Embed Size (px)
Citation preview

Radiation and Climate Change FS 2019 Martin Wild
Exam information
Exam, 31. 5. 2019• Takes place in RZ F21, approx. 60 Min.• Covers all material discussed in the lectures and in the computer lab• No supporting material allowed (keine Hilfsmittel), except a simple pocket
calculator with trigonometric and power functions (no calculators on smartphones, no pocket computers). We will provide a number of TI30 calculators, if you cannot bring an appropriate calculator.
• Emphasis is on understanding of concepts• You should know the more simple laws and formulas (e.g. the Stefan
Boltzman law), but not the complex ones (e.g. the solution of the Schwarzschild Equation).
• Not necessary to learn by heart values of the constants in the equations• Please be here at 8 15, we will need some time to check your IDs and
possibly the pocket calculators, and start the exam towards 8 30.• Additional reading material on website is not part of exam

6. Radiation and climate change on different timescales
Radiation and Climate Change FS 2019 Martin Wild

Radiation and Climate Change FS 2019 Martin Wild
• Radiative forcings over 109 Years: Climate change on geological timescales: faint Sun, snowball Earth
• Radiative forcings over 106 Years: Ice age cycles
• Radiative forcings over 104 Years: Holocen climate change
• Radiative forcings over 103 Years: Millenium climate change
• Radiative forcings over 102 Years: Multidecadal climate change
Radiative forcings over Earth’s history

Radiation and Climate Change FS 2019 Martin Wild
Orbital parameters that determine changes in solar radiation relevant for glaciation and ice ages cycles
Radiative forcing over past million years
100’000 yearsperodicity
41’000 yearsperodicity
20’000 yearsperodicity
Radiation and Climate Change FS 2019 Martin Wild
Radiative forcing over past million years
Milutin Milankovitch (1879-1958) - astronomical theory (1940): realized importance of summertime insolation changes in high latitudes for ice sheet melt.

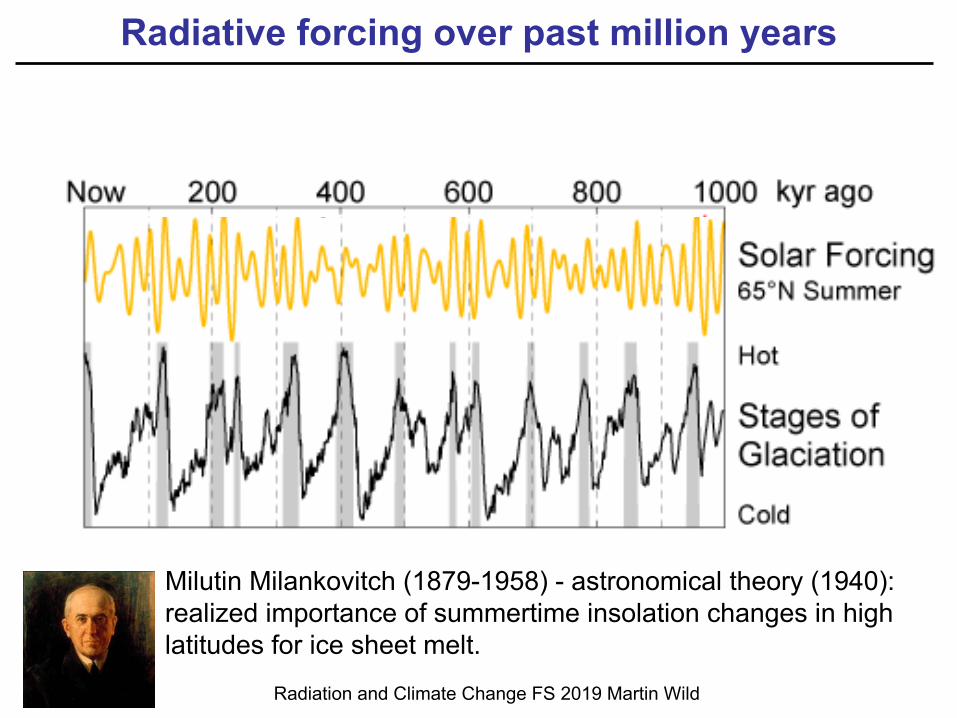
Radiative forcing over past 10‘000 years
Holocene dominated by Precession (20‘000 years periodicity)
Radiation and Climate Change FS 2019 Martin Wild
N-Summer in Perihel
N-Summer In Aphel
Inso
latio
n (W
m-2
) Dec
embe
r 45°
Inso
latio
n (W
m-2
) Dec
embe
r 0° Insolation (W
m-2) July 0
°
Insolation (Wm
-2) July 45°
Radiative forcing over past 10‘000 years
Holocene dominated by Precession (20‘000 years periodicity)
Radiation and Climate Change FS 2019 Martin Wild
Northern Hemisphere
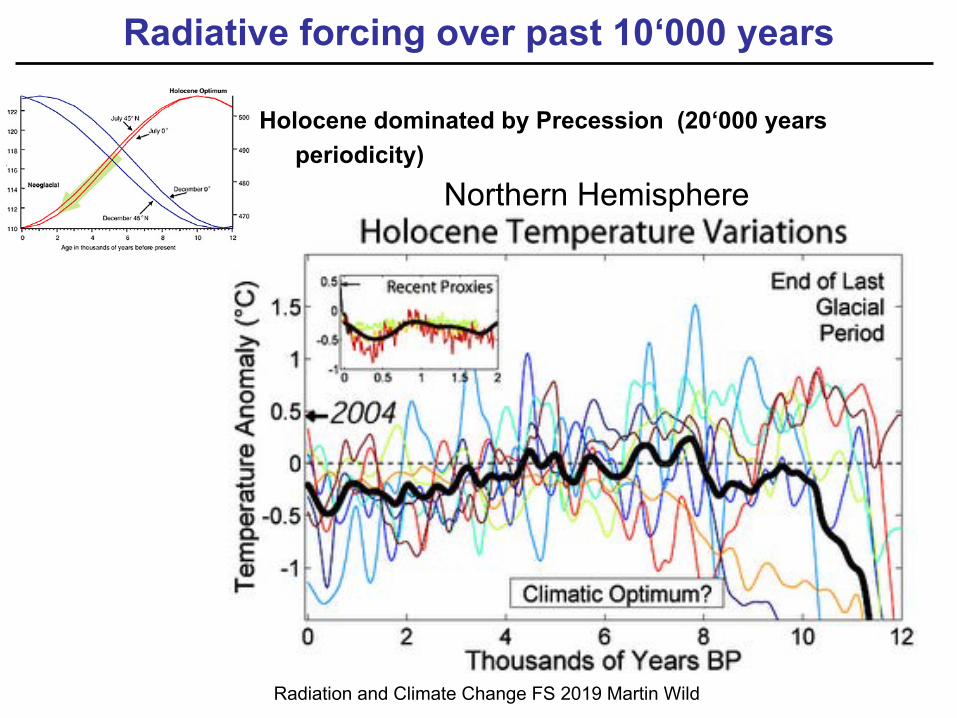
Insolation past 1300 years
Radiative forcing over past 1000 years
Radiation and Climate Change FS 2019 Martin Wild
Temperature past 1000 years
Variations in solar output relevant

Little ice age caused by weak solar forcing
Painting of the frozen Thames 1683 by Jan GrifierRadiation and Climate Change FS 2019 Martin Wild
Radiative forcing over past 1000 years
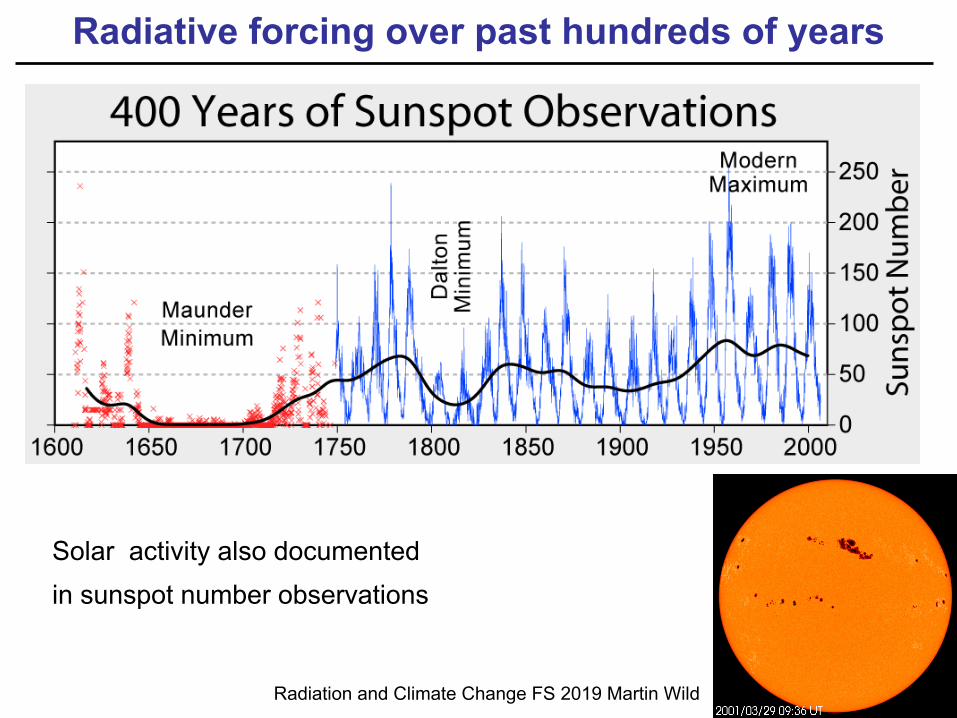
Solar activity also documented in sunspot number observations
Radiative forcing over past hundreds of years
Radiation and Climate Change FS 2019 Martin Wild

Radiation and Climate Change FS 2019 Martin Wild
Radiative forcing over past 100 years

Radiation and Climate Change FS 2019 Martin Wild
Radiative forcing over past 100 years
Radiative energy imbalance currently estimated at ~0.8 W/m-2
Hansen et al. (2004) Model simulations
?=
“radiative energy imbalance”

Radiation and Climate Change FS 2019 Martin Wild
Additional reading
Available on the course website:http://www.iac.ethz.ch/education/master/radiation_and_climate_change/

Radiation and Climate Change FS 2019 Martin Wild
Radiative energy imbalance at TOA 1860-2100
Slingo and Webb 1997, QJRMS
Model simulations
“radiative energy imbalance”

Radiative imbalance: where does the energy go?
Radiation and Climate Change FS 2019 Martin Wild
0.8 Wm-2
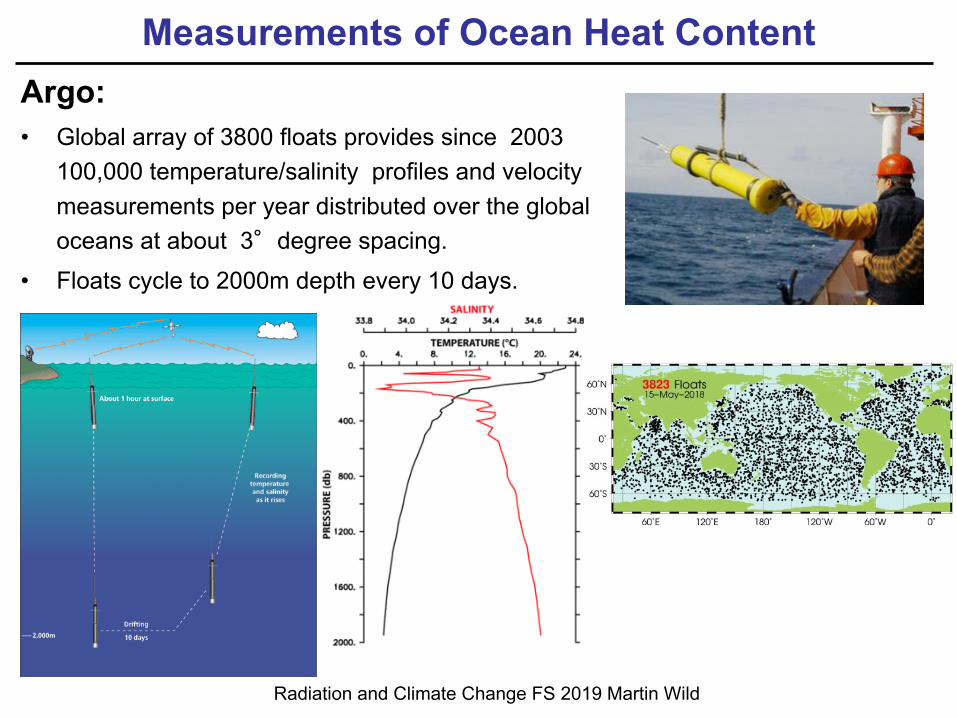
Measurements of Ocean Heat Content
Radiation and Climate Change FS 2019 Martin Wild
Argo: • Global array of 3800 floats provides since 2003
100,000 temperature/salinity profiles and velocity measurements per year distributed over the global oceans at about 3°degree spacing.
• Floats cycle to 2000m depth every 10 days.
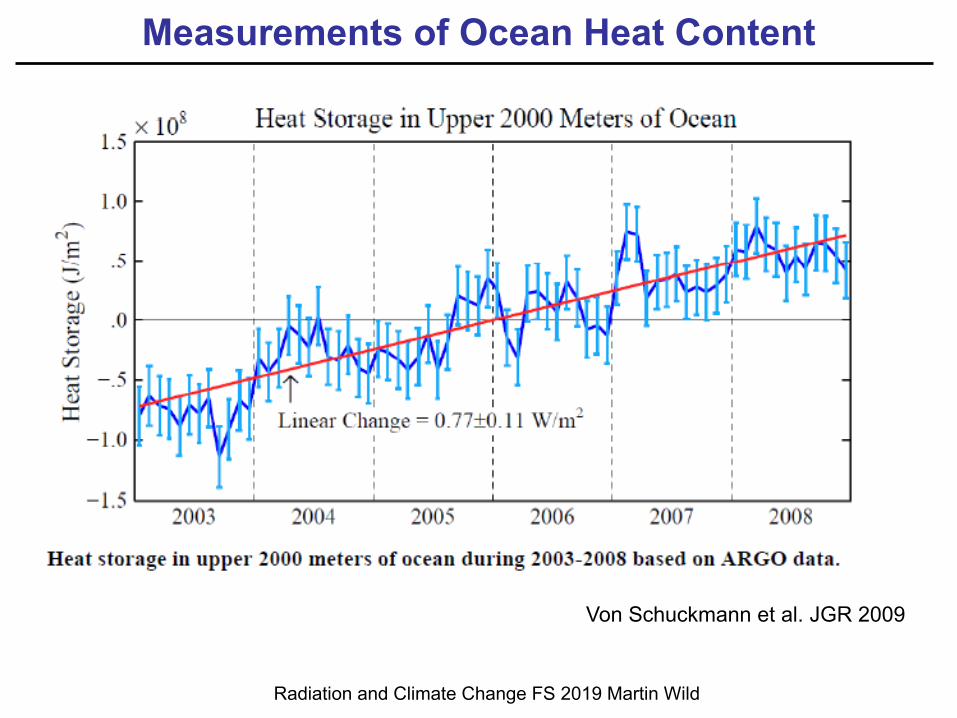
Measurements of Ocean Heat Content
Radiation and Climate Change FS 2019 Martin Wild
Von Schuckmann et al. JGR 2009

Radiation and Climate Change FS 2019 Martin Wild
Additional reading
Available on the course website:http://www.iac.ethz.ch/edu/courses/master/modules/radiation-and-climate-change.html

Radiation and Climate Change FS 2019 Martin Wild
Forcing and Energy Imbalance
From Murphy et al 2009
Apply step-function radiative forcing (e.g., instantaneous doubling of CO2: system responds by change in temperature and resulting change in emitted longwave radiation)
TOA Imbalance
Outgoing longwave radiation
(imbalance)
Forcing
Response
Radiation and Climate Change FS 2019 Martin Wild
Decadal changes in surface radiation balance
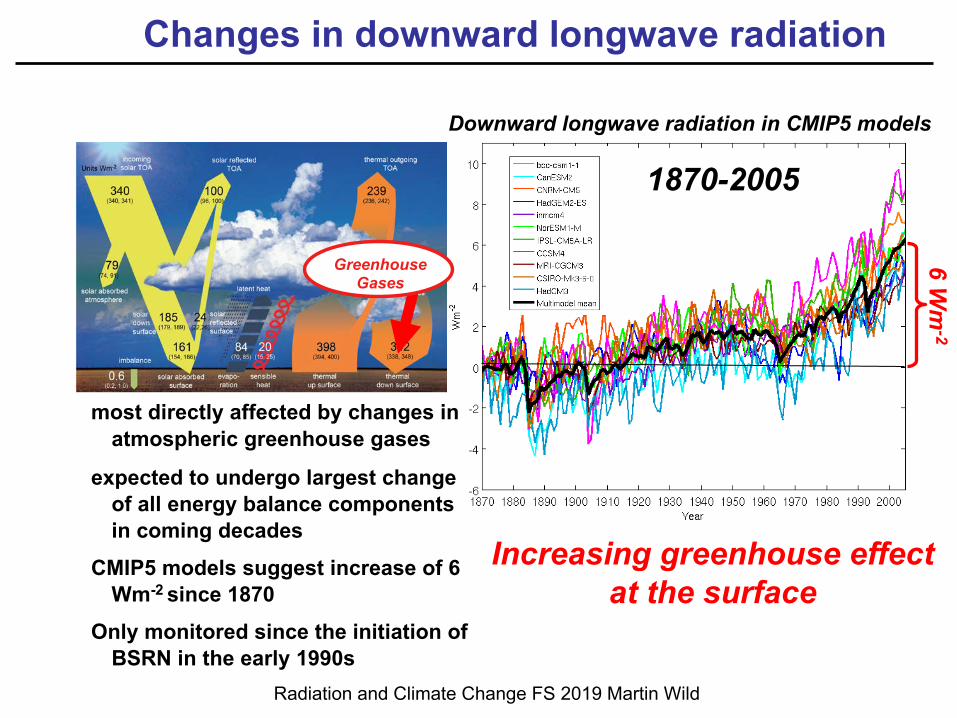
Changes in downward longwave radiation
most directly affected by changes in atmospheric greenhouse gases
expected to undergo largest change of all energy balance components in coming decades
CMIP5 models suggest increase of 6 Wm-2 since 1870
Only monitored since the initiation of BSRN in the early 1990s
Downward longwave radiation in CMIP5 models
Greenhouse Gases
6 Wm
-2
1870-2005
Increasing greenhouse effect at the surface
Radiation and Climate Change FS 2019 Martin Wild

Radiation and Climate Change FS 2019 Martin Wild
What can we see in currently available records
of downward longwave radiation?Baseline Surface Radiation Network (BSRN)
Observed changes in downward longwave radiation
Longterm monitoring of downward longwave radiation is acentral objective of BSRN

Radiation and Climate Change FS 2019 Martin Wild
Philipona et al. 2004
Wild et al. 2016
Widespread increase in observed downward longwave radiation
Ny-Alesund Spitzbergen
Alpine sites
Greenhouse Gases
Observed changes in downward longwave radiation

25 Wm
-210 Wm
-2
RCP 8.5
RCP 4.5
CMIP5 projections 21th century 10 CMIP5 Models
Future changes in downward longwave radiation
Wild et al. 1997 J. Climate / Wild 2016, AIP proc.

25 Wm
-210 Wm
-2
RCP 8.5
RCP 4.5
CMIP5 projections 21th century
2010-2030: RCP8.5:+2.2 Wm-2/decRCP4.5:+1.7 Wm-2/dec
Observed: +2 Wm-2/dec
10 CMIP5 Models
Future changes in downward longwave radiation
Wild et al. 1997 J. Climate / Wild 2016, AIP proc.

“dimming”
Potsdam, Germany 1937 – 2014
Inso
latio
n an
omal
ies
(Wm
-2)
Decadal changes in surface solar radiation
Surfa
ce s
olar
radi
atio
n (W
m-2
)
Wild et al. 2005, ScienceWild 2016, WIREs Clim Change
“dimming” “brightening”
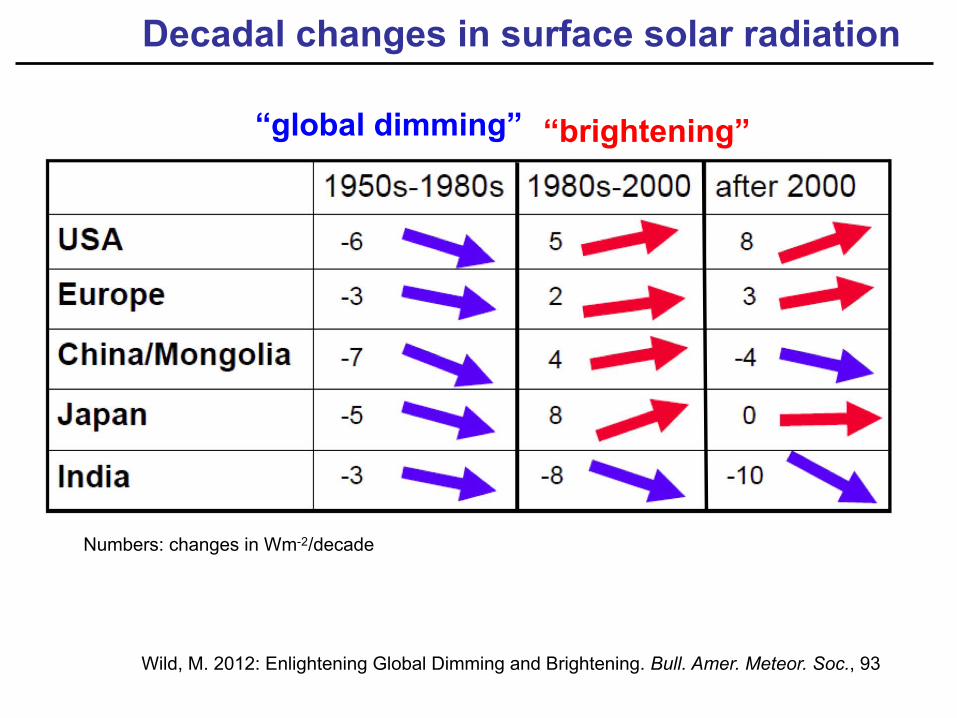
Wild, M. 2012: Enlightening Global Dimming and Brightening. Bull. Amer. Meteor. Soc., 93
“global dimming” “brightening”
Decadal changes in surface solar radiation
Numbers: changes in Wm-2/decade
Radiation and Climate Change FS 2019 Martin Wild
Additional reading
Available on the course website:http://www.iac.ethz.ch/education/master/radiation_and_climate_change/

Periodic sunspots > active sun
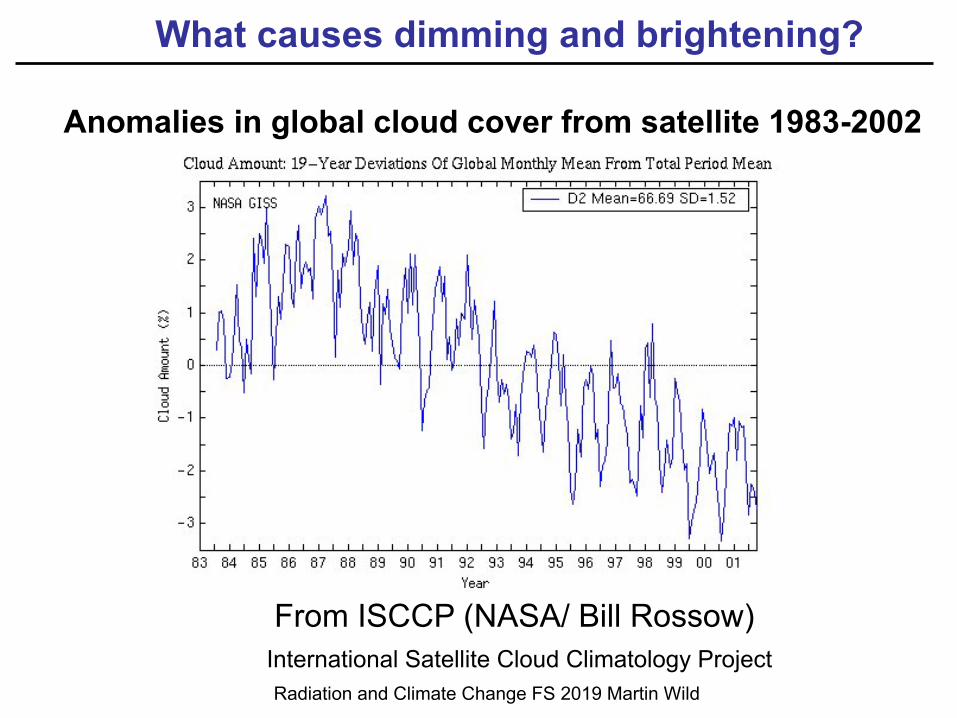
What causes dimming and brightening?
Can variations in solar activity explain dimming/brightening?

0.1 %
Variations in solar activity CANNOT explain dimming/brighthening
Variations in solar output, measured from satellites
Periodic sunspots > active sun
Number of sunspots
What causes dimming and brightening?
Radiation and Climate Change FS 2019 Martin Wild
From ISCCP (NASA/ Bill Rossow)
Anomalies in global cloud cover from satellite 1983-2002
International Satellite Cloud Climatology Project
What causes dimming and brightening?
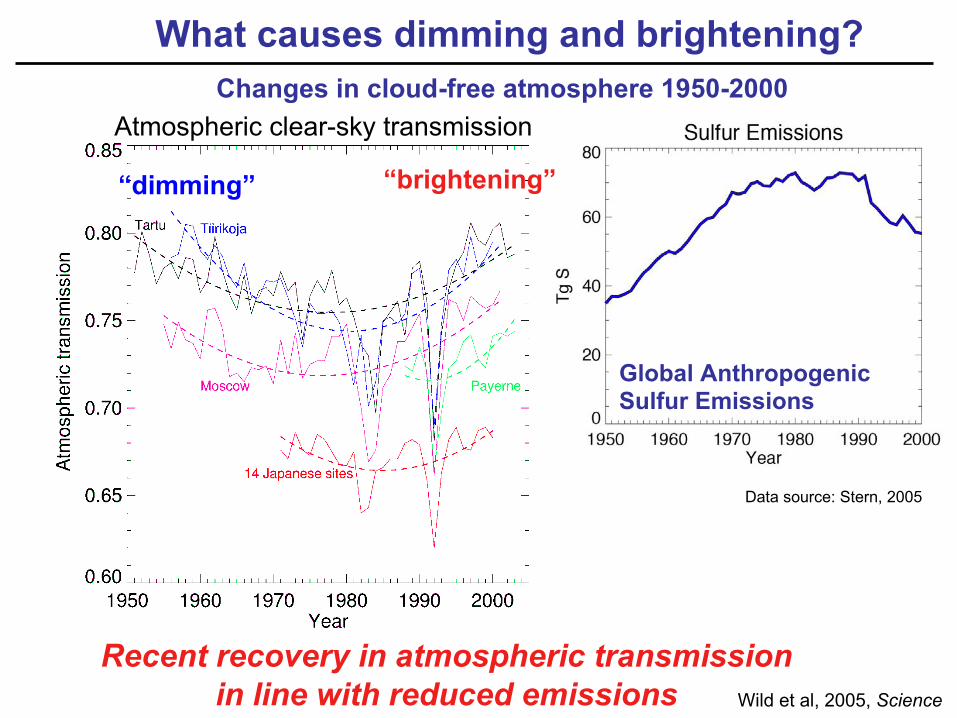
Wild et al, 2005, Science
Recent recovery in atmospheric transmission in line with reduced emissions
“dimming” “brightening”
Atmospheric clear-sky transmission
Data source: Stern, 2005
Global AnthropogenicSulfur Emissions
Changes in cloud-free atmosphere 1950-2000
What causes dimming and brightening?
Radiation and Climate Change FS 2019 Martin Wild
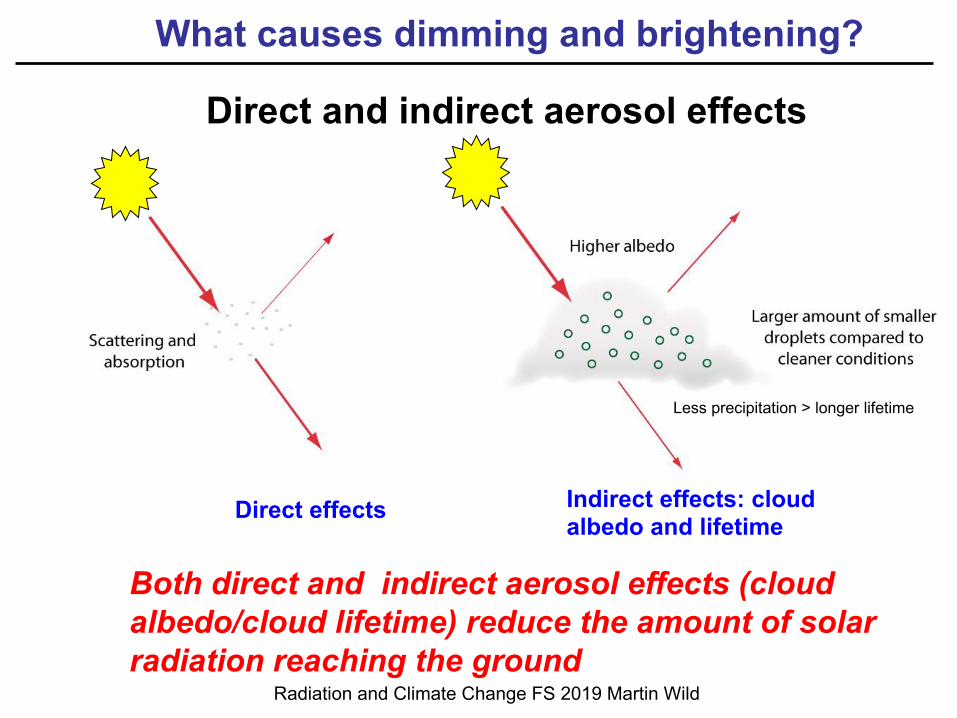
Both direct and indirect aerosol effects (cloud albedo/cloud lifetime) reduce the amount of solar radiation reaching the ground
Direct and indirect aerosol effects
Direct effects Indirect effects: cloud albedo and lifetime
Less precipitation > longer lifetime
What causes dimming and brightening?

Radiation and Climate Change FS 2019 Martin Wild
- +
Global dimming versus greenhouse warming
1950s to 1980s• global dimming counter-
balances increasing thermal downward radiation
• Surface radiative heating is not increasing
Wild et al. (2004) GRL 32Wild (2012) Bull. Amer. Meteorol. Soc.
- +-xsince 1980s• Absence of global
dimming no longer masks thermal greenhouse effect
• Surface radiative heating increases significantlyWild et al. (2005) Science 308Wild (2012) Bull. Amer. Meteorol. Soc.

Dimming BrighteningDimming / brightening modulates decadal warming rates
Observed Northern HemisphereTemperature change
Data source:CRU
2m T
empe
ratu
re a
nom
alie
s (C
)
Deviation from 1960-1990
-0.002°/ decade 0.29°/decade
Global dimming versus greenhouse warming
Radiation and Climate Change FS 2019 Martin Wild Wild 2012, BAMS

Radiation and Climate Change FS 2019 Martin Wild
DTR as proxy for surface insolation changes
From Liu et al. 2004, J. Climate
Correlation of surface insolation and DTR in Europe
Correlation of surface insolation and DTR in China
From Makowski et al. 2009, JGR
Daily maximum temperature dominated by surface solar radiation
Daily minimum temperature dominated by thermal radiation
DTR:Diurnal Temperature Range=T max – T min
R=0.87

Radiation and Climate Change FS 2019 Martin Wild
Observation data: CRU dataset
Wild et al. 2007, Geophys. Res. Lett.
Units °C/decade
1958-1985“dimming”
1985-2002“brightening”
T max -0.04 +0.37
T min 0.11 +0.40
DTR -0.15 -0.03
Observed DTR Land Mean 1958-2000s
Linear regression slopes land mean DTREvidence for large scale change in surface radiative forcings

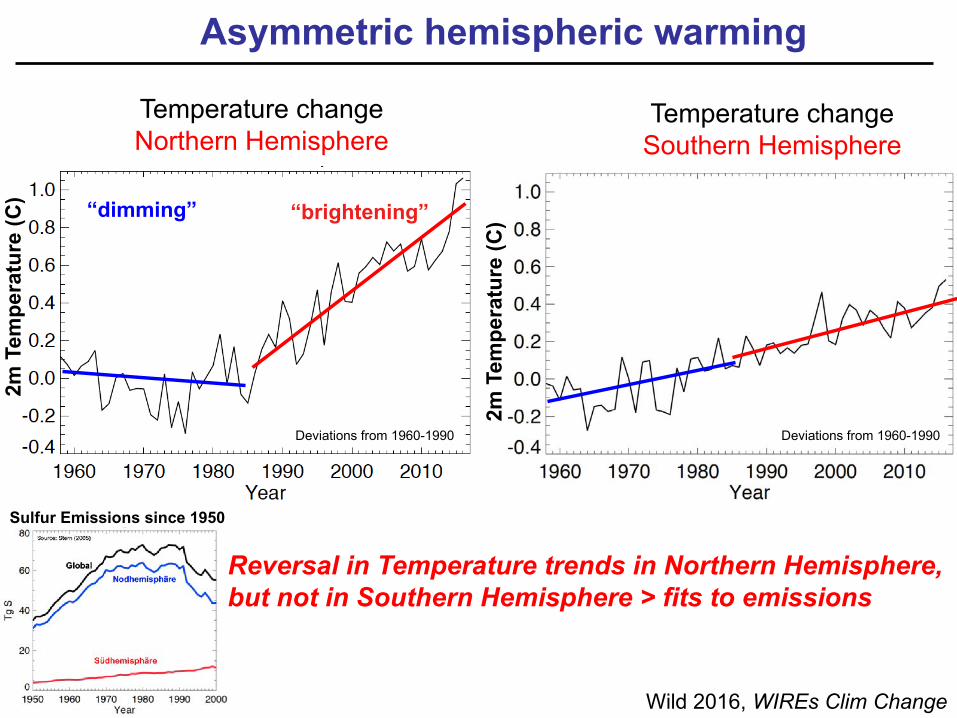
Asymmetric hemispheric pollution
Emissions show trend reversal in NH, but not in SH
Anthropogenic sulfur emission 1950-2000
Source: Stern (2005)
Northern Hemisphere
Southern Hemisphere
Globe
Wild, BAMS 2012Radiation and Climate Change FS 2019 Martin WildWild 2016, WIREs Clim Change
2m T
empe
ratu
re (C
)“dimming” “brightening”
Temperature changeNorthern Hemisphere
2m T
empe
ratu
re (C
)
Wild 2016, WIREs Clim Change
Temperature changeSouthern Hemisphere
Sulfur Emissions since 1950
Reversal in Temperature trends in Northern Hemisphere, but not in Southern Hemisphere > fits to emissions
Deviations from 1960-1990 Deviations from 1960-1990
Asymmetric hemispheric warming

Radiation and Climate Change FS 2019 Martin Wild
Impact on mountain glaciers
Swiss Glaciers area reduction:
“Dimming phase“1973 - 1985: -1 %“Brightening phase“1985 - 2017: -33 %F. Paul. Personal communication
Swiss glaciers only retreated
after transition from dimming to brightening

Negative surface net radiation
Positive surface net radiation
Observed precipitation NH mean landData source:
GHCN
Wild, BAMS 2012
Impact on the global water cycle
Radiation and Climate Change FS 2019 Martin Wild
Variations in precipitation quantitatively consistentwith variations in surface net radiation

Dimming total radiationdiffuse fraction
Brightening total radiationdiffuse fraction
Dimming and brightening affects quantity & quality of radiation
Abakumova et. al. 1996
Total solar radiation
Direct solar radiation
Diffuse solar radiation
Solar radiation during dimming phasein Odessa 1960-1986
More pollution leads to less direct and more diffuse solar radiation
Impact on carbon uptake and plant growth
Total radiation= Direct + DiffuseDiffuse fraction= Diffuse / Total

total radiation --- reduces plant photosynthesis
diffuse fraction --- enhances plant photosynthesis
Global-Dimming period
Mercado et al. 2009 Nature
Direct radiation: Can only be used by uppermost leaves for photosynthesis
Diffuse radiation: penetrates deeper into canopy - can be more effectively used for photosynthesis by many plants
Modeling studies: Effect of diffuse fraction increase dominates=> Increased carbon uptake and plant growth during dimming
Impact on carbon uptake and plant growth
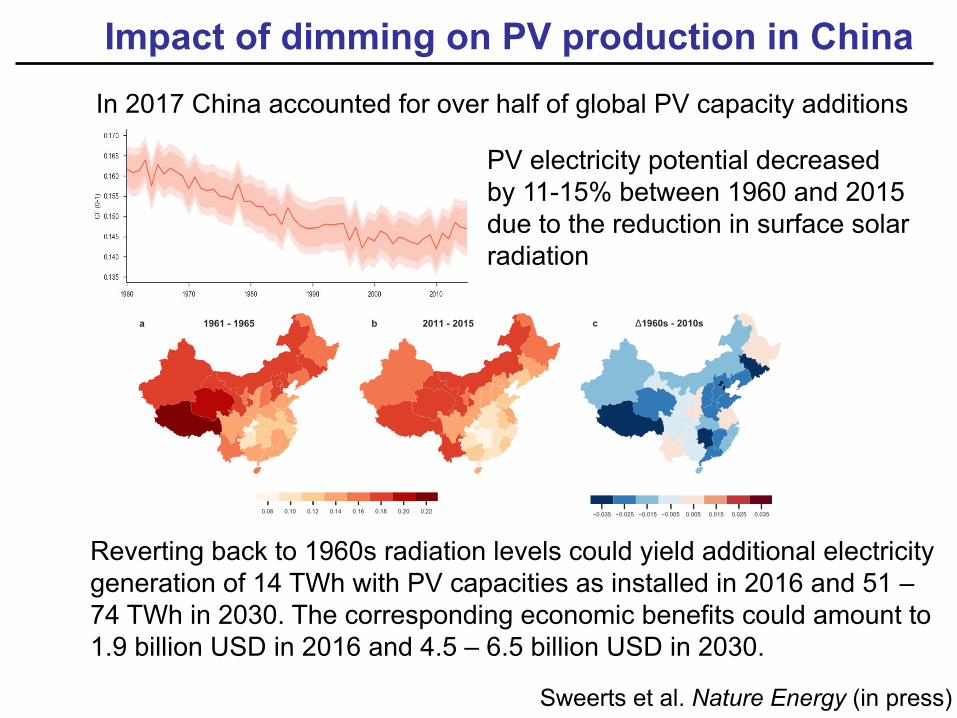
Impact of dimming on PV production in China
Sweerts et al. Nature Energy (in press)
PV electricity potential decreased by 11-15% between 1960 and 2015 due to the reduction in surface solar radiation
In 2017 China accounted for over half of global PV capacity additions
Reverting back to 1960s radiation levels could yield additional electricity generation of 14 TWh with PV capacities as installed in 2016 and 51 –74 TWh in 2030. The corresponding economic benefits could amount to 1.9 billion USD in 2016 and 4.5 – 6.5 billion USD in 2030.

Radiation and Climate Change FS 2019 Martin Wild
Additional reading
Available on the course website:http://www.iac.ethz.ch/education/master/radiation_and_climate_change/