Embed Size (px)
Citation preview

1 | Page RADIALcvtDesignVer1.8.docx
RADIALcvt prototype design,
simulation and testing
Dr. J. J. Naude 8 Aug 2017
Version 1.8
2 | Page RADIALcvtDesignVer1.8.docx
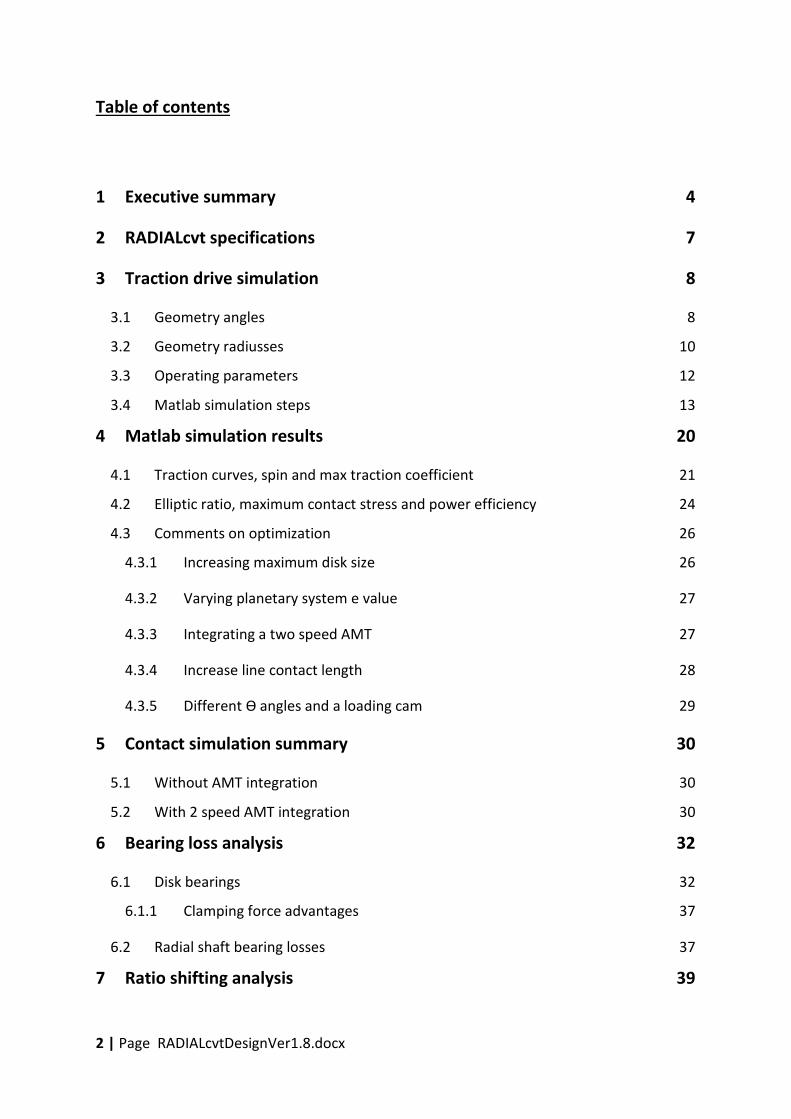
Table of contents
1 Executive summary 4
2 RADIALcvt specifications 7
3 Traction drive simulation 8
3.1 Geometry angles 8
3.2 Geometry radiusses 10
3.3 Operating parameters 12
3.4 Matlab simulation steps 13
4 Matlab simulation results 20
4.1 Traction curves, spin and max traction coefficient 21
4.2 Elliptic ratio, maximum contact stress and power efficiency 24
4.3 Comments on optimization 26
4.3.1 Increasing maximum disk size 26
4.3.2 Varying planetary system e value 27
4.3.3 Integrating a two speed AMT 27
4.3.4 Increase line contact length 28
4.3.5 Different ϴ angles and a loading cam 29
5 Contact simulation summary 30
5.1 Without AMT integration 30
5.2 With 2 speed AMT integration 30
6 Bearing loss analysis 32
6.1 Disk bearings 32
6.1.1 Clamping force advantages 37
6.2 Radial shaft bearing losses 37
7 Ratio shifting analysis 39

3 | Page RADIALcvtDesignVer1.8.docx
7.1 Geometry analysis 39
7.1.1 Alternative radial shaft and driver design 42
7.2 Total shifting torque and forces 42
8 Prototype testing 44
8.1 No load tests 44
8.2 Conclusions 48
9 References 48
List of Figures
Figure 1. 3D CAD design of the RADIALcvt prototype ............................................................... 8
Figure 2 Geometry in the y-plane .............................................................................................. 9
Figure 3 Body A and B configuration ....................................................................................... 10
Figure 4 Geometry in the x-plane ............................................................................................ 11
Figure 5 Surface velocity vs maximum traction coefficient ..................................................... 13
Figure 6 Regression coefficients (Loewenthal & Zaretsky, 1985) page 35 .............................. 15
Figure 7 Regression analysis parameter ranges ...................................................................... 19
Figure 8 Traction curves ........................................................................................................... 21
Figure 9 Spin and maximum traction coefficient ..................................................................... 22
Figure 10 Power efficiency and power losses .......................................................................... 22
Figure 11 Maximum contact stress and elliptic ratio .............................................................. 24
Figure 12 Power efficiency and Input torque .......................................................................... 25
Figure 13 Input power, torque and power efficiency for the complete RADIALcvt ................ 26
Figure 14 Minimum surface roughness and EHD film thickness ............................................. 26
Figure 15 Effect of 2 speed AMT integration ........................................................................... 27
Figure 16 Effect of 2 speed AMT integration and line contact length increase ...................... 28
Figure 17 Line contact increase effect on spin and maximum traction coefficient. ............... 29
Figure 18 Clamping unit and Conved disk................................................................................ 33
Figure 19 Cross section of assembled Convex disk and Clamping unit ................................... 34
Figure 20 NU 303 ECP bearing calculations ............................................................................ 34
Figure 21 51103 bearing calculations ...................................................................................... 35

4 | Page RADIALcvtDesignVer1.8.docx
Figure 22 51113 bearing calculations ...................................................................................... 35
Figure 23 Clamping bearing losses in Watt.............................................................................. 36
Figure 24 Clamping bearing losses as a % of transmitted power ............................................ 36
Figure 25 Bottom radial driver bearing losses. ........................................................................ 38
Figure 26 Radial driver force diagram...................................................................................... 39
Figure 27 Radial shaft and driver ............................................................................................. 40
Figure 28 Ratio shifting forces ................................................................................................. 41
Figure 29 Modified radial shaft and driver design ................................................................... 42
Figure 30 Prototype variator components .............................................................................. 44
Figure 31 RADIALcvt no load power consumption .................................................................. 45
Figure 32 SKF bearing calculator sample result ....................................................................... 46
Figure 33 Clamping bearings, Ph and Pr simulated losses....................................................... 46
Figure 34 Optimised bearing configuration losses .................................................................. 47
1 Executive summary
This document provides a design and traction drive contact analysis and simulation of the
first RADIALcvt prototype as well as some initial test result. The simulation results are

5 | Page RADIALcvtDesignVer1.8.docx
discussed and improvements to the current design recommended. It presents a high
mechanical efficiency and eliminates the use of a hydraulic control system. The RADIALcvt
has a number of fundamental advantages that sets it apart from all other developmental
and commercial CVT’s and are listed below:
� One friction interface: Only one friction drive interface in series in a parallel power
path. All other CVT’s, developmental and commercial have 2 friction drive interfaces
in series thus resulting in a compound friction loss. Thus if the friction contacts have
the same efficiency then the RADIALcvt will have 50% of the friction drive losses of
other CVT’s. See section 4 and 5 for details.
� Line contact: The friction drive contact in the RADIALcvt friction drive can be a line
contact, which is only possible in belt/chain CVT and cone ring CVT and not possible
in toroidal and planet ball CVT’s. Line contact reduces the maximum contact stress.
� Constant input radius: The RADIALcvt has a constant friction drive input radius. All
other CVT have a variable input radius which results in high surface rolling speeds
and lower coefficient of friction which require higher clamping forces. See section 4.
� Six parallel power paths: The RADIALcvt has at least 6 parallel power paths. Such a
large number of parallel paths is only possible in planet ball CVT’s.
� Large output friction disk: The output friction drive disk of the RADIALcvt can be
positioned concentric and close to the engine flywheel and can approximate
flywheel size. Thus the diameter of this output friction drive can be much larger than
any of the belt/chain or toroidal or cone ring CVT output friction drive components.
Due to this fact the RADIALcvt provides its highest efficiency in low ratios associated
with city driving. See section 4 and 5 for details.
� High power efficiency: Above results in a RADIALcvt with a friction drive contact
power efficiency in all ratios, under maximum engine torque, of about 95% in high
ratio to about 98% in low ratio including in use, without a 2 speed AMT, with a ratio
range up to 4.7, or with ratio range up to 10 and beyond with 2 speed AMT
integration. A ratio range of 10 is currently the maximum in the industry. See section
4 and 5 for details.

6 | Page RADIALcvtDesignVer1.8.docx
� No hydraulic control: As shown in section 4 and 5, the RADIALcvt can be realised
without any hydraulic control. All current developmental and commercial CVT
require a hydraulic control system.
� Clamping force utilization: In the RADIALcvt configuration, a unit of clamping force
supports two parallel friction drive interfaces, while in all other developmental and
commercial CVT’s only one friction drive interface is supported. Losses due to
clamping forces should thus be 50% lower in the RADIALcvt. See section 5 for details.
� Clamping force location: The RADIALcvt clamping force, bearing losses are only
associated with the RADIALcvt output, namely the Convex and Concave disks, while
the RADIALcvt input, the radial drivers, are in equilibrium as mentioned in section
4.3.5. Thus these bearing losses, for a given clamping force, are only a function of the
RADIALcvt output speed. This has the obvious low loss advantages in low output
speed ratios. In contrast in all other CVT’s, the clamping force is associated with both
the input and output speeds of the respective CVT, thus for a given clamping force
the applicable speed for bearing loss calculation would be the average of the input
and output speeds.
� Low bearing losses: Disk bearing (clamping) losses, which are a well-known source of
traction drive losses (Loewenthal & Zaretsky, 1985), is a maximum of 2.5% in high
ratio to about 1.5% in low ratio of transmitted power. See section 6 for details.
Since the RADIALcvt use existing very well developed traction/ friction drive technology,
any potential licensee of our technology can very easily evaluate and verify the
advantages of the RADIALcvt. The advantages of the RADIALcvt is realised by its unique
patented configuration of components.
Initial no load tests with 100 % clamping force, as presented in section 8, indicate
clamping force related bearing losses of 1.4% while the operation of the radial drivers,
all on the same radius, is validated as well as the correct functioning of the shifting
mechanism.

7 | Page RADIALcvtDesignVer1.8.docx
2 RADIALcvt specifications
The RADIALcvt presented in this document functions according to the PCT patent
application number PCT/ZA2016/050017. The current prototype has the following
specifications:
� Input torque 70 N.m (extended to 225 N.m with AMT integration)
� Maximum input rpm 4400
� Disk diameter 292 mm
� Width 262mm
� Height 340 mm
Figure 1 presents a 3D CAD design of the RADIALcvt prototype. Note that in this design the
combining planetary system is integrated in the rear of the rear convex disk, while in
PCT/ZA2016/050017 it is positioned to one side. This design used the same variator
configuration as in PCT/ZA2016/050017 that is with 3 radial drivers, making contact and
driving the two disks in opposite directions in a traction fluid. Thus 6 traction drive contact
points are created, representing the 6 parallel power paths, each parallel path containing
only one friction drive interface in series.

8 | Page RADIALcvtDesignVer1.8.docx
Figure 1. 3D CAD design of the RADIALcvt prototype
3 Traction drive simulation
This section presents the simulation of the traction drive interface of a radial driver clamped
between the convex and concave disk. This simulation is based on the design methodology
as presented in (Loewenthal & Zaretsky, 1985). This work is based on regression analysis of
a large number of experimental results using Santotrac 50 and TDF 88 as traction fluid. This
methodology was also recently used, among others, by (Lichao, 2013) and (Carter, Pohl,
Raney, & Sadler, 2004).
3.1 Geometry angles
Figure 2 presents the geometry of a driver clamped between disks in the y plane. The y
direction is defined as the direction away from the coincident axes of rotation of body B

9 | Page RADIALcvtDesignVer1.8.docx
(convex disk) and body C (concave disk). The notation used is the same as used in
(Loewenthal & Zaretsky, 1985) page 26 and 27.
Figure 2 Geometry in the y-plane
Considering body A and B, the angle γ is defined as the angle between the axes of rotation
of body A and B and is 900. Similarly γ for bodies A and C is also 90
0. Considering body A and
B, the angle ϴ is defined as the angle between the rotation axis of body A and the line/plane
tangent to the contact point. ϴB refers to the interface between body A and B and ϴC refers
to the interface between body A and C. In the current RADIALcvt design the convex disk and
concave disk have the same disk angle of 6.50.
Figure 3 below presents Figure 25 of (Loewenthal & Zaretsky, 1985) as it is used to
determine ϴ for different traction drive configurations. From Figure 3 it is concluded that for
the body A and B interface (most left configuration in the 3rd
row) ϴB=6.50 and for body A
and C interface (most left configuration in the 4th
row) ϴC=-6.50. Note that in Figure 3 body A
rotates around the horizontal axis

10 | Page RADIALcvtDesignVer1.8.docx
Figure 3 Body A and B configuration
3.2 Geometry radiusses
Figure 4 presents a view of section E-E in Figure 2 which also presents the x direction/plane.
The x-direction is defined as the rolling direction.
The following are the relevant radiuses and their values and value ranges of the
current RADIALcvt prototype:
Body A
RA=31 mm Rolling radius of body A
RA,x=31 mm Contact radius of body A in the x direction
RA,y=45 mm Contact radius (crown) of body A in the y direction. This
contact is also modelled as line contact in which case it
has infinite value.
RA,yline=2.35mm In the case where RA,y is modelled as a line contact, this
value refers to the length of the line contact.

11 | Page RADIALcvtDesignVer1.8.docx
Figure 4 Geometry in the x-plane
Body B
RB=30 - 143 mm Variable rolling radius of body B
RB,x Contact radius of body B in the x-direction which is a
function of RB. RB,x is calculated by a Matlab function
calculating the projected circle created by RB projected
on a plane tilted at an angle equal to the disk angle.
RB,y=infinity Contact radius of body B in the y direction. This contact
is a line contact, thus the infinite value.
Body C
RC=30 - 143 mm Variable rolling radius of body C
RC,x Contact radius of body C in the x direction which is a
function of RC. Note that RC,x= -RB,x because of the
negative radius. (Convex vs Concave)
RC,y=infinity Contact radius of body C in the y direction. This contact
is a line contact, thus the infinite value.

12 | Page RADIALcvtDesignVer1.8.docx
During simulation RB and RC are varied, which caused RC,x and RB,x to vary while all the other
above angles and radiuses are kept constant.
3.3 Operating parameters
The current RADIALcvt is intended as a hydraulic free CVT for small passenger vehicles,
typically around 70 N.m, 40 kW torque and power. In these vehicles there is no need to
operate the engine above 4400 rpm as at this point maximum power is achieved while
maximum torque is achieved at lower rpm. Thus 4400 rpm is taken as the input speed and
also the speed of the drivers (body A). The normal load, Q, in the traction contact is taken as
6800 N. The surface rolling speed in the x-direction, U, is calculated as U=4400
rpm*pi*2*RA/60=14.3 m/s. Note that since the radius RA=31 mm of body A does not change,
U is also a constant, which is not the case in current commercial CVT or CVT’s in
development including, Cone ring, Toroidal and Planet ball CVT’s. The fact that U is constant
for the RADIALcvt is a huge advantage, because as U increases, the maximum traction
coefficient decreases as reported by (Loewenthal & Rohn, 1983) figure 11 , duplicated
below as Figure 5.
The low maximum surface velocity, U=14.3 m/s, of the RADIALcvt prototype will thus
contribute to a higher maximum traction coefficient. Figure 5 also indicates that maximum
contact pressures above about 2 GPa do not increase the maximum traction coefficient. The
lubricant inlet temperature is set at = 50 0C.

13 | Page RADIALcvtDesignVer1.8.docx
Figure 5 Surface velocity vs maximum traction coefficient
3.4 Matlab simulation steps
The below section describes the sequence of calculations performed in the Matlab contact
simulation.
1. Calculate equivalent radii
(Loewenthal & Zaretsky, 1985) equation 3
(Loewenthal & Zaretsky, 1985) equation 10
2. Calculate contact parameters
Inverse curvature sum (Loewenthal & Zaretsky, 1985) equation 17
Auxiliary contact size parameter (Loewenthal & Zaretsky, 1985)
equation 16
Where EA= EB=207 GPa representing the modulus of elasticity of steel and ξA= ξB=0.3
representing the poison ratio for steel.
Elliptic ratio (Loewenthal & Zaretsky, 1985) equation 9

14 | Page RADIALcvtDesignVer1.8.docx
Figure 11 in (Loewenthal & Zaretsky, 1985) was digitised and used as a lookup for
dimensionless contact ellipse factors a* and b
* using k.
The contact elliptic radii are calculated as:
Elliptic ratio (Loewenthal & Zaretsky, 1985) equation 14
3. Maximum contact stress
The maximum contact stress is calculated as:
Maximum contact stress (Loewenthal & Zaretsky, 1985) equation 14
As a comparison, the maximum contact stress, σ0, b and k are also calculated for
Hertz cylinder-cylinder contact where RA,yline=2a, while b and σ0 is calculated via the
Hertz formula and k from k=a/b.
4. Calculate spin, maximum traction coefficient and initial traction slope
Spin, ωS, is the result of a mismatch in roller radii at contact points on either side of
the point of pure rolling and is calculated by:
(Loewenthal & Zaretsky, 1985) equation 36
Non dimensional spin is calculated as:
(Loewenthal & Zaretsky, 1985) page 35
Use the regression results to calculate the maximum available traction coefficient, µ
and the initial slope of the traction curve, m.
(Loewenthal & Zaretsky, 1985) equation 52
Where the coefficients are presented in below table:

15 | Page RADIALcvtDesignVer1.8.docx
Figure 6 Regression coefficients (Loewenthal & Zaretsky, 1985) page 35
Slope correction on m is performed by:
(Loewenthal & Zaretsky, 1985) equation 53
Where and =22.57mm for Santotrac 50 and
12.5mm for TDF-88.
The dimensionless spin parameter J3, is calculated as:
(Loewenthal & Zaretsky, 1985) equation 39
Where (Loewenthal & Zaretsky, 1985) equation 44
5. Slip/creep calculations
Slip or creep is the differential velocity, ΔU, in the rolling direction (x- direction)
arising from the shear forces generated between body A and B across the lubricant
film. If no slip exists, there is no traction and the coefficient of friction in the x-
direction µX=0. It is therefore important to generate the relationship between ΔU
and µX as ΔU increases while µX also increases to its maximum value. The graph

16 | Page RADIALcvtDesignVer1.8.docx
detailing ΔU/U versus µX is used for this purpose and is referred to as the traction
curve. In order to generate the traction curve, incremental values for ΔU/U from 0 to
0.07 (0% to 7%) is generated and the following is performed for each increment to
calculate the respective µX value as well as traction in the y-direction, µY value:
Dimensionless J1 parameter is calculated as:
(Loewenthal & Zaretsky, 1985) equation 37
Figure 27 in (Loewenthal & Zaretsky, 1985) was digitised and used as a
lookup for dimensionless traction in the x-direction parameter J4 by using
above J1 and previously calculated J3 and k values.
µX is now calculated from:
(Loewenthal & Zaretsky, 1985) equation 40
Spin also generates a side traction force and this need to be calculated.
Figure 30 in (Loewenthal & Zaretsky, 1985) was digitised and used as a
lookup for dimensionless side traction in the y-direction parameter J5 by
using above J1 and previously calculated J3 value.
µY is now calculated from:
(Loewenthal & Zaretsky, 1985) equation 41
By repeating above for each ΔU/U increment the traction curve can be plotted.
6. Selecting operating µX
Usually µX selected for operating conditions is a percentage of the maximum
available µX value in the traction curve. For the purposes of this simulation the
operating µX is set to 90% of the value of µX at 5% slip on the traction curve and the
corresponding J4 value is calculated as:

17 | Page RADIALcvtDesignVer1.8.docx
(Loewenthal & Zaretsky, 1985) equation 40
Where µX now represents the value of µX under operating conditions at 5% slip level.
7. Power calculations
Transmitted power and torque
The transmitted power Pt is calculated as:
Pt= µXQU (Loewenthal & Zaretsky, 1985) page 3
The transmitted input torque is calculated as:
Tt=60Pt/(2πinput rpm)
Power traction contact loss
Figure 31 in (Loewenthal & Zaretsky, 1985) was digitised and used as a lookup for the
power loss factor LF by using the above calculated values for J4, J3 and k.
The ratio of for the contact loss can now be calculated from:
(Loewenthal & Zaretsky, 1985) equation 45
The traction contact power loss is calculated as:
PC= Pt
Rolling traction power loss
By estimating the central EHD film thickness, the power loss due to rolling of the
traction contact can be determined.
The material elastic parameter is calculated as:
(Loewenthal & Zaretsky, 1985) equation 6
The dimensionless EHD speed parameter is calculated as:

18 | Page RADIALcvtDesignVer1.8.docx
(Loewenthal & Zaretsky, 1985) equation 4
Where η0 =0.0194 represents the absolute viscosity of the traction fluid (Santotrac
50) at ambient pressure.
The dimensionless EHD load parameter is calculated as:
(Loewenthal & Zaretsky, 1985) equation 7
The dimensionless EHD materials parameter is calculated as:
(Loewenthal & Zaretsky, 1985) equation 8
Where αp =2.6x10⁻⁸
Pa-1
represents the pressure-viscosity coefficient of the traction
fluid (Santotrac 50).
The dimensionless central EHD film thickness is calculated as:
(Loewenthal & Zaretsky, 1985) equation 12
The central EHD film thickness hc is calculated from:
(Loewenthal & Zaretsky, 1985) equation 2
The rolling traction power loss is calculated as:
(Loewenthal & Zaretsky, 1985) equation 2
Where the length of line contact
Hysteresis power loss
The hysteresis power loss is calculated as:
(Loewenthal & Zaretsky, 1985) equation 51 and page 38
Where the hysteresis loss factor for steel is ϕ=0.01
Total power loss and power efficiency
The total power loss is calculated as:
Ploss= PC+ Pr+ Ph
2

19 | Page RADIALcvtDesignVer1.8.docx
The percentage power efficiency is calculated as:
Peff=100( Pt- Ploss)/ Pt
8. Surface finish calculations
The ratio of film thickness to composite roughness, λ is set to 2 to avoid surface
distress. The composite roughness σ is then calculated from:
λ = hC/σ (Loewenthal & Zaretsky, 1985) page 38
Therefore the actual composite surface roughness should be less than above
calculated σ.
Assuming equal surface roughness, RAq, of body A and RBq, of body B, the maximum
surface roughness, Rq, of body A and B is calculated from:
Rq=(σ2/2)
0.5 (Leimei, 2013) equation 2
Where σ = (RAq2+ RBq
2)0.5
Matlab code was generated to calculate above. The Matlab results were compared against
the Performance calculation example in section 3.3 of (Loewenthal & Zaretsky, 1985) page
35 to 38 to ensure correctness.
The use of the regression analysis is valid for the parameter ranges in Figure 7 below.
Figure 7 Regression analysis parameter ranges

20 | Page RADIALcvtDesignVer1.8.docx
4 Matlab simulation results
Matlab results are presented in the form of graphs, each including the relevant results for
both body A and body B(Convex disk) and for body A and body C(Concave disk).
Since all current commercial CVT and developmental CVT include a variable input radius, a
complex hydraulic control/clamping system is used to vary Q when the input radius varies.
This is required since the tangential contact traction force changes (assuming input torque is
unchanged) as the radius changes. What complicates the matter even further is that two
contact friction drives, including at least two variable radii needs to be optimised by a single
clamping mechanism in toroidal CVT’s. In belt CVT’s two clamping actuators is used, one at
each pulley, but need to be synchronised to maintain the current ratio as torque demand
changes. Controlling slip seems to be a dominant control strategy in current commercial and
developmental CVT’s. Referring for example to (Jans, 2005), the Cone Ring CVT performs at
maximum traction coefficient at 2% slip and the control system was developed to maintain
this level of slip. Control can be simplified to account for torque changes by using a loading
cam. The variable surface rolling speed in commercial and developmental CVT’s adds yet
another layer of complexity to the control system, since all of them create a very significant
overdrive in high ratio, resulting in component speeds of more than double engine/input
speed, with the resulting increase in rolling surface speed and the subsequent drop in
traction coefficient thus requiring a higher clamping force, Q, to maintain current torque
transfer levels. This also leads to more contact cycles and reduces life of the components. As
an example typical operating traction coefficients reported by Torotrak (Heumann, Briffet, &
Burke, 2003) varied from 0.035 to 0.055. All current commercial and developmental CVT’s
have two friction interfaces in series, resulting in compounded losses.
The RADIALcvt has two very significant fundamental advantages in comparison to above.
� Only one friction contact: The RADIALcvt has only one friction drive contact in series
in its parallel power paths and there are therefore no compound losses.
� Constant rolling speed: The maximum surface rolling speed U, is constant through
the ratio range for a given input rpm and is very low at a maximum of 14.3 m/s. Thus
for engine input from idle to 4400 rpm, U changes from 3.25 m/s to 14.3 m/s. Figure

21 | Page RADIALcvtDesignVer1.8.docx
5 indicates that above rolling speed range is on the left hand side and will therefore
not contribute in the reduction of the maximum traction coefficient as is the case in
commercial and developmental CVT’s
4.1 Traction curves, spin and max traction coefficient
Figure 8 Traction curves
Figure 8 presents the traction curves for the Convex (RB) disk and Concave(RC) disk for
different values of RB and RC. It can be seen that on average the maximum traction
coefficient is 0.01 lower in the Concave disk in comparison to the Convex disk. Also small
disk radii result in low maximum traction coefficients which exponentially increase with an
increase in disk radius. Typically increasing the minimum disk radius from 30mm to 40mm
will result in an about 0.013 increase in the maximum traction coefficient.
Evaluating Figure 9 and Figure 10 the following can be concluded:
� From the power loss contribution presented in Figure 10 is can be seen that the
Traction contact power loss PC is the only major contributor to power loss. PC is a
function of the loss factor LF which is a function of J4, J3 and k. Of these parameters,
J3 dominates and is directly related to spin via (Loewenthal & Zaretsky, 1985)
equation 39 and also as reported by (Lichao, 2013).

22 | Page RADIALcvtDesignVer1.8.docx
Figure 9 Spin and maximum traction coefficient
Figure 10 Power efficiency and power losses
� The source of spin, ωS, is the result of a mismatch in body A and body B radii at
contact points on either side of the point of pure rolling and is calculated by
as presented in section 3.4. Spin is zero when the line tangent to
the contact point intersects the intersection of the rotating axes of body A and body
B. Therefore if spin needs to be reduced at the low disk radii then for the convex
disk, ϴB need to be increased at these radii or RA needs to be decreased and/or RB
increased. (Assuming close to equal RB and RA then ϴB =450 will result in zero spin)

23 | Page RADIALcvtDesignVer1.8.docx
Similarly, for the concave disk, spin can be reduced by decreasing RA and/or
increasing RB or in this case, ϴC being negative, needs to be less negative or positive.
� However the radial adjustment of body A (to adjust the ratio) is dependent on a disk
angle. If the disk angle is zero (ϴB= ϴC=0) then the axis of body A needs to be at an
angle other than 900 to the axes of body B and C in order to shift ratios. This will
represent the only configuration in which the performance of the two disks is
identical. Performance optimisation will therefore include the comparison of the
combined performance of the convex and concave disk when ϴB and ϴC are not
equal, to the configuration where body B and body C are flat disks while body A axis
is at an angle other than 900 to the axis of body B and C. The current first prototype
will provide a lot of insights into its shifting characteristics.
� To counter the effect of the lower maximum traction coefficient at low RB and RC the
profile of the convex disk and concave disk can be modified to have a variable angle
ϴB and or ϴC angle in such a way as to decrease the distance between these disks at
low values of RB and RC. The effect will be that the two disks will be forced further
apart when body A makes contact in this region. Since the clamping force is supplied
by mechanical springs, the springs will be further compressed and the clamping force
will increase accordingly to maintain the current torque level by compensating for
the lower maximum traction coefficient. For example the current prototype springs
are compressed 4mm, thus if above method is applied and for example if the springs
are just compressed an additional 1mm this will result in a 25% increase in the
clamping force.
� It is also very important to note that the high RB and RC values correspond to the low
RADIALcvt ratios at pull away. Thus in city driving the RADIALcvt will operate in its
very high power efficiency range typically under lower power loads. Current
commercial CVT have difficulty in obtaining high power efficiency in these
conditions, particularly because of the hydraulic control system.

24 | Page RADIALcvtDesignVer1.8.docx
� Thus for a very basic RADIALcvt, assuming low maximum contact stresses, typically
below 2 GPa, the clamping force can be constant and thus created by mechanical
springs. This however will result in over clamping at partial load, but the associated
efficiency loss needs to be compared to the cost of a loading cam.
� When a more powerful RADIALcvt is considered, the same basic design is used, and
maximum clamping force can be increased to say 2.5 GPa while employing a loading
cam in combination with mechanical springs to optimize clamping vs input torque.
This loading cam can be based on input torque as presented in section 4.3.5.
4.2 Elliptic ratio, maximum contact stress and power efficiency
The elliptic ratio k, a and b plays an important role in both the maximum contact stress and
spin. Ideally a high value of b (semi width of contact area in the x or rolling direction) is
desired with lower values of a (semi width of contact area in the y- direction transverse to
the rolling direction) to produce lower values of k=a/b. However the larger the area created
by the ellipse with radii a and b the lower the maximum contact stress. Line contact
between body A and B as well as A and C is very effective in reducing the maximum contact
stress. However line contact is only possible throughout the ratio range for constant values
of ϴB and ϴC while this line contact l=2a is in the y direction, so care should be taken that it
does not have a significant effect on increasing spin losses.
Figure 11 Maximum contact stress and elliptic ratio

25 | Page RADIALcvtDesignVer1.8.docx
Figure 12 Power efficiency and Input torque
Evaluating Figure 11 and Figure 12 the following conclusions can be made:
� The convex disk produces higher k and maximum contact stresses while all stresses is
below 2 GPa in the current design.
� Power efficiency is generally very high, average from about 95% to 98.5%, with the
convex disk typically 1% higher than the concave disk.
� Average torque increase from low values of RB and RC from about 11 N.m to 18N.m
while the Convex disk torque is generally about 2 N.m higher.
� Note the total torque of the current RADIALcvt is obtained by multiplying above
average torque by the 6 parallel power paths, thus from about 66 N.m to 108 N.m.
and 30 kW to 50 kW Figure 13 presents the input power and torque of the complete
RADIALcvt.
Figure 14 presents the central film thickness hc and the minimum surface roughness Rq
for above conditions. It can be seen that a surface roughness of about 0.4 um on both
the radial driver and disks will prevent metal on metal contact.

26 | Page RADIALcvtDesignVer1.8.docx
Figure 13 Input power, torque and power efficiency for the complete RADIALcvt
Figure 14 Minimum surface roughness and EHD film thickness
4.3 Comments on optimization
4.3.1 Increasing maximum disk size
The current RADIALcvt has a disk diameter of 292mm. In the case of a front wheel drive
transmission the standard is that the differential axis is 180mm from the engine/RADIALcvt
input axis. If it is assumed that a 25mm driveshaft has to pass over the disks, the disk
diameter can be increased to 335 and typically the RB and RC range can be increased from

27 | Page RADIALcvtDesignVer1.8.docx
143mm to 165mm. If a ratio range of 4.5, equal to the current equivalent manual
transmission is chosen, the minimum value of RB and RC will increase from 30mm to 37mm.
Above results in a 0.5% increase at the minimum value of RB and RC in power efficiency from
95% to 95.5%.
4.3.2 Varying planetary system e value
From Figure 12 it can be seen that the input torque of the Concave disk is consistently lower
than that of the Convex disk. If left unattended, the Concave disk torque will always
represent the maximum input torque for both the Concave and Convex disk for an equally
balanced planetary system with e value of -1 if calculated according to (Shingley & Miscke,
1989) page 553, which results in an equal 50% torque contribution of both the Convex and
Concave disk to the Combining planetary system of Figure 1. By changing the e value of the
Combining planetary system the torque contribution between the Convex and the Concave
disk can be changed to such a ratio as to compensate for the difference in maximum toque
capability of the two disks. Such a non-equal ratio will allow each disk to produce its
respective maximum torque for the same clamping force. (Shingley & Miscke, 1989)
4.3.3 Integrating a two speed AMT
If a more power full RADIALcvt is considered and if it needs to compete with the current
maximum ratio range on the market, around 10, then the following can be done:
Figure 15 Effect of 2 speed AMT integration
� A two speed automated manual transmission can be integrated and this will require
the RADIALcvt variator to only produce a ratio range of 101/2
=3.16.

28 | Page RADIALcvtDesignVer1.8.docx
� Taking above maximum RB and RC value of 165 and ignoring the fact that a more
powerful engine will have a bigger flywheel and therefore allow bigger disks, the
operating range of RB and RC is decreased to 165/3.16=52.2 to 165 mm.
� Above will create space around the input bevel gear and will allow the addition of
another radial drive (body A) resulting in 8 parallel power paths vs the current 6.
Figure 15 presents the results of above with minimum power efficiency of about 96.6% in
high ratio to about 98.7% in low ratio.
4.3.4 Increase line contact length
Increasing the line contact from 2.35 mm to 5 mm reduces the maximum contact stress, but
increase a and therefore also k which leads to an increase in spin and lowering the power
efficiency. Increasing the normal load Q to 15600 N, still produces contact stresses below 2
GPa but increases minimum input torque and power to 225 N.m and 100 kW respectively as
presented in Figure 16. Above is accomplished with the sacrifice of about 1.25 % in
minimum power efficiency of which the average is still above 95 %. The huge advantage is
the input torque and power is about double the levels before the line contact increase as
presented in Figure 15.
Figure 16 Effect of 2 speed AMT integration and line contact length increase
From Figure 17 it can be seen that spin level decrease as a result of the AMT integration
(increase in the minimum RB and RC values), but again increased with the line contact length
increase to more or less the same levels as that of Figure 9.

29 | Page RADIALcvtDesignVer1.8.docx
Figure 17 Line contact increase effect on spin and maximum traction coefficient.
4.3.5 Different ϴ angles and a loading cam
Note that line contact are maintained, if different fixed angles of ϴB and ϴC are used, while
this difference will create a variable normal load Q, created by mechanical springs, which
can be used to compensate for the lower maximum traction coefficient at low RB and RC
values. This will then also prevent over clamping in high values of RB and RC. Note that all of
above is based on maximum contact stress values of less than 2 GPa, which is very low
compared to industry standards.
In case where over clamping due to partial loads occur, the cost penalty to implement a
loading cam need to be considered and compared to the power efficiency gain.
The configuration of the RADIALcvt variator facilitates the implementation of a loading cam
in the following way. The structure, in which the radial drivers are housed, has a reaction
torque around its axis (coinciding with the axis of the input shaft) which is equal to the input
torque. The reason for this being the fact that each radial driver (body A) is subject to a
tangential traction force in each of the two contacts with the convex a concave disk. These
forces are substantially equal but in opposite directions, thus cancelling each other.
Thus for the implementation of a loading cam the above structure, housing the radial
drivers, can be coupled (which may include a torque multiplying gear ratio) to a loading cam
operation between one of the disk bearings and the RADIALcvt casing.

30 | Page RADIALcvtDesignVer1.8.docx
With above in place the combination of different fixed angles of ϴB and ϴC together with
mechanical springs and the addition of a loading cam as per above would prevent over
clamping in all operating conditions of the RADIALcvt.
5 Contact simulation summary
In general considering the high levels of power efficiency which should result in low
operating temperatures and relative high maximum traction coefficients at relative low
maximum contact stresses (below 2 GPa) the following:
� Other traction fluids should be investigate that under low temperatures and low
contact stresses provide better maximum traction coefficients at higher levels of
spin. (Loewenthal & Zaretsky, 1985) indicates that softer traction fluids (lower slope
m) with thicker film thickness are more tolerant of spin.
� Note that all of above is under the assumption that engine torque and power does
not need to be limited in some ratios as is the case with commercial CVT’s. Therefore
the RADIALcvt relies on the fact that it can, in all ratios, handle any maximum torque
the engine can create, thus eliminating any engine power or torque limiting control
system.
5.1 Without AMT integration
Without AMT integration, the spin levels are already high and therefore any contact line
increase will further lower the maximum traction fluid and power efficiency. The
performance of the contact line in question does not vary too much from a crowned surface
in terms of contact stresses, thus in this case variable ϴB and ϴC angles can be used to
counter spin and vary clamping force to compensate for lower maximum traction
coefficient. Ratio range for the current prototype is 4.7 and seems to be close to a maximum
because of the available space. Minimum power and torque levels are at 30 kW and 66 N.m
respectively.
5.2 With 2 speed AMT integration
With AMT integration the ratio range is reduced to 3.16 to provide a CVT with an overall
ratio range of 10, equalling the maximum currently in the industry. The reduced ratio range,

31 | Page RADIALcvtDesignVer1.8.docx
enables larger minimum RB and RC values which in turn reduce spin, increase traction
coefficient and power efficiency while also allow space for the inclusion of a fourth radial
drive (body A) thus creating 8 parallel power paths.
If ϴB and ϴC are kept fixed, line contact is possible in all ratios and by increasing the line
contact reduces the maximum contact stress. The downside of line contact is an increase in
spin, resulting in lower maximum traction coefficient and lower power efficiency.
However by increasing the contact line length from 2.3mm to 5mm and increasing the
normal load Q to 15600 N, while still keeping maximum contact stresses below 2 GPa,
produces a 225 N.m, 100 kW CVT with a minimum power efficiency of 95 %. The penalty for
the line contact increase is about 1.25 % in power efficiency. Note that line contact is not
possible in toroidal or planet ball CVT’s. This is thus a major advantage of the RADIALcvt.
Yet another advantage of the RADIALcvt in comparison to chain/belt CVT’s is the fact that
the disks in the RADIALcvt are uniformly loaded. In chain/belt CVT’s the chain/belt only
makes contact on the one side of the disks creating a force that tends to push the disks
away from each other on only one side. To counter this involves stiffer disks, shafts and
bearings to deal with this.
Yet another advantage of the RADIALcvt compared to current commercial and
developmental CVT’s is the fact that in the case of the RADIALcvt, one unit of clamping force
supports 2 parallel power paths. In the case of toroidal and planet ball CVT’s a unit of
clamping force support two friction drive contacts point (input toroid to roller to output
toroid) of a single friction drive path with two friction drive contacts in series. In belt/chain
CVT’s for the input pulley a unit of clamping force supports two friction contact interfaces
on either side of the belt/chain which represents two parallel power paths, but since an
output pulley is also required the total belt/chain CVT with two pulleys and their respective
clamping forces also result in two friction drive interfaces for each unit of clamping force,
the same as for the toroidal CVT’s. However note that in belt/chain CVT’s the clamping force
is not applied across bearings, thus they do not suffer the effect of bearing loss due to
clamping force. However the camping force creates a belt/chain tension force which tends
to pull the two pulleys towards each other and therefore the bearings being loaded with this
force suffer the relevant losses indirectly caused by the clamping force.

32 | Page RADIALcvtDesignVer1.8.docx
In high efficiency traction drives, the losses in the bearings supporting the clamping force
can be a major contributor to the overall losses in the CVT (Loewenthal & Zaretsky, 1985).
Above provides the RADIALcvt with a fundamental advantage with the potential of having
only 50% of the clamping bearing losses if compared to belt/chain, toroidal, planet ball and
cone ring CVT’s.
6 Bearing loss analysis
6.1 Disk bearings
The disk bearings presented in Figure 1 is for use in a RADIALcvt display version with perspex
casing plates and is not suited for efficiency testing because of their large diameter which
will result in large bearing losses as well as the fact that deep groove bearings create
relatively large losses when loaded axially. Disk bearings for use in the RADIALcvt have to
serve the following purposes:
1. Bear the clamping force create by the mechanical springs.
2. Stabilize the variator structure relative to the disks and RADIALcvt casing.
3. Have minimal power losses.
The variator structure is centralised around the output axis via a bush in the front casing and
at the rear via a bearing located in the convex disk. However if not at least one disk is
secured parallel to the variator structure, the two disk might not be parallel and this will
cause a difference in the radius of the three drivers with respect to the input shaft axis. This
is of particular concern when the RADIALcvt is in the high ratio (radial driver are at a
minimum radius with respect to the input shaft axis). Thus to secure and stabilize the
convex disk, its bearing location need to be at a relative large radius, as in the current
prototype design, but without the typical losses associated with large diameter bearings.
Figure 18 presents a design which supports the convex disk at a relative large radius by using
three Bearing units mounted with their axis in the radial direction from the input shaft in a
Clamping unit. The Clamping unit is mounted in the casing of the RADIALcvt via the mating
of its outer Circular body with a circular cut out in the casing and is axially slidable relative to
the casing. An angled surface (green) on the Bearing units make line contact with a mating

33 | Page RADIALcvtDesignVer1.8.docx
Disk angled surface (green) on the rear of the Convex disk. This angled surface is at such an
angle that the line contact does not experience any spin and therefore consists of pure
rolling. A Center bearing in the Clamping structure, mating with a Center boss on the Convex
disk rear secures the Convex disk concentric to the Clamping structure. The Clamping
springs acts between the Clamping unit and the RADIALcvt casing to force the Convex disk
via the mating green surface against the radial drivers.
Figure 18 Clamping unit and Convex disk
Figure 18 presents a cross section of the assembled Clamping unit and Convex disk. The
Bearing units consist of a NU303ECP cylindrical roller bearing to handle the radial load, while
a 51103 thrust ball bearing handles the axial load created by the angled green line contact
surface. The size of the Bearing unit and its line contact radius with the Convex disk is such
that the Bearing unit turns 2.17 times faster than the Convex disk. It is assumed that the
NU303ECP bearings bear the full clamping force in their radial direction and that the 51103
bear 0.35 (angled surface at 19.40) of the clamping force in their axial direction.

34 | Page RADIALcvtDesignVer1.8.docx
Figure 19 Cross section of assembled Convex disk and Clamping unit
The Concave disk is simply supported via a 51113 thrust ball bearing. Figure 20 to Figure 22
presents sample calculations of above bearings from the online SKF bearing calculator (SKF,
SKF) for a disk speed of 2000 rpm.
Figure 20 NU 303 ECP bearing calculations

35 | Page RADIALcvtDesignVer1.8.docx
Figure 21 51103 bearing calculations
Figure 22 51113 bearing calculations

36 | Page RADIALcvtDesignVer1.8.docx
Figure 23 presents the bearing losses in Watt of all the clamping related bearings and Figure
24 presents these losses as a percentage of transmitted power.
Figure 23 Clamping bearing losses in Watt
Figure 24 Clamping bearing losses as a % of transmitted power

37 | Page RADIALcvtDesignVer1.8.docx
It can thus be concluded that overall disk/clamping bearing losses, under the influence of
the clamping force, is at a maximum of less than 3.5 %. Note that when a smaller ratio range
is required, like in the case with AMT integration in section 5.2, only a 3.16 ratio range is
required, corresponding to a minimum disk radius of about RB=RC=45 mm and according to
Figure 24 will reduce the total bearing losses to about 1.5%.
6.1.1 Clamping force advantages
The RADIALcvt configuration includes the following two important clamping force
advantages.
� Clamping force utilization: As already mentioned in section 5.2, a unit of clamping
force supports two parallel friction interfaces, and all other CVT’s supports only one,
thus in equal conditions the RADIALcvt should have 50% of the clamping bearing
losses.
� Clamping force location: The RADIALcvt clamping force, bearing losses are only
associated with the RADIALcvt output, namely the Convex and Concave disks, while
the RADIALcvt input, the radial drivers, are in equilibrium as mentioned in section
4.3.5. Thus these bearing losses, for a given clamping force, are only a function of the
RADIALcvt output speed. This has the obvious low loss advantages in low output
speed ratios. In contrast in all other CVT’s, the clamping force is associated with both
the input and output speeds of the respective CVT, thus for a given clamping force
the applicable speed for bearing loss calculation would be the average of the input
and output speeds.
6.2 Radial shaft bearing losses
As described in section 4.3.5 the radial shafts experience no radial load as a result of its
interaction though the two friction drive contacts as the tangential forces cancel out. Thus
the bottom radial bearing experience the radial and axial force created in its 1:1 Zerol bevel
drive with the input shaft. Using the equation provided by (TIMKEN, 2017) the tangential
force and axial thrust of the Zerol gear is calculated and used as input in the bearing loss
calculations. For a total of 70 N.m input torque, resulting in 23.3 N.m per radial shaft, the
radial force on the botton 6003 depp groove ball bearing is 1735 N and the axial force 446
N. Figure 25 presents the losses as calculated by the online SKF bearing calculator. The loss

38 | Page RADIALcvtDesignVer1.8.docx
is only 22 Watt per bearing and thus a total of 66 Watt or about 0.2% if 30 kW is transmitted
and can thus be ignored for a first prototype analysis.
Figure 25 Bottom radial driver bearing losses.
Note that the radial shaft bearing losses are load dependent.

39 | Page RADIALcvtDesignVer1.8.docx
7 Ratio shifting analysis
7.1 Geometry analysis
Figure 26 Radial driver force diagram
Figure 26 presents the two force diagrams on the radial driver as a result of the Convex disk
(B) and Concave disk (C) being clamped together by a force FclampB which under normal
operating conditions is equal to FclampC resulting in line contact between the two disks and
the Radial driver. It is assumed that the normal force (FparB and FparC) between the respective
disk and Radial driver act at the centre of the contact line. Disk B convex angle is ϴB and disk
C concave angle is ϴC and is currently taken as being equal.
The force Fshift acts perpendicular to the radial driver axis and is the result of moving the
radial driver shaft in the direction of Fshift during ratio shifting, thus to a larger radius of RB
and RC.
The following relationships can be established from Figure 20 and above.
FparB= (FclampB+ Fshift)sin(ϴB) (R1)
FparC= (FclampC- Fshift)sin(ϴC) (R2)
The difference between the vertical components of FparB and FparC provides the resultant
force shifting FS which will be exerted on the radial driver to move it to a different radial
ratio position. Thus from above
Fs= FparB cos(ϴB)–FparCcos( ϴC ) (R3)

40 | Page RADIALcvtDesignVer1.8.docx
Combining equation 1 to 3 provides
FS= cos(ϴB)(FclampB+ Fshift)sin(ϴB) – cos( ϴC ) (FclampC- Fshift)sin(ϴC) (R4)
Figure 27 Radial shaft and driver
In order to shift, FS needs to be larger than Ffric, the friction force with friction coefficient µt
between the radial driver and radial shaft created by the torque Tt being transmitted, added
to the friction force with friction coefficient µs between the radial driver and radial shaft
created by Fshift, thus:
Ffric= Tt µt /RF + Fshift µs (R5)
In order for the current ratio to be in equilibrium, FS, in equation R4 is set to zero and
solving for Fshift , while noting that Fclamp = FclampB =FclampB =clamping force across disks, gives:
Fshift= Fclamp [cos(ϴC)sin(ϴC) - cos(ϴB)sin(ϴB)]/[ cos(ϴB)sin(ϴB)+ cos(ϴC)sin(ϴC)] (R6)
From equation R6 is can be seen that Fshift is only zero if ϴC=ϴB, thus if they differ Fshift will
represent the force required to keep the RADIALcvt in the current ratio.
The radial driver also experiences a torque TD around an axis perpendicular to Figure 26 as a
result of the distance Rdiff and it is calculated by:
TD=0.5Rdiff(FnormB + FnormC ) (R7)
In terms of the clamping forces, equation R7 can be written as:

41 | Page RADIALcvtDesignVer1.8.docx
TD=0.5Rdiff(FclampBcos(ϴB) + FclampCcos(ϴC)) (R8)
Figure 28 Ratio shifting forces
Figure 28 below present the ratio shifting parameters for the conditions presented in Figure
8 to Figure 13 with µt =µs=0.05. It can be seen that ShiftRes= FS- Ffric, has positive values thus
the shifting force Fshift=2000 N will be sufficient to overcame the friction. ShiftRes thus
represents the force available to act on the two rolling friction drive contact interfaces, on
either side of the radial driver, to move it to a larger radius/values of RB and RC. The rate of
this radius change will be further investigated when experimental data is available, but
should be a function of clamping force and torque transmitted.
The moment TD as calculated from equation R8 might also have an effect on µt and µs as it
might tend to continually close the tolerance gap between the radial driver and radial shaft
on opposite sides in an axial direction of the radial driver and will also be investigated when
experimental data is available. Shifting friction force can be drastically reduced by
implementing ball splines between the radial shafts and the radial drivers. In this case µt and
µs will represent rolling friction which is much lower than the above values of 0.05 for sliding
friction, but the additional cost penalty need to be considered.

42 | Page RADIALcvtDesignVer1.8.docx
7.1.1 Alternative radial shaft and driver design
Figure 24 presents and alternative Radial shaft and Radial driver design in which µt is
drastically reduced as follows. The Radial shaft is modified to include a Radial slot right
through its center including a wider Roller slot at each side. The Radial driver is modified to
include a Roller pin, mated at its ends in cavities in the Radial driver and secured by two
Securing pins. The Roller pin carries two Rollers that in operation roll along the Roller slots.
In this design the Rollers can be of the SKF RSTO type of support rollers (SKF, 1989) with
integrated needle rolling bearing. In the Figure 29 design the torque Tt is transmitted via the
Rollers and thus in this case µt presents rolling friction in the Roller’s needle bearing
together with the rolling friction of the Rollers in the Roller slots, while in the Figure 27 case
µt presented sliding friction between two surfaces, thus drastically reducing the value of µt
in the Figure 29 design and thus reducing Ffric as per equation R5. µs remains unchanged in
this design.
Figure 29 Modified radial shaft and driver design
7.2 Total shifting torque and forces
The total torque Vt on the variator and the ball screw shifting force Fbs for the sum of all the
radial drivers due to Fshift is calculated as follows:
Vt= Fshift nrdLramp/(2π) (R9)
Fbs= Vt/Rbv (R10)

43 | Page RADIALcvtDesignVer1.8.docx
Where nrd = number of radial drivers
Lramp = the lead m/rev of the ramps on the casing on which the variator rides
Rbv =the radius from the RADIALcvt input axis to the ball screw attachment
Since Fshift is constant, Vt= 76 N.m and Fbs=381 N are also constant for the conditions in
Figure 28. Note that as discussed in section 4.3, the normal force Q (directly related to the
clamping force), which currently is constant, need to be varied, for optimization purposes,
to allow a near constant input torque Tt. Thus if Q is not constant then Fshift will vary
accordingly. Above values is only given as an example to present the order of magnitude.

44 | Page RADIALcvtDesignVer1.8.docx
8 Prototype testing
A RADIALcvt prototype was manufactured and Figure 30 presents the main variator
components. The prototype was design according to the parameters in section 2 but
capable of up to 100 N.m input torque, limited by the radial shaft Zerol bevel gears.
Figure 30 Prototype variator components
The disks were manufactured from EN36B (655M13) steel and case hardened to 60 HRC. It
was then hard machined and finished with a diamond burnishing tool to a surface finish of
0.15 um Ra for the convex disk and 0.175 um Ra for the concave disk. These values are
within range of required values. See Figure 14. The radial drivers were manufactured from
Bohler S600 high speed steel and hardened to 64 HRC.
8.1 No load tests
Initial tests on the prototype include no load tests but with 100% clamping force. Such no
load tests, by measuring the power to spin the prototype with no load attached, are very
important for the following reasons.
1. The losses in the bearings supporting the clamping forces are included in this
measurement. These losses do not change when the transmission is under load

45 | Page RADIALcvtDesignVer1.8.docx
conditions and thus load independent in the absence of a loading cam, which is
currently the case.
2. The rolling traction power loss Pr and hysteresis power loss Ph, as presented in
section 3.4 7, is load independent and also included in the measurement.
3. Above bearing losses, Pr and Ph can be calculated and subtracted from the measured
power to spin the prototype, with no load attached, to provide a power loss that can
only be attributed to oil drag and misalignments in radius differences of the radial
drivers with respect to the input shaft axis.
Figure 31 presents the power consumption of the prototype with an input speed of 2000
rpm while continuously changing the ratio by changing the radial driver radius RB and RC
between 40 mm to 139 mm (1.22 : 1 to 4.24 :1) resulting in a output speed variation
from 1639 to 471 rpm. The ratio was changed very slowly to reduce any shifting losses
as far as possible. Total clamping force via the mechanical springs was 20498 N or 6832
N per radial driver and the temperature was 600 C.
Figure 31 RADIALcvt no load power consumption
In order to deduct the clamping force related losses due to the two SKF 61932 deep groove
ball bearings, each supporting a disk, the losses were calculated via the online SKF bearing
calculator (SKF, SKF). Figure 32 present a sample calculation for above bearing.

46 | Page RADIALcvtDesignVer1.8.docx
Figure 32 SKF bearing calculator sample result
Figure 33 Clamping bearings, Ph and Pr simulated losses
Figure 33 presents the simulated losses for the two clamping force (disk supporting) 61932
deep groove ball bearings together with the Ph and Pr losses. It also includes the measured
losses at the high and low ratio. From Figure 33 it can be seen that in the case of the high

47 | Page RADIALcvtDesignVer1.8.docx
ratio test, the losses were only about 400 Watt higher than the simulated bearing losses. Ph
and Pr can be ignored since they are very small.
Figure 34 presents the scenario in which the 61932 deep groove ball bearings are replaced
by the optimised bearing configuration presented in section 6.1. This optimised bearing
configuration includes a 5113 thrust ball bearing supporting the concave disk and three
NU303ECP cylindrical roller bearings in combination with three 51103 thrust ball bearings.
The losses were calculated by the same SKF bearing calculator (SKF, SKF) as per above. The
green diamond marker presents the high ratio losses in the case where the optimised
bearing configuration is used and has a value of 653 Watt.
It can thus be concluded that oil drag and possible radial misalignment and other bearing
losses for an input speed of 2000 rpm and total clamping force of 20400 N in a high ratio
with disk speed of 1639 rpm amounts to 378 Watt. (the difference between the green
marker (653 Watt) and the total bearing loss magenta line (275 Watt))
Figure 34 Optimised bearing configuration losses

48 | Page RADIALcvtDesignVer1.8.docx
8.2 Conclusions
The following conclusions and observations can be made:
1. Above results clearly demonstrate the huge advantage of the RADIALcvt in
comparison to other commercial CVT’s in that the clamping force related bearing
losses are only associated with the variator output (disk) speed while in commercial
CVT it is associated with the input and output speeds. See also section 6 for a
discussion.
2. The no load losses have a more or less linear relationship with the output (disk)
speed.
3. Note that 100% clamping force are maintained at all times eliminating a hydraulic
control system as well as a loading cam. Commercial CVT’s include both a hydraulic
control system and loading cam.
4. At a disk speed of 1639 rpm the current prototype can transmit a maximum of 46
kW (100 N.m input torque and 4400 input rpm with a variator ratio of about 2.7:1
and RB=RC=81mm. See Figure 13) which means that for the optimised bearing
configuration all losses except the Power traction contact loss PC (see section 3.4 7 )
will amount to 1.4% (0.653 kW/46kW) of the transmitted power.
5. It can be concluded that the radial drivers operate on the same radius and that the
shifting mechanism is operating correctly. If this was not the case, much larger
losses would have been experienced. This is quite a crucial issue, which is working
very well. The very low losses of 180 Watt in the low ratio test in Figure 34 also
confirm the above.
9 References
Carter, J., Pohl, B., Raney, R., & Sadler, B. (2004). The Turbo Trac Traction Drive CVT. SAE
International, 7.
Heumann, H., Briffet, G., & Burke, M. (2003). System efficiency optimisation of the Torotrak
Infinitely Variable Transmission (IVT). Lancashire, UK.: Torotrak Development.

49 | Page RADIALcvtDesignVer1.8.docx
Jans, C. (2005). Slip measurement and control in a cone ring transmission. Eindhoven:
Eindhoven University of Technology.
Leimei, L. (2013). Assesment of Effects of Surface Roughness and Oil Viscosity on Friction
Coefficient under Lubricated Rolling-sliding Conditions. Komatsu.
Lichao, P. (2013). Tribology of a CVT traction drive. Eindhoven: Eindhoven University of
Technology.
Loewenthal, S. H., & Rohn, D. A. (1983). Regression analysis of traction characteristics of two
traction fluids. Cleveland, Ohio: NASA Technical paper 2154.
Loewenthal, S. H., & Zaretsky, E. V. (1985). Design of Traction Drives. Ohio: NASA Reference
Publication 1154.
Loewenthal, S., & Rohn, D. (1983). Traction Behavior of Two Traction Lubricants. American
Society of Lubrication Engineers. Houston, texas.
Shingley, J., & Miscke, C. (1989). Mechanical Engineering Design (Fifth ed.). Singapore:
McGraw-Hill.
SKF. (1989). SKF General catalogue. Germany.
SKF. (n.d.). SKF. Retrieved 8 4, 2017, from SKF Bearing calculator:
http://webtools3.skf.com/BearingCalc/selectProduct.action
TIMKEN. (2017). TIMKEN product catalog A21.


![Simulation Studies of a Prototype Stripline Kicker for the ...[4] CST Studio Suite 2015, Computer Simulation Technology, [5] C. Yao HWD O , Preliminary Test Results of a Prototype](https://img.dokumen.tips/doc/110x75/6125c0f7ff812658807ca828/simulation-studies-of-a-prototype-stripline-kicker-for-the-4-cst-studio-suite.jpg)