Embed Size (px)
Citation preview

Racial Transformation and the Changing Nature of Segregation
By
Gary Orfield and Chungmei Lee
January 2006

Copyright © 2006 by President and Fellows of Harvard College All rights reserved. No part of this publication may be reproduced or transmitted in any form or by any means, electronic or mechanical, including photocopy, recording, or any information storage and retrieval systems, without permission in writing from The Civil Rights Project. This publication should be cited as: Orfield, G. and Lee, C. (2006). Racial Transformation and the Changing Nature of Segregation. Cambridge, MA: The Civil Rights Project at Harvard University. Additional copies of this report may be obtained from our website at: http://www.civilrightsproject.harvard.edu/
2

ACKNOWLEDGEMENTS
This report could not have been produced without the dedicated efforts of staff members at The Civil Rights Project. In particular, we thank Erica Frankenberg, Lori Kelley, Jerry Monde, Jennifer Blatz, and Christina Tobias-Nahi for their invaluable assistance. We would also like to thank Carolyn Peelle for her feedback.
3
RACIAL TRANSFORMATION AND THE CHANGING NATURE OF SEGREGATION
When Martin Luther King made his first speech at the Lincoln memorial in 1957 three years after the Brown decision, desegregation was about a battle to give black students access to schools previously established for whites only, mostly in the seventeen states that had practiced segregation by state law. King called for action to enforce the desegregation decision. The nation’s schools were overwhelmingly white, and when King marched against segregation eight years later in Chicago in 1965, it was still about a black-white conflict. Forty years later, however, the nation’s schools have changed almost beyond recognition; the white majority is continuously shrinking, and the segregation has taken on a multiracial character. Unfortunately, though generations of students have been born and graduated, segregation is not gone. In fact, in communities that were desegregated in the Southern and Border regions, segregation is increasing; and in regions that were never substantially desegregated, including many metropolitan areas in the Northeast, Midwest, and West, segregation is growing in degree and complexity as the nation becomes increasingly multiracial. The resegregation of blacks is greatest in the Southern and Border states and appears to be clearly related to the Supreme Court decisions in the l990s permitting return to segregated neighborhood schools. These changes, and the continuing strong relationship between segregation and many forms of educational inequality, compound the already existing disadvantage of historically excluded groups. The rapid growth of these excluded populations in conditions of intensifying segregation make urgent the development of plans and policies to transform diversity into an asset for all children and society, rather than continuing to separate children in a way that harms both those excluded from better schools and white students in those schools who are not being prepared for success in multiracial communities and workplaces of the future. School segregation is often perceived as an old and obsolete issue. Reactions include claims that it was solved long ago, that, on the contrary, experience shows it cannot be solved, or that we have learned to make separate schools genuinely equal. None of these perceptions is true. Past research showed that, after a period of desegregation in the late 1960s, black students became increasingly resegregated in the South and Border states. Latino students, who have been excluded from serious desegregation efforts, are becoming even more segregated than black students in Southern and Western regions. Yet, despite recent trends in resegregation, the South and Border states remain among the least segregated for black students, suggesting that desegregation orders in the past have been effective, and that segregation is not an intractable issue. Further, the strong relationship between poverty, race and educational achievement and graduation rates shows that, but for a few exceptional cases under extraordinary circumstances, schools that are separate are still unquestionably unequal. Segregation is an old issue but one that is deeply rooted and difficult to resolve and extremely dangerous to ignore. If segregation were just about race or ethnicity, it might be of only academic interest. However, segregation is rarely only by race or ethnicity. It is almost always double or triple segregation, involving concentrated poverty and, increasingly, linguistic segregation, and this multiple segregation is almost always related to many forms of tangible inequality in educational opportunity on multiple dimensions. When the Supreme Court decided the Brown decision that began the desegregation revolution, it emphasized the psychological harms of segregation and said nothing specific about the educational gains connected with desegregation. The decision
4
was largely about giving students the right to attend the normal public schools where they would presumably receive more equal education and not face the stigma of apartheid and overt racial exclusion. Not much could be known about segregation outside the South because many schools and state governments did not even collect racial statistics that would permit people to know how much segregation there was, much less what it was related to. Further, though urban desegregation was resisted, it has been viewed as a positive experience by both white and minority parents whose children experienced it as well as teachers and students. In a 2004 poll held by Education Week, Americans expressed their belief in the importance of racially integrated education.1 Our project surveyed African Americans and Latinos in metro Boston in 2005, in the city that saw what was probably the most bitter conflict in any American city over school desegregation back in the l970s.2 We found that even there, where minority families feel unwelcome in many settings, a large majority wants more done to integrate the schools. An earlier study of black Boston parents who sent their children on long bus rides to suburban schools showed that their motivation was overwhelmingly to obtain better school opportunities for their children, and they found both the opportunities and the interracial experiences strongly positive.3 Surveys we have conducted among high school juniors in cities across the country show very positive responses to interracial educational experiences among all groups of students, who feel well prepared to live and work in a multiracial society.4 In a survey conducted in 2003, more than half (57%) of adults surveyed believed that racially integrated schools are better for kids, and only seven percent believed the opposite.5 The fact that desegregation is not being discussed by political and most educational leaders does not mean that it is not highly important or that it failed or that there are no viable alternatives, only that it is controversial. Lastly, there has not been a serious discussion of the costs of segregation or the advantages of integration for our most segregated population, white students. The lack of discussion of this issue in public schools stands in sharp contrast to the intense national discussion of the question in colleges during the long struggle that led up to the Supreme Court’s 2003 decision upholding affirmative action in college admissions. In that decision, the Court concluded that there was compelling evidence of tangible benefits of college integration for white and all other groups of students, and that the nation’s major institutions and the democracy itself needed to have students trained in interracial settings who were prepared for adult lives in the kind of society we are becoming. Research that The Civil Rights Project and others conducted in colleges clearly showed such benefits for white students, whose previous schooling had been the most segregated, and this research was recognized by the Supreme Court in upholding affirmative action.6 A recent national poll in 2004 found that close to two-thirds of Americans surveyed
1 Reid, K. (2004). Survey Probes Views on Race. Washington, DC: Education Week. 2 Louie, J. (2005). “We Don’t Feel Welcome Here: African Americans and Hispanics in Metro Boston.” Cambridge, MA: The Civil Rights Project at Harvard University. 3 Eaton, S. (2001). The other Boston busing story: What’s won and lost across the boundary line. New Haven, CT: Yale University Press. 4 Kurlaender, M. and Yun, J. (2001). Is diversity a compelling educational interest? Evidence from Louisville in Gary Orfield and Michal Kurlaender, eds. Diversity challenged: Evidence on the impact of affirmative action. Cambridge, MA: Harvard Education Publishing Group. 5 Pew Hispanic Center/Kaiser Family Foundation. National survey of Latinos: Education, January 2004. 6 Gurin, P., Dey, E., Hurtado, S. and Gurin, G. (2002). “Diversity and Higher Education: Theory and Impact on Educational Outcomes.” Harvard Educational Review. 72 (3); Orfield, G. and Whitla, D. “Diversity and Legal
5

believe it is “very important” that colleges and universities prepare students to participate in a diverse society.7 Further, more than 70 percent of those surveyed believed that students acquiring a diverse educational experience on college and university campuses would bring society together. This report is about the changing patterns of segregation in American public schools through the 2003-2004 school year. We begin by examining the transformation of racial composition in the nation’s schools, the dynamic patterns of segregation and desegregation of all racial groups in regions, states, and districts by using data from 1968 until 2003-4.8 We examine both the changes over the last decade (1991-2003) as well as those over a much longer period (1954-2003). Unless otherwise specified data from this report are computed from the Common Core of Data of the National Center for Education Statistics of the U.S. Department of Education for the years 1991 and 2003. Where data for a given year is missing, such as the racial statistics from Georgia and Virginia for 1991, it is noted in the tables and the nearest year is substituted and noted.9 We then explore the relationship between racial and economic segregation, document the growing presence of multiracial schools, as well as discuss the implications of the lifting of desegregation orders on districts and the possible policy alternatives. The report ends with a brief discussion of what could be done to increase integration in schools. We rely on two kinds of measures to examine the dimensions of segregation.10 The exposure index measures the share of a particular group in the school of the average student of another racial group. We also examine the distribution of students in schools with different racial compositions: majority minority (defined as 50-100% minority), majority white (defined as 50-100% white), and intensely segregated minority schools (defined as schools with more than 90% minority). In some tables we include calculations of the number and percent of students in “apartheid schools” that is, schools with zero to one percent white students. Demographic Transformation of American Public Schools Since the 2000 Census a great deal has been written about the demographic transformation under way in many American communities as the U.S. moves toward the day when citizens of European background will no longer be the majority, but the changes are much more rapid and dramatic in the school age population. In the 2003-2004 school year the national totals showed Latinos are the largest minority group at 19 percent, followed by l7 percent black students, four percent Asian students and one percent American Indian students (Table 1). All of the minority
Education: Student Experiences in Leading Law Schools.” In Gary Orfield and Michal Kurlaender, eds., Diversity Challenged: Evidence on the Impact of Affirmative Action. Cambridge, MA: Harvard Education Publishing Group. 7 National Poll on Campus Diversity (1998).Conducted by DYG, Inc, survey commissioned by Ford Foundation. 8 Unless otherwise noted, data before l987 is collected by the Office for Civil Rights of the Education Department and from the Race Relations Reporting Service and the U.S. Civil Rights Commission, with high coverage for the South and other areas with significant minority enrollments, and samples that could be used to project state totals for states across the country. The federal government has officially issued desegregation statistics only twice since the early l970s. 9 Due to the lack of enrollment data disaggregated by race for Tennessee in 2003-04, we used data as reported by the Tennessee Department of Education for its 2000-01 school year. 10 For an explanation of the exposure index, see Massy, D.S. and Denton, N.A. (1988). The dimensions of racial segregation. Social Forces, 67:281-315; Orfield, G., Bachmeier, M., James, D., and Eitle, T. (1997). Deepening segregation in American public schools. Cambridge, MA: Harvard Project on School Desegregation.
6
communities are growing much faster than whites, with Latino and Asians increasing most rapidly. The fact that Latinos are the youngest group, have the largest families, and have children at younger ages will result in population growth independent of immigration.11 For African Americans, on the other hand, child bearing is now similar to the white rates, though the population is younger and thus producing relatively larger numbers of children. Latinos, now clearly the largest minority in the schools, have the largest presence in the most rapidly growing regions in the Sunbelt12 and make up 14 percent of students in the Northeast, long the center of immigration from the Caribbean and now drawing Latinos from many regions in spite of its slow growth. Given the upsurge in Latino enrollment and the low white birth rates, the regions of the historic South,13 stretching from Virginia to Texas, and of the West, from the Rocky Mountains to the Pacific, no longer have a majority of whites. The South, the nation’s most populous region, in 2003 had 50 percent white students while the West had 47 percent. While the South has always been home to the majority of U.S. blacks and has by far the highest proportion of black students at 27 percent, it is also a region where Latino enrollment is rising rapidly so that in the 2003-04 school year, one in five of its students is Latino. Even in the South, where the traditional black-white models of U.S. race relations are most deeply rooted, the framework is clearly breaking down. In the West, where blacks have played a large role in raising civil rights issues and movement, there are now five times as many Latino students as black students, who now constitute only seven percent of the enrollment. The West is the great center of Latino enrollment with 36 percent Latino enrollment, and like the South, also foreshadows the increasingly multiracial nature of U.S. education. The other major regions of the country still have very substantial majorities of white public school students—69 percent in the Border states14 stretching from Oklahoma to Delaware, 66 percent in the Northeast, which reaches from Pennsylvania through New England, and 74 percent in the slow growing Midwest, stretching from Ohio to the Rocky mountain states. The Midwest and the Border states, lagging in job creation, have relatively small Latino and Asian numbers though there are growing local concentrations.
11 Hispanics are the only racial or ethnic group with reproduction levels above the natural replacement level, averaging 2.3 children for women 40-44, compared to 1.8 for whites and 1.9 for blacks, with especially high rates for foreign-born Latinas.(Jane Lawler Dye, “Fertility of American Women: June 2004,” U.S. Census Bureau, Current Population Reports, December 2005 pp. 2-3). 12 The Sunbelt includes the southern states plus California, Arizona, Colorado, and Nevada. 13 The South includes the eleven states of the old Confederacy. Our definition of the regions is as follows: South: Alabama, Arkansas, Florida, Georgia, Louisiana, Mississippi, North Carolina, South Carolina, Tennessee, Texas, and Virginia; Border: Delaware, Kentucky, Maryland, Missouri, Oklahoma, and West Virginia; Northeast: Connecticut, Maine, Massachusetts, New Hampshire, New Jersey, New York, Pennsylvania, Rhode Island, and Vermont; Midwest: Illinois, Indiana, Iowa, Kansas, Michigan, Minnesota, Nebraska, North Dakota, Ohio, South Dakota, and Wisconsin; West: Arizona, California, Colorado, Montana, Nevada, New Mexico, Oregon, Utah, Washington, and Wyoming. Note: Hawaii and Alaska, which have very distinctive populations are treated separately and the District of Columbia is treated as a city rather than a state. 14 The Border states are the six states and Washington D.C., which were slave States but stayed within the Union during the Civil War. Both the Southern and Border States maintained state-mandated segregation until after the Brown decision.
7

Viewed in historical perspective, the nation’s schools are going though an astonishing transformation since the l960s, changing from a country where more than four of every five students were white, to one with just 58 percent white enrollment nationwide and changing slightly each year. Within a decade it is likely that there will be fewer than half white students in our public schools, which serve nearly nine in ten U.S. students. This will not be true because of flight to private schools, which serve a much smaller proportion of students than they did in the 1950s and are expected to serve a declining share in the future.15 It is because of a changing population structure created by differential birth rates and age structures and a largely nonwhite international flow of millions of immigrants. Since whites are older, marry at later ages, have smaller families, and account for a small fraction of immigrants, these changes are almost certain to continue. The end of the white majority will lead to a nation of schools without a majority of any one racial group. Table 1 Regular Public School Enrollments by Race/Ethnicity and Region, 2003-04
%White %Black %Latino %Asian %Native American
West 47 7 36 8 2 Border 69 21 4 2 4 Midwest 74 15 7 3 1 South 50 27 20 2 0 Northeast 66 16 14 5 0 Total 58 17 19 4 1 Source: Common Core of Data, 2003-04 Given this transformation of the nation’s public schools, white students are attending schools with more minority students than before. However, of all racial groups, whites remain the most isolated group: the average white student attends schools where more than three quarters (78%) of his or her peers are also white (Table 2). As a result of this isolation, most nonwhite groups experience less exposure to white students than one would expect given the racial composition of the nation’s public schools. The average black student attends a school that is 30 percent white and the average Latino student, 28 percent. Asian and American Indian students attend schools with larger proportions of white students, likely due to the fact that their populations are far smaller and less residentially segregated than either the black and Latino populations.
15 Reardon, S.F., & Yun, J.T. (2002). Private School Racial Enrollments and Segregation. Report for The Civil Rights Project at Harvard University, Cambridge, MA.
8

Table 2 Racial Composition of Schools Attended by the Average Student of Each Race, 2003-04 Racial Composition of School Attended by Average: Percent Race In Each School
White Student
Black Student
Latino Student
Asian Student
American IndianStudent
% White 78 30 28 45 44 % Black 9 53 12 12 7 % Latino 9 13 55 20 11 % Asian 3 3 5 22 3 % American Indian 1 1 1 1 35 Total 100.0 100.0 100.0 100.0 100.0 Source: Common Core of Data, 2003-04 Changing Patterns of Segregation by Region For the first nineteen years following Brown the Supreme Court simply ignored segregation outside the seventeen Southern and Border states and Washington, D.C., those with a history of state-imposed segregation. In the l960s the Lyndon Johnson Administration forced the schools in those states to comply with court decisions and the l964 Civil Rights Act. By far the largest changes took place for black students in the Southern and Border states, so they had the most to lose when the Supreme Court supported ending desegregation orders. When the Court finally extended legal obligations to the North, they were actively opposed by the Richard Nixon and Gerald Ford Administrations and limited within a year by the Supreme Court’s l974 Milliken v. Bradley decision that made city-suburban desegregation almost impossible even though there was extensive proof of official actions producing segregation and no viable solution within largely nonwhite and poor central city school systems.16 Since the Supreme Court authorized a return to segregated neighborhood schools in 1991 (see footnote 20), the percentage of black students attending majority nonwhite schools increased in all regions from 66 percent in 1991 to 73 percent in 2003-4 (Table 3). The most dramatic changes took place in the Southern and Border state regions where the desegregation effort had been concentrated. Over the twelve-year period, the percent of Southern black students in majority non-white schools rose from 61 percent to 71 percent, and the percent of black students in such schools grew from 59 to 69 percent in the Border States. In spite of these changes, in 2003 these two regions remained by a small margin the least segregated for blacks though they had the highest proportion of black students. They are clearly headed backward, however, even faster than other regions.17 Intense segregation for black students increased in all regions: the growth of intense segregation for black students in schools with 0-10 percent whites increased nationally from 34 to 38 percent and was most rapid in the Border states, climbing from 33 to 42 percent in twelve years. In 2003
16 Milliken v. Bradley, 418 U.S. 717 (1974). 17 For a collection of new research on the changes in the South, see John Boger and Gary Orfield, eds., School Resegregation: Must the South Turn Back?, Chapel Hill: University of North Carolina Press, 2005.
9

the South and the West had the lowest proportions of blacks in intensely segregated schools (32% and 30%) while the Northeast and the Midwest had the highest, 51 and 46 percent respectively, reflecting the high residential segregation in these areas—the nation’s worst—and the fragmentation of their metro housing markets into many small school districts. Nationally, the share of black students in intensely segregated schools increased from 34 to 38 percent. The Midwest, home to such cities as Chicago and Detroit, has the largest concentrations of black students in “apartheid” or extremely segregated (99-100%) minority schools at 26 percent, followed closely by 23 percent of black students in the Northeast. In contrast, the two regions with the lowest proportion of black students in such schools were the South (12%), the region with the largest fraction of blacks, and the West (11%), with the lowest percentage of black students. The national share of black students in these apartheid schools decreased slightly from 19 percent to 17 percent, perhaps reflecting trends such as the destruction of traditional subsidized housing and suburban migrations. Except at this extreme, however, the clear pattern is one of growing isolation. Table 3 Changes in Black Segregation, 1991-2003, by Region
%Black in 50-100% %Black in 90-100% %Black in 99-100% Minority Schools Minority Schools Minority Schools
Region 1991-2 2003-4 1991-92 2003-4 1991-92 2003-4 West 70 76 26 30 15 11 Border 59 69 33 42 22 21 Midwest 70 72 40 46 24 26 South 61 71 26 32 12 12 Northeast 76 79 50 51 31 23 Total 66 73 34 38 19 17 Source: Common Core of Data, 1991 and 2003 Latino segregation is higher than black segregation on some measures in the South and West (Table 4). In the West, where Latinos are concentrated, 81 percent of Latinos are in schools with nonwhite majorities, followed by 78 percent in the Northeast and the South. In the West, 39 percent of Latinos attended intensely segregated (90-100%) minority schools (compared to 32 percent for blacks in the South), and 12 percent attended apartheid (99-100%) schools, the same as the black South. These startling figures are even higher in the Northeast where 44 percent were enrolled in intensely segregated schools and 15 percent in apartheid schools. In the South, which includes the substantial Latino enrollment in Texas, 40 percent of the Latino public school enrollment attended intensely segregated minority schools, far higher than the region’s black segregation, and 10 percent attended apartheid schools. Segregation increased for Latinos in all regions except the Northeast, where it remains very high even though there is a slight decline on some measures, perhaps reflecting Latino suburbanization trends. The lowest segregation levels for Latinos were in the Border and Midwest states where the Latino enrollments were very small but segregation was growing in both as secondary migration patterns to these regions emerged.
10

Table 4 Changes in Latino Segregation, 1991-2003, by Region %Latino in 50-100% %Latino in 90-100% %Latino in 99-100% Region minority Schools minority Schools minority Schools 1991-92 2003-4 1991-92 2003-4 1991-92 2003-4 West 73 81 30 39 10 12 Border 37 56 11 16 5 5 Midwest 53 57 21 25 5 5 South 77 78 39 40 8 10 Northeast 78 78 46 44 19 15 Total 73 77 34 39 10 11 Source: Common Core of Data, 1991 and 2003 Since they are small shares of the total enrollments, Asians and American Indians are less likely to be segregated with their own group except in reservation schools and some areas of low income Asian refugee communities. The pattern for American Indian students is complex (Table 5). Although they account for only one percent of the public school population, significant numbers live on largely segregated reservations and attend schools operating for American Indian students by tribal governments.18 Due to the historic removal of American Indian tribes from the Southeastern and most Midwestern states, there are very few American Indian students, significantly less than one percent, in the Northeast and the South and just one percent in the Midwest. Numbers excluding schools of the BIA, show that the West had two percent American Indian students, and the Border states have the highest share, four percent of their enrollment. Although a very small minority, 59 percent of American Indians in the West and 48 percent in the South attend school with less than half whites. About a fifth of those in the Northeast and South and 30 percent of those in the West attend intensely segregated (90-100%) minority schools. About a ninth of American Indians in the Northeast and 14 percent of those in the West attend schools with virtually no white students. Table 5 Changes in American Indian Segregation, 1991-2003, by Region
% American Indian in 50-100%
% American Indian in 90-100%
% American Indian in 99-100%
Region Minority Schools Minority Schools Minority Schools 1991-92 2003-4 1991-92 2003-04 1991-92 2003-04 West 53 59 27 30 7 14 Border 21 35 1 1 0 0 Midwest 28 31 14 16 7 7 South 47 48 22 18 5 1 Northeast 31 37 12 21 6 11 Total 43 52 20 26 7 15 Source: Common Core of Data, 1991 and 2003 At the aggregate level, Asians are the most integrated racial group in American public schools but as their numbers rapidly increase, especially in a few states, they are experiencing less
18 These numbers do not include the American Indians attending schools under the jurisdiction of the Bureau of Indian Affairs.
11

contact with whites (Table 6).19 Asians account for only two to three percent of the enrollment in most regions, except the Northeast and the West where they are five and eight percent of students respectively. In the West, two-thirds (66%) of Asians are in schools with less than half white students, up from 60 percent twelve years earlier. In the Northeast, half of Asians attend such schools. In the South, Midwest, and Border states a substantial majority of Asians attend predominantly white schools, and only five to eight percent are in schools with less than 10 percent white students. In the Northeast and West about a fifth of Asian students attend such intensely segregated schools. In no region are there significant numbers of Asian students in the apartheid schools—even where the numbers are larger, in the Northeast and West, only two percent of Asians experience this degree of extreme isolation. Even when Asians are in predominantly minority schools they are seldom overwhelmingly Asian and, therefore, very unlikely to have the kind of substantial linguistic segregation that significantly affects Latino students. Table 6 Changes in Asian Segregation, 1991-2003, by Region %Asian in 50-100% %Asian in 90-100% %Asian in 99-100% Region Minority Schools Minority Schools Minority Schools 1991-92 2003-4 1991-92 2003-4 1991-92 2003-4 West 60 66 13 20 2 2 Border 25 35 3 6 1 1 Midwest 19 25 2 5 0 1 South 34 44 5 8 0 0 Northeast 42 50 12 17 2 2 Total 53 56 13 15 3 1 Source: Common Core of Data, 1991 and 2003 The Historical Context of Segregation for Black and Latino Students Although there have been continuing increases in segregation for black students since the late l980s and for Latino students since data were first collected in the late 1960s, these trends are not inevitable and they were very different in some regions in the past. When statistics on racial composition of schools were first collected nationally in 1968 there were only about a third as many Latinos in the nation’s school population as there are now, Asians were not a significant population, and whites accounted for more than eighty percent of the nation’s public school students (Figure 1). The rise of nonwhite proportions and the decline in the fraction of white students means that if nothing else had changed there would be fewer whites and substantially more nonwhites in the average school. This is particularly true for Latino students and in the states with the highest growth of nonwhite enrollment, especially the Western and some of the Southern states.
19 Aggregate numbers about Asians often obscure the experiences of Southeast Asian subgroups who are often educationally disadvantaged. The subject of educational opportunities for these groups will be addressed in an upcoming book jointly released by SEARAC and The Civil Rights Project.
12

Figure 1: Percentage of Public School Enrollment by Race/Ethnicity, 1968
1968
5%1%
14%
80%
Hispanics
Whites
Blacks
Asians/N.Amer.
Source: Gary Orfield, Rosemary George, and Amy Orfield, "Racial Change in U.S. School Enrollments, 1968-84," paper presented at National Conference on School Desegregation, University of Chicago, 1986. OCR data for 1968 NCES Common Core of Data. The long-term record, however, shows more than two decades of rising contact between black and white students, particularly in the Southern and Border States and in some states with small black minorities (Figure 2). The rapid growth of integration in the South began with the passage and enforcement of the 1964 Civil Rights Act, which forbade discrimination in all institutions receiving federal funds20 and ended about the time the Supreme Court began to authorize school districts to return to segregated neighborhood schools in 1991.21 By far the most dramatic change took place between 1964 and l970 at the peak of the Civil Rights era, with the Warren Court and the Administration of Lyndon Johnson. During this time, the percent of black students in majority white schools in the South jumped from two percent to 33 percent. Desegregation for black students reached its peak in the late l980s, when 44 percent of black students attended majority white schools, and the South was by a significant margin the least segregated region for black students throughout this period. This was also a period of rising high school graduation rates and of a major decline in the racial achievement gap between whites and blacks. Students were becoming increasingly desegregated despite the growth of the black population relative to whites. Black and white students during this era went to schools that were, on average, significantly less segregated than their neighborhoods. However, after the early 1990s, when the Supreme Court relaxed desegregation standards and allowed a return to neighborhood schools, resegregation occurred and the schools became more segregated.22
20 Gary Orfield, The Reconstruction of Southern Education: The Schools and the 1964 Civil Rights Act, New York: John Wiley, 1969. 21 Board of Education of Oklahoma v. Dowell, 498 U.S. 237(1991). The Court followed with two other orders which further relaxed desegregation standards. Freeman v. Pitts, 503 U.S. 467 (1992) allowed districts to dismantle desegregation plans even though integration had not been achieved. In Missouri v. Jenkins, 115 S. Ct. 2038 (1995), the Supreme Court emphasized local control over desegregation as the primary goal. 22 See Orfield, G. and Lee, C. (2004). Brown at 50: King’s dream or Plessy’s nightmare? Cambridge, MA: The Civil Rights Project at Harvard University.J. Boger and G Orfield, School Resegegation: Must the South Turn Back? Chapel Hill: University of North Carolina Press, 2005.
13

Figure 2: Percent Black in Majority White Schools in the South, 1954-2003
0
5
10
15
20
25
30
35
40
45
50
1954 1960 1964 1967 1968 1970 1972 1976 1980 1986 1988 1991 1994 1996 1998 2000 2001 2003
Year
Perc
ent
Source: Southern Education Reporting Service in Reed Sarratt, The Ordeal of Desegregation (New York: Harper & Row, 1966); HEW Press Release, May 27, 1968; OCR data tapes; 1992-3, 1994-5, 1996-7, 1998-9, 2000-01, 2001-02, 2003-04 NCES Common Core of Data. The story was very different for Latinos. The right of Latino students to desegregation was not established by the Supreme Court until 1973 in the Keyes (Denver) case and it was never seriously enforced except in a few locations.23 As the number of Latinos soared and residential segregation increased, the schools in many areas became vastly more segregated and there was no significant initiative to address it. The Office for Civil Rights had been denied enforcement powers by President Nixon. The basic problem targeted by most Latino rights advocates was language, not segregation, and the basic fight was for bilingual education, a movement that enjoyed considerable success in the l970s, met mounting resistance in the l980s and sharp reversals in the l990s.24 Segregation steadily increased and by some measures and in some regions became substantially higher than black segregation. Many desegregation plans were designed only to desegregate black students, since they were designed before the right of Latinos to desegregation remedies was even established by the Supreme Court and often with no civil rights lawyers representing Latino interests. As Latinos become ever more segregated in inferior schools with extremely low graduation rates and test scores, with many found to be failing under No Child Left Behind Act,25 federal courts have ended desegregation in their communities and
23 Keyes v. Denver School District No. I, 413 U.S. 189 (1973) 24 See note supra; for a description of the failure of the federal civil rights officials to enforce Keyes see: G. Orfield, Must We Bus? Segregated Schools and National Policy, Washington: Brookings Inst., 1978. 25 Orfield, G., Losen, D., Wald, J., and Swanson, C. (2004). Losing 0ur future: How minority youth are being left behind by the graduation rate crisis. Cambridge, MA: The Civil Rights Project at Harvard University. Contributors: Urban Institute, Advocates for Children of New York, and The Civil Society Institute.
14

issued rulings which extinguished the rights of Latinos children without ever considering the issue of Latino segregation. Multiracial Schools and the Need for a New Paradigm Growing segregation of black and Latino students from white students is a basic educational trend. But there is another large and more encouraging development—the emergence of multiracial schools on a large scale. 26 Over the past half century there has been a good deal of energy devoted to creating and studying biracial schools, particularly those with black and white students. A good deal has been learned about the policies that produce segregation, desegregation, integration and resegregation, about the typical impact of such policies on educational outcomes and life chances of students, and about practices that make interracial schools more or less successful on various dimensions.27 But we now see the emergence of thousands of schools that are not biracial but multiracial, often multiracial with two or more historically excluded “minority” groups and relatively few white students. Others may be multiracial, for example, with relatively advantaged groups of whites and Asians and a smaller black or Latino group. Across the U.S. some 8.6 million students are attending multiracial schools of a sort never thought of when the school desegregation struggle was framed as one of ending the exclusion of a black minority from the much better white schools (Table 7). Whites are by far the students least likely to attend such schools—only about an eighth (12 percent) of whites do. Asian students are by far the most likely to be in such schools; 42 percent attend these multiracial institutions. Twenty-seven percent of Latinos, 23 percent of African Americans and 20 percent of American Indian students are in multiracial schools. Whites in the West and South, where almost a fifth are in multiracial schools are much more likely than whites in the Midwest (5%) and Border states (6%) to experience this cultural diversity. For whites, blacks, and Asians the multiracial experience reaches its highest level in the West. An extraordinary 52 percent of Western blacks and 51 percent of Western Asians attend these diverse schools. For Latinos, however, the multiracial experience is lower in the West (24%) than in all other regions and substantially higher in the Northeast (37 percent). The Northeast also has schools that are second only to the West in the exposure of black and Asian students to multiracial schools. The concentration of such schools in the West and Northeast is likely due in part to the concentration of Asian immigration in these areas as well as the extensive contact between black and Latino students in these areas.
26 Multiracial schools are schools in which at least a tenth of the students are from each of at least three of the five major racial and ethnic groups. 27 See note infra.
15

Table 7 Percentage of Students in Multiracial Schools by Race, 2003-04
Region %White %Black %Latino %Asian%American
Indian West 19 52 24 51 23 Border 6 12 40 32 15 Midwest 5 15 25 27 9 South 18 20 28 44 28 Northeast 10 29 37 45 19 Total 12 23 27 42 20 An important reality about multiracial schools is that the basic multiracial contact may be between two or three minority groups and that they may still be highly segregated from whites. Very little systematic research has been done on the dynamics and effects of multiracial schools in terms of possible benefits or best ways to operate schools where there are substantial numbers of students from two or more disadvantaged groups attending the same school. Since many of the traditional benefits of desegregation result from moving students from high poverty to middle class schools with richer opportunities and networks, it is important to consider likely effects of combining two or more impoverished groups in the same multiracial school. There are large numbers of both blacks and Latinos in such schools in important immigration destinations where there are few whites left in the schools and these groups are inheriting the city. In the West, for example, blacks who are isolated from whites in minority schools are actually, on average, in schools with more Latinos than fellow African Americans. Changing Patterns of Segregation by State Distribution of Students in Segregated Schools The highest levels of black segregation were found in New York, Illinois, California, and Michigan. In these states, the average black student attended schools with less than one quarter white students in 2003-03 (Table 8). The only state where black segregation did not increase in the last decade, Michigan, was already highly segregated in 1970 and showed no change since then. This was the state where most blacks remained segregated as a direct result of the Supreme Court’s decision to overturn the decisions of the lower federal courts which had ordered city-suburban desegregation in metropolitan Detroit, concluding that it was the only feasible remedy for the local and state violations of black students’ rights. Black students in Nevada experienced the largest decline in exposure to white students after experiencing a period of major desegregation progress from 1970-1980. The difference in segregation levels was even greater for black students in Delaware, which ended its Wilmington desegregation court order in 1995.28 The share of white students in the school of the average black student in Delaware dropped from 69 percent in 1980 to 49 percent in 2003, to almost its 1970 level of 47 percent. It is worth noting that other states which showed large drops in desegregation from 1991 to 2003 are several
28 Under the desegregation plan which took effect in 1980, the Wilmington city district was merged with 12 suburban districts. Until it was dissolved, the state had almost no black students in intensely segregated (90-100% minority) schools.
16

Southern and Border states such as North Carolina, Arkansas, Oklahoma, and Florida where long-standing school desegregation orders were terminated during the 1990s. Despite these resegregation trends, black students in the South and Border states have amongst the highest levels of exposure to white students. In Kentucky, the average black student attends a school that is almost two-thirds white and in Delaware, 49 percent of the student body in the school of the average black student is white. Louisville, like Wilmington in Delaware, implemented a metropolitan wide desegregation plan which consolidated the city and county school system to create substantial desegregation. These trends suggest that regardless of recent resegregation, desegregation efforts of the past forty years continue to have an impact today.
17

Table 8: Changes in the Percentage of White Students in Schools Attended by the Average Black Student by State, 1970-2003 29
*These numbers are from 1993-4 school year.
% White % White Students in School of Average Black
Change
2003 1970 1980 1991 2003 1970-80 1980-1991
1991-2003
Alabama 60 33 38 35 30 5 -3 -5 Arkansas 70 43 47 44 36 4 -3 -8 California 33 26 28 27 22 2 -1 -5 Connecticut 68 44 40 35 32 -4 -5 -3 Delaware 57 47 69 65 49 22 -4 -16 Florida 51 43 51 43 34 8 -8 -9 Georgia* 52 35 38 35 30 3 -3 -5 Illinois 57 15 19 20 19 4 1 -1 Indiana 82 32 39 47 41 7 8 -6 Kansas 76 52 59 58 51 7 -1 -7 Kentucky 87 49 74 72 65 25 -2 -7 Louisiana 48 31 33 32 27 2 -1 -5 Maryland 50 30 35 29 23 5 -6 -6 Massachusetts 75 48 50 45 38 2 -5 -7 Michigan 73 22 23 22 22 1 -1 0 Mississippi 47 30 29 30 26 -1 1 -4 Missouri 78 21 34 40 33 13 6 -7 Nebraska 80 33 66 62 49 33 -4 -13 New Jersey 58 32 26 26 25 -6 0 -1 New York 54 29 23 20 18 -6 -3 -2 Nevada 51 56 68 62 38 12 -6 -24 North Carolina 58 49 54 51 40 5 -3 -11 Ohio 79 28 43 41 32 15 -2 -9 Oklahoma 61 42 58 51 42 16 -7 -9 Pennsylvania 76 28 29 31 30 1 2 -1 South Carolina 54 41 43 42 39 2 -1 -3 Tennessee** 73 29 38 36 32 9 -2 -4 Texas 39 31 35 35 27 4 0 -8 Virginia* 61 42 47 46 41 5 -1 -5 Wisconsin 79 26 45 39 29 19 -6 -10 Source: US Department of Education Data
**These numbers are from 2000-2001 school year. From a historical perspective the increase in Latino segregation since systematic data was first collected is truly shocking (Figure 3). Back in l970, there was little severe segregation in most
18
29 This table includes states that had more than five percent black enrollment in 1970 and 1980.

states and Latinos were far more integrated than blacks. Only in New York, New Jersey, Texas and New Mexico was the average Latino student in a school with less than 40 percent white classmates, and even in the most segregated states in the Southwest about a third of the students were white. In California, which had historically been less segregated than Texas, the other great center of Latino settlement, the typical Latino was in a 54 percent white school, a school that would be considered almost ideally integrated. In Arizona there were an average of 47 percent white classmates and in Nevada 84 percent. The l970s brought the first and only Supreme Court decision on the desegregation rights of Latinos in the Keyes decision of l973.30 There was no significant enforcement of the decision, however, and by l980 there were sharp increases in segregation in California, Connecticut, Florida and Illinois. The only states with a significant Latino enrollment that showed any decline in segregation during the 1970s was Colorado, the site of the Denver desegregation plan. During the l980s as the Reagan Administration pressed for termination of desegregation plans and huge increases in Latino student bodies took place, Latino segregation increased in every state with a significant enrollment except Arizona, which was implementing desegregation in Tucson and part of Phoenix.31 The sharpest increases in segregation came in California and Nevada, though even after this Nevada Latinos, on average attended schools with almost two-thirds whites. The story in California was very different. By l991, the amount of contact with whites had fallen by a half from that of l970 and the typical Latino student was in a 73 percent non-white school. During the 12 years from l991-2003, the most dramatic upsurge of segregation occurred in Nevada, likely due to the dismantling of metro Las Vegas’ desegregation plan amid massive growth of the district, which enrolled 70 percent of the state's students. Between l980 and 2003, the level of contact with whites fall by half, and in 2003 the typical Nevada Latino was in a 63 percent nonwhite school. Other major backward movements took place in Arizona, Colorado and California. Texas, which never showed any increase in desegregation during the civil rights era, took a significant step backwards as well. During this entire period there never was any significant change in New York, which was consistently the most segregated state for Latinos, with students attending schools that were about four-fifths non-white on average. The biggest change came in California, which tied New York for the highest segregation level for Latinos. California, home to about a third of the nation's Latino students had led the race backwards, with massive consequences. Texas, with the second largest enrollment had never desegregated and slowly declined over the 33 year period, reaching nearly the same level of isolation as the two most segregated states. 30 See supra note. 31 Orfield, G., Monfort, F. and Aaron, M. (1988). Racial Change and Desegregation in Large School Districts—Trends Through 1986-87 School Year. Washington, DC: NSBA Council of Urban Boards of Education.
19

Figure 3:
Changes in the Percentage of White Students in Schools Attended by the Average Latino Student by State, 1970-2000
0102030405060708090
Arizon
a
Califor
nia
Conne
cticu
t
Colorad
o
Florida
Illino
is
New Je
rsey
New Y
ork
Nevad
a
New M
exico
Texas
Wyo
ming
State
Perc
ent 1970
198019912003
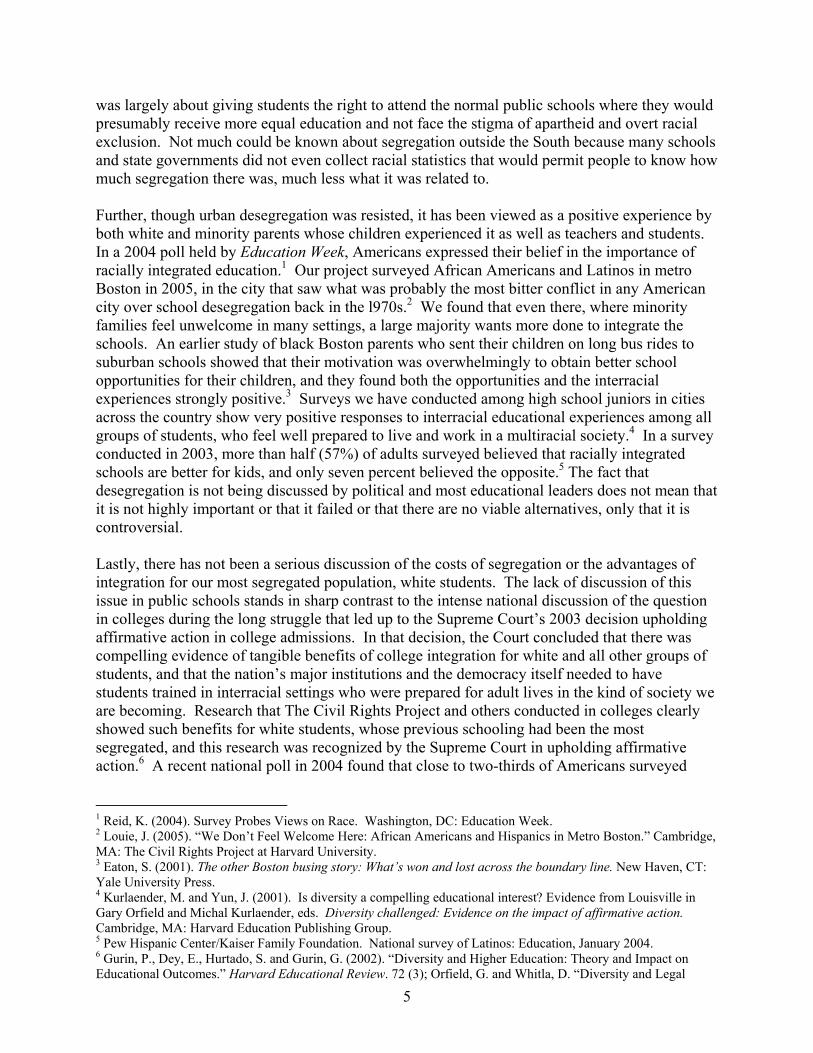
Distribution of Students in Multiracial Schools by State At the state level, whites are most likely to attend multiracial schools in Nevada (43%), California (34%), Texas (31%), and Florida (30%), but in most states the level is much lower, including 21 states where it is three percent or less (Table 9). Blacks are most likely to be in multiracial schools in Nevada (74%), Rhode Island (61%), California (55%), Colorado (54%), and Washington (52%). When we look at the percent of the total enrollment of all races in a state attending multiracial schools we find 52 percent of Nevada students in such schools, 34 percent of all students in California and Florida, and 30 percent of those in Texas. More than a third of states, on the other hand, had five percent or less of their students in such schools. The effect of such schooling experience on preparing students to live and work effectively in the far more multiracial society of the future deserves study and the development of policies to take advantage of the cultural and linguistic diversity and avoid racial polarization and in-school segregation. Asian students are most likely to attend multiracial schools because they live in the least segregated neighborhoods, they are a relatively small but significant group, and they are concentrated in some of the most multiracial states. Over half of the Asian students in the following states attend multiracial schools: Alaska (67%), California (55%), Nevada (69%), New York (56%) and Texas (55%). Asian students in the Northeast and Midwest tend to be in multiracial predominantly white schools. In the West they tend to be in schools with a substantial share of Latino students, and only in the Southern and Border States do they attend schools with a substantial share of black students. Asian students in Arizona and Texas, for example, are in schools with an average of 27 percent Latino students, and in New Mexico the number is 40 percent. Asian students in Louisiana attend schools with an average of 46 percent black students, in Mississippi and South Carolina, 34 percent, and in North Carolina, 31 percent. In other states Asians are often in schools with less than the state average of black or Latino students. Other research by The Civil Rights Project on metropolitan Boston and forthcoming work on Asian subgroups suggest that the students most likely to be found in the heavily
20

minority disadvantaged schools are from the relatively poor and poorly educated refugee communities from Vietnam.32 As the nation’s most integrated group of students and residents of rapidly changing states very heavily influenced by international immigration flows, Asians are a community of particular interest for thinking about school desegregation policy and about the future role and attitudes of a very successful group that is experiencing both higher educational levels than whites and much more contact with nonwhite students in their education and socialization. Table 9 Percent of Students in Multiracial Schools by Race, 2003-04
%White
in %Black in %Latino in %Asian in %American Indian in
State Multiracial School
Multiracial School
Multiracial School
Multiracial School
Multiracial School
Alaska 25 64 54 67 23 Alabama 2 2 13 5 12 Arkansas 2 5 14 14 9 Arizona 11 27 14 17 21 California 34 55 26 55 39 Colorado 11 54 16 26 29 Connecticut 15 49 52 30 27 Dist. of Columbia 45 4 20 44 27 Delaware 16 22 47 21 14 Florida 30 35 41 43 42 Georgia 11 12 44 40 12 Hawaii 16 38 15 4 14 Iowa 3 17 19 16 26 Idaho 1 0 2 1 10 Illinois 10 16 24 35 24 Indiana 3 17 26 9 9 Kansas 7 31 25 25 22 Kentucky 1 5 17 7 3 Louisiana 3 3 24 17 24 Massachusetts 10 48 40 40 22 Maryland 12 13 49 43 16 Maine 0 8 4 5 1 Michigan 4 9 27 16 6 Minnesota 6 42 31 45 13
32 These findings will be documented in an upcoming publication jointly released by Southeast Asian Action Resource Center (SEARAC) and The Civil Rights Project.
21
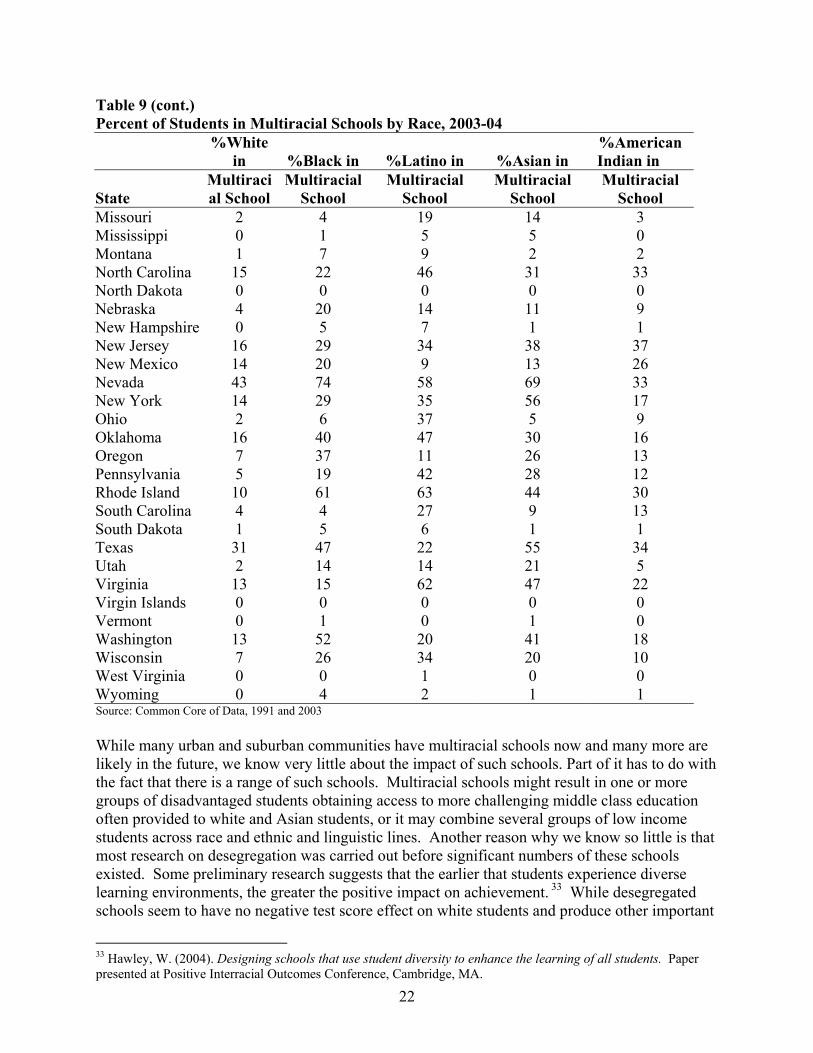
Table 9 (cont.) Percent of Students in Multiracial Schools by Race, 2003-04
%White
in %Black in %Latino in %Asian in %American Indian in
State Multiracial School
Multiracial School
Multiracial School
Multiracial School
Multiracial School
Missouri 2 4 19 14 3 Mississippi 0 1 5 5 0 Montana 1 7 9 2 2 North Carolina 15 22 46 31 33 North Dakota 0 0 0 0 0 Nebraska 4 20 14 11 9 New Hampshire 0 5 7 1 1 New Jersey 16 29 34 38 37 New Mexico 14 20 9 13 26 Nevada 43 74 58 69 33 New York 14 29 35 56 17 Ohio 2 6 37 5 9 Oklahoma 16 40 47 30 16 Oregon 7 37 11 26 13 Pennsylvania 5 19 42 28 12 Rhode Island 10 61 63 44 30 South Carolina 4 4 27 9 13 South Dakota 1 5 6 1 1 Texas 31 47 22 55 34 Utah 2 14 14 21 5 Virginia 13 15 62 47 22 Virgin Islands 0 0 0 0 0 Vermont 0 1 0 1 0 Washington 13 52 20 41 18 Wisconsin 7 26 34 20 10 West Virginia 0 0 1 0 0 Wyoming 0 4 2 1 1 Source: Common Core of Data, 1991 and 2003 While many urban and suburban communities have multiracial schools now and many more are likely in the future, we know very little about the impact of such schools. Part of it has to do with the fact that there is a range of such schools. Multiracial schools might result in one or more groups of disadvantaged students obtaining access to more challenging middle class education often provided to white and Asian students, or it may combine several groups of low income students across race and ethnic and linguistic lines. Another reason why we know so little is that most research on desegregation was carried out before significant numbers of these schools existed. Some preliminary research suggests that the earlier that students experience diverse learning environments, the greater the positive impact on achievement. 33 While desegregated schools seem to have no negative test score effect on white students and produce other important
33 Hawley, W. (2004). Designing schools that use student diversity to enhance the learning of all students. Paper presented at Positive Interracial Outcomes Conference, Cambridge, MA.
22

gains for them, black and Latino students generally learn more and graduate at higher levels in majority white schools than in segregated schools. More research is needed on the complexity of creating opportunity for one group of historically excluded and disadvantaged students given the presence of other groups with a different set of educational problems. Further research about tracking within schools, curriculum and teacher diversity, effect of such schools on residential segregation must be conducted. If they are managed well, these schools have the potential to offer a kind of cultural richness rarely experienced by today’s adults in their childhood schools. As the public school enrollment grows increasingly diverse, getting answers to some of these questions will be increasingly urgent.34 The California, Nevada, and Texas Stories By the early 21st century the most rapid population growth in the U.S. was occurring in the desert Southwest, where the U.S. Census predicted that growth would continue until at least 2030. The Southwest is now at the very moment of transition from a majority of white students to a complex majority of nonwhite students in which Latinos are by far the largest group. Less than 40 percent of the students are white in California and Texas, and whites comprise slightly more than half (51%) in Nevada (Table 10). Furthermore, the largest minority group in each of these states is Latino, comprising at least 30 percent of the public school enrollment. In short, these three states—California, Nevada, and Texas--exemplify the segregation trends, the development of multiracialism, the end of the black-white paradigm, and the relationship between black and Latino students. California and Texas are the nation’s two largest states, both are growing rapidly, and they are home to more than half of all Latinos as well as the largest Asian population and large black communities. Nevada is the nation’s most rapidly growing state and has been so for almost two decades. Its largest school district, Clark County (metro Las Vegas), is the nation’s sixth largest district and is growing explosively. Looking at these three states we can get a sense of the dynamic of racial change and multiracialism in the parts of the country which will become steadily more important in determining the nation’s future. Table 10 Racial Composition of California, Nevada, and Texas, 2003-04 State Enrollment %White %Black %Latino %Asian %American Indian California 6,212,692 33 8 47 11 1 Nevada 385,401 51 11 30 7 2 Texas 4,329,841 39 14 44 3 0 Source: Common Core of Data, 1991 and 2003 Brief Overview and History of Each State California is, of course, the nation’s largest state, with 33,872,000 residents according to the 2000 Census. 35 The Census Bureau’s 2005 projections predict that the state will grow by 12,573,000 by 2030 to a total of 46,449,000, accounting for almost a sixth of the nation’s growth (15.3 percent) during those three decades, substantially more than the total growth of the 34 The Civil Rights Project held a research roundtable on these issues at the Harvard Law School and will be publishing the papers in a new book. 35 35U.S. Bureau of the Census, “Interim State Population Projections, 2005,” April 21, 2005.
23
eighteen states of the Northeast and the Midwest. Both the immensity of the state, and the fact that it has been in the epicenter of the wave of immigration that is remaking the nation, mean that the trends in California are of great national importance. California back in the civil rights era was far less segregated and far more progressive than the South on matters of school segregation. For Latinos, it was far less segregated than Texas.36 There had been pioneering decisions, before the Supreme Court’s Brown decision, holding that imposed segregation of Mexican Americans was illegal.37 The California Supreme Court had held that under the State’s constitution, segregation was illegal regardless of whether or not it was the result of intentional public action, creating a right that was far more expansive than the federal right. A U.S. Supreme Court decision on a case from San Francisco established the requirement that schools must provide appropriate education for non-English speaking students.38 Some communities, including Berkeley, were national pioneers in desegregating their schools without court orders.39 A huge lawsuit was in progress to desegregate the nation’s second largest school system, Los Angeles. The state department of education had an Intergroup Relations office working on desegregation issues with districts. After a proposal for metropolitan desegregation for greater Los Angeles was submitted to a trial court in 1978, the voters of California passed a constitutional amendment, Proposition 1, which eliminated the existing right to such an approach under the state constitution. In both Texas and Arizona, the Administration of President Jimmy Carter sued for metropolitan desegregation of the largest cities, but the Reagan Administration dropped the cases. Nevada is and has been the nation’s most rapidly growing state. This has been true for almost two decades and is projected to be true for the period to 2030 40. Given its large Latino immigration, Nevada is projected to grow faster than any other state.41 It is also a state that had the only large city-suburban desegregation plan in the West, covering the Las Vegas metropolitan area, which is served by one of the nation’s largest and most rapidly growing school systems—Clark County. Under that plan, which lasted from 197242 until it was terminated by a federal court in 199343, Nevada became the second most integrated state in the nation for Latino students and the fourth most integrated state for black students by 1991, the year the Supreme Court authorized termination of desegregation orders.44 Although there were many districts in the Southern and Border states that had county-wide school districts incorporating much or all of a metropolitan area, there were none in the Northeast or Midwest and very few in the West. If full and lasting desegregation of the metropolitan areas where more than 80 percent of Americans live was impossible without crossing the line between central city and suburbs, Nevada was the only state in the region where the dominant metropolitan area 36 L. Grebler, J. Moore, and R. Guzman, The Mexican American People, New York: Free Press: 1970. 37 Westminster School District of Orange County v. Mendez, 161 F.2d 774 (9th Cir., 1947) 38 Lau v. Nichols, 414 US 563 (1974). 39 Neil V. Sullivan, Now is the Time: Integration in the Berkeley Schools, Bloomington: University of Indiana Press, 1970. 40 U.S. Bureau of the Census, “Nevada Edges Out Arizona as the Fastest Growing State,” New Release, December 22, 2005. 41 U.S. Bureau of the Census, “Interim State Population Projections, 2005,” April 21, 2005. 42 Kelly v. Guinn, 456 F.2d 100 (9th Cir. 1972), cert. denied, 413 U.S. 919. 43 Lisa Kim Bach, “Desegregation 50 Years Later: Then and Now,” Las Vegas Review Journal, May 16, 2004; L. Steven Demaree, Donna M. Mendoza-Mitchell and Africa A. Sanchez, “Equality by Law: Brown v. Board of Education 50 Years Later,” Communique, Clark County Bar Association, vol. 25, no. 2 February 2004. 44 Orfield and Lee, Brown at 50, table 15, table 17.
24
experienced relatively comprehensive desegregation.45 The metropolitan Las Vegas district, which had the great majority of black and Latino students in the state, is an example both of what might have been and what the impact of dissolving court orders may be. Texas has the nation’s second largest Latino population and historically large concentrations of African Americans, particularly in East Texas and the largest cities. Texas was part of the Confederacy, had the full set of apartheid policies that the rest of the South adopted after Reconstruction, and was the site of many of the most important legal struggles of the civil rights era, including the key higher education case, Sweatt v. Painter, that set the stage for the Brown decision.46 But, unlike the rest of the South, Texas also had a very important Latino population, dating back to the era when Texas declared independence from Mexico. South Texas has long been an overwhelmingly Mexican American community with very strong relationships across the border. Texas historically engaged in many forms of segregation and discrimination against Latino students and was the site of an active movement against segregation led by civil rights groups, including the American G.I. Forum and League of United Latin American Citizens (LULAC).47 During the civil rights era, Texas had far higher levels of segregation of Latinos than California. There were desegregation orders or plans negotiated with the Office for Civil Rights in many Texas districts and a sweeping order, U.S. v. Texas, that covered many smaller districts. There was a major lawsuit filed in Texas’ largest city, Houston, by the Carter Administration. Houston is famous as a city which vastly expanded its boundaries as the suburbs grew, becoming one of the nation’s largest cities. The Carter Justice Department believed that the fact that the Houston Independent School District stopped expanding its boundaries the same year the Supreme Court declared segregation illegal even as the city grew, produced segregation and was a constitutional violation, but that case was quickly dropped by the Reagan Administration, and Houston remained highly segregated. Latino civil rights groups in Texas gave bilingualism and financial equalization higher priority than desegregation following the Keyes and Lau decisions. By the late l990s, many of the major plans in Texas were dissolved, including Austin, Dallas and Ft. Worth.
Segregation Trends in California, Nevada, and Texas California had become one of the top five most segregated states by 2003-04 for black students by two different measures even though the state had only 7% black students: 87% of the black students attend majority minority schools, and the typical black student attended a school with 22 percent white students (Table 11). While the state has among the highest share of black students in majority minority schools and lowest black exposure to white, it is worthy to note that compared to some Northeastern and Midwestern states such as New York, Illinois, and Michigan, California has a relatively lower percentage of black students (38%) in intensely segregated minority schools. Overall, the record shows that California, which had limited desegregation orders covering a small part of the state’s students and a state policy fostering voluntary desegregation plans until the l980s, never achieved a high level of desegregation for its relatively small proportion of black students. By the late l990s the major plans in San Diego, San Francisco, San Jose, and elsewhere had either ended or were being phased out.
46 Sweatt v. Painter. 339 US 629 (1950). 47 Guadalupe San Martin, “Let All of them Take Heed”: Mexican Americans and the Campaign for Educational Equity in Texas: 1910-198l, Austin: University of Texas Press, 1987.
25

Since the Clark County, NV, school district covers nearly 8,000 square miles and contains more than 70 percent of the state’s students, the desegregation case had a massive impact on Nevada’s racial pattern. After the desegregation order was dismantled in 1993, the share of black students in majority minority schools has increased.48 In the 2003-04 school year, more than two-thirds (69%) of black students in Nevada attended majority minority schools, and the average black student attends a school that is over a third (38%) white--a very dramatic change. More than three quarters of black students in Texas attend majority minority schools, and more than a third (38%) attend intensely segregated minority schools. The average black student in Texas attends a school that is a little more a quarter white (27%). Table 11 Most Segregated States for Black Students, 2003-04 %Black in %Black in Black Exposure to
Rank Majority Minority Schools 90-100% Minority Schools White 1 California 87 New York 61 New York 182 New York 86 Illinois 60 Illinois 193 Illinois 82 Michigan 60 Michigan 224 Maryland 81 Maryland 53 California 225 Michigan 79 New Jersey 49 Maryland 236 Texas 78 Pennsylvania 47 New Jersey 257 New Jersey 77 Alabama 46 Mississippi 268 Louisiana 77 Wisconsin 45 Louisiana 279 Mississippi 76 Mississippi 45 Texas 2710 Georgia 73 Louisiana 41 Wisconsin 2911 Wisconsin 72 Missouri 41 Pennsylvania 3012 Connecticut 72 Ohio 38 Georgia 3013 Pennsylvania 72 California 38 Alabama 3014 Ohio 71 Texas 38 Hawaii 3215 Alabama 70 Georgia 37 Ohio 3216 Arkansas 69 Florida 32 Connecticut 3217 Nevada 69 Connecticut 31 Missouri 3318 Massachusetts 67 Massachusetts 26 Florida 3419 Florida 67 Indiana 23 Arkansas 3620 Missouri 67 Arkansas 23 Nevada 38
Source: Common Core of Data, 1991 and 2003 California is now a national leader in isolation for both blacks and Latinos. California was one of the top three segregated states for Latino students on three measures of segregation. Close to 90 percent of Latino students in California attend majority minority schools, and almost half (47%) attend intensely segregated (90-100%) minority schools (Table 12). The average Latino student in California attends a school that is 19 percent white. Latinos had moved from schools that had, on average, high levels of integration in l970 to schools that were among the nation’s most segregated by the 1990s. This is probably a result of the facts that the numbers of Latinos 48 See Orfield and Lee, (2005), Table 15 pg. 30.
26

soared, segregated Latino residential areas expanded greatly, and most of the limited number of desegregation orders were dissolved by the late 1990s. Texas has experienced huge growth of Latino population since the 1960s and is destined to become a majority Latino state. Given the combination of little effort to integrate Latinos, dissolution of some of the plans that accomplished the most, such as Austin’s, and the huge population growth, it is not surprising that there has been increasing segregation of Latino students. Texas is one of the five most segregated states for Latino students on all three measures: more than four-fifths (85%) of Latino students attend majority minority schools, and half attend intensely segregated (90-100%) minority schools. The average Latino student in Texas attends a school that is 21 percent white. While still high and very rapidly increasing, the segregation levels for Latino students in Nevada are less intense than for their peers in California and Texas. The average Latino student in Nevada attends a school that is 37 percent white, and about 11 percent attend intensely segregated (90-100%) minority schools. This is likely due to the lingering effects of the desegregation order that was dismantled in 1993.
27

Table 12 Most Segregated States for Latino Students, 2003-04 % Latino in Majority % Latino in 90-100% Latino/White
Rank Minority Schools Minority Schools Exposure 1 California 89 New York 58 New York 192 New York 86 Texas 50 California 193 New Mexico 85 California 47 Texas 214 Texas 85 Illinois 41 New Mexico 265 Rhode Island 79 New Jersey 40 New Jersey 286 New Jersey 75 Arizona 31 Illinois 287 Maryland 75 Rhode Island 30 Rhode Island 298 Illinois 75 Florida 29 Arizona 309 Arizona 75 New Mexico 28 Florida 3210 Florida 72 Maryland 27 Maryland 3311 Nevada 72 Pennsylvania 27 Connecticut 3512 Connecticut 70 Connecticut 26 Nevada 3713 Massachusetts 65 Massachusetts 19 Massachusetts 3914 Pennsylvania 63 Colorado 18 Pennsylvania 4015 Colorado 59 Wisconsin 16 Georgia 4316 Virginia 58 Georgian 16 Colorado 4317 Georgia 57 Nevada 11 Virginia 4718 Delaware 56 Michigan 11 Delaware 4819 Louisiana 56 Indiana 9 Louisiana 4820 Kansas 52 Mississippi 9 North Carolina 49
Source: Common Core of Data, 1991 and 2003 The desegregation issue is often posed as a choice between integration and cultural solidarity in schools dominated by one’s own culture. Because of the massive influx of Latino immigrants into areas where blacks live, black students, however, often end up as a small minority in resegregated neighborhood schools dominated by another disadvantaged group with a quite different culture and, often, language. In each of these three states this kind of pattern is common. In a state that now has no racial majority and is heading toward a Latino majority in schools if the current trends continue, California has a very interesting pattern of race relations among “minority” groups (Table 13). Black students are highly segregated from whites in very high minority schools, but they are typically a relatively small minority of the minority students in those schools, greatly outnumbered, on average, by Latino students (Table). In California, black exposure to Latinos (43%) is almost twice that of the average black student’s exposure to whites (22%) or to fellow blacks (23%). During the 1991 to 2003 period there has been a substantial drop in the already low percentage of whites in the school of the typical black student in Texas, but Texas black students now attend school, on average, with substantially larger numbers of Latinos. In 2003, the typical black student was in a school with larger shares of Latino students (31%) than with white students (27%). In cities and school districts very little attention has been paid to the issues of successful integration and educational provision of such schools. Race relations research and studies of
28
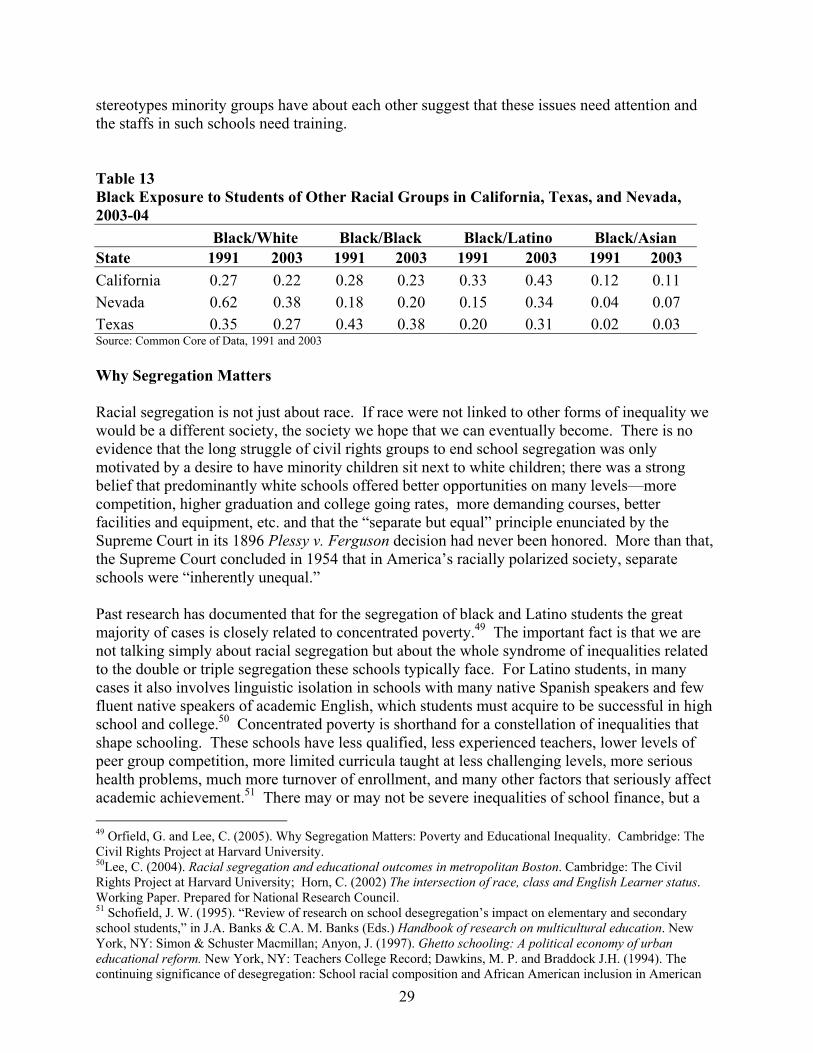
stereotypes minority groups have about each other suggest that these issues need attention and the staffs in such schools need training. Table 13 Black Exposure to Students of Other Racial Groups in California, Texas, and Nevada, 2003-04 Black/White Black/Black Black/Latino Black/Asian State 1991 2003 1991 2003 1991 2003 1991 2003 California 0.27 0.22 0.28 0.23 0.33 0.43 0.12 0.11 Nevada 0.62 0.38 0.18 0.20 0.15 0.34 0.04 0.07 Texas 0.35 0.27 0.43 0.38 0.20 0.31 0.02 0.03 Source: Common Core of Data, 1991 and 2003 Why Segregation Matters Racial segregation is not just about race. If race were not linked to other forms of inequality we would be a different society, the society we hope that we can eventually become. There is no evidence that the long struggle of civil rights groups to end school segregation was only motivated by a desire to have minority children sit next to white children; there was a strong belief that predominantly white schools offered better opportunities on many levels—more competition, higher graduation and college going rates, more demanding courses, better facilities and equipment, etc. and that the “separate but equal” principle enunciated by the Supreme Court in its 1896 Plessy v. Ferguson decision had never been honored. More than that, the Supreme Court concluded in 1954 that in America’s racially polarized society, separate schools were “inherently unequal.” Past research has documented that for the segregation of black and Latino students the great majority of cases is closely related to concentrated poverty.49 The important fact is that we are not talking simply about racial segregation but about the whole syndrome of inequalities related to the double or triple segregation these schools typically face. For Latino students, in many cases it also involves linguistic isolation in schools with many native Spanish speakers and few fluent native speakers of academic English, which students must acquire to be successful in high school and college.50 Concentrated poverty is shorthand for a constellation of inequalities that shape schooling. These schools have less qualified, less experienced teachers, lower levels of peer group competition, more limited curricula taught at less challenging levels, more serious health problems, much more turnover of enrollment, and many other factors that seriously affect academic achievement.51 There may or may not be severe inequalities of school finance, but a 49 Orfield, G. and Lee, C. (2005). Why Segregation Matters: Poverty and Educational Inequality. Cambridge: The Civil Rights Project at Harvard University. 50Lee, C. (2004). Racial segregation and educational outcomes in metropolitan Boston. Cambridge: The Civil Rights Project at Harvard University; Horn, C. (2002) The intersection of race, class and English Learner status. Working Paper. Prepared for National Research Council. 51 Schofield, J. W. (1995). “Review of research on school desegregation’s impact on elementary and secondary school students,” in J.A. Banks & C.A. M. Banks (Eds.) Handbook of research on multicultural education. New York, NY: Simon & Schuster Macmillan; Anyon, J. (1997). Ghetto schooling: A political economy of urban educational reform. New York, NY: Teachers College Record; Dawkins, M. P. and Braddock J.H. (1994). The continuing significance of desegregation: School racial composition and African American inclusion in American
29

very basic problem in any case is all the added instructional costs and burdens that are concentrated in these segregated high poverty schools—language training, some forms of special education, constant training and supervision of new teachers because teachers leave much more rapidly, remedial education, social work and counseling for kids from severely troubled families, health emergencies, frequent moves and school transfer in mid-year, and many others.52 This means that equal dollars cannot produce equal opportunities. This syndrome of inequalities is so profound that there is a very striking relationship between a school’s poverty level and its test scores, independent of any other factors.53 Reformers for the past 40 years have consistently noted and celebrated the exceptions to this pattern, partly because they are so rare, but they have never figured out how to “scale up” those patterns of leadership and extraordinary dedication found in many of those schools or even, in many cases, how to maintain that success in specific schools after their great leader leaves, or faculty teams break up, or resources are withdrawn in a budget crunch.54 The data in the following table show that in 2003-4 almost one-seventh of U.S. schools reported that they had 80-100 percent minority students, and three-fourths of those schools reported that 50-100 percent of their students were from families poor enough to qualify for free or reduced price school lunches (Table 14). Given that some schools do not offer the lunch program and that many children in poor high schools either do not eat in the cafeteria or are too ashamed to apply for free lunch by documenting their family’s poverty, the rate is doubtless higher.55 At the other extreme, 52 percent of U.S. schools have 0 to 20% minority students and only one-seventh of those schools are dealing with concentrated poverty, which is related to many negative factors from poor prenatal development, poor childcare and preschool experiences, untreated health problems, instability from frequent involuntary moves, exposure to neighborhood violence, schools with less trained and experienced teachers, and many more sources of inequality.56
society. Journal of Negro Education. 63(3):394-405; Natriello, G., McDill, E.L. and Pallas, A.M. (1990). Schooling disadvantaged children: Racing against catastrophe. New York, NY: Teachers College Press. 52 Knapp, M. S. et al. (1995). Teaching for meaning in high-poverty classrooms. New York, NY: Teachers College Press; Metz, M. (1990). How social class differences shape teachers’ work. In M.W. McLaughlin, J.E. Talbert, and N. Bascia (Eds.), The contexts of teaching in secondary schools. New York, NY: Teachers College Press; Puma, M. et al., (1995). Prospectives: Final report on student outcomes. In Knapp et al, Teaching for meaning in high-poverty classrooms. New York, NY: Teachers College Press. 53 Orfield, G. and Lee, C. (2005). Why Segregation Matters: Poverty and Educational Inequality. Cambridge: The Civil Rights Project at Harvard University; Rothstein, R. (2004). Class and Schools: Using Social, Economic and Educational Reform to Close the Black-White Achievement Gap. Washington, D.C.: Economic Policy Institute. 54 Elmore, R. (1996). Getting to scale with good educational practice. Harvard Educational Review, 66 (1), 1-26. 55 The statistics on free and reduced lunch are less complete than data for racial composition, though these data are available for the majority of schools. 56 For a more extensive discussion of these issues, see Orfield, G. and Lee, C. (2005). Why Segregation Matters: Poverty and Educational Inequality. Cambridge: The Civil Rights Project at Harvard University. http://www.civilrightsproject.harvard.edu/research/diversity/diversity_gen.php
30

Table 14 Relationship between Segregation by Race and Poverty, 2003-04 Percent Minority Students in Schools % Poor in Schools
0-10%
10-20%
20-30%
30-40%
40-50%
50-60%
60-70%
70-80%
80-90%
90-100%
0-10% 32 25 15 13 11 9 12 10 13 17 10-25% 23 25 23 14 8 4 3 2 1 1 25-50% 31 33 37 39 34 27 18 10 7 6 50-100% 15 17 25 35 48 60 67 77 78 76 % of Schools (Column Totals)
40 12 8 6 6 5 4 4 4 10
Source: Common Core of Data, 1991 and 2003 Court Decisions and Increasing Segregation in the Districts Under three Supreme Court decisions57, desegregation can be ended after at time if a parent sues the school district for continuing to follow policies intentionally assigning students by race to integrated schools, even if local officials believe it is educationally and socially beneficial. The courts were also directed to limit court-ordered educational remedies intended to repair the harms of segregation. Since the Supreme Court authorized termination of desegregation plans in a 1991 decision concerning Oklahoma City schools, many school districts have ended their plans and restored neighborhood schools with segregation reflecting or even intensifying the residential segregation. While the termination of the orders might not automatically result in resegregation, and some districts tried to maintain some level of desegregation by keeping old policies in place, or through keeping elements such as magnet schools and controlled choice plans, others simply returned to neighborhood based schools or stopped enforcing the desegregation plans even before the court reached the decisions. In many cases, a return to neighborhood schools intensifies school segregation because schools tend to over-represent neighborhood minority population, and a higher proportion of white than minority children attend private schools.. The spread of charter schools, which are on average even more segregated than regular public schools, further exacerbates the problem.58 The belief that a return to neighborhood schools can result in a significant white return to public schools is unsubstantiated. First, the argument is founded on the assumption that desegregation orders are largely responsible for white flight to the suburbs. The white flight argument appears to have been largely a misinterpretation of the changing population, particularly of big city school systems, blaming the decline on school desegregation rather than the basic underlying forces of differential birth rates, immigration, and continuing spread of residential segregation, especially for families with children. In fact, since schools tend to over-represent neighborhood minority population, they can resegregate much faster than neighborhoods. Since the average housing unit changes hands every six years and young families move more often, failure of a 57 See note supra. 58 Frankenberg, Erica and Chungmei Lee. 2003. “Charter Schools and Race: A Lost Opportunity for Integrated Education.” Educational Policy Analysis Archives, vol. 11, no. 32 (2003).
31

neighborhood and its schools to continue to draw whites can, in a few years, produce a segregated school. Equally worrisome is middle class black and Latino flight--the fact that resegregated schools tend to become predominantly high poverty schools over a relatively short period of time, schools that may cause a neighborhood to lose its middle class black or Latino population as well. One way to address the close relationship between school and residential segregation is through school districts that encompass broader housing markets. Past reports have shown that the most remarkable levels of long-term school desegregation were achieved though city-suburban desegregation plans.59 After the Supreme Court rejected desegregation plans crossing school district boundary lines in the 1974 Milliken v. Bradley decision, these plans were largely limited to states which had country-wide districts, encompassing much or all of the metropolitan housing market. States with plans involving only central cities that divided metropolitan areas into housing submarkets with heavily minority schools, sometimes including mandatory reassignment of white students, and suburbs with little or no desegregation and few low income students, created the worst possible conditions for maintaining and expanding stable residential integration. In short, the return to neighborhood schools calls for greatly increased focus on residential integration but that has not occurred. There is important evidence that metropolitan-wide school desegregation produced increases in residential integration by eliminating the racial factor of school composition or fear of resegregation of the local school from the housing choice process.60 These statistics suggest that if the racially diverse school districts and communities wish to remained multiracial and hold white families, they will probably have to seriously work to stabilize interracial neighborhoods and avoid residential resegregation since there is nothing about neighborhood schools that is automatically stable. As we examine the changes in the largest school districts (30,000 and over) that terminated desegregation, we see a significant, sometimes a very substantial, decline in the percent of white students in the school of a district’s average black student, as shown in Table 15. The decline in share of white enrollment is evident in all the districts, with the greatest changes in Southern and Western metro or suburban districts such as Broward, East Baton Rouge, Clark, and Aldine. During this time the percent of white students in the school of the average black student dropped in all districts and seemingly replaced by Latino classmates. This is especially evident in Western states such as California and Colorado, where the share of Latino students in the school of the average black student increased at least 10 percentage points in San Diego and San Jose and a startling 20 percentage points in Denver. In Florida, black students in Hillsborough, Lee, Polk, and St. Lucie districts also experienced at least a 10 percentage point increase in exposure to Latino peers. In other Southern states such as North Carolina and Texas, the share of Latino students in the school of the average black in Charlotte increased from one to 10 percent and in Dallas, the percent Latino in the school of the average black increased from 20 to 27 percent. 59 Frankenberg, E., Lee, C. and Orfield, G. (2003). A Multiracial Society with Segregated Schools: Are We Losing the Dream? Cambridge, MA: The Civil Rights Project. 60 For a comparison of residential patterns in areas with metrolitan desegregation and more limited plans, see: Myron Orfield and Thomas Luce, Minority Suburbanization and Racial Change: Stable Integration, Neighborhood Transition, and the Need for Regional Approache.s Presented at Race and Regionalism Conference, Inst. On Race and Poverty, University of Minnesota, Minneapolis, Minnesota, May 2005.
32
Although the black and Latino students had much less contact with whites, the idea that ending desegregation would produce a return of white classmates to neighborhood schools proved wrong, as the overall demographic change of districts continued, and the proportion of whites in the class of the average white student fell in all districts except Mobile, Denver, Chatham, DeKalb, Cincinnati, Cleveland, and Houston. It is instructive to look at what happened to the major school districts involved in the Supreme Court’s landmark desegregation cases after the termination of their plans, and to review the general pattern of change in the largest city, suburban, and metropolitan districts. The landmark cases include Brown (1954), from Topeka, KS, which established the right to desegregation61; Cooper v. Aaron (1958) from Little Rock, which overrode the ability of state government to block desegregation on the claim that it would produce violence62; Swann (Charlotte, 1971) which established the right to comprehensive urban desegregation and implemented city-suburban desegregation in a county-wide district, accepting busing if necessary to desegregate urban districts in the South63; Keyes (Denver, 1973) which established the right to desegregation outside the South and the right of Latino students to desegregation64; Milliken (Detroit, 1974) which blocked city-suburban desegregation in most states65; Dowell (Oklahoma City. 1991) which established the policy of terminating desegregation plans and returning to segregated neighborhood schools after a period of years66; Freeman v. Pitts (DeKalb—suburban Atlanta, 1992) which authorized piecemeal termination of desegregation orders67; and Jenkins (Kansas City, MO, 1995) which held that the educational components of desegregation plans could be cancelled even if they had not yet produced educational progress.68 In all of these historic districts the desegregation orders have now been ended and it is possible to look at the ensuing conditions Among all these districts, the highest level of desegregation was achieved in Charlotte and Topeka, and the most radical increase in segregation after the plan was dissolved has taken place in Charlotte.69 The Detroit plan, as Justice Thurgood Marshall pointed out in his dissent, was deeply unsuccessful and the city continued to move through rapid residential resegregation producing schools attended by black students that are only three percentage points away from complete apartheid.70 However, despite the low white enrollment, white students are in schools that have far more whites than the district average. Detroit consistently in recent decades has rated among the most hypersegregated metropolitan housing markets in the U.S. The Charlotte schools were among the most integrated metropolitan areas for three decades following the implementation of county-wide busing in 1971. After the county school board’s 61 Brown v. Borad of Education of Topeka, 347 U.S. 483(1954). 62 Cooper v. Aaron, 358 U.S. 1 (1958). 63 Swann v. Charlotte-Mecklenberg Board of Education, 402 U.S. I (1971). 64 Keyes v. Denver School District No. I, 413 U.S. 189 (1973). 65 Milliken v. Bradley, 418 U.S. 717 (1974). 66 Board of Education of Oklahoma v. Dowell, 498 U.S. 237 (1991). 67 Freeman v. Pitts, 503 U.S. 467(1992). 68 Missouri v. Jenkins, 115 S.Ct. 2038(1995). 69 Mickelson, R. (2005). The Incomplete Desegregation of the Charlotte-Mecklenburg Schools and Its Consequences, 1971-2004 in John Boger & Gary Orfield, eds. School Resegregation: Must the South Turn Back? Chapel Hill: The University of North Carolina. 70 See Appendix for black isolation figures.
33

long and costly struggle to continue its desegregation plan was rejected by the federal courts, the county has experienced enormous increases in segregation. In 2003, the average black student attended a school that was 28 percent white, compared to 51 percent a little over a decade ago. Despite the drop in white share of enrollment, white isolation remained essentially unchanged. Charlotte had a major decline in residential segregation during the period of school desegregation, and its housing in 2000 was much less segregated than Detroit.71 Following the 1973 desegregation order that was limited to the city of Denver, there was a significant decline in segregation for blacks and Latinos in Denver during the l970s. For Latinos, Colorado was the only state with significant Latino enrollment where segregation did not increase during the l970s. However, lasting desegregation was jeopardized when a state constitutional amendment, the Poundstone amendment, was enacted the year of Denver’s desegregating, prohibiting Denver from continuing to expand its district boundaries. As white suburbanization to neighboring school districts continued, there was a gradual increase of segregation in the l980s. After the plan was terminated in the l990s, there was a significant additional increase in segregation.72 Denver is one of the districts in which black students are attending multiracial schools: the average black student in 2003 attended a school that is 18 percent white and 39 percent Latino. Oklahoma City, a large district including much of the urban area, achieved a level of significant desegregation before it began to dismantle its plan, a process that was accelerated after the Supreme Court decision in 1991. There have been substantial increases in segregation for blacks since the plan was ended. In 2003, the average black student attended a four-fifths minority school that has similar shares of White and Latino students at 19 and 14 percent respectively. Interestingly enough, the major growth of enrollment in the district has been Latino, and there were no provisions for desegregation of Latinos in the plan. Their segregation has increased but they have no rights to any remedy since the Supreme Court has held that the district has fulfilled all of its obligations and is free to take actions which have the result of increasing segregation as long as that is not the stated intent. In the Southern and Border states where Latino enrollment is now surging, the desegregation rights of Latino students have been cancelled before any remedy was received. DeKalb County, Georgia, home to the large black middle class exodus from Atlanta, was going through rapid racial change and had never fully desegregated when the Supreme Court authorized termination of the student assignment plan in 1992. Subsequently, the courts forbade the continuation of a student transfer plan that let a few thousand black students transfer to stronger white schools in other parts of the district. There has now been a substantial increase in black segregation: the average black student in 2003 attended an overwhelming black school that was only 6 percent white, 3 percent Latino and 89 percent Black. White students are similarly isolated: despite the fact that white students constitute only 12 percent of the student population, the average white student attends a school that is 43 percent white, an increase since 1991. The Kansas City (Jenkins) case ended an unusual effort by federal courts to stabilize integration by radically upgrading the schools and offering many special programs in a district where both
71 Orfield and Luce, 2005. 72 Lee, C. (2006). Denver Public Schools: Resegregation Latino Style. Report to be release by Piton Foundation in its January, 2006 issue of its publication, Term Paper.
34
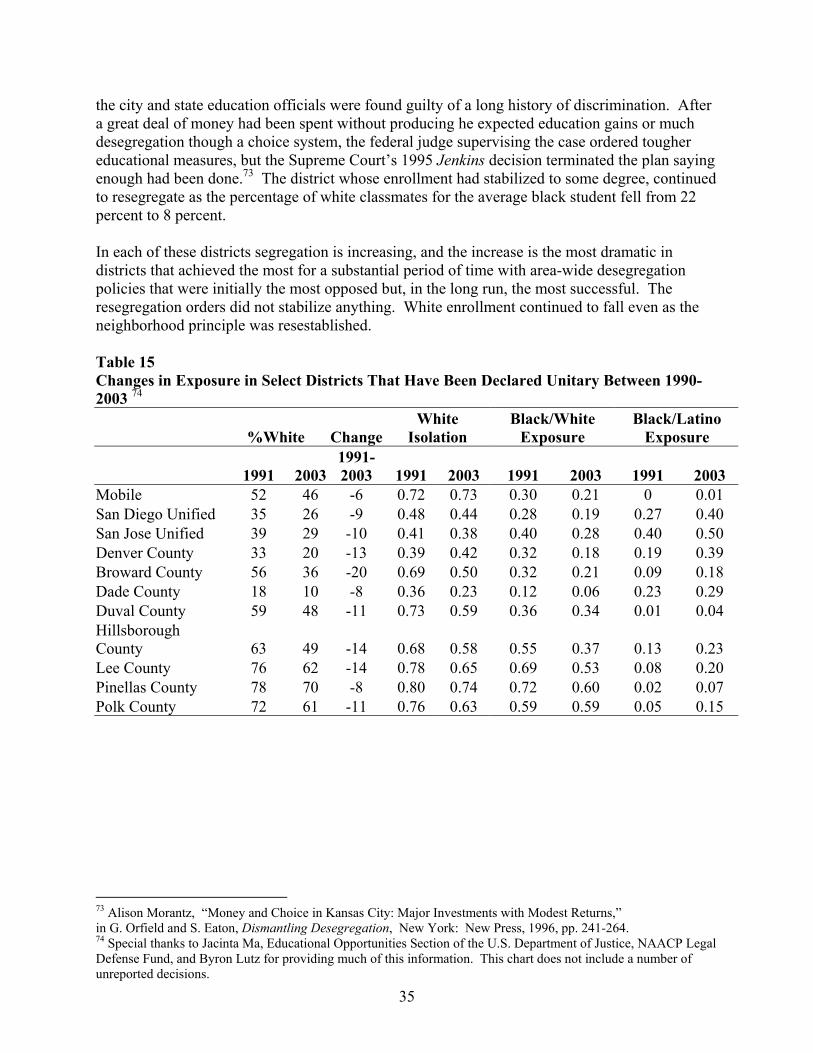
the city and state education officials were found guilty of a long history of discrimination. After a great deal of money had been spent without producing he expected education gains or much desegregation though a choice system, the federal judge supervising the case ordered tougher educational measures, but the Supreme Court’s 1995 Jenkins decision terminated the plan saying enough had been done.73 The district whose enrollment had stabilized to some degree, continued to resegregate as the percentage of white classmates for the average black student fell from 22 percent to 8 percent. In each of these districts segregation is increasing, and the increase is the most dramatic in districts that achieved the most for a substantial period of time with area-wide desegregation policies that were initially the most opposed but, in the long run, the most successful. The resegregation orders did not stabilize anything. White enrollment continued to fall even as the neighborhood principle was resestablished. Table 15 Changes in Exposure in Select Districts That Have Been Declared Unitary Between 1990-2003 74
%White ChangeWhite
Isolation Black/White
Exposure Black/Latino
Exposure
1991 2003 1991-2003 1991 2003 1991 2003 1991 2003
Mobile 52 46 -6 0.72 0.73 0.30 0.21 0 0.01 San Diego Unified 35 26 -9 0.48 0.44 0.28 0.19 0.27 0.40 San Jose Unified 39 29 -10 0.41 0.38 0.40 0.28 0.40 0.50 Denver County 33 20 -13 0.39 0.42 0.32 0.18 0.19 0.39 Broward County 56 36 -20 0.69 0.50 0.32 0.21 0.09 0.18 Dade County 18 10 -8 0.36 0.23 0.12 0.06 0.23 0.29 Duval County 59 48 -11 0.73 0.59 0.36 0.34 0.01 0.04 Hillsborough County 63 49 -14 0.68 0.58 0.55 0.37 0.13 0.23 Lee County 76 62 -14 0.78 0.65 0.69 0.53 0.08 0.20 Pinellas County 78 70 -8 0.80 0.74 0.72 0.60 0.02 0.07 Polk County 72 61 -11 0.76 0.63 0.59 0.59 0.05 0.15
73 Alison Morantz, “Money and Choice in Kansas City: Major Investments with Modest Returns,” in G. Orfield and S. Eaton, Dismantling Desegregation, New York: New Press, 1996, pp. 241-264. 74 Special thanks to Jacinta Ma, Educational Opportunities Section of the U.S. Department of Justice, NAACP Legal Defense Fund, and Byron Lutz for providing much of this information. This chart does not include a number of unreported decisions.
35

Table 15 (cont.) Changes in Exposure in Select Districts That Have Been Declared Unitary Between 1990-2003 75
%White ChangeWhite
Isolation Black/White
Exposure Black/Latino
Exposure
1991 2003 1991-2003 1991 2003 1991 2003 1991 2003
Seminole County 76 67 -9 0.78 0.69 0.64 0.60 0.07 0.16 St. Lucie County 63 55 -8 0.65 0.57 0.60 0.52 0.04 0.14 Chatham County* 38 30 -8 0.44 0.45 0.34 0.22 0.01 0.02 DeKalb County* 23 12 -9 0.41 0.43 0.16 0.06 0.02 0.03 Muscogee County* 42 35 -7 0.60 0.56 0.28 0.22 0.03 0.03 Indianapolis Public Schools 47 31 -16 0.52 0.46 0.42 0.23 0.01 0.07 Jefferson County 68 60 -8 0.69 0.63 0.66 0.56 0 0.03 East Baton Rouge Parish 42 21 -21 0.57 0.40 0.31 0.15 0 0.01 Prince Georges County 25 8 -17 0.40 0.23 0.19 0.07 0.04 0.08 Boston 21 14 -7 0.30 0.27 0.18 0.10 0.19 0.26 Detroit City 8 3 -5 0.30 0.20 0.05 0.02 0.01 0.01 Minneapolis 46 27 -19 0.48 0.44 0.44 0.20 0.02 0.11 Kansas City 26 13 -13 0.35 0.34 0.22 0.08 0.03 0.08 St. Louis City 20 16 -4 0.41 0.37 0.15 0.11 0 0.01 Clark County 68 44 -24 0.72 0.55 0.61 0.37 0.15 0.34 Buffalo City 40 26 -14 0.44 0.40 0.38 0.20 0.05 0.08 Charlotte-Mecklenburg 56 42 -14 0.60 0.59 0.51 0.28 0.01 0.10 Cincinnati 35 25 -10 0.47 0.51 0.29 0.16 0 0.01 Cleveland 23 18 -5 0.27 0.44 0.21 0.09 0.05 0.04 Oklahoma City 44 27 -17 0.54 0.38 0.32 0.19 0.06 0.14 Aldine ISD 31 6 -25 0.36 0.09 0.30 0.07 0.28 0.50 Austin ISD 43 30 -13 0.57 0.55 0.29 0.19 0.33 0.56 Corpus Christi ISD 26 20 -6 0.40 0.32 0.20 0.19 0.67 0.71 Dallas ISD 16 6 -10 0.39 0.24 0.09 0.04 0.20 0.37 Fort Worth ISD 33 18 -15 0.55 0.40 0.20 0.13 0.15 0.31 Houston ISD 14 9 -5 0.33 0.35 0.09 0.06 0.23 0.35 Norfolk City* 34 26 26 0.43 0.37 0.28 0.22 0.01 0.02 *These numbers are from 1993-4 school year. Source: Common Core of Data, 1991 and 2003
75 Special thanks to Jacinta Ma, Educational Opportunities Section of the U.S. Department of Justice, NAACP Legal Defense Fund, and Byron Lutz for providing much of this information. This chart does not include a number of unreported decisions.
36

Voluntary Integration Under their current leadership, the federal courts are not going to integrate America’s segregated schools. Indeed, the Supreme Court became the driving force in resegregation in three major decisions in the l990s, concerning Oklahoma City76, DeKalb Country77, Georgia, and Kansas City, MO78. The Court held that desegregation was only a temporary requirement, that following a court order for a number of years made up for the historic violation, and that courts should end orders and permit school districts to return to neighborhood schools, even if they would be predictably segregated and unequal. The Court said that plans could be disestablished piecemeal, even if all elements had never been achieved. Finally, in the 1995 Kansas City case the Court held that the educational programs required to help make up for a history of segregated and unequal education could be dismantled, even if they had not accomplished their goals. Across the country, districts returned to policies that reestablished extensive segregation. Every measure of segregation since the late l980s has shown growing separation. Once mandatory desegregation was largely dismantled, the civil rights critics began an active attack on voluntary desegregation, which was undertaken not under a court order but by local educational leaders and school boards and involved forms of educational choice. Many of these magnet school and voluntary transfer and controlled choice plans had been created to avoid mandatory student reassignment and to encourage parents to choose educationally valuable alternatives that would produce schools that were both integrated and desirable to parents of all races. The way these schools were kept integrated was to actively recruit across racial lines, provide free transportation to assure real choice for families who could not provide private transportation, to make the schools welcoming to all groups of students, and to set aside seats for white and minority students when necessary to assure integration. Many of these schools were very popular and successful, and federal magnet school funds were eagerly sought in spite of desegregation requirements. Conservatives wanted these programs banned because they believed that any use of race in student assignment was illegal, not only if it imposed segregation but even when it fostered integration. These arguments had some success in federal courts especially in the conservative Fourth Circuit Court of Appeals where the judges banned race-conscious assignment for magnet schools in Arlington, VA, and Montgomery Country, MD, as well as Charlotte, NC. The Supreme Court’s decision supporting affirmative action at the University of Michigan Law School, however, clearly held that educational integration had great value for students, the educational process, and for society and its major institutions. Following that decision three other Courts of Appeals, the First Circuit in New England, the Sixth Circuit in the Midwest, and the Ninth Circuit in the West have spoken in 2005 on the issue of voluntary integration in cases from Massachusetts city of Lynn, from the metropolitan Louisville (Jefferson Country) school district, and from Seattle, Washington, and each has upheld the right of school districts to follow such policies.79
76 Dowell v. Oklahoma City, U.S. (1991). 77 Freeman v. Pitts, U.S. (1992). 78 Missouri v. Jenkins, U.S. (I1995). 79 Hampton v. Jefferson County Board of Education, 72 F. Supp. 2d 753; (WD Ky.1999,McFarland v. Jefferson County Public Schools, 330 F. Supp. 2d 834 (WD Ky. 2004), McFarland v. Jefferson County Public Schools, 416
37

Voluntary action by school districts and state governments to preserve and expand good magnet and choice plans could help end the growth of racially separate schools. When federal funds were available to expand racially integrated magnet schools and to develop special curriculum and staff training for schools of choice, they were eagerly sought, and many of the schools became highly popular with parents, educators, and community leaders. Funds should again be provided on a major scale for such schools. Now, many of these schools could well be created in racially changing suburbs as well as central cities and be explicitly designed to serve both city and suburban schools as some successful schools under Connecticut’s Sheff decision have done.80 Such schools need certain equity provisions to avoid becoming elite schools serving the most privileged students. Those policies include: explicit desegregation standards and recruitment to meet them, including holding seats for under-represented groups if necessary, good personal parent information, staffs and materials to reach families regardless of language and educational status, welcoming all groups of students including English Language learners, staff integration and multicultural curriculum, selection on the basis of interest and choice, not academic screening, random selection when schools are over-chosen to avoid giving special advantage to well-connected parents who choose first. Obviously the impact of such standards would be greatly enhanced if they were applied to the thousands of charter schools, which typically lack these policies and are even more segregated than traditional public schools. Finally, the good idea in No Child Left Behind that gives students in failing schools the right to transfer could be transformed from a little used and generally useless right to transfer to another segregated high poverty school to a right to transfer under such desegregation policies to better multiracial schools regardless of school district boundary lines. The changing racial composition of schools in the U.S. requires that we think about desegregation more broadly. What are needed are policies that are not limited to getting “minority” students into white schools but focus on integrating students from isolation in high poverty black and Latino schools to middle class white, Asian and multiracial schools. We also need serious support for research, curriculum development, and teacher training in schools that serve several minority groups in a high poverty context, such as the historically black schools in California or Florida, or New York or Texas which are experiencing surging Latino enrollment. No Child Left Behind promised to deal with racial inequality, never mentioning segregation, but has usually ended up, so far, documenting in vast detail the systematic inequality of high poverty minority schools and has ended up not providing the promised resources to those schools but directing a very disproportionate share of the policy’s harsh sanctions at this group.81 Recent dropout research has shown that the nation’s crisis of high school completion is concentrated in a few hundred high poverty minority high schools which have been accurately described as “dropout factories,” since dropouts are their major product and less than half their students typically graduate, sometimes much less. For forty years, optimists have pointed to the relative handful of schools that break the barriers of segregation by race and poverty, as if it is the
F.3d 513; (6th Circuit, 2005) U.S. App Parents Involved in Community Schools v. Seattle, 426 F.3d 1162 (9th Circuit 2005) Comfort v. Lynn, 418 F.3d 1 (1st Circuit 2005). 80 Sheff v. O'Neill, 238 Conn. 1, 678 A.2d 1267 (1996). 81 Gail Sunderman, James Kim and Gary Orfield, NCLB Meets School Realities, Corwin, 1995.
38
solution, but these successes have been largely at the elementary level and have never been generalized across the system in any district with a large minority enrollment. Perhaps the Supreme Court was correct when it held in 1954 that segregated schools that are the product of discrimination are “inherently unequal.” Certainly until we have serious evidence to the contrary and learn that there is some way to successfully prepare our students to live and work in an extremely multiracial society in segregated schools and neighborhoods, it would be well to take prudent steps to build on successful models and begin to turn back the tide of resegregation. What Can Be Done? If growing segregation threatens the American future and denies important opportunities to children of all races, the logical question is--what can be done? It is often said that the trends are deeply unfortunate but that there is little or nothing that can be done about them, given the force of the demographic changes or the current leadership of the judiciary and the elected branches of government. This is wrong. Substantial progress can be made and some communities are successfully defending desegregation or seeking new ways to achieve it. Most of our school districts and communities are doing very little to work on this issue or even to discuss it, and some are taking steps that are clearly negative. The floodtide of data about racial differences and school level achievement scores produced by No Child Left Behind and state reforms and recent dropout research show the persisting educational inequalities in segregated schools. In fact, the little discussed reality is that no one has a program shown to equalize segregated schools on scale; and, as the Supreme Court recognized in the recent college affirmative action case, there are lessons very important to living and working in a multiracial society that cannot, in their nature, be learned in segregated schools. It is true that demography changes the issues. In a country with only 58% white students and two of its major regions without a white majority, there is no way that all minority students could attend majority white schools. If that were considered the only reasonable achievement of desegregation, it would become less feasible every year. The right way to begin to think about this is to adopt a few basic principles and then consider a variety of decisions and practices in light of how they may assist or undermine the goals. The first principle is that segregation by race and ethnicity is almost always related to seriously unequal opportunities for all races, including whites, and it should be minimized. The second is that, to the extent that we can increase the access of students from historically excluded to stronger middle class schools without jeopardizing those schools and their students, that is a very desirable goal for many reasons relating not only to the students' own destinies but also to the realization of the broad goals of creating a successful and stable multiracial society. The third is that successful models for lowering segregation have been demonstrated for decades in various districts and programs. The first principle that is needed is recognition of the problem and the opportunity and creation of a goal of successfully integrated schools at the level of the school, the district, the state, and the nation. There are important things that can be done at each level. The recent decisions of
39

three high federal courts that affirm the right of communities to take race-conscious action to create or retain integrated schools clearly lend support to community efforts and to state policies supporting integration. State constitutions and laws can also provide support for integrationist policies. The following are important dimensions for policy on this issue: 1) Communities and community groups considering moves to terminate desegregation orders should be made fully aware of the fact that unitary status rulings eliminate the rights and judicial protection for minority students that grew out of the history of local discrimination. A court order provides protection against local political decisions which create segregated and unequal education for minority children and protects the rights of local educators to pursue voluntary magnet school and other educational approaches without fear of judicial challenge. 2) Communities should carefully examine the relationship between segregation and the success of schools in meeting state standards and NCLB requirements as well as a good graduation rate for students and the availability of college-oriented courses in high school. If there is a systematic relationship and the local reform plans have failed to resolve it, civil rights and educational organizations should ask for a plan to lessen segregation by race and poverty. 3) In areas of increasing school segregation and racial transition in sectors of suburbia, federal, state and local civil rights enforcement agencies and private fair housing groups should continually monitor housing market discrimination and steering, including inappropriate use of test score data to steer homebuyers away from integrated communities. 4) Successful magnet school programs that produce integrated student bodies within school districts should be expanded, and regional magnets drawing students together for special programs across school district boundary lines should be created. 5) Charter schools should have specific integration goals and policies, including policies on recruitment and transportation to school. 6) Transfer policies that foster integration should be continued and transfers that increase segregation or undermine integrated communities discontinued. The transfers provided under NCLB should follow that rule and should open opportunities to transfer from segregated high poverty failing schools to better, more integrated schools in other districts. 7) State civil rights and legal officials should support efforts of communities to retain and expand school integration and should encourage regional cooperation among suburbs as suburban resegregation spreads. 8) Private foundations, university centers, and federal research agencies should sponsor basic and applied research on the spread of multiracial schools, their impact on learning and degree attainment, and preparation for functioning in multiracial communities and on the development of techniques and curricula to improve outcomes in these schools.
40

APPENDIX Black Isolation in Select Districts That Have Been Declared Unitary, 1990-2003 Black Isolation 1991 2003 Mobile 0.69 0.77 San Diego Unified 0.25 0.23 San Jose Unified 0.05 0.06 Denver County 0.44 0.38 Broward County 0.57 0.59 Dade County 0.64 0.64 Duval County 0.62 0.59 Hillsborough County 0.31 0.38 Lee County 0.22 0.26 Pinellas County 0.24 0.30 Polk County 0.35 0.26 Seminole County 0.27 0.20 St. Lucie County 0.34 0.32 Chatham County 0.64 0.75 Dekalb County 0.79 0.89 Muscogee County 0.68 0.74 Indianapolis Public Schools 0.56 0.69 Jefferson County 0.33 0.39 East Baton Rouge Parish 0.67 0.82 Prince Georges County 0.73 0.83 Detroit City 0.93 0.96 Minneapolis 0.39 0.50 Kansas City 0.73 0.82 St. Louis City 0.84 0.87 Clark County 0.19 0.21 Buffalo City 0.55 0.69 Charlotte-Mecklenburg 0.45 0.58 Cincinnati 0.70 0.82 Cleveland 0.72 0.86 Oklahoma City 0.57 0.61 Aldine ISD 0.37 0.41 Corpus Christi ISD 0.12 0.08 Dallas ISD 0.70 0.57 Fort Worth ISD 0.62 0.54 Houston ISD 0.66 0.57 Norfolk City 0.68 0.74
41