Embed Size (px)
Citation preview

SPATIAL ECOLOGY AND WETLAND USE OF AQUATIC TURTLES IN THE COASTAL
PLAIN OF GEORGIA
by
RACHEL LAUREN KING
(Under the Direction of Lora Smith and Alan Covich)
ABSTRACT
The Southeastern Coastal Plain of the United States is a global hotspot of aquatic turtle
diversity yet little is known about the basic spatial ecology and habitat selection for many
species. I described the differences in aquatic turtle assemblages in streams and geographically
isolated wetlands in the Dougherty Plain physiographic district of southwestern Georgia, and
used occupancy modeling and radio-telemetry to identify wetland characteristics important for
turtles. I also examined spatial patterns of overland movement and terrestrial habitat associations
of turtles, and used the results to generate potential corridors of terrestrial movement between
aquatic systems using Linkage Mapper and Circuitscape. My results suggest that both isolated
wetlands and stream systems are needed to support turtle diversity in the region and that aquatic
turtles may demonstrate a functional linkage between these systems. Moreover, turtles moving
overland were most often found in natural forests rather than agricultural fields or pine
plantations. Turtles also and used geographically isolated wetlands as stepping stones across the
landscape, which highlights the collective importance of these landscape features for turtles.
INDEX WORDS: aquatic turtles, geographically isolated wetlands, streams, detection
probability, overland movements, radio-telemetry, Chelydra serpentina, Trachemys
scripta

SPATIAL ECOLOGY AND WETLAND USE OF AQUATIC TURTLES IN THE COASTAL
PLAIN OF GEORGIA
by
RACHEL LAUREN KING
BS, University of Central Florida, 2011
A Thesis Submitted to the Graduate Faculty of the University of Georgia in Partial Fulfillment of
the Requirements for the Degree
MASTER OF SCIENCE
ATHENS, GEORGIA
2014

© 2014
Rachel Lauren King
All Rights Reserved

SPATIAL ECOLOGY AND WETLAND USE OF AQUATIC TURTLES IN THE COASTAL
PLAIN OF GEORGIA
by
RACHEL LAUREN KING
Major Professor: Lora Smith, Alan Covich
Committee: Steve Golladay, John Maerz
Electronic Version Approved:
Maureen Grasso
Dean of the Graduate School
The University of Georgia
May 2014

IV
DEDICATION
I would like to dedicate my thesis to my grandfather, Daniel “Papa” Moncol, who
sparked my love of the outdoors and all things creepy crawly and encouraged me all my life to
follow my dreams. I remember him letting me go down to his lab in the basement and look
through his microscope, and many of my favorite childhood memories include exploring and
making mischief on his land in the mountains. He has been my biggest supporter throughout
graduate school and I honestly could not have done this without him.
V
ACKNOWLEDGEMENTS
The funding for this project was made possible by the University of Georgia Graduate
School and matching funds from the Joseph W. Jones Ecological Research Center. This project
was conducted with the approval of the University of Georgia’s Institutional Animal Care and
Use Committee (Animal use protocol #: A2012 04-028-R1).
I would like to thank my committee members, Drs. Alan Covich, John Maerz, and Steve
Golladay, for their guidance on my graduate project, and I would specifically like to thank Dr.
Lora Smith, who found my graduate school application and decided to give me a chance. She has
never stopped encouraging me to strive to become a better ecologist, and has been patient and
incredibly helpful throughout my entire graduate school tenure. She has truly become my
Ichauway mom. I also thank Jean Brock, Lain Alexander, and Dr. Jeff Hepinstall-Cymerman for
their GIS and computer expertise which was critical to my project.
I would like to thank the following people for their help with installing drift fencing and
bringing me turtles: Jen Howze and all the past and present members of the herpetology lab,
Bobby Bass, Joe Warden, Ashley Warren, Joe Bolton, Nick Deuel, and Nate Sellers.
Lastly, I thank my family and friends for supporting me throughout graduate school and
sticking with me through thick and thin, and I thank the turtles of Ichauway who have inspired a
passion in me for them and the ecosystems they live in.

VI
TABLE OF CONTENTS
Page
ACKNOWLEDGEMENTS………………………………………………………………..…..…V
LIST OF TABLES…………………………………………………………………..….………VII
LIST OF FIGURES………………………………………………………………………….......XI
CHAPTER
1 INTRODUCTION AND LITERATURE REVIEW…………………………..……….…1
INTRODUCTION……………………………………………………...…….…..……….1
LITERATURE REVIEW…………………….…………………………..………..……...2
LITERATURE CITED……………………………………………………..….………….7
2 AQUATIC TURTLE COMMUNITIES AND OCCUPANCY IN STREAMS AND
ISOLATED WETLANDS IN THE COASTAL PLAIN OF GEORGIA……...…….…..14
INTRODUCTION………………………………………………………………….……14
METHODS………………………………………………….....….………………….….16
RESULTS…………………………………………………………………………….….20
DISCUSSION…………………………………………..……………………………….22

VII
LITERATURE CITED……………………………………………………………...……24
3 OVERLAND MOVEMENT BY AQUATIC TURTLES IN THE DOUGHERTY PLAIN
OF GEORGIA…………………………….........………..………………………………45
INTRODUCTION……………………………………………..………...………………45
METHODS…………………………………………………………...……………….…48
RESULTS…………………………………………………………...…..………….……52
DISCUSSION……………………………………………………………...…………….54
LITERATURE CITED………………………………………………………………..…58
4 SPATIAL ECOLOGY AND HABITAT SELECTION OF COMMON SNAPPING
TURTLES (CHELYDRA SERPENTINA) AND YELLOW-BELLIED SLIDERS
(TRACHEMYS SCRIPTA) IN A LONGLEAF PINE ECOSYSTEM…………...……..78
INTRODUCTION…………………………………………………...……………..……78
METHODS……………………………………..………………...…………………..….81
RESULTS……………………………………………………...…………………...……85
DISCUSSION………………..…………………………...……………………..……….87
LITERATURE CITED……….………………………………………………...………..91
5 CONCLUSIONS AND MANAGEMENT IMPLICATIONS……………….....…………120
LITERATURE CITED…………………………………………………………………...124

VIII
LIST OF TABLES
Page
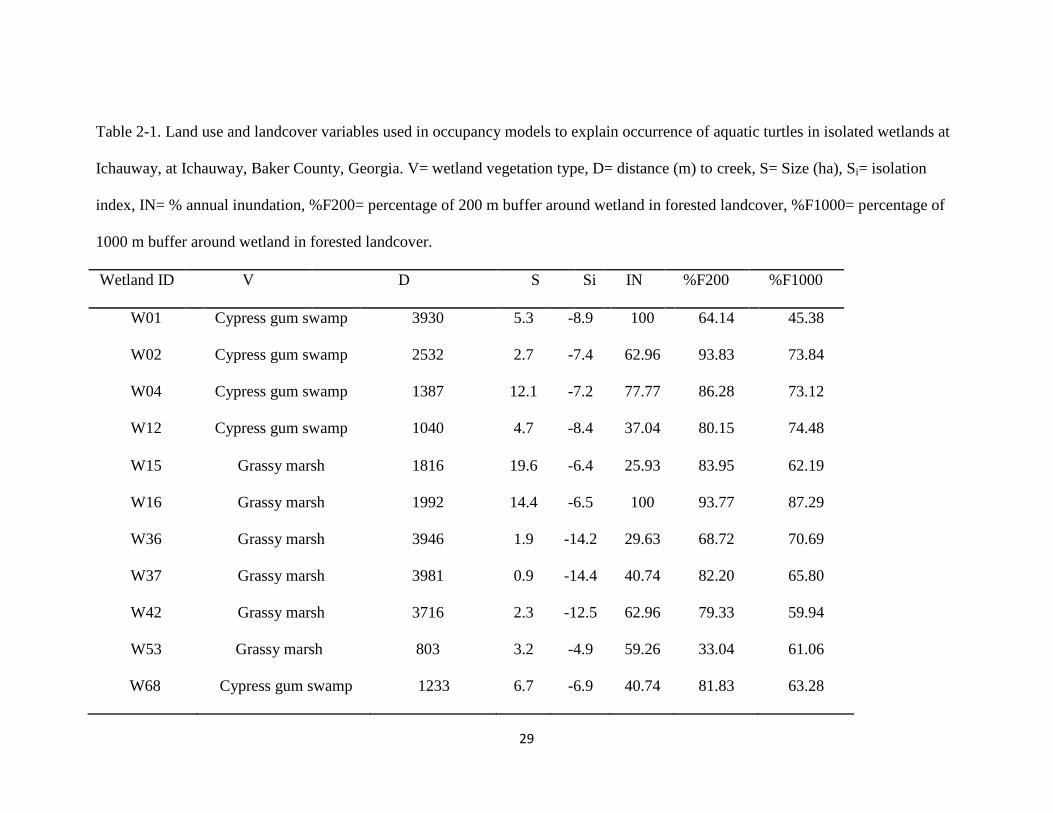
Table 2-1: Land use and landcover variables used in occupancy models to explain occurrence of
aquatic turtles in isolated wetlands at Ichauway, at Ichauway, Baker County, Georgia. V=
wetland vegetation type, D= distance (m) to creek, S= Size (ha), Si= isolation index, IN=
% annual inundation, %F200= percentage of 200 m buffer around wetland in forested
landcover, %F1000= percentage of 1000 m buffer around wetland in forested
landcover………………………………………….……….……………………..………29
Table 2-2: Models used to evaluate turtle occupancy (all species except Trachemys scripta) in
geographically isolated wetlands at Ichauway, Baker County, Georgia. *Denotes –post
priori model. Variables are vegetation type (V), distance to creek (D), size(S), isolation
(Si), annual inundation (IN), and % forested in 200 m buffer (%F). A hypothesis for each
a-priori model is provided……………………………………………………………….30
Table 2-3: Models used to evaluate Trachemys scripta) occupancy in isolated wetlands at
Ichauway, Baker County, Georgia. * Denotes –post priori model. Variables are
vegetation type (V), distance to creek (D), size(S), isolation (Si), annual inundation (IN),
and % forested in 200 m buffer (%F). A hypothesis for each a-priori model is
provided…………………………………..…………………………………………...…31
Table 2-4: Hoop trapping effort for aquatic turtles along a 24 km stretch of Ichawaynochaway
Creek, Baker County Georgia, 2012 and 2013. CPUE= catch per unit effort
(#captures/trap night).………………………………………..…………………..………32
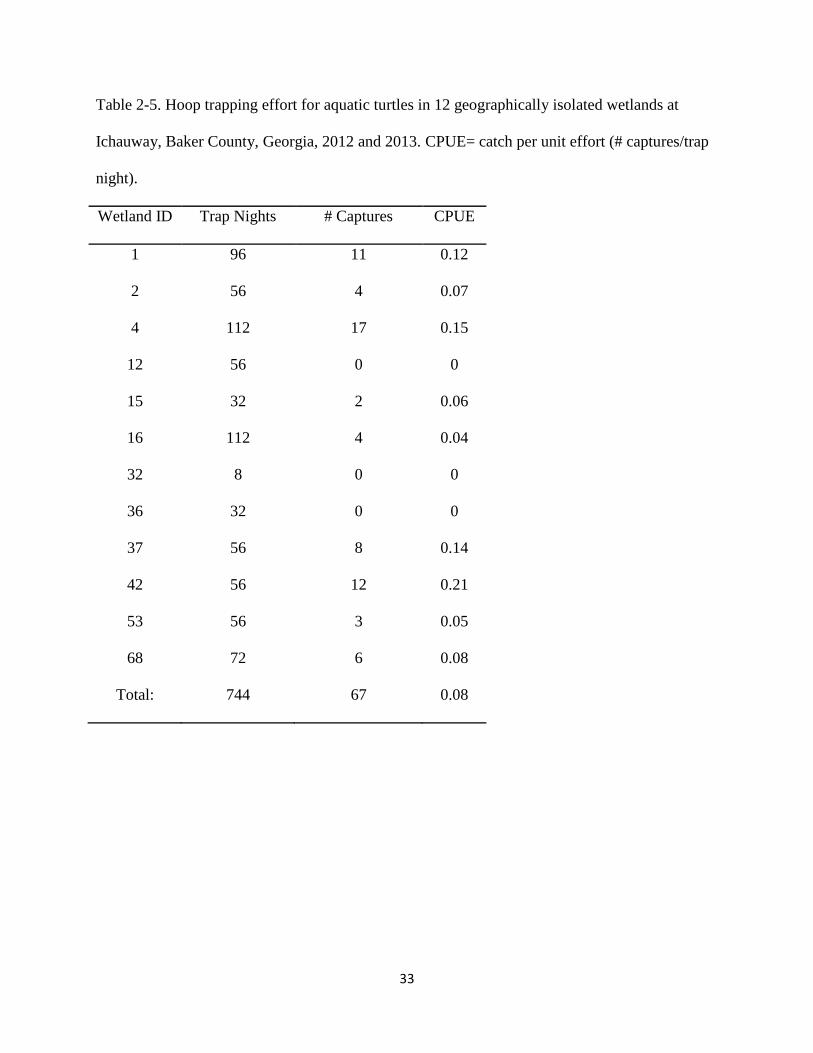
Table 2-5: Hoop trapping effort for aquatic turtles in 12 geographically isolated wetlands at
Ichauway, Baker County, Georgia, 2012 and 2013. CPUE= catch per unit effort (#
captures/trap
night)………………………………………………………...…..……………….………33
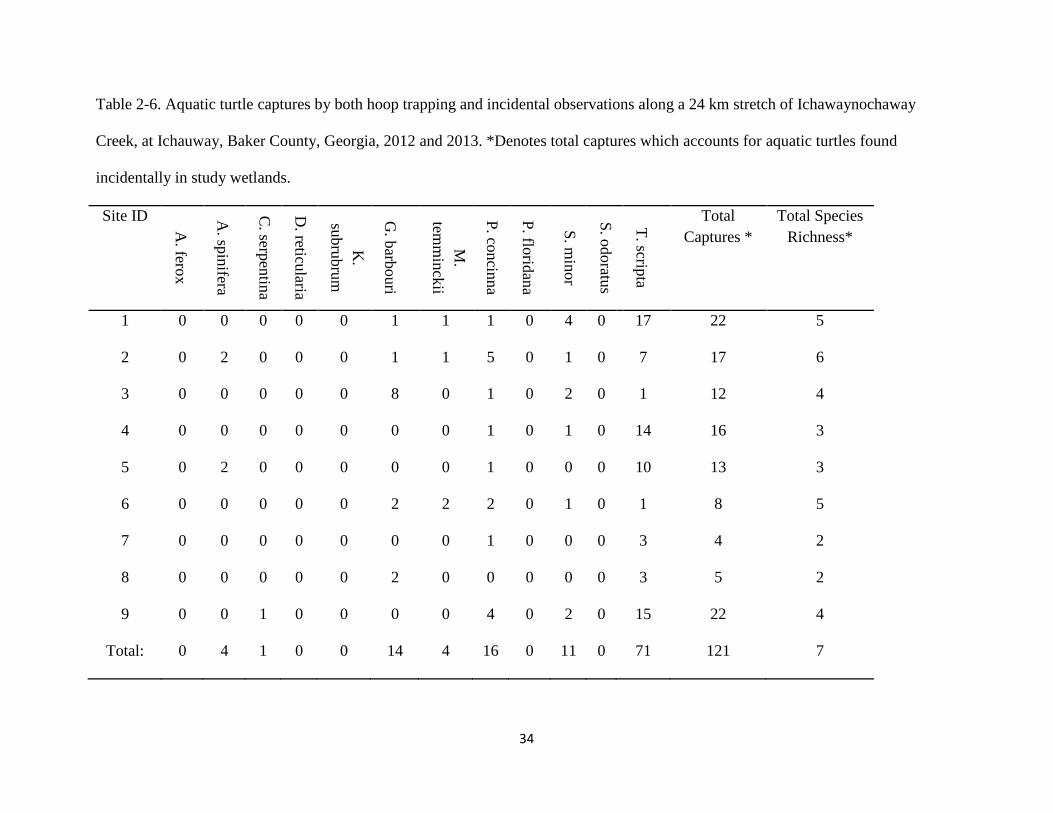
Table 2-6: Aquatic turtle captures by both hoop trapping and incidental observations along a 24
km stretch of Ichawaynochaway Creek, at Ichauway, Baker County, Georgia, 2012 and
2013. *Denotes total captures which accounts for aquatic turtles found incidentally in
study
wetlands………………………………………………………………………………….34
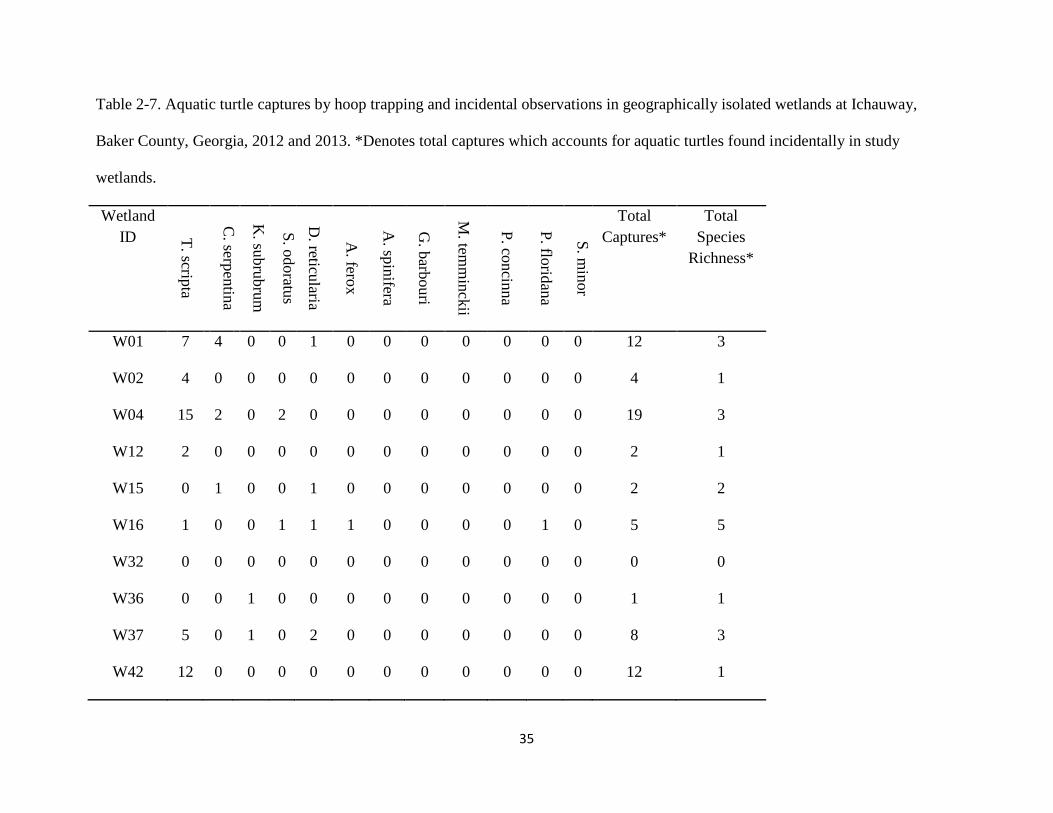
Table 2-7: Aquatic turtle captures by hoop trapping and incidental observations in geographically
isolated wetlands at Ichauway, Baker County, Georgia, 2012 and 2013. *Denotes total
captures which accounts for aquatic turtles found incidentally in study
wetlands…………………………………………………………………………….……35

IX
Table 2-8: Freshwater turtles captured in hoop net traps in twelve isolated wetlands and nine
creek sites at Ichauway, Baker County, Georgia in 2012 and
2013……………………………………………………………………………………....37
Table 2-9: Table 2-9. Models explaining the effects of wetland variables on turtle presence for all
species excluding T. scripta in geographically isolated wetlands at Ichauway, Baker
County, Georgia.. The number of predictor variables (K) in each model includes the
intercept term. Models with lower second order Akaike’s information criterion (AICC)
and difference (Δ AICc) and greater Akaike weights (wi) were more strongly supported
by the data………………………………….…………………………………...…….….38
Table 2-10: Individual site detection probability, naïve occupancy, and estimated overall
occupancy based on leading candidate model for all species except T. scripta presence/
absence (percent forest within 1000 m buffer) in geographically isolated wetlands at
Ichauway, Baker County, Georgia.………………………………………………..….….39
Table 2-11: Models explaining the effects of wetland variables on presence of T. scripta in
geographically isolated wetlands at Ichauway Baker County, Georgia.. The number of
predictor variables (K) in each model includes the intercept term. Models with lower
second order Akaike’s information criterion (AICC) and difference (Δ AICc) and greater
Akaike weights (wi) were more strongly supported by the data…………………………40
Table 2-12: Individual site detection probability, naïve occupancy, and estimated overall
occupancy based on leading candidate model for T. scripta presence/absence (wetland
size) in geographically isolated wetlands at Ichauway, Baker County, Georgia. ……….41
Table 3-1:27 a priori models and variables used in logistic regression for Trachemys scripta to
describe habitat associations of aquatic turtles during overland movements at Ichauway,
Baker County, Georgia from 2003-2013. Variables are scrub (SC), urban (UR), upland
pine (UP), hardwood forest (HW), hardwood pine mix (MX), pine plantation (PP), open
water (OW), wetland (WT), agriculture (AG), road density (RD), habitat edge density
(EG), and distance to nearest water (DW)………………………..…..………….………64
Table 3-2: Number of captures, recaptures, percent of individuals recaptured, and sex ratios for
aquatic turtle species captured on land at Ichauway, Baker County Georgia, 2003-
2013…………………………………………................................................................…66
Table 3-3: Number of captures, recaptures, and sex ratios of aquatic turtles entering and exiting
wetland Holt Pond at Ichauway, Baker County Georgia, 2003-2013……..………….….67
Table 3-4: Cardinal directions of 308 aquatic turtles entering and exiting Holt Pond at Ichauway,
Baker County Georgia, 2003-2013……….….…………………………………………..68
Table 3-5: Mean distances to nearest permanent body of water and depressional wetland for
aquatic turtle species captured on land at Ichauway, Baker County Georgia, 2003-2013.
Only data from species with >10 captures are displayed. Differences were considered
significant at α=0.05…………………..…………………………………………………69

X
Table 3-6: Analysis of maximum likelihood estimates of landcover types and road and edge
densities within 125-m buffers around T. scripta locations and random road points within
a 8736 ha study area at Ichauway, Baker County Georgia, 2003-2013. Differences were
considered significant at α=0.05……...…………………………………………...…..…70
Table 3-7: Logistic regression models used to investigate effects of overland habitat variables on
T. scripta overland movements on a 8736 ha study area at Ichauway, in Baker County,
Georgia. Models were evaluated with Akaike’s Information Criterion (Burnham and
Anderson, 2002), where k equals the number of parameters, AIC= 2k- 2 ln(L), ΔAIC is
the difference between each model and the best model, and wi is the Akaike weight of
each model……………………………………………………………………….....……71
Table 4-1: Mean body size (CL =carapace length), mass (g), and tracking data for 11 telemetered
male yellow-bellied sliders, T. scripta, and 14 (4 male, 10 female) common snapping
turtles, C. serpentina, at Ichauway, Baker County, Georgia, 2013……………..……….96
Table 4-2: Average percentage of locations and Wilcoxon rank sum Z test statistics in different
habitat types used by C. serpentina (n=162 locations) and T. scripta (n=162 locations) at
Ichauway, Baker County Georgia, 2013. Differences were considered significant at
α=0.05……………………………………………………………………….….…….….97
Table 4-3: Euclidean distance (ED) and least cost paths (LCP) distances (in m) and cost: distance
ratios for overland movements for 4 C. serpentina and 8 T. scripta at Ichauway, Baker
County Georgia, 2013………………...……………………………………….………....98

XI
LIST OF FIGURES
Page
Figure 2-1: Locations of the nine creek trap sites along a 24 km stretch of Ichawaynochaway
Creek and locations of 12 selected isolated wetlands at Ichauway, Baker County,
Georgia, 2012 and 2013…………………………………………………………………42
Figure 2-2: Monthly catch per unit effort (CPUE) for aquatic turtles across 12 wetland study sites
at Ichauway, Baker County, Georgia from July-October 2012 and February-June
2013………………………………………………………………………………..……..43
Figure 2-3: Mean number of turtle captures with standard error for creek and wetland study sites
at Ichauway, Baker County, Georgia, by sex and age class (age classes were adults and
juveniles, with juveniles being turtles that were too small to accurately determine sex;
Jensen et al. 2008)………………………………………………………………….....….44
Figure 3-1: Map of the study area of Ichauway used to model habitat associations of Trachemys
scripta during overland movements at Ichauway, Baker County, Georgia from 2003-
2013…………………………………..………………………………………….……….73
Figure 3-2: Aquatic turtle overland captures pooled by species and month at Ichauway, Baker
County Georgia, 2003-2013………………………………………...……….…………...74
Figure 3-3: Aquatic turtle overland captures pooled by species and year at Ichauway, Baker
County Georgia, 2003-2013……………………………………………...………………75
Figure 3-4: Aquatic turtle overland captures and cumulative rainfall (cm) at Ichauway, Baker
County Georgia, 2003-2013……………..………………………………………….……76
Figure 3-5: Daily aquatic turtle overland captures, rainfall (cm), and daily average temperature
(°C), at Ichauway, Baker County, Georgia from May 2012- June 2013…….…….…….77
Figure 4-1: Map of Ichauway, Baker County, Georgia, showing landcover types and
corresponding resistance values (1-90) for aquatic turtles moving overland used in
Linkage Mapper and CircuitScape modeling. Lower resistance values signify greater ease
of movement…………………………………………………………………………......99
Figure 4-2: Contour map of Wetland 0 at Ichauway, Baker County, Georgia, showing locations
of telemetered Chelydra serpentina and Trachemys scripta (white dots). Darker colors
represent lower elevation.…………………………...………………………………….100

XII
Figure 4-3: Contour map of Wetland 01 at Ichauway, Baker County, Georgia, showing locations
of telemetered Chelydra serpentina and Trachemys scripta (white dots). Darker colors
represent lower elevation……………………………………………………………….101
Figure 4-4: Contour map of Wetland 11 at Ichauway, Baker County, Georgia, showing locations
of telemetered Chelydra serpentina and Trachemys scripta (white dots). Darker colors
represent lower elevation……………………………………………………………….102
Figure 4-5: Contour map of Wetland 15 at Ichauway, Baker County, Georgia, showing locations
of telemetered Chelydra serpentina and Trachemys scripta (white dots). Darker colors
represent lower elevation……………………………………………………………….103
Figure 4-6: Contour map of Wetland 46 at Ichauway, Baker County, Georgia, showing locations
of telemetered Chelydra serpentina and Trachemys scripta (white dots). Darker colors
represent lower elevation……………………………………………………………….104
Figure 4-7: Contour map of Wetland 53 at Ichauway, Baker County, Georgia, showing locations
of telemetered Chelydra serpentina and Trachemys scripta (white dots). Darker colors
represent lower elevation……………………………………………………………….105
Figure 4-8: Contour map of Wetland 58 at Ichauway, Baker County, Georgia, showing locations
of telemetered Chelydra serpentina and Trachemys scripta (white dots). Darker colors
represent lower elevation……………………………………………………………….106
Figure 4-9: Contour map of Wetland 68 at Ichauway, Baker County, Georgia, showing locations
of telemetered Chelydra serpentina and Trachemys scripta (white dots). Darker colors
represent lower elevation……………………………………………………………….107
Figure 4-10: Current maps used to model probable movement between core habitat areas (blue
polygons) for adult Chelydra serpentina ID # 470 at Ichauway, Baker County, Georgia.
Warmer colors indicate areas with higher current density and greater ease of movement.
Black lines indicate roads……………………………………………………………....108
Figure 4-11: Current maps used to model probable movement between core habitat areas (blue
polygons) for adult Trachemys scripta ID # 1821 at Ichauway, Baker County, Georgia.
Warmer colors indicate areas with higher current density and greater ease of movement.
Black lines indicate roads……………………………………………………………....109
Figure 4-12: Current maps used to model probable movement between core habitat areas (blue
polygons) for adult Chelydra serpentina ID # 260 at Ichauway, Baker County, Georgia.
Warmer colors indicate areas with higher current density and greater ease of movement.
Black lines indicate roads……………………………………………………………....110
Figure 4-13: Current maps used to model probable movement between core habitat areas (blue
polygons) for adult Chelydra serpentina ID # 490 at Ichauway, Baker County, Georgia.
Warmer colors indicate areas with higher current density and greater ease of movement.
Black lines indicate roads……………………………………………………………....111

XIII
Figure 4-14: Current maps used to model probable movement between core habitat areas (blue
polygons) for adult Chelydra serpentina ID # 540 at Ichauway, Baker County, Georgia.
Warmer colors indicate areas with higher current density and greater ease of movement.
Black lines indicate roads…………………………………………………………..…..112
Figure 4-15: Current maps used to model probable movement between core habitat areas (blue
polygons) for adult Trachemys scripta ID # 1813 at Ichauway, Baker County, Georgia.
Warmer colors indicate areas with higher current density and greater ease of movement.
Black lines indicate roads……………………………………………………………....113
Figure 4-16: Current model used to map probable movement between core habitat areas (blue
polygons) for adult Trachemys scripta ID # 1814 at Ichauway, Baker County, Georgia.
Warmer colors indicate areas with higher current density and greater ease of movement.
Black lines indicate roads……………………………………………………………....114
Figure 4-17: Current maps used to model probable movement between core habitat areas (blue
polygons) for adult Trachemys scripta ID # 1815 at Ichauway, Baker County, Georgia.
Warmer colors indicate areas with higher current density and greater ease of movement.
Black lines indicate roads…………………………………………………………..…..115
Figure 4-18: Current maps used to model probable movement between core habitat areas (blue
polygons) for adult Trachemys scripta ID # 1817 at Ichauway, Baker County, Georgia.
Warmer colors indicate areas with higher current density and greater ease of movement.
Black lines indicate roads……………………………………………………………....116
Figure 4-19: Current maps used to model probable movement between core habitat areas (blue
polygons) for adult Trachemys scripta ID # 1824 at Ichauway, Baker County, Georgia.
Warmer colors indicate areas with higher current density and greater ease of movement.
Black lines indicate roads……………………………………………………………....117
Figure 4-20: Current maps used to model probable movement between core habitat areas (blue
polygons) for adult Trachemys scripta ID # 1825 at Ichauway, Baker County, Georgia.
Warmer colors indicate areas with higher current density and greater ease of movement.
Black lines indicate roads…………………………………………………………..…..118
Figure 4-21: Current maps used to model probable movement between core habitat areas (blue
polygons) for adult Trachemys scripta ID # 1851 at Ichauway, Baker County, Georgia.
Warmer colors indicate areas with higher current density and greater ease of movement.
Black lines indicate roads………………………………………………………………119
1
CHAPTER 1
Introduction and Literature Review
Introduction
The Southeastern Coastal Plain of the United States is a global hotspot of aquatic turtle
diversity due, in part, to the variety of available aquatic habitats (Smith et al., 2006; Buhlmann et
al., 2009a; Georgia Department of Natural Resources, 2009). The Dougherty Plain physiographic
district in southwestern Georgia has 12 species of freshwater turtles, which represents
approximately 4% of the world’s turtle diversity, and includes two state threatened species,
Barbour’s map turtle (Graptemys barbouri) and alligator snapping turtle (Macrochelys
temminckii; Georgia Department of Natural Resources, 2009). Despite the high diversity of
turtles, little is known about the basic spatial ecology and habitat selection by many species,
particularly in the streams and geographically isolated wetlands of the Dougherty Plain.
Reptiles around the world are experiencing population declines and approximately 42%
of all turtle species are threatened, primarily from habitat loss and degradation (Semlitsch and
Bodie, 1998; Gibbons et al., 2000; Buhlmann et al., 2009a). Aquatic turtle species are
particularly vulnerable to habitat degradation as many require both suitable aquatic and terrestrial
habitats. Many species are also at risk due to the increased mortality associated with overland
movements in developed areas (Gibbons, 1986; Buhlmann and Gibbons, 2001; Gibbs and
Shriver, 2002; Steen et al., 2006).

2
I trapped aquatic turtles in geographically isolated wetland and stream habitats and
collected turtles moving overland across a study site in the Dougherty Plain of Georgia during
2012 and 2013 in an effort to describe aquatic habitat use and overland movements by aquatic
turtles. The primary objectives of this thesis were to: 1) describe differences in aquatic turtle
assemblages in streams and wetlands in the Dougherty Plain of Georgia (Chapter 2); 2) use
detection probabilities and telemetry to identify important wetland variables predicting turtle
occupancy (Chapters 2 and 3); 3) examine patterns of overland movement and terrestrial habitat
associations of aquatic turtles (Chapter 3); and 4) generate theoretical corridors of terrestrial
movement among aquatic systems by turtles (Chapter 4).
Literature Review
Dougherty Plain and Aquatic Turtle Communities
The Dougherty Plain physiographic district is located within the Southeastern Coastal
Plain in southwestern Georgia. The region is characterized by karst topography with an
abundance of geographically isolated wetlands (Hendricks and Goodwin, 1952; Kirkman et al.,
2000; Kirkman et al., 2012). These wetlands are formed by the gradual dissolution of calcium
carbonate in the limestone bedrock, which causes depressions to develop; subsequent
accumulation of impermeable sand and clay layers ultimately allows the wetlands to pond water
(Hendricks and Goodwin, 1952). Geographically isolated wetlands are surrounded by uplands
and not directly connected to rivers and/or other more permanent bodies of water (Tiner, 2003).
These wetlands rely on rainfall to fill, and typically dry down in late spring and summer due to
evapotranspiration, which often excludes fish from the wetlands (Battle and Golladay, 2001).
Based on the dominant vegetation and soils, three types of isolated wetlands have been described

3
in the Dougherty Plain: cypress-gum swamps, cypress savannas, and grassy marshes (Kirkman et
al., 2000, Kirkman et al., 2012). Cypress-gum swamps typically have a longer hydroperiod than
grassy marshes and cypress savannas (Battle and Golladay, 2001). However, depending on
rainfall patterns wetlands may hold water or remain dry throughout the year.
In 2001, the U.S. Supreme Court heard the case of Solid Waste Agency of Northern
Cook County (SWANCC) versus the U.S. Army Corp of Engineers, and reinterpreted the Clean
Water Act to exclude jurisdiction over isolated wetlands, which are “not navigable” or are not
connected to navigable waters (Nadeau and Leibowitz, 2003). This court decision impacted
isolated wetlands by removing federal protection, despite the importance of these wetlands as
wildlife habitat (Gibbons, 2003; Kusler, 2001; Semlitsch and Bodie, 1998). In 2006, the
Supreme Court heard the case of Rapanos versus the United States and Carabell versus the U.S.
Army Corp of Engineers, and decided to restore federal jurisdiction over wetlands with a
“significant nexus” to navigable waters. However, this ruling lacked clarity, and the U.S.
Environmental Protection Agency and U.S. Army Corp of Engineers interpreted this to assert
jurisdiction over wetlands adjacent to navigable waters or those that have a significant nexus to
navigable waters (e. g., chemical, physical, biological; United States Fish and Wildlife Service,
2013). Previous studies have provided evidence for wildlife linkages among geographically
isolated wetlands (Gibbons, 2003; Roe et al., 2004; Subalusky, et al., 2009), but studies of
aquatic turtles are less common despite the diversity of turtles in geographically isolated
wetlands and navigable waters and their potential as examples of wildlife connectivity between
systems.
In addition to geographically isolated wetlands, the Dougherty Plain also is characterized
by deeply incised streams. Ichawaynochaway Creek is the stream ecosystem used in this study,
4
and is a tributary of the Flint River. Ichawaynochaway Creek receives groundwater inputs from
the upper Floridan aquifer in addition to precipitation and is characterized by numerous
limestone shoals and deep pools with sandy bottoms (Livingston, 1992). The creek originates in
a large swamp system and runs south for ~100 km through agricultural and forested lands before
emptying into the Flint River (Golladay et al., 2000).
The Dougherty Plain supports diverse assemblages of aquatic turtles that include two
state threatened species (i.e., Graptemys barbouri and Macrochelys temminckii; Georgia
Department of Natural Resources, 2009). Habitat specialists (e. g., Deirochelys reticularia and
G. barbouri; Gibbons and Greene, 1978; Jensen, 2008) and generalists (e.g., Trachemys scripta
and Chelydra serpentina; Ernst et al., 1984; Gibbons, 1990) are both represented in the turtle
assemblage in the Dougherty Plain.
Land Use Trends
The southeastern Coastal Plain historically was dominated by longleaf pine (Pinus
palustris) forests noted for their plant and animal diversity (Guyer and Bailey, 1993). Today less
than 3% of the original longleaf pine remains due to historical harvest, followed by conversion to
agriculture and commercial pine stands or urbanization (Frost, 1993; Noss et al., 1995).
Agriculture is now the dominant land use in southwestern Georgia, with extensive farming of
cotton, peanuts, soybeans, and corn (Ward et al., 2005). These practices have impacted aquatic
systems in the region. In the past 6 decades geographically isolated wetlands have been
converted to cropland or farm ponds, with additional fragmentation of forested corridors both
between wetlands, and between wetlands and streams (Martin, 2010; Martin et al., 2013; Stuber,
2013). Sterrett et al. (2011) found loss of riparian forest cover from agricultural practices to be

5
detrimental to turtle species abundance and species composition. Specifically, generalist species
including yellow-bellied slider (Trachemys scripta) were more abundant in stream reaches with
less adjacent forest, whereas, dietary specialists including Barbour’s map turtle (G. barbouri)
were less abundant in these reaches than in more forested reaches (Sterrett et al., 2011) . In
addition, since the 1970’s there have been increasing surface and groundwater withdrawals for
crop irrigation in the Dougherty Plain (Rugel et al., 2009). These withdrawals have been shown
to significantly decrease stream flows in Ichawaynochaway Creek, especially during late spring
and summer when crop irrigation is most prevalent (Golladay et al., 2004; Rugel et al., 2012).
Runoff from agricultural irrigation can create temporary wetlands that potentially attract aquatic
turtles during dry periods when water levels in river and wetlands habitats are decreased. These
agricultural wetlands and surrounding agricultural landscape can be detrimental to turtle
movements among natural and man-made aquatic habitats. These landscapes are often
fragmented with little to no protective vegetative cover and offer poor quality aquatic habitats
(Moll and Moll, 2004). Additionally, the slow moving nature of turtles renders them vulnerable
to injury or death from agricultural machinery (Bowne et al., 2006; Erb and Jones, 2011;
Saumure et al., 2007).
Aquatic Turtle Ecology
Aquatic turtles make up a large proportion of all extant turtle species and are present on
every continent except Antarctica (Moll and Moll, 2004; Van Dijk et al., 2012). Aquatic turtles
occupy diverse ecosystems and vary widely in life history. Specialists typically have narrow
habitat preferences and/or diets, while generalists tend to occupy a wide variety of aquatic
habitats, and through their movements have the potential to link otherwise isolated systems
(Lundberg and Moberg, 2003; Moll and Moll, 2004). All aquatic turtles, regardless of life history
6
strategies, move overland at least once in their lifetimes. Female turtles nest on land, and
hatchling turtles disperse from nests to aquatic habitats. Some species use terrestrial habitats for
overwintering, and many turtles move overland between freshwater ecosystems, including rivers,
ponds, and wetlands in search of food, mates, or other resources (Gibbons, 1990, Gibbons, 2003;
Tuberville et al., 1996). Thus, landscape connectivity and movement corridors may be important
to conserve turtle populations, as certain land-use types and roadways are causes of mortality in
aquatic turtles (Erb and Jones, 2011; Gibbs and Shriver, 2002; Gibbs and Steen, 2004).
Habitat specialists in the Dougherty Plain include chicken turtles (Deirochelys
reticularia) and eastern mud turtles (Kinosternon subrubrum). Classified as isolated wetland
specialists, they use terrestrial systems extensively by overwintering in upland nests as
hatchlings, while males and females of all ages aestivate in upland habitat during drought
(Skorepa and Ozment, 1968; Bennett, 1972; Gibbons, 1983; Buhlmann et al., 2009b). In contrast,
river specialists (i. e., M. temminckii, Sternotherus minor, Apalone spinifera, and G. barbouri),
typically move aquatically and generally only females travel overland to nest (Steen et al., 2012).
Generalist species (e. g., T. scripta, Chelydra serpentina) use both lotic and lentic systems and
often travel long distances. Understanding the extent to which turtles use different aquatic
habitats is important to manage and develop conservation strategies for turtle diversity in the
Southeast. Furthermore, understanding the degree to which certain species move among isolated
depressional wetland and stream systems is important as these species may show important
biological connections between systems, as has been recently demonstrated with the American
alligator (Alligator mississippiensis; Subalusky et al., 2009).

7
Literature Cited
Battle, J. and S.W. Golladay. 2001. Water quality and macroinvertebrate assemblages in three
types of seasonally inundated limesink wetlands in southwest Georgia. Journal of
Freshwater Ecology 16: 189-207.
Bennett, D. H. 1972. Notes on the terrestrial wintering of mud turtles (Kinosternon subrubrum).
Herpetologia 28: 245-247.
Bowne, D. R., M. A. Bowers, and J. E. Hines. 2006. Connectivity in an agricultural landscape as
reflected by interpond movements of a freshwater turtle. Conservation Biology 20: 780-
791.
Buhlmann, K. A. and J. W. Gibbons. 2001. Terrestrial habitat use by aquatic turtles from a
seasonally fluctuating wetland: implications for wetland conservation boundaries.
Chelonian Conservation and Biology 4: 115-127.
Buhlmann, K. A., S. B. Akre, J. B. Iverson, D. Karapatakis, R. A. Mittermeier, A. Georges, A.
G. Rhodin, P. P. Van Dijk, and J. W. Gibbons. 2009a. Global analysis of tortoise and
freshwater turtle distributions with identification of priority conservation areas.
Chelonian Conservation and Biology 8: 116-149.
Buhlmann, K. A., J. D. Congdon, J. W. Gibbons, and J. L. Greene. 2009b. Ecology of chicken
turtles (Deirochelys reticularia) in a season al wetland ecosystem: exploiting resource
and refuge environments. Herpetologica 65: 39-53.

8
Erb, L. and M. T. Jones. 2011. Can turtle mortality be reduced in managed fields? Northeastern
Naturalist 18: 489-496.
Ernst, C., J. Lovich, and R. Barbour. 1994. Turtles of the United States. Smithsonian Institution
Press. Washington, DC.
Frost, C.C. 1993. Four centuries of changing landscape patterns in the longleaf pine ecosystem.
Pp 17-43. In Proceedings of the 18th Tall Timbers fire ecology conference. Tall Timbers
Research Station, Tallahassee, FL.
Georgia Department of Natural Resources. 2009. Rare species profiles. Available online at
www.georgiawildlife.com/node/2223/.
Gibbs, J. P. and W. G. Shriver. 2002. Estimating the effects of road mortality on turtle
populations. Conservation Biology 16: 1647-1653.
Gibbs, J. P. and D. A. Steen. 2005. Trends in sex ratios of turtles in the United States:
implications of road mortality. Conservational Biology 19: 552-556.
Gibbons, J. W. 1986. Movement patterns among turtle populations: applicability to management
of the desert tortoise. Herpetologia 42: 104-113.
Gibbons, J.W. 1990. Turtle studies at SREL: A research perspective. Pp. 19-44. In: Gibbons, J.
W. (ed.) Life History and Ecology of the Slider Turtle. Smithsonian Institution Press,
Washington, DC.
Gibbons, J. W. 2003. Terrestrial habitat: A vital component for herpetofauna of isolated
wetlands. Wetlands 23: 630-635.

9
Gibbons, J. W. and J. L. Greene. 1978. Selected aspects of the ecology of the chicken turtle,
/Dieirochelys reticularia/ (Lateille) (Reptilia, Testudines, Emydidae). Journal of
Herpetology 12: 237-242.
Gibbons, J. W., J. L. Greene, and J. D. Congdon. 1983. Drought-related responses of aquatic
turtle populations. Journal of Herpetology 17:242-246.
Gibbons, J.W., D.E. Scott, T.J. Ryan, K.A. Buhlmann, T.D. Tuberville, B.S. Metts, J.L. Greene,
T. Mills, Y. Leiden, S. Poppy, and C.T. Winne. 2000. The Global Decline of Reptiles:
Déjà vu Amphibians. Bioscience 50: 653-666.
Golladay, S. W., P. Gagon, M. Kearns, J. M. Battle, and D. W. Hicks. 2004. Response of
freshwater mussel assemblages (Bivalvia: Unionidae) to record drought in the Gulf
Coastal Plain of southwest Georgia. Journal of the North American Benthological Society
23:494-506.
Golladay, S. W., K. Watt, S. Entrekin, and J. Battle. 2000. Hydrological and geomorphic
controls on suspended particulate organic matter concentration and transport in
Ichawaynochaway Creek, Georgia, USA. Archiv fur Hydrobiologie 149:655-678.
Guyer, C. and M. A. Bailey. 1993. Amphibians and reptiles of longleaf pine communities. Pp.
130-158 In The Longleaf Pine Ecosystem: Ecology, Restoration and Management.
Hermann, S. M. (Ed.) Tall Timbers Research Station, Tallahassee, FL.
Hendricks, E.L and M.H. Goodwin. 1952. Water-level fluctuations in limestone sinks of
southwestern Georgia. U.S. Geological Survey Water-Supply Paper 1110-E.

10
Jensen, J. J., C. D. Camp, J. Gibbons, and M. J. Elliott, (eds.). 2008. Amphibians and reptiles of
Georgia. University of Georgia Press, Athens, GA.
Kirkman, L. K., P. C. Goebel, L. West, M. B. Drew, and B. J. Palik. 2000. Depressional wetland
vegetation types: a question of plant assemblage development. Wetlands 20: 373-385.
Kirkman, L. K., L. L. Smith, and S. W. Golladay. 2012. Southeastern depressional wetlands. Pp.
203-215. In D. A. Batzer and A. H. Baldwin (eds.) Wetland Habitats of North America:
Ecology and Conservation Concerns. University of California Press, Berkeley, CA.
Kusler, J. 2001. The SWANCC decision and state regulation of wetlands. Available online at
www.aswm.org
Livingston, R .J. 1992. Medium-sized Rivers of the Gulf Coastal Plain. Pp. 351-385. In C. T.
Hackney, S. M. Adams, and W. H. Martin. (eds.) Biodiversity of the Southeastern United
States: Aquatic Communities. John Wiley and Sons, New York, NY.
Lundberg, J. and F. Moberg. 2003. Mobile link organisms and ecosystem functioning:
implications for ecosystem resilience and management. Ecosystems 6: 87-98.
Martin, G. I. 2010. Evaluating the location, extent, and condition of isolated wetlands in the
Dougherty Plain, Georgia, USA. Master’s Thesis, University of Georgia, Athens, GA.
Martin, G. I., J. A. Hepinstall, and L. K. Kirkman. 2013. Six decades (1948 - 2007) of landscape
change in the Dougherty Plain of Southwest Georgia, USA. Southeastern Geographer 53.
Moll, D. and E. O. Moll. 2004. The Ecology, Exploitation, and Conservation of River Turtles.
Oxford University Press, Oxford, NY.
11
Nadeau, T. L. and S. G. Leibowitz. 2003. Isolated Wetlands: in introduction to the special issue.
Wetlands 23: 471-474.
Noss, R.F., E.T. LaRoe and J.M. Scott. 1995. Endangered ecosystems of the United States: a
preliminary assessment of loss and degradation. U.S. Department of Interior National
Biological Service, Biological Report 28.U.S. Department of Interiors, Washington, D.C.
Roe, J. K., B. A. Kingsbury, and N. R. Herbert. 2004. Comparative water snake ecology:
conservation of mobile animals that use temporally dynamic resources. Biological
Conservation 118: 79-89.
Rugel, K., C. R. Jackson, J. J. Romeis, S. W. Golladay, D. W. Hicks, and J. F. Dowd. 2012.
Effects of irrigation withdrawals on streamflows in a karst environment: lower Flint
River Basin, Georgia, USA. Hydrological Processes 26: 523-534.
Rugel, K., J. Romeis, C. R. Jackson, S. W. Golladay, D. W. Hicks, and J. F. Dowd. 2009. Use of
historic data to evaluate effects of pumping stress on streams in Southwest Georgia.
Proceedings of the 2009 Georgia Water Resources Conference. Athens, GA.
Saumure, R. A., T. B. Herman, and R. D. Titman. 2007. Effects of haying and agricultural
practices on a declining species: the North American wood turtle (Glyptemys insculpta).
Biological Conservation 135: 565-575.
Semlitsch, R. D. and J. R. Bodie. 1998. Are small, isolated wetlands expendable? Conservation
Biology 12: 1129-1133.
Skorepa, A. C. and J. E. Ozment. 1968. Habitats, habits, and variation of Kinosternon subrubrum
in southern Illinois. Transactions of the Illinois Academy of Science 61: 247-251.
12
Smith, L. L., D. A. Steen, J. M. Stober, M. C. Freeman, S. W. Golladay, L. M. Conner, and J.
Cochrane. 2006. The vertebrate fauna of Ichauway, Baker County, GA. Southeastern
Naturalist 5: 599-620.
Steen, D. A., M. J. Aresco, S. G. Beilke, B. W. Compton, E. P. Congdon, C. K. Dodd, H.
Forrester, J. W. Gibbons, J. L. Greene, G. Johnson, J. M. Langden, M. J. Oldham, D. N.
Oxier, R. A. Saumure , F. W. Schueler, J. M. Sleeman, L. L. Smith, J. K. Tucker, and J.
P. Gibbs. 2006. Relative vulnerability of female turtles to road mortality. Animal
Conservation 206: 269-273.
Steen, D. A., J.P. Gibbs, K.A. Buhlmann, J.L. Carr, B.W. Compton, J.D. Congdon, J.S. Doody,
J.C. Godwin, K.L. Holcomb, D.R. Jackson, F.J. Janzen, G. Johnson, M.T. Jones, J.T.
Lamer, T.A. Langen, M.V. Plummer, J.W. Rowe, R.A. Saumure, J.K. Tucker, D.S.
Wilson. 2012. Terrestrial habitat requirements of nesting freshwater turtles. Biological
Conservation 150: 121-128.
Sterrett, S.C., L.L. Smith, S.W. Golladay, S.H. Schweitzer, and J.C. Maerz. 2011. The
conservation implications of riparian land use on river turtles. Animal Conservation
14:38-46.
Stuber, O. S. 2013. The relationship between land use and the ecological integrity of isolated
wetlands in the Dougherty Plain, Georgia, USA. M. S. Thesis. University of Georgia.
Subalusky, A. L., L. A. Fitzgerald, and L. L. Smith. 2009. Ontogenetic niche shifts in the
American alligator establish functional connectivity between aquatic systems. Biological
Conservation 142: 1507-1514.
13
Tiner, R. W. 2003. Geographically isolated wetlands of the United States. Wetlands 23: 494-51.
Tuberville, T. D., J.W. Gibbons, J.L Greene. 1996. Invasion of new aquatic habitats by male
freshwater turtles. Copeia 1996: 713-715.
United States Fish and Wildlife Service. 2013. The Rapanos / Carabell supreme court decision
and implications for jurisdiction under the clean water act. Available online at
http://www.fws.gov/habitatconservation/rapanos_carabell/rapanos_carabell.html
Van Dijk, P. P., J. B. Iverson, H. B. Shaffer, R. Bour, and A. G. J. Rhodin. 2012. Turtles of the
world, 2012 update: annotated checklist of taxonomy, synonomy, distribution, and
conservation status. Chelonian Research Monographs 5: 243-328.
Ward, G. M., P. M. Harris, and A. K. Ward. 2005. Gulf Coast rivers of the Southeastern United
States. Pp. 125-178. In Rivers of North America. Benke, A. C. and C. E. Cushing (eds.).
Elsevier Academic Press, Amsterdam, Netherlands.

14
CHAPTER 2
Aquatic Turtle Occupancy in Streams and Isolated Wetlands in the Coastal Plain of
Georgia
Introduction
The Southeastern Coastal Plain of the United States is a global hotspot of freshwater
turtle diversity due, in part, to diversity of available aquatic habitats (Buhlmann et al., 2009a). A
large proportion of turtle species are lotic, occurring in rivers, streams, and riparian swamps,
whereas geographically isolated wetlands (Tiner 2003) are primary habitat for other turtle
species. Several species occur in both streams and wetlands moving among them in response to
changing hydrologic conditions and life history requirements. An understanding of how turtle
species use different aquatic habitats is important in managing and developing conservation
strategies for turtle diversity. Further, an understanding of how species move is important as
these species may provide a wildlife link between different aquatic ecosystems, as has been
demonstrated with the American alligator (Subalusky et al., 2009).
Within the southeastern U.S., the Dougherty Plain physiographic district in Southwest
Georgia is characterized by karst topography dominated by Ocala limestone that has resulted in
an abundance of geographically isolated wetlands. These wetlands are formed by the dissolution
of calcium carbonate in the limestone bedrock, which causes depressions to develop over time;
the accumulation of impermeable sand and clay layers over time ultimately allows the wetlands
to pond water (Hendricks and Goodwin, 1952; Kirkman et al., 2012a). By definition,

15
geographically isolated wetlands are surrounded by uplands and not directly connected to rivers
and/or other more permanent bodies of water (Tiner, 2003). These wetlands rely on rainfall to
fill, and generally dry down in late spring and summer due to evapotranspiration (Battle and
Golladay, 2001). Based on the dominant vegetation, three types of geographically isolated
wetlands have been described in the Dougherty Plain: cypress-gum swamps, cypress savannas,
and grassy marshes (Kirkman et al., 2000). Of the 12 freshwater turtle species in the region, four
species, the Florida softshell (Apalone ferox), chicken turtle (Deirochelys reticularia), eastern
mud turtle (Kinosternon subrubrum), and common musk turtle (Sternotherus odoratus) are
considered wetland specialists (Gibbons, 1983; Buhlmann and Gibbons, 2001; Buhlmann et al.,
2009b). Chicken turtles and eastern mud turtles aestivate in upland habitats surrounding
geographically isolated wetlands during drought and winter (Skorepa and Ozment, 1968;
Gibbons, 1983; Gibbons and Greene, 1978; Buhlmann and Gibbons, 2001; Buhlmann et al.,
2009b). Other wetland species include the common snapping turtle (Chelydra serpentina),
Florida cooter (Pseudemys floridana), and yellow-bellied slider (Trachemys scripta); however,
these turtles also use other aquatic systems, such as streams, in addition to geographically
isolated wetlands (Smith et al., 2006; Jensen et al., 2008) and often move overland between
aquatic ecosystems (Steen et al., 2010).
Agricultural land use has significantly impacted streams and wetland ecosystems in the
Dougherty Plain. Many geographically isolated wetlands have been lost or degraded in the past
six decades by conversion of wetlands to cropland or farm ponds and fragmentation of forested
corridors between wetlands and between wetlands and streams (Martin, 2010; Martin et al.,
2013, Stuber, 2013). Since the 1970’s, there have been increasing surface and groundwater
withdrawals in the Dougherty Plain for agricultural irrigation (Rugel et al., 2009). These

16
withdrawals significantly decrease stream flows in Ichawaynochaway Creek, especially during
droughts and in late spring and summer when crop irrigation is most prevalent (Golladay et al.,
2004; Rugel et al., 2012).
Given habitat diversity in the Dougherty Plain and recent land use changes affecting
wetlands and streams, my objective was to determine which ecosystems were used most often by
different turtle species. Sterrett et al. (2011) described differences in the aquatic turtle
assemblages of streams in the region related to differences in surrounding land use. However,
little is known about the effects of land use and landscape characteristics of geographically
isolated wetlands on turtles. Therefore, I used an occupancy modeling approach to identify
important variables in predicting turtle occurrence and to assist in identifying high priority
wetland habitat for conservation (MacKenzie et al., 2002). The study was initiated during a
significant regional drought, followed by a period of above average rainfall (Georgia Automated
Environmental Monitoring Network, www.Georgiaweather.net). Thus, I expected captures of
generalist species to initially be greater in the creek than in wetlands because it provided more a
more stable aquatic habitat. Likewise, I expected turtle occupancy of wetlands to be negatively
related to distance to the creek.
Methods
Study Area
The study took place at Ichauway, the 11,300 ha research site of the Joseph W. Jones
Ecological Research Center, which is located in the Dougherty Plain physiographic district in
southwestern Georgia. Ichauway is managed for the longleaf pine (Pinus palustris) forest with
native groundcover. There are more than 90 geographically isolated wetlands on Ichauway,
including both cypress-gum swamps and grassy marshes (Kirkman et al., 2000, Kirkman et al.,

17
2012a). Cypress-gum swamps have organic soils and a dense canopy of pond cypress (Taxodium
ascendens) and swamp tupelo (Nyssa biflora) with little to no understory. Grassy marshes have
sandy soils and an open canopy and understory of panic grasses (Panicum spp.) and cutgrass
(Leersia hexandra; Kirkman et al., 2000). These wetlands typically draw down during late spring
to fall, and fill during winter and early spring; cypress-gum swamps typically have a longer
hydroperiod than grassy marshes (Battle and Golladay, 2001). However, depending on rainfall
patterns geographically isolated wetlands may hold water or remain dry throughout the year.
Ichauway is bordered on the east by a 21 km stretch of the Flint River and a 24 km stretch of
Ichawaynochaway Creek runs through the center of the property.
Field Sampling
Field sampling took place from July-October 2012 and February-June 2013 at nine sites
along Ichawaynochaway Creek. I attempted to distribute sampling sites at even intervals along
the creek, but sites were ultimately placed from 1 to 6 km apart based on accessibility (Figure 2-
1). I sampled 12 geographically isolated wetlands that were selected with varying distance from
Ichawaynochaway Creek, vegetation type, and size (Figure 2-1). I sampled six cypress-gum
swamps and six grassy marshes, with three of each within 2 km of the creek (short distance) and
three >2.5 km from the creek (long distance). I sampled three large wetlands (cypress gum
swamps >5 ha, grassy marshes >3 ha) and three small wetlands (cypress gum swamps <5 ha,
grassy marshes <3 ha).
Creek and wetland sites were sampled during a drought from July through October 2012,
and during a drought recovery period above normal rainfall from February through June 2013
(Georgia Automated Environmental Monitoring Network, www.Georgiaweather.net). Sites were
sampled twice a month using two hoop traps (0.9 m diameter, four hoops, 3.8 cm mesh;
18
Memphis Net and Twine, Memphis, TN, USA) baited with pig liver for five consecutive days
(four trap nights per session; eight trap nights per site). Traps were checked once a day. I also
hand captured several turtles observed at the sites during trapping sessions. These “incidentally”
captured turtles were included in the data set as captures.
All turtles captured were identified to species and were marked either by drilling (turtles
caught in creek) or notching (turtles caught in wetlands) a unique combination of marginal scutes
(Cagle, 1939). Softshell turtles (Apalone spp.) were notched (Plummer, 2008) and hatchlings and
small juveniles of all species were marked with alpha-numeric tags (1.2 mm x 2.7 mm,
Northwest Marine Technologies, Shaw Island, WA, USA), which were attached to the plastron
using super glue (Loctite, Henkel Corporation, Rocky Hill, CT, USA). For each capture I
recorded the site, capture date, capture session, ID number, recapture status, sex, reproductive
status (females were hand-palpated to see if they carried shelled eggs; Cagle, 1944), age class
(adult, juvenile), mass (g), plastron length (mm), carapace length (CL; mm), and any injuries or
abnormalities. Age class was determined based on descriptions in Jensen et al. (2008). In
addition, wetland and creek water levels during trapping sessions were obtained via wetland staff
gauges (Jones Center Monitoring Data, unpublished) and U.S. Geological Survey stream gauge
data (www.nwis.waterdata.usgs.gov).
Data Analysis
Turtle Trapping
Total and mean catch per unit effort (CPUE) were calculated for the 12 study wetlands
and the nine sampling sites on Ichawaynochaway Creek. I calculated estimated species richness
in wetlands and the creek based on hoop trap and incidental captures. Species richness estimates

19
(Chao 1 and 2; Chao et al., 2005) and Bray-Curtis abundance-based similarity indices were
calculated using Estimate S software (Ver. 9.1.0; Colwell, 2013).
Wetland Turtle Occupancy
The 12 study wetlands were categorized by vegetation type (V): cypress gum swamps
and grassy marshes (Kirkman et al., 2000). ArcGIS (Ver. 9.2, ESRI, Redlands, CA, USA) was
used to calculate the size of each study wetland in hectares (S), as well as the distance in meters
(D) from the wetland to Ichawaynochaway Creek using the near function tool. Water depth was
measured twice monthly as part of a long term monitoring (unpublished data). I used these data
to calculate the percent of time each wetland was inundated (IN) from June 2012-June 2013. I
included isolation indices (Si) for each wetland in occupancy models (Kirkman et al., 2012b).
The equation for the isolation index was as follows, where higher absolute values of Si signified
less isolated wetlands (Hanski and Thomas, 1994):
ij))
where α = 1 (constant for strength of distance and area affects); dij = distance (km) between focal
wetland i to j through n = 11. I created two buffers around wetlands, one with a 200 m radius
and one with a 1000 m radius using ArcGIS. The 200 m buffer was used to describe local scale
characteristics surrounding the wetlands. The 1000 m buffer represented the landscape scale.
Buffers were clipped to existing landcover and I categorized land cover within each buffer zone
as forested or non-forested. Forested landcover types included pine (e.g., Pinus palustris, P.
elliottii, P. taeda), and hardwoods, which were primarily oaks (e.g., Quercus alba, Q. geminata,
Q. falcata, Q. laevis). Wildlife food plots, roads, oak scrub, open water, non forested wetlands,
and agriculture were all considered non-forested. These variables (Table 2-1) were used to
develop 18 a priori models: a global model, null model, a model for each of the six variables,

20
and 2 post priori models, which were tested for an interaction between the top two candidate
models (Tables 2-2, 2-3). These models were used to identify landscape and local scale variables
that best predicted turtle occurrence and species richness. I hypothesized that wetland inundation
and isolation would be the two most important variables for explaining turtle occupancy in
wetlands, with wetlands having longer annual inundation periods and less isolating having the
highest turtle occupancy. I used two sets of capture data to test the models, one using
presence/absence data for all species except T. scripta (N=13 captures of 7 species), and one for
only T. scripta, the most frequently captured species (N=35). I was unable to use
presence/absence data for other species due to low capture numbers. Drought conditions during
in the first year of field sampling left the majority of the wetlands dry; therefore, I used only data
from February-June 2013, when 11 of the 12 wetlands were inundated. I excluded one wetland
from analysis because the water was too shallow to place traps in. Models were developed using
Program Presence (Ver. 6.1) with the Single Season Model (MacKenzie et al., 2002) to estimate
detection and site occupancy. Due to small sample size, I used a second-order Akaike’s
Information Criteria (AICC) to evaluate the models.. I considered the model with the lowest AICC
to be the best model from each set, and included the top three models as the best set of candidate
models (Burnham and Anderson, 2002).
Results
Turtle Trapping
Total trapping effort for the creek was 1080 trap-nights (8 trap-nights x 15 sampling
sessions x 9 sites; Table 2-4). I captured 89 individuals for a total of 103 captures (recapture rate:
12.62%), with a mean of 11.4 ± 7.9 captures per site (range 2-22). The mean CPUE across all
trap sites on the creek was 0.095 turtles. Trapping effort for individual wetlands varied due to

21
fluctuating water levels throughout the study; effort ranged from 8-112 trap-nights with a total
CPUE of 0.077 turtles (Table 2-5). A total of 67 turtles, representing 50 individuals, were
captured (recapture rate: 23.88%, with a mean across all wetland sites of 5.5 ± 5.46 captures per
site (range 0-17). Catch per unit effort was highest in July 2012 and in May and June 2013
(Figure 2-2).
I captured seven species of turtles in Ichawaynochaway Creek (Table 2-6) and seven
species in isolated wetlands (Table 2-7). The Chao2 estimate of species richness for the creek
was 7 (95%CI: 7.14-8.09), while the Chao2 estimate of species richness for isolated wetlands
was 7.93 (95%CI: 7.07-19.77). Two species, T. scripta and C. serpentina occurred in both the
creek and wetlands (Table 2-8). The Bray-Curtis abundance-based similarity index for turtle
species between the creek and wetlands was 0.564. The sex ratio (males: females) of turtles
captured on the creek and wetlands were 1.33:1 and 1:1, respectively (Figure 2-3). Juvenile
turtles represented 7.4% of creek captures and 5.8% of wetland captures. The smallest turtles
captured in the creek and wetlands were two juvenile T. scripta (creek, CL = 33 mm, 7 g;
wetland, CL=47 mm; 20 g).
Wetland Turtle Occupancy
The best fitting model (wi= 0.5570) for predicting wetland-specific detection and
occupancy across all sampled wetlands for all species except T. scripta was percent forest cover
within a 1000 m buffer (Table 2-9). This model estimated overall occupancy as 0.9796 (Table 2-
10), and predicted that detection probability decreased with an increase in surrounding forest
cover within a 1000 m buffer. For T. scripta, the species with the highest captures, the best
model (wi= 0.3967) included the variable wetland size (S; Table 2-11). This model estimated an
overall occupancy of 0.8353 (Table 2-12), and predicted that detection probability increased with

22
decrease in wetland size. Other competing models included interactions between wetland size,
distance to creek, isolation, and percent forest cover within a 1000 m buffer. There was a weak
negative relationship between surrounding % forest cover and all species turtle captures (R= -
0.67, R2= 0.45), but no relationship between T. scripta captures and wetland size (R= -0.50, R
2=
0.25).
Discussion
My results suggested that both isolated wetlands and lotic systems supported somewhat
different turtle species, and collectively, the two habitats supported high regional turtle species
richness. I found A. ferox, D. reticularia, K. subrubrum, P. floridana, and S. odoratus only in
isolated wetlands and A. spinifera, G. barbouri, M. temminckii, P. concinna, and S. minor only
within the creek. The only species of turtle that were caught in both ecosystems were T. scripta
and C. serpentina. The majority of the geographically isolated wetlands in the study area were
dry for some portion of the study period. However, some species of turtles were able to persist in
wetlands during these dry periods. For example, I had a reasonably high recapture rate of T.
scripta within wetlands (24%). In addition, several C. serpentina were discovered aestivating in
mud in deep areas of several dry cypress gum swamps, and one radio-tagged individual used the
burrow of an American alligator (Alligator mississippiensis) in a cypress gum swamp (e.g.,
Chapter 3). Catch per unit effort was high in July 2012 when several wetlands retained water but
decreased throughout the remainder of the year. Once wetlands began to fill during spring 2013,
turtle detection and catch per unit effort rapidly increased (Figure 2-2).
Occupancy models for all species showed that percent forest cover in the 1000 m buffer
was the most important variable explaining the occurrence of all species except T. scripta. This
relationship was negative, which did not support my hypothesis that wetlands with greater

23
surrounding forest cover would have higher detections of turtles than those with lower forest
cover. This relationship likely resulted because the study wetlands with the highest captures were
close to the boundary of Ichauway, and thus the 1000m buffer included non-forested agricultural
lands. Wetland size was an important predictor of occupancy by T. scripta; however, I feel that
this finding may have been an artifact of increased capture success (CPUE) in smaller wetlands
than large wetlands. I was surprised that wetland isolation did not appear to influence turtle
presence; however, T. scripta, the most commonly detected species in this study, is capable of
long distance overland movements (Chapter 3; Morreale et al., 1984).
It is important to note that the wetland occupancy models developed for this study were
limited by low numbers of captures, which were likely related to the long term regional drought
(United States Drought Monitor, 2012). The occupancy models were also skewed by the large
proportion of T. scripta captures (>70% of all captures). T. scripta is a widespread generalist
species that can persist in many different aquatic habitats of varying quality and does not likely
represent the regional turtle species assemblage in terms of wetland habitat selection and
adaptations to drought (Ernst et al. 1994).
Overall, both isolated wetlands and streams are important for supporting a diverse turtle
assemblage in the Southeastern Coastal Plain. Geographically isolated wetlands supported a
different turtle assemblage than Ichawaynochaway Creek, despite drought conditions during a
large portion of this study (United States Drought Monitor, 2012). Identification of local and
landscape variables most important to supporting isolated wetland turtle assemblages will require
additional study.

24
Literature Cited
Battle, J. and S.W. Golladay. 2001. Water quality and macroinvertebrate assemblages in three
types of seasonally inundated limesink wetlands in southwest Georgia. Journal of
Freshwater Ecology 16: 189-207.
Buhlmann, K. A. and J. W. Gibbons. 2001. Terrestrial habitat use by aquatic turtles from a
seasonally fluctuating wetland: implications for wetland conservation boundaries.
Chelonian Conservation and Biology 4: 115-127.
Buhlmann, K. A., S. B. Akre, J. B. Iverson, D. Karapatakis, R. A. Mittermeier, A. Georges, A.
G. Rhodin, P. P. Van Dijk, and J. W. Gibbons. 2009a. Global analysis of tortoise and
freshwater turtle distributions with identification of priority conservation areas.
Chelonian Conservation and Biology 8: 116-149.
Buhlmann, K. A., J. D. Congdon, J. W. Gibbons, and J. L. Greene. 2009b. Ecology of chicken
turtles (Deirochelys reticularia) in a season al wetland ecosystem: exploiting resource
and refuge environments. Herpetologica 65: 39-53.
Burnham, K. P., and D.R. Anderson. 2002. Model Selection and Multimodal Inference: A
Practical Information-Theoretic Approach, 2nd ed. Springer-Verlag, New York, NY.
Cagle, F.R. 1939. A system of marking turtles for future identification. Copeia 3: 170-173.
Cagle, F.R. 1944. A technique for obtaining turtle eggs for study. Copeia 1944: 60.

25
Chao, A., R.L. Chazdon, R.K. Colwell and T. Shen. 2005. A new statistical approach for
assessing similarity of species composition with incidence and abundance data. Ecology
Letters 8: 148-159.
Colwell, R.K. 2013. EstimateS: Statistical estimation of species richness and shared species from
samples. Department of Ecology & Evolutionary Biology, University of Connecticut,
Storrs, CT.
Ernst, C., J. Lovich, and R. Barbour. 1994. Turtles of the United States. Smithsonian Institution
Press. Washington, DC.
Gibbons, J. W. and J. L. Greene. 1978. Selected aspects of the ecology of the chicken turtle,
/Dieirochelys reticularia/ (Lateille) (Reptilia, Testudines, Emydidae). Journal of
Herpetology 12: 237-242.
Gibbons, J. W., J. L. Greene, and J. D. Congdon. 1983. Drought-related responses of aquatic
turtle populations. Journal of Herpetology 17:242-246.
Golladay, S. W., P. Gagon, M. Kearns, J. M. Battle, and D. W. Hicks. 2004. Response of
freshwater mussel assemblages (Bivalvia: Unionidae) to record drought in the Gulf
Coastal Plain of southwest Georgia. Journal of the North American Benthological Society
23:494-506.
Golladay, S. W., K. Watt, S. Entrekin, and J. Battle. 2000. Hydrological and geomorphic
controls on suspended particulate organic matter concentration and transport in
Ichawaynochaway Creek, Georgia, USA. Archiv fur Hydrobiologie 149:655-678.

26
Hanski, I. and C. D. Thomas. 1994. Metapopulation dynamics and conservation: a spatially
explicit model applied to butterflies. Biological Conservation 68: 167-180.
Hendricks, E.L and M.H. Goodwin. 1952. Water-level fluctuations in limestone sinks of
southwestern Georgia. U.S. Geological Survey Water-Supply Paper 1110-E.
Jensen, J. B., C. D. Camp, J. W. Gibbons, and M. J. Elliott. 2008. Amphibians and reptiles of
Georgia. Athens: University of Georgia Press, Athens, GA.
Kirkman, L. K., P. C. Goebel, L. West, M. B. Drew, and B. J. Palik. 2000. Depressional wetland
vegetation types: a question of plant assemblage development. Wetlands 20: 373-385.
Kirkman, L. K., L. L. Smith, and S. W. Golladay. 2012a. Southeastern depressional wetlands.
Pp. 203-215. In D. A. Batzer and A. H. Baldwin (eds.) Wetland Habitats of North
America: Ecology and Conservation Concerns. University of California Press, Berkeley,
CA.
Kirkman, L. K, L. L. Smith, P. F. Quintana-Ascencio, M. J. Kaeser, S. W. Golladay, and A. L.
Farmer. 2012b. Is species richness congruent among taxa? Surrogacy, complementarity,
and environmental correlates among three disparate taxa in geographically isolated
wetlands. Ecological Indicators 18: 131-139.
Livingston R .J. 1992. Medium-sized Rivers of the Gulf Coastal Plain. Pp. 351-385. In C. T.
Hackney, S. M. Adams, and W. H. Martin. (eds.) Biodiversity of the Southeastern United
States: Aquatic Communities. John Wiley and Sons, New York, NY.
27
Martin, G. I. 2010. Evaluating the location, extent, and condition of isolated wetlands in the
Dougherty Plain, Georgia, USA. Master of Science Thesis, University of Georgia,
Athens, GA.
Martin, G. I., J. A. Hepinstall, and L. K. Kirkman. 2013. Six decades (1948 - 2007) of landscape
change in the Dougherty Plain of Southwest Georgia, USA. Southeastern Geographer 53:
28-49.
MacKenzie, D. I., J. D. Nichols, G. B. Lachman, S. Droege, J. A. Royle and C. A. Langtimm.
2002. Estimating site occupancy rates when detection probabilities are less than one.
Ecology 83(8): 2248-2255.
Morreale, S.J., J. W. Gibbons, and J. D. Congdon. 1984. Significance of activity and movement
in the yellow-bellied slider turtle (Pseudemys scripta). Canadian Journal of Zoology.
62:1038-1042.
Plummer, M. V. 2008. A notching system for marking softshell turtles. Herpetological Review
39: 64-65.
Rugel, K., C. R. Jackson, J. J. Romeis, S. W. Golladay, D. W. Hicks, and J. F. Dowd. 2012.
Effects of irrigation withdrawals on streamflows in a karst environment: lower Flint
River Basin, Georgia, USA. Hydrological Processes 26: 523-534.
Rugel, K., J. Romeis, C. R. Jackson, S. W. Golladay, D. W. Hicks, and J. F. Dowd. 2009. Use of
historic data to evaluate effects of pumping stress on streams in Southwest Georgia.
Proceedings of the 2009 Georgia Water Resources Conference. Athens, GA.
28
Smith, L. L., D. A. Steen, J. M. Stober, M. C. Freeman, S. W. Golladay, L. M. Conner, and J.
Cochrane. 2006. The vertebrate fauna of Ichauway, Baker County, GA. Southeastern
Naturalist 5: 599-620.
Steen, D. A., S. C. Sterrett, A. M. Heupel, and L. L. Smith. 2010. Snapping turtle, Chelydra
serpentina, overland movements near the southeastern extent of its range. Georgia
Journal of Science 68: 196-201.
Sterrett, S. C., L. L. Smith, S. W. Golladay, S. H. Schweitzer, and J. C. Maerz. 2011. The
conservation implications of riparian land use on river turtles. Animal Conservation 14:
38-46.
Subalusky, A. L., L. A. Fitzgerald, and L. L. Smith. 2009. Ontogenetic niche shifts in the
American alligator establish functional connectivity between aquatic systems. Biological
Conservation 142: 1507-1514.
Tiner, R. W. 2003. Geographically isolated wetlands of the United States. Wetlands 23: 494-516.
29
Table 2-1. Land use and landcover variables used in occupancy models to explain occurrence of aquatic turtles in isolated wetlands at
Ichauway, at Ichauway, Baker County, Georgia. V= wetland vegetation type, D= distance (m) to creek, S= Size (ha), Si= isolation
index, IN= % annual inundation, %F200= percentage of 200 m buffer around wetland in forested landcover, %F1000= percentage of
1000 m buffer around wetland in forested landcover.
Wetland ID V D S Si IN %F200 %F1000
W01 Cypress gum swamp 3930 5.3 -8.9 100 64.14 45.38
W02 Cypress gum swamp 2532 2.7 -7.4 62.96 93.83 73.84
W04 Cypress gum swamp 1387 12.1 -7.2 77.77 86.28 73.12
W12 Cypress gum swamp 1040 4.7 -8.4 37.04 80.15 74.48
W15 Grassy marsh 1816 19.6 -6.4 25.93 83.95 62.19
W16 Grassy marsh 1992 14.4 -6.5 100 93.77 87.29
W36 Grassy marsh 3946 1.9 -14.2 29.63 68.72 70.69
W37 Grassy marsh 3981 0.9 -14.4 40.74 82.20 65.80
W42 Grassy marsh 3716 2.3 -12.5 62.96 79.33 59.94
W53 Grassy marsh 803 3.2 -4.9 59.26 33.04 61.06
W68 Cypress gum swamp 1233 6.7 -6.9 40.74 81.83 63.28

30
Table 2-2. Models used to evaluate turtle occupancy (all species except Trachemys scripta) in geographically isolated wetlands at
Ichauway, Baker County, Georgia. *Denotes –post priori model. Variables are vegetation type (V), distance to creek (D), size(S),
isolation (Si), annual inundation (IN), and % forested in 200 m buffer (%F). A hypothesis for each a-priori model is provided.
Model Hypotheses
V_D_S_Si_IN_%F (Global)
%F1000_Si*
All wetland variables are equally important for all species occupancy.
-post priori model
V Cypress gum swamps will have higher occupancy than grassy marshes.
D Wetlands closer to the creek will have higher occupancy.
S Larger wetlands will have higher occupancy.
Si Less isolated wetlands will have higher occupancy.
IN More inundated wetlands will have higher occupancy.
%F200 Wetlands with more surrounding forest cover on a local scale will have higher occupancy.
%F1000 Wetlands with more surrounding forest cover on a landscape scale will have higher
occupancy.
Constant P (Null) Wetland variables will not influence turtle wetland occupancy.

31
Table 2-3. Models used to evaluate Trachemys scripta) occupancy in isolated wetlands at Ichauway, Baker County, Georgia.. *
Denotes –post priori model. Variables are vegetation type (V), distance to creek (D), size(S), isolation (Si), annual inundation (IN),
and % forested in 200 m buffer (%F). A hypothesis for each a-priori model is provided.
Model Hypotheses
V_D_S_Si_IN_%F (Global) All wetland variables will have equal estimates for T. scripta occupancy
V Cypress gum swamps will have higher occupancy than grassy marshes.
D Wetlands closer to the creek will have higher occupancy.
S Larger wetlands will have higher occupancy.
Si Less isolated wetlands will have higher occupancy.
IN More inundated wetlands will have higher occupancy.
%F200 Wetlands with more surrounding forest cover at a local scale will have higher occupancy.
%F1000 Wetlands with more surrounding forest cover on a landscape scale will have higher
occupancy.
Constant P (Null) Wetland variables will not influence turtle wetland occupancy.

32
Table 2-4. Hoop trapping effort for aquatic turtles along a 24 km stretch of Ichawaynochaway
Creek, Baker County Georgia, 2012 and 2013. CPUE= catch per unit effort (#captures/trap
night).
Creek Site Trap Nights # Captures CPUE
1 120 22 0.18
2 120 16 0.13
3 120 2 0.02
4 120 15 0.13
5 120 12 0.1
6 120 9 0.08
7 120 4 0.03
8 120 2 0.02
9 120 22 0.18
Total: 1080 103 0.1
33
Table 2-5. Hoop trapping effort for aquatic turtles in 12 geographically isolated wetlands at
Ichauway, Baker County, Georgia, 2012 and 2013. CPUE= catch per unit effort (# captures/trap
night).
Wetland ID Trap Nights # Captures CPUE
1 96 11 0.12
2 56 4 0.07
4 112 17 0.15
12 56 0 0
15 32 2 0.06
16 112 4 0.04
32 8 0 0
36 32 0 0
37 56 8 0.14
42 56 12 0.21
53 56 3 0.05
68 72 6 0.08
Total: 744 67 0.08
34
Table 2-6. Aquatic turtle captures by both hoop trapping and incidental observations along a 24 km stretch of Ichawaynochaway
Creek, at Ichauway, Baker County, Georgia, 2012 and 2013. *Denotes total captures which accounts for aquatic turtles found
incidentally in study wetlands.
Site ID
A. fero
x
A. sp
inifera
C. serp
entin
a
D. reticu
laria
K.
subru
bru
m
G. b
arbouri
M.
temm
inck
ii
P. co
ncin
na
P. flo
ridan
a
S. m
inor
S. o
doratu
s
T. scrip
ta
Total
Captures *
Total Species
Richness*
1 0 0 0 0 0 1 1 1 0 4 0 17 22 5
2 0 2 0 0 0 1 1 5 0 1 0 7 17 6
3 0 0 0 0 0 8 0 1 0 2 0 1 12 4
4 0 0 0 0 0 0 0 1 0 1 0 14 16 3
5 0 2 0 0 0 0 0 1 0 0 0 10 13 3
6 0 0 0 0 0 2 2 2 0 1 0 1 8 5
7 0 0 0 0 0 0 0 1 0 0 0 3 4 2
8 0 0 0 0 0 2 0 0 0 0 0 3 5 2
9 0 0 1 0 0 0 0 4 0 2 0 15 22 4
Total: 0 4 1 0 0 14 4 16 0 11 0 71 121 7
35
Table 2-7. Aquatic turtle captures by hoop trapping and incidental observations in geographically isolated wetlands at Ichauway,
Baker County, Georgia, 2012 and 2013. *Denotes total captures which accounts for aquatic turtles found incidentally in study
wetlands.
Wetland
ID T. scrip
ta
C. serp
entin
a
K. su
bru
bru
m
S. o
doratu
s
D. reticu
laria
A. fero
x
A. sp
inifera
G. b
arbouri
M. tem
min
ckii
P. co
ncin
na
P. flo
ridan
a
S. m
inor
Total
Captures*
Total
Species
Richness*
W01 7 4 0 0 1 0 0 0 0 0 0 0 12 3
W02 4 0 0 0 0 0 0 0 0 0 0 0 4 1
W04 15 2 0 2 0 0 0 0 0 0 0 0 19 3
W12 2 0 0 0 0 0 0 0 0 0 0 0 2 1
W15 0 1 0 0 1 0 0 0 0 0 0 0 2 2
W16 1 0 0 1 1 1 0 0 0 0 1 0 5 5
W32 0 0 0 0 0 0 0 0 0 0 0 0 0 0
W36 0 0 1 0 0 0 0 0 0 0 0 0 1 1
W37 5 0 1 0 2 0 0 0 0 0 0 0 8 3
W42 12 0 0 0 0 0 0 0 0 0 0 0 12 1

36
W53 2 0 1 0 1 0 0 0 0 0 0 0 4 3
W68 6 0 0 1 0 0 0 0 0 0 0 0 7 2
Total 54 7 3 4 6 1 0 0 0 0 1 0 76 7

37
Table 2-8. Freshwater turtles captured in hoop net traps in twelve isolated wetlands and nine
creek sites at Ichauway, Baker County, Georgia in 2012 and 2013.
Scientific Name Common Name Isolated
Wetlands
Creek
Apalone spinifera Gulf coast spiny softshell X
Apalone ferox Florida softshell X
Chelydra serpentina Common snapping turtle X X
Deirochelys reticularia Chicken turtle X
Kinosternon subrubrum Mud turtle X
Graptemys barbouri Barbour’s map turtle X
Macrochelys temminckii Alligator snapping turtle X
Pseudemys concinna Eastern river cooter X
Pseudemys floridana Florida cooter X
Sternotherus minor Loggerhead musk turtle X
Sternotherus odoratus Eastern musk turtle X
Trachemys scripta Yellow-bellied slider X X

38
Table 2-9. Models explaining the effects of wetland variables on turtle presence for all species
excluding T. scripta in geographically isolated wetlands at Ichauway, Baker County, Georgia..
The number of predictor variables (K) in each model includes the intercept term. Models with
lower second order Akaike’s information criterion (AICC) and difference (Δ AICc) and greater
Akaike weights (wi) were more strongly supported by the data.
Model K AICC Δ AICC wi Model
likelihood
%F1000 2 106.28 0.0 0.56 1.00
%F1000_Si 3 108.38 2.10 0.19 0.35
%F1000_%F200 3 109.72 3.44 0.18 0.18
Null 1 110.39 4.11 0.13 0.13
%F200 2 112.30 6.02 0.03 0.05
Si 2 112.53 6.25 0.02 0.04
V 2 115.72 9.44 0.00 0.04
IN 2 130.56 24.28 0.00 0.00
D 2 136.80 30.52 0.00 0.00
Global 8 145.60 39.32 0.00 0.00
S 2 156.86 50.58 0.00 0.00

39
Table 2-10. Individual site detection probability, naïve occupancy, and estimated overall
occupancy based on leading candidate model for all species except T. scripta presence/ absence
(percent forest within 1000 m buffer) in geographically isolated wetlands at Ichauway, Baker
County, Georgia.
Site Detection Probability (SE) 95% CI
W01 0.1062 (0.0797) 0.0224-0.3810
W02 0.0303 (0.0401) 0.0021-0.3122
W04 0.0313 (0.0410) 0.0023-0.3139
W12 0.0294 (0.0393) 0.0020-0.3108
W15 0.0512 (0.0559) 0.0056-0.3396
W16 0.0163 (0.0259) 0.0007-0.2822
W36 0.0349 (0.0441) 0.0028-0.3195
W37 0.0436 (0.0507) 0.0042-0.3310
W42 0.0566 (0.0592) 0.0068-0.3450
W53 0.0538 (0.0575) 0.0062-0.3423
W68 0.0488 (0.0543) 0.0051-0.3370
Overall Occupancy
Naïve 0.8182
Estimated 0.9796 (0.7944) 0.0000-1.0000

40
Table 2-11. Models explaining the effects of wetland variables on presence of T. scripta in
geographically isolated wetlands at Ichauway Baker County, Georgia. The number of predictor
variables (K) in each model includes the intercept term. Models with lower second order
Akaike’s information criterion (AICC) and difference (Δ AICc) and greater Akaike weights (wi)
were more strongly supported by the data.
Model K AICC Δ AICC wi Model
likelihood
S 2 172.17 0.00 0.24 1.00
S_D_%F1000 4 172.86 0.69 0.17 0.71
S_Si_%F1000 4 173.19 1.02 0.15 0.16
D 2 173.77 1.60 0.11 0.12
%F1000 2 174.35 2.18 0.09 0.09
Si 2 174.45 2.28 0.07 0.04
Null 1 176.18 4.01 0.04 0.04
IN 2 178.14 5.97 0.01 0.04
V 2 178.39 6.22 0.01 0.01
%F200 2 178.44 6.27 0.01 0.01
Global 8 182.97 10.80 0.00 0.00
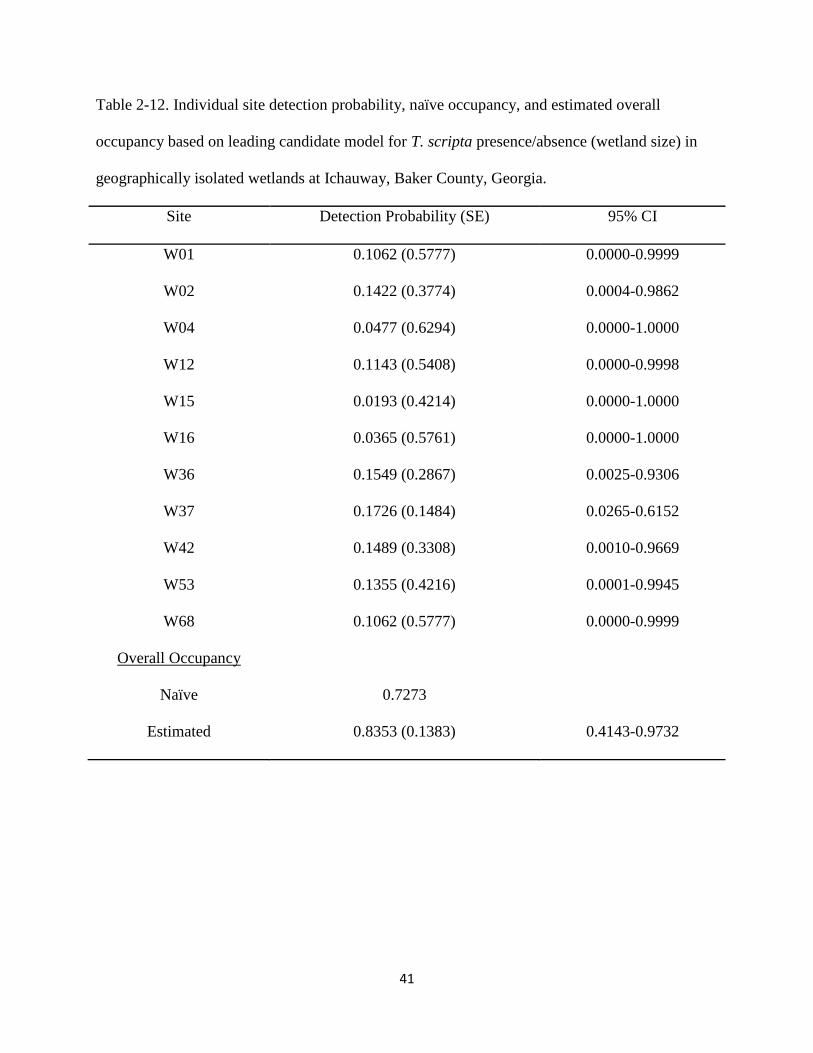
41
Table 2-12. Individual site detection probability, naïve occupancy, and estimated overall
occupancy based on leading candidate model for T. scripta presence/absence (wetland size) in
geographically isolated wetlands at Ichauway, Baker County, Georgia.
Site Detection Probability (SE) 95% CI
W01 0.1062 (0.5777) 0.0000-0.9999
W02 0.1422 (0.3774) 0.0004-0.9862
W04 0.0477 (0.6294) 0.0000-1.0000
W12 0.1143 (0.5408) 0.0000-0.9998
W15 0.0193 (0.4214) 0.0000-1.0000
W16 0.0365 (0.5761) 0.0000-1.0000
W36 0.1549 (0.2867) 0.0025-0.9306
W37 0.1726 (0.1484) 0.0265-0.6152
W42 0.1489 (0.3308) 0.0010-0.9669
W53 0.1355 (0.4216) 0.0001-0.9945
W68 0.1062 (0.5777) 0.0000-0.9999
Overall Occupancy
Naïve 0.7273
Estimated 0.8353 (0.1383) 0.4143-0.9732

42
Figure 2-1. Locations of the nine creek trap sites along a 24 km stretch of Ichawaynochaway
Creek and locations of 12 selected isolated wetlands at Ichauway, Baker County, Georgia, 2012
and 2013.

43
Figure 2-2. Monthly catch per unit effort (CPUE) for aquatic turtles across 12 wetland study sites
at Ichauway, Baker County, Georgia from July-October 2012 and February-June 2013.
0.00
0.02
0.04
0.06
0.08
0.10
0.12
0.14
0.16
0.18
CP
UE

44
Figure 2-3. Mean number of turtle captures with standard error for creek and wetland study sites
at Ichauway, Baker County, Georgia, by sex and age class (age classes were adults and juveniles,
with juveniles being turtles that were too small to accurately determine sex; Jensen et al. 2008).
0
1
2
3
4
5
6
7
8
Wetlands Creek
Aq
uat
ic T
urt
le C
aptu
res
Females
Males
Juveniles

45
CHAPTER 3
Overland Movement by Aquatic Turtles in the Dougherty Plain of Georgia
Introduction
Reptiles are experiencing population declines globally and approximately 42% of all
turtle species are threatened, primarily from habitat loss and degradation (Semlitsch and Bodie,
1998; Buhlmann et al., 2009a; Gibbons et al., 2000). Aquatic turtle species are particularly
vulnerable to habitat degradation as some require both aquatic and terrestrial habitats. Many
aquatic turtles use terrestrial habitats for nesting and overwintering. The importance of an intact
terrestrial core around wetlands and streams to accommodate these activities has been well-
documented (Semlitsch and Bodie, 2003; Buhlmann et al., 2009b). In addition to nesting and
overwintering, many aquatic turtles migrate between freshwater ecosystems, including rivers,
ponds, and wetlands in search of food, mates, or other resources (Gibbons et al., 1990, Tuberville
et al., 1996; Gibbons, 2003). Very little is known about the extent of turtle movements and the
permeability of different terrestrial habitats for migrating aquatic turtles.
The extent of terrestrial habitat use varies among turtle species and among sexes and
different life stages. Male turtles are thought more likely to move overland to find new aquatic
habitats and thus more potential mates (Parker, 1984; Gibbons, 1986). Among turtles in the
southeastern U. S., chicken turtles (Deirochelys reticularia) and eastern mud turtles (Kinosternon
subrubrum) often occur in geographically isolated wetlands. Both species use uplands by
overwintering in nests as hatchlings, while males and females of all ages aestivate in upland
46
habitat during drought (Skorepa and Ozment, 1968; Bennett, 1972; Gibbons and Greene, 1978;
Gibbons, 1983; Buhlmann and Gibbons, 2001; Steen et al., 2007; Buhlmann et al., 2009b). In
contrast, highly aquatic species typically found in streams including alligator snapping turtles
(Macrochelys temminckii), loggerhead musk turtles (Sternotherus minor), Gulf Coast spiny
softshells (Apalone spinifera), and Barbour’s map turtles (Graptemys barbouri) rarely leave the
water and typically only females travel overland to nest (Steen et al., 2012). The yellow-bellied
slider (Trachemys scripta) and common snapping turtle (Chelydra serpentina) inhabit both
wetlands and streams and make extensive overland movements. For example, Steen et al. (2010)
documented a male C. serpentina moving over 1.7 km overland and T. scripta have been
reported to move more than 3 km overland (Morreale et al., 1984).
Overland movements by aquatic turtles are greatly influenced by weather and climate
patterns. Turtles often leave drying water bodies to find refugia during drought (Cagle, 1944a;
Sexton, 1959; Gibbons, 1983), and migrate back when these habitats refill. Gibbons (1970)
suggested that rainfall influences whether a turtle moves overland during drought, but does not
influence terrestrial movements during periods of normal rainfall or overwintering. Turtles that
inhabit geographically isolated wetlands in the southeastern U.S., which experience cycles of dry
down and refilling, are adapted to aestivate or migrate when wetlands are dry. Isolated wetlands
rely on rainfall to fill, and generally dry down in late spring and summer due to
evapotranspiration (Battle and Golladay, 2001). To maintain aquatic turtle populations that use a
suite of upland and aquatic habitats, it is imperative to maintain connectivity between wetland
and riparian systems through conservation of migration corridors.
Overland movement is costly for aquatic turtles due to high energetic demands as well as
high risk of mortality via desiccation, overheating, and predation. Risk is exacerbated by
47
landscape development as turtles moving overland are more vulnerable to harvest by humans,
predation (e.g., from domestic dogs), and roadway mortality, which particularly affects nesting
females (Gibbons, 1986; Buhlmann and Gibbons, 2001; Gibbs and Shriver, 2002; Steen et al.,
2006). Agricultural land, in particular, may be detrimental to turtle movement due to
fragmentation with little to no protective cover and poor quality aquatic habitat (i.e., ecological
traps; Moll and Moll, 2004). Additionally, the slow moving nature of turtles renders them
vulnerable to injury or death by agricultural machinery (Bowne et al., 2006; Saumure et al.,
2007; Erb and Jones, 2011).
Of the aquatic turtles species in southwestern Georgia, the yellow-bellied slider
(Trachemys scripta), common snapping turtle (Chelydra serpentina), river cooter (Pseudemys
concinna), and Florida cooter (Pseudemys floridana), use multiple habitats (i.e., streams, isolated
wetlands) while moving through longleaf pine (Pinus palustris) uplands (Smith et al., 2006). The
Florida softshell (Apalone ferox), chicken turtle (Deirochelys reticularia), eastern mud turtle
(Kinosternon subrubrum), and common musk turtle (Sternotherus odoratus) use isolated
wetlands in the region, and so are expected to move among theses wetlands as well (Smith et al.,
2006).
The primary objective of this study was to examine overland movements of aquatic
turtles among geographically isolated wetlands and streams within a longleaf pine landscape.
More specifically, I 1) quantified temporal patterns of overland movements and looked for
differences in movement patterns among species and sexes of aquatic turtles, and 2) identified
terrestrial habitats used by migrating turtles to determine habitat permeability with the goal of
informing selection of priority landscapes for conservation. I hypothesized that semi-aquatic
species, (i.e., A. ferox, C. serpentina, D. reticularia, K. subrubrum, P. concinna, P. floridana, S.

48
odoratus, and T. scripta), would exhibit greater overall frequencies of overland movements than
fully aquatic stream specialists, (i.e, A. spinifera, G. barbouri, M. temminckii, and S. minor;
Smith et al. 2006), and that male turtles would move overland more frequently than females and
juveniles to search for mates. I also hypothesized that during overland movements, turtles would
be more often associated with forested habitats including pine uplands and bottomland
hardwoods close to bodies of water than non-forested habitats and disturbed areas including
scrub, agriculture, and developed habitats.
Methods
Study Site
The study took place on Ichauway, the 11,300 ha research site of the Joseph W. Jones
Ecological Research Center, which is located in the Dougherty Plain Physiographic District in
southwestern Georgia. Ichauway is a private reserve managed for longleaf pine and Northern
bobwhite quail (Colinus virginianus) and consists of second growth longleaf pine forest
characterized by an open canopy and a wiregrass (Aristida stricta) dominated understory. Other
pine species including slash pine (P. elliottii) and loblolly pine (P. taeda) are also present in
addition to hardwoods (e.g., Quercus spp.). Ichauway also contains scrub and deciduous riparian
habitat as well as pine plantations, small agricultural fields and wildlife food plots for Northern
bobwhite and white-tailed deer (Odocoileus virginianus), and areas classified as developed
which consist of buildings and houses. There are more than 90 geographically isolated wetlands
on Ichauway, including both cypress-gum swamps, cypress savannas and grassy marshes
(Kirkman et al., 2000). Cypress-gum swamps are characterized as having a dense canopy of
pond cypress (Taxodium ascendens) and swamp tupelo (Nyssa biflora) with little to no

49
understory, and have organic soils. Cypress savannas have a sparse overstory of pond cypress
and an herbaceous understory. Grassy marshes are characterized as having open canopies and
understories of panic grasses (Panicum spp.), cutgrass (Leersia hexandra), and sandy soils
(Kirkman et al., 2000). Ichauway is bordered on the east by a 21 km reach of the Flint River and
a 24 km reach of Ichawaynochaway creek runs through the center of the property. The property
is surrounded by extensive, privately owned agricultural lands.
Field Data Collection
In 2012 and 2013, I collected aquatic turtles encountered on roads at Ichauway. I also
used existing unpublished data for aquatic turtles on roads that were collected on roads from
2003-1011 (unpublished data). Most turtle captures were associated with a predator exclusion
fence around a 16 ha study plot (see Conner et al., 2010 for a detailed description of the plot)
containing a 7 ha geographically isolated wetland (Wetland 0). The predator exclusion fence
prevented turtles from moving freely to and from the wetland from 2003-2013. The fence line
was monitored regularly over that time and collected, marked, and measured all migrating
aquatic turtles and recorded whether they were entering or exiting the fence. All turtles were
released across the fence after they were marked.
All turtles captured were identified to species and marked by notching a unique
combination of marginal scutes (Cagle, 1939). Softshell turtles (Apalone spp.) were notched
(Plummer, 2008) and hatchlings and small juveniles of all species were marked with alpha-
numeric mussel tags (1.2 mm x 2.7 mm, Northwest Marine Technologies, Shaw Island, WA,
USA) which were glued on the plastron using Super Glue (Loctite, Henkel Corporation, Rocky
Hill, CT, USA). For each capture the date, ID number, recapture status, sex, reproductive status
(females were hand-palpated in the spring and summer to see if they carried shelled eggs, Cagle,

50
1944b), age class (adult, sub-adult; Jensen et al., 2008), mass (g), plastron length (mm), carapace
length (mm), and any injuries or abnormalities were recorded. The locations of captured turtles
were mapped by hand using ArcGIS (version 9.3; Earth Systems Research Institute, Redlands,
CA).
Data Analysis
Overland Movement Patterns
I calculated the total number and sex ratio of all turtles captured on land. Captures from
2003-2013 were pooled by month and year to describe seasonal patterns in overland movement. I
calculated incidences of aquatic turtle movements during and after rainfall events from May
2012- June 2013 to determine whether rainfall affected turtle movements. I obtained rainfall data
from the Georgia Automated Environmental Monitoring Network’s weather station located at
Ichauway (www.Georgiaweather.net)
I used ArcGIS and existing landcover data layers for Ichauway to calculate the distance
(m) from each turtle location to the nearest geographically isolated wetland and nearest body of
“permanent” water (i.e. Ichawaynochaway creek, Flint River, agricultural ponds). I compared
mean distance of locations to nearest depressional wetland and permanent water body by species
using t-tests (SAS 9.3). Only species with >10 captures were used in this analysis.
The number of turtles entering and exiting the fence surrounding Wetland 0 from 2003-
June 2013 was recorded by species and sex. I examined relationships between turtle captures and
season, water levels, as well as directionality of turtle movements using correlation analyses.

51
Habitat Associations
Locations of the most frequently captured species, T. scripta (n=179), were overlaid onto
an existing land cover layer of Ichauway using ArcGIS. Most turtle captures (<90%) occurred in
the central and northern portion of the property; therefore, I spatially defined the study area for
this portion of the analysis as the 8736 ha portion of the property (Figure 3-1). I generated 179
random points within the study area using Hawth's Analysis Tools for ArcGIS to spatially
represent the available surrounding habitat at a landscape scale. I created a 125-m buffer around
these points and the T. scripta locations (Beyer, 2004.) I calculated the mean percentages of
landuse variables within buffers around turtle locations and random points. Land cover types
included: agriculture and wildlife food plots (AG), hardwood forest (HW), hardwood pine mixed
forest (MX), open water (OP), pine plantation (PP), scrub (SC), upland pine (UP), developed
(DV), and wetland (WT). Other variables were: road density (total length of paved and dirt roads
within buffer; RD), habitat edge density (total perimeter of borders between different habitats
within buffer; EG), and distance to nearest body of water (DW). Agricultural land consisted of
small wildlife food plots and offsite center-pivot agricultural fields. Hardwood forests were
typically associated riparian bottomlands and contained several species including live oak
(Quercus virginiana), water oak (Q. nigra), laurel oak (Q. laurifolia), and red oak (Q. falcata),
while mixed hardwood pine contained both oaks and pines. Open water included
Ichawaynochaway Creek and the Flint River as well as any other permanent bodies of water.
Pine plantations were typically young planted pine (<10 years old), though some were mature
pine stands and all had generally less groundcover than upland pine habitat. Scrub habitat
contained both oak thickets and abandoned pastures. Upland pine habitat was dominated by
mature longleaf pine, but also contained slash pine and loblolly pine and diverse herbaceous
52
groundcover. Developed areas included homes, barns and other buildings, and roads that
included two county highways. Wetland habitat consisted of cypress gum swamps, cypress
savannas, and grassy marshes.
Data were log-transformed and 27 a-priori logistic regression models (including global
and null models; Table 3-1) were developed to investigate associations between T. scripta
presence and specific habitat variables. Logistic regression models were run in SAS 9.3 (SAS
Institute Inc., Cary, NC), and Akaike’s Information Criterion (AIC) was used to rank models
(Burnham and Anderson, 2002).
Results
Overland Movement Patterns
A total of 705 aquatic turtles were captured on land from 2003-2013. Twenty three
percent of the total were recaptures. T. scripta accounted for 468 captures (66% of total captures)
and riverine species Apalone spinifera and Graptemys barbouri accounted for <2% of total
captures (Table 3-2). The majority of turtle captures (>90%) occurred from March-September,
with highest capture numbers in May and June (Figure 3-2). Only in 2006 and 2013 were more
than 80 turtles captured (Figures 3-3, 3-4). Sex ratios (males: females) among individual species
varied from 0:1-2:1 (Table 3-2).
In 2012, during a period of extreme drought (United States Drought Monitor, 2012), 19
turtles were captured on land from May-September, with three peaks (>1/day for 2012) in
captures. In 2013, 150 turtles were captured from February-June, with a total of 11 peaks (>4/day
for 2013)in captures (Figure 3-5). Rainfall ranged from 0.03- 7.45 cm during these peaks and
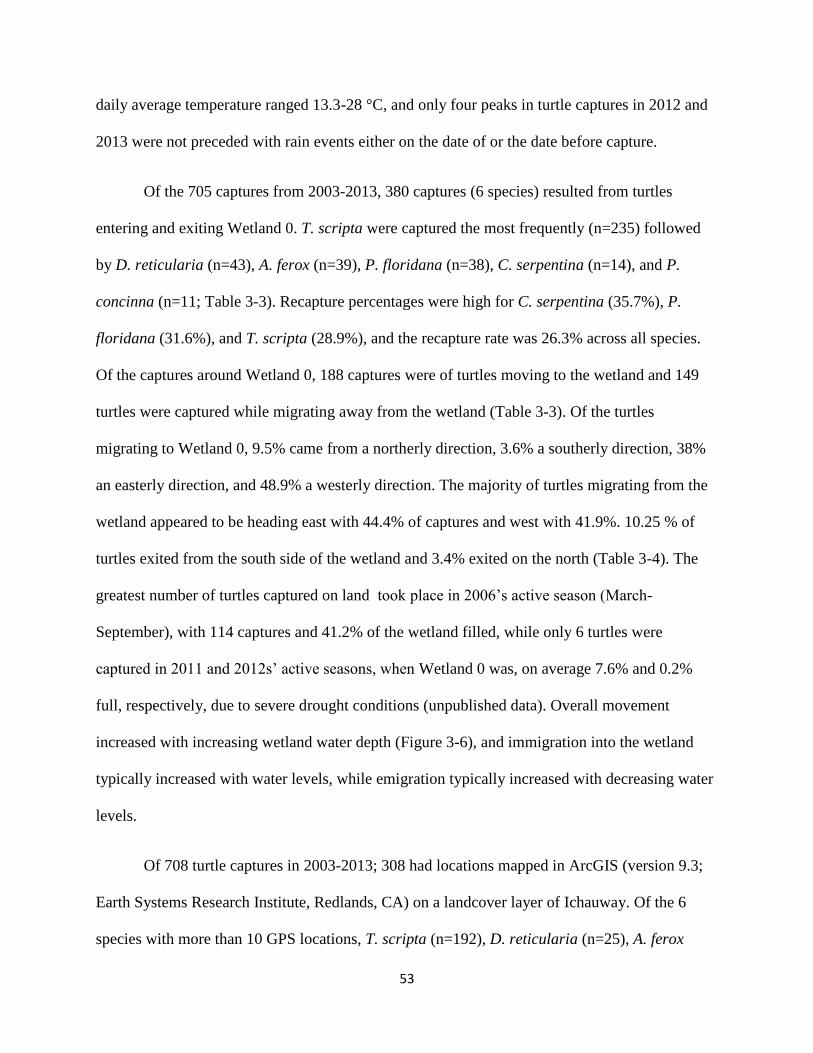
53
daily average temperature ranged 13.3-28 °C, and only four peaks in turtle captures in 2012 and
2013 were not preceded with rain events either on the date of or the date before capture.
Of the 705 captures from 2003-2013, 380 captures (6 species) resulted from turtles
entering and exiting Wetland 0. T. scripta were captured the most frequently (n=235) followed
by D. reticularia (n=43), A. ferox (n=39), P. floridana (n=38), C. serpentina (n=14), and P.
concinna (n=11; Table 3-3). Recapture percentages were high for C. serpentina (35.7%), P.
floridana (31.6%), and T. scripta (28.9%), and the recapture rate was 26.3% across all species.
Of the captures around Wetland 0, 188 captures were of turtles moving to the wetland and 149
turtles were captured while migrating away from the wetland (Table 3-3). Of the turtles
migrating to Wetland 0, 9.5% came from a northerly direction, 3.6% a southerly direction, 38%
an easterly direction, and 48.9% a westerly direction. The majority of turtles migrating from the
wetland appeared to be heading east with 44.4% of captures and west with 41.9%. 10.25 % of
turtles exited from the south side of the wetland and 3.4% exited on the north (Table 3-4). The
greatest number of turtles captured on land took place in 2006’s active season (March-
September), with 114 captures and 41.2% of the wetland filled, while only 6 turtles were
captured in 2011 and 2012s’ active seasons, when Wetland 0 was, on average 7.6% and 0.2%
full, respectively, due to severe drought conditions (unpublished data). Overall movement
increased with increasing wetland water depth (Figure 3-6), and immigration into the wetland
typically increased with water levels, while emigration typically increased with decreasing water
levels.
Of 708 turtle captures in 2003-2013; 308 had locations mapped in ArcGIS (version 9.3;
Earth Systems Research Institute, Redlands, CA) on a landcover layer of Ichauway. Of the 6
species with more than 10 GPS locations, T. scripta (n=192), D. reticularia (n=25), A. ferox

54
(n=22), P. floridana (n=22), and C. serpentina (n=14) were found closer to wetlands than
permanent water (Table 3-5). P. concinna (n=19) were not significantly closer to either aquatic
system.
Habitat Associations
Maximum likelihood estimates indicated that the percentage of upland pine (1.0718, P
<0.0001), open water (0.8406, P = 0.0276), and wetland (1.4471, P <0.0001) habitats within
buffers around T. scripta were significantly greater than expected by chance, while the
percentage of scrub (-0.4417, P=0.0451), pine plantation (-0.9669, P <0.0001), and agriculture (-
1.2361, P <0.0001) habitats were significantly lower than expected. T. scripta captures were
significantly closer to water (-1.3308, P<0.0001) than random points. The percentages of
hardwood forest (0.1656, P=0.3546), hardwood/pine mix (0.1536, P=0.3309), road density (-
0.4812, P=0.4941) and edge density (1311, P=0.4380) did not differ between turtle captures and
random points (Table 3-6).
The best model for predicting terrestrial locations of T. scripta during overland
movements was the global model (AIC=406.06; Table 3-7). The upland pine and wetland
habitat model (upland pine, wetlands, and distance to nearest water; AIC= 413.90) and the
undisturbed habitat model (upland pine, hardwood forest, hardwood/pine mix, open water, and
wetlands; AIC= 425.86 fell outside of 2 AIC units and thus, were not well supported.
Discussion
Of the 12 aquatic turtle species that occur in the Dougherty Plain, nine were captured on
land during this study. This included two riverine species, A. spinifera and G. barbouri,
indicating the importance of upland habitats for aquatic turtles. Trachemys scripta exhibited the

55
most overland activity, which was expected of a habitat generalist (Ernst et al. 1994) using many
types of aquatic habitats throughout the region. Other species that were frequently captured
during overland forays were Apalone ferox, Deirochelys reticularia, and Pseudemys floridana
(all wetland specialists), in addition to Chelydra serpentina and Pseudemys concinna. Pseudemys
floridana was the only species where more males than females were captured overland, while all
other species had either equal overland movements by sex or had females move more than males.
This was unexpected as it does not agree with previous studies that found males to move more
than females (Parker, 1984; Gibbons, 1986).However; this may be due to the relatively short
hydroperiods of wetlands in the region, which forces both sexes to move to obtain resources and
aquatic refuges necessary for survival and growth. Females of several species (i.e. A. ferox, A.
spinifera, C. serpentina, G. barbouri, and P. concinna) moved overland more than males, though
this is most likely due to nesting forays as evidenced by sudden influxes of gravid females during
April and May, which are common nesting periods (Ernst et al., 1994).
The large numbers of captures and recaptures of six turtle species moving in and out of
Holt Pond indicates high activity entering and leaving isolated depressional wetlands. Many
individuals were captured entering and leaving during the same year. This could indicate that
turtles are not permanent residents of a single wetland, but use multiple wetlands and, in the case
of generalist species, other aquatics habitats. Movement between multiple water bodies suggests
that aquatic turtles may be spending large amounts of time in the uplands. Many turtles were
caught moving toward or coming from the east side of Wetland 0, where another depressional
wetland (grassy marsh) is situated 200 m away. Turtles also exhibited high movement activity
from the west, where an offsite agricultural pond was less than 1 km away. Both wetlands
typically hold water throughout the year (RLK pers. obs.), and may be important habitat for

56
turtles. Overall movements typically increased when water levels increased in Holt Pond, though
there were some exceptions. Wetland water levels dropped throughout 2006, yet turtle movement
to and from Holt Pond remained high. This may be explained by turtles moving through the
wetland or using it as a “stepping stone” as they search for more permanent aquatic habitat.
When water levels remained low throughout the year (i.e., 2007, 2011, and 2012), movement
rapidly decreased. Overall movements to and from Holt Pond indicate high connectivity between
isolated wetlands and extensive movement through upland habitat at Ichauway.
Despite the importance of dispersal corridors among wetlands for wildlife connectivity,
policies are typically only designed to buffer aquatic resources and not terrestrial and wildlife
resources (Crawford and Semlitsch, 2007). Along with other published studies (Semlitsch and
Bodie, 2003; Steen et al., 2012) my data suggest that these buffers are not adequate to provide
for terrestrial migration of aquatic turtles. For example, in this study, many turtles were captured
further away from aquatic habitat than anticipated. Of the six species for which I calculated
Euclidian distances from permanent water, primarily stream habitat, only P. concinna, a species
that often inhabits rivers, had an average distance of <300 m. P. concinna also had the largest
average distance to isolated depressional wetlands. C. serpentina and T. scripta had the largest
average distances to permanent water, with individuals of both species found >3 km from
streams. C. serpentina and T. scripta also had the greatest average distances to wetlands aside
from P. concinna. Average distances for all other species fell between 94.8-141.1 m from
wetlands. The majority of these distances are much larger than typical wetland (30-120 m) and
river (12-20 m) buffer zones. My results suggest that a 287 m maximum core terrestrial zone
around wetlands and a 150 m riparian buffer are more appropriate to protect turtle populations

57
(Semlitsch and Bodie, 2003; Steen et al., 2012); however, corridors between and among habitats
may be a more appropriate approach to accommodating inter-wetland movements (see Chapter
4).
The most interesting finding of this study is the evidence supporting turtle preference for
certain habitats when traveling over land. T. scripta were found more often in natural upland
pine, wetland, and open water habitats than expected by chance and less often in scrub, pine
plantations, and agriculture. Turtles also were found closer to aquatic habitats than expected by
chance. Along with the results of the logistic regression models, this indicated that T. scripta
preferred to move through upland pine forests near bodies of water and other undisturbed
habitats, and avoided moving through more disturbed habitats including open scrub and
agriculture and pine plantations.
Overall, this information may be beneficial for assigning priority landscapes for
conservation of turtle populations in the Dougherty Plain and the Southeastern Coastal Plain,
which was historically dominated by the longleaf pine ecosystem, of which <3% remains due to
urbanization and conversion to agriculture and commercial pine stands (Frost, 1993; Noss et al.,
1995). Many isolated depressional wetlands that also occurred in the region have been lost or
degraded by agricultural land use practices over the past 6 decades by both conversion on
wetlands to cropland or farm ponds and fragmentation of forested corridors between wetlands
(Martin, 2010; Martin et al., 2013).

58
Literature Cited
Battle, J. and S.W. Golladay. 2001. Water quality and macroinvertebrate assemblages in three
types of seasonally inundated limesink wetlands in southwest Georgia. Journal of
Freshwater Ecology 16: 189-207.
Bennett, D. H. 1972. Notes on the terrestrial wintering of mud turtles (Kinosternon subrubrum).
Herpetologia 28: 245-247.
Beyer, H. L. 2004. Hawth's Analysis Tools for ArcGIS
Bowne, D. R., M. A. Bowers, and J. E. Hines. 2006. Connectivity in an agricultural landscape as
reflected by interpond movements of a freshwater turtle. Conservation Biology 20: 780-
791.
Buhlmann, K.A., T.S.B. Akre, J.B. Iverson, D. Karapatakis, R.A. Rittermeier, A. Georges,
A.G.J. Rhodin, P.P van Dijk, and J.W. Gibbons. 2009a. A global analysis of tortoise and
freshwater turtle distributions with identification of priority conservation areas.
Chelonian Conservation and Biology 8: 116-149.
Buhlmann, K. A., J. D. Congdon, J. W. Gibbons, and J. L. Greene. 2009b. Ecology of chicken
turtles (Deirochelys reticularia) in a seasonal wetland ecosystem: exploiting resource and
refuge environments. Herpetologia 65: 39-53.

59
Buhlmann, K. A. and J. W. Gibbons. 2001. Terrestrial habitat use by aquatic turtles from a
seasonally fluctuating wetland: implications for wetland conservation boundaries.
Chelonian Conservation and Biology 4: 115-127.
Burnham, K. P. and D. R. Anderson. 2002. Model selection and multimodal inference: A
practical information-theoretical approach. Springer-Verlag. New York, NY.
Cagle, F.R. 1939. A system of marking turtles for future identification. Copeia 3: 170-173.
Cagle, F. R. 1944a. Home range, homing behavior and migration in turtles. Miscellaneous
Publications from the Museum of Zoology of the University of Michigan 61: 37p.
Cagle, F.R. 1944b. A technique for obtaining turtle eggs for study. Copeia 1944: 60.
Crawford, J.A. and R.D. Semlitsch. 2006. Estimation of core terrestrial habitat for stream-
breeding salamanders and delineation of riparian buffers for protection of biodiversity.
Conservation Biology 21: 152-158.
Erb, L. and M. T. Jones. 2011. Can turtle mortality be reduced in managed fields? Northeastern
Naturalist 18: 489-496.
Ernst, C., J. Lovich, and R. Barbour. 1994. Turtles of the United States. Smithsonian Institution
Press. Washington, DC.
Frost, C.C. 1993. Four centuries of changing landscape patterns in the longleaf pine ecosystem.
Proceedings of the 18th Tall Timbers fire ecology conference. Tall Timbers Research
Station, Tallahassee, FL. Pp 17-43.

60
Gibbs, J. P. and W. G. Shriver. 2002. Estimating the effects of road mortality on turtle
populations. Conservation Biology 16: 1647-1653.
Gibbons, J. W. 1970. Terrestrial activity and the population dynamics of aquatic turtles.
American Midland Naturalist 83: 404-414.
Gibbons, J. W. 1983. Reproductive characteristics and ecology of the mud turtle, Kinosternon
subrubrum (Lacepede). Herpetologia 39: 254-271.
Gibbons, J. W. 1986. Movement patterns among turtle populations: applicability to management
of the desert tortoise. Herpetologia 42: 104-113.
Gibbons, J.W. 1990. Turtle studies at SREL: a research perspective. Pp 19-44. In Gibbons, J. W.
(ed.) Life history and ecology of the slider turtle. Smithsonian Institution Press.
Washington, DC.
Gibbons, J. W. 2003. Terrestrial habitat: A vital component for herpetofauna of isolated
wetlands. Wetlands 23: 630-635.
Gibbons, J. W. and J. L. Greene. 1978. Selected aspects of the ecology of the chicken turtle,
/Deirochelys reticularia/ (Lateille) (Reptilia, Testudines, Emydidae). Journal of
Herpetology 12: 237-242.
Gibbons, J.W., D.E. Scott, T.J. Ryan, K.A. Buhlmann, T.D. Tuberville, B.S. Metts, J.L. Greene,
T. Mills, Y. Leiden, S. Poppy, and C.T. Winne. 2000. The Global Decline of Reptiles:
Déjà vu Amphibians. Bioscience 50: 653-666.
Jensen, J. B., C. D. Camp, J. W. Gibbons, and M. J. Elliott. 2008. Amphibians and reptiles of
Georgia. Athens: University of Georgia Press, Athens, GA.

61
Kirkman, L.K., P.C. Goebel, L. West, M.B. Drew, and B.J. Palik. 2000. Depressional wetland
vegetation types: a question of plant assemblage development. Wetlands 20:373-385.
Martin, G.I. 2010. Evaluating the location, extent, and condition of isolated wetlands in the
Dougherty Plain, Georgia, USA. Master’s Thesis, University of Georgia, Athens, GA.
Martin, G. I., J. A. Hepinstall, and L. K. Kirkman. 2013. Six decades (1948 - 2007) of landscape
change in the Dougherty Plain of Southwest Georgia, USA. Southeastern Geographer 53.
Moll, D. and E. O. Moll. 2004. The Ecology, Exploitation, and Conservation of River Turtles.
Oxford University Press, Oxford, NY.
Morreale, S.J., J. W. Gibbons, and J. D. Congdon. 1984. Significance of activity and movement
in the yellow-bellied slider turtle (Pseudemys scripta). Canadian Journal of Zoology.
62:1038-1042.
Noss, R.F., E.T. LaRoe and J.M. Scott. 1995. Endangered ecosystems of the United States: a
preliminary assessment of loss and degradation. Pp. 81. In U.S. Department of Interior
National Biological Service, Biological Report 28.U.S. Department of Interiors,
Washington, D.C.
Parker, W. S. 1984. Immigration and dispersal of slider turtles (Pseudemys scripta) in
Mississippi farm ponds. American Midland Naturalist 112: 280-293.
Plummer, M.V. 2008. A Notching System for Marking Softshell Turtles. Herpetological Review
39: 64-65.
SAS Institute Inc. 2008. User installation guide for SAS 9.1.3 foundation for Microsoft
Windows, Cary, NC.

62
Saumure, R. A., T. B. Herman, and R. D. Titman. 2007. Effects of haying and agricultural
practices on a declining species: the North American wood turtle (Glyptemys insculpta).
Biological Conservation 135: 565-575.
Semlitsch, R.D. and J.R. Bodie. 1998. Are small, isolated wetlands expendable? Conservation
Biology 12: 1129-1133.
Semlitsch, R. D. and J. R. Bodie. 2003. Biological criteria for buffer zones around wetlands and
riparian habitats for amphibians and reptiles. Conservation Biology 17: 1219-1228.
Sexton, O. J. 1959. Spatial and temporal movements of a population of the painted turtle,
Chrysemys picta marginata (Agassiz). Ecological Monographs 29: 113-140.
Skorepa, A. C. and J. E. Ozment. 1968. Habitats, habits, and variation of Kinosternon subrubrum
in southern Illinois. Transactions of the Illinois Academy of Science 61: 247-251.
Smith, L. L., D. A. Steen, J. M. Stober, M. C. Freeman, S. W. Golladay, L. M. Conner, and J.
Cochrane. 2006. The vertebrate fauna of Ichauway, Baker County, GA. Southeastern
Naturalist 5: 599-620.
Steen, D. A., M. J. Aresco, S. G. Beilke, B. W. Compton, E. P. Congdon, C. K. Dodd, H.
Forrester, J. W. Gibbons, J. L. Greene, G. Johnson, J. M. Langden, M. J. Oldham, D. N.
Oxier, R. A. Saumure , F. W. Schueler, J. M. Sleeman, L. L. Smith, J. K. Tucker, and J.
P. Gibbs. 2006. Relative vulnerability of female turtles to road mortality. Animal
Conservation 206: 269-273.

63
Steen, D. A., J.P. Gibbs, K.A. Buhlmann, J.L. Carr, B.W. Compton, J.D. Congdon, J.S. Doody,
J.C. Godwin, K.L. Holcomb, D.R. Jackson, F.J. Janzen, G. Johnson, M.T. Jones, J.T.
Lamer, T.A. Langen, M.V. Plummer, J.W. Rowe, R.A. Saumure, J.K. Tucker, D.S.
Wilson. 2012. Terrestrial habitat requirements of nesting freshwater turtles. Biological
Conservation 150: 121-128.
Steen, D. A., S. C. Sterrett, A. M. Heupel, and L. L. Smith. 2010. Snapping turtle, Chelydra
serpentina, overland movements near the southeastern extent of its range. Georgia
Journal of Science 68: 196-201.
Tuberville, T. D., J.W. Gibbons, J.L Greene. 1996. Invasion of new aquatic habitats by male
freshwater turtles. Copeia 1996: 713-715.

64
Table 3-1. 27 a priori models and variables used in logistic regression for Trachemys scripta to
describe habitat associations of aquatic turtles during overland movements at Ichauway, Baker
County, Georgia from 2003-2013. Variables are scrub (SC), urban (UR), upland pine (UP),
hardwood forest (HW), hardwood pine mix (MX), pine plantation (PP), open water (OW),
wetland (WT), agriculture (AG), road density (RD), habitat edge density (EG), and distance to
nearest water (DW).
Model Description
Global
Undisturbed
All Disturbed
Upland Pine and Wetland
Natural Forested
All Pine
Riparian and Hardwood
All Aquatic
Heavily Disturbed
All Wetland
Agriculture and Pine Plantation
Scrub and Pine Plantation
Natural Pine
Riparian
SC+DV+UP+HW+MX+PP+OW+WT+AG+RD+EG+DW
UP+HW+MX+OW+WT
DV+PP+AG+RD
UP+WT+DW
UP+HW+MX
UP+MX+PP
OW+DW+HW
OW+WT+DW
DV+AG+RD
WT+DW
PP+AG
SC+PP
UP+MX
OW+DW
Scrub SC
Developed DV

65
Upland Pine UP
Hardwood Forest HW
Hardwood Pine Mixed MX
Pine Plantation
Open Water
Wetland
Agriculture
Road Density
Habitat Edge Density
Distance to Water
Null
PP
OW
WT
AG
RD
EG
DW
None

66
Table 3-2. Number of captures, recaptures, percent of individuals recaptured, and sex ratios for
aquatic turtle species captured on land at Ichauway, Baker County Georgia, 2003-2013.
Species Captures Recaptures % Recaptures Sex Ratio
(M: F)
A. ferox 46 3 6.5 1:2
A. spinifera 2 0 0 0:1
C. serpentina 34 8 23.5 1:2
D. reticularia 58 11 19 1:1
K. subrubrum 4 0 0 1:0
G. barbouri 7 0 0 0:2
M. temminckii 0 0 0 N/A
P. concinna 39 7 17.9 1:3
P. floridana 47 13 27.7 2:1
S. minor 0 0 0 N/A
S. odoratus 0 0 0 N/A
T. scripta 468 121 25.9 1:1
Total 705 163 23.1 1:1
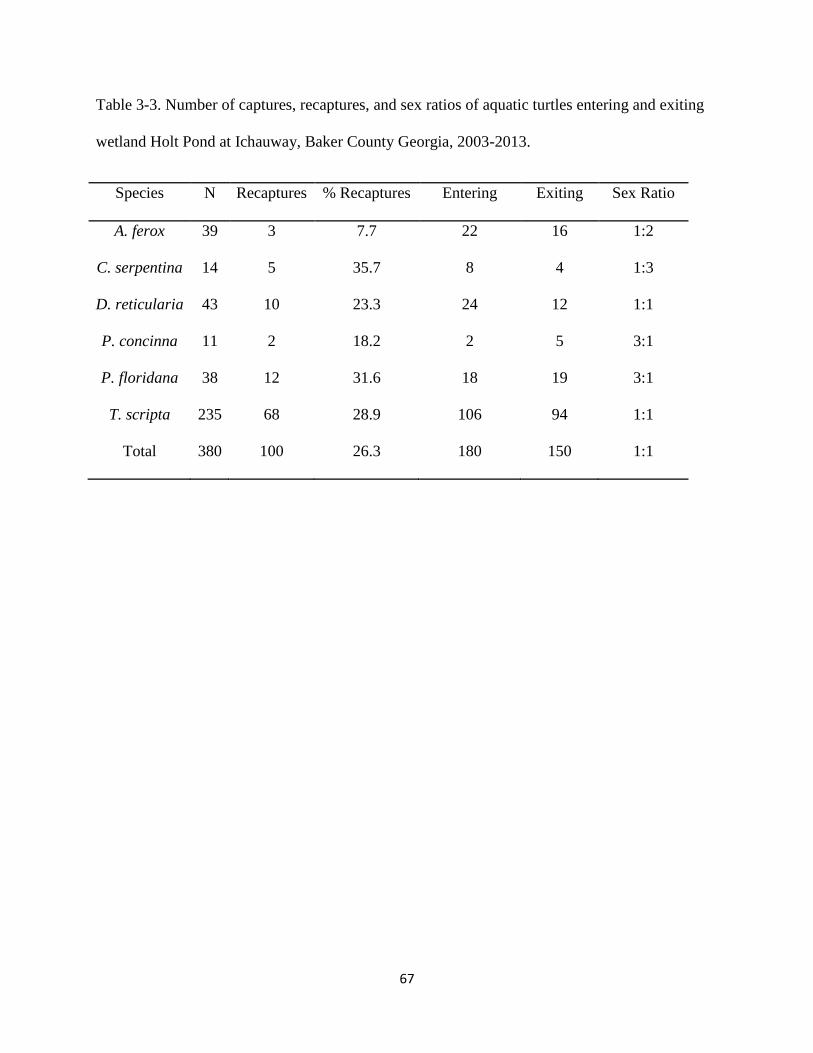
67
Table 3-3. Number of captures, recaptures, and sex ratios of aquatic turtles entering and exiting
wetland Holt Pond at Ichauway, Baker County Georgia, 2003-2013.
Species N Recaptures % Recaptures Entering Exiting Sex Ratio
A. ferox 39 3 7.7 22 16 1:2
C. serpentina 14 5 35.7 8 4 1:3
D. reticularia 43 10 23.3 24 12 1:1
P. concinna 11 2 18.2 2 5 3:1
P. floridana 38 12 31.6 18 19 3:1
T. scripta 235 68 28.9 106 94 1:1
Total 380 100 26.3 180 150 1:1

68
Table 3-4. Cardinal directions of 308 aquatic turtles entering and exiting Holt Pond at Ichauway,
Baker County Georgia, 2003-2013.
Direction % Exiting % Entering
North 3.4 9.5
South 10.2 3.6
East 44.4 38
West 41.9 48.9

69
Table 3-5. Mean distances to nearest permanent body of water and depressional wetland for aquatic turtle species captured on land at
Ichauway, Baker County Georgia, 2003-2013. Only data from species with >10 captures are displayed. Differences were considered
significant at α=0.05.
Species N Mean Distance to Permanent water (SE) Distance to Wetland (SE) P-value
A. ferox 22 484.3 (82.75) 113.4 (30.26) <0.0001
C. serpentina 14 866.3 (268.4) 160.6 (50.37) 0.0157
D. reticularia 25 394.7 (90.16) 141.1 (38.39) 0.0106
P. concinna 19 224.6 (51.53) 358.3 (73.13) 0.0691
P. floridana 22 377.5 (63.53) 94.79 (27.24) 0.0002
T. scripta 192 612.0 (44.53) 294.8 (21.27) <0.0001

70
Table 3-6. Analysis of maximum likelihood estimates of landcover types and road and edge
densities within 125-m buffers around T. scripta locations and random road points within a 8736
ha study area at Ichauway, Baker County Georgia, 2003-2013. Differences were considered
significant at α=0.05.
Analysis of Maximum Likelihood Estimates
Variable Estimate Standard error P > ChiSq
Scrub -0.4417 0.2204 0.0451
Developed 0.4087 0.2531 0.1064
Upland 1.0718 0.2423 <0.0001
Hardwood 0.1656 0.1789 0.3546
Mix 0.1536 0.1580 0.3309
Plantation -0.9669 0.2035 <0.0001
Open Water 0.8406 0.3816 0.0276
Wetland 1.4471 0.2201 <0.0001
Agriculture -1.2361 0.1868 <0.0001
Road Density -0.4812 0.7038 0.4941
Edge 0.1311 0.1690 0.4380
Distance to Water -1.3308 0.2292 <0.0001

71
Table 3-7. Logistic regression models used to investigate effects of overland habitat variables on
T. scripta overland movements on a 8736 ha study area at Ichauway, in Baker County, Georgia.
Models were evaluated with Akaike’s Information Criterion (Burnham and Anderson, 2002),
where k equals the number of parameters, AIC= 2k- 2 ln(L), ΔAIC is the difference between
each model and the best model, and wi is the Akaike weight of each model.
Variables1 K AIC ΔAIC w
i
SC+DV+UP+HW+MX+PP+OW+WT+AG+RD+EG+DW 13 406.06 0.00 0.98
UP+WT+DW 4 413.89 7.84 0.02
UP+HW+MX+OW+WT 6 425.86 19.79 0
DV+PP+AG+RD 7 432.2 21.79 0
PP+AG 5 434.91 26.14 0
WT+DW 3 437.29 28.85 0
OW+WT+DW 3 438.66 31.23 0
DV+AG+RD 4 448.98 32.60 0
WT 4 449.06 42.92 0
AG 2 449.11 43.00 0
DW 2 461.14 43.05 0
OW+DW 2 462.48 55.08 0
OW+DW+HW 3 464.42 56.42 0
UP+HW+MX 4 464.43 58.36 0
UP+MX+PP 4 466.94 58.37 0
UP+MX 4 473.11 60.88 0
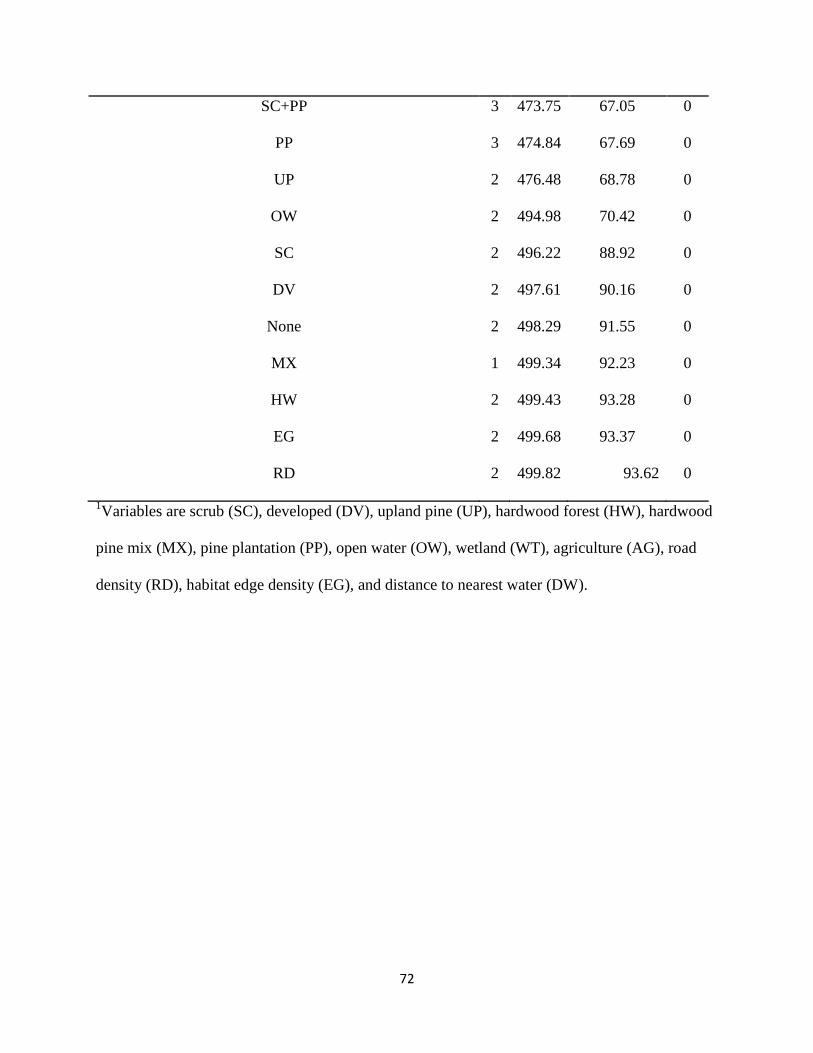
72
SC+PP 3 473.75 67.05 0
PP 3 474.84 67.69 0
UP 2 476.48 68.78 0
OW 2 494.98 70.42 0
SC 2 496.22 88.92 0
DV 2 497.61 90.16 0
None 2 498.29 91.55 0
MX 1 499.34 92.23 0
HW 2 499.43 93.28 0
EG 2 499.68 93.37 0
RD 2 499.82 93.62 0
1Variables are scrub (SC), developed (DV), upland pine (UP), hardwood forest (HW), hardwood
pine mix (MX), pine plantation (PP), open water (OW), wetland (WT), agriculture (AG), road
density (RD), habitat edge density (EG), and distance to nearest water (DW).
73
Figure 3-1. Map of the study area of Ichauway used to model habitat associations of Trachemys
scripta during overland movements at Ichauway, Baker County, Georgia from 2003-2013.

74
Figure 3-2. Aquatic turtle overland captures pooled by species and month at Ichauway, Baker
County Georgia, 2003-2013.
0
20
40
60
80
100
120
140
160
Cap
ture
s (#
Ind
ivid
ual
s)
Overland Turtle Captures by Month (2003-2013)
T. scripta
S. ordoratus
P. floridana
P. concinna
G. barbouri
K. subrubrum
D. reticularia
C. serpentina
A. spinifera
A. ferox

75
Figure 3-3. Aquatic turtle overland captures pooled by species and year at Ichauway, Baker
County Georgia, 2003-2013.
0
20
40
60
80
100
120
140
160
2003 2004 2005 2006 2007 2008 2009 2010 2011 2012 2013
Cap
ture
s (#
Inid
ivid
ual
s)
Year
Overland Turtle Captures by Year (2003-2013)
T. scripta
S. odoratus
P. floridana
P. concinna
K. subrubrum
G. barbouri
D. reticularia
C. serpentina
A. spinifera
A. ferox

76
Figure 3-4. Aquatic turtle overland captures and cumulative rainfall (cm) at Ichauway, Baker
County Georgia, 2003-2013.
0
20
40
60
80
100
120
140
160
180
2003 2004 2005 2006 2007 2008 2009 2010 2011 2012 2013
Overland Turtle Captures (2003-2013)
Captures
Rainfall (cm)

77
Figure 3-5. Daily aquatic turtle overland captures, rainfall (cm), and daily average temperature
(°C), at Ichauway, Baker County, Georgia from May 2012- June 2013.
0
1
2
3
4
5
6
7
8
Cap
ture
s (#
Ind
ivid
ual
s)
Turtle Captures May 2012-June 2013
0
5
10
15
20
25
30
35
0
1
2
3
4
5
6
7
8
Rai
nfa
ll (
cm)
Rain (cm) and Daily Average Temperature (°C)
Rain (cm) Avg Daily Temperature

78
CHAPTER 4
Spatial Ecology and Wetland Habitat Use of Common Snapping Turtles (Chelydra
serpentina) and Yellow-bellied sliders (Trachemys scripta) in a Longleaf Pine Ecosystem
Introduction
Geographically isolated wetlands within the Coastal Plain of the southeastern United
States support high herpetofaunal diversity (Guyer and Bailey, 1993; Semlitsch et al., 1996).
Isolated wetlands vary in size, depth, vegetation, and surrounding landscape characteristics, and
although the influence of these wetland characteristics on amphibians has been described
(Pechmann et al., 1989; Rothermel and Semlitsch, 2002; Liner et al., 2008), their influence on
reptiles, and aquatic turtles in particular, is less well known. As many of these wetlands dry
down seasonally, aquatic fauna often migrate through uplands, which were historically longleaf
pine forests (Pinus palustris) to more permanent aquatic habitats (Subalusky et al., 2009). Thus,
the upland habitat surrounding geographically isolated wetlands is critical to providing
connectivity for migrating aquatic species. Research examining the permeability of upland
habitats for aquatic fauna has primarily focused on amphibians (Semlitsch, 1998; Doyle et al.,
2004). Much less is known about the importance of upland permeability for turtles despite the
importance of geographically isolated wetlands for this group (Gibbons, 1983; Buhlmann and
Gibbons, 2001; Chapter 2).
The Southeastern Coastal Plain of the United States has a variety of freshwater systems
including tens of thousands of geographically isolated wetlands, i.e., wetlands that are typically

79
not hydrologically connected to permanent bodies of water (Tiner, 2003; Martin et al., 2012).
Several types of geographically isolated wetlands occur in the region, including cypress-gum
swamps, grassy marshes, and cypress savannas (Kirkman et al., 2000). Cypress-gum swamps
are characterized by a dense canopy of pond cypress (Taxodium ascendens) and swamp tupelo
(Nyssa biflora) with little to no understory, and have organic soils. Grassy marshes have an open
canopy structure with an understory of panic grasses (Panicum spp.) and cutgrass (Leersia
hexandra), and sandy soils (Kirkman et al., 2000). Cypress savannas have a sparse canopy of
pond cypress with an understory similar to that of grassy marshes. Geographically isolated
wetlands rely on rainfall to fill, and generally dry down in late spring and summer due to
decreased rainfall and increased evapotranspiration (Battle and Golladay, 2001). Determining the
degree to which turtles use these wetlands and their surrounding habitat will provide information
on wildlife linkages in these geographically isolated habitats and help identify priority
conservation areas.
The common snapping turtle (Chelydra serpentina), and the yellow-bellied slider
(Trachemys scripta) are widespread species that inhabit a variety of freshwater systems and
exhibit long range terrestrial movements (Morreale et al., 1984; Steen et al., 2010). C. serpentina
is one of the largest turtle species in North America and ranges east of the Rocky Mountains
from Southern Canada to South Florida (Ernst et al., 1994). Habitat selection of C. serpentina
has primarily been studied in the northern extent of its range; few studies exist on habitat
selection in the southern part of its range or in geographically isolated wetlands. A study at a
central Florida lake suggested that C. serpentina preferred habitats with slow moving water,
abundant aquatic vegetation and a soft muddy bottom (Bancroft et al., 1983). A separate study in

80
north Florida found that C. serpentina occurred in greatest abundance in small suburban ponds
(Aresco and Gunzburger, 2007).
Trachemys scripta is a medium-sized turtle with three subspecies within the United States
(T. scripta elegans, T. scripta scripta, and T. scripta troostii). T. scripta scripta, the yellow-
bellied slider, ranges from southern Virginia to northern Florida and is the target subspecies for
this study (Ernst et al., 1994). The majority of ecological studies on the yellow-bellied slider
have been performed at the Savanna River Ecology Laboratory in Aiken County, South Carolina
(Gibbons, 1990). T. scripta are found in aquatic habitats similar to the common snapping turtle;
however, they also prefer habitats with quality basking sites (Ernst et al., 1994).
In this study, I used radio-telemetry to monitor movements of C. serpentina and T.
scripta to describe their use of geographically isolated wetlands versus streams. Thus, the first
objective of this study was to examine aquatic habitat use of each species. The study took place
during a period of drought recovery from late winter-summer 2013 (Georgia Environmental
Monitoring Network, http://georgiaweather.net). Based on previous studies of these species I
hypothesized that individuals of both species would use multiple geographically isolated wetland
types and, to a lesser extent, other aquatic habitats (i.e., streams and agricultural ponds) in
proximity to isolated wetlands. I expected T. scripta to move greater distances within and among
wetlands because they are smaller and more mobile than C. serpentina and the species has been
described as a habitat generalist (Ernst et al., 1994). I also hypothesized that within
geographically isolated wetlands, both species would select deeper habitats, which typically are
the last areas to dry and often contain abundant vegetation and quality basking sites. The second
objective of this study was to use telemetry locations of turtles and terrestrial habitat selection
data (Chapter 3) to generate theoretical paths of overland movement of turtles using ArcGIS and

81
two software packages: Linkage Mapper, which identifies measurable least-cost paths
throughout a landscape (McRae and Kavanagh, 2011), and Circuitscape, a tool that uses circuit
theory to map probable flow as a function of landcover resistance by running “currents” between
core habitats in a landscape (McRae and Shah, 2009).
Methods
Study Site
The study took place on Ichauway, the 11,300 ha research site of the Joseph W. Jones
Ecological Research Center, which is located in the Dougherty Plain physiographic district in
Baker County, Georgia. Ichauway is a private reserve managed for longleaf pine (Pinus
palustris) and Northern bobwhite quail (Colinus virginianus) and primarily consists of mature
long leaf pine upland habitat with an open canopy and a wiregrass (Aristida stricta) dominated
understory. Other pine species including slash pine (P. elliottii) and loblolly pine (P. taeda) are
also present in addition to hardwoods (Quercus spp.). Ichauway also contains scrub habitat,
deciduous riparian forest, pine plantations, small agricultural fields and wildlife food plots, and
areas classified as developed consisting of buildings and houses. There are more than 90
geographically isolated wetlands on Ichauway, including cypress-gum swamps, cypress
savannas, and grassy marshes (Kirkman et al., 2000). Other aquatic habitats include hardwood
depressions and streams. Hardwood depressions are dominated by oaks (Quercus spp.) and are
only occasionally inundated. Ichawaynochaway Creek is a tributary of the Flint River with
numerous limestone shoals and deep sandy areas that runs south for >100 km through
agricultural and forested land before joining the Flint River, and was the primary stream habitat
used in this study. Ichauway is also bordered on the east by a 21 km section of the Flint River. A

82
number of altered ponds are located in the surrounding agricultural lands bordering on Ichauway,
and thus had the potential to be inhabited by turtles.
Turtle Captures and Radio Telemetry
From January 2013-May 2013, 12 male T. scripta and 14 C. serpentina (4 males, 10
females; Table 4-1) were captured either incidentally on land or in baited hoop traps in wetlands
(0.9 m diameter, four hoops, 3.8 cm mesh; Memphis Net and Twine, Memphis, TN, USA;
Chapter 2). All turtles captured were assigned unique identification numbers by notching the
marginal scutes (Cagle, 1939). For each turtle, mass (g), plastron length (mm), and carapace
length (mm) were recorded (Table 4-1). Transmitters (Model SI-2E, 9 g, Holohil Systems Ltd.,
Ontario, Canada; Model R1860, 15.3 g, ATS Advanced Telemetry Systems, Isanti, MN) were
then attached to the carapace of each turtle using PC-plumbing putty epoxy (Protective Coating
Co., Allentown, PA). Turtles were radio tracked by homing approximately once per week
through 31 August 2013 using a three-element folding Yagi antenna (Wildlife Materials, Inc.,
Murphysboro, IL) and R1000 radio-telemetry receiver (Communication Specialists Inc., Orange,
CA). The following data were collected each time a turtle was tracked: location taken with a
Trimble Juno Global Positioning System (GPS; Trimble Navigation, Ltd, Sunnyvale, CA),
general habitat type, and several behavioral traits. Habitat types consisted of the following:
cypress gum swamps, grassy marshes, cypress savannas, hardwood depressions, streams,
agricultural ponds, and terrestrial habitat. Behavior consisted of basking, feeding, mating, nesting
(females), moving (either swimming or travelling overland), and stationary. GPS locations were
mapped using ArcGIS (version 9.3; Earth Systems Research Institute, Redlands, CA). Locations
separated by >5m were considered new locations.

83
Data Analysis
Movements and Aquatic Habitat Use
I calculated average daily movements of telemetered turtles using Euclidean distances
(ArcGIS) between consecutive locations for each turtle. I used a Student’s t-test to determine
whether mean daily movement differed significantly between C. serpentina and T. scripta.
Contour data (0.25 m resolution) were available for 8 of the geographically isolated wetlands
used by turtles. I used these data in ArcGIS to show where turtles were encountered in these
wetlands (Beyer, 2004. Hawth's Analysis Tools for ArcGIS).
I examined habitat use of both species by categorizing the habitats at each location (C.
serpentina ,n= 223; T. scripta, n= 162) as one of the following using an existing landcover data
layer for Ichauway: cypress gum swamps, grassy marshes, cypress savannas, hardwood
depressions, streams, agricultural ponds, and terrestrial habitat. I used a Wilcoxon rank sum test
(PROC npar1way; SAS 9.3) to test for differences in habitat use between C. serpentina and T.
scripta.
Connectivity Modeling
I created a raster layer (1-m cells) of existing landcover vector data for Ichauway and
used the results of the habitat association analysis in Chapter 3 to appoint resistance values to
each landcover type described above. Lower raster values signified lower resistance (greater
ease) of movement by turtles, while higher values represented greater resistance (Figure 4-1).
Agricultural land consisted of small wildlife food plots and offsite center-pivot agricultural

84
fields, and was shown to be avoided by T. scripta (Chapter 3). Hardwood forests were typically
riparian bottomlands and contained live oak (Quercus virginiana), water oak (Q. nigra), laurel
oak (Q. laurifolia), and red oak (Q. falcata), while hardwood pine mixed contained both oaks
and pines. Open water included Ichawaynochaway Creek and the Flint River. Pine plantations
were typically <10 years old, though some were mature pine stands and all had generally less
groundcover than upland pine habitat. Scrub habitat contained both oak thickets and abandoned
pastures. Pine plantations and scrub were avoided by T. scripta in the habitat association analysis
(Chapter 3). Upland pine habitat was dominated by mature longleaf pine, but also contained
slash pine and loblolly pine and diverse herbaceous groundcover. Developed areas included
homes, barns and other buildings, and roads and were appointed a high resistance value due to
increased risk to turtles from vehicles. Wetland habitat consisted of cypress gum swamps,
cypress savannas, and grassy marshes. Only turtles that exhibited overland movement were used
in this analysis. Locations of each telemetered turtle that used >1 habitat (4 C. serpentina, 8 T.
scripta) were overlaid onto a landcover layer using ArcGIS, and Linkage Mapper (ArcGIS;
McRae and Kavanagh, 2011; McRae et al., 2012) was run for each individual using the GPS
locations as core areas, while Circuitscape (Version 3.5.8; McRae and Shah, 2009; Zeigler et al.,
2011) was run using wetlands occupied by each turtle as core regions.
Least cost paths (LCP; in meters) for overland movement were generated using Linkage
Mapper and compared to overland Euclidean distance data (m) for each turtle, to determine of
turtles would have to move significantly greater distances between wetlands to pass through less
resistant habitats. In addition, I compared average cost-to-distance ratios for LCP’s and
Euclidean distances using a Student’s t test. I then used the outputs from Circuitscape, which
uses electronic circuit theory to generate maps, with core habitats represented as electrical nodes
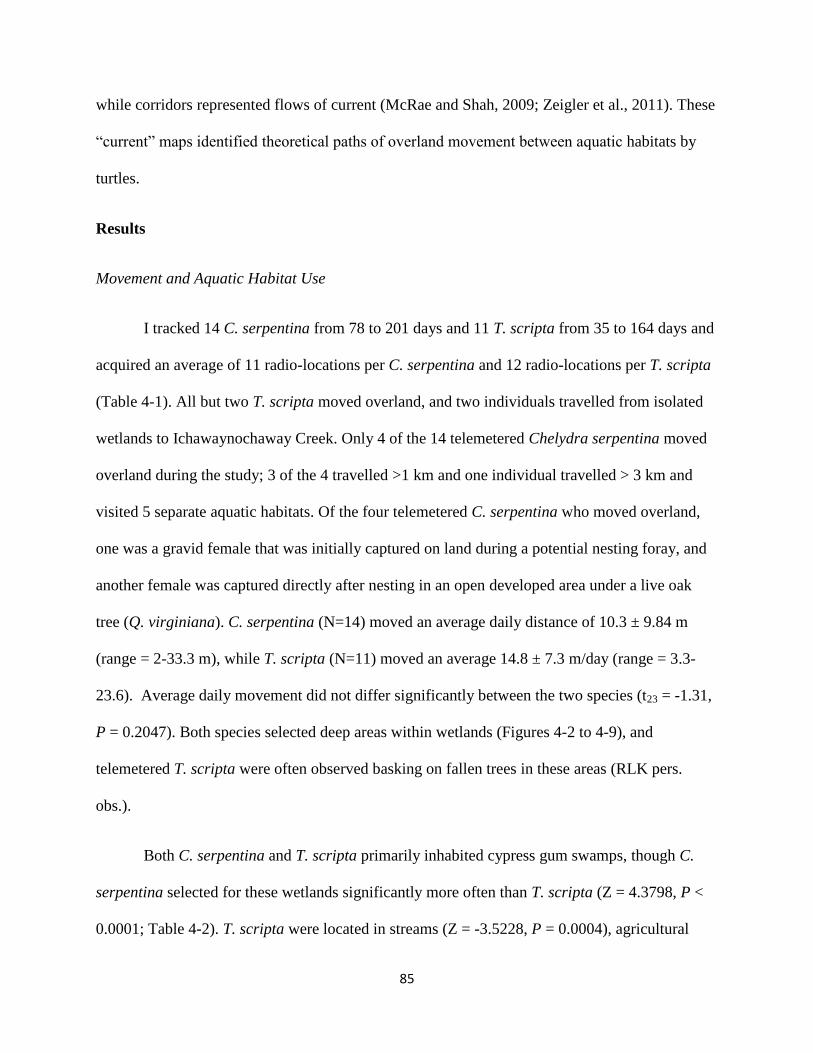
85
while corridors represented flows of current (McRae and Shah, 2009; Zeigler et al., 2011). These
“current” maps identified theoretical paths of overland movement between aquatic habitats by
turtles.
Results
Movement and Aquatic Habitat Use
I tracked 14 C. serpentina from 78 to 201 days and 11 T. scripta from 35 to 164 days and
acquired an average of 11 radio-locations per C. serpentina and 12 radio-locations per T. scripta
(Table 4-1). All but two T. scripta moved overland, and two individuals travelled from isolated
wetlands to Ichawaynochaway Creek. Only 4 of the 14 telemetered Chelydra serpentina moved
overland during the study; 3 of the 4 travelled >1 km and one individual travelled > 3 km and
visited 5 separate aquatic habitats. Of the four telemetered C. serpentina who moved overland,
one was a gravid female that was initially captured on land during a potential nesting foray, and
another female was captured directly after nesting in an open developed area under a live oak
tree (Q. virginiana). C. serpentina (N=14) moved an average daily distance of 10.3 ± 9.84 m
(range = 2-33.3 m), while T. scripta (N=11) moved an average 14.8 ± 7.3 m/day (range = 3.3-
23.6). Average daily movement did not differ significantly between the two species (t23 = -1.31,
P = 0.2047). Both species selected deep areas within wetlands (Figures 4-2 to 4-9), and
telemetered T. scripta were often observed basking on fallen trees in these areas (RLK pers.
obs.).
Both C. serpentina and T. scripta primarily inhabited cypress gum swamps, though C.
serpentina selected for these wetlands significantly more often than T. scripta (Z = 4.3798, P <
0.0001; Table 4-2). T. scripta were located in streams (Z = -3.5228, P = 0.0004), agricultural

86
ponds (Z = -1.9646, P = 0.0495), and hardwood depressions (Z = -3.9581, P < 0.0001)
significantly more than C. serpentina. I found no difference in use of grassy marshes (Z =
1.4515, P = 0.1466), cypress savannas (Z = 0.9938, P = 0.3203), and terrestrial habitat (Z = -
1.6432, P = 0.1003) between the two species.
Connectivity Modeling
Overland Euclidean distance and least cost paths (LCP) varied greatly among individuals
(Euclidean: 311-3189 m; LCP: 240-4024.7 m), and LCP distances were greater than Euclidean
distances for 9 of the 12 turtles, although there was no significant difference between the mean
LCP and Euclidean distance for all turtles (t14 = 0.91, P= 0.3775). Mean cost-to-distance ratios
(Euclidean and LCP) also varied among individuals, although cost-to-LCP ratios were
consistently, but not significantly (t24 =0.44, P = 0.6667), lower than cost-to-Euclidean distance
ratios for all individuals (Table 4-3).
Current maps for 4 C. serpentina and 8 T. scripta are presented in Figures 4-10 to 4-21.
Flow paths created by currents varied depending on the distance among core habitats in addition
to the surrounding landscape type. Many of the maps provided more than one flow path of
current between cores. For example, one female C. serpentina, ID # 470, used two agricultural
ponds that were 1.5 km apart during the study (Figure 4-10). The current map for this individual
provided several flow paths from the pond of origin through forested landscape before narrowing
down to a single path through an agricultural field to the other agricultural pond. Another turtle,
a male T. scripta, was originally captured moving away from Ichawaynochaway Creek and
visited two flooded hardwood depressions before moving to a cypress gum swamp (Figure 4-11).

87
The current map for this individual did not provide specific flow paths, but instead depicted a
broad path between the visited wetland systems.
Discussion
Daily movement varied greatly among individual turtles in this study, and there was no
difference in movement distances between C. serpentina and T. scripta despite the difference in
body size and mobility between the two species. Additionally, total overland movement
distances were highly variable and only 4 of the 14 telemetered C. serpentina moved overland
during the study; however, 3 of these 4 turtles travelled >1 km overland during the study and one
individual travelled > 3km demonstrating the ability of this large aquatic turtle to move long
distances overland. Other studies have found that movement between aquatic habitats varies by
sex in turtles, and that adult males move overland more often during mating season and adult
females move farther during nesting season (Morreale et al., 1984). Male turtles typically move
overland to increase mating opportunities and thus, reproductive fitness (Berry and Shine, 1980;
Morreale et al, 1984; Gibbons, 1986, Tuberville et al., 1996). These assumptions were only
partially confirmed by my results, as males did exhibit overland movements during mating
season (April-November for C. serpentina, spring and fall months for T. scripta; Ernst et al,
1994); however, two of the four C. serpentina that moved overland were females and one of
those females made several overland movements outside of nesting season (May-June; Ernst et
al. 1994). Other studies have used turtle size as a predictor of movement, with larger turtles
making more frequent overland movements than smaller turtles (House et al., 2010). However,
in my study I tracked adult turtles of relatively similar sizes and it did not appear that body size
within species influenced distance moved. Thus, my results were not consistent with these
previous studies regarding the importance of size relative to distances travelled.

88
One possible explanation for the observed difference in propensity to move overland may
relate to landscape and aquatic habitat availability in the region as well as rainfall patterns during
the course of the study. The Dougherty Plain is composed of many small geographically isolated
wetlands that dry up and fill depending on a multitude of variables (i.e., soil, elevation, climate,
surrounding landscape), with fewer permanent aquatic habitats available (e.g. streams,
reservoirs). The scarcity of permanent aquatic habitat may force turtles to use these dynamic
aquatic ecosystems as “stepping-stones” over their lifetimes as they search for resources and
mates.
My habitat use results indicated that C. serpentina primarily were most often found in
cypress gum swamps (83.95% of locations), rarely used grassy marshes, cypress savannas,
agricultural ponds, and did not use hardwood depressions or streams. However, it was surprising
that C. serpentina primarily inhabited cypress gum swamps as this species also typically inhabits
a large variety of aquatic habitats throughout its range; thus, this species may be more selective
of aquatic habitat than previously thought (Ernst et al., 1994; Aresco and Gunzberger, 2007). A
previous study at Ichauway noted the use of hardwood depressions and streams by adult C.
serpentina (Steen et al., 2010), but these habitats were not used by individuals in the current
study. I think the difference in habitat selection may be explained by differences in aquatic
habitat availability, as the region was experiencing low precipitation and nearly all of the isolated
depressional wetlands were dry during the previous study. In contrast, during the telemetry
portion of my study, which followed a significant regional drought, rainfall was frequent and the
majority of the wetlands were inundated in the current study (Georgia Environmental Monitoring
Network, http://georgiaweather.net; Steen et al., 2010).
89
Trachemys scripta also primarily used cypress gum swamps (62.35%), but also showed
greater breadth in habitats selected including grassy marshes, streams, agricultural ponds, and
hardwood depressions. Trachemys scripta’s generalist habitat selection has been previously
noted (Gibbons, 1990; Ernst et al., 1994). The use of both isolated wetlands and a stream
suggests that this species can provide a link between aquatic ecosystems much like the American
alligator (Subalusky et al., 2009). Additional study is needed to explore functional contributions
that this species may provide to both aquatic systems (Deegan, 1993, Gibbons et al., 2006;
Register et al., 2006).
Within geographically isolated wetlands, both C. serpentina and T. scripta appeared to
prefer the deepest habitats. The deepest portions of the wetlands hold water longest (RLK pers.
obs.); however, turtles continued to use these habitats even when the wetlands were fully
inundated. There may be other aspects of deep areas that attracted turtles. Many of the deepest
areas in geographically isolated wetlands (primarily cypress gum swamps) in this study received
direct sunlight due to openings in the canopy, abundant vegetation including buttonbush
(Cephalanthus occidentalis), and large woody debris (RLK pers. obs.). The combination of
sunlight and woody debris may attract T. scripta, who often bask for thermoregulatory purposes
(Ernst et al., 1994). Chelydra serpentina typically do not bask but may also prefer these areas for
thermoregulatory purposes as well as the abundance of aquatic vegetation (Brown et al., 1990;
Ernst et al., 1994). The deepest portion of the wetlands may also contain a stable prey base for
turtles (Moll and Moll, 2004; Edwards et al., 2013).
Linkage Mapper and Circuitscape appeared to be useful tools for mapping potential
movement corridors for turtles across landscapes, though both had limitations. Circuitscape
generated multiple broad areas for potential movement and was able to illustrate the affects of

90
distance and landscape on resistance of movements, but only provided visual outputs and little
measurable data. Linkage Mapper was useful for calculating specific least cost path distances
and cost-to-distance ratios based on likely permeability of different habitats and distance
between core habitats. This method was useful for obtaining quantifiable data that could be
tested statistically, but may not be realistic, as the LCPs were only one pixel (1 m x 1 m) wide. A
caveat to using these programs is the need to have specific data on the ecology and habitat
permeability for the organism of interest. For this study I was able to use the habitat selection
results from a previous study on T. scripta (see Chapter 3); however; my sampling did not
capture the annual home range of the turtles and may have under-represented their use of certain
habitats. Moreover, these data may not be applicable for other turtle species in the same
landscape, including C. serpentina, which may select different overland habitats to travel
through than T. scripta. Therefore, I believe it is important for future research to obtain more
data on species-specific overland habitat selection to more accurately model movement
corridors, and to utilize multiple connectivity programs to best model potential corridors.
91
Literature Cited
Aresco, M. J. and M. S. Gunzburger. 2007. Ecology and morphology of Chelydra serpentina in
Northwestern Florida. Southeastern Naturalist 6: 435-448.
Bancroft, G. T., J. S. Godley, D. T. Gross, N. N. Rojas, D. A. Sutphen, and R. W. McDiarmid.
1983. Large-scale operations management test of use of the white amur for control of
problem aquatic plants. The Herpetofauna of Lake Conway: Species Accounts.
Miscellaneous Paper A-83-5.
Battle, J. and S.W. Golladay. 2001. Water quality and macroinvertebrate assemblages in three
types of seasonally inundated limesink wetlands in southwest Georgia. Journal of
Freshwater Ecology 16: 189-207.
Berry, J. F. and R. Shine. 1980. Sexual size dimorphism and sexual selection in turtles (Order
Testudines). Oecologia 44: 185-191.
Beyer, H. L. 2004. Hawth's Analysis Tools for ArcGIS.
Brown, G., J. B. Ronald, and A. L. James. 1990. Radiotelemetry of body temperatures of free-
ranging snapping turtles (Chelydra serpentina) during summer. Canadian Journal of
Zoology 68: 1659-1663.
Buhlmann, K. A. and J. W. Gibbons. 2001. Terrestrial habitat use by aquatic turtles from a
seasonally fluctuating wetland: implications for wetland conservation boundaries.
Chelonian Conservation and Biology 4: 115-127.

92
Deegan, L. A. 1993. Nutrient and energy transport between estuaries and coastal marine
ecosystems by fish migration. Canadian Journal of Fisheries and Aquatic Sciences 50:
74-79.
Doyle, M. C., R. C. Mank, B. B. Rothermel, and R. D. Semlitsch. 2004. Substrate cues influence
selection by spotted salamanders. Journal of Wildlife Management 14: 685-691.
Edwards, L., H. O. Nourse, C Nourse, J. Ambrose, and L. K. Kirkman. 2013 The Natural
Communities of Georgia. Athens: University of Georgia Press, Athens, GA.
Ernst, C., J. Lovich, and R. Barbour. 1994. Turtles of the United States. Smithsonian Institution
Press. Washington, DC.
Gibbons, J. W. 1983. Reproductive characteristics and ecology of the mud turtle, Kinosternon
subrubrum (Lacepede). Herpetologia 39: 254-271.
Gibbons, J. W. 1986. Movement patterns among turtle populations: applicability to management
of the desert tortoise. Herpetologica 42: 104-113.
Gibbons, J.W. 1990. Turtle studies at SREL: A research perspective. Pp. 19-44. In Gibbons J.W.
(ed.) Life History and Ecology of the Slider Turtle. Smithsonian Institution Press.
Washington, DC.
Gibbons, J.W., Winne, C.T., Scott, D.E., Willson, J.D., Glaudas, X., Andrews, K.M., Todd,
B.D., Fedewa, L.A., Wilkinson, L., Tsaliagos, R.N., Harper, S.J., Greene, J.L.,
Tuberville, T.D., Metts, B.S., Dorcas, M.E., Nestor, J.P., Young, C.A., Akre, T., Reed,
R.N., Buhlmann, K.A., Norman, J., Croshaw, D.A., Hagen, C., Rothermel, B.B., 2006.

93
Remarkable amphibian biomass and abundance in an isolated wetland: implications for
wetland conservation. Conservation Biology 20, 1457–1465.
Guyer, C. and M. A. Bailey. 1993. Amphibians and reptiles of longleaf pine communities. Pp.
130-158 In The Longleaf Pine Ecosystem: Ecology, Restoration and Management.
Hermann, S. M. (Ed.) Tall Timbers Research Station, Tallahassee, FL.
House, W. J., I. M. Nall, and R. B. Thomas. 2010. Interpond movement of western painted
turtles (Chrysemys picta) in East-Central Kansas. The Southwestern Naturalist 55: 403-
410.
Kirkman, L.K., P.C. Goebel, L. West, M.B. Drew, and B.J. Palik. 2000. Depressional wetland
vegetation types: a question of plant assemblage development. Wetlands 20:373-385.
Liner, A. E., L. L. Smith, S. W. Golladay, S. B. Castleberry, and J. W. Gibbons. 2008.
Amphibian distributions within three types of isolated wetlands in southwest Georgia.
American Midland Naturalist 160: 69-81.
Martin, G. L., L. K. Kirkman, and J. Hepinstall-Cymerman. 2012. Mapping geographically
isolated wetlands in the Dougherty Plain, Georgia, USA. Wetlands 32: 149-160.
McRae, B. H., S. Hall, P. Beier, and D. M. Theobold. 2012. Where to restore ecological
connectivity? Detecting barriers and quantifying restoration benefits. PLoS ONE 7: 1-12.
McRae, B.H. and D.M. Kavanagh. 2011. Linkage Mapper Connectivity Analysis Software. The
Nature Conservancy, Seattle WA.
McRae, B.H., and Shah, V.B. 2009. Circuitscape User Guide. ONLINE. The University of
California, Santa Barbara.

94
Moll, D. and E. O. Moll. 2004. The Ecology, Exploitation, and Conservation of River Turtles.
Oxford University Press, Oxford, NY.
Morreale, S. J., J. W. Gibbons, and J. D. Congdon. 1984. Significance of activity and movement
in the yellow-bellied slider turtle (Pseudemys scripta). Canadian Journal of Zoology 62:
1038-1042.
Pechmann, J. H. K., D. E. Scott, J. W. Gibbons, and R. D. Semlitsch. 1989. Influence of wetland
hydroperiod on diversity and abundance of metamorphosing juvenile amphibians.
Wetlands Ecology and Management 1: 3-11.
Regester, K.J., Lips, K.R., Whiles, M.R., 2006. Energy flow and subsidies associated with the
complex life cycle of ambystomatid salamanders in ponds and adjacent forest in southern
Illinois. Oecologia 147, 303–314.
Rothermel, B. B. and R. D. Semlitsch. 2002. An experimental investigation of landscape
resistance of forest versus old-field habitats to emigrating juvenile amphibians.
Conservation Biology 16: 1324-1332.
SAS Institute Inc. 2008. User installation guide for SAS 9.1.3 foundation for Microsoft
Windows, Cary, NC.
Semlitsch, R. D., D. E. Scott, J. H. K. Pechmann, and J. W. Gibbons. 1996 Structure and
dynamics of an amphibian assemblage: evidence from a 16-year study of a natural pond.
Pp. 217-248. In Long Term Studies of Vertebrate Communities. Cody, M. I. and J. A.
Smallwood (eds.), Long-term studies of vertebrate communities. Academic Press, San
Diego, California.

95
Semlitsch, R.D. and J.R. Bodie. 1998. Are small, isolated wetlands expendable? Conservation
Biology 12: 1129-1133.
Steen, D. A., S. C. Sterrett, A. M. Heupel, and L. L. Smith. 2010. Snapping turtle, Chelydra
serpentina, overland movements near the Southeastern extent of its range. Georgia
Journal of Science 68: 196-201.
Subalusky, A. L., L. A. Fitzgerald, and L. L. Smith. 2009. Ontogenetic niche shifts in the
American alligator establish functional connectivity between aquatic systems. Biological
Conservation 142: 1507-1514.
Tiner, R. W. 2003. Geographically isolated wetlands of the United States. Wetlands 23: 494-516.
Tuberville, T. D., J.W. Gibbons, and J.L Greene. 1996. Invasion of new aquatic habitats by male
freshwater turtles. Copeia 1996: 713-715.
Zeigler, S. L., M. C. Neel, L. Oliveira, B. E. Raboy and W. F. Fagan. 2011. Conspecific and
heterospecific attraction in assessments of functional connectivity. Biodiversity
Conservation 20: 2779-2796.

96
Table 4-1. Mean body size (CL =carapace length), mass (g), and tracking data for 11 telemetered
male yellow-bellied sliders, T. scripta, and 14 (4 male, 10 female) common snapping turtles, C.
serpentina, at Ichauway, Baker County, Georgia, 2013.
Means (std) Mass (g) CL (mm) No. Loc. No. day tracked
Female C. serpentina 7190.0 (1770.4) 325.6 (25.7) 1.2 (.4) 113.3 (26.9)
Male C. serpentina 7375.0 (2509.2) 341.5 (43.1) 2.5 (1.9) 181.0 (32.6)
Overall C. serpentina 7242.9 (1905.3) 330.1 (30.7) 1.6 (1.2) 132.6 (41.9)
T. scripta 1065.7 (191.2) 193.6 (23.1) 1.9 (1.0) 138.5 (41.4)

97
Table 4-2. Average percentage of locations and Wilcoxon rank sum Z test statistics in different habitat types used by C. serpentina
(n=162 locations) and T. scripta (n=162 locations) at Ichauway, Baker County Georgia, 2013. Differences were considered significant
at α=0.05.
Cypress
gum swamp
Grassy marsh Cypress
savanna
Stream Agricultural
wetland
Hardwood
depression
Terrestrial
C. serpentina
(n=162)
83.95 7.41 0.62 0.00 7.41 0.00 0.62
T. scripta
(n=162)
62.35 3.70 0.00 7.41 14.20 9.26 3.09
Z = 4.3798 Z = 1.4515 Z = 0.9938 Z = -3.5228 Z = -1.9646 Z = -3.9581 Z = -1.6432
P < 0.0001 P = 0.1466 P = 0.3211 P = 0.0004 P = 0.0495 P < 0.0001 P = 0.1003

98
Table 4-3. Euclidean distance (ED) and least cost paths (LCP) distances (in m) and cost: distance
ratios for overland movements for 4 C. serpentina and 8 T. scripta at Ichauway, Baker County
Georgia, 2013.
ID Species ED (m) Cost : ED. LCP (m) Cost : LCP
260 C. serpentina 311 4.9: 1 240 4.1: 1
470 C. serpentina 2161 59.9 : 1 2726 55.1 : 1
490 C. serpentina 1860 5.8 : 1 2058.5 4.9 : 1
540 C. serpentina 3189 22.8 : 1 4024.7 18.7 : 1
1813 T. scripta 1024 5.9 : 1 1667 4.8 : 1
1814 T. scripta 312.5 7.5 : 1 292.5 6.2 : 1
1815 T. scripta 1442 25.0 : 1 3379 16.7 : 1
1817 T. scripta 1125.9 7.3 : 1 1774.5 5.3 : 1
1821 T. scripta 1564 19.5 : 1 1257 17.2 : 1
1824 T. scripta 2578.2 7.7 : 1 2128.5 6.4 : 1
1825 T. scripta 2298.5 6.5 : 1 2832 5.9 : 1
1851 T. scripta 1585 9.4 : 1 1653 8.7 : 1
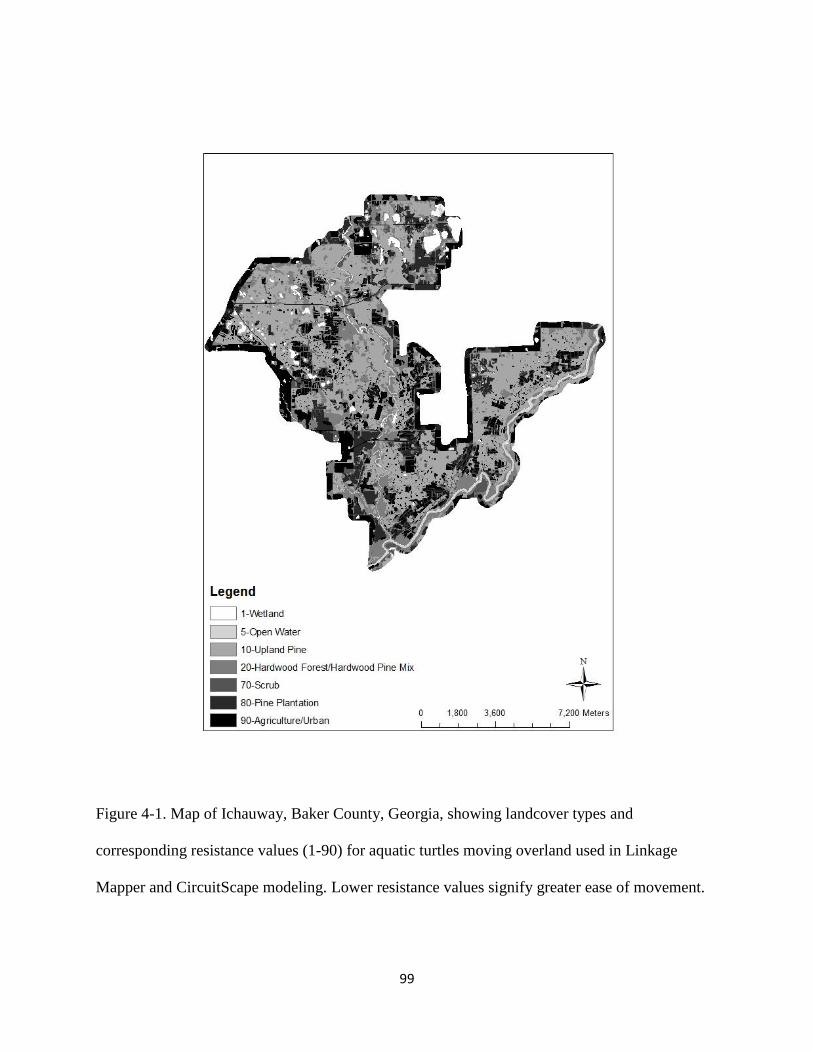
99
Figure 4-1. Map of Ichauway, Baker County, Georgia, showing landcover types and
corresponding resistance values (1-90) for aquatic turtles moving overland used in Linkage
Mapper and CircuitScape modeling. Lower resistance values signify greater ease of movement.
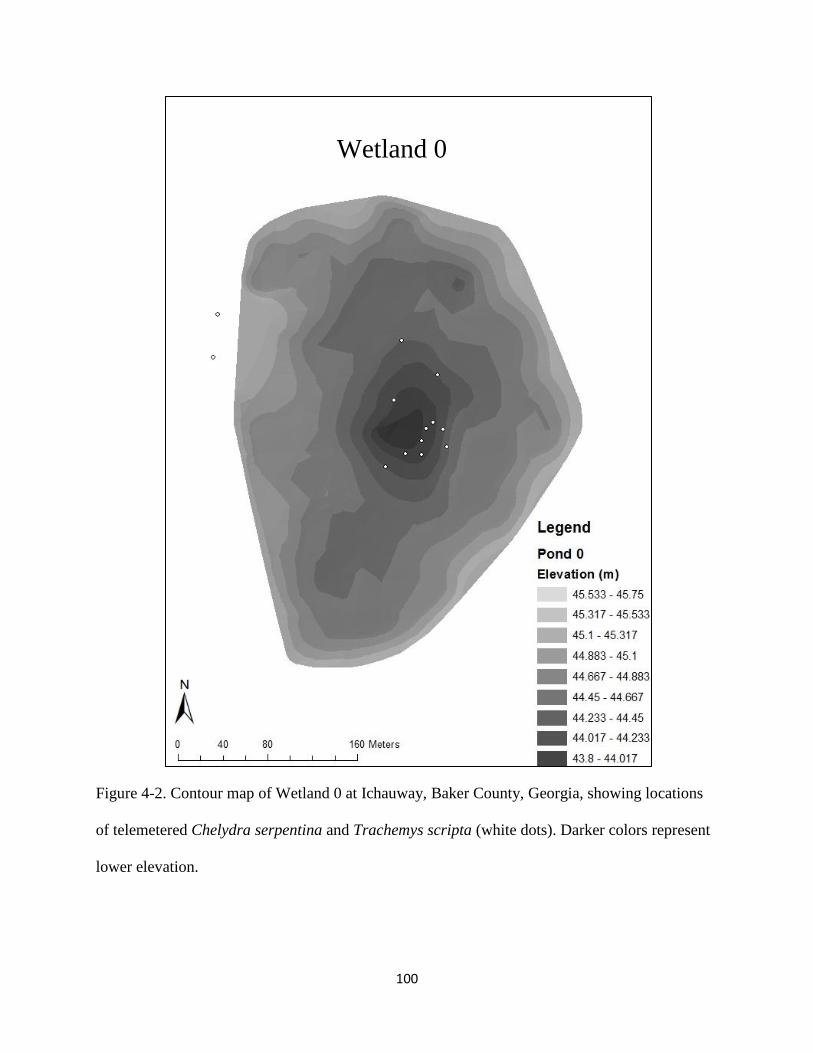
100
Figure 4-2. Contour map of Wetland 0 at Ichauway, Baker County, Georgia, showing locations
of telemetered Chelydra serpentina and Trachemys scripta (white dots). Darker colors represent
lower elevation.
Wetland 0

101
Figure 4-3. Contour map of Wetland 01 at Ichauway, Baker County, Georgia, showing locations
of telemetered Chelydra serpentina and Trachemys scripta (white dots). Darker colors represent
lower elevation.
Wetland 01

102
Figure 4-4. Contour map of Wetland 11 at Ichauway, Baker County, Georgia, showing locations
of telemetered Chelydra serpentina and Trachemys scripta (white dots). Darker colors represent
lower elevation.
Wetland 11

103
Figure 4-5. Contour map of Wetland 15 at Ichauway, Baker County, Georgia, showing locations
of telemetered Chelydra serpentina and Trachemys scripta (white dots). Darker colors represent
lower elevation.
Wetland 15

104
Figure 4-6. Contour map of Wetland 46 at Ichauway, Baker County, Georgia, showing locations
of telemetered Chelydra serpentina and Trachemys scripta (white dots). Darker colors represent
lower elevation.
Wetland 46
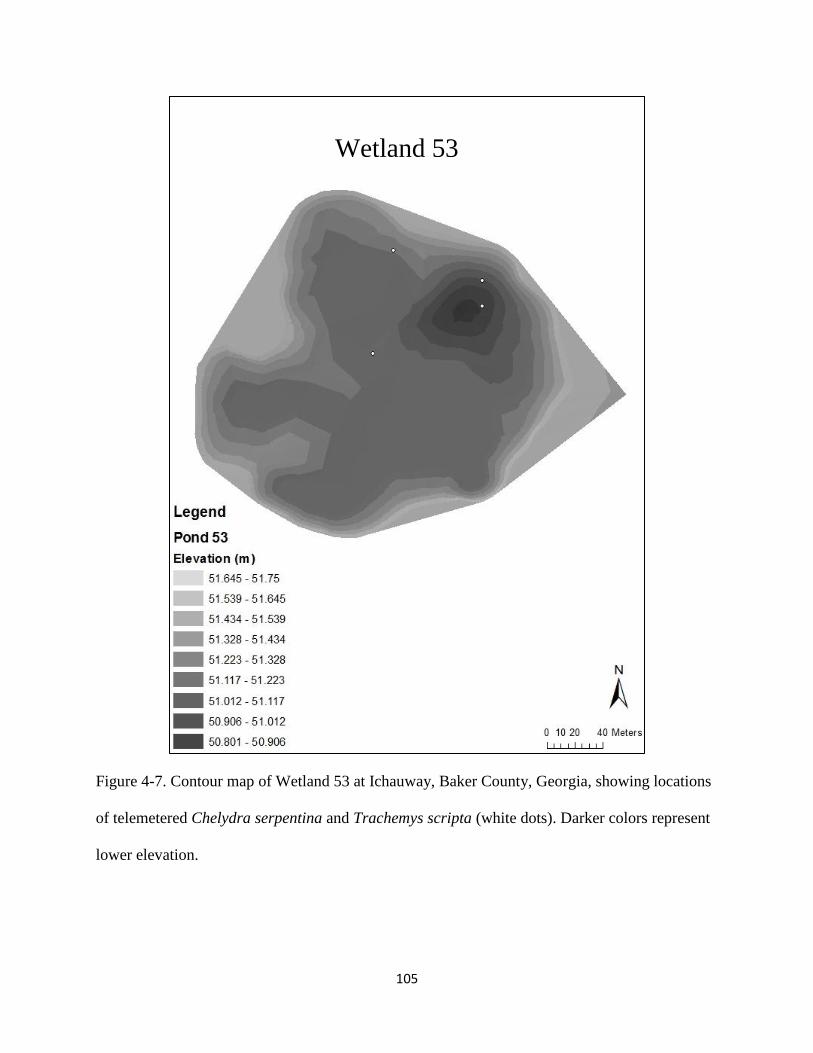
105
Figure 4-7. Contour map of Wetland 53 at Ichauway, Baker County, Georgia, showing locations
of telemetered Chelydra serpentina and Trachemys scripta (white dots). Darker colors represent
lower elevation.
Wetland 53

106
Figure 4-8. Contour map of Wetland 58 at Ichauway, Baker County, Georgia, showing locations
of telemetered Chelydra serpentina and Trachemys scripta (white dots). Darker colors represent
lower elevation.
Wetland 58

107
Figure 4-9. Contour map of Wetland 68 at Ichauway, Baker County, Georgia, showing locations
of telemetered Chelydra serpentina and Trachemys scripta (white dots). Darker colors represent
lower elevation.
Wetland 68

108
Figure 4-10. Current maps used to model probable movement between core habitat areas (blue
polygons) for adult Chelydra serpentina ID # 470 at Ichauway, Baker County, Georgia. Warmer
colors indicate areas with higher current density and greater ease of movement. Black lines
indicate roads.

109
Figure 4-11. Current maps used to map probable movement between core habitat areas (blue
polygons) for adult Trachemys scripta ID # 1821 at Ichauway, Baker County, Georgia. Warmer
colors indicate areas with higher current density and greater ease of movement. Black lines
indicate roads.

110
Figure 4-12. Current maps used to map probable movement between core habitat areas (blue
polygons) for adult Chelydra serpentina ID # 260 at Ichauway, Baker County, Georgia. Warmer
colors indicate areas with higher current density and greater ease of movement. Black lines
indicate roads.

111
Figure 4-13. Current maps used to map probable movement between core habitat areas (blue
polygons) for adult Chelydra serpentina ID # 490 at Ichauway, Baker County, Georgia. Warmer
colors indicate areas with higher current density and greater ease of movement. Black lines
indicate roads.
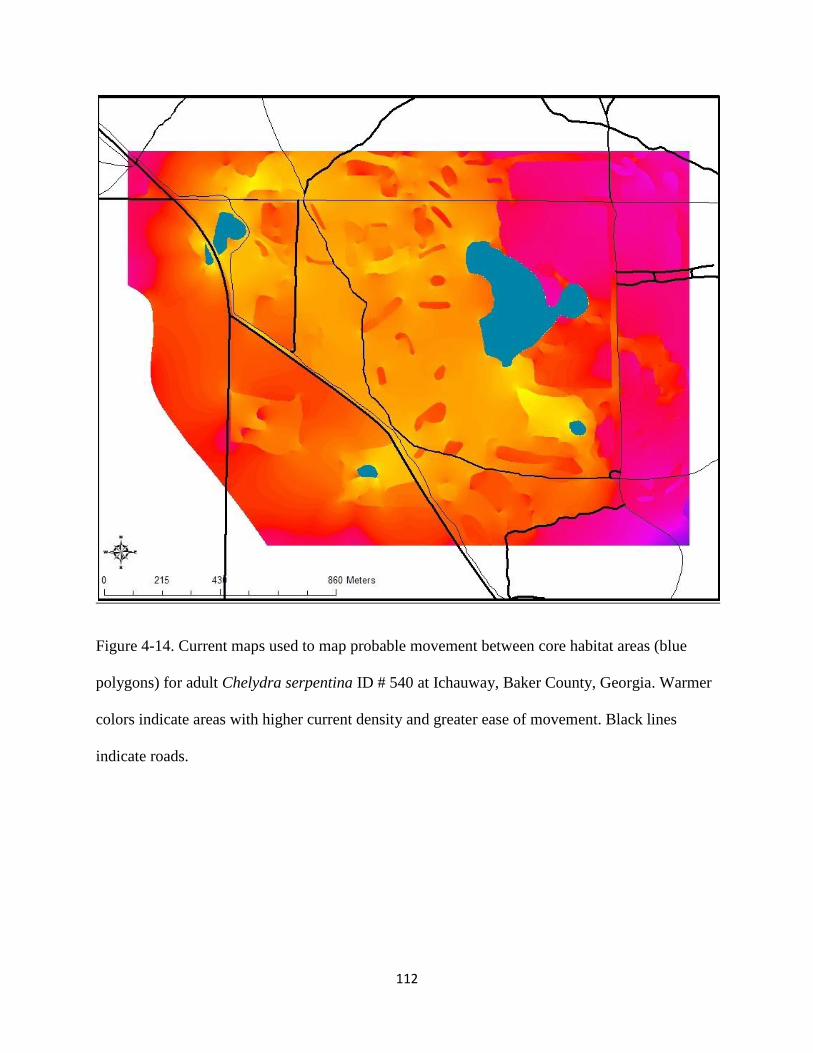
112
Figure 4-14. Current maps used to map probable movement between core habitat areas (blue
polygons) for adult Chelydra serpentina ID # 540 at Ichauway, Baker County, Georgia. Warmer
colors indicate areas with higher current density and greater ease of movement. Black lines
indicate roads.

113
Figure 4-15. Current maps used to map probable movement between core habitat areas (blue
polygons) for adult Trachemys scripta ID # 1813 at Ichauway, Baker County, Georgia. Warmer
colors indicate areas with higher current density and greater ease of movement. Black lines
indicate roads.

114
Figure 4-16. Current maps used to map probable movement between core habitat areas (blue
polygons) for adult Trachemys scripta ID # 1814 at Ichauway, Baker County, Georgia. Warmer
colors indicate areas with higher current density and greater ease of movement. Black lines
indicate roads.

115
Figure 4-17. Current maps used to map probable movement between core habitat areas (blue
polygons) for adult Trachemys scripta ID # 1815 at Ichauway, Baker County, Georgia. Warmer
colors indicate areas with higher current density and greater ease of movement. Black lines
indicate roads.

116
Figure 4-18. Current maps used to map probable movement between core habitat areas (blue
polygons) for adult Trachemys scripta ID # 1817 at Ichauway, Baker County, Georgia. Warmer
colors indicate areas with higher current density and greater ease of movement. Black lines
indicate roads.
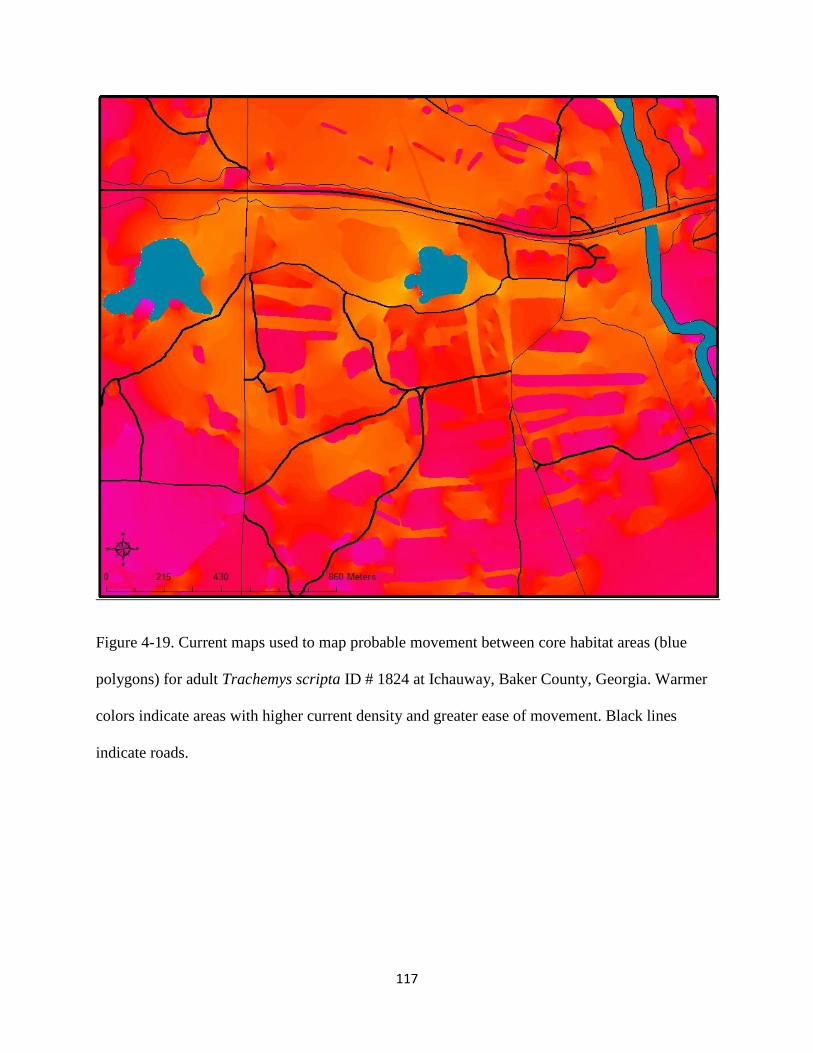
117
Figure 4-19. Current maps used to map probable movement between core habitat areas (blue
polygons) for adult Trachemys scripta ID # 1824 at Ichauway, Baker County, Georgia. Warmer
colors indicate areas with higher current density and greater ease of movement. Black lines
indicate roads.
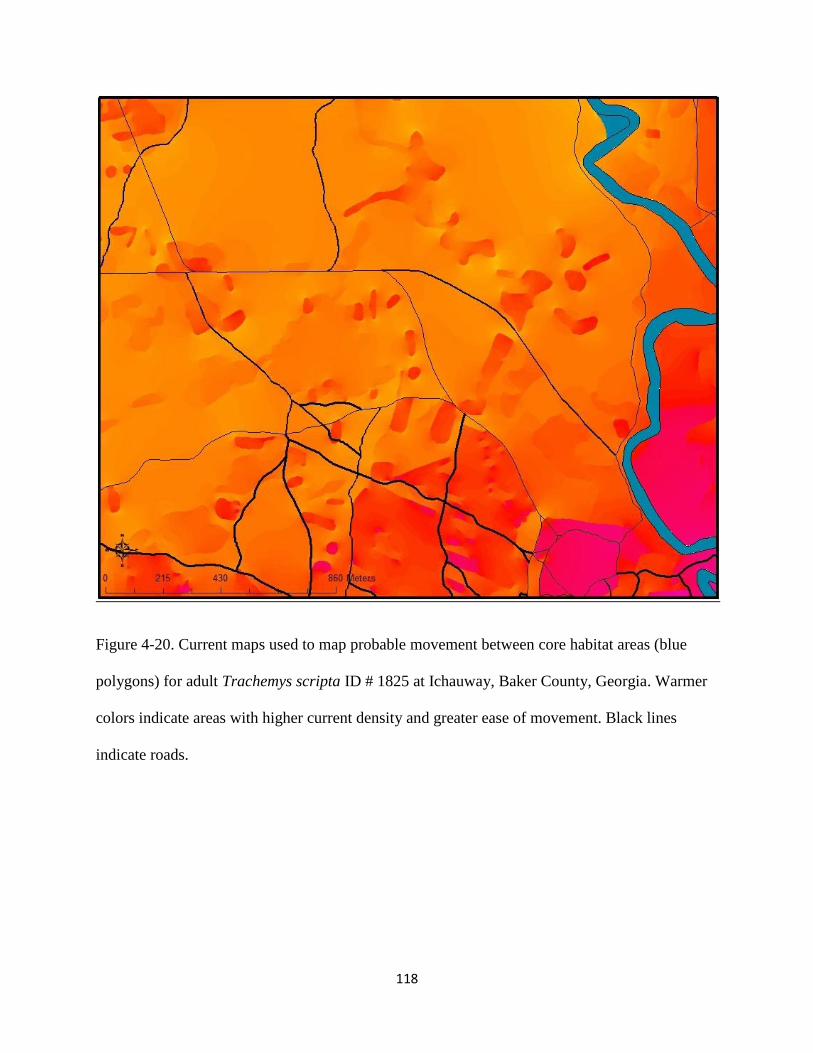
118
Figure 4-20. Current maps used to map probable movement between core habitat areas (blue
polygons) for adult Trachemys scripta ID # 1825 at Ichauway, Baker County, Georgia. Warmer
colors indicate areas with higher current density and greater ease of movement. Black lines
indicate roads.

119
Figure 4-21. Current maps used to map probable movement between core habitat areas (blue
polygons) for adult Trachemys scripta ID # 1851 at Ichauway, Baker County, Georgia. Warmer
colors indicate areas with higher current density and greater ease of movement. Black lines
indicate roads.

120
CHAPTER 5
Conclusions and Management Recommendations
Many studies have been conducted on aquatic turtles in the Southeastern U. S., yet little
is known about habitat selection and movements of turtles among geographically isolated
wetland systems, streams, and through the surrounding uplands landscapes. Both aquatic turtles
and isolated wetlands have been adversely affected by human land use and other activities in the
coastal plain of Georgia (Buhlmann and Gibbons, 1997; Kusler, 2001), and this study aimed to
expand knowledge on turtle use of isolated wetlands and show evidence of wildlife connectivity
within and among isolated wetlands and other aquatic habitats. Specifically, the objectives of this
study were to 1) describe differences in aquatic turtle assemblages in streams and geographically
isolated wetlands in the Dougherty Plain of Georgia; 2) use detection probabilities and radio
telemetry of turtles to identify important wetland variables predicting turtle occupancy of
isolated wetlands; 3) examine patterns of overland movement and terrestrial habitat associations
of aquatic turtles; and 4) generate theoretical corridors of terrestrial movement between aquatic
systems by turtles.
I trapped aquatic turtles in geographically isolated wetlands and Ichawaynochaway Creek
on Ichauway a private reserve managed for longleaf pine forest, to determine species
assemblages in these ecosystems. I found distinct difference in turtle presence, with only two
species, Trachemys scripta and Chelydra serpentina, present in the stream and wetlands.
Although both systems had similar estimates of species richness, the turtle assemblages were

121
dissimilar, signifying that both geographically isolated wetlands and stream systems are needed
to support regional turtle diversity. Captures of turtles were low compared to other studies
(Frazer et al., 1990; Thomas et al., 2008; Sterrett, 2009). However, this may have been due to
prolonged drought conditions that affected the hydrology of both the creek and the isolated
wetlands (United States Drought Monitor, 2012).
I determined the detection probabilities of turtles in geographically isolated wetlands
using occupancy modeling (MacKenzie et al. 2004). Specifically, I attempted to determine
whether vegetation type, wetland size, proximity to the creek and other wetlands, hydroperiod,
and surrounding forest cover influenced occupancy of wetlands by turtles. Of seven species were
detected, captures were dominated by, T. scripta. I found that for most species, detection
probability decreased with an increase in surrounding forest cover, while the detection
probability of T. scripta was highest in smaller wetlands. These results were unexpected, as I
hypothesized that large wetlands with a high percentage of surrounding forest cover would have
the highest turtle detection probabilities. I suggest these results may be due to an overall low
capture rate following a long term drought in which most isolated wetlands were dry
(unpublished data). My results may have also been biased by the high catch per unit effort in a
single wetland near the border of the study site, and by the increased capture probability in
smaller wetlands. My telemetry study on T. scripta and C. serpentina also provided insight into
isolated wetland characteristics important to aquatic turtles. Both species primarily used cypress
gum swamps, but also used grassy marshes and off-site agricultural ponds, and preferred the
deepest areas within these wetlands. Overall, T. scripta selected a wider variety of aquatic
habitats than C. serpentina including hardwood depressions and the creek. Both species’ use of
agricultural ponds was interesting and I suspect that these altered wetlands, which often have an

122
extended hydroperiods (RLK pers. obs.) provide suitable habitat for these and perhaps other
turtle species, particularly when isolated wetlands are not inundated.
My study showed that aquatic turtles in the Dougherty Plain use a wide array of isolated
wetland types and make frequent and extensive overland movements within the landscape.
Among the species in my study, T. scripta exhibited the most overland activity, Apalone ferox,
C. serpentina, Deirochelys reticularia, Pseudemys concinna, and Pseudemys floridana also
showed a propensity to move overland. Many individuals moved or were located > 1 km from
aquatic habitats, and one radio-tagged turtle (C. serpentina) travelled overland > 3 km during the
study. The extensive movements of turtles in the Dougherty Plain may be due to the dynamic
hydroperiods of isolated wetlands that may force both sexes to move frequently and use isolated
wetlands as “stepping stones” to obtain resources and aquatic refuges necessary for survival and
growth.
I used a long term data set of observations of T. scripta on land to determine if turtles
were moving through particular landcover types. Logistic regression models indicated that T.
scripta preferred moving through upland pine forests and other undisturbed habitats (i.e.,
hardwood pine mix, hardwood forests) near bodies of water, and avoided moving through open
scrub, agricultural fields and pine plantations. I was able to use these results to model potential
movement corridors for turtles between aquatic habitats at Ichauway using ArcGIS, Linkage
Mapper, and Circuitscape software (ArcGIS version 9.3; Earth Systems Research Institute,
Redlands, CA; McRae and Shah, 2009; McRae and Kavanagh, 2011; Zeigler et al., 2011; McRae
et al., 2012). Linkage Mapper and Circuitscape have the potential to be useful management tools
for identifying movement corridors for aquatic turtles, and both succeeded in generating
theoretical pathways using Euclidean distance and landscape permeability between core habitats.

123
Circuitscape also demonstrated how both distance and landcover permeability affect resistance to
movement of turtles. Landcover permeability became less of a factor to resistance as distance
between core habitats decreased, and more of a factor as distance increased. This concept is
important since many wetlands in the Southeast Coastal Plain have become altered or lost and
much of the historic landcover has become converted to less permeable habitat for turtles.
The use of geographically isolated wetlands, agricultural ponds, and streams within the
Dougherty Plain suggests that aquatic turtles, like the American alligator (Alligator
mississippiensis), demonstrate a faunal connection among aquatic systems in this region
(Subalusky et al., 2009). However, the extent to which turtles may represent a functional
connection among these systems is unknown and warrants additional study. My results suggest
the extensive movements of turtle among multiple wetlands and other aquatic ecosystems
signifies the need to manage turtles in the Southeastern Coastal Plain at a larger scale than
previously considered (Semlitsch and Bodie, 2007), with conservation of multiple aquatic
ecosystems upwards of several kilometers from one another and their surround permeable
landscape instead of single bodies of water.

124
Literature Cited
Buhlmann, K. A. and J. W. Gibbons. 1997. Imperiled aquatic reptiles of the Southeastern United
States: historical review and current conservation status. Pp. 201-231. In Benz, G. W. and
D. E. Collins (eds.). Aquatic Fauna in Peril: The Southeastern Perspective. Lenz Design
and Communications, Decatur, Ga.
Frazer, N. B., J. W. Gibbons, and T. J. Owens. 1990. Turtle trapping: preliminary tests of
conventional wisdom. Copeia 1990: 1150-1152.
Kusler, J. 2001. The SWANCC decision and state regulation of wetlands. Available online at
www.aswm.org
MacKenzie, D. I., J. D. Nichols, G. B. Lachman, S. Droege, J. A. Royle and C. A. Langtimm.
2002. Estimating site occupancy rates when detection probabilities are less than one.
Ecology 83: 2248-2255.
McRae, B. H., S. Hall, P. Beier, and D. M. Theobold. 2012. Where to restore ecological
connectivity? Detecting barriers and quantifying restoration benefits. PLoS ONE 7: 1-12.
McRae, B.H. and D.M. Kavanagh. 2011. Linkage Mapper Connectivity Analysis Software. The
Nature Conservancy, Seattle WA.
McRae, B.H., and Shah, V.B. 2009. Circuitscape User Guide. ONLINE. The University of
California, Santa Barbara.
Semlitsch, R.D. and J.R. Bodie. 2007. Biological criteria for buffer zones around wetlands and
riparian habitats for amphibians and reptiles. Conservation Biology 17: 1219-1228.

125
Sterrett, S. C. 2009. The ecology and influence of land use on river turtles in Southwest Georgia.
Master’s Thesis, University of Georgia, Athens, GA.
Subalusky, A. L., L. A. Fitzgerald, and L. L. Smith. 2009. Ontogenetic niche shifts in the
American alligator establish functional connectivity between aquatic systems. Biological
Conservation 142: 1507-1514.
Thomas, R. B., I. M. Hall, and W. J. House. 2008. Relative efficacy of three different baits for
trapping pond-dwelling turtles in East-Central Kansas. Herpetological Review 39: 186-
188.
United States Drought Monitor. 2012. U.S. drought monitor map archive. Available online at
http://droughtmonitor.unl.edu/MapsAndData/MapArchive.aspx
Zeigler, S. L., M. C. Neel, L. Oliveira, B. E. Raboy and W. F. Fagan. 2011. Conspecific and
heterospecific attraction in assessments of functional connectivity. Biodiversity
Conservation 20: 2779-2796.