Embed Size (px)
Citation preview

Race, Ethnicity and Prosecution inCook County, Illinois
Advancing Prosecutorial Effectiveness and Fairness Report SeriesOctober 2019

Introduction What the project is aboutWhat the report is aboutForeword by Kim FoxxStudy methodologyExecutive summary
Part 1: Case Approval Figure 1: Simple percentage of cases approved Table 1: Likelihood of case approval Figure 2: Likelihood of case approval Part 2: Disposition Type Figure 3: Simple percentage of cases resulting in each major disposition type Table 2: Likelihood of case disposition Figure 4: Likelihood of case disposition
Part 3: Changes in Charge Severity from Initiation to Disposition Figure 5: Simple percentage of cases with charge changes at disposition Table 3: Likelihood of changes in charge severity from charging to disposition Figure 6: Likelihood of charge reduction
Part 4: Sentencing Figure 7: Simple percentage of sentence type Table 4: Likelihood of sentence type Figure 8: Likelihood of custodial sentence type AppendicesAppendix A - Racial and ethnic disparity dashboardsAppendix B - Descriptive statisticsAppendix C - Most common person, weapons, property, and drug charges referred for charging
About the Authors
112357
9101012
13141520
19222224
25262729
30314145
Back Cover

1
This project is a groundbreaking partnership between prosecutors and researchers to promote more effective, just, and transparent decision making in prosecution. It is a bipartisan effort to be smart on crime, to think about new ways to maximize public safety, to enhance fairness, and to create a new system of accountability to the public. It involves four forward-thinking prosecutors in Cook County (IL), Jacksonville (FL), Milwaukee County (WI), and Tampa (FL) working with researchers at Florida International University and Loyola University Chicago to take a new look at prosecutorial performance and decision making. This partnership is supported by the John D. and Catherine T. MacArthur Foundation.
Improving prosecutorial performance and decision making is impossible without data. Data takes center stage in the project, because it tells prosecutors what problems are the biggest threats to community well-being, and it points to ways to tackle those problems. Data helps measure the overall impact of prosecutors’ work, and it alerts them that a policy or practice needs to be continued or changed. Unfortunately, most prosecutors’ offices lack the ability to collect, analyze, and apply data to these ends. Many offices do not record the data they need. Others are missing the staff and knowledge necessary to analyze their data. Still other offices—probably most—do not have the ability and commitment to use data to guide their decisions and reforms. This project focuses on helping our partner offices and other interested jurisdictions overcome these hurdles. The project has four distinct objectives:
What The Project Is AboutWhile the project targets performance in our four partner jurisdictions, it also aims to use the knowledge generated from this experiment to advance the field of prosecution nationally. There are more than 2,300 local prosecutors’ offices in the United States, but very few organizations specialize in prosecutorial research and technical assistance. Realistically, most prosecutors’ offices will not receive any direct meaningful assistance. By building sustainable data collection, performance measurement, and communication practices for the four offices, this project provides a set of blueprints that offices across the country can use to make their own internal improvements. We realize there is no one-size-fits-all approach to prosecutorial office management that will meet every office’s needs. Writing a prescription for a patient we have not examined is hard. However, the project provides a model that other offices can use to start thinking about forming local partnerships, improving data capacity, and producing metrics for assessing their own impact.
The backdrop for this project is the Safety & Justice Challenge, the MacArthur Foundation initiative to reduce jail misuse and overuse as both a crucial component and a major driver of America’s over-reliance on incarceration. Unnecessary jail incarceration carries significant costs to individuals, families, communities, and society at large. These costs take their greatest toll on low-income people and communities of color. The Safety & Justice Challenge supports local leaders who are dedicated to safely reducing jail populations, improving justice systems, and ultimately strengthening their communities.
To expand offices’ data and analytical capacity by assessing case management systems, making better use of existing data, and exploring options for capturing new information without creating additional burdens for prosecutors.
To assist prosecutors with tracking their progress toward greater efficiency, effectiveness, and fairness using prosecutorial performance indicators at the office and unit levels (as opposed to the individual prosecutor level).
To identify possible racial and ethnic disparities at various stages of case processing across offense categories, and to work with stakeholders to develop specific solutions to reduce them.
To establish a practice of using data to measure monthly or quarterly performance and engage with the communities.
1
2
3
4
Introduction

2
The fair and just treatment of racial and ethnic minorities at all stages of the criminal justice system is of significant importance to communities of color, practitioners, and scholars alike. Central to this discourse is a recognition of the discretionary power that prosecutors wield in shaping the outcomes of criminal cases. This includes, among other things, the decision to approve or reject a case, amend the severity and number of charges, and dispose of criminal cases through dismissal, plea bargaining, or trial.
This report focuses on the outcomes of prosecutorial decision making for felony offenses in Cook County, Illinois. Specifically, it assesses the extent to which racial and ethnic disparities exist across the following four decision points in felony criminal case processing: (1) Case approval; (2) Disposition type; (4) Charge changes from filing to disposition; and (5) Sentencing.
We encourage the reader to interpret the results while recognizing that criminal case processing can trigger disparate outcomes for racial and ethnic minorities for a number of different reasons. Some of these reasons, such as defense attorney role and judicial discretion, are beyond the immediate control of prosecutors. At the same time, our partners are keenly aware that prosecutors can and should play a vital role in uncovering and addressing racial and ethnic disparities in the criminal justice system, and this report stems from that recognition.
The intent of this report is to prompt discussion and raise questions, rather than provide definitive answers. We also want to stress that the findings presented throughout this report cannot be used to support or refute possible racial and ethnic biases. Our methodology simply does not permit that. Rather than serving as an end point, we view this report as a starting point from which to engage in meaningful discussions concerning policies and procedures that can ameliorate racial and ethnic disparities in case outcomes. Furthermore, given that prosecutorial decision making does not operate in a vacuum, certain findings direct attention to ways state attorney’s offices, the defense bar, law enforcement agencies, and the judiciary can galvanize future reform efforts. Even more importantly, continued efforts to engage with minority communities will be critical for increasing public trust in and cooperation with the criminal justice system.
This report is the second in a series of publications resulting from this partnership. The first report, Prosecutorial Attitudes, Perspectives, and Priorities: Insights from the Inside, was released in December 2018. The third report in the series, focused on prosecutorial performance indicators, will be released near the end of 2019.
We also welcome your questions. Our contact information is provided on the back cover.
What The Report Is About

3
Introduction
Forward from Kim Foxx
State’s AttorneyCook County State’s Attorney’s Office
Chicago, IL
My vision for the Cook County State’s Attorney’s Office is, and always will be, for it to be a fairer, forward-thinking agency focused on building public trust and being proactive in making all our communities safer. A vital component in seeing this happen is through a framework of transparency. Transparency is how we efficiently and effectively fulfill our public safety mission and insure that our work is grounded in data and evidence, and giving the public access to that information is critical.
I am so proud of this project and fully acknowledge that it could not have been possible without the collaboration between our office, Florida International University, Loyola University Chicago, three forward-thinking prosecutors in Jacksonville, Milwaukee, and Tampa, and the support of the John D. and Catherine T. MacArthur Foundation. Having a bipartisan coalition working together with the knowledge that prosecutors have an important role in our communities addressing racial disparities in the criminal justice system was an inspiring reminder of why we do the work that we do.
The goals we set forth, to expand our data capacity, to identify possible racial and ethnic disparities, and to increase our practice of using data to engage with communities, are all with the aim of promoting more effective, just, and transparent decision making in prosecution. Gathering information of this nature allows us to effectively evaluate and modify the way we investigate and prosecute misconduct, promote public safety, and pursue justice.
The emphasis on utilizing and disseminating data has been a cornerstone of the Cook County State’s Attorney’s Office since I was elected, but what we learn from this data is only half the battle. We must vigilantly utilize this information to inform the work we do on a daily basis to pursue prosecutorial effectiveness and fairness. This report is not the end of this process though, as it says, it is meant to be a jumping off point for ways to have thoughtful discussions around policies and procedures with the aim of remedying racial disparities in the outcome of the cases we prosecute.

44

Study Methodology

6
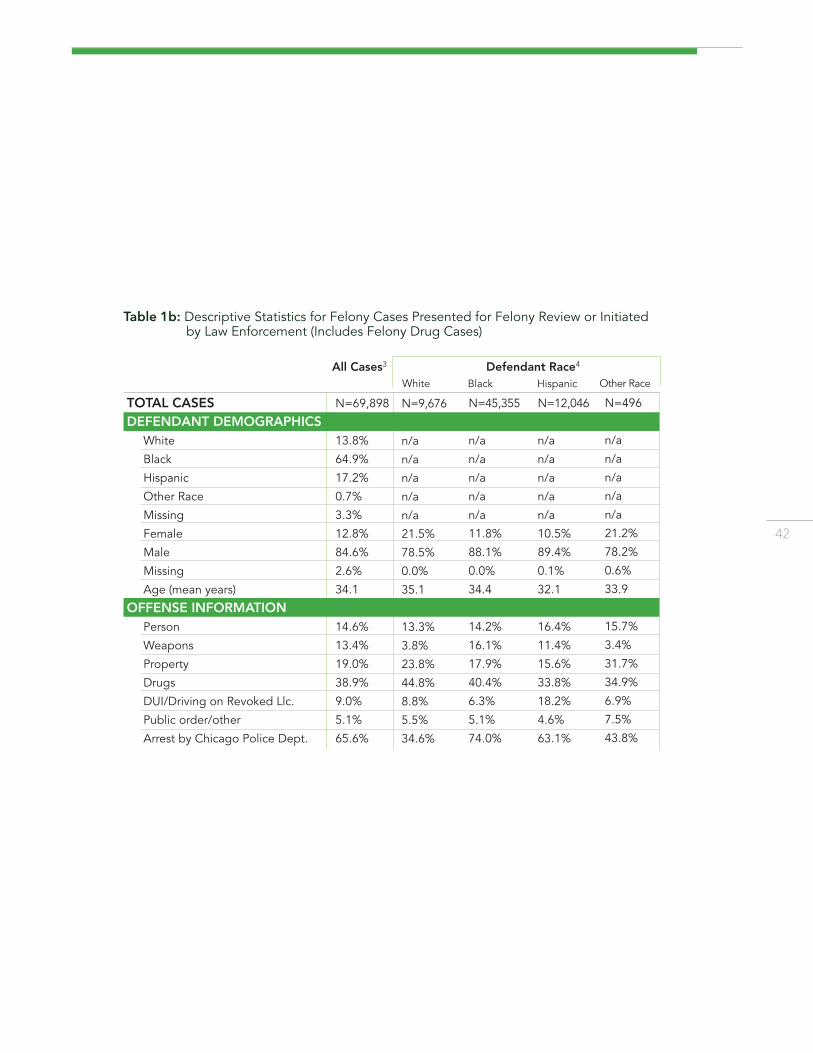
DataData for this report came from the Cook County State’s Attorney’s Office’s (CCSAO) case management system. Analyses of case outcomes across offense type rely on data for 69,898 felony cases reviewed/initiated, 58,270 felony cases disposed of, and 38,016 felony cases sentenced by the CCSAO in 2017 and 2018. Trend analyses of select outcomes rely on data for 341,344 felony cases reviewed/initiated, 287,422 felony cases disposed of, and 187,127 felony cases sentenced by the CCSAO between 2011 and 2018.
Race and EthnicityDefendant race and ethnicity are identified as recorded in the CCSAO case management system. Defendants were identified as White, Black, or Hispanic. Though it is important to examine case processing outcomes for Asian and Native American defendants, there were not enough cases to conduct robust disparity analyses for these groups. Appendix B, however, includes basic descriptive information for the cases involving Asian and Native American defendants.
Defining a Case This report offers a case-level as opposed to charge-level analysis, which means that many cases in the dataset have multiple charges and/or counts. The information on multiple charges and counts is also captured and accounted for when appropriate. Also, some defendants had more than one case disposed of within the 24-month period analyzed. Cases at each stage of the prosecution process (Intake, Initiation, Disposition, Sentencing) are tracked by the most serious charge at that stage. The top charge for Part 1 of the report represents the primary arrest charge as identified by the CCSAO case management system. The top charge for Part 2 represents the highest filed charge, as identified by felony class and charge type. The top charge for Part 3 represents the highest guilty charge, as identified by felony class and charge type.
Decision PointsThis report presents results for the following four decisions points: (1) Case review/approval; (2) Disposition; (3) Charge changes from filing to disposition; and (5) Sentencing. A description of each decision point is provided at the beginning of each section.
Accounting for Legal and Non-Legal FactorsThe results account for differences in defendant and case characteristics among racial groups. However, the results do not take into account case evidence, pretrial detention, diversion eligibility, plea bargaining details, defendants’ socioeconomic characteristics, or defendant’s criminal history.
Offense CategoriesResults are provided for all offenses together, and then broken down into person (violent and sex offenses), weapons (both illegal possession of a weapon and use of a weapon), property, and drug-law violation offenses separately. Public order and traffic offenses, which are the largest but most diverse category, are not analyzed as their own offense type. Excluded from this analysis are “driving under the influence” cases and cases flagged by the SAO as “domestic battery,” because these two types of cases tend to have unique trends which would have unduly influenced the overall results. Our plan is to analyze this large volume of cases separately.
Presentation of ResultsBar graphs Simple percentages for each decision outcome by racial/ethnic group that do not take into account other differences in defendant or case characteristics. Percentages are provided for all defendants, then for White, Black, and Hispanic defendants separately.
Tables Expected rates per 1,000 cases for White, Black, and Hispanic defendants at each decision outcome after accounting for defendant and case characteristics. The rates are predicted probabilities calculated following logistic or multinomial logistic regressions.
Line chartsTrends in expected rates for White, Black, and Hispanic defendants at each decision outcome after accounting for defendant and case characteristics. The rates are predicted probabilities calculated following logistic or multinomial logistic regressions for all felony offenses combined for each year of data (2011-2018).
Dashboards Appendix AA visual overview of racial and ethnic disparities for all five decision points included in this report, broken down by offense type.

Executive Summary

8
The analyses reveal few differences in outcomes across racial/ethnic groups in Cook County. When looking at case approval, dispositions, and charge reductions for all felony offenses combined, differences in the probability of specific outcomes by race/ethnicity are relatively small after accounting for other case factors such as offense severity or number of charges. For many decision points, differences in the probability of specific outcomes range from just 0 percentage points to 4 percentage points across racial/ethnic groups. When looking at specific offense types – person, weapons, property, drugs – differences in the probability of case approval, dispositions, and charge reductions across racial/ethnic groups remain relatively small.
Differences in outcomes, however, are more pronounced when examining the use of alternative prosecution and the imposition of custodial sentences. For drug offenses, Black defendants are less likely than White defendants to be referred to an alternative prosecution program (e.g., deferred prosecution, drug court) – differences in the probability of entering an alternative prosecution are roughly 8 percentage points lower for Black defendants than for White defendants. In contrast, differences in the probability of entering an alternative prosecution program are just 2 percentage points lower for Hispanic defendants than for White defendants. In turn, for all offense types, Black defendants are more likely than White defendants to receive a custodial sentence following conviction – differences between Black and White defendants in the probability of custodial sentence range from 6 percentage points for property offenses to 21 percentage points for drug offenses. Again, the probability of receiving a custodial sentence following conviction is more similar for Hispanic and White defendants.
Despite these findings, there are limitations to the analyses that prevent drawing strong conclusions. First, the analyses are unable to account for differences in defendant eligibility for alternative prosecution programs, defendant interest in such programs, economic or geographic barriers to participation in alternative prosecution programs – factors that may explain differences in outcomes across groups. Second, the analyses are unable to account for differences in defendant criminal history – a factor that affects both eligibility for alternative prosecution and the imposition of custodial sentences. Differences in criminal history across racial/ethnic groups likely explain much of the difference in custodial sentences across these groups; as such, these results should be viewed very cautiously.
There are additional findings to consider beyond differences across racial/ethnic groups. For example, the no probable cause rates and dismissal rates for felony drug cases both appear to be high: roughly 11% of felony drug cases receive a finding of no probable cause and 32% are dismissed (nolle pros). Felony drug cases are unique since they are direct filed by law enforcement and do not go through felony review; thus, after case initiation or at preliminary hearing is the first opportunity a prosecutor has to review a case, which explains some of the higher rates. Relative to other offense types, however, the rates appear high even after accounting for the proportion of person, weapons, and property cases rejected at felony review. The findings suggest opportunities to conserve resources and reduce the burden on defendants by examining how felony drug cases enter the system and how long it takes to dismiss such cases.
9
Changes in Charge Severity from Initiation to
Conviction
CaseApproval
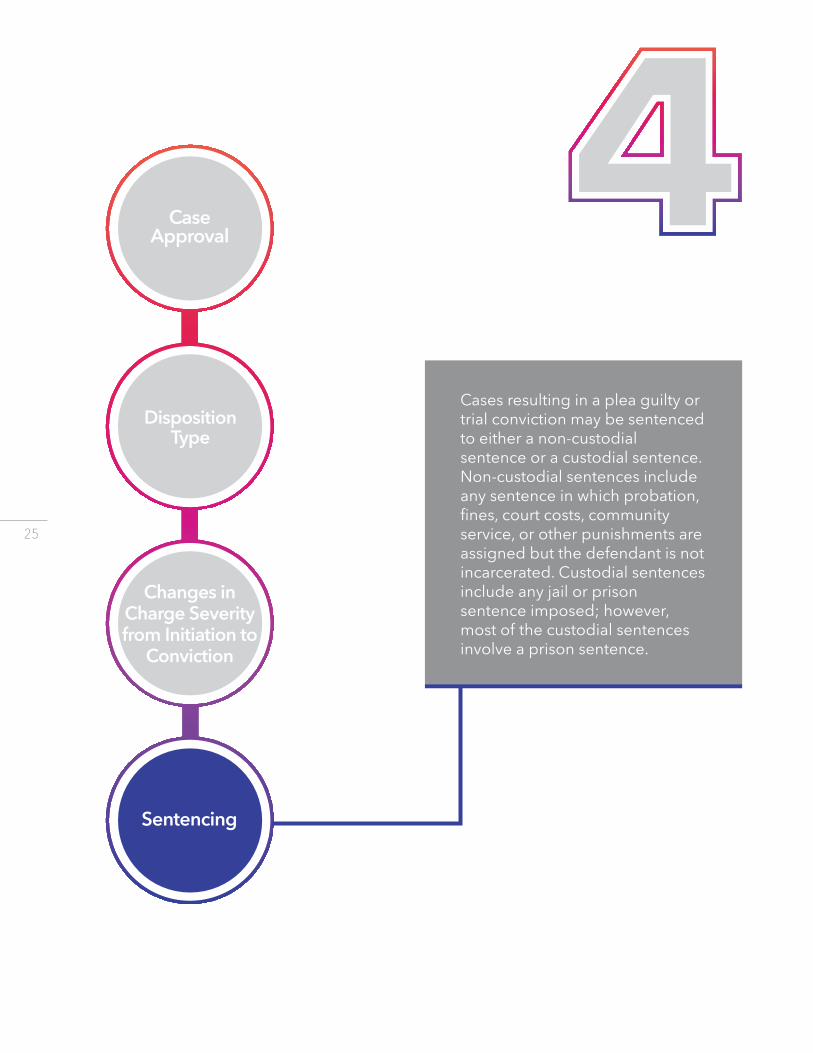
Sentencing
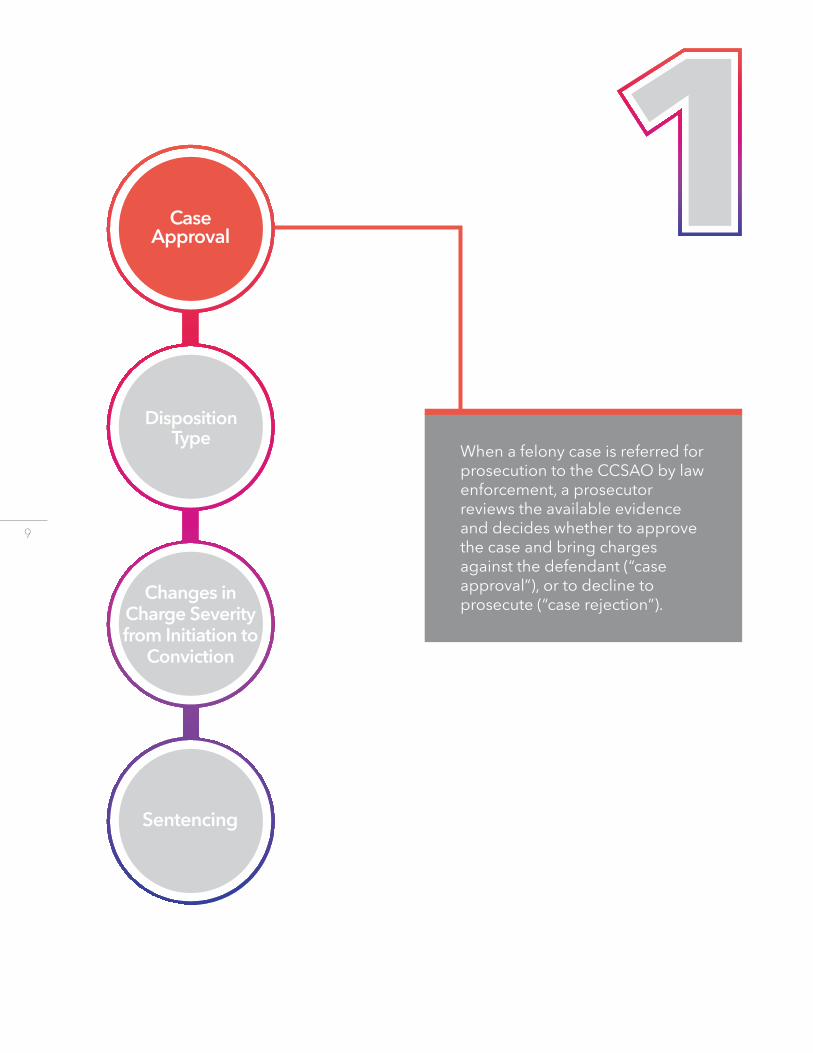
When a felony case is referred for prosecution to the CCSAO by law enforcement, a prosecutor reviews the available evidence and decides whether to approve the case and bring charges against the defendant (“case approval”), or to decline to prosecute (“case rejection”).

10
Figure 1: Simple Percentage of Cases Approved for Prosecution 2017/2018, by Defendant Race
Figure 1 represents simple percentages of cases approved for prosecution in 2017/2018 for all defendants together, followed by White, Black, and Hispanic defendants separately. The graph does not take into account differences in case or defendant characteristics; it also does not include felony drug law violations, since these are direct filed by law enforcement and are not reviewed by the CCSAO. As the graph indicates, approval rates were fairly consistent across racial/ethnic groups – in 2017/2018, roughly 82% of cases involving White defendants, 83% of cases involving Black defendants, and 84% of cases involving Hispanic defendants were approved for prosecution.
All Defendants 82.7%17.3%
APPROVEDREJECTED
White 81.6%18.4%
Black 82.9%17.1%
Hispanic 83.6%16.4%
Table 1: Likelihood of Case Approval 2017/2018, by Defendant Race
Numbers in this table represent the expected rates of case approval per 1,000 cases for White, Black, and Hispanic defendants after accounting for the influence of: (1) offense type, (2) year of disposition, (3) arresting agency, (4) defendant gender, (5) defendant race, and (6) defendant age.
White
Black
Hispanic
Number of Cases
832 out of 1,000 cases
827 out of 1,000 cases
832 out of 1,000 cases
36,477
826
834802
8,870
763
752
799
12,248
All Offenses PersonOffenses
PropertyOffenses
893
893
900
9,009
WeaponsOffenses
Note: Results do not include DUI charges or Domestic Battery charges. Felony drug cases were excluded since these are direct filed by law enforcement.

11
Most influential factors Approval: Race/ethnicity was not an influential factor for this decision. Charges were more likely to be approved when: the arrest charge was a weapon offense the arrest occurred outside Chicago the defendant was male the defendant was younger
For all felony offenses combined, approval rates were nearly identical across all racial groups. Black defendants were slightly less likely to have their cases approved for prosecution, after accounting for defendant and case characteristics. For every 1,000 cases involving a Black defendant, 827 were approved for prosecution, compared to 832 cases involving White or Hispanic defendants. This means there were just 5 more cases approved for every 1,000 cases involving White or Hispanic defendants than for every 1,000 cases involving Black defendants.
For felony person offenses, approval rates varied slightly across racial/ethnic groups, with Black defendants the most likely (834 out of 1,000 cases) and Hispanic defendants the least likely (802 out of 1,000 cases) to have their cases approved, after accounting for legal and extralegal characteristics; approval rates for White defendants fell in the middle at 826 out of 1,000 cases.
The approval rates for felony weapon offenses were similar to patterns for all felonies combined, with very small differences across racial groups (893 out of 1,000 cases for Black and White defendants and 900 out of 1,000 cases for Hispanic defendants).
For felony property offenses, Black defendants were least likely (752 out of 1,000 cases) and Hispanic defendants were most least likely (799 out of 1,000 cases) to have their cases approved for prosecution, after controlling for other defendant and case factors; for every 1,000 cases involving White defendants, roughly 763 were approved for prosecution.
Overall, there was very little difference in approval rates across racial/ethnic groups and across offense types.
12
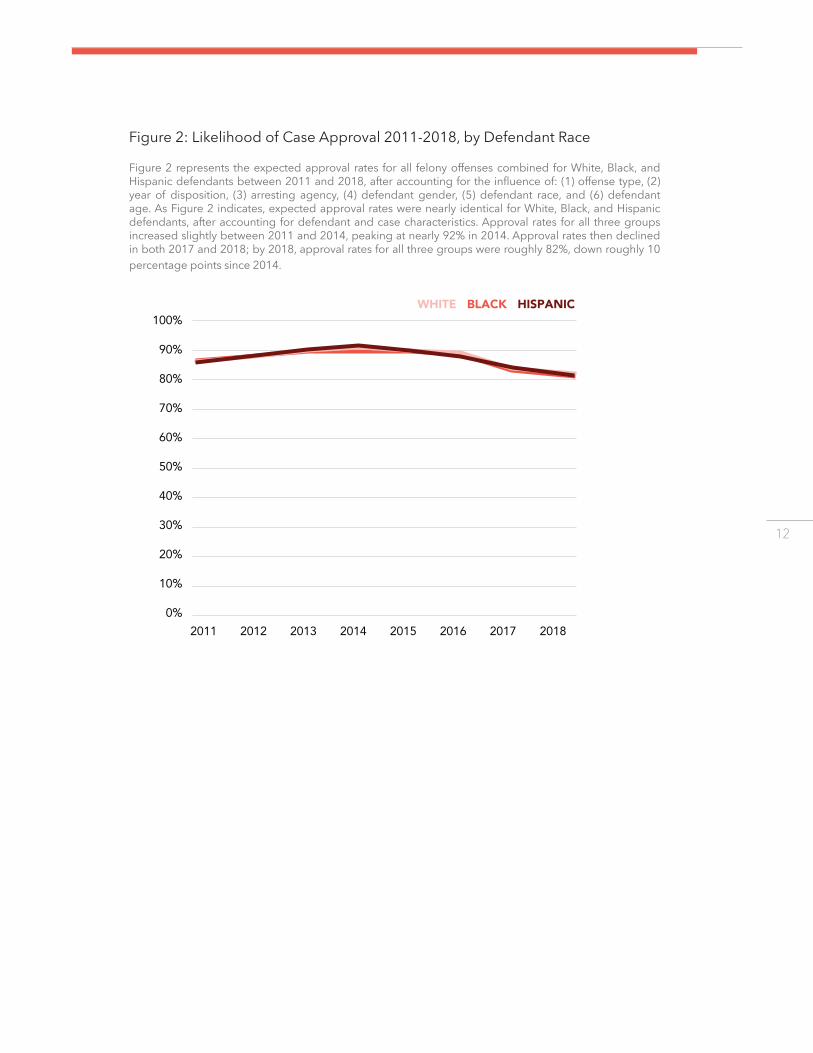
Figure 2: Likelihood of Case Approval 2011-2018, by Defendant Race
Figure 2 represents the expected approval rates for all felony offenses combined for White, Black, and Hispanic defendants between 2011 and 2018, after accounting for the influence of: (1) offense type, (2) year of disposition, (3) arresting agency, (4) defendant gender, (5) defendant race, and (6) defendant age. As Figure 2 indicates, expected approval rates were nearly identical for White, Black, and Hispanic defendants, after accounting for defendant and case characteristics. Approval rates for all three groups increased slightly between 2011 and 2014, peaking at nearly 92% in 2014. Approval rates then declined in both 2017 and 2018; by 2018, approval rates for all three groups were roughly 82%, down roughly 10 percentage points since 2014.
100%
90%
80%
70%
60%
50%
40%
30%
20%
10%
0%2011 2012 2013 2014 2015 2016 2017 2018
WHITE BLACK HISPANIC

13

14
Figure 3: Simple Percentage of Cases Resulting in No Probable Cause, Dismissal, Alternative Prosecution, or Plea/Trial 2017/2018, by Defendant Race
Figure 3 represents simple percentages of disposition types for all defendants together, followed by White, Black, and Hispanic defendants separately. The graph does not take into account differences in case or defendant characteristics. As Figure 3 indicates, findings of no probable cause were fairly consistent across racial/ethnic groups – in 2017/2018, 5.8% of cases involving White defendants, 5.2% of cases involving Black defendants, and 6.5% of cases involving Hispanic defendants were disposed of through a finding of no probable cause. Similarly, dismissal rates also were consistent across racial ethnic groups - in 2017/2018, 20.8% of cases involving White defendants, 21.0% of cases involving Black defendants, and 19.8% of cases involving Hispanic defendants were dismissed. However, alternative prosecution rates and plea/trial rates were significantly different across groups. In 2017/2018, 13.2% of cases involving White defendants were disposed of through an alternative prosecution program, compared to just 3.8% of cases involving Black defendants and 6.6% of cases involving Hispanic defendants. As a result, the percent of cases resulting in a plea/trial was higher for Black and Hispanic defendants relative to White defendants; in 2017/2018, 70.0% of cases involving Black defendants and 67.1% of cases involving Hispanic defendants were disposed of through plea/trial, compared to just 60.2% of cases involving White defendants.
All Defendants 68.1%20.7%
5.5%5.7%
PLEA/TRIALDISMISSED
NO PROBABLE CAUSEALTERNATIVE PROSECUTION
White 60.2%20.8%
5.8%13.2%
Black 70.0%21.0%
5.2%3.8%
Hispanic 67.1%19.8%
6.5%6.6%

15
Table 2: Likelihood of Case Disposition 2017/2018, by Defendant Race
Numbers in this table represent the expected rates of each outcome per 1,000 cases for White, Black, and Hispanic defendants after accounting for the influence of: (1) felony class of most serious charge, (2) offense type of most serious charge, (3) charge counts, (4) year of disposition, (5) defendant gender, (6) defendant race, (7) defendant age, (8) time to disposition, and (9) court in which the case was disposed. Results for drug offenses also take into account (10) drug type and (11) whether the offense involved possession or sale/trafficking/manufacturing.
Note: Results do not include DUI charges or Domestic Battery charges. Cases were designated as “no probable cause” if all charges had a disposition of “no probable cause; cases were designated “dismissed” if all charges remaining after preliminary hearing had a disposition of “nolle prosequi” or “case dismissed”. Cases were designated as “alternative prosecution” if all charges remaining after preliminary hearing had a disposition reason related to an alternative prosecution program. Cases were designated as “plea/trial” if any charge had a disposition resulting from a plea of guilty or a finding/verdict.
White
Black
Hispanic
623 out of 1,000 cases
705 out of 1,000 cases
657 out of 1,000 cases
913
913
931
900862
857
402
508401
All Offenses
OUTCOME 1: GUILTY PLEA AND TRIAL
White
Black
Hispanic
224 out of 1,000 cases
201 out of 1,000 cases
201 out of 1,000 cases
77
7859
100
137
142
337316
325
OUTCOME 2: CASE DISMISSED
White
Black
Hispanic
50 out of 1,000 cases
53 out of 1,000 cases
68 out of 1,000 cases
3
5
4
n/a
n/a
n/a
103
105
142
OUTCOME 3: FINDING OF NO PROBABLE CAUSE
PersonOffenses
PropertyOffenses
DrugOffenses
WeaponsOffenses
818
829
840
82
9977
3
2010
White
Black
Hispanic
Number of Cases
103 out of 1,000 cases
41 out of 1,000 cases
74 out of 1,000 cases
53,989
7
4
6
7,876
n/a
n/a
n/a
7,196
15871
132
24,214
OUTCOME 4: ALTERNATIVE PROSECUTION
9752
73
10,002

16
Most influential factors
No Probable Cause: Race/ethnicity was not one of the most influential factors for this decision. No probable cause dispositions were most likely when: the case involved fewer filed charges the top filed charge was a less serious felony class the top filed charge was a drug offense
For all felony offenses, the rates of no probable cause dispositions were nearly identical across all racial/ethnic groups. Hispanic defendants were slightly more likely to have their cases disposed of through a finding of no probable cause, after accounting for defendant and case characteristics. For every 1,000 cases involving Hispanic defendants, 68 received a finding of no probable cause, compared to 53 cases involving Black defendants and 50 cases involving White defendants.
For felony person offenses, a no probable cause disposition occurred in roughly 4 out of 1,000 cases for White, Black, and Hispanic defendants.
For felony weapon offenses, a no probable cause disposition occurred in almost no cases; as such, there were not enough cases to generate predicted probabilities across racial groups.
For felony property offenses, a no probable cause disposition occurred in less than 20 out of 1,000 cases for all racial/ethnic groups.
For felony drug offenses, White defendants and Black defendants were least likely to have their cases receive a finding of no probable cause (roughly 104 out of 1,000 cases), while Hispanic defendants were most likely (142 out of 1,000 cases).
Overall, no probable cause dispositions were rare for all offense types, with the exception of drug offenses, and were similar across all racial/ethnic groups.
No Probable Cause Findings

17
Most influential factors
Dismissal: Race/ethnicity was not one of the most influential factors for this decision. Dismissals were most likely when: the case was disposed outside Chicago the top filed charge was a less serious felony class the top filed charge was a weapons or drug offense the case involved a defendant aged 21-30
For all felony offenses, Black and Hispanic defendants were least likely to have their cases dismissed (201 out of 1,000 cases) and White defendants were most likely (224 per 1,000 cases), after accounting for defendant and case characteristics. This means there were just 23 more cases dismissed for every 1,000 cases involving White defendants than for every 1,000 cases involving Black or Hispanic defendants. These differences were driven primarily by differences in dismissal rates for weapon and drug offenses.
For felony person offenses, dismissal dispositions were relatively rare for all racial/ethnic groups. White and Black defendants were most likely to have their cases dismissed (roughly 77 out of 1,000 cases) and Hispanic defendants were least likely to have their cases dismissed (59 out of 1,000 cases).
Felony weapon offenses exhibited the largest differences in dismissal rates across racial/ethnic groups. White defendants were least likely to have their cases dismissed (100 out of 1,000 cases) and Black (137 out of 1,000 cases) and Hispanic defendants (142 out of 1,000 cases) were most likely to have their cases dismissed.
For felony property offenses, dismissal dispositions were relatively rare for all racial/ethnic groups. Hispanic defendants were the least likely to have their cases dismissed (77 out of 1,000 cases), followed by White defendants (82 out of 1,000 cases) and Black defendants (99 out of 1,000 cases).
Felony drug offenses exhibited the highest dismissal rates, but with little variation across all racial/ethnic groups. Black defendants were least likely to have their cases dismissed (316 out of 1,000 cases), followed by Hispanic defendants (325 out of 1,000 cases) and White defendants (337 out of 1,000 cases).
Overall, dismissal dispositions were similar across all racial/ethnic groups, with differences in rates ranging from just 5 to 20 out of 1,000 cases across groups. The only exception was weapon offenses, for which differences in dismissal rates ranged from 37 to 42 out of 1,000 cases across racial/ethnic groups.
Dismissal Findings

18
Most influential factors
Alternative Prosecution: Race/ethnicity was one of the most influential factors for this decision. Alternative prosecution was most likely when:
the top filed charge was a less serious felony class the top filed charge was a drug offense the case involved a White defendant the case involved a female defendant the case involved a defendant aged 17-20 years old the case was disposed outside of Chicago
For all felony offenses, Black defendants were least likely to receive an alternative prosecution program (41 out of 1,000 cases) and White defendants were most likely (103 per 1,000 cases), after accounting for defendant and case characteristics. This means there were roughly 62 more cases to receive an alternative prosecution program for every 1,000 cases involving White defendants than for every 1,000 cases involving Black defendants. These differences were driven primarily by differences in rates for drug offenses.
For felony person offenses, alternative prosecution dispositions were rare for all racial/ethnic groups, with roughly 6 out of 1,000 cases receiving an alternative prosecution.
For felony weapon offenses, an alternative prosecution disposition occurred in almost no cases; as such, there were not enough cases to generate predicted probabilities across racial groups.
For felony property offenses, Black defendants (52 out of 1,000 cases) and Hispanic defendants (73 out of 1,000 cases) were the least likely to receive an alternative prosecution program, while White defendants were the most likely (97 out of 1,000 cases).
Felony drug offenses exhibited the largest differences in alternative prosecution rates across racial/ethnic groups. Black defendants were least likely to receive an alternative prosecution (71 out of 1,000 cases), followed by Hispanic defendants (132 out of 1,000 cases) and White defendants (158 out of 1,000 cases). This means there were roughly 87 more cases receiving alternative prosecution for every 1,000 cases involving White defendants than for every 1,000 cases involving Black defendants.
Overall, alternative prosecution dispositions were similar across all racial/ethnic groups. The only exception was drug offenses, for which differences in rates ranged from 26 to 87 out of 1,000 cases across racial/ethnic groups.
Alternative Prosecution Findings

19
Most influential factors
Plea/Trial: Race/ethnicity was one of the most influential factors for this decision. Pleas/trials were most likely when: the case involved more charges the top filed charge was a more serious felony class the top filed charge involved a person or weapon offense the case involved a Black defendant
For all felony offenses, given their higher dismissal rates, White defendants were least likely to have their cases disposed through plea/trial (623 out of 1,000 cases) and Black defendants were most likely to have their cases disposed through plea/trial (705 out of 1,000 cases). Plea/trial rates for Hispanic defendants fell in the middle (657 out of 1,000 cases). These differences in plea/trial rates were due primarily to differences in rates for drug offenses.
For felony person offenses, there were few differences in plea/trial rates across racial/ethnic groups. White defendants and Black defendants were least likely to have their cases disposed of through plea/trial (913 out of 1,000 cases) and Hispanic defendants slightly more likely (931 out of 1,000 cases) to have their cases disposed through plea trial.
For felony weapon offenses, Black and Hispanic defendants were least likely to have their cases disposed through plea/trial (roughly 860 out of 1,000 cases) and White defendants were most likely to have their cases disposed through plea/trial (900 out of 1,000 cases).
For felony property offenses, White defendants were least likely to have their cases disposed through plea/trial (815 out of 1,000 cases), followed by Black defendants (829 out of 1,000 cases) and Hispanic defendants (840 out of 1,000 cases).
Felony drug offenses exhibited the largest differences in plea/trial rates across racial/ethnic groups. Black defendants were most likely to have their cases disposed of through plea/trial (508 out of 1,000 cases), followed by Hispanic defendants (413 out of 1,000 cases) and White defendants (402 out of 1,000 cases). This means there were roughly 106 more cases disposed of through plea/trial for every 1,000 cases involving Black defendants than for every 1,000 cases involving White defendants, and 11 more cases disposed of through plea/trial for every 1,000 cases involving Hispanic defendants than for every 1,000 cases involving White defendants.
Overall, dispositions through plea/trial were similar across all racial/ethnic groups, with differences in rates ranging from just 20 to 40 out of 1,000 cases across groups. The only exception was drug offenses, for which differences in plea/trial rates ranged from 50 to 100 out of 1,000 cases across racial/ethnic groups.
Plea/Trial Findings

20
Figure 4: Likelihood of Case Disposition 2011-2018, by Defendant Race
The line graphs below represent expected disposition rates for all felony offenses combined for White, Black, and Hispanic defendants after taking into account defendant and case characteristics. As the figures indicate, expected plea/trial rates increased significantly between 2011 and 2016 for all racial/ethnic groups, from roughly 61.0% to 71.0% for White and Hispanic defendants and from 67.0% to 76.0% for Black defendants. This increase was due largely to a steady decrease in no probable cause rates, which declined from roughly 18% for all racial/ethnic groups in 2011 to just 7.5% in 2016. During this period dismissal rates remained stable at roughly 14.5% for all racial/ethnic groups; alternative prosecution rates also remained stable, with roughly 4.5% of While and Hispanic defendants and 1.5% of Black defendants receiving an alternative prosecution program. Between 2016 and 2018, however, no probable cause rates continued to decline to just 4% for all racial/ethnic groups. During this period, plea/trial rates also declined for all racial/ethnic groups as well; however, by 2018 plea/trial rates for Black defendants (67.9%) remained higher than rates for Hispanic defendants (63.6%) and White defendants (61.8%). The recent decline in plea/trial rates was due largely to an increase in dismissal rates and alternative prosecution rates for all racial/ethnic groups. Between 2016 and 2018, dismissal rates increased by roughly 9 percentage points, from roughly 14.0% to 23.0% for all racial/ethnic groups; during the same period, alternative prosecution rates increased from 1.5% to 4.2% for Black defendants, from 4.7% to 7.9% for Hispanic defendants, and from 6.4% to 10.0% for White defendants.
2011 2012 2013 2014 2015 2016 2017 2018
100%
80%
60%
40%
20%
0%
WHITE BLACK HISPANICALTERNATIVE PROSECUTION
2011 2012 2013 2014 2015 2016 2017 2018
100%
80%
60%
40%
20%
0%
WHITE BLACK HISPANICNO PROBABLE CAUSE
2011 2012 2013 2014 2015 2016 2017 2018
100%
80%
60%
40%
20%
0%
WHITE BLACK HISPANICDISMISSAL
2011 2012 2013 2014 2015 2016 2017 2018
100%
80%
60%
40%
20%
0%
WHITE BLACK HISPANICPLEA/TRIAL

21

22
Figure 5: Simple Percentage of Cases with Reduction in Charge Severity at Conviction 2017/2018, by Defendant Race
Figure 5 represents simple percentages of cases with a charge reduction from initiation to conviction in 2017/2018 for all defendants together, followed by White, Black, and Hispanic defendants separately. The graph does not take into account differences in case or defendant characteristics; since there were no cases involving a charge increase in 2017/2018, the graph only includes outcomes for charge reduction and no charge reduction. As Figure 5 indicates, charge reduction rates were slightly higher for Black defendants – in 2017/2018, roughly 30.9% of cases involving Black defendants resulted in a charge reduction from initiation to conviction, compared to 24.3% of cases involving White defendants and 25.5% of cases involving Hispanic defendants.
CHARGE REDUCTIONNO CHARGE REDUCTION
All Defendants 29.3%70.7%
White 24.3%75.7%
Black 30.9%69.1%
Hispanic 25.5%74.5%
Table 3: Likelihood of Charge Reduction 2017/2018, by Defendant Race
Numbers in this table represent the expected charge reduction rates per 1,000 cases for White, Black, and Hispanic defendants after taking into account the influence of: (1) felony class of most serious charge, (2) offense type of most serious charge, (3) charge counts, (4) year of disposition, (5) defendant gender, (6) defendant race, (7) defendant age, (8) time to disposition, (9) court in which case was disposed, and (10) mode of disposition (trial/plea). Results for drug offenses also take into account (11) drug type and (12) whether the offense involved possession or sale/trafficking/manufacturing.
Note: Results do not include DUI charges or Domestic Battery charges.
All Offenses
White
Black
Hispanic
Number of Cases
261 out of 1,000 cases
301 out of 1,000 cases
274 out of 1,000 cases
34,445
266
312
318
6,169
375
435404
5,680
261
382292
10,927
PersonOffenses
PropertyOffenses
DrugOffenses
WeaponsOffenses
162151
143
8,136

23
Most influential factors
Reduction in charge severity: Race/ethnicity was not one of the most influential factors for this decision. Charges were more likely to be reduced when: the top filing charge was a less serious felony class the top filing charge was not a property offense or public order offense the case took longer to dispose of
For all felony offenses combined, Black defendants were the most likely to receive a charge reduction and White defendants were the least likely to receive a charge reduction from case initiation to conviction, after accounting for defendant and case characteristics. For every 1,000 cases involving a Black defendant, 301 resulted in a charge reduction, compared to 261 cases involving White defendants and 274 cases involving Hispanic defendants. This means there were just 40 more cases with a charge reduction for every 1,000 cases involving Black defendants than for every 1,000 cases involving White defendants.
For felony person offenses, Hispanic and Black defendants were the most likely receive a charge reduction (318 out of 1,000 cases, and 312 out of 1,000 cases respectively), while White defendants were the least likely to receive a charge reduction (266 out of 1,000 cases).
The charge reduction rates for felony weapon offenses were similar to patterns for all felonies combined, with Black defendants the most likely to receive a charge reduction (435 out of 1,000 cases), followed by Hispanic defendants (404 out of 1,000 cases), and White defendants (375 out of 1,000 cases).
The charge reduction rates for felony property offenses showed the smallest levels of racial/ethnic differences, with Hispanic defendants slightly less likely to receive a charge reduction (143 out of 1,000 cases) relative to Black defendants (151 out of 1,000 cases) and White defendants (162 out of 1,000 cases)
In contrast, felony drug offenses showed the highest levels of racial/ethnic differences in charge reduction rates. Black defendants were the most likely to receive a charge reduction (382 out of 1,000 cases) and White defendants were the least likely to receive a charge reduction (261 out of 1,000 cases); charge reduction rates for Hispanic defendants fell in the middle at 292 out of 1,000 cases. This means there were 121 more cases with a charge reduction for every 1,000 cases involving Black defendants than for every 1,000 cases involving White defendants.
Overall, charge reduction rates were similar across all racial/ethnic groups, with differences in rates ranging from just 20 to 60 out of 1,000 cases across groups. The only exception was drug offenses, for which differences in charge reduction rates ranged from 90 to 120 out of 1,000 cases across racial/ethnic groups.

24
Figure 6: Likelihood of Charge Reduction 2011-2018, by Defendant Race
Figure 6 represents the expected charge reduction rates for all felony offenses combined for White, Black, and Hispanic defendants after taking into account the influence of: (1) felony class of most serious charge, (2) offense type of most serious charge, (3) charge counts, (4) year of disposition, (5) defendant gender, (6) defendant race, (7) defendant age, (8) time to disposition, (9) court in which case was disposed, and (10) mode of disposition (trial/plea). As Figure 6 indicates, expected charge reduction rates were similar for White, Black, and Hispanic defendants between 2011 and 2013, after accounting for defendant and case characteristics. Between 2014 and 2018, charge reduction rates for Black defendants were slightly higher than rates for White and Hispanic defendants. More importantly, perhaps, charge reduction rates increased markedly for all racial/ethnic groups between 2011 and 2018. In 2011, roughly 13% of felony cases resulted in a charge reduction from initiation to conviction; by 2018, 30.6% of cases involving Black defendants, 28.5% of cases involving Hispanic defendants, and 27.5% of cases involving White defendants resulted in a charge reduction.
100%
90%
80%
70%
60%
50%
40%
30%
20%
10%
0%2011 2012 2013 2014 2015 2016 2017 2018
25
Changes in Charge Severity from Initiation to
Conviction
CaseApproval
Sentencing

26
Figure 7: Simple Percentage of Cases Resulting in Non-Custodial and Custodial Sentences 2017/2018, by Defendant Race
Figure 7 represents simple percentages of non-custodial and custodial sentences imposed for all defendants together, followed by White, Black, and Hispanic defendants separately. The graphs do not take into account differences in case or defendant characteristics. As the graph indicates, Black defendants were much more likely to receive a custodial sentence relative to both White and Hispanic defendants. In 2017/2018, 60.5% of Black defendants received a custodial sentence following conviction, compared to 48.5% of Hispanic defendants and just 42.2% of White defendants.
All Defendants 44.0%56.0%
NON-CUSTODIAL SENTENCECUSTODIAL SENTENCE
White 57.8%42.2%
Black 39.5%60.5%
Hispanic 51.5%48.5%

27
Table 4: Likelihood of Custodial Sentence by Defendant Race
Numbers in this table represent the expected custodial sentence rates per 1,000 cases for White, Black, and Hispanic defendants after accounting for the influence of: (1) felony class of most serious charge, (2) offense type of most serious charge, (3) charge counts, (4) year of disposition, (5) defendant gender, (6) defendant race, (7) defendant age, (8) time to disposition, (9) court in which case was disposed, and (10) mode of disposition (trial/plea). Results for drug offenses also take into account (10) drug type and (11) whether the offense involved possession or sale/trafficking/manufacturing. A note of caution: these results do not account for differences in prior criminal history, which is taken into consideration at sentencing and likely explains differences in custodial sentence rates across racial/ethnic groups.
Note: Results do not include DUI charges or Domestic Battery charges. Murder and Class X Felonies are also excluded as these carry mandatory prison sentences; other offenses with mandatory prison sentences, however, are included and may overstate custodial sentence rates.
White
Black
Hispanic
Number of Cases
465 out of 1,000 cases
599 out of 1,000 cases
473 out of 1,000 cases
32,935
487
638527
4,484
621
693642
5,403
354
561412
10,593
All Offenses PersonOffenses
PropertyOffenses
DrugOffenses
WeaponsOffenses
492
552462
7,897

28
Most influential factors
Custodial sentence: Race/ethnicity was one of the most influential factors for this decision. Cases were more likely to result in a custodial sentence when: the top conviction charge was a more serious felony class the defendant was male the defendant was Black the defendant was older the case involved more conviction charges
For all felony offenses, White and Hispanic defendants were least likely and Black defendants were most likely to receive a custodial sentence, after controlling for other defendant and case factors. For every 1,000 cases involving a White defendant, 465 resulted in a custodial sentence, compared to 599 cases involving Black defendants and 473 cases involving Hispanic defendants. This means there were roughly 133 more custodial sentences for every 1,000 cases involving Black defendants than for every 1,000 cases involving White defendants. These differences were consistent across all offense types.
For felony person offenses, White defendants were the least likely and Black defendants were the most likely to receive a custodial sentence, after controlling for other defendant and case factors; for every 1,000 person cases involving White defendants 487 received a custodial sentence, compared to 638 involving Black defendants and 527 involving Hispanic defendants.
For felony weapon offenses, custodial sentence rates were not as disparate across racial/ethnic groups; however, White defendants remained the least likely (621 out of 1,000 cases) and Black defendants the most likely (693 per 1,00 cases) to receive a custodial sentence.
For felony property offenses, Hispanic defendants were the least likely (462 out of 1,000 cases) and Black defendants were the most least likely (552 out of 1,000 cases) to receive a custodial sentence; for every 1,000 cases involving White defendants, roughly 492 resulted in a custodial sentence.
For felony drug offenses, differences in custodial sentence rates across racial/ethnic groups were the largest among offense categories. White defendants were the least likely (354 out of 1,000 cases) and Black defendants were the most least likely (561 out of 1,000 cases) to receive a custodial sentence, after controlling for other defendant and case factors; for every 1,000 cases involving Hispanic defendants, roughly 412 resulted in a custodial sentence. The difference in custodial sentence rates between White and Black defendants means there were roughly 207 more custodial sentences for every 1,000 cases involving Black defendants than for every 1,000 cases involving White defendants.
Overall, custodial sentence rates varied markedly across racial/ethnic groups. Black defendants were consistently more likely to receive a custodial sentence than either White or Hispanic defendants for all offense types. Again, these results cannot account for a defendant’s prior criminal history - a factor that is taken into consideration at sentencing. Differences in prior criminal history across racial/ethnic groups likely explain the racial/ethnic differences in custodial sentences shown here. As such, these results should be interpreted with this in mind.

29
Figure 8: Likelihood of Custodial Sentence 2011-2018, by Defendant Race
Figure 8 represents the expected custodial sentence rates for all felony offenses combined for White, Black, and Hispanic defendants after taking into account the influence of: (1) felony class of most serious charge, (2) offense type of most serious charge, (3) charge counts, (4) year of disposition, (5) defendant gender, (6) defendant race, (7) defendant age, (8) time to disposition, (9) court in which case was disposed, and (10) mode of disposition (trial/plea). As Figure 8 indicates, expected custodial sentence rates were nearly identical for White and Hispanic defendants between 2011 and 2018, after accounting for defendant and case characteristics; custodial sentence rates for Black defendants remained roughly 13 percentage points higher during this period. Custodial sentence rates for all racial/ethnic groups remained relatively stable between 2011 and 2017, before declining sharply in 2018. By 2018, custodial sentence rates for Black defendants (56.9%) and Hispanic defendants (44.6%) were at their lowest point in eight years; custodial sentence rates for White defendants (44.0%) were just slightly higher than their lowest point.
100%
90%
80%
70%
60%
50%
40%
30%
20%
10%
0%
WHITE BLACK HISPANIC
2011 2012 2013 2014 2015 2016 2017 2018

30
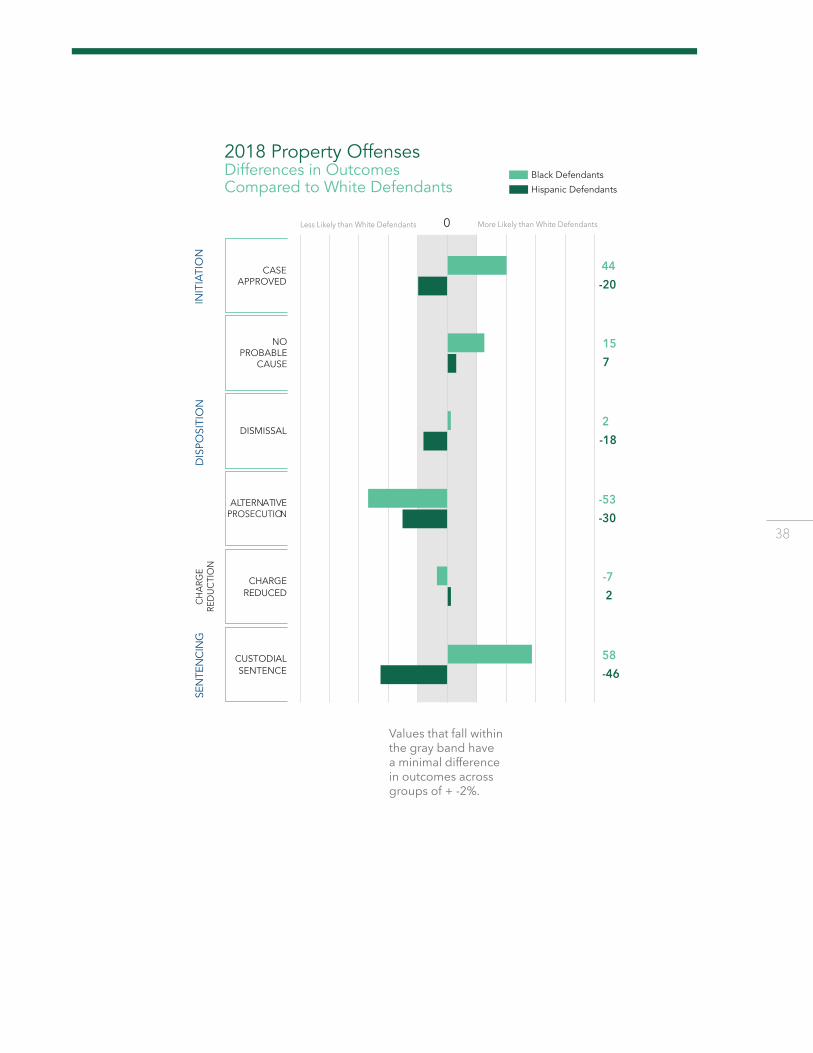
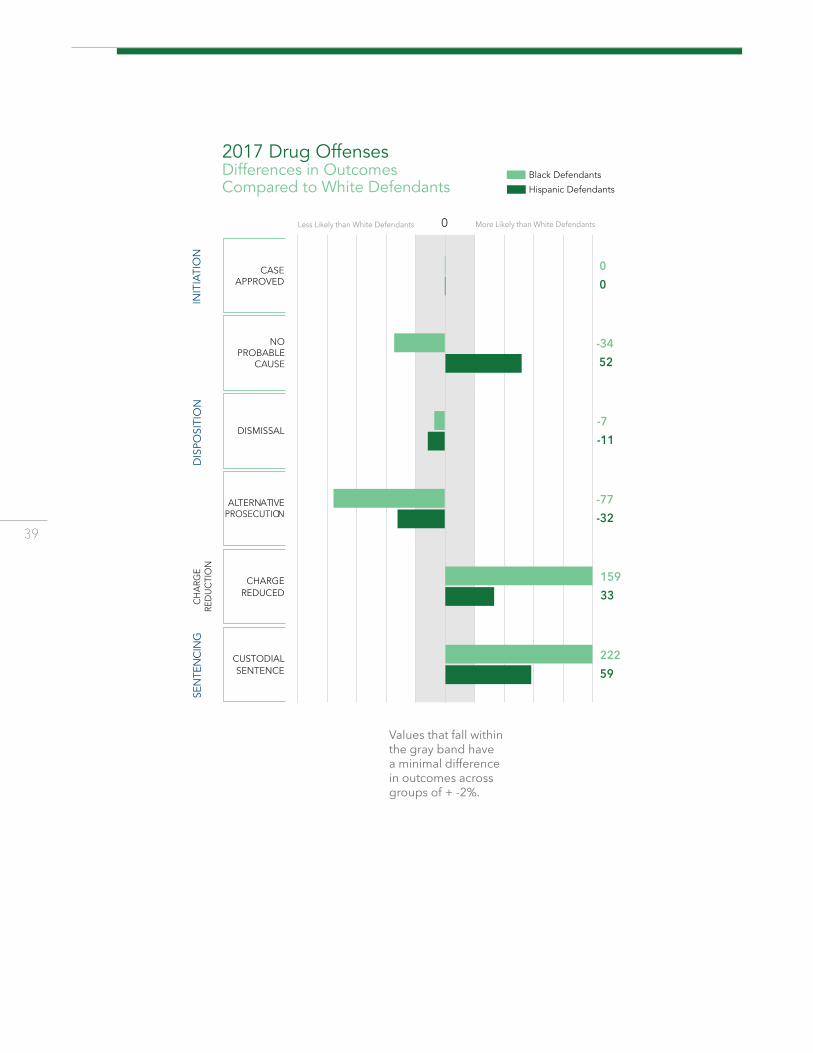
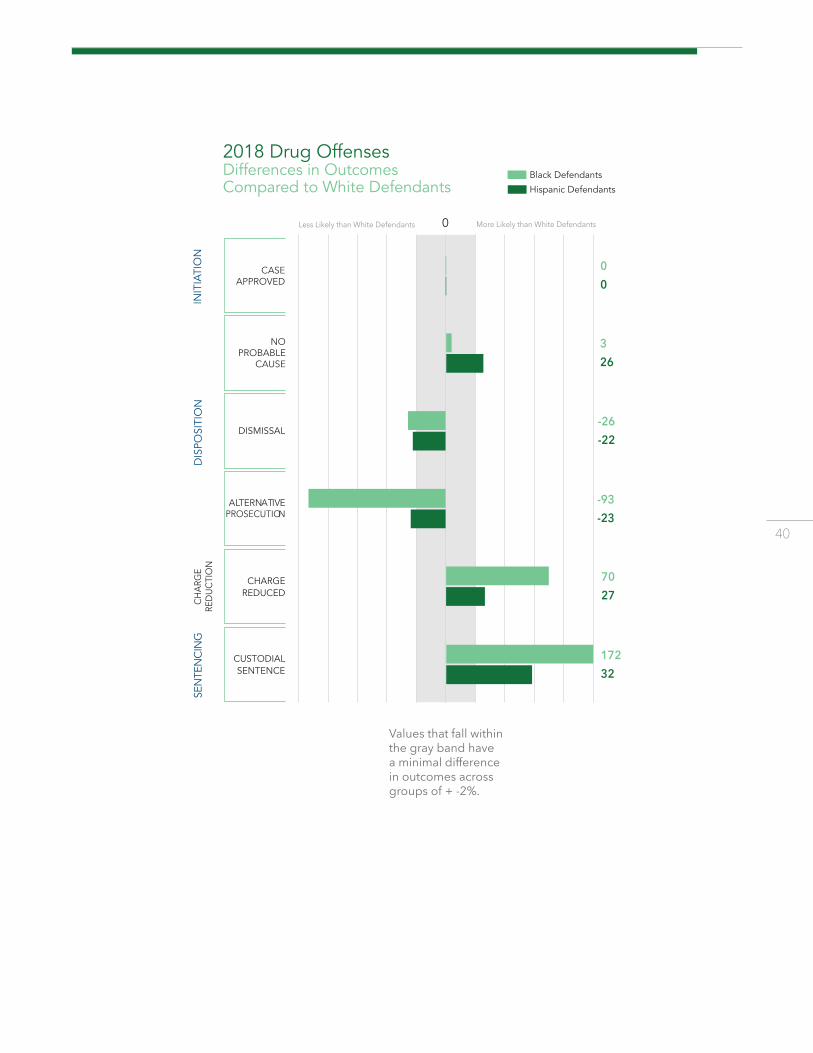
Appendix ARacial and Ethnic Disparity DashboardsThese dashboards provide the reader with a visual overview of how outcomes for different racial and ethnic groups compare across the five decision points detailed in this report.
Dashboards are broken down by offense type: (1) all offenses, (2) person offenses, (3) weapon offenses, (4) property offenses, and (5) drug offenses.
Differences between Black and White defendants, and between Hispanic and White defendants, are presented as rates per 1,000 cases. These rates take into account the influence of defendant and case factors described in the tables throughout the report.Each bar in the dashboards has three components:
Color - Lighter bars show differences in rates for Black defendants compared to White defendants, while darker bars show differences in rate for Hispanic defendants compared to White defendants.
Number - The number at the end of each bar shows the difference in rates for each outcome. Positive numbers indicate that Black or Hispanic defendants have a higher rate of the outcome than White defendants, while negative numbers indicate Black or Hispanic defendants have a lower rate of the outcome than White defendants.
Direction – The direction of the bar reflects whether Black or Hispanic defendants are more likely or less likely than White defendants to receive a specific outcome.

31
Values that fall within the gray band have a minimal difference in outcomes across groups of + -2%.
2017 All Felony OffensesDifferences in OutcomesCompared to White Defendants
CASEAPPROVED
NOPROBABLE
CAUSE
ALTERNATIVEPROSECUTION
CHAR
GE
RED
UCTI
ON
27
225
-23-20
-54-26
4414
10138
Less Likely than White Defendants More Likely than White Defendants

32
2018 All Felony OffensesDifferences in OutcomesCompared to White Defendants
CASEAPPROVED
NOPROBABLE
CAUSE
ALTERNATIVEPROSECUTION
CHAR
GE
RED
UCTI
ON
-12-7
614
-4-10
-58-21
3110
6129
Less Likely than White Defendants More Likely than White Defendants
Values that fall within the gray band have a minimal difference in outcomes across groups of + -2%.

33
Values that fall within the gray band have a minimal difference in outcomes across groups of + -2%.
2017 Person OffensesDifferences in OutcomesCompared to White Defendants
CASEAPPROVED
NOPROBABLE
CAUSE
ALTERNATIVEPROSECUTION
CHAR
GE
RED
UCTI
ON
26-1
20
-16-1
-6-3
2741
13410
Less Likely than White Defendants More Likely than White Defendants

34
Values that fall within the gray band have a minimal difference in outcomes across groups of + -2%.
2018 Person OffensesDifferences in OutcomesCompared to White Defendants
CASEAPPROVED
NOPROBABLE
CAUSE
ALTERNATIVEPROSECUTION
CHAR
GE
RED
UCTI
ON
-8-47
-1-1
31-20
-11-7
6359
17580
Less Likely than White Defendants More Likely than White Defendants

35
Values that fall within the gray band have a minimal difference in outcomes across groups of + -2%.
2017 Weapon OffensesDifferences in OutcomesCompared to White Defendants
CASEAPPROVED
NOPROBABLE
CAUSE
CHAR
GE
RED
UCTI
ON
127
30
5054
3718
7551
Less Likely than White Defendants More Likely than White Defendants

36
Values that fall within the gray band have a minimal difference in outcomes across groups of + -2%.
2018 Weapon OffensesDifferences in OutcomesCompared to White Defendants
CASEAPPROVED
NOPROBABLE
CAUSE
CHAR
GE
RED
UCTI
ON
-5 4
10
5042
7232
7210
Less Likely than White Defendants More Likely than White Defendants

37
Values that fall within the gray band have a minimal difference in outcomes across groups of + -2%.
2017 Property OffensesDifferences in OutcomesCompared to White Defendants
CASEAPPROVED
NOPROBABLE
CAUSE
ALTERNATIVEPROSECUTION
CHAR
GE
RED
UCTI
ON
-2 26
204
-1-15
-66-40
-24-31
63-14
Less Likely than White Defendants More Likely than White Defendants
38
Values that fall within the gray band have a minimal difference in outcomes across groups of + -2%.
2018 Property OffensesDifferences in OutcomesCompared to White Defendants
CASEAPPROVED
NOPROBABLE
CAUSE
ALTERNATIVEPROSECUTION
CHAR
GE
RED
UCTI
ON
44-20
157
2-18
-53-30
-7 2
58-46
Less Likely than White Defendants More Likely than White Defendants
39
Values that fall within the gray band have a minimal difference in outcomes across groups of + -2%.
2017 Drug OffensesDifferences in OutcomesCompared to White Defendants
CASEAPPROVED
NOPROBABLE
CAUSE
ALTERNATIVEPROSECUTION
CHAR
GE
RED
UCTI
ON
0 0
-34 52
-7-11
-77-32
15933
22259
Less Likely than White Defendants More Likely than White Defendants
40
Values that fall within the gray band have a minimal difference in outcomes across groups of + -2%.
2018 Drug OffensesDifferences in OutcomesCompared to White Defendants
CASEAPPROVED
NOPROBABLE
CAUSE
ALTERNATIVEPROSECUTION
CHAR
GE
RED
UCTI
ON
0 0
3 26
-26-22
-93-23
7027
17232
Less Likely than White Defendants More Likely than White Defendants

41
Appendix BDescriptive Statistics
42

43
44

45


Florida International University
Besiki Luka KutateladzeAssociate Professor of Criminology and Criminal [email protected]
Rebecca RichardsonAssistant Professor of Criminology and Criminal [email protected]
Ryan MeldrumAssociate Professor of Criminology and Criminal [email protected]
Loyola University Chicago
Don StemenAssociate Professor of Criminal Justice and [email protected]
David OlsonProfessor of Criminal Justice and [email protected]
Elizabeth WebsterAssistant Professor of Criminal Justice and [email protected]
Research Assistants
Maria ArndtDoctoral Student at Florida International University
Dylan MatthewsDoctoral Student at Florida International University
Sadhika SoorDoctoral Student at Florida International University
About the Authors
Race, Ethnicity and Prosecution inMilwaukee County, Wisconsin
About Florida International University
Florida International University is classified by Carnegie as a R1: Doctoral Universities - Highest Research Activity and recognized as a Carnegie engaged university. It is a public research university with colleges and schools that offers 196 bachelor’s, master’s and doctoral programs in fields such as engineering, computer science, international relations, architecture, law and medicine. This project is housed in the Department of Criminology and Criminal Justice and the Center for the Administration of Justice, which are part of the Steven J. Green School of International and Public Affairs.
About Loyola University Chicago
Loyola University Chicago, a private university founded in 1870 as St. Ignatius College, is one of the nation’s largest Jesuit, Catholic Universities and the only one located in Chicago. Recognizing Loyola’s excellence in education, U.S. News and World Report has ranked Loyola consistently among the top “national universities” in its annual publications. Loyola is among a select group of universities recognized for community service and engagement by prestigious national organizations like the Carnegie Foundation and the Corporation for National and Community Service.
Designed by: pinnaclegraphics.design