Embed Size (px)
Citation preview
Race and Economic Opportunity in the United StatesAn Intergenerational Perspective
Raj Chetty, StanfordNathaniel Hendren, Harvard
Maggie R. Jones, U.S. Census BureauSonya Porter, U.S. Census Bureau
March 2018
Disclaimer: The views expressed are not necessarily those of the U.S. Census Bureau. The statistical summaries reported in these slides have been cleared by theCensus Bureau's Disclosure Review Board release authorization number CBDRB-FY18-195. All values in the tables and figures that appear in this presentation havebeen rounded to four significant digits as part of the disclosure avoidance protocol.
$63,200
$38,600
$80,700
$46,900
$39,700
0
20
40
60
80
Media
n H
ouse
hold
Incom
e (
$1000
)
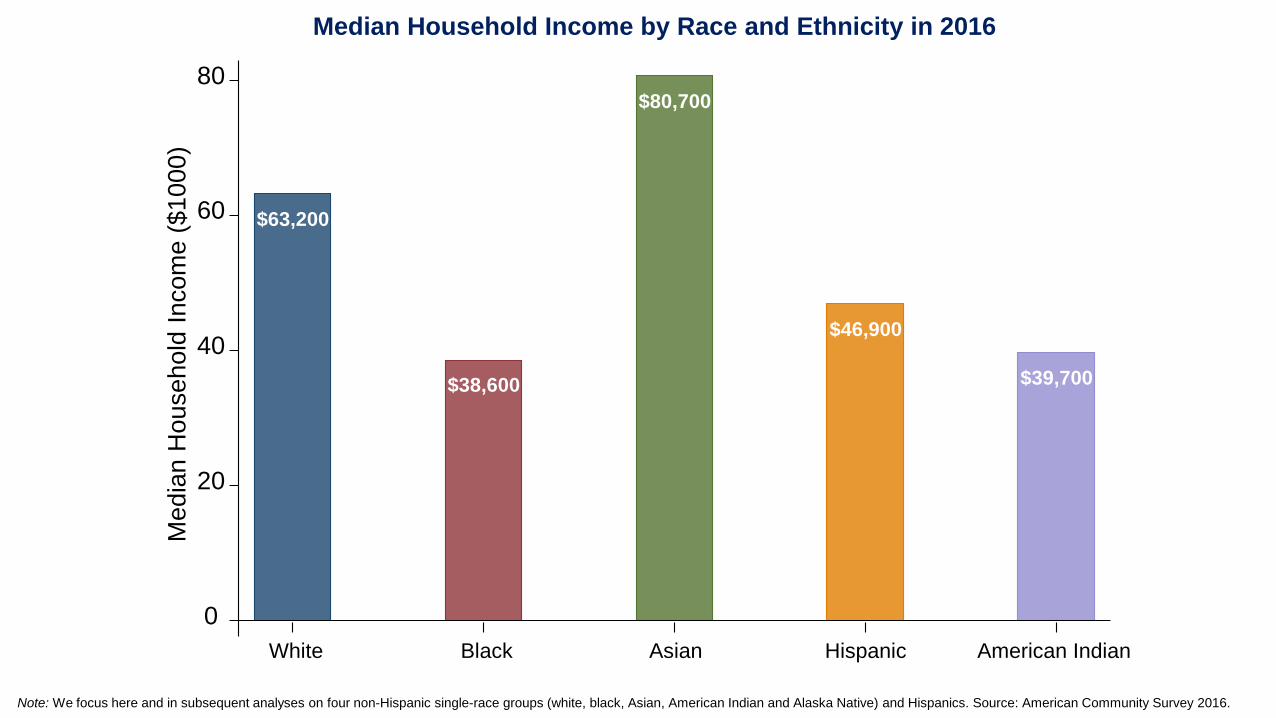
Median Household Income by Race and Ethnicity in 2016
White Black Asian Hispanic American Indian
Note: We focus here and in subsequent analyses on four non-Hispanic single-race groups (white, black, Asian, American Indian and Alaska Native) and Hispanics. Source: American Community Survey 2016.
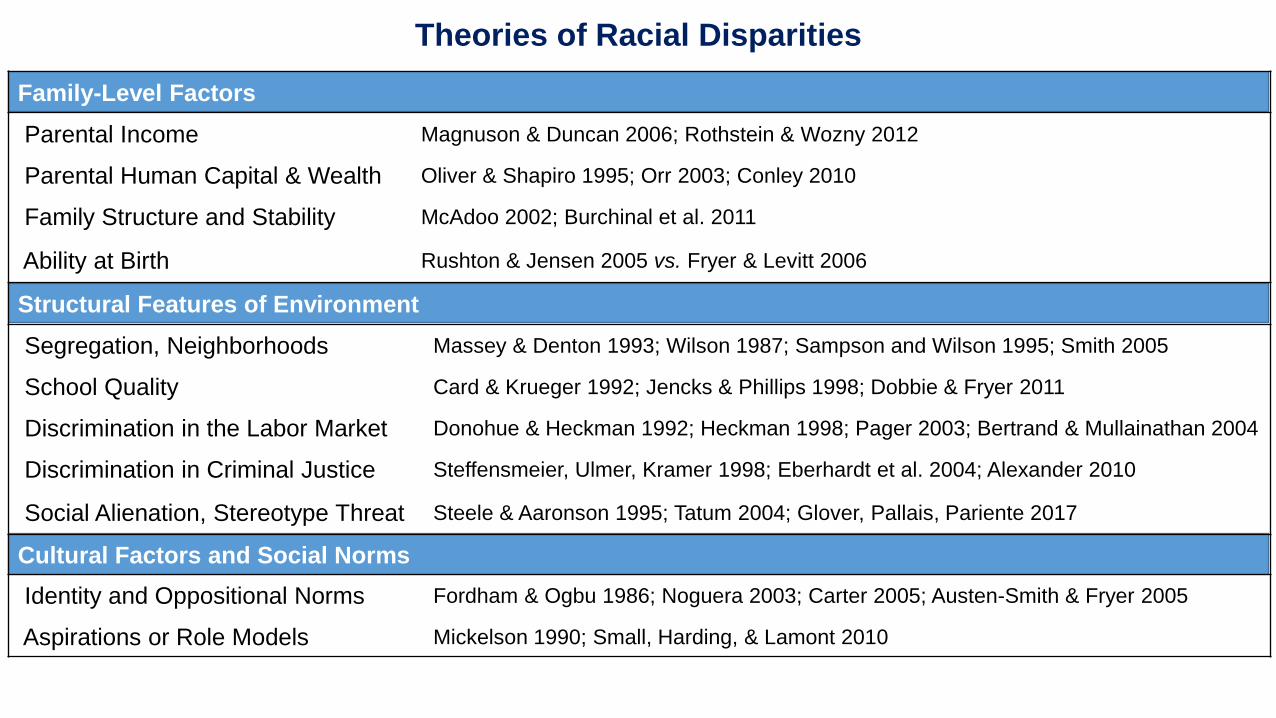
Theories of Racial Disparities
Family-Level Factors
Parental Income Magnuson & Duncan 2006; Rothstein & Wozny 2012
Parental Human Capital & Wealth Oliver & Shapiro 1995; Orr 2003; Conley 2010
Family Structure and Stability McAdoo 2002; Burchinal et al. 2011
Ability at Birth Rushton & Jensen 2005 vs. Fryer & Levitt 2006
Structural Features of Environment
Segregation, Neighborhoods Massey & Denton 1993; Wilson 1987; Sampson and Wilson 1995; Smith 2005
School Quality Card & Krueger 1992; Jencks & Phillips 1998; Dobbie & Fryer 2011
Discrimination in the Labor Market Donohue & Heckman 1992; Heckman 1998; Pager 2003; Bertrand & Mullainathan 2004
Discrimination in Criminal Justice Steffensmeier, Ulmer, Kramer 1998; Eberhardt et al. 2004; Alexander 2010
Social Alienation, Stereotype Threat Steele & Aaronson 1995; Tatum 2004; Glover, Pallais, Pariente 2017
Cultural Factors and Social Norms
Identity and Oppositional Norms Fordham & Ogbu 1986; Noguera 2003; Carter 2005; Austen-Smith & Fryer 2005
Aspirations or Role Models Mickelson 1990; Small, Harding, & Lamont 2010
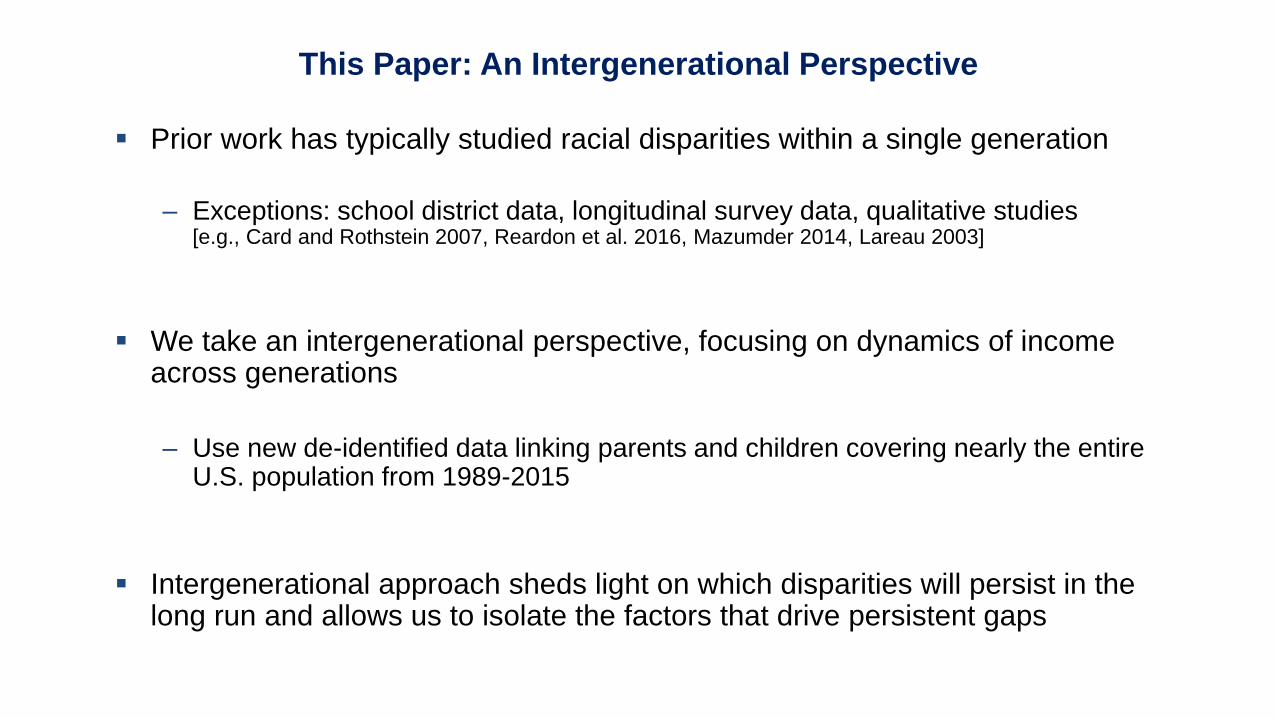
Prior work has typically studied racial disparities within a single generation
– Exceptions: school district data, longitudinal survey data, qualitative studies[e.g., Card and Rothstein 2007, Reardon et al. 2016, Mazumder 2014, Lareau 2003]
We take an intergenerational perspective, focusing on dynamics of income across generations
– Use new de-identified data linking parents and children covering nearly the entire U.S. population from 1989-2015
Intergenerational approach sheds light on which disparities will persist in the long run and allows us to isolate the factors that drive persistent gaps
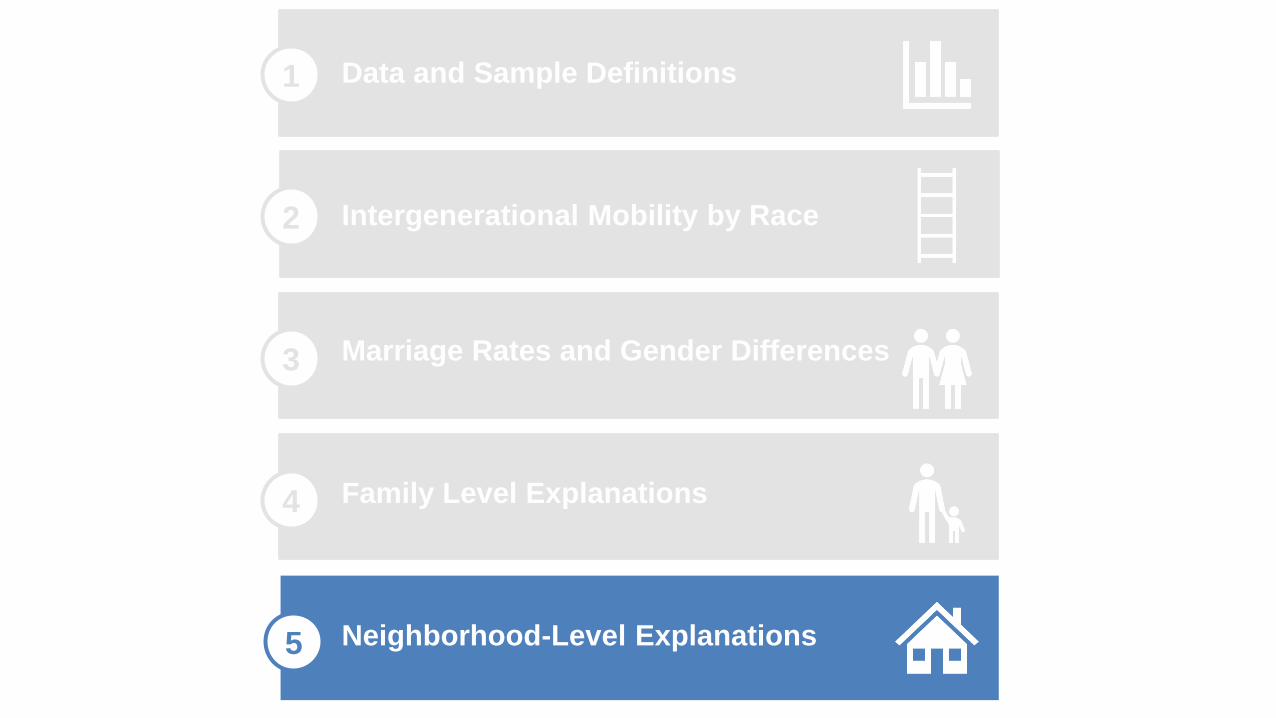
This Paper: An Intergenerational Perspective
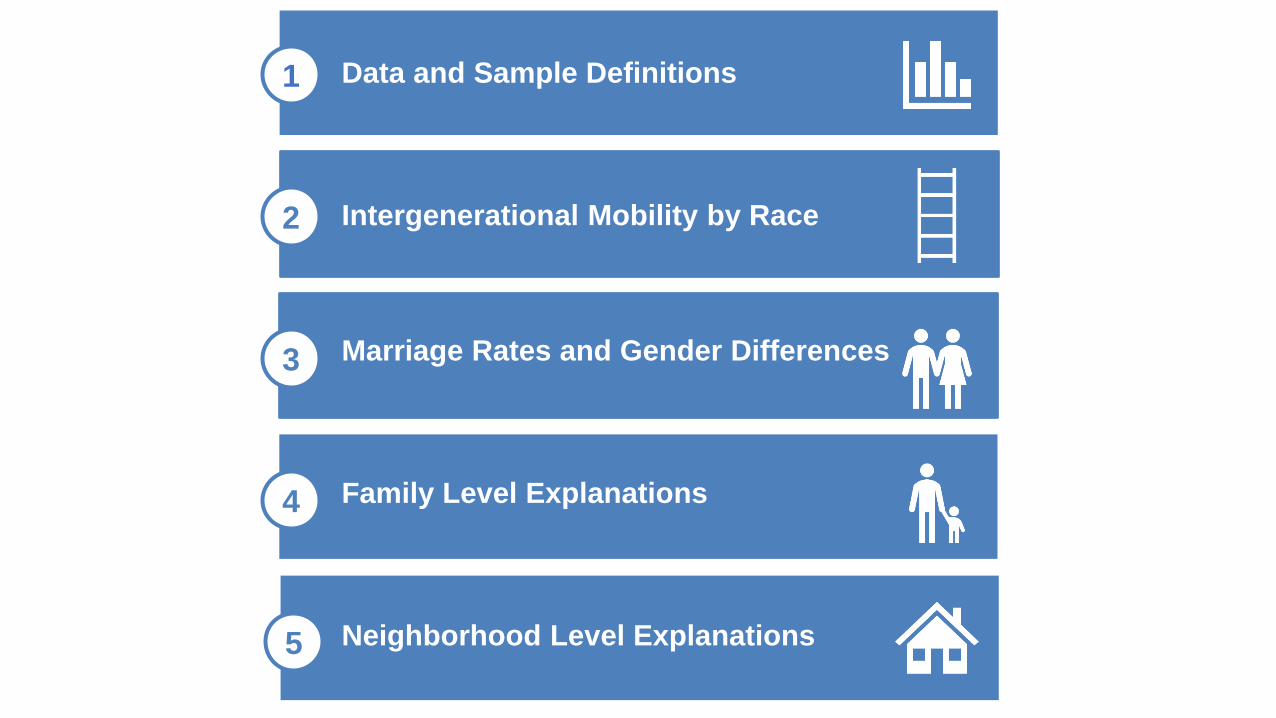
1
2
3 Marriage Rates and Gender Differences
5 Neighborhood Level Explanations
Intergenerational Mobility by Race
Family Level Explanations4
Data and Sample Definitions
1
2
3 Marriage Rates and Gender Differences
5
Intergenerational Mobility by Race
Family Level Explanations4
Data and Sample Definitions
Neighborhood-Level Explanations

Data sources: Census data (2000, 2010, ACS) covering U.S. population
linked to federal income tax returns from 1989-2015 [Akee, Jones, and Porter 2017]
Intergenerational linkage: Children linked to parents who first claim them as
a dependent on a tax return
Target sample: Children in 1978-83 birth cohorts who were born in the U.S.
or are authorized immigrants who came to the U.S. in childhood
Analysis sample: 20 million children, 94% coverage rate of target sample
Data and Sample Definitions
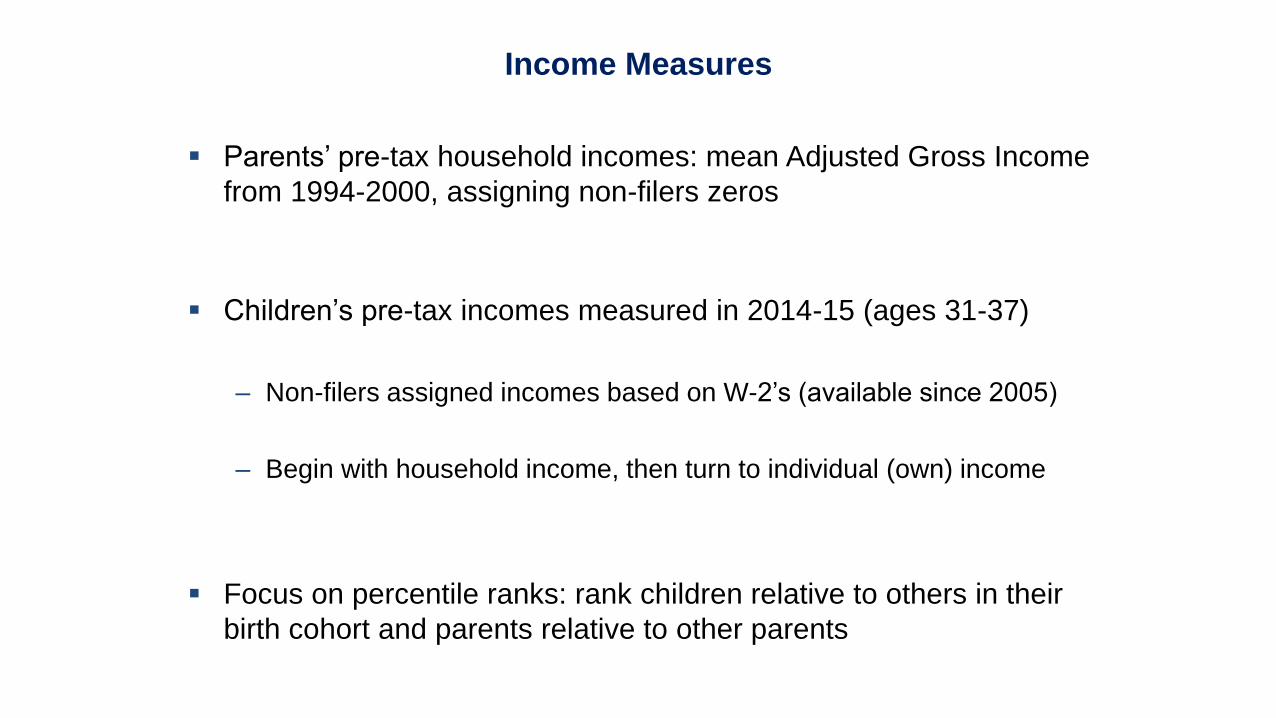
Parents’ pre-tax household incomes: mean Adjusted Gross Income
from 1994-2000, assigning non-filers zeros
Children’s pre-tax incomes measured in 2014-15 (ages 31-37)
– Non-filers assigned incomes based on W-2’s (available since 2005)
– Begin with household income, then turn to individual (own) income
Focus on percentile ranks: rank children relative to others in their
birth cohort and parents relative to other parents
Income Measures
1
2
3 Marriage Rates and Gender Differences
5
Intergenerational Mobility by Race
Family Level Explanations4
Data and Sample Definitions
Neighborhood-Level Explanations
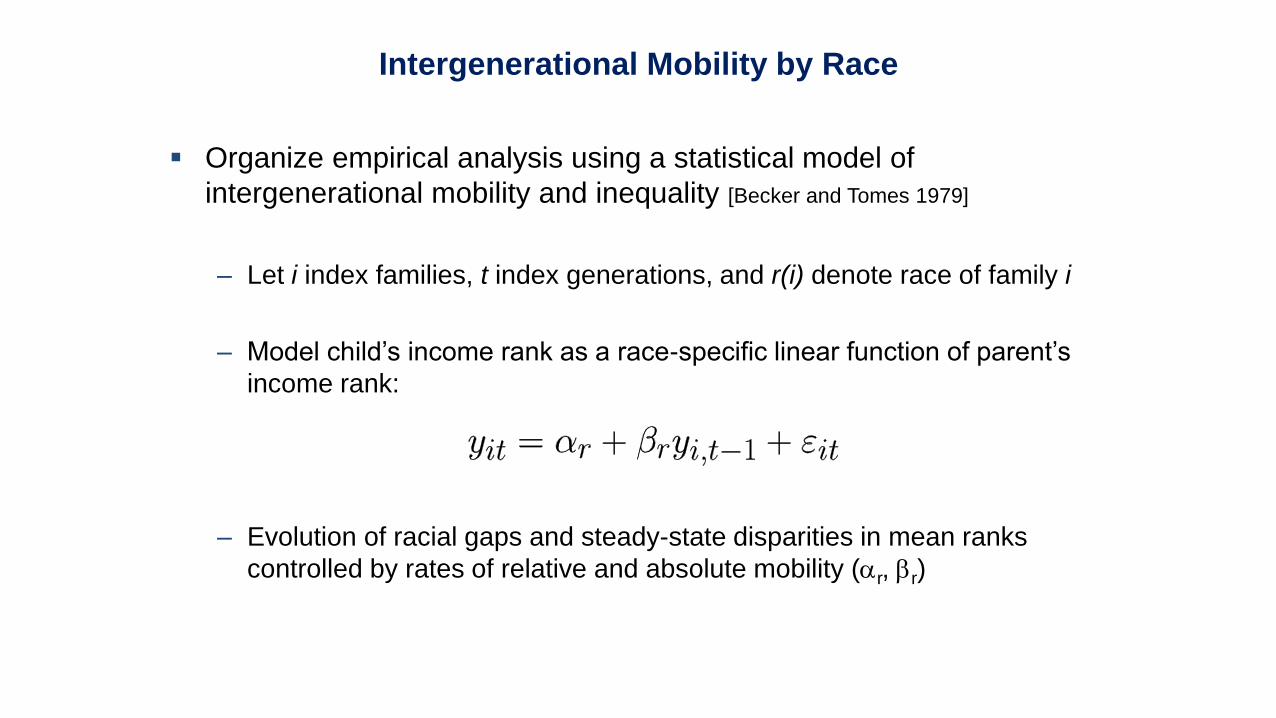
Organize empirical analysis using a statistical model of
intergenerational mobility and inequality [Becker and Tomes 1979]
– Let i index families, t index generations, and r(i) denote race of family i
– Model child’s income rank as a race-specific linear function of parent’s
income rank:
– Evolution of racial gaps and steady-state disparities in mean ranks
controlled by rates of relative and absolute mobility (ar, br)
Intergenerational Mobility by Race
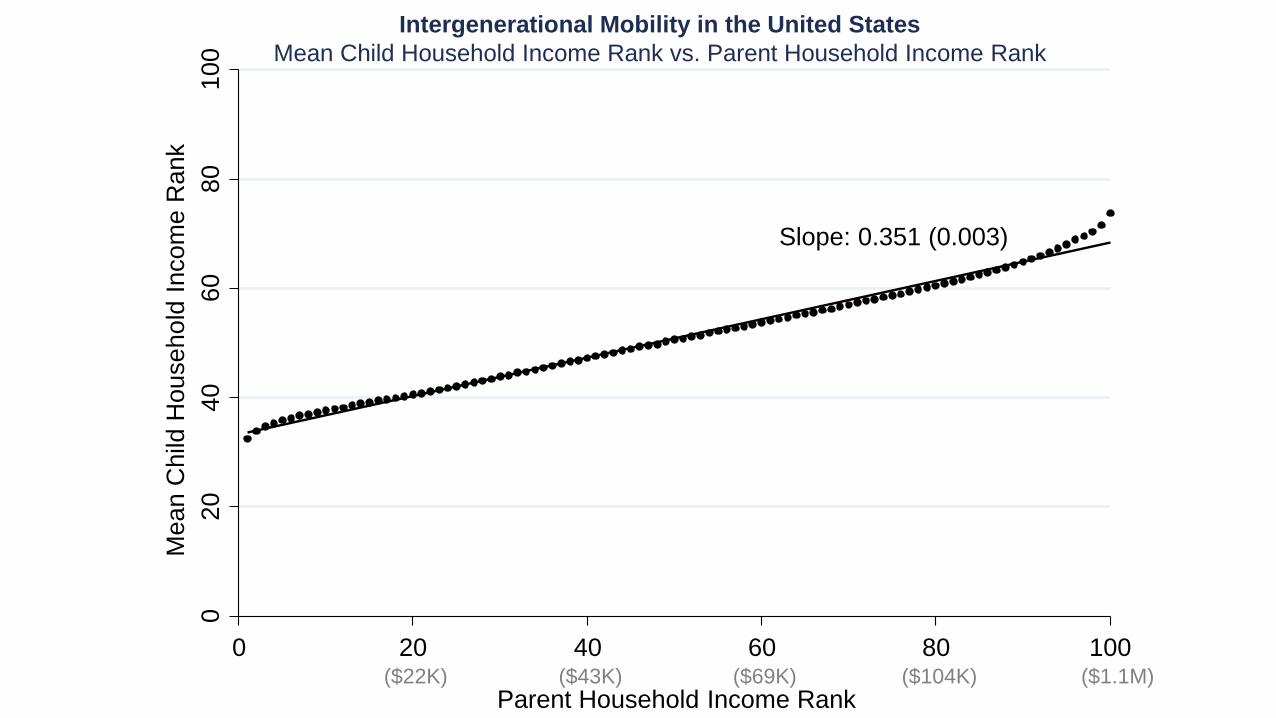
Intergenerational Mobility in the United States
Mean Child Household Income Rank vs. Parent Household Income Rank
Slope: 0.351 (0.003)0
20
40
60
80
10
0
Me
an
Ch
ild H
ou
se
ho
ld I
nco
me
Ra
nk
0 20 40 60 80 100
Parent Household Income Rank($22K) ($43K) ($69K) ($104K) ($1.1M)

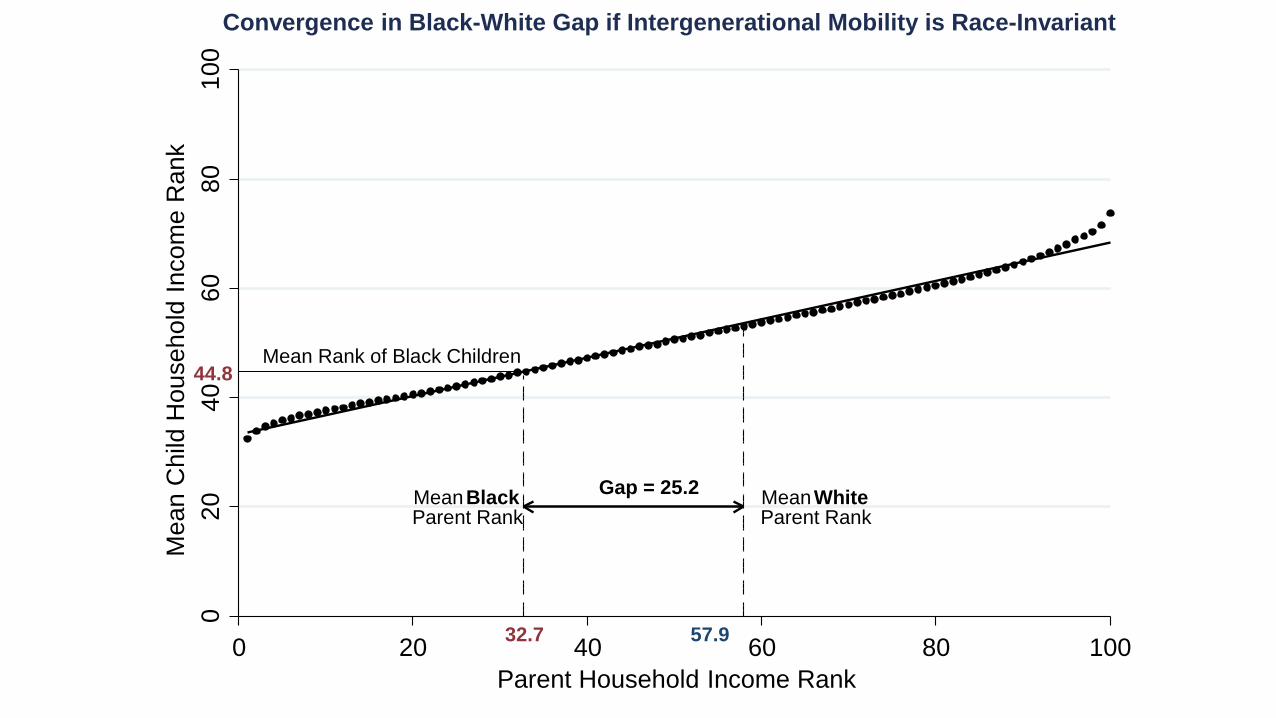
Convergence in Black-White Gap if Intergenerational Mobility is Race-Invariant
Mean BlackParent Rank
Mean WhiteParent Rank
32.7 57.9
02
04
06
08
01
00
Me
an
Ch
ild H
ou
se
ho
ld I
nco
me
Ra
nk
0 20 40 60 80 100
Parent Household Income Rank

Convergence in Black-White Gap if Intergenerational Mobility is Race-Invariant
Gap = 25.2Mean BlackParent Rank
Mean WhiteParent Rank
32.7 57.9
02
04
06
08
01
00
Me
an
Ch
ild H
ou
se
ho
ld I
nco
me
Ra
nk
0 20 40 60 80 100
Parent Household Income Rank
Convergence in Black-White Gap if Intergenerational Mobility is Race-Invariant
Gap = 25.2Mean BlackParent Rank
Mean WhiteParent Rank
32.7 57.9
Mean Rank of Black Children44.8
02
04
06
08
01
00
Me
an
Ch
ild H
ou
se
ho
ld I
nco
me
Ra
nk
0 20 40 60 80 100
Parent Household Income Rank
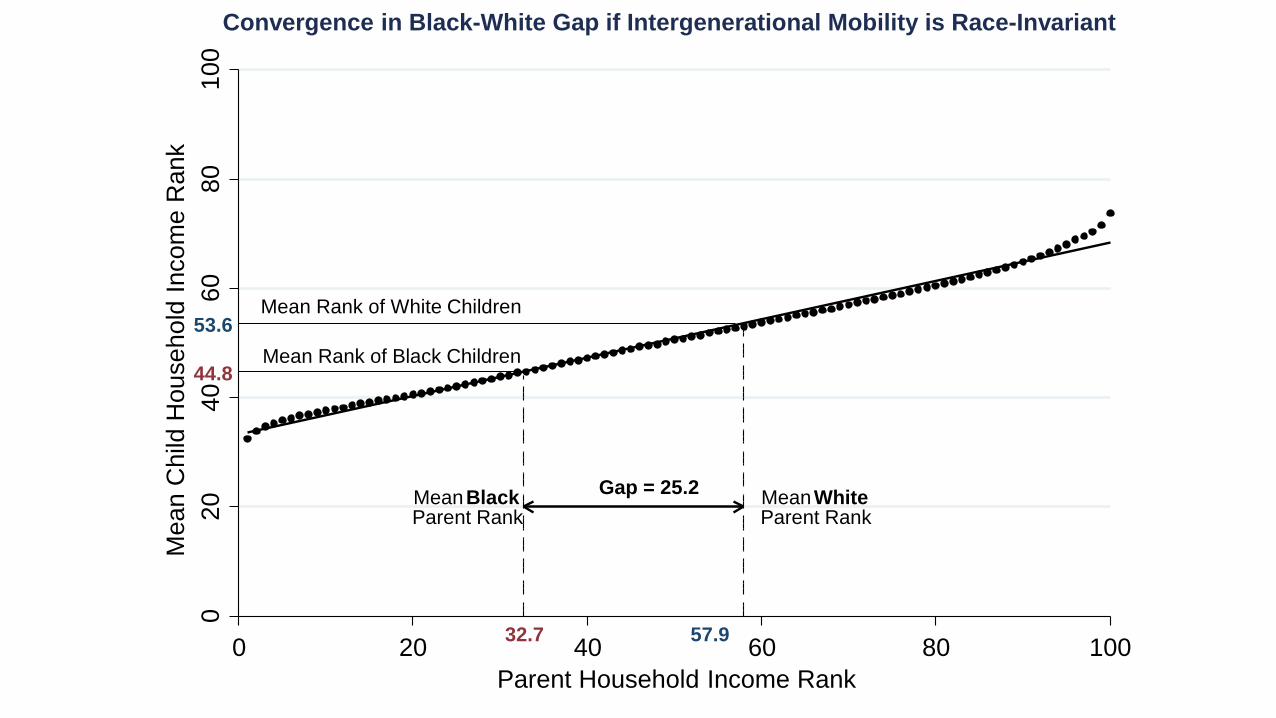
Convergence in Black-White Gap if Intergenerational Mobility is Race-Invariant
Gap = 25.2Mean BlackParent Rank
Mean WhiteParent Rank
32.7 57.9
Mean Rank of White Children53.6
Mean Rank of Black Children44.8
02
04
06
08
01
00
Me
an
Ch
ild H
ou
se
ho
ld I
nco
me
Ra
nk
0 20 40 60 80 100
Parent Household Income Rank

Convergence in Black-White Gap if Intergenerational Mobility is Race-Invariant
Current Gen.Gap = 25.2
Mean BlackParent Rank
Mean WhiteParent Rank
32.7 57.9
53.6
Pred. Gap in Next Gen. = 8.844.8
02
04
06
08
01
00
Me
an
Ch
ild H
ou
se
ho
ld I
nco
me
Ra
nk
0 20 40 60 80 100
Parent Household Income Rank
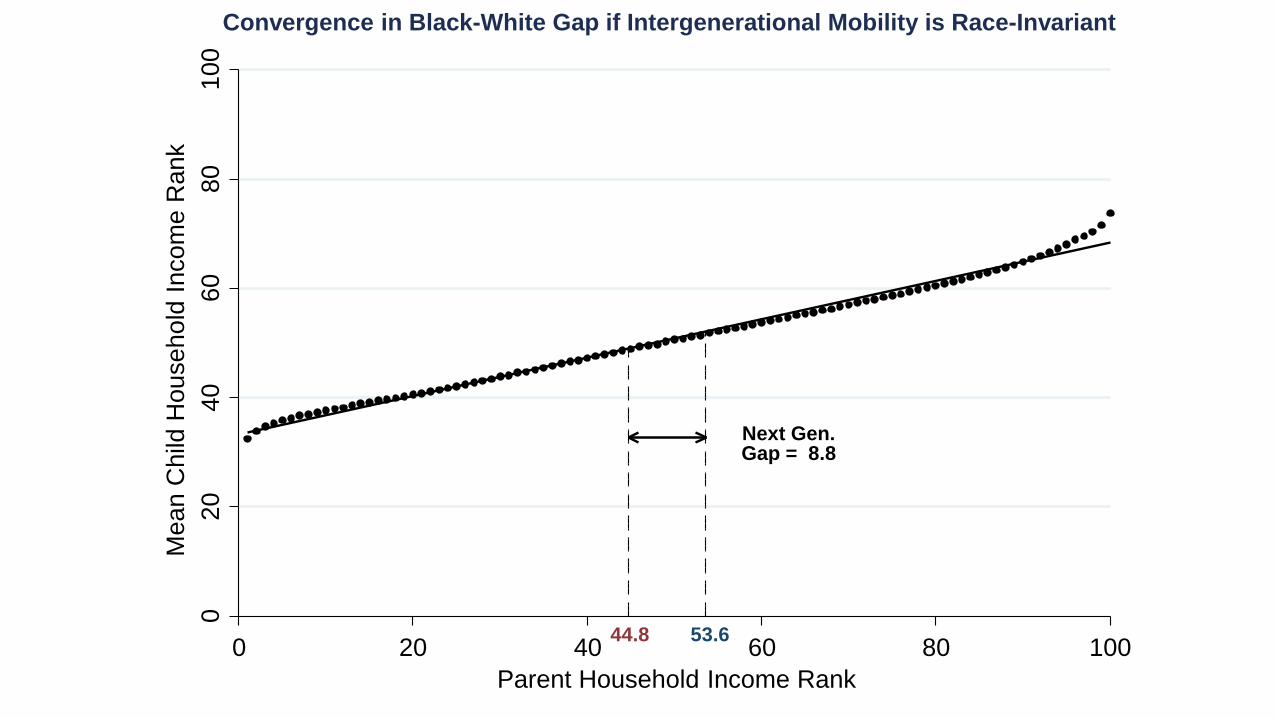
Convergence in Black-White Gap if Intergenerational Mobility is Race-Invariant
44.8 53.6
Next Gen.Gap = 8.8
02
04
06
08
01
00
Me
an
Ch
ild H
ou
se
ho
ld I
nco
me
Ra
nk
0 20 40 60 80 100
Parent Household Income Rank
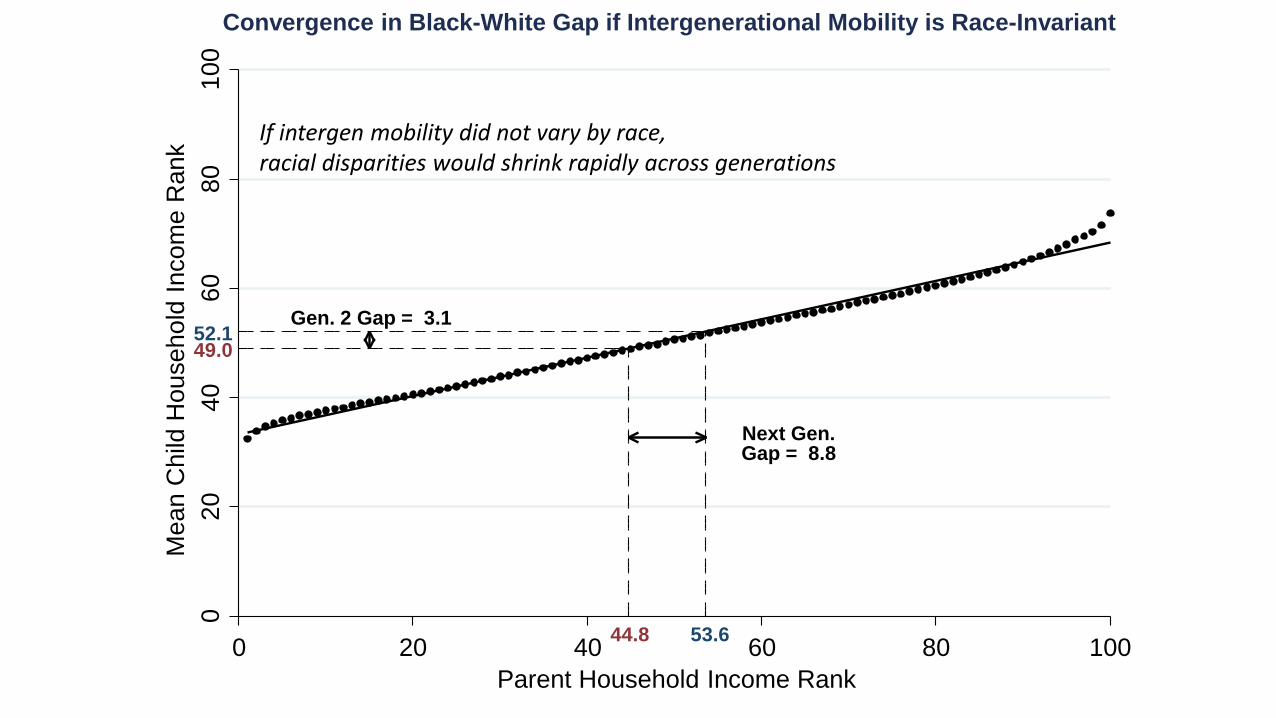
If intergen mobility did not vary by race, racial disparities would shrink rapidly across generations
Convergence in Black-White Gap if Intergenerational Mobility is Race-Invariant
44.8 53.6
Next Gen.Gap = 8.8
52.149.0
Gen. 2 Gap = 3.1
02
04
06
08
01
00
Me
an
Ch
ild H
ou
se
ho
ld I
nco
me
Ra
nk
0 20 40 60 80 100
Parent Household Income Rank
02
04
06
08
01
00
Me
an
Ch
ild H
ou
se
ho
ld I
nco
me
Ra
nk
0 20 40 60 80 100
Parent Household Income Rank
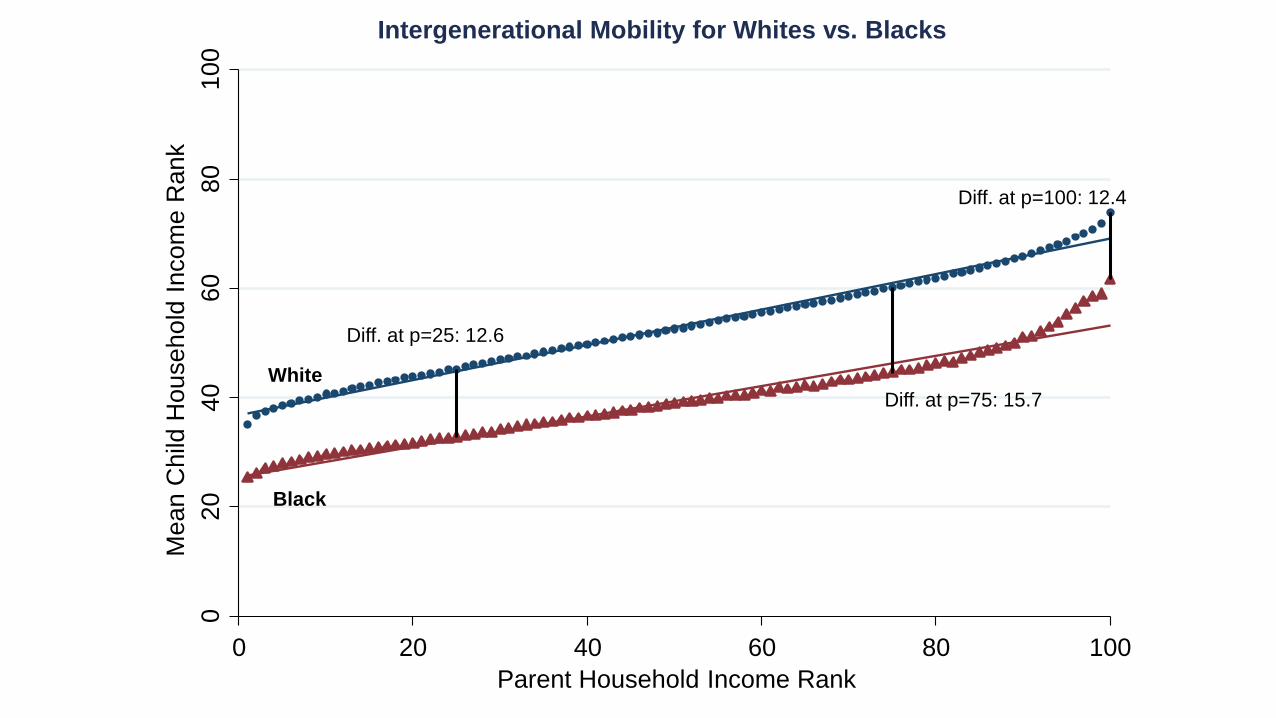
Intergenerational Mobility for Whites vs. Blacks
White
Black
Diff. at p=25: 12.6
Diff. at p=75: 15.7
Diff. at p=100: 12.4
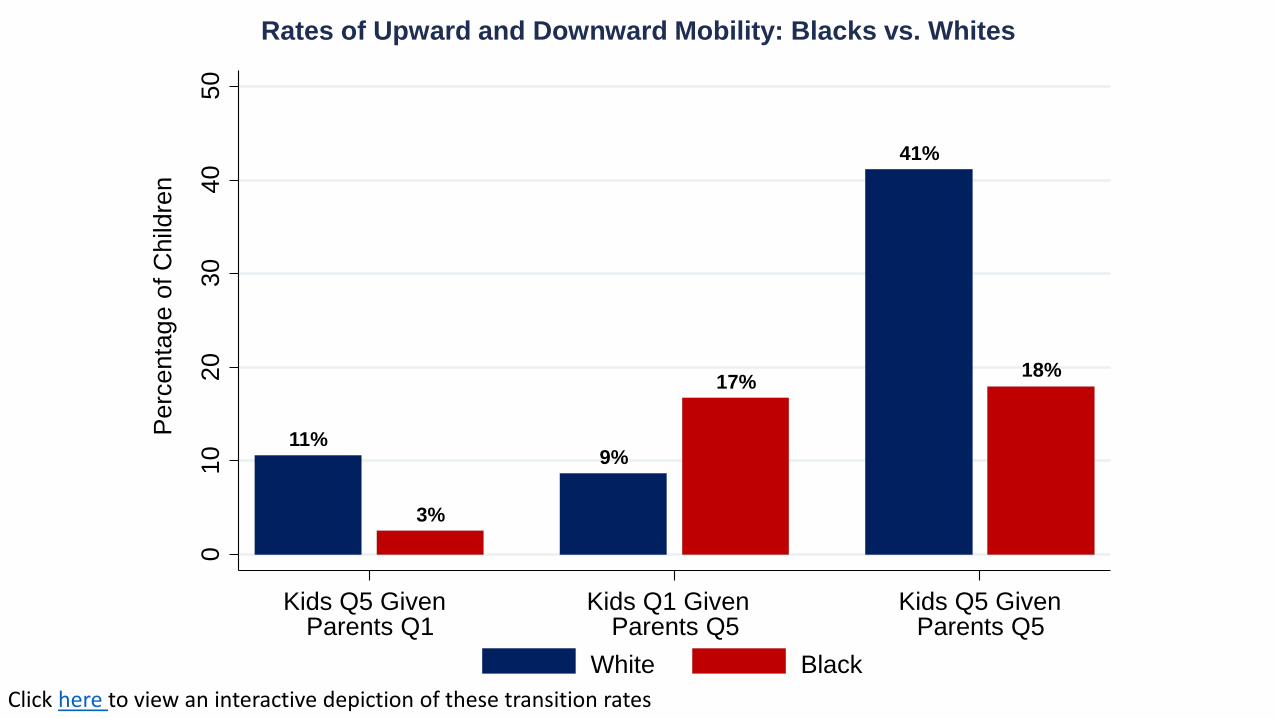
9%11%
41%
17%
3%
18%
01
02
03
04
05
0
Perc
enta
ge o
f C
hild
ren
Kids Q5 Given Parents Q1
Kids Q1 GivenParents Q5
Kids Q5 GivenParents Q5
White Black
Rates of Upward and Downward Mobility: Blacks vs. Whites
Click here to view an interactive depiction of these transition rates
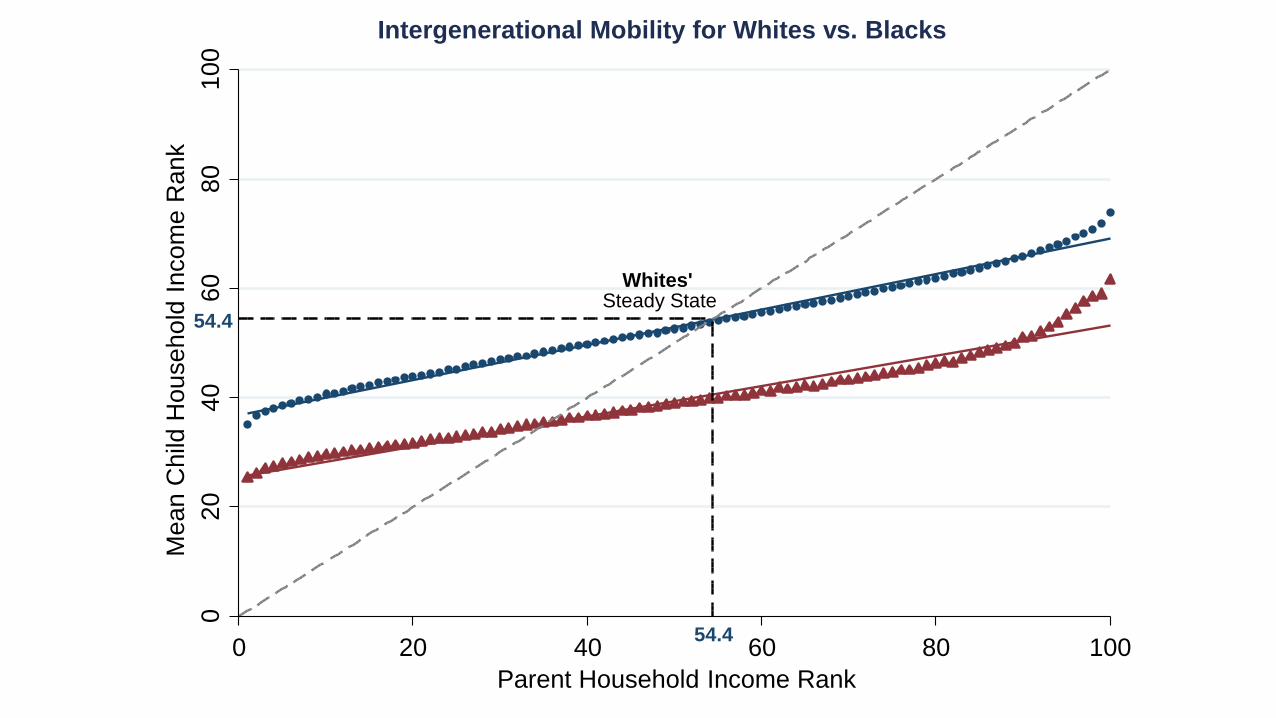
54.4
54.4
Whites'Steady State
02
04
06
08
01
00
Me
an
Ch
ild H
ou
se
ho
ld I
nco
me
Ra
nk
0 20 40 60 80 100
Parent Household Income Rank
Intergenerational Mobility for Whites vs. Blacks

35.2 54.4
35.2
54.4
Blacks'Steady State
Whites'Steady State
02
04
06
08
01
00
Me
an
Ch
ild H
ou
se
ho
ld I
nco
me
Ra
nk
0 20 40 60 80 100
Parent Household Income Rank
Intergenerational Mobility for Whites vs. Blacks
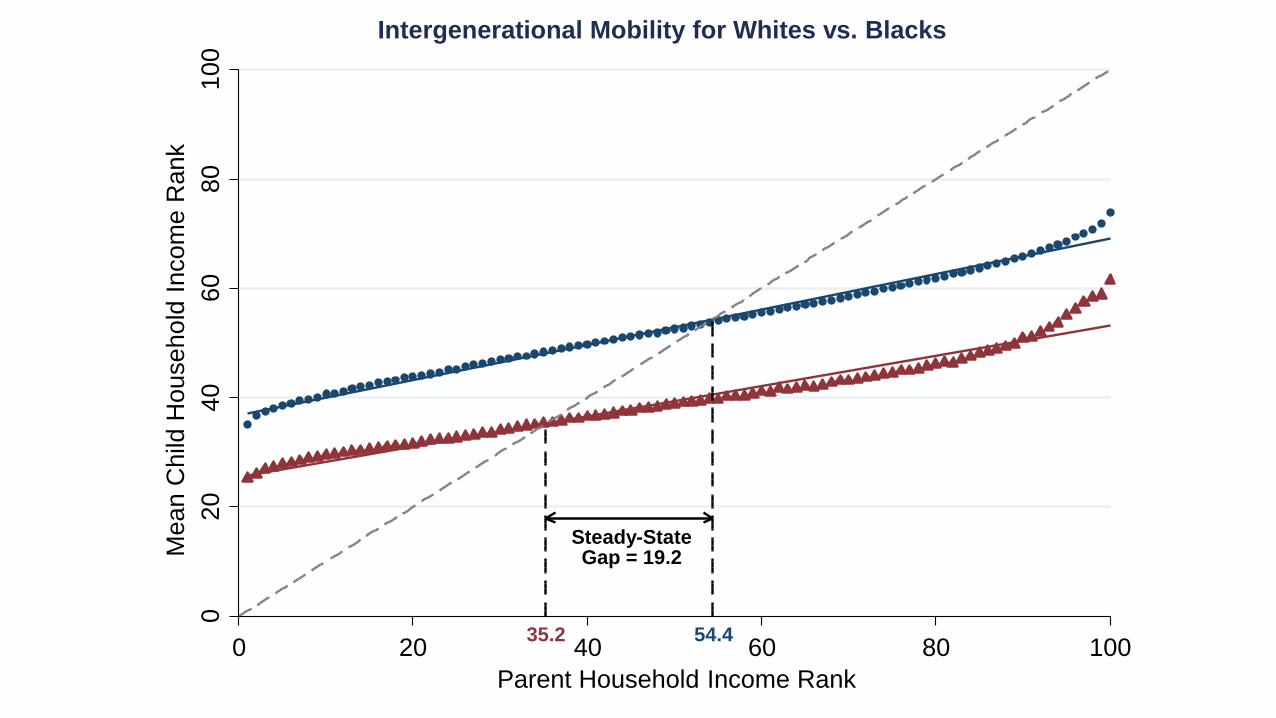
35.2 54.4
Steady-StateGap = 19.2
02
04
06
08
01
00
Me
an
Ch
ild H
ou
se
ho
ld I
nco
me
Ra
nk
0 20 40 60 80 100
Parent Household Income Rank
Intergenerational Mobility for Whites vs. Blacks
35.2 54.4
Steady-StateGap = 19.2
02
04
06
08
01
00
Me
an
Ch
ild H
ou
se
ho
ld I
nco
me
Ra
nk
0 20 40 60 80 100
Parent Household Income Rank
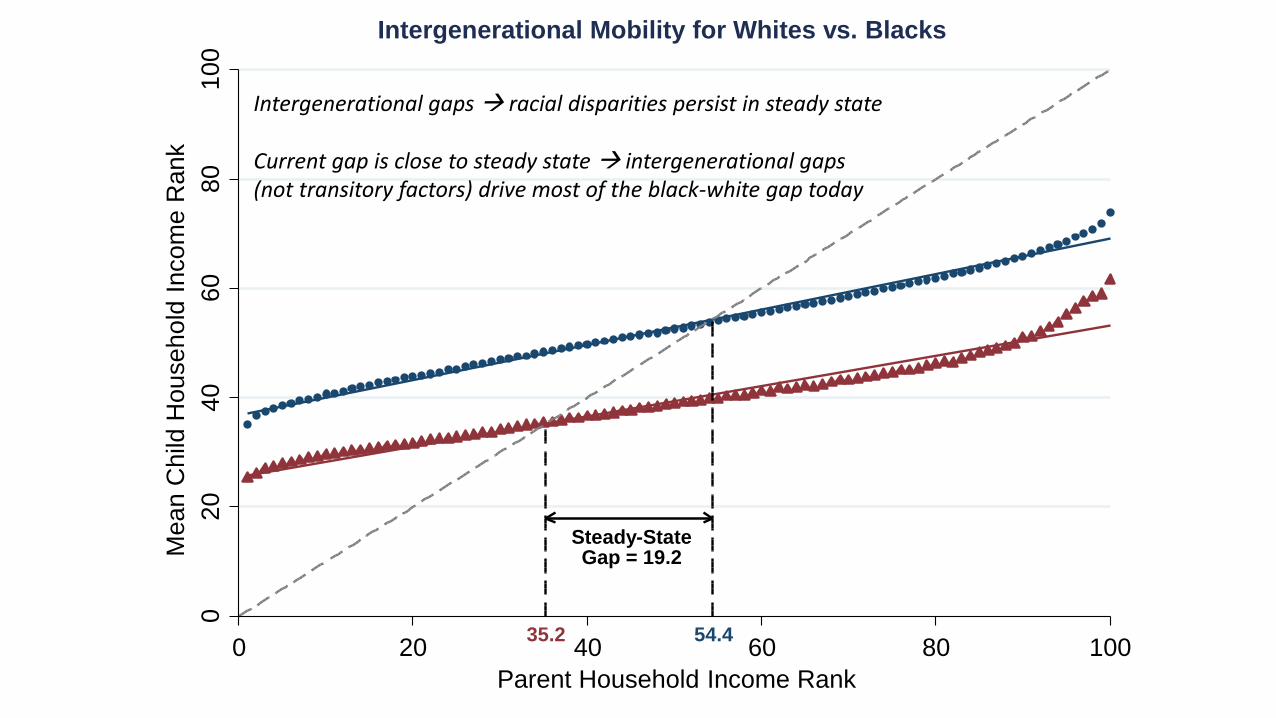
Intergenerational Mobility for Whites vs. Blacks
Intergenerational gaps racial disparities persist in steady state
Current gap is close to steady state intergenerational gaps(not transitory factors) drive most of the black-white gap today
02
04
06
08
01
00
Me
an
Ch
ild H
ou
se
ho
ld I
nco
me
Ra
nk
0 20 40 60 80 100
Parent Household Income Rank
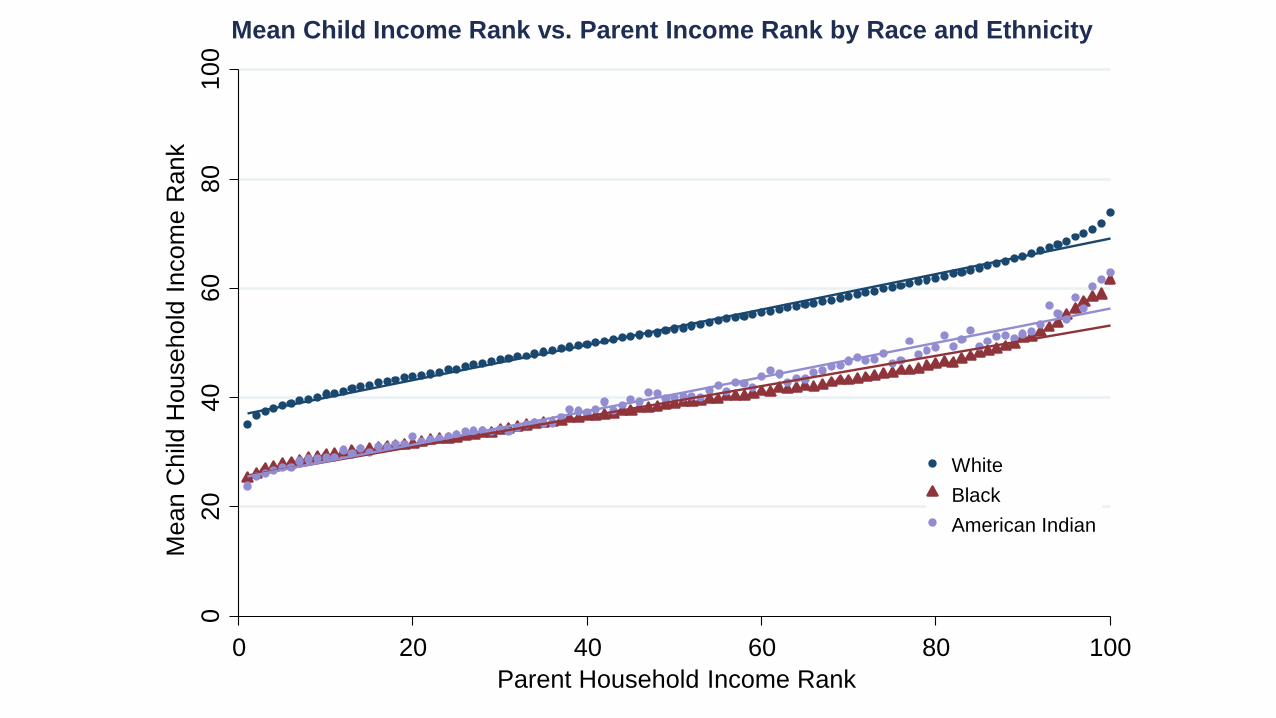
Mean Child Income Rank vs. Parent Income Rank by Race and Ethnicity
White
Black
American Indian
02
04
06
08
01
00
Me
an
Ch
ild H
ou
se
ho
ld I
nco
me
Ra
nk
0 20 40 60 80 100
Parent Household Income Rank
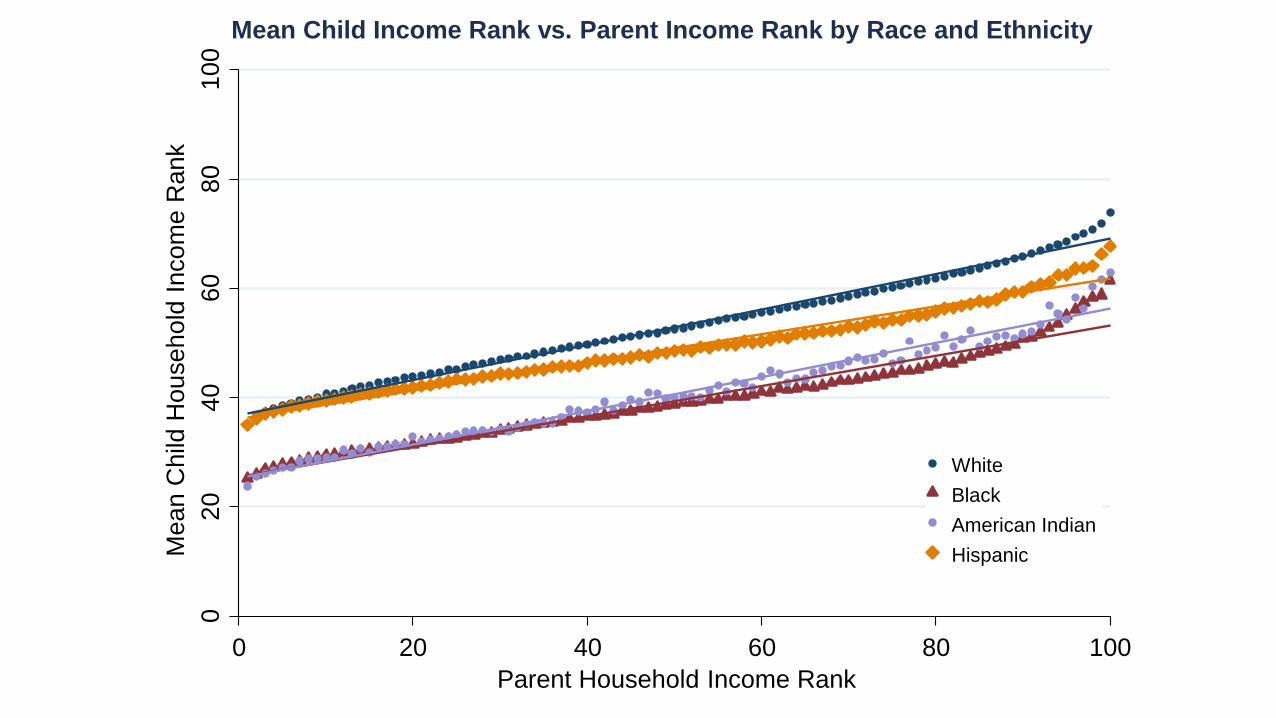
Mean Child Income Rank vs. Parent Income Rank by Race and Ethnicity
White
Black
American Indian
Hispanic
02
04
06
08
01
00
Me
an
Ch
ild H
ou
se
ho
ld I
nco
me
Ra
nk
0 20 40 60 80 100
Parent Household Income Rank
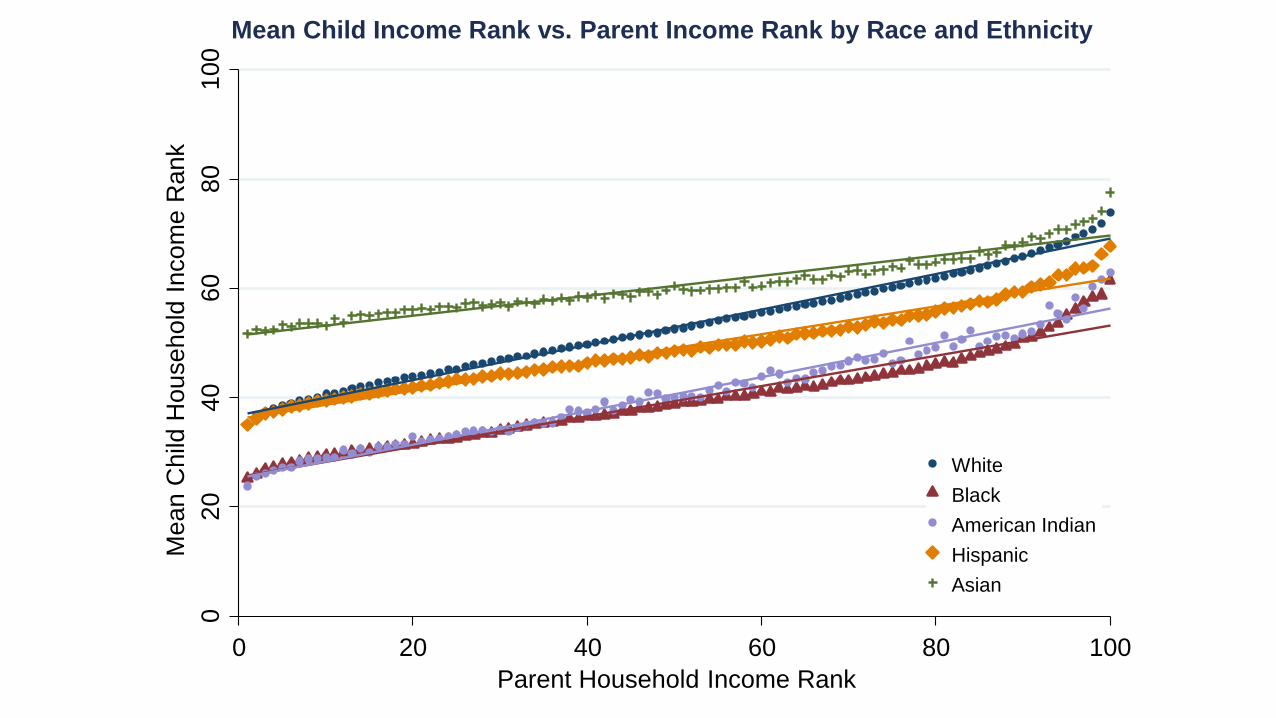
White
Black
American Indian
Hispanic
Asian
Mean Child Income Rank vs. Parent Income Rank by Race and Ethnicity
02
04
06
08
01
00
Me
an
Ch
ild H
ou
se
ho
ld I
nco
me
Ra
nk
0 20 40 60 80 100
Parent Household Income Rank
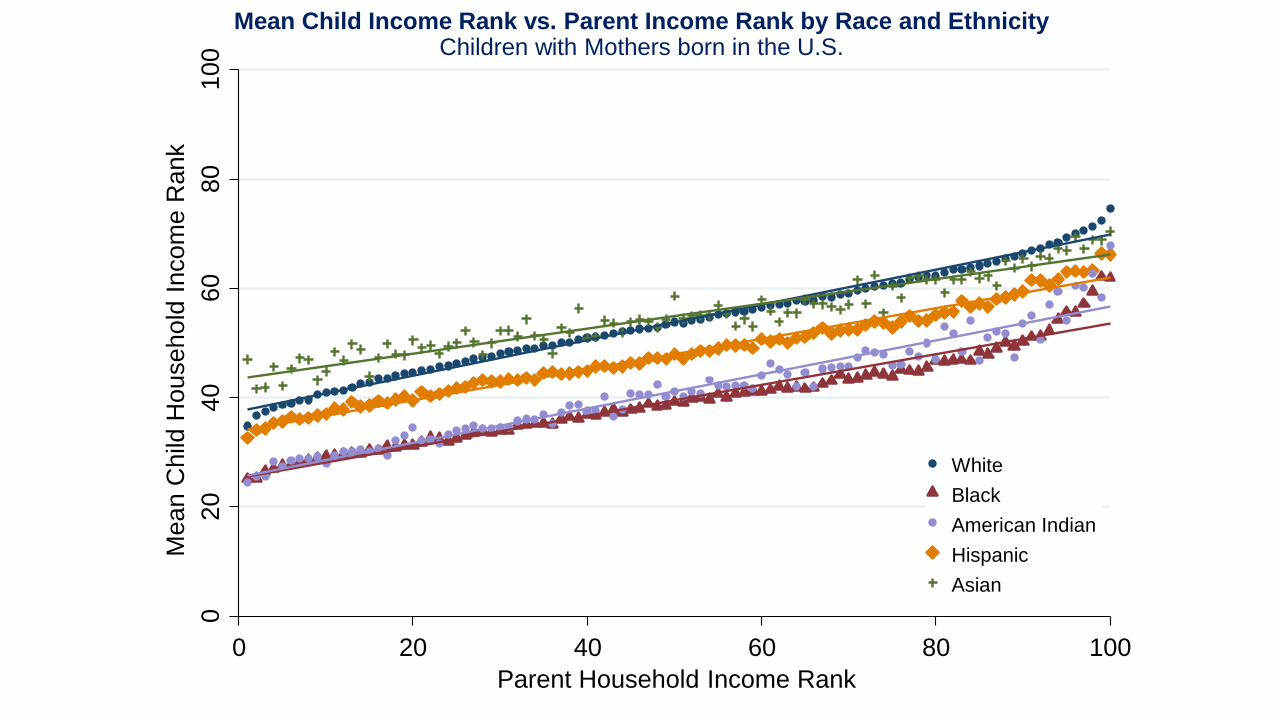
White
Black
American Indian
Hispanic
Asian
Mean Child Income Rank vs. Parent Income Rank by Race and EthnicityChildren with Mothers born in the U.S.
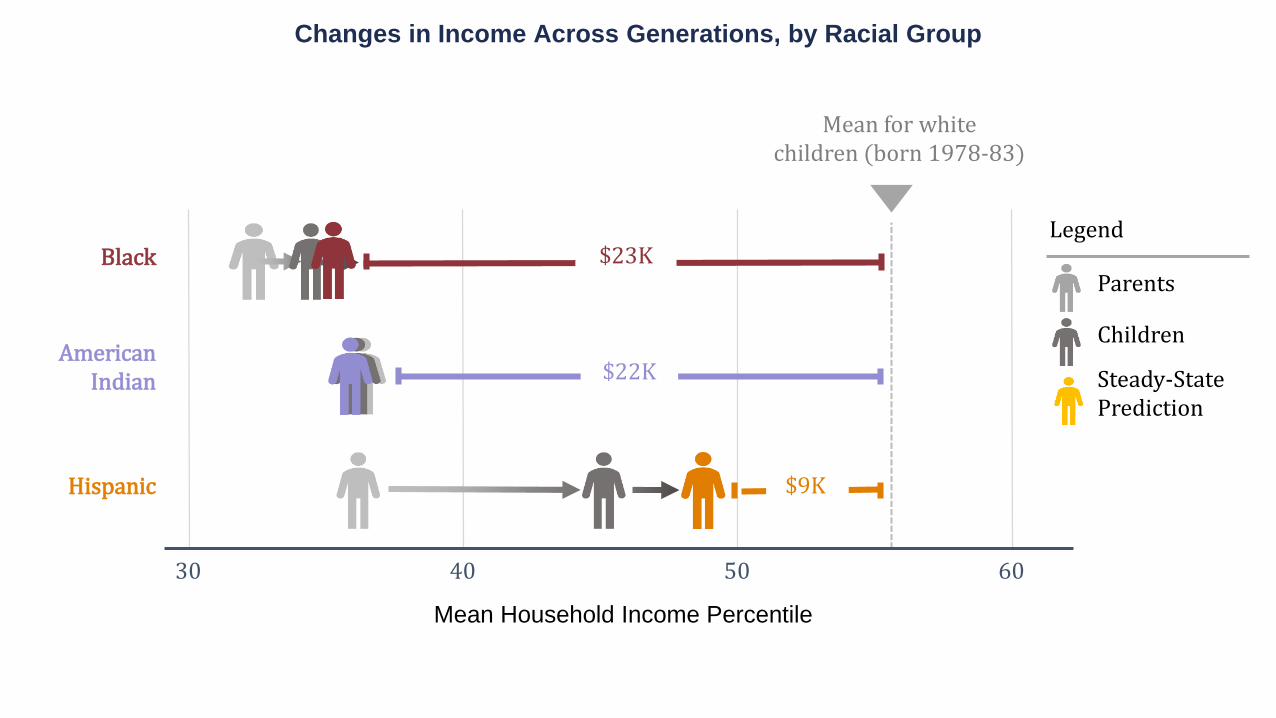
Mean for white children (born 1978-83)
30 40 50 60
Mean Household Income Percentile
Legend
Parents
Children
Steady-State Prediction
Black $23K
American Indian $22K
$9KHispanic
Changes in Income Across Generations, by Racial Group
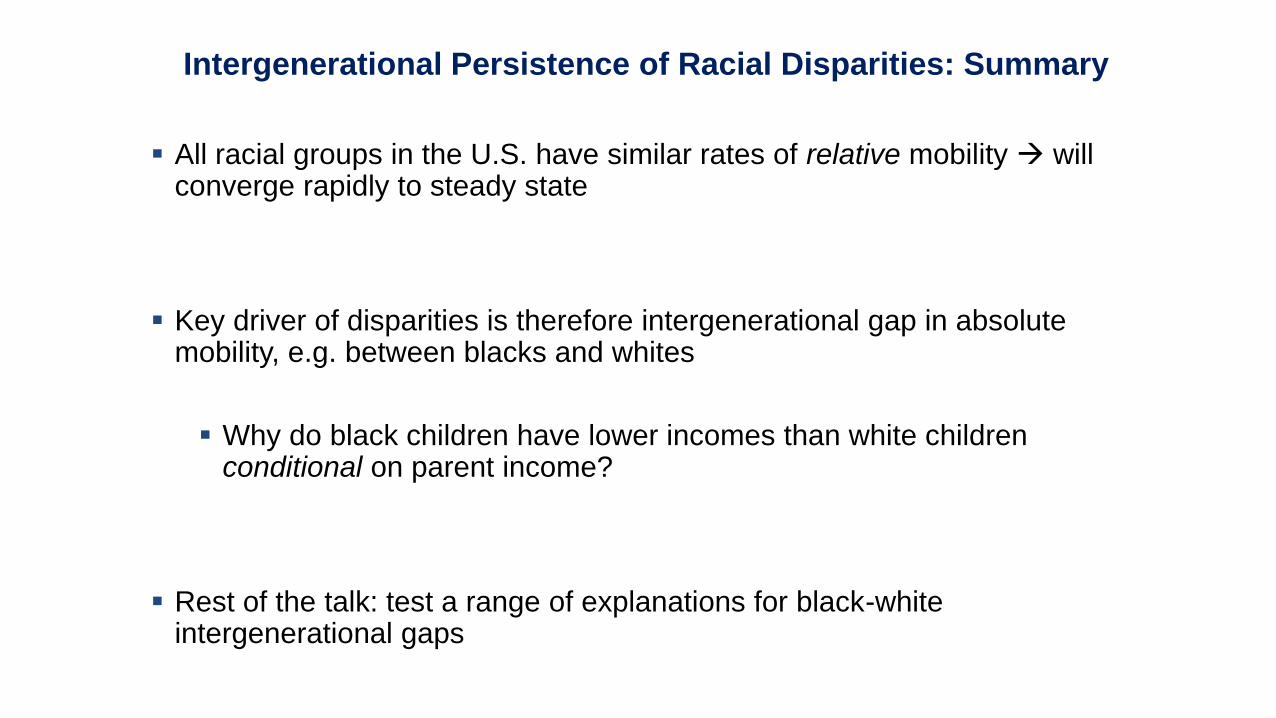
All racial groups in the U.S. have similar rates of relative mobility will converge rapidly to steady state
Key driver of disparities is therefore intergenerational gap in absolute mobility, e.g. between blacks and whites
Why do black children have lower incomes than white children conditional on parent income?
Rest of the talk: test a range of explanations for black-white intergenerational gaps
Intergenerational Persistence of Racial Disparities: Summary

1
2
3 Marriage Rates and Gender Differences
5
Intergenerational Mobility by Race
Family Level Explanations4
Data and Sample Definitions
Neighborhood-Level Explanations
Well-known that blacks marry at much lower rates than whites
Do differences in marriage rates create mechanical differences
between the household incomes of blacks and whites?
Examine marriage rates and children’s individual incomes by
parental income
Mechanical Effects of Household Size
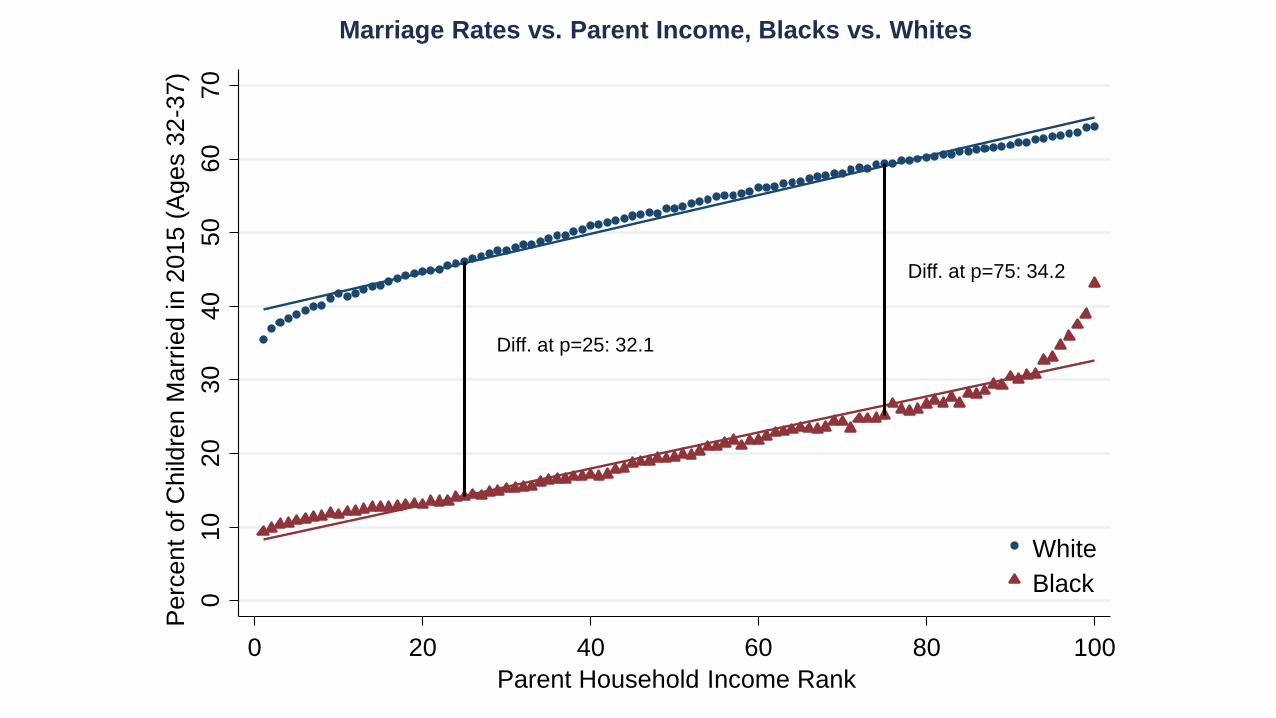
Diff. at p=25: 32.1
Diff. at p=75: 34.2
01
02
03
04
05
06
07
0
Pe
rce
nt
of
Ch
ildre
n M
arr
ied
in
20
15
(A
ge
s 3
2-3
7)
0 20 40 60 80 100
Parent Household Income Rank
White
Black
Marriage Rates vs. Parent Income, Blacks vs. Whites
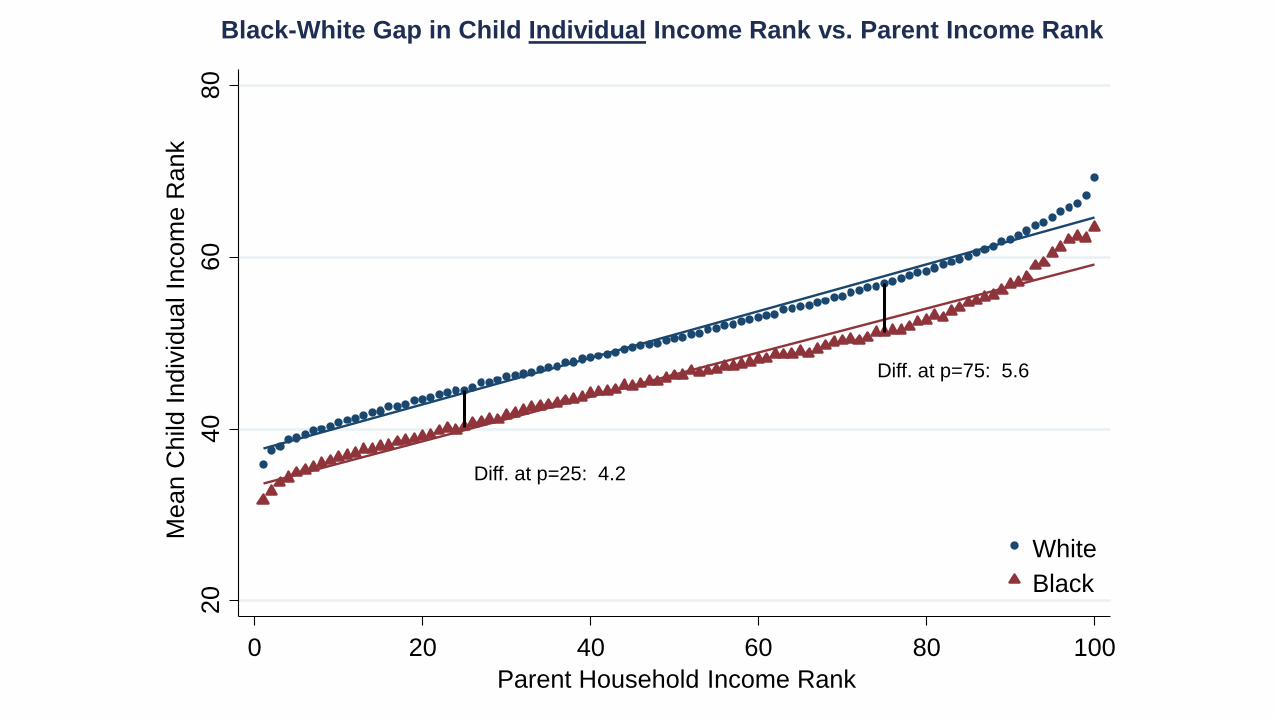
Diff. at p=25: 4.2
Diff. at p=75: 5.6
20
40
60
80
Me
an C
hild
Indiv
idu
al In
com
e R
ank
0 20 40 60 80 100
Parent Household Income Rank
White
Black
Black-White Gap in Child Individual Income Rank vs. Parent Income Rank

Diff. at p=25: 9.7
Diff. at p=75: 12.0
20
40
60
80
Me
an C
hild
Indiv
idu
al In
com
e R
ank
0 20 40 60 80 100
Parent Household Income Rank
White
Black
Black-White Gap in Child Individual Income Rank vs. Parent Income Rank
Male Children
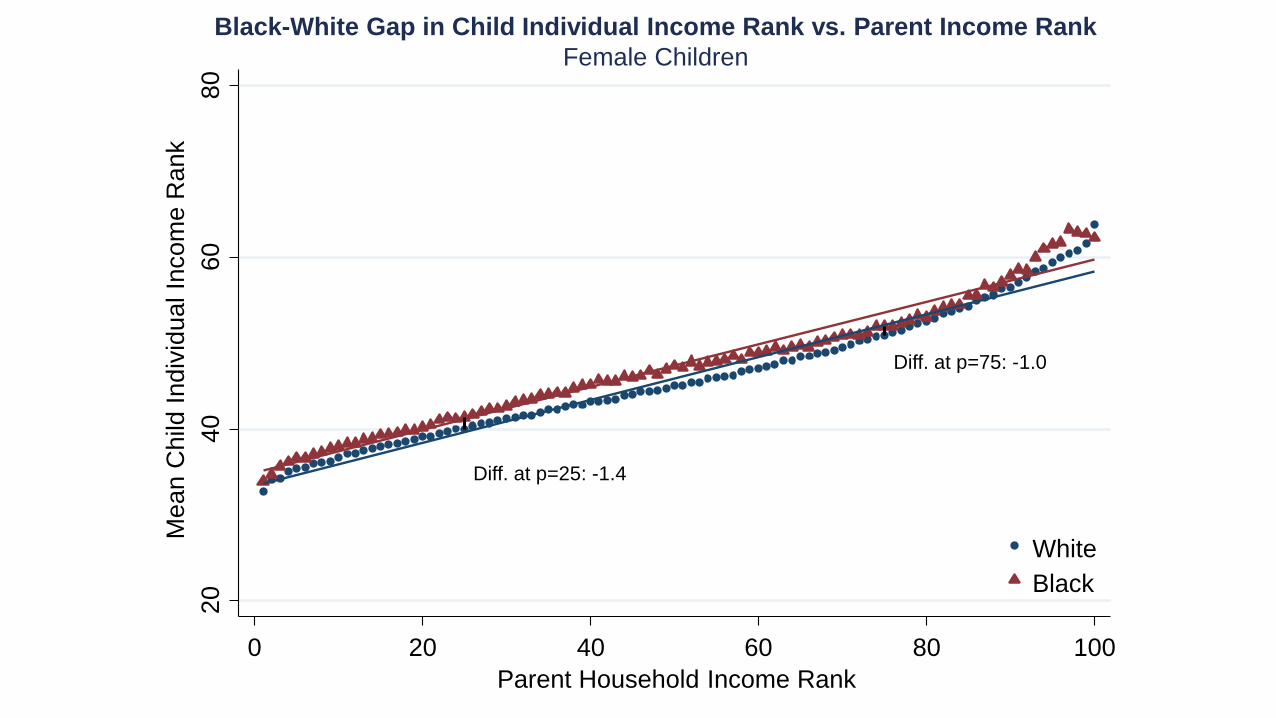
Diff. at p=25: -1.4
Diff. at p=75: -1.0
20
40
60
80
Me
an C
hild
Indiv
idu
al In
com
e R
ank
0 20 40 60 80 100
Parent Household Income Rank
White
Black
Black-White Gap in Child Individual Income Rank vs. Parent Income Rank
Female Children
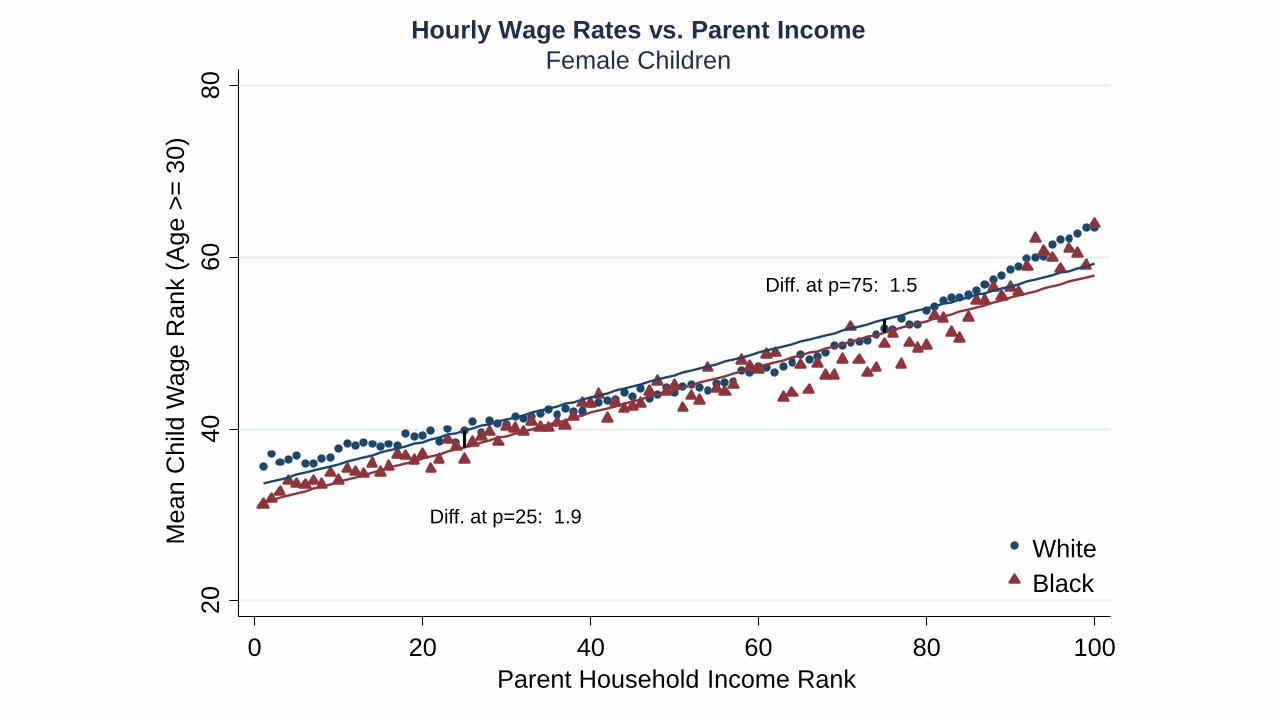
Diff. at p=25: 1.9
Diff. at p=75: 1.5
20
40
60
80
Me
an C
hild
Wage R
ank (
Age >
= 3
0)
0 20 40 60 80 100
Parent Household Income Rank
White
Black
Hourly Wage Rates vs. Parent Income
Female Children
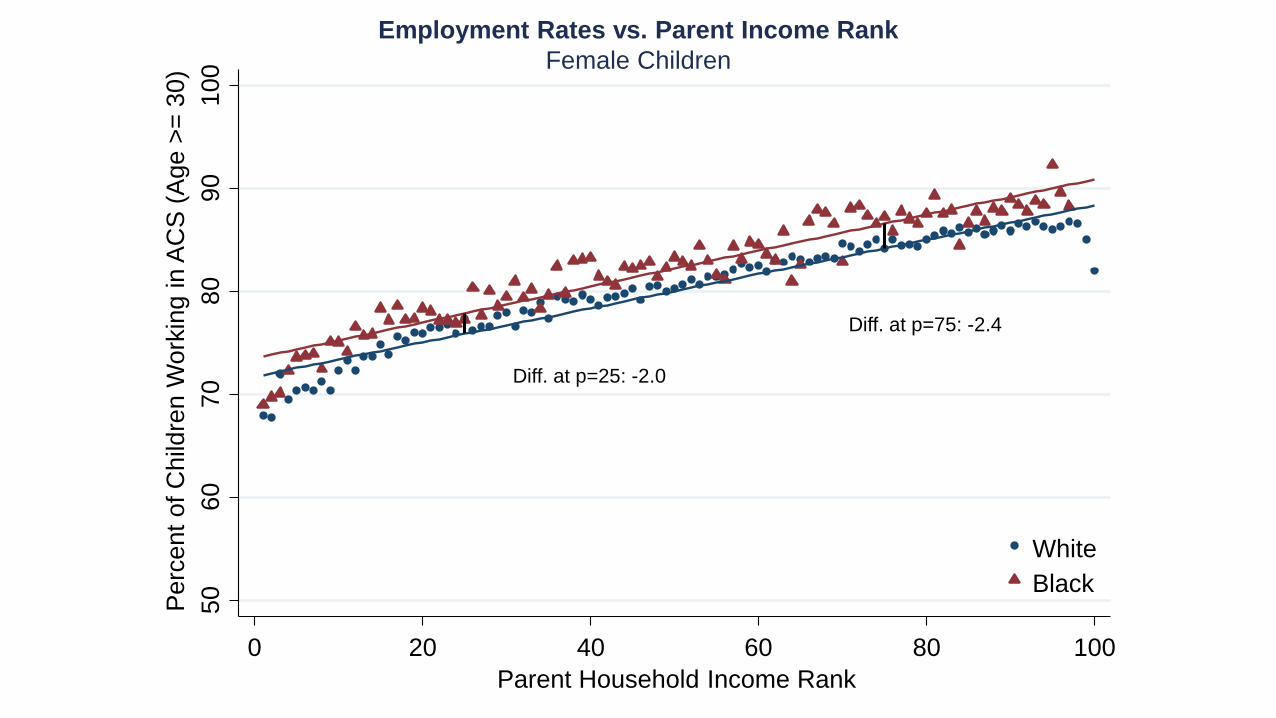
Diff. at p=25: -2.0
Diff. at p=75: -2.4
50
60
70
80
90
10
0
Pe
rce
nt
of
Ch
ildre
n W
ork
ing
in
AC
S (
Ag
e >
= 3
0)
0 20 40 60 80 100
Parent Household Income Rank
White
Black
Employment Rates vs. Parent Income Rank
Female Children
50
60
70
80
90
10
0
Pe
rce
nt
of
Ch
ildre
n W
ork
ing
(A
ge
>=
30
)
0 20 40 60 80 100
Parent Household Income Rank
White Males
Black Males
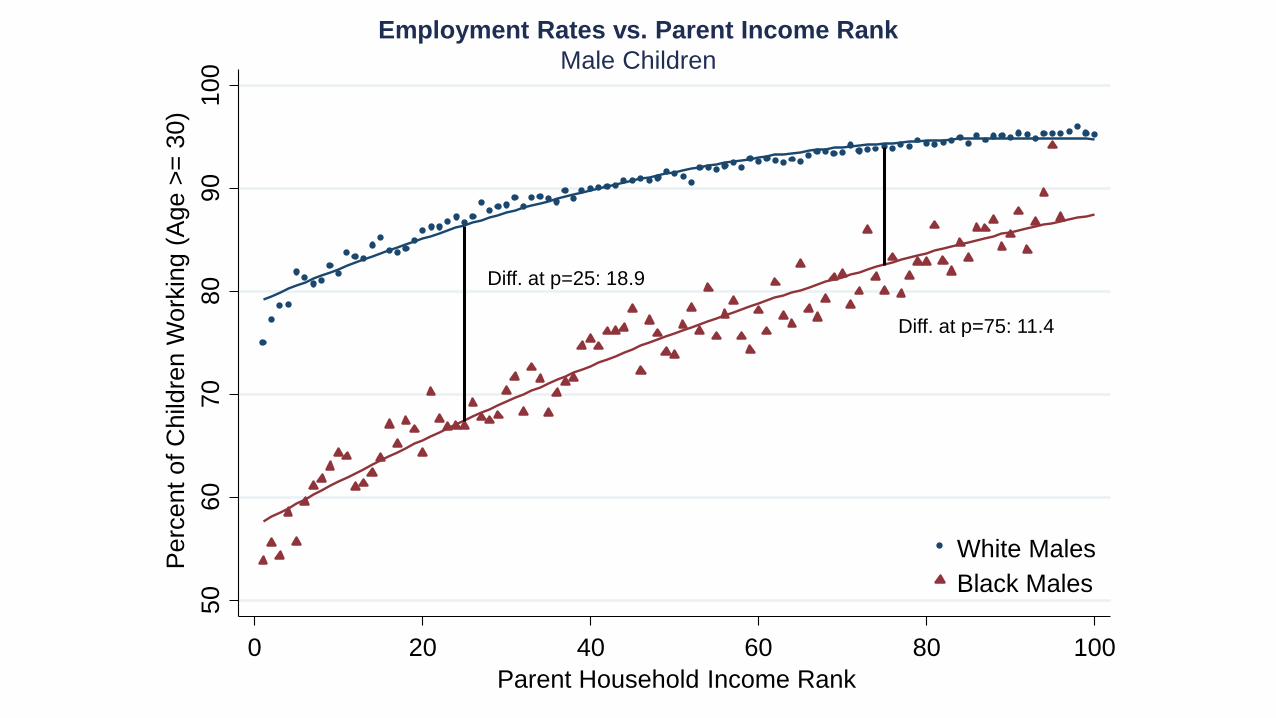
Employment Rates vs. Parent Income Rank
Male Children
Diff. at p=25: 18.9
Diff. at p=75: 11.4
50
60
70
80
90
10
0
Pe
rce
nt
of
Ch
ildre
n W
ork
ing
(A
ge
>=
30
)
0 20 40 60 80 100
Parent Household Income Rank
White Males
Black Males
White Females
Black Females
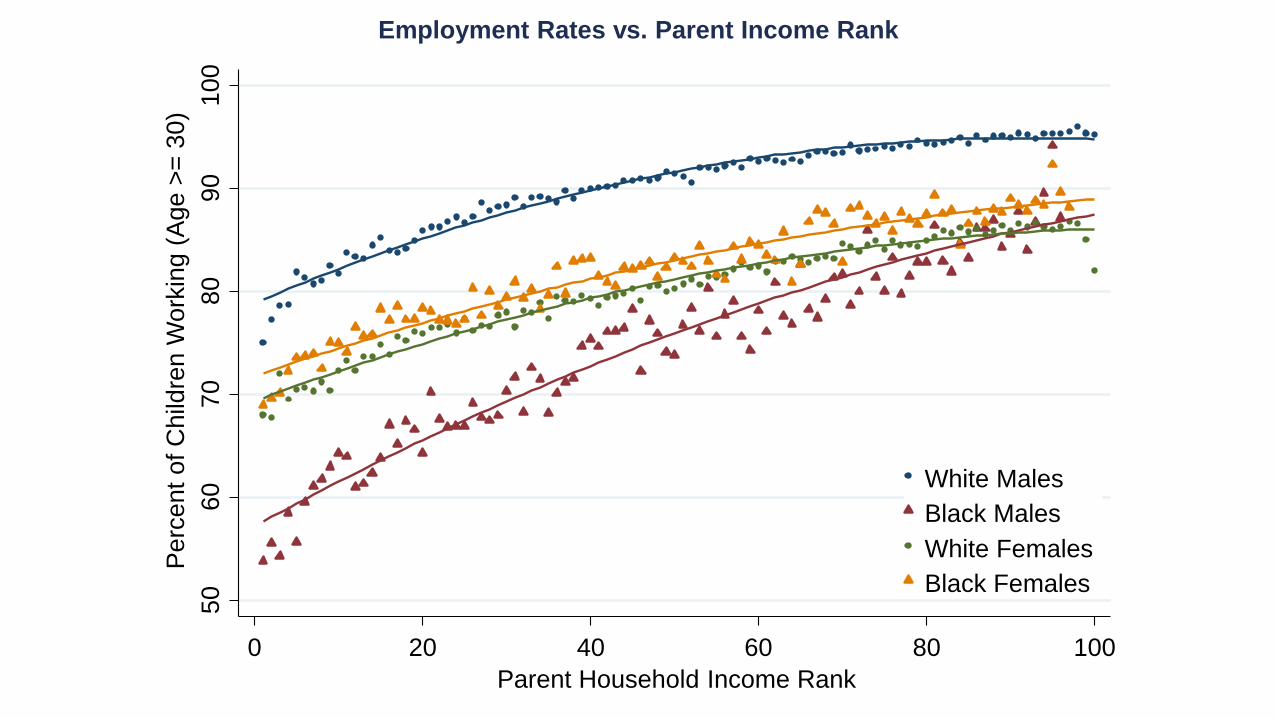
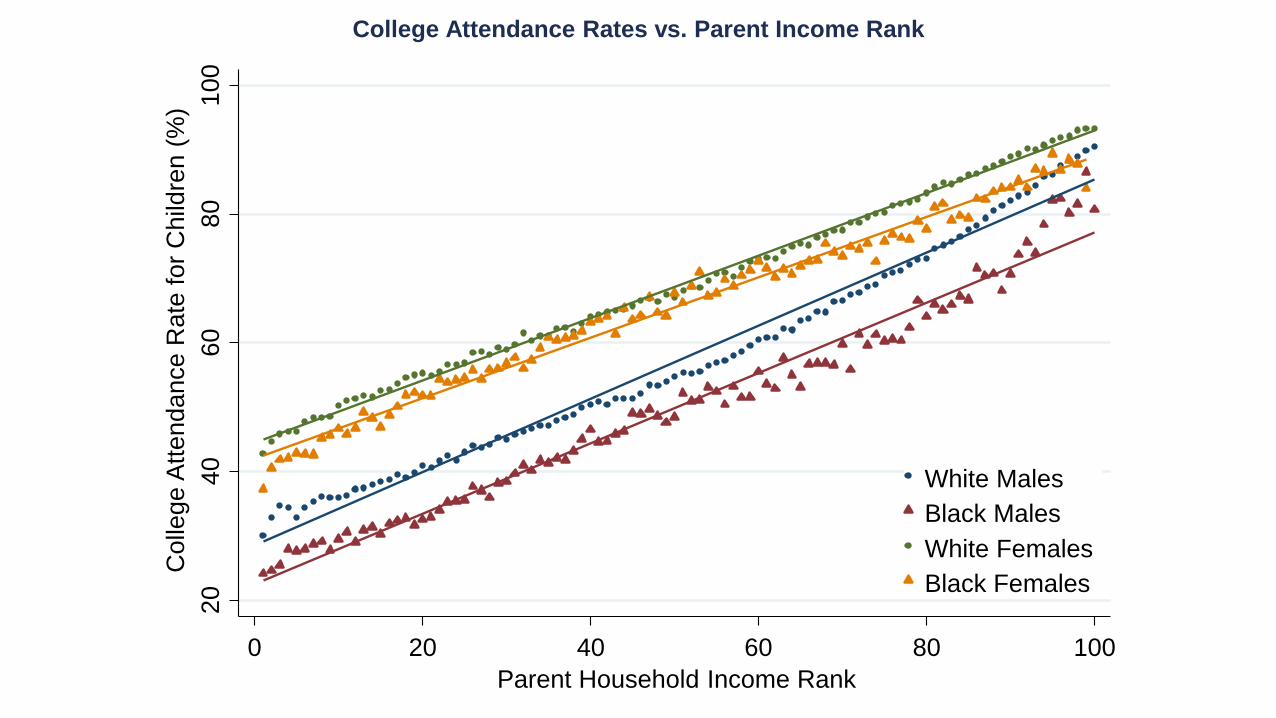
Employment Rates vs. Parent Income Rank
20
40
60
80
10
0
Co
lleg
e A
tte
nd
an
ce
Ra
te f
or
Ch
ildre
n (
%)
0 20 40 60 80 100
Parent Household Income Rank
White Males
Black Males
White Females
Black Females
College Attendance Rates vs. Parent Income Rank
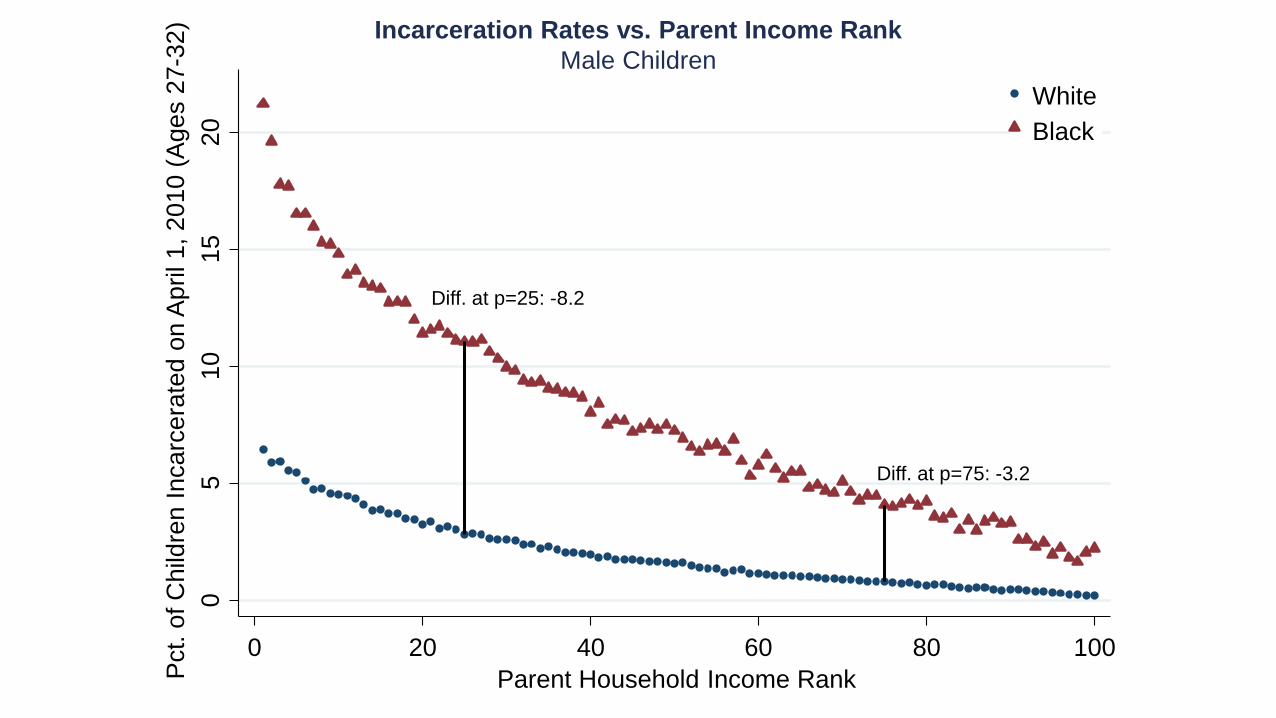
Diff. at p=25: -8.2
Diff. at p=75: -3.2
05
10
15
20
Pct.
of
Ch
ildre
n I
nca
rce
rate
d o
n A
pril 1
, 2
01
0 (
Ag
es 2
7-3
2)
0 20 40 60 80 100
Parent Household Income Rank
White
Black
Incarceration Rates vs. Parent Income Rank
Male Children
05
10
15
20
Pct.
of
Ch
ildre
n I
nca
rce
rate
d o
n A
pril 1
, 2
01
0 (
Ag
es 2
7-3
2)
0 20 40 60 80 100
Parent Household Income Rank
White
Black
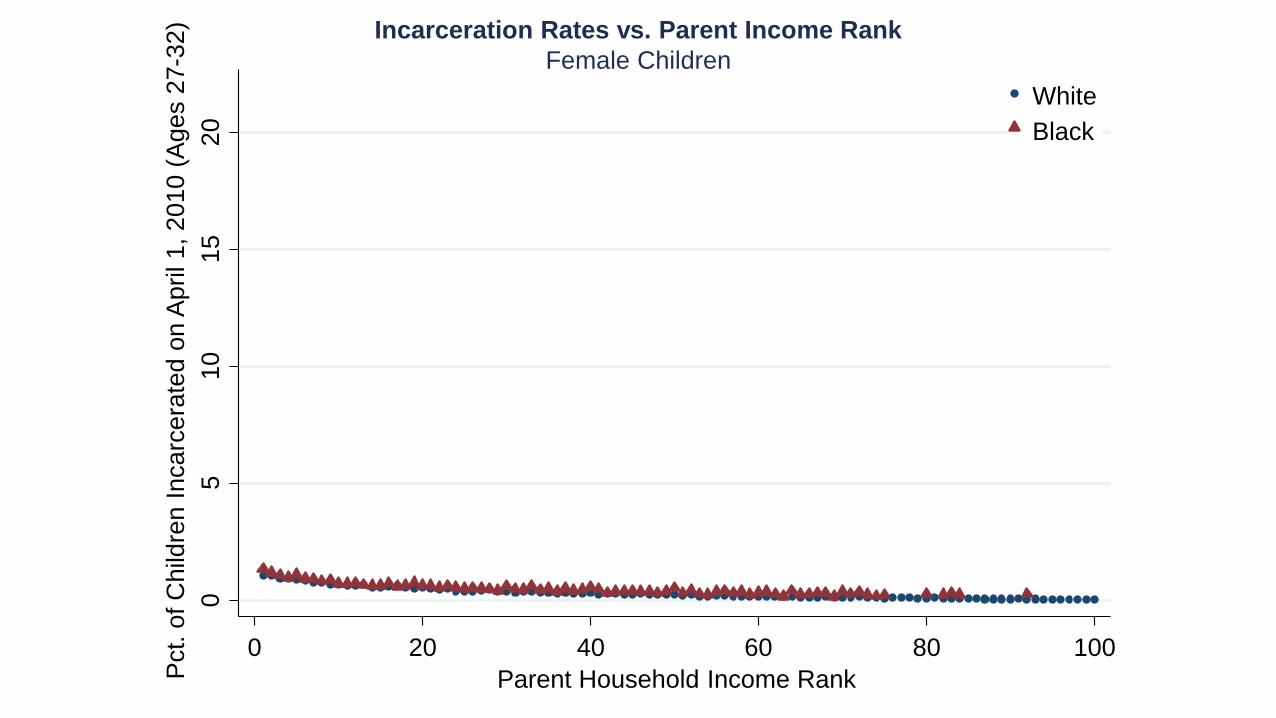
Incarceration Rates vs. Parent Income Rank
Female Children
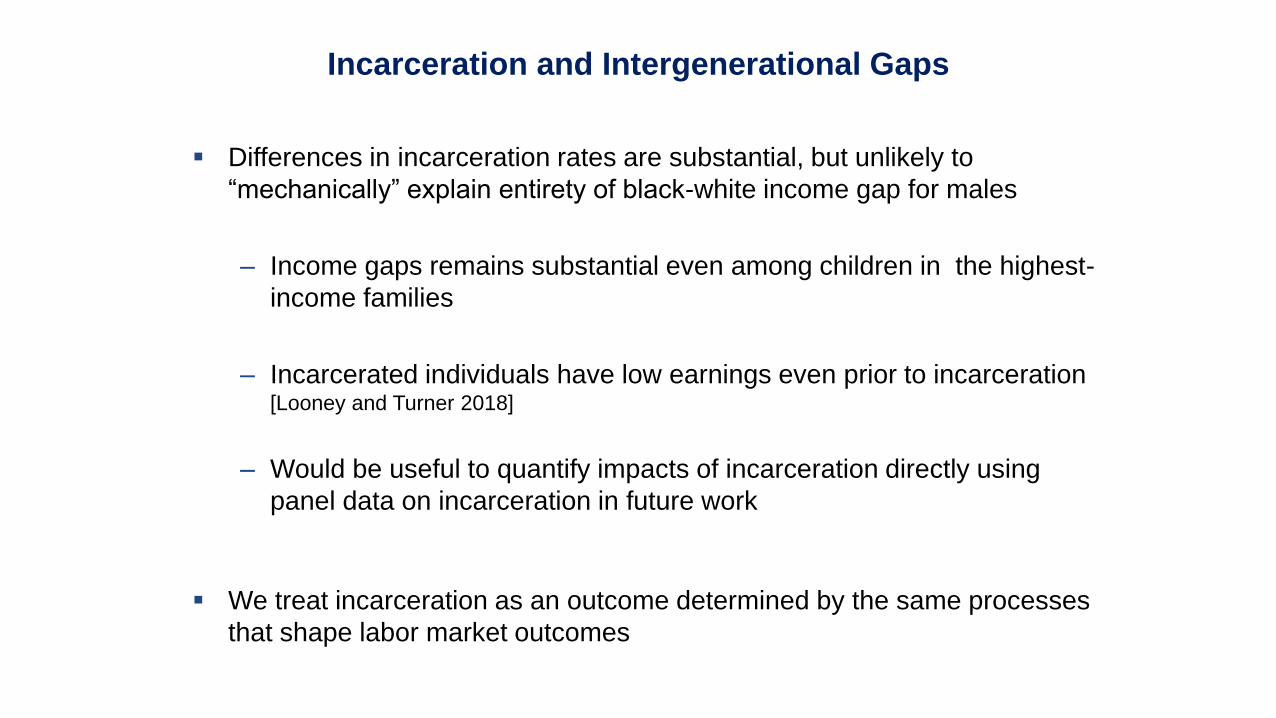
Differences in incarceration rates are substantial, but unlikely to
“mechanically” explain entirety of black-white income gap for males
– Income gaps remains substantial even among children in the highest-
income families
– Incarcerated individuals have low earnings even prior to incarceration[Looney and Turner 2018]
– Would be useful to quantify impacts of incarceration directly using
panel data on incarceration in future work
We treat incarceration as an outcome determined by the same processes
that shape labor market outcomes
Incarceration and Intergenerational Gaps
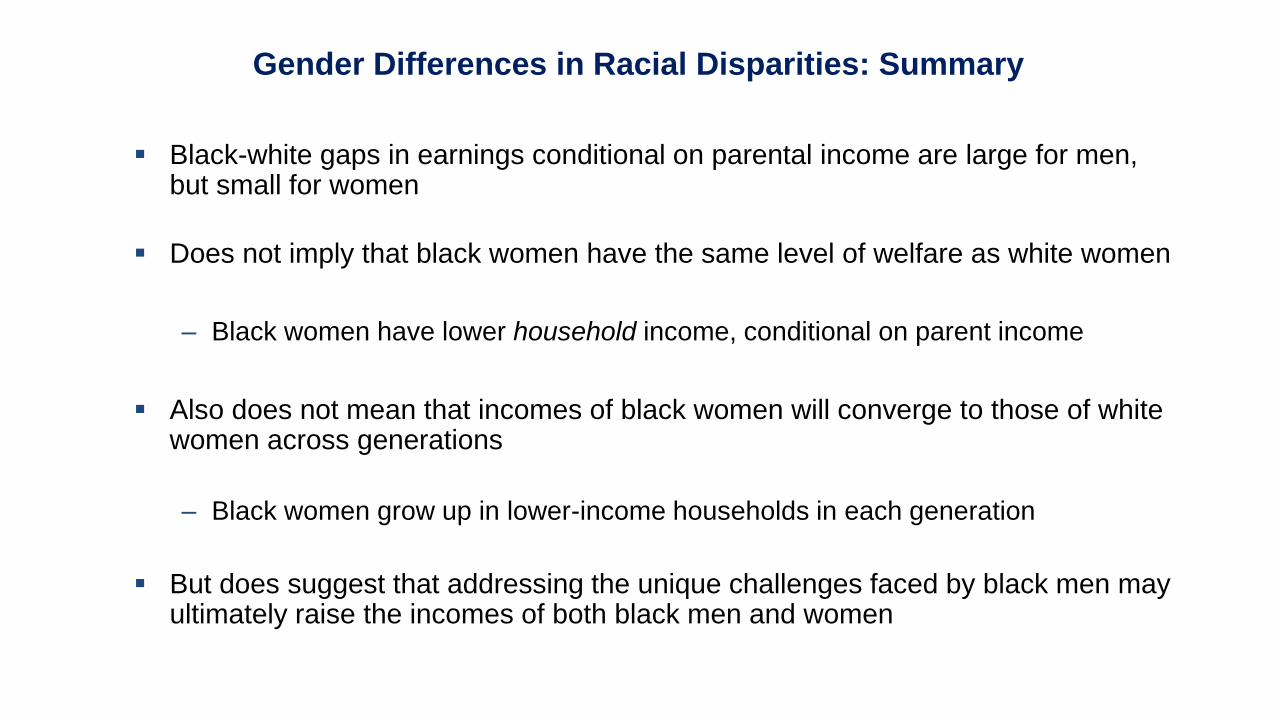
Black-white gaps in earnings conditional on parental income are large for men, but small for women
Does not imply that black women have the same level of welfare as white women
– Black women have lower household income, conditional on parent income
Also does not mean that incomes of black women will converge to those of white women across generations
– Black women grow up in lower-income households in each generation
But does suggest that addressing the unique challenges faced by black men may ultimately raise the incomes of both black men and women
Gender Differences in Racial Disparities: Summary
1
2
3 Marriage Rates and Gender Differences
5
Intergenerational Mobility by Race
Family Level Explanations4
Data and Sample Definition
Neighborhood-Level Explanations
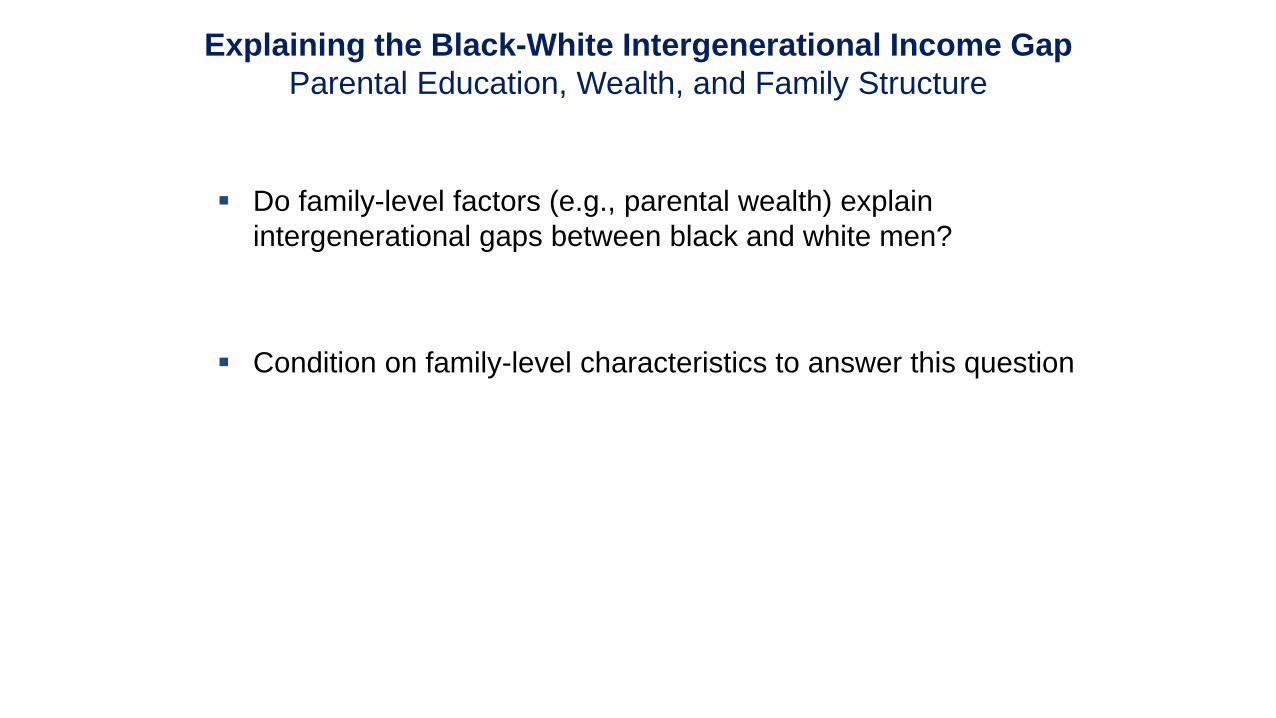
Do family-level factors (e.g., parental wealth) explain
intergenerational gaps between black and white men?
Condition on family-level characteristics to answer this question
Explaining the Black-White Intergenerational Income Gap
Parental Education, Wealth, and Family Structure
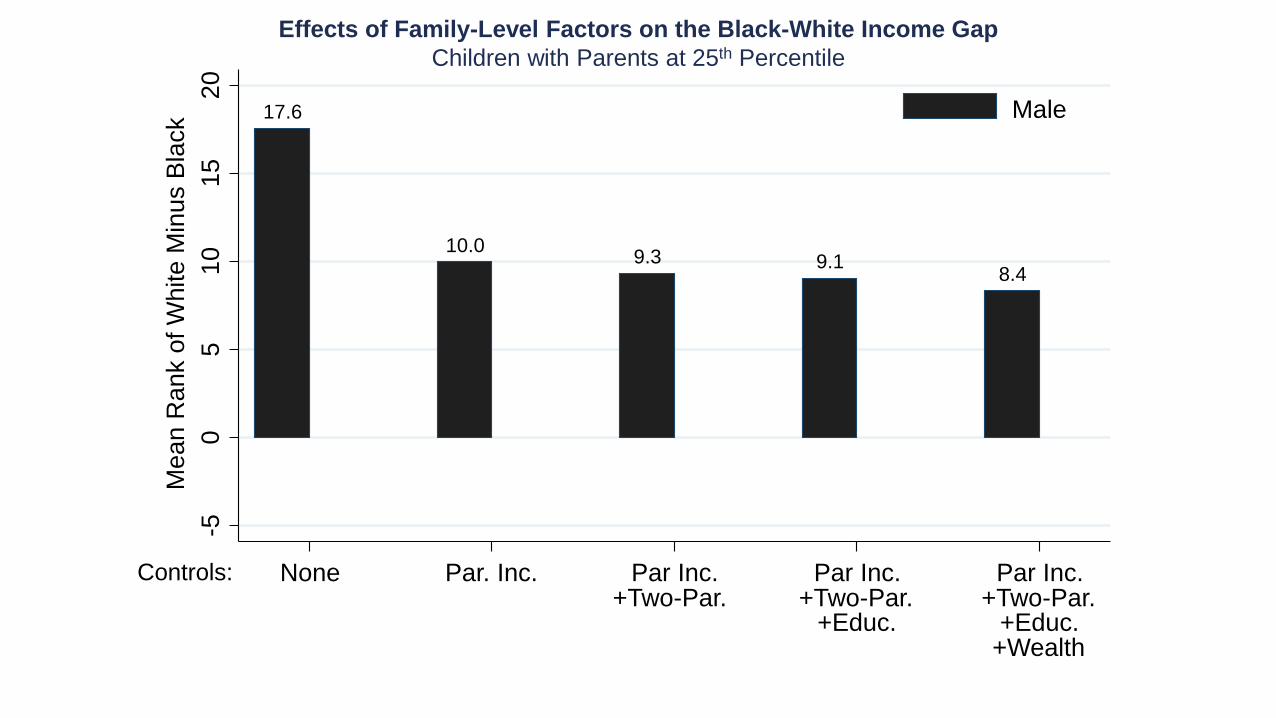
17.6
10.09.3 9.1
8.4
-50
51
01
52
0
Me
an
Ra
nk o
f W
hite
Min
us B
lack
None Par. Inc. Par Inc.+Two-Par.
Par Inc.+Two-Par.
+Educ.
Par Inc.+Two-Par.
+Educ.+Wealth
Male
Effects of Family-Level Factors on the Black-White Income Gap
Children with Parents at 25th Percentile
Controls:
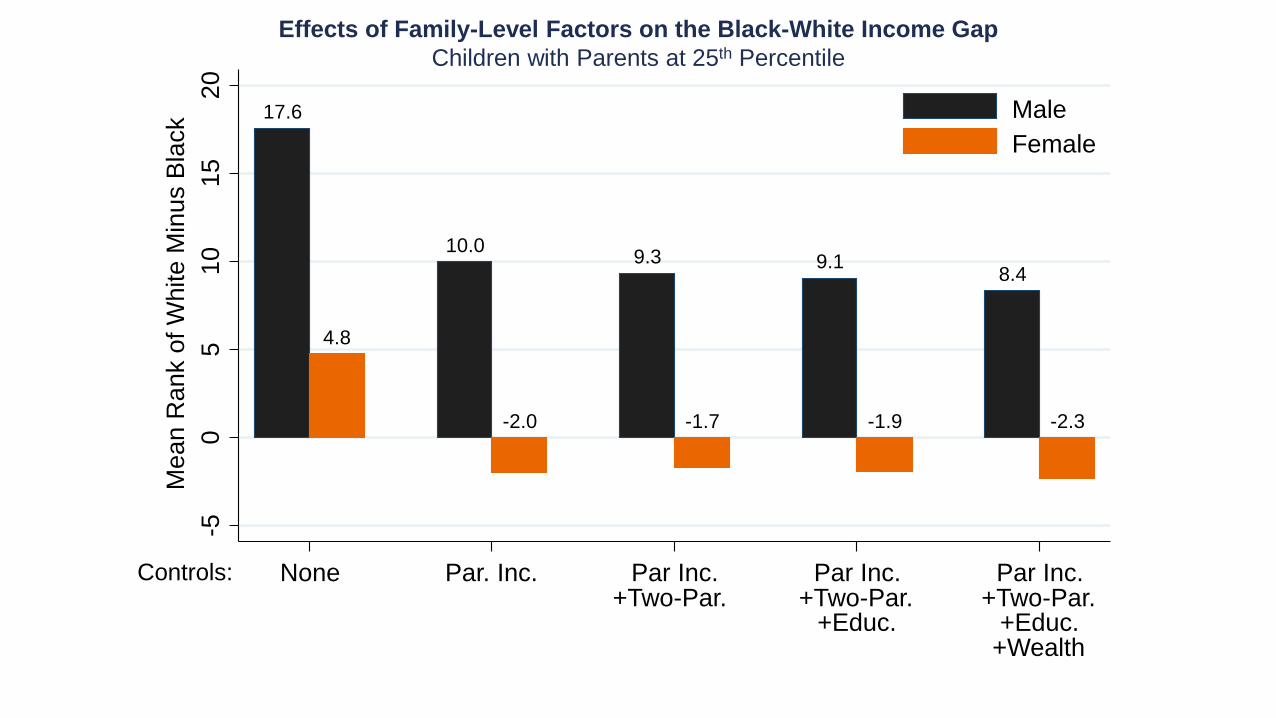
17.6
10.09.3 9.1
8.4
4.8
-1.7 -1.9-2.0 -2.3
-50
51
01
52
0
Me
an
Ra
nk o
f W
hite
Min
us B
lack
None Par. Inc. Par Inc.+Two-Par.
Par Inc.+Two-Par.
+Educ.
Par Inc.+Two-Par.
+Educ.+Wealth
Male
Female
Controls:
Effects of Family-Level Factors on the Black-White Income Gap
Children with Parents at 25th Percentile

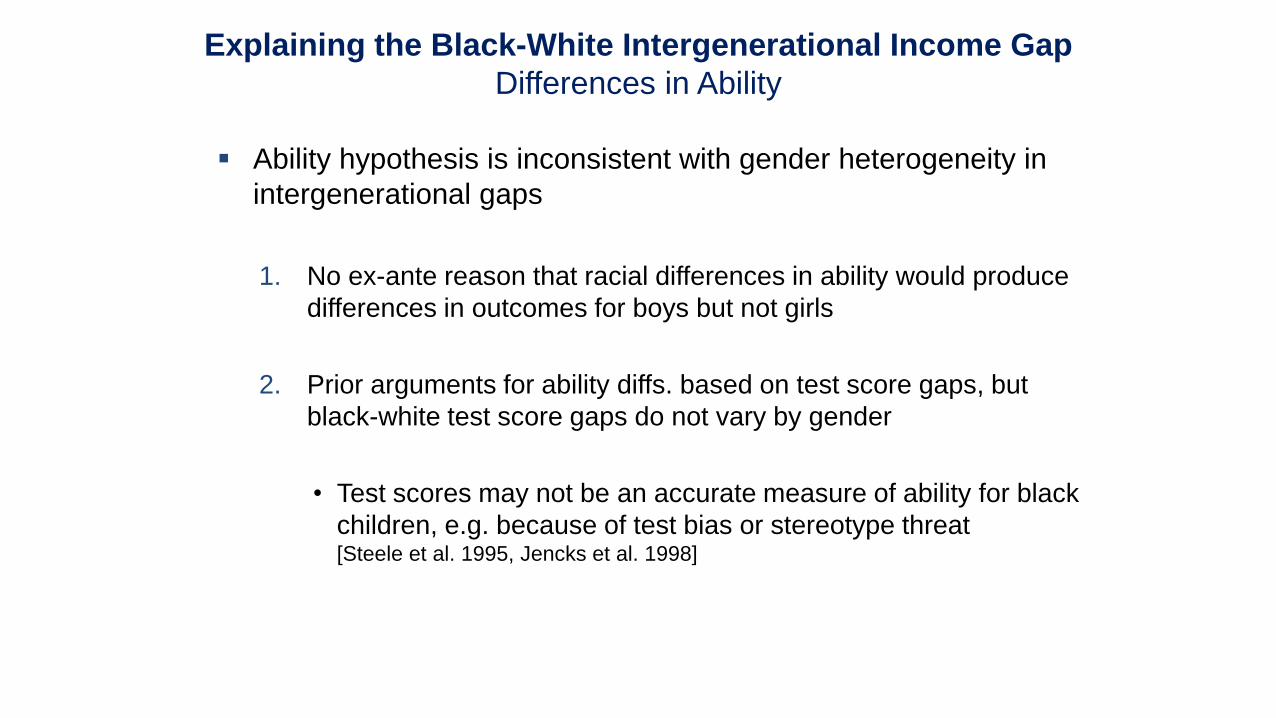
Ability hypothesis is inconsistent with gender heterogeneity in
intergenerational gaps
1. No ex-ante reason that racial differences in ability would produce
differences in outcomes for boys but not girls
2. Prior arguments for ability diffs. based on test score gaps, but
black-white test score gaps do not vary by gender
Explaining the Black-White Intergenerational Income Gap
Differences in Ability
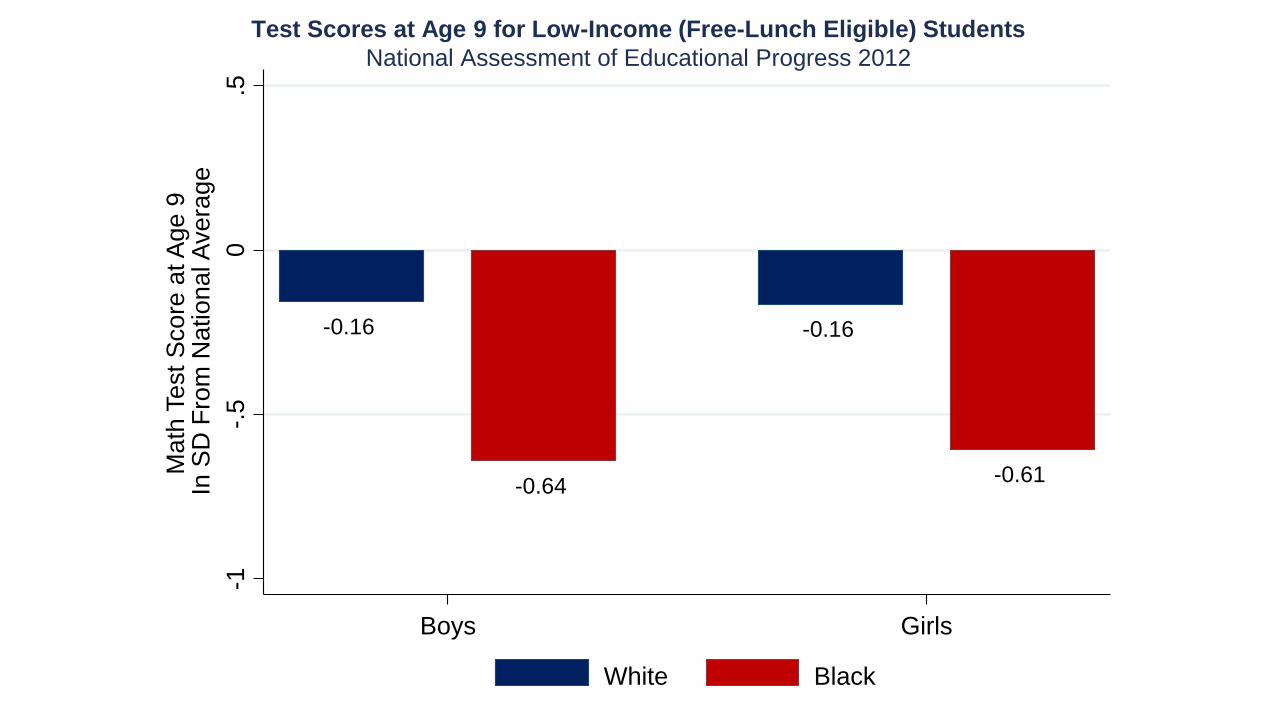
Test Scores at Age 9 for Low-Income (Free-Lunch Eligible) Students
National Assessment of Educational Progress 2012
-0.16-0.16
-0.64-0.61
-1-.
50
.5
Ma
th T
est
Sco
re a
t A
ge
9In
SD
Fro
m N
atio
na
l Ave
rag
e
Boys Girls
White Black
Ability hypothesis is inconsistent with gender heterogeneity in
intergenerational gaps
1. No ex-ante reason that racial differences in ability would produce
differences in outcomes for boys but not girls
2. Prior arguments for ability diffs. based on test score gaps, but
black-white test score gaps do not vary by gender
• Test scores may not be an accurate measure of ability for black
children, e.g. because of test bias or stereotype threat[Steele et al. 1995, Jencks et al. 1998]
Explaining the Black-White Intergenerational Income Gap
Differences in Ability
1
2
3 Marriage Rates and Gender Differences
5
Intergenerational Mobility by Race
Family Level Explanations4
Data and Sample Definitions
Neighborhood-Level Explanations
Do blacks have worse outcomes than whites because they live in different
neighborhoods?
Begin by examining broad geographic variation across commuting zones [Chetty, Hendren, Kline, and Saez 2014]
– Assign children to locations in proportion to the fraction of their childhood
that they spent in each CZ
Estimate expected rank of children with parents at the 25th percentile of
national income distribution using linear regression within each CZ
Neighborhood Environments and the Black-White Gap
20
30
40
50
60
70
Me
an C
hild
Rank in N
ation
al In
com
e D
istr
ibu
tion
0 10 20 30 40 50 60 70 80 90 100
Parent Rank in National Income Distribution
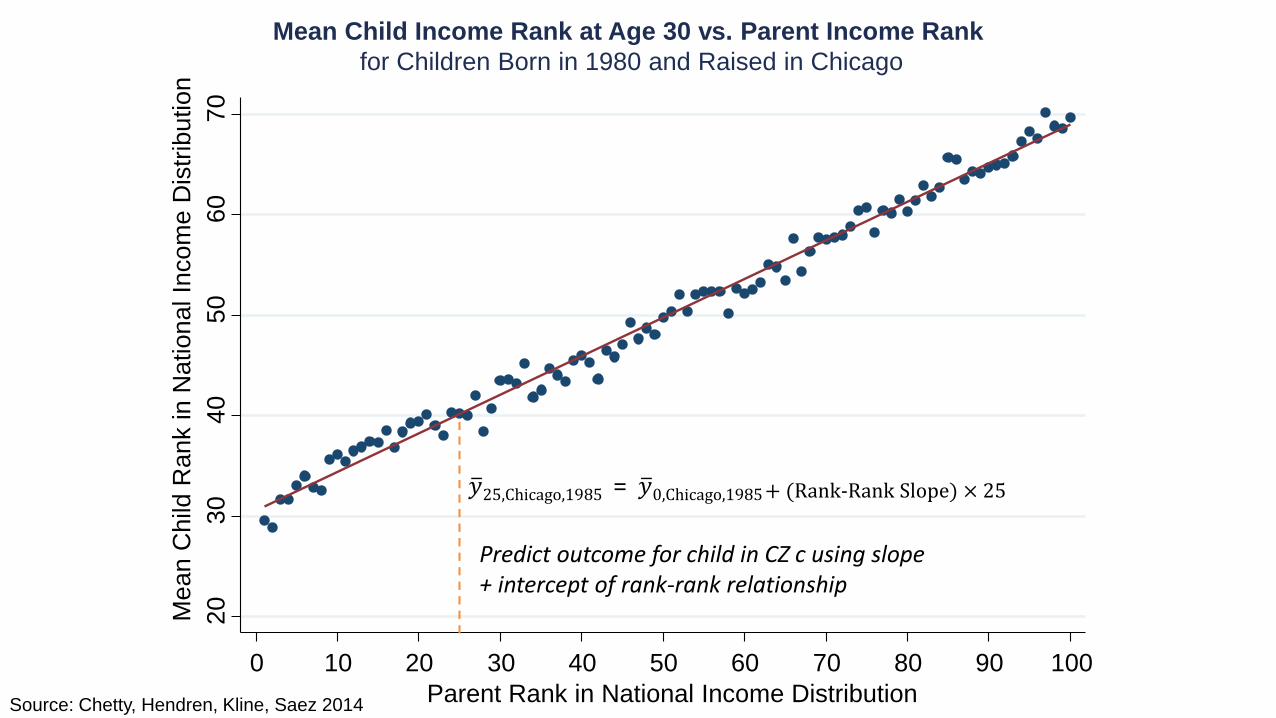
Mean Child Income Rank at Age 30 vs. Parent Income Rank
for Children Born in 1980 and Raised in Chicago
Predict outcome for child in CZ c using slope + intercept of rank-rank relationship
ത𝑦25,Chicago,1985 = ത𝑦0,Chicago,1985 + (Rank-Rank Slope) × 25
Source: Chetty, Hendren, Kline, Saez 2014
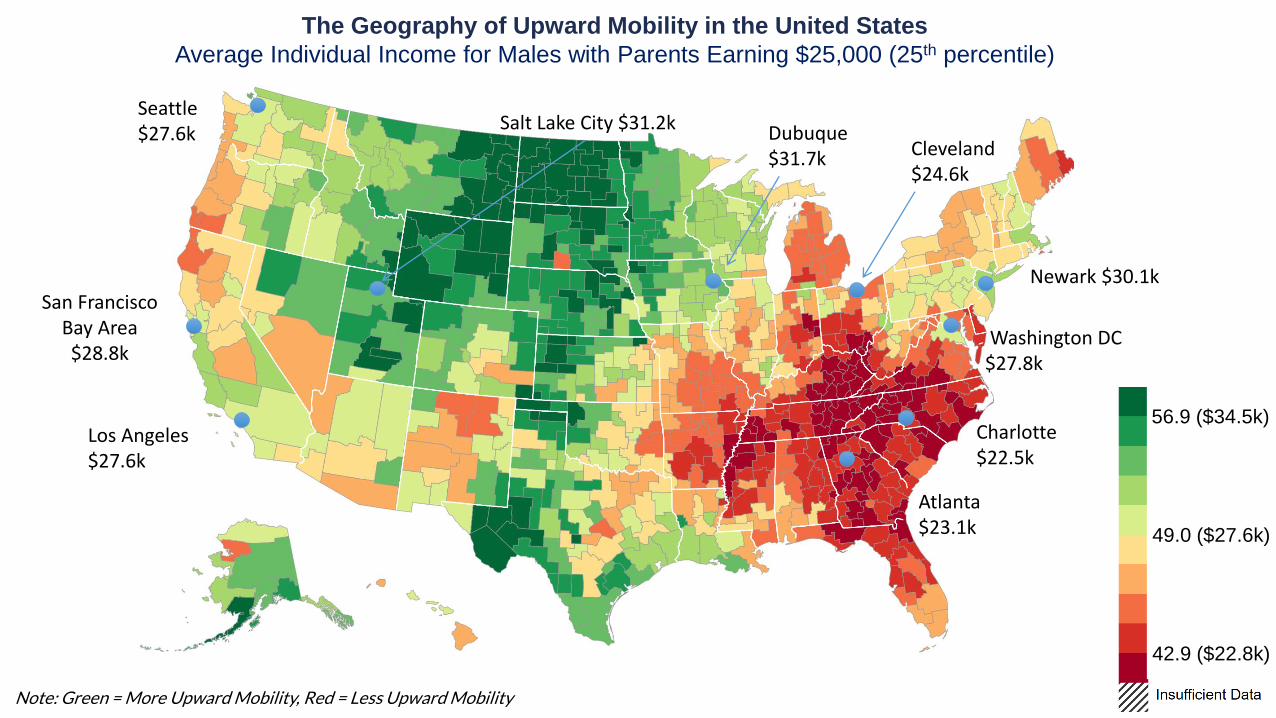
The Geography of Upward Mobility in the United States
Average Individual Income for Males with Parents Earning $25,000 (25th percentile)
Note: Green = More Upward Mobility, Red = Less Upward Mobility
56.9 ($34.5k)
49.0 ($27.6k)
42.9 ($22.8k)
Atlanta $23.1k
Washington DC $27.8k
Charlotte $22.5k
San FranciscoBay Area$28.8k
Seattle $27.6k
Salt Lake City $31.2kCleveland $24.6k
Los Angeles $27.6k
Dubuque$31.7k
Newark $30.1k

Black Men White Men
Note: Green = More Upward Mobility, Red = Less Upward Mobility; Grey = Insufficient Data
Boston
$24k
Boston
$31k
Atlanta
$18k
Atlanta
$26k
Newark
$20k
San
Francisco
$19k
San
Francisco
$31k
Two Americas: The Geography of Upward Mobility by Race
Average Individual Income for Boys with Parents Earning $25,000 (25th percentile)
45.8($25k)
<36.5($17k)
>56.9($35k)
Newark
$32k
Commuting-zone level variation illuminates broad regional patterns but
does not directly test for “neighborhood” effects
Blacks live in different neighborhoods from whites within CZs
Zoom in to examine variation across Census tracts in the rest of the
lecture
– 70,000 Census tracts with about 4,250 people per tract in the U.S.
Neighborhood Environments and the Black-White Gap
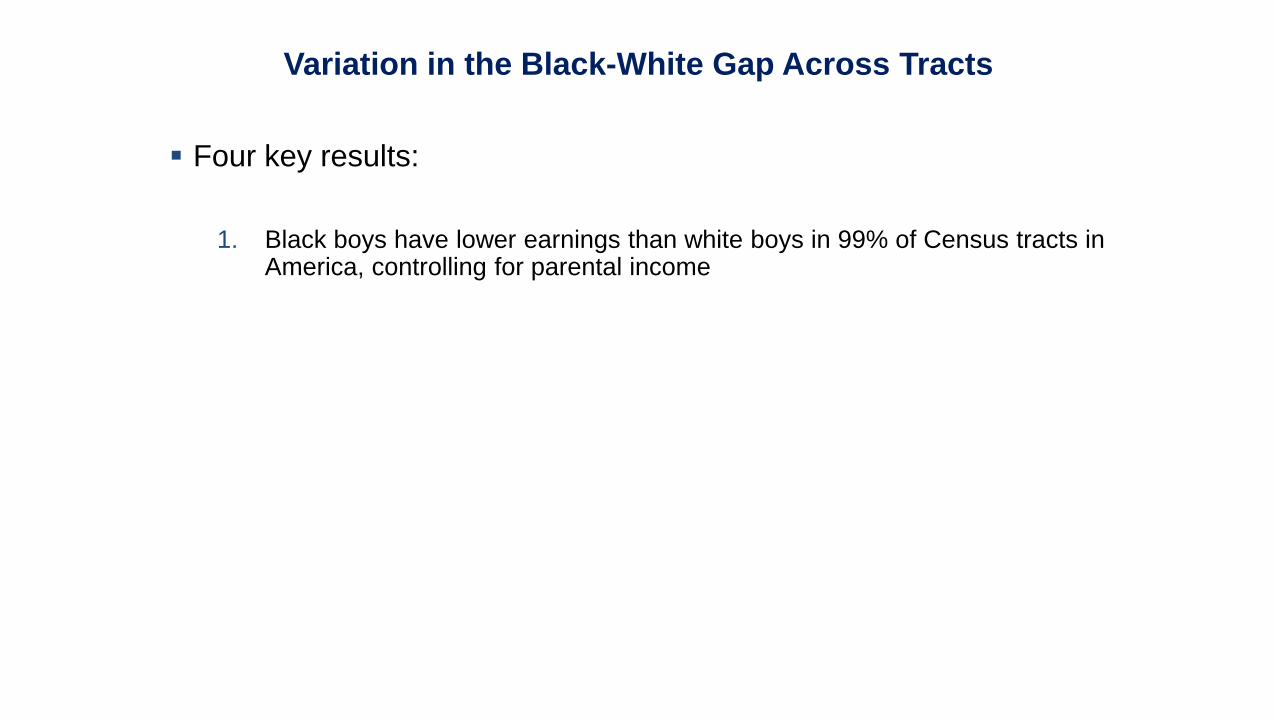
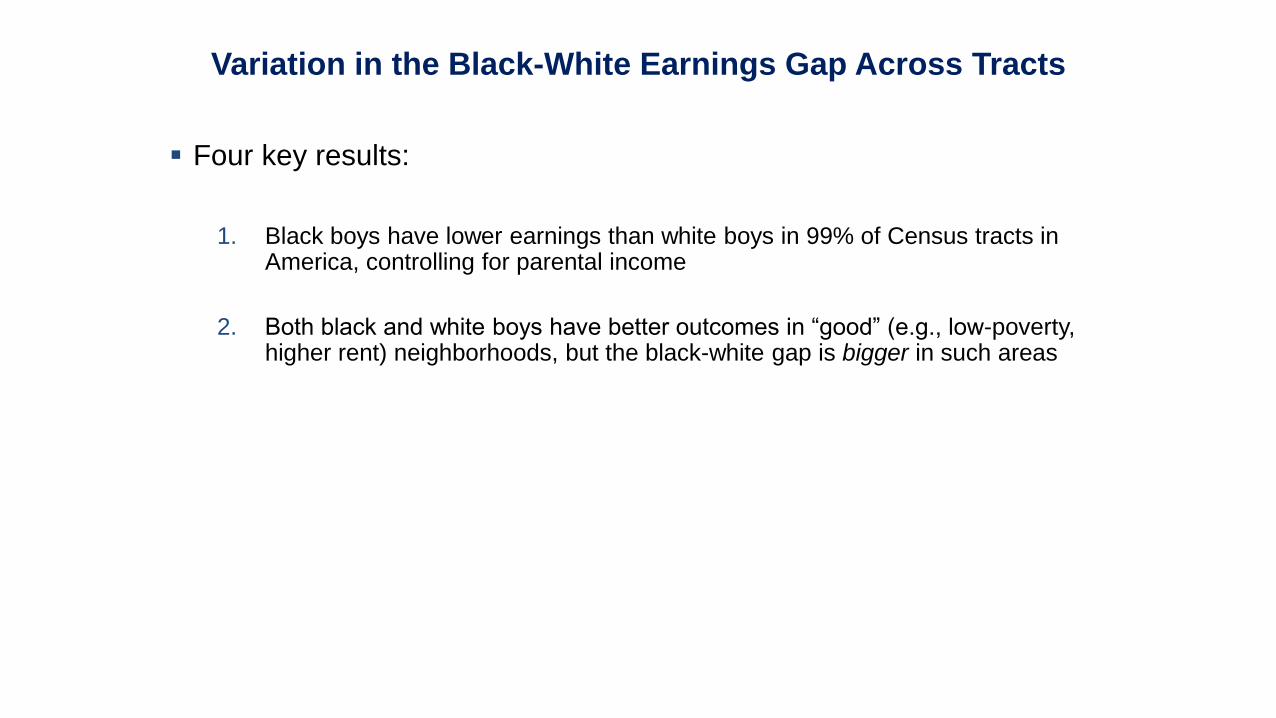
Four key results:
1. Black boys have lower earnings than white boys in 99% of Census tracts in America, controlling for parental income
Variation in the Black-White Gap Across Tracts
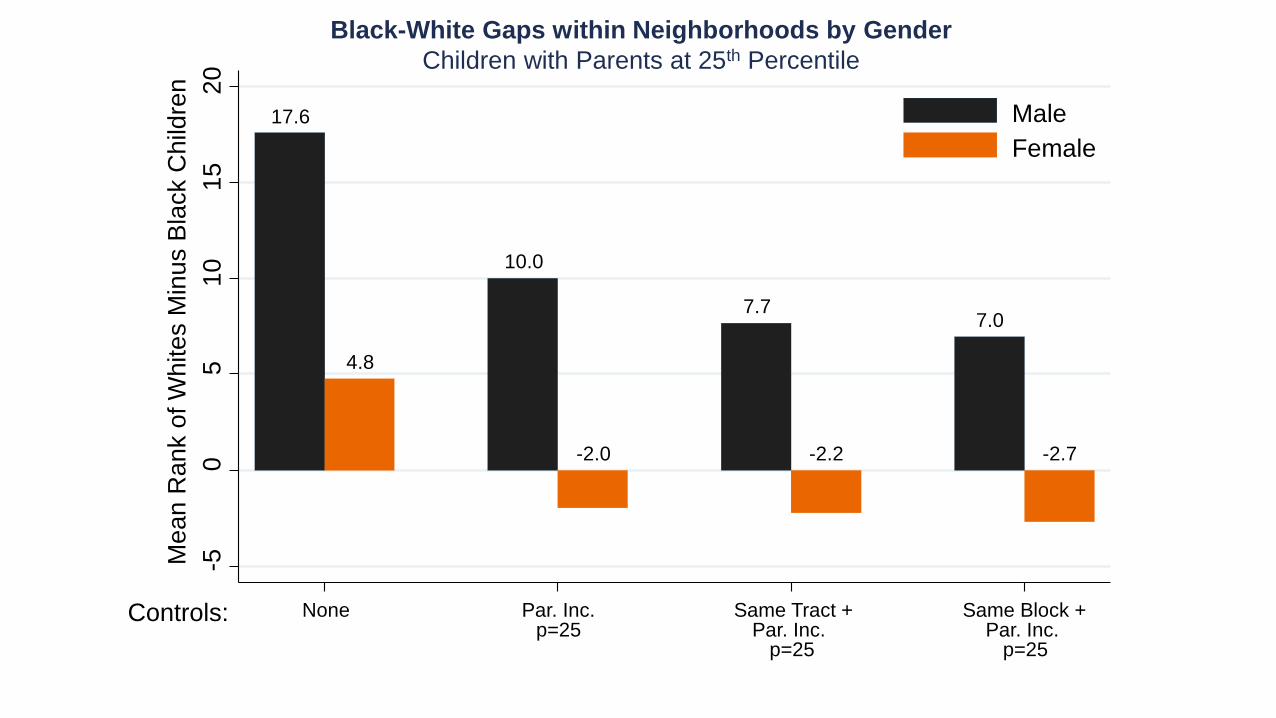
7.77.0
17.6
10.0
-2.2 -2.7
4.8
-2.0
-50
51
01
52
0
Me
an R
ank o
f W
hites M
inu
s B
lack C
hild
ren
None Par. Inc.p=25 Par. Inc.
p=25Par. Inc.
p=25
Male
Female
Controls:
Black-White Gaps within Neighborhoods by Gender
Children with Parents at 25th Percentile
Same Tract + Same Block +
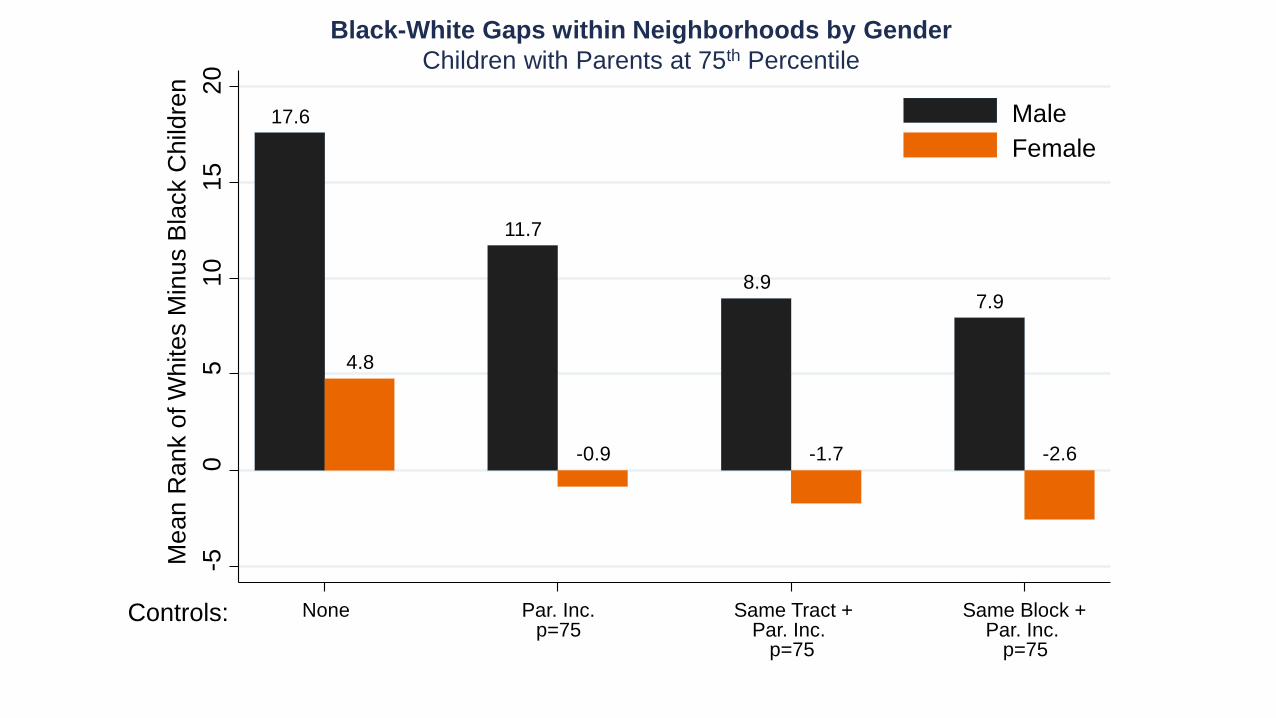
8.97.9
17.6
11.7
-1.7 -2.6
4.8
-0.9
-50
51
01
52
0
None Par. Inc.p=75
Same Tract +Par. Inc.
p=75Par. Inc.
p=75
Male
Female
Controls:
Black-White Gaps within Neighborhoods by Gender
Children with Parents at 75th Percentile
Same Block +
Me
an R
ank o
f W
hites M
inu
s B
lack C
hild
ren
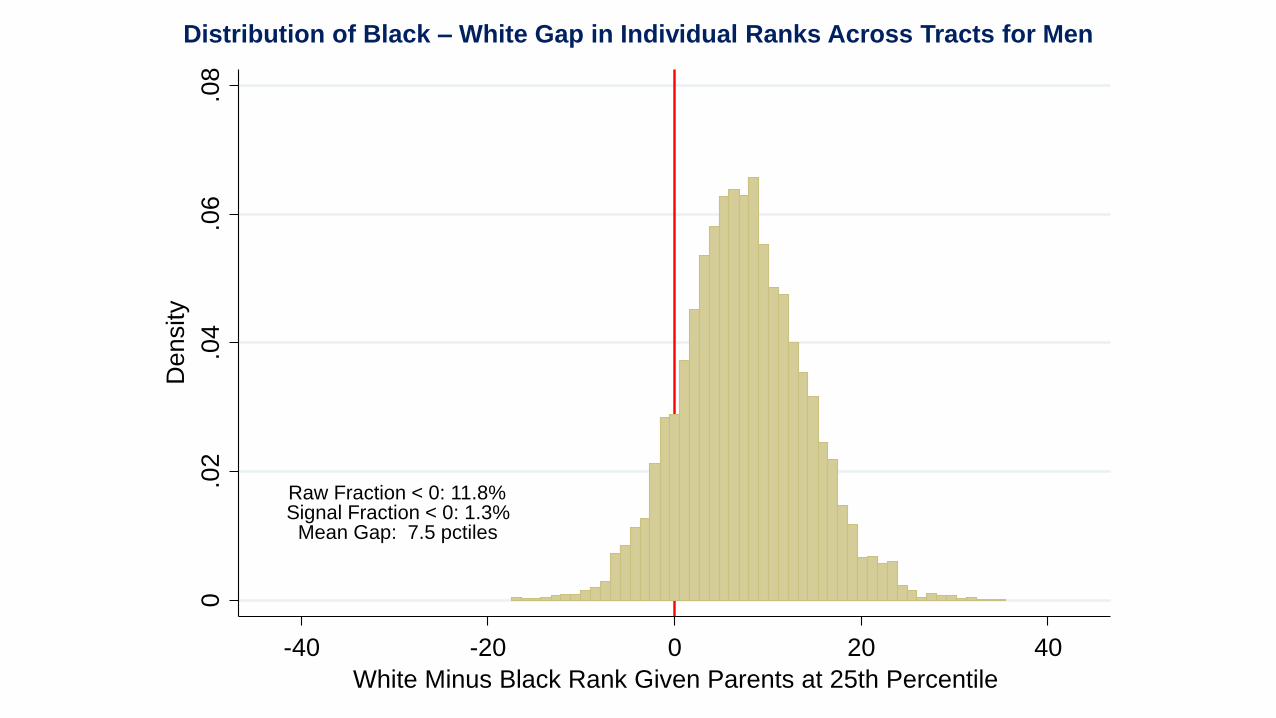
Raw Fraction < 0: 11.8%Signal Fraction < 0: 1.3%
Mean Gap: 7.5 pctiles
0.0
2.0
4.0
6.0
8
Density
-40 -20 0 20 40
White Minus Black Rank Given Parents at 25th Percentile
Distribution of Black – White Gap in Individual Ranks Across Tracts for Men
Four key results:
1. Black boys have lower earnings than white boys in 99% of Census tracts in America, controlling for parental income
2. Both black and white boys have better outcomes in “good” (e.g., low-poverty, higher rent) neighborhoods, but the black-white gap is bigger in such areas
Variation in the Black-White Earnings Gap Across Tracts

Economy
Schools
Educ.Attainment
Housing
HealthcareAccess
Correlations between Tract-Level Characteristics and Incomes of Black vs. White Men
Children with Parents at 25th Percentile
Share Above Poverty Line
Mean Household Income
Employment Rate
Mean 3rd Grade Math Score
Mean 8th Grade Math Score
Share HS Students Not Suspended
Share High School Grad.
Share College Grad.
Median Rent (2BR)
Share Homeowners
Share Married
Share Two-Parent
Share Adults Insured
0 0.2 0.4 0.6
Magnitude of Correlation
Family Structure
White Black
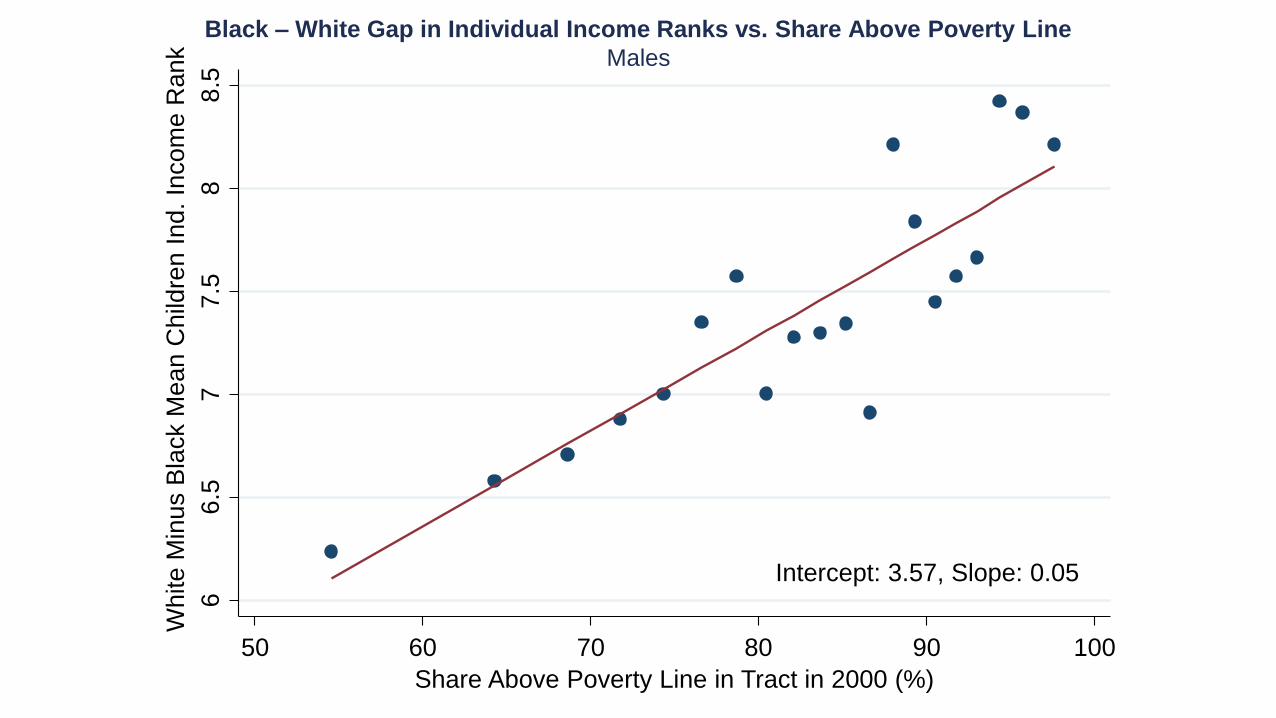
Intercept: 3.57, Slope: 0.05
66
.57
7.5
88
.5
White M
inu
s B
lack M
ean C
hild
ren I
nd.
Incom
e R
ank
50 60 70 80 90 100
Share Above Poverty Line in Tract in 2000 (%)
Black – White Gap in Individual Income Ranks vs. Share Above Poverty Line
Males
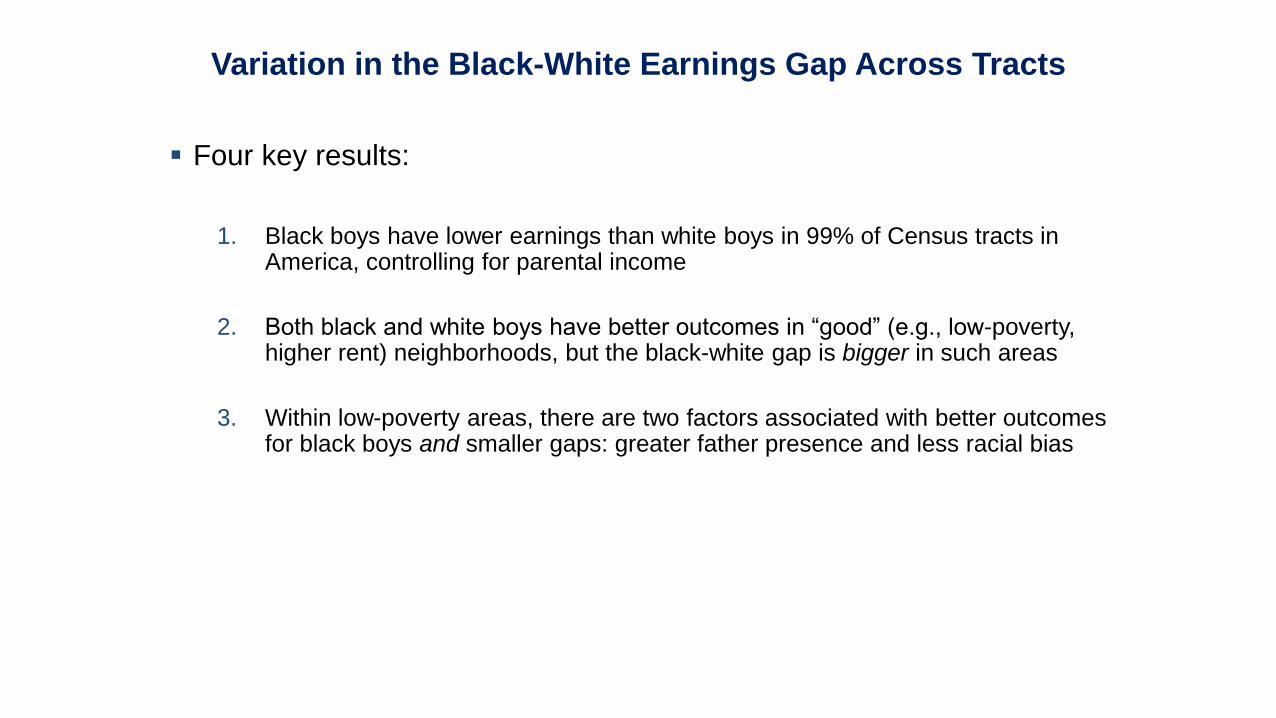
Four key results:
1. Black boys have lower earnings than white boys in 99% of Census tracts in America, controlling for parental income
2. Both black and white boys have better outcomes in “good” (e.g., low-poverty, higher rent) neighborhoods, but the black-white gap is bigger in such areas
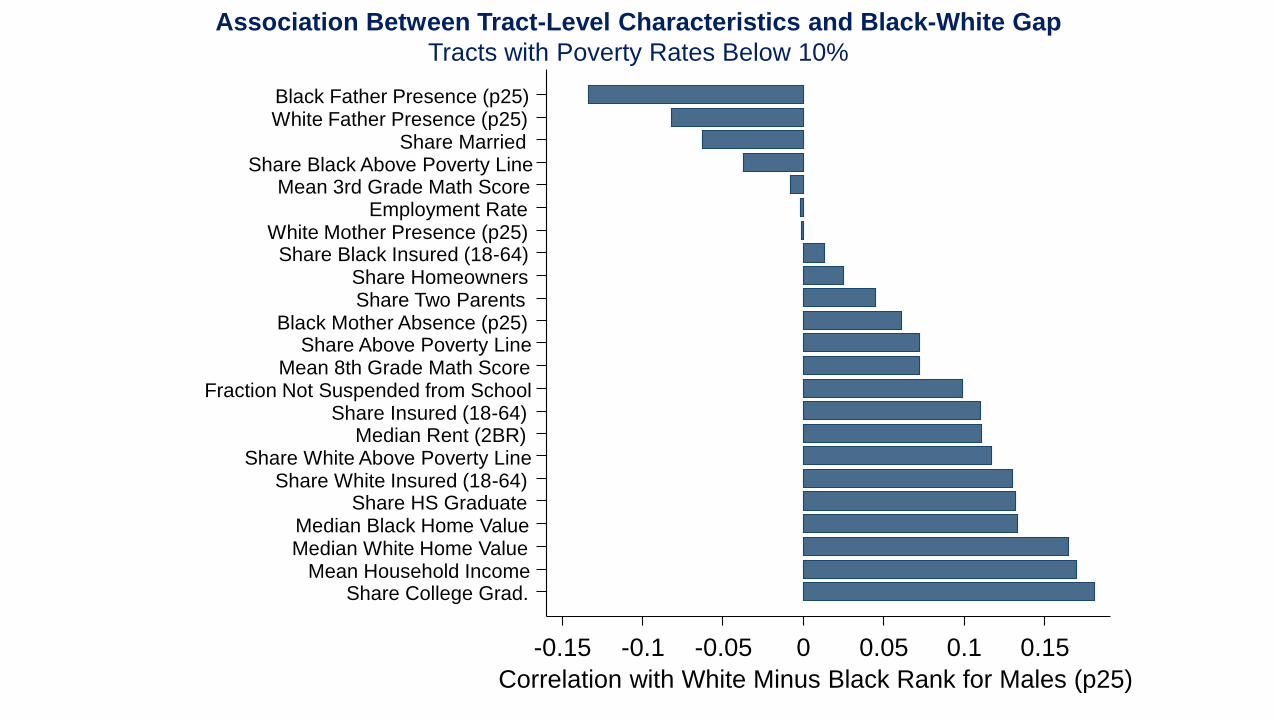
3. Within low-poverty areas, there are two factors associated with better outcomes for black boys and smaller gaps: greater father presence and less racial bias
Variation in the Black-White Earnings Gap Across Tracts
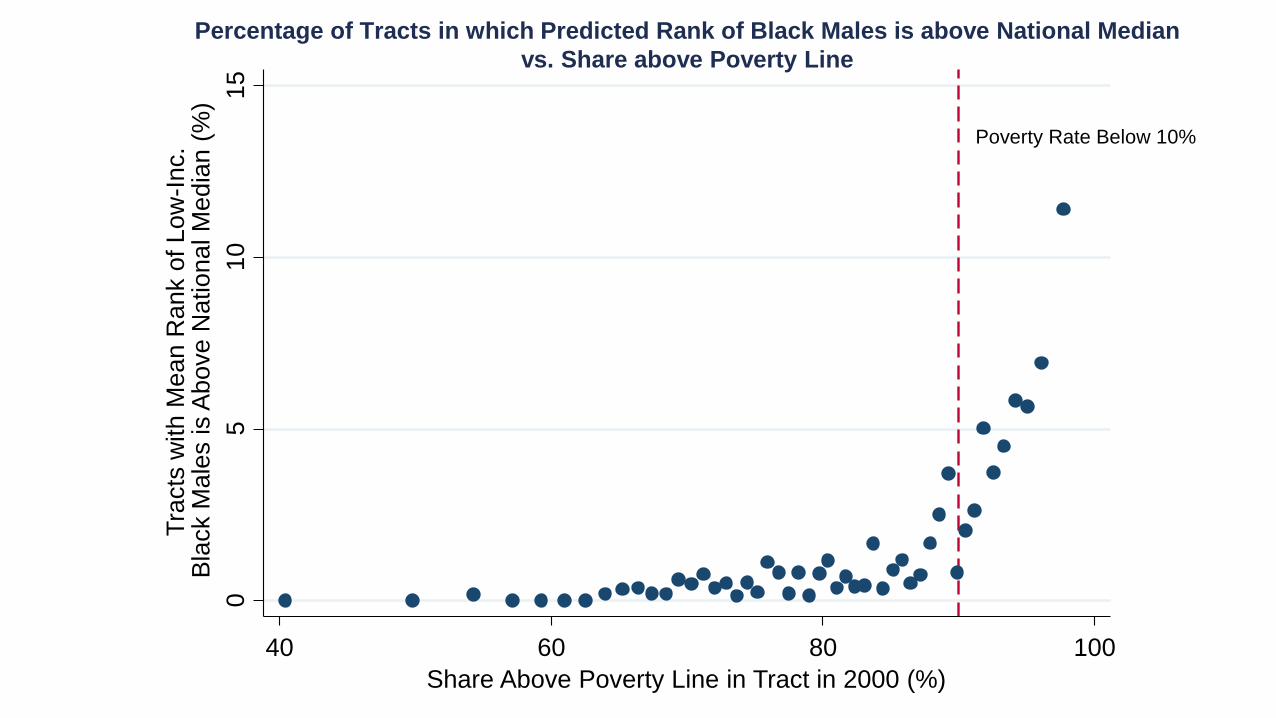
Poverty Rate Below 10%
05
10
15
Tra
cts
with M
ean R
ank o
f Lo
w-I
nc.
Bla
ck M
ale
s is A
bo
ve
Na
tio
na
l M
ed
ian
(%
)
40 60 80 100
Share Above Poverty Line in Tract in 2000 (%)
Percentage of Tracts in which Predicted Rank of Black Males is above National Median
vs. Share above Poverty Line
Share College Grad. Mean Household Income
Median White Home Value Median Black Home Value
Share HS Graduate Share White Insured (18-64)
Share White Above Poverty Line Median Rent (2BR)
Share Insured (18-64) Fraction Not Suspended from School
Mean 8th Grade Math Score Share Above Poverty Line
Black Mother Absence (p25) Share Two Parents Share Homeowners
Share Black Insured (18-64) White Mother Presence (p25)
Employment Rate Mean 3rd Grade Math Score
Share Black Above Poverty Line Share Married
White Father Presence (p25) Black Father Presence (p25)
-0.15 -0.1 -0.05 0 0.05 0.1 0.15
Correlation with White Minus Black Rank for Males (p25)
Association Between Tract-Level Characteristics and Black-White Gap
Tracts with Poverty Rates Below 10%
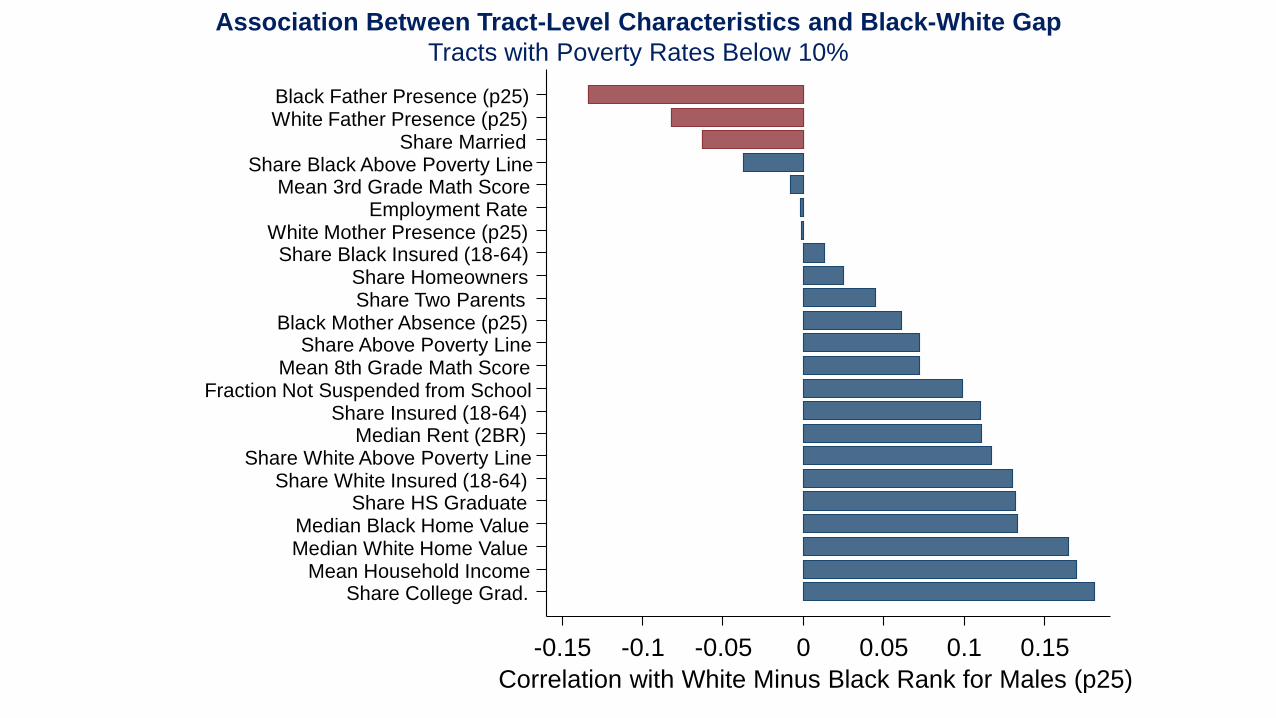
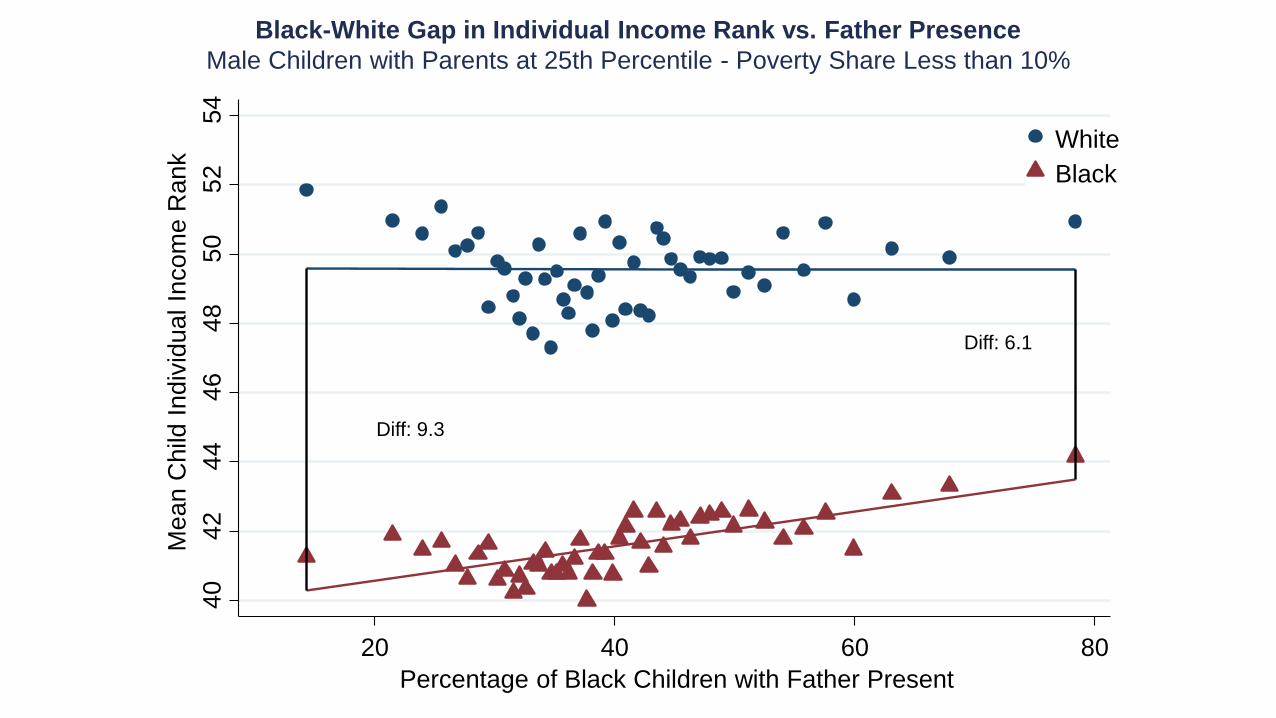
Diff: 9.3
Diff: 6.1
40
42
44
46
48
50
52
54
Me
an C
hild
Indiv
idu
al In
com
e R
ank
20 40 60 80
Percentage of Black Children with Father Present
White
Black
Black-White Gap in Individual Income Rank vs. Father Presence
Male Children with Parents at 25th Percentile - Poverty Share Less than 10%
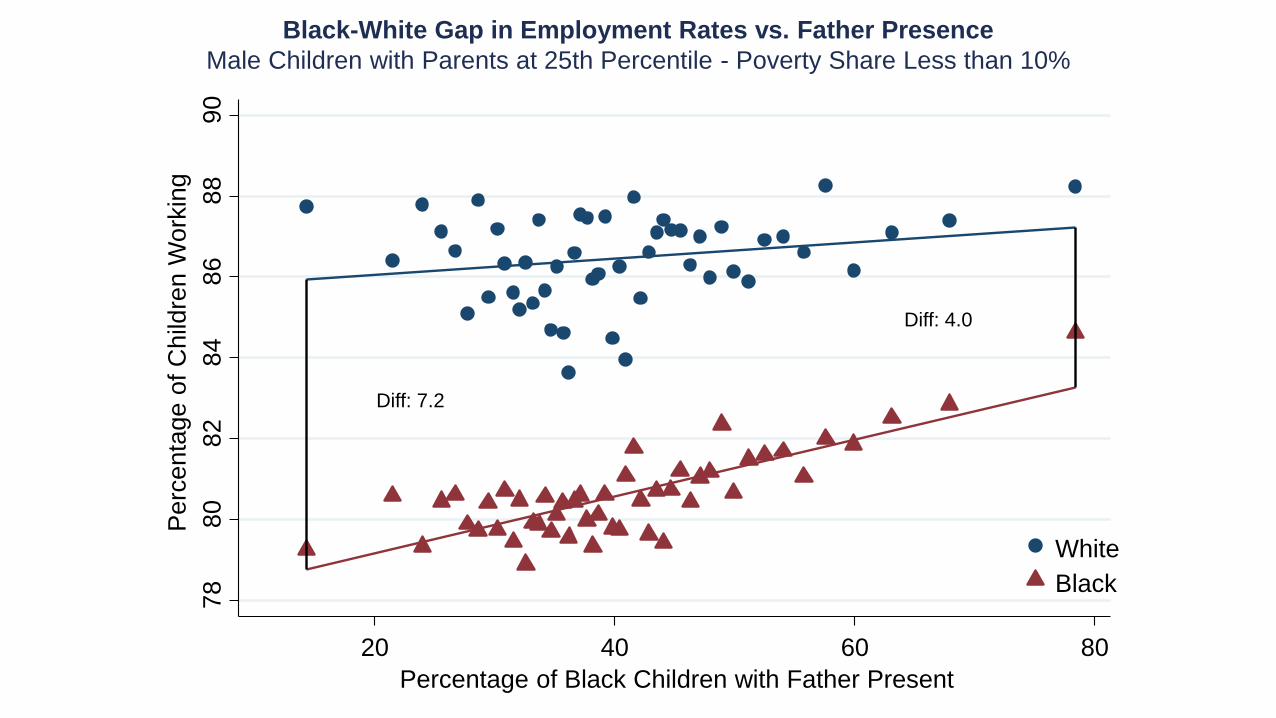
Diff: 7.2
Diff: 4.0
78
80
82
84
86
88
90
Perc
enta
ge o
f C
hild
ren W
ork
ing
20 40 60 80
Percentage of Black Children with Father Present
White
Black
Black-White Gap in Employment Rates vs. Father Presence
Male Children with Parents at 25th Percentile - Poverty Share Less than 10%

Diff: 13.0
Diff: 7.7
75
80
85
90
95
Perc
enta
ge o
f C
hild
ren W
ork
ing
20 40 60 80
Percentage of Black Children with Father Present
Black Male
Black Female
Male-Female Gap in Employment Rates vs. Father Presence
Black Children with Parents at 25th Percentile - Poverty Share Less than 10%
BaselineBlack and White
Father Presence
Children with
Two Parents Gender Ratio
(1) (2) (3) (4)
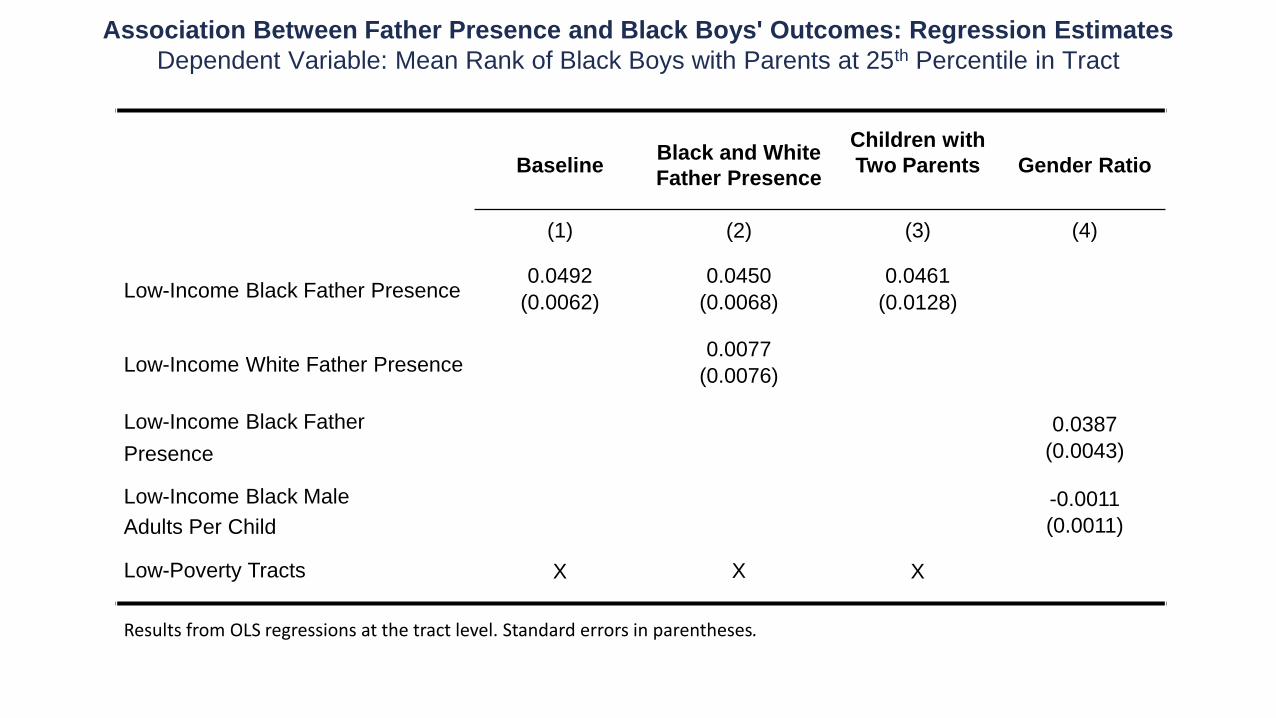
Low-Income Black Father Presence0.0492 0.0450 0.0461
(0.0062) (0.0068) (0.0128)
Low-Income White Father Presence 0.0077
(0.0076)
Low-Income Black Father 0.0387
Presence (0.0043)
Low-Income Black Male -0.0011
Adults Per Child (0.0011)
Low-Poverty Tracts X X X
Results from OLS regressions at the tract level. Standard errors in parentheses.
Association Between Father Presence and Black Boys' Outcomes: Regression Estimates
Dependent Variable: Mean Rank of Black Boys with Parents at 25th Percentile in Tract
Greater presence of white fathers in tract is predictive of white boys’
outcomes
– Phenomenon is not unique to black boys; but rates of father presence
are much lower for black boys
Black father presence in childhood neighborhood is predictive even
conditional on tract in which child lives as an adult
– Not a mechanical consequence of black boys and their fathers being
subject to the same set of environmental factors (e.g., policing)
Father Presence: Additional Results
Now turn to another set of factors that are associated with both better
outcomes for black boys and smaller black-white gaps: racial bias
Racial bias measures unavailable at the Census tract level
Instead focus on two measures available at county and media market level:
1. Implicit racial bias: index based on participants’ ability to match positive
and negative words with black vs. white faces [Greenwald et al. 1998]
2. Explicit racial animus: index based on frequency of Google searches for
racial epithets [Stephens-Davidowitz 2014]
Racial Bias and Black Children’s Outcomes

Dependent Variable:
Males
Baseline
White vs.
Black IAT
State Fixed
EffectsFemales Males Females
(1) (2) (3) (4) (5) (6)
Difference in IAT -0.0081 -0.0060 -0.0082
(0.0024) (0.0019) (0.0029)
IAT for Whites -0.0080
(0.0023)
IAT for Blacks 0.0047
(0.0023)
Racial Animus -0.0263 -0.0191
(0.0056) (0.0080)
State FE’s X
Number of Cells 340 340 340 325 28 27
Number of Observations 492,200 492,200 492,200 491,700 386,600 386,600
Columns (1)-(4) are at the county level. Columns (5)-(6) are at the media market level. We restrict to counties (media markets) with poverty rates less than 10%.
Association Between Racial Bias and Black Boys' Outcomes: Regression Estimates
Dependent Variable: Mean Rank of Black Children with Parents at 25th Percentile in Tract
Four key results:
1. Black boys have lower earnings than white boys in 99% of Census tracts in America, controlling for parental income
2. Both black and white boys have better outcomes in “good” (e.g., low-poverty, higher rent) neighborhoods, but the black-white gap is bigger in such areas
3. Within low-poverty areas, there are two factors associated with better outcomes for black boys and smaller gaps: greater father presence and less racial bias
4. Neighborhoods have causal childhood exposure effects: black boys who move to good areas at a younger age do better
Variation in the Black-White Earnings Gap Across Tracts
Identifying the Causal Effects of Neighborhoods
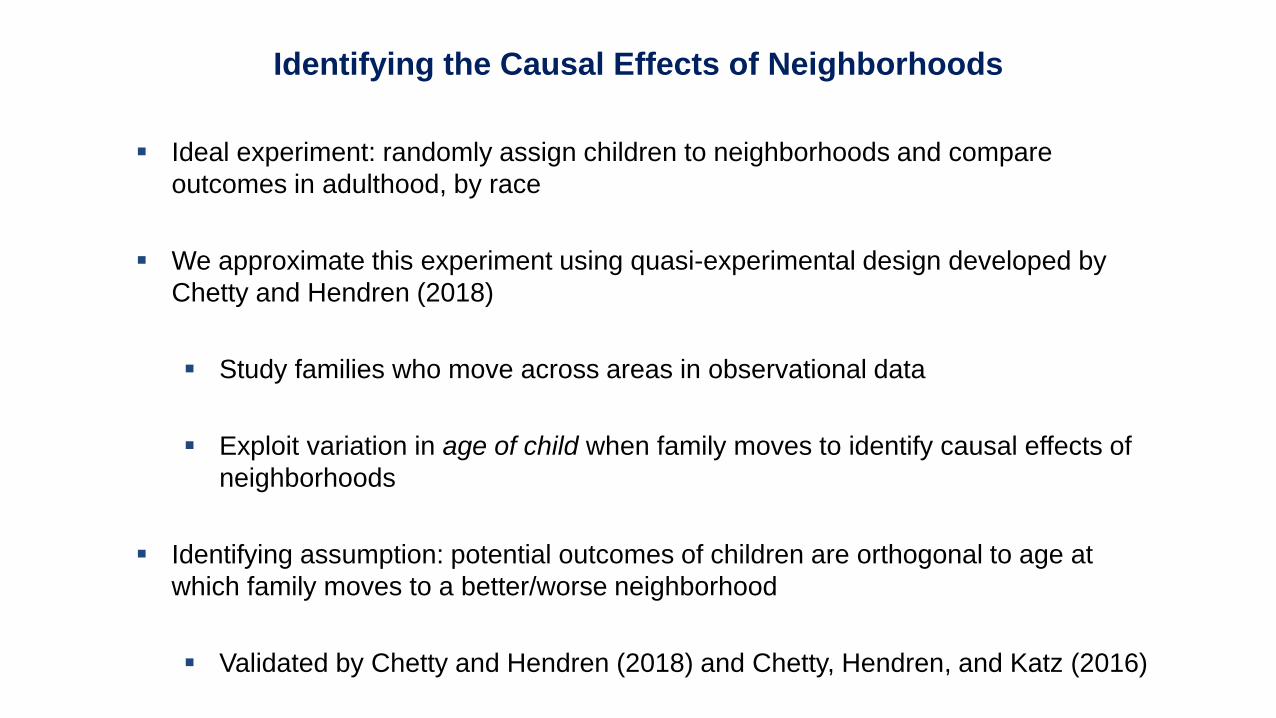
Ideal experiment: randomly assign children to neighborhoods and compare
outcomes in adulthood, by race
We approximate this experiment using quasi-experimental design developed by
Chetty and Hendren (2018)
Study families who move across areas in observational data
Exploit variation in age of child when family moves to identify causal effects of
neighborhoods
Identifying assumption: potential outcomes of children are orthogonal to age at
which family moves to a better/worse neighborhood
Validated by Chetty and Hendren (2018) and Chetty, Hendren, and Katz (2016)
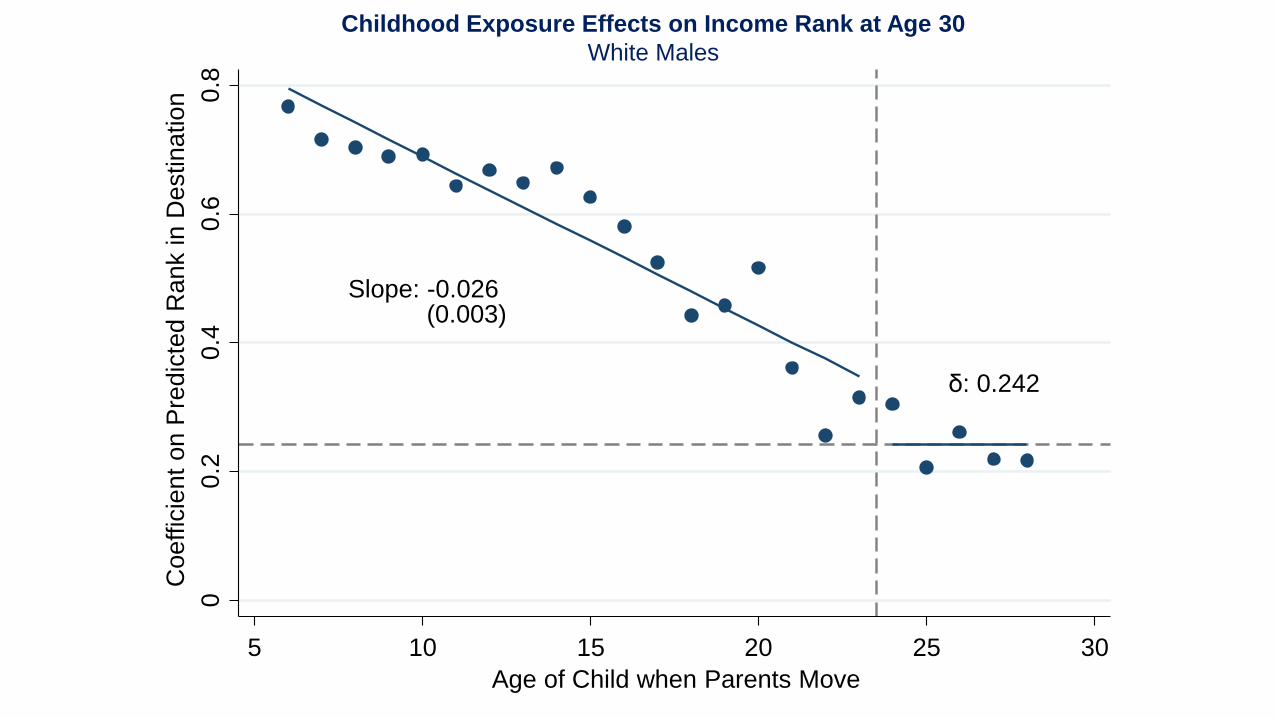
Childhood Exposure Effects on Income Rank at Age 30
White Males
Slope: -0.026(0.003)
δ: 0.242
00
.20
.40
.60
.8
Coeffic
ient
on P
redic
ted
Rank in D
estinatio
n
5 10 15 20 25 30
Age of Child when Parents Move

Childhood Exposure Effects on Income Rank at Age 30
Black Males
Slope: -0.027(0.004)
δ: 0.119
00
.20
.40
.60
.8
Coeffic
ient
on P
redic
ted
Rank in D
estinatio
n
5 10 15 20 25 30
Age of Child when Parents Move
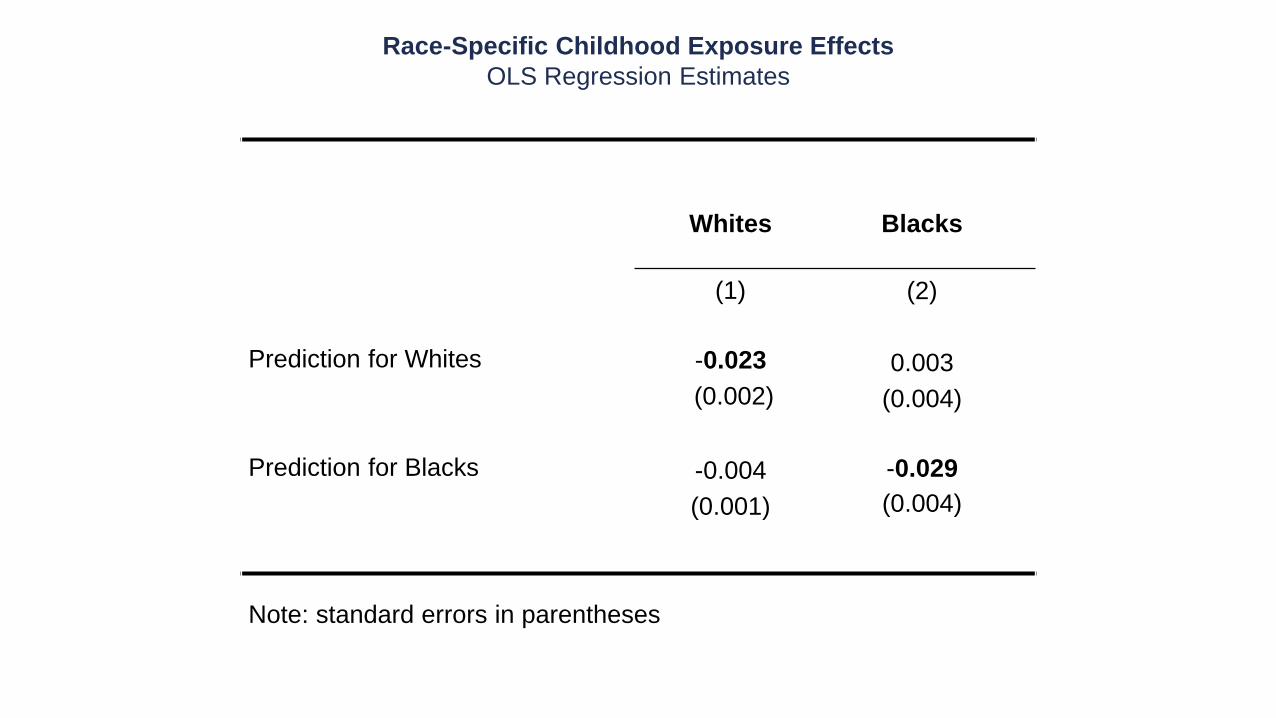
Race-Specific Childhood Exposure Effects
OLS Regression Estimates
Whites Blacks
(1) (2)
Prediction for Whites -0.023 0.003
(0.002) (0.004)
Prediction for Blacks -0.004 -0.029
(0.001) (0.004)
Note: standard errors in parentheses
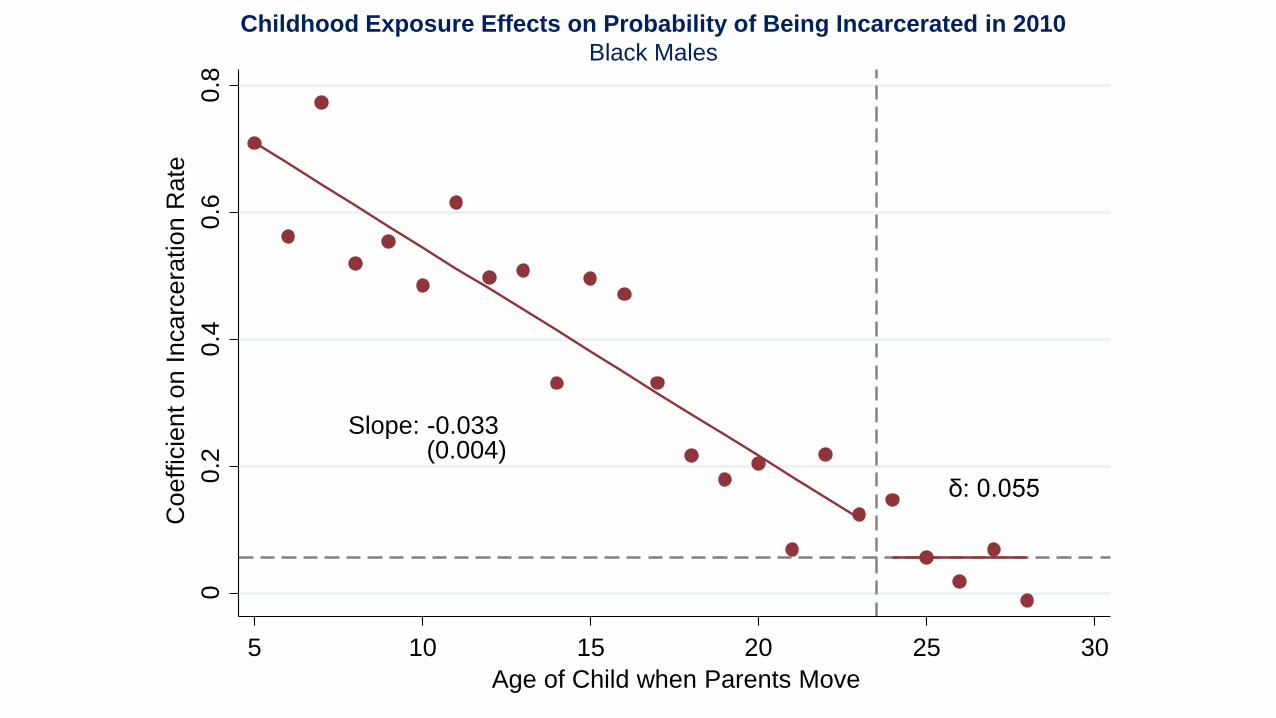
Childhood Exposure Effects on Probability of Being Incarcerated in 2010
Black Males
Slope: -0.033(0.004)
δ: 0.055
00
.20
.40
.60
.8
Coeffic
ient
on I
ncarc
era
tion R
ate
5 10 15 20 25 30
Age of Child when Parents Move
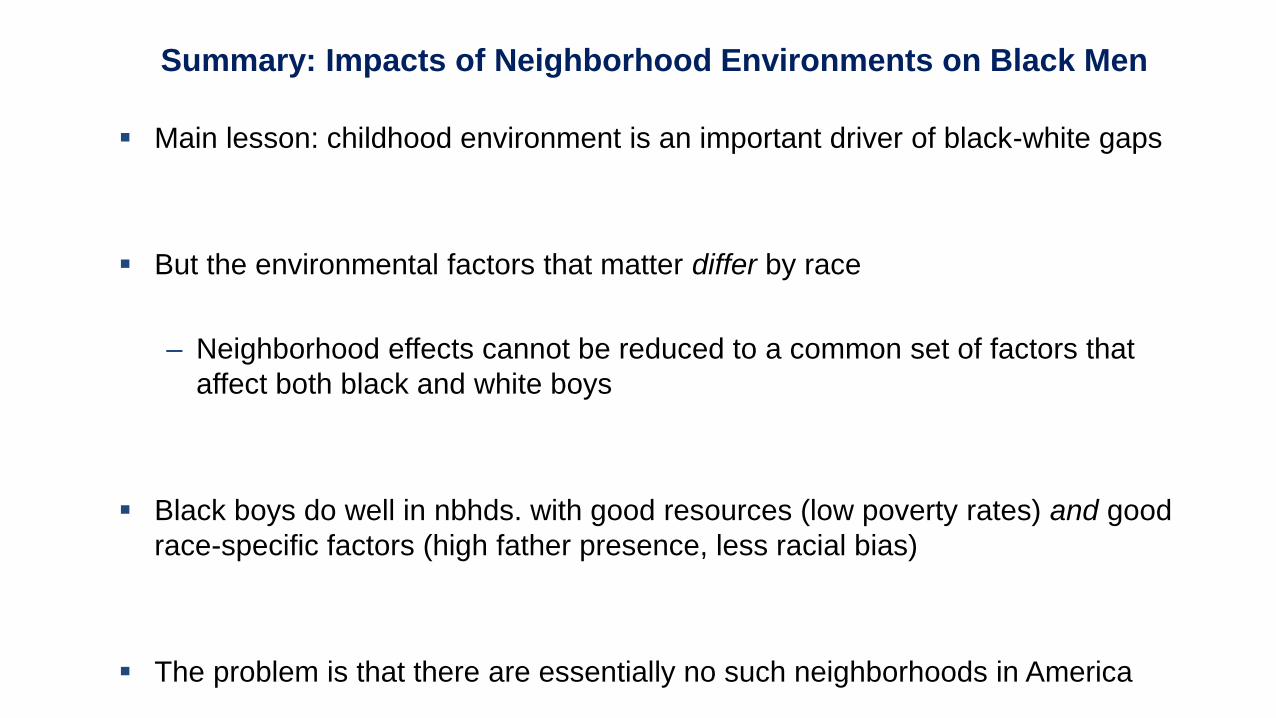
Main lesson: childhood environment is an important driver of black-white gaps
But the environmental factors that matter differ by race
– Neighborhood effects cannot be reduced to a common set of factors that
affect both black and white boys
Black boys do well in nbhds. with good resources (low poverty rates) and good
race-specific factors (high father presence, less racial bias)
The problem is that there are essentially no such neighborhoods in America
Summary: Impacts of Neighborhood Environments on Black Men
66.3 9.8 19.7 34.1 62.54.2
Black White
LowFathers
HighFathers
01
02
03
04
05
06
07
08
0
Sh
are
of
Ch
ildre
n in
Ne
igh
bo
rho
od
Typ
e
High Pov. Low Pov. High Pov. Low Pov.
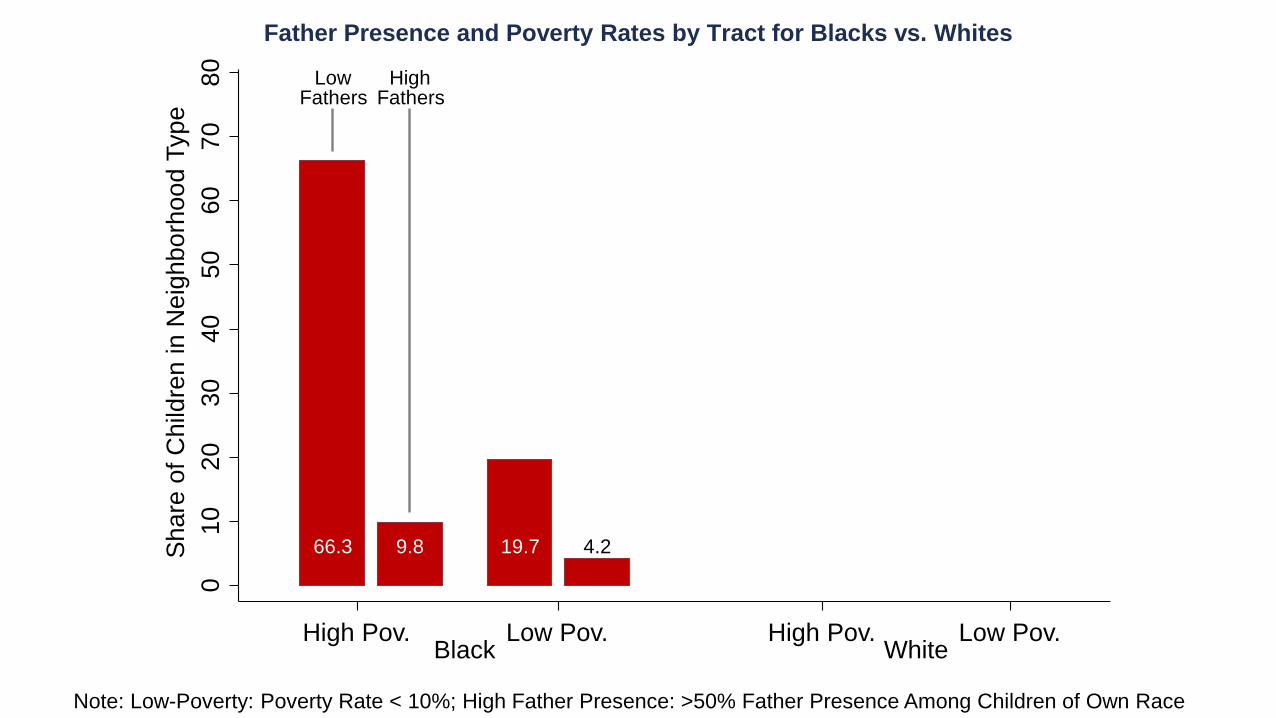
Father Presence and Poverty Rates by Tract for Blacks vs. Whites
Note: Low-Poverty: Poverty Rate < 10%; High Father Presence: >50% Father Presence Among Children of Own Race

66.3 9.8 19.7 34.1 62.54.2 1.0 2.4
Black White
LowFathers
HighFathers
LowFathers
HighFathers
01
02
03
04
05
06
07
08
0
Sh
are
of
Ch
ildre
n in
Ne
igh
bo
rho
od
Typ
e
High Pov. Low Pov. High Pov. Low Pov.
Father Presence and Poverty Rates by Tract for Blacks vs. Whites
Note: Low-Poverty: Poverty Rate < 10%; High Father Presence: >50% Father Presence Among Children of Own Race
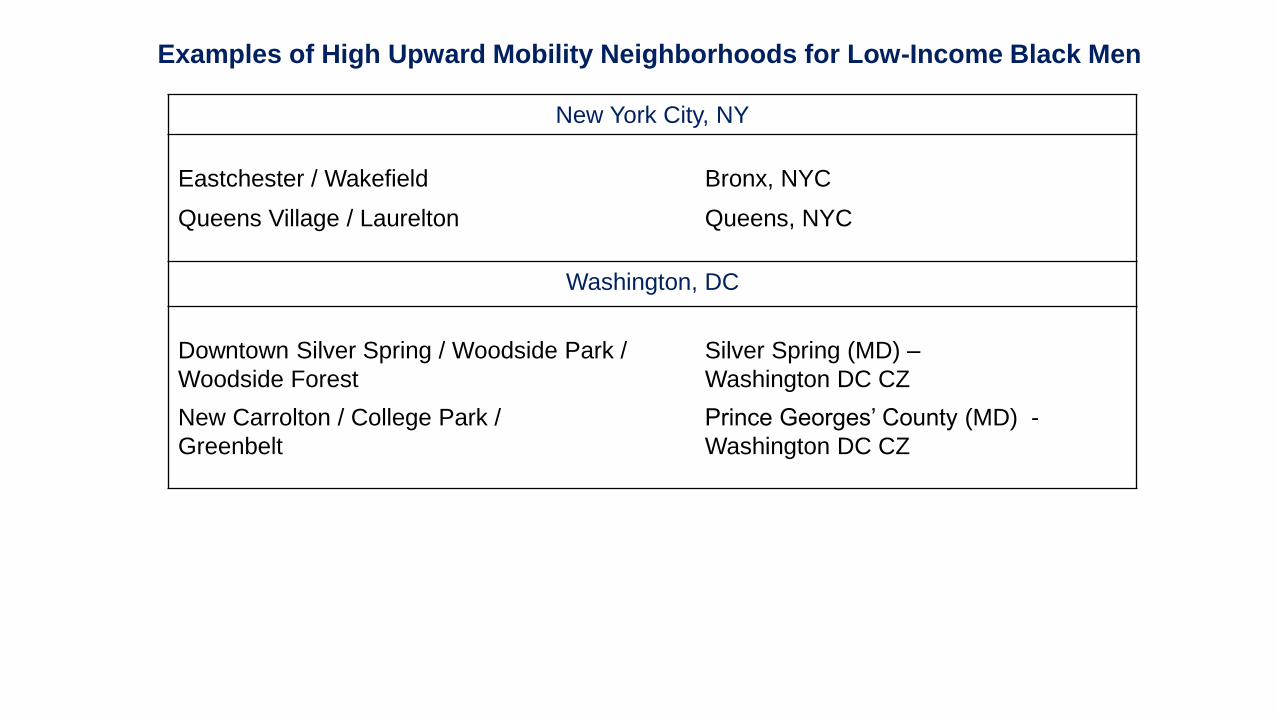
Examples of High Upward Mobility Neighborhoods for Low-Income Black Men
New York City, NY
Eastchester / Wakefield Bronx, NYC
Queens Village / Laurelton Queens, NYC
Washington, DC
Downtown Silver Spring / Woodside Park /
Woodside Forest
Silver Spring (MD) –
Washington DC CZ
New Carrolton / College Park /
Greenbelt
Prince Georges’ County (MD) -
Washington DC CZ
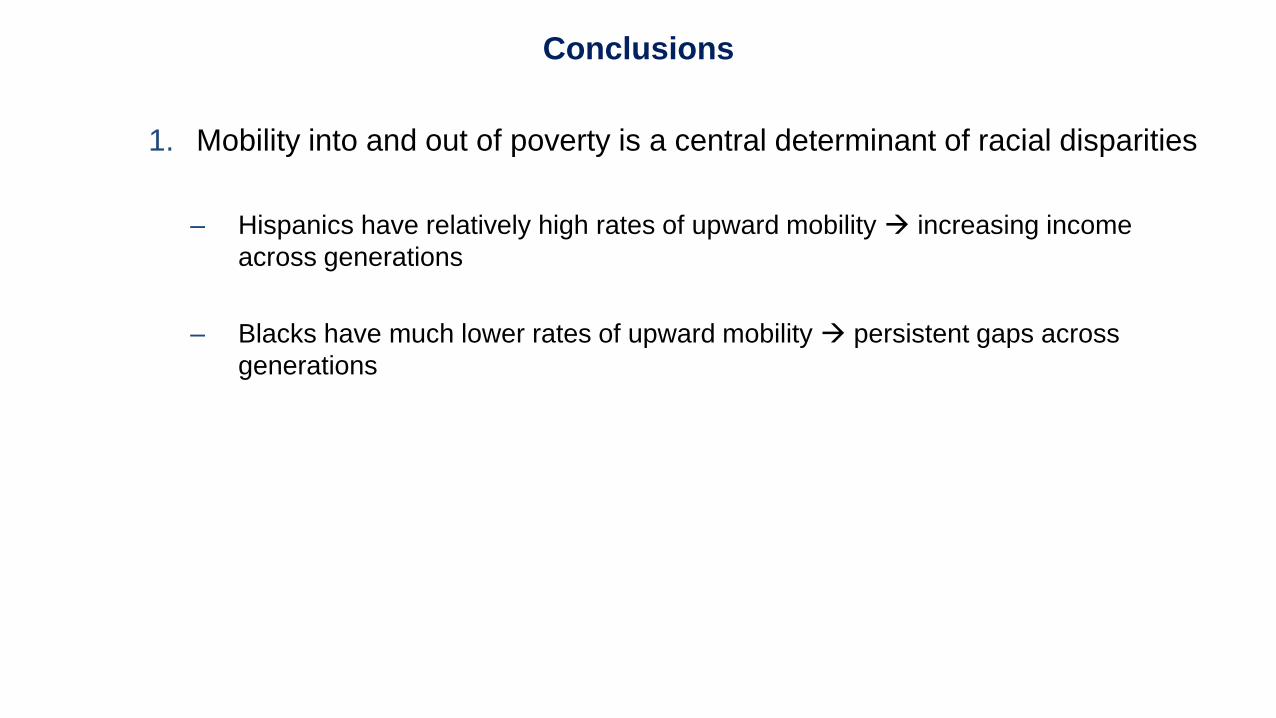
1. Mobility into and out of poverty is a central determinant of racial disparities
– Hispanics have relatively high rates of upward mobility increasing income
across generations
– Blacks have much lower rates of upward mobility persistent gaps across
generations
Conclusions
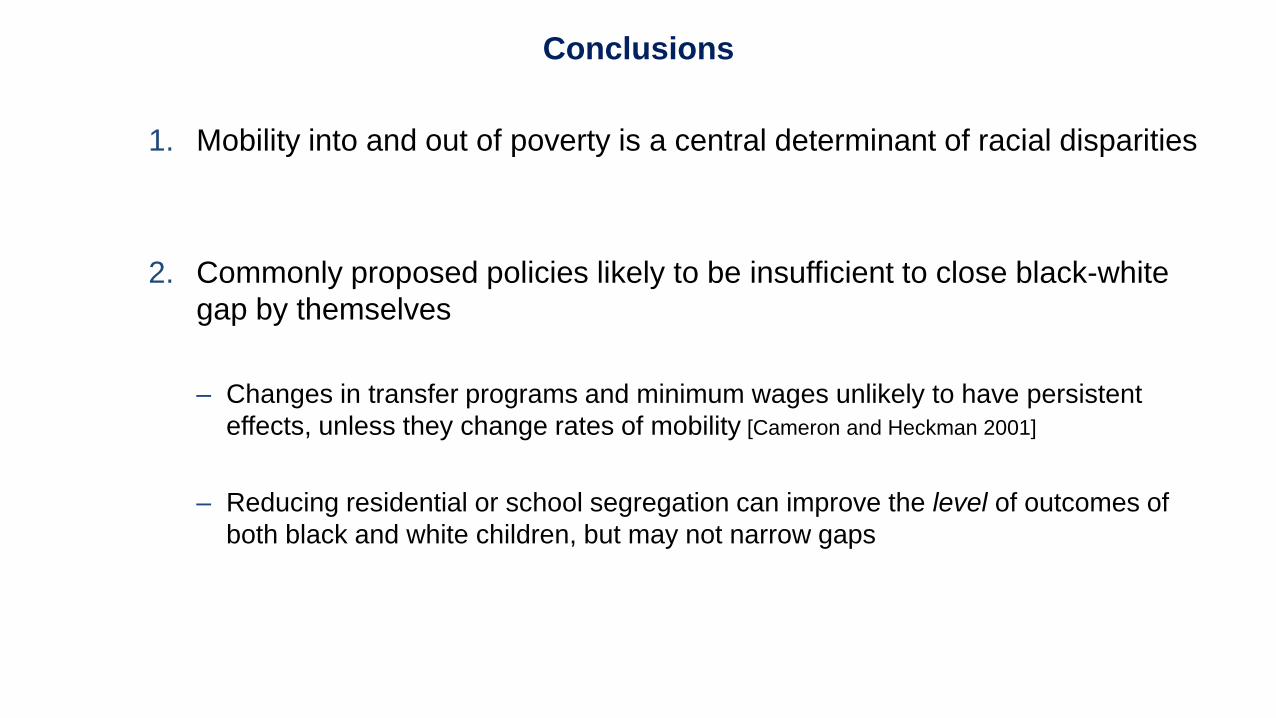
1. Mobility into and out of poverty is a central determinant of racial disparities
2. Commonly proposed policies likely to be insufficient to close black-white
gap by themselves
– Changes in transfer programs and minimum wages unlikely to have persistent
effects, unless they change rates of mobility [Cameron and Heckman 2001]
– Reducing residential or school segregation can improve the level of outcomes of
both black and white children, but may not narrow gaps
Conclusions
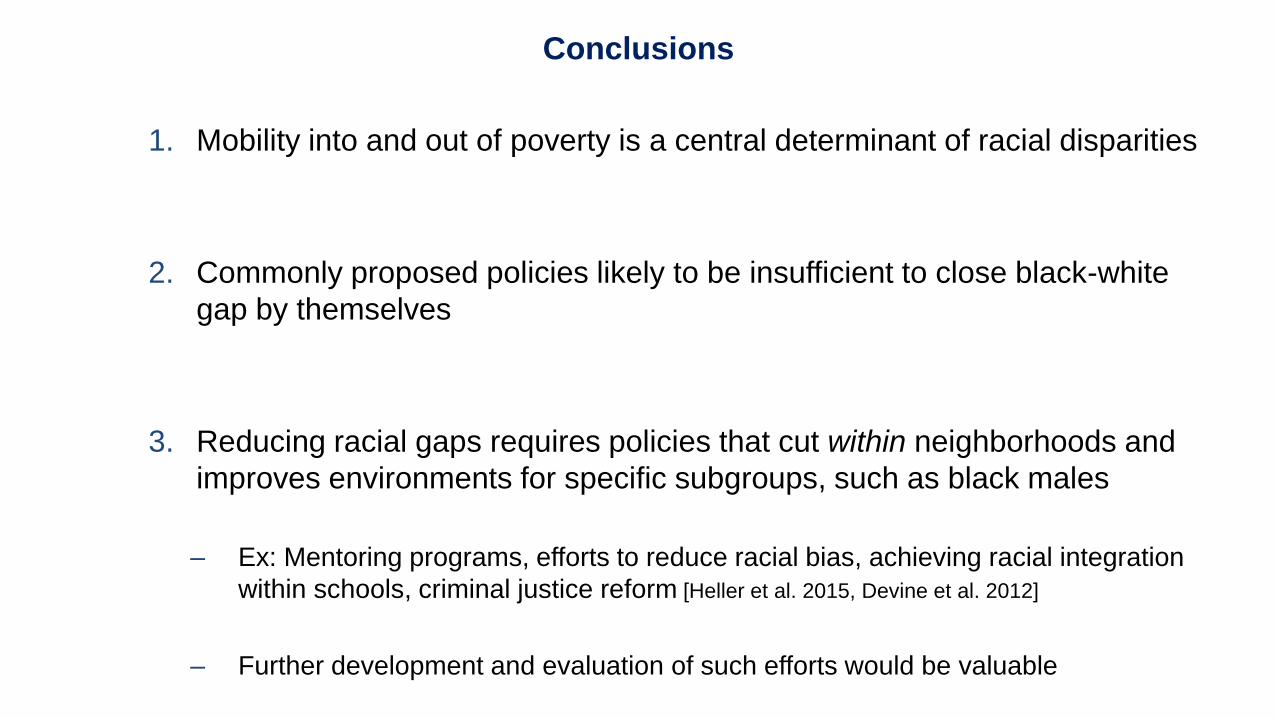
1. Mobility into and out of poverty is a central determinant of racial disparities
2. Commonly proposed policies likely to be insufficient to close black-white
gap by themselves
3. Reducing racial gaps requires policies that cut within neighborhoods and
improves environments for specific subgroups, such as black males
– Ex: Mentoring programs, efforts to reduce racial bias, achieving racial integration
within schools, criminal justice reform [Heller et al. 2015, Devine et al. 2012]
– Further development and evaluation of such efforts would be valuable
Conclusions

Supplementary Figures
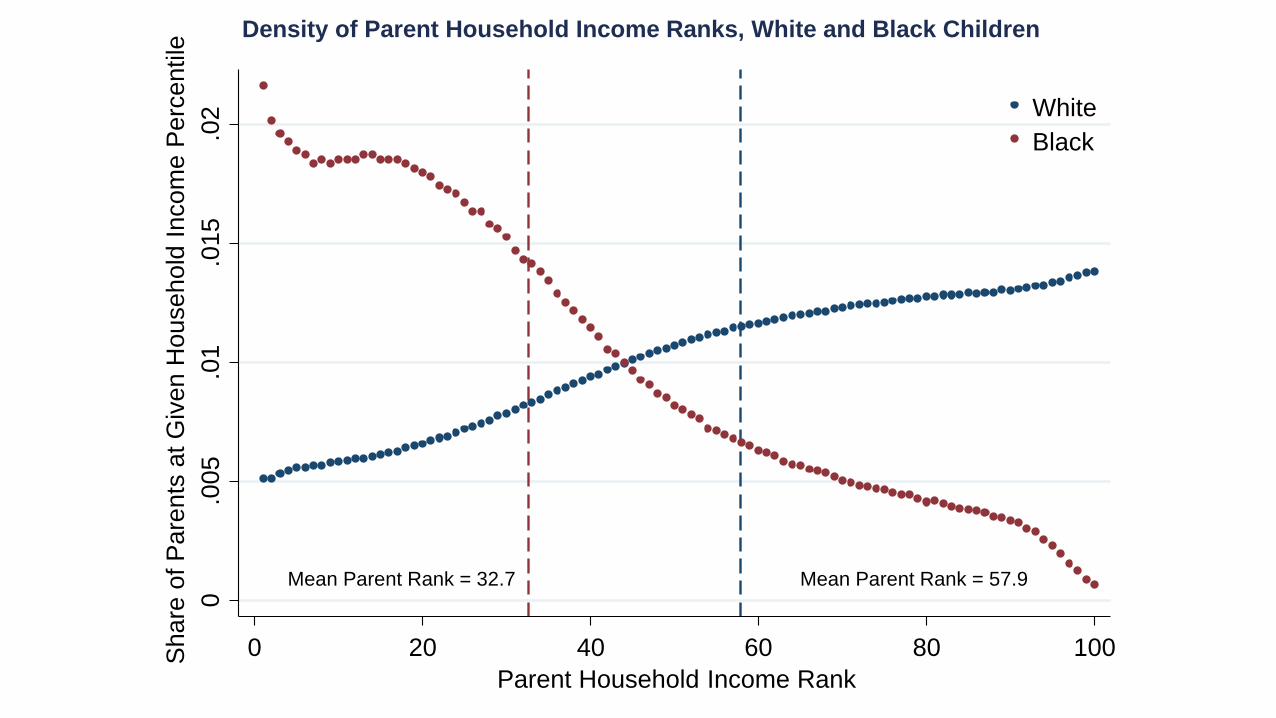
Density of Parent Household Income Ranks, White and Black Children
Mean Parent Rank = 32.7 Mean Parent Rank = 57.9
0.0
05
.01
.01
5.0
2
Share
of P
are
nts
at G
iven
Househ
old
Incom
e P
erc
entile
0 20 40 60 80 100
Parent Household Income Rank
White
Black
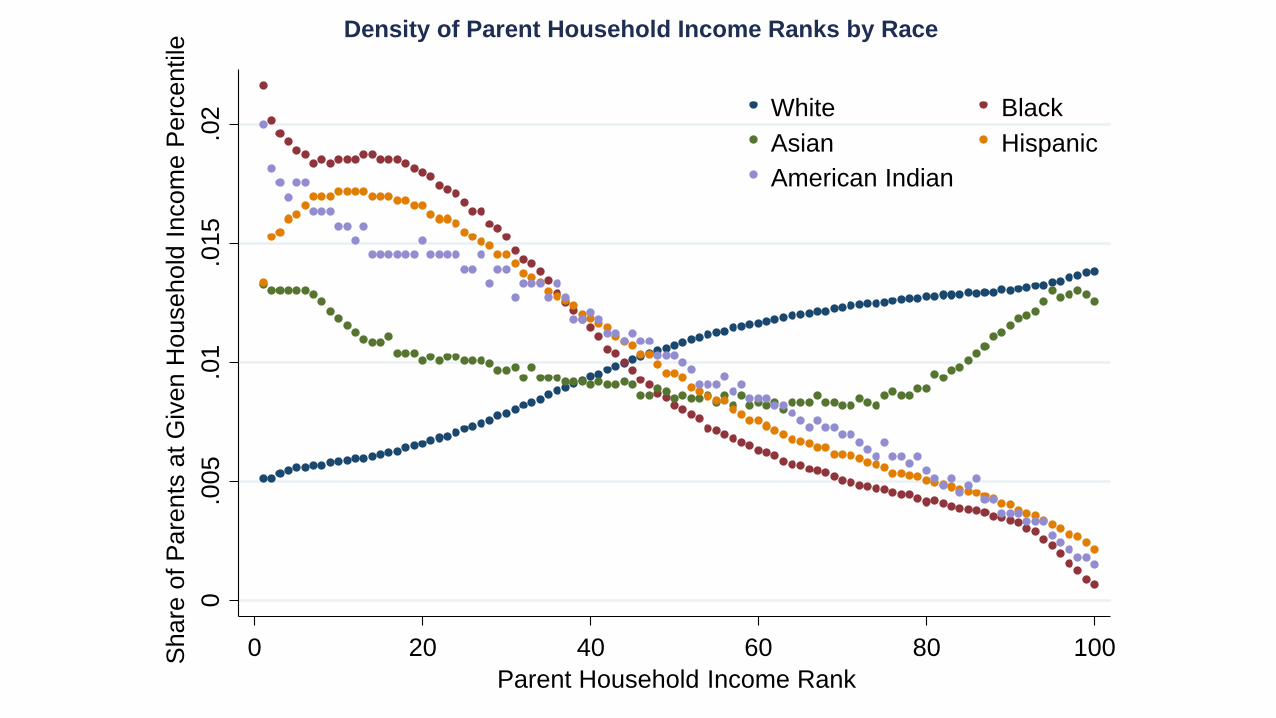
Density of Parent Household Income Ranks by Race
0.0
05
.01
.01
5.0
2
Share
of P
are
nts
at G
iven
Househ
old
Incom
e P
erc
entile
0 20 40 60 80 100
Parent Household Income Rank
White Black
Asian Hispanic
American Indian
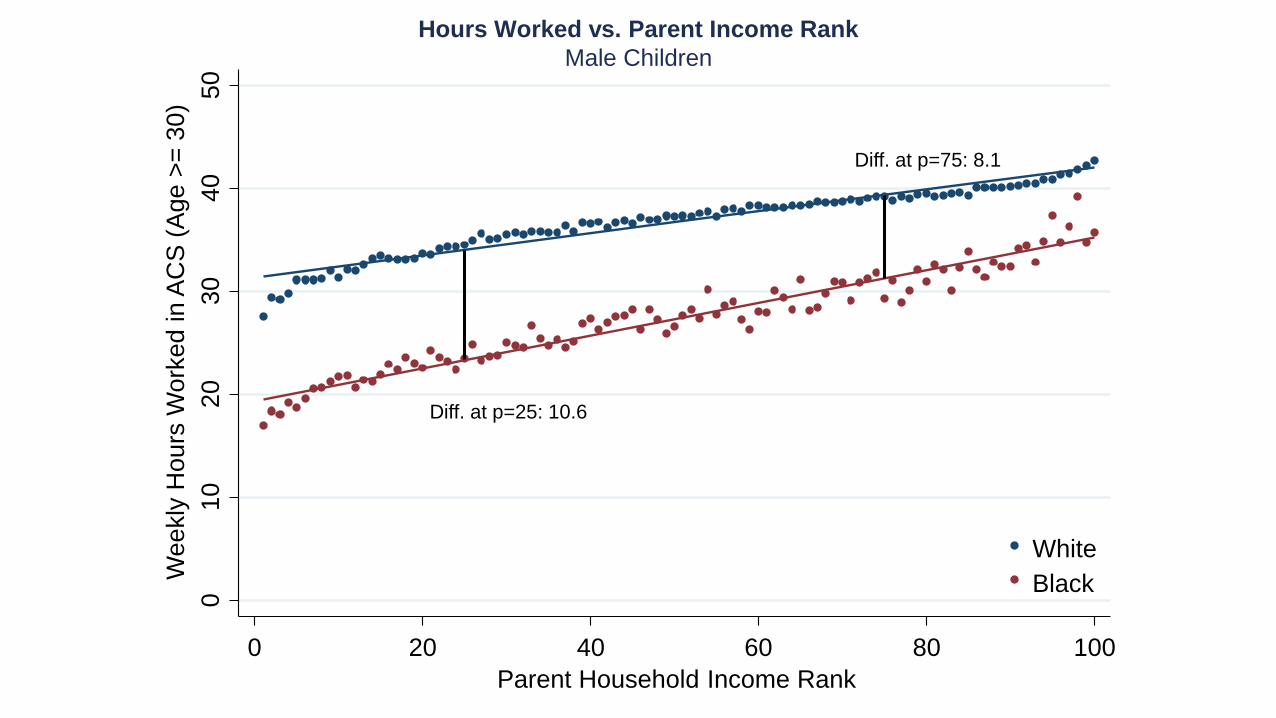
Hours Worked vs. Parent Income Rank
Male Children
Diff. at p=25: 10.6
Diff. at p=75: 8.1
01
02
03
04
05
0
We
ekly
Ho
urs
Wo
rke
d in
AC
S (
Ag
e >
= 3
0)
0 20 40 60 80 100
Parent Household Income Rank
White
Black

Hours Worked vs. Parent Income Rank
Female Children
Diff. at p=25: -1.0
Diff. at p=75: -1.30
10
20
30
40
50
We
ekly
Ho
urs
Wo
rke
d in
AC
S (
Ag
e >
= 3
0)
0 20 40 60 80 100
Parent Household Income Rank
White
Black
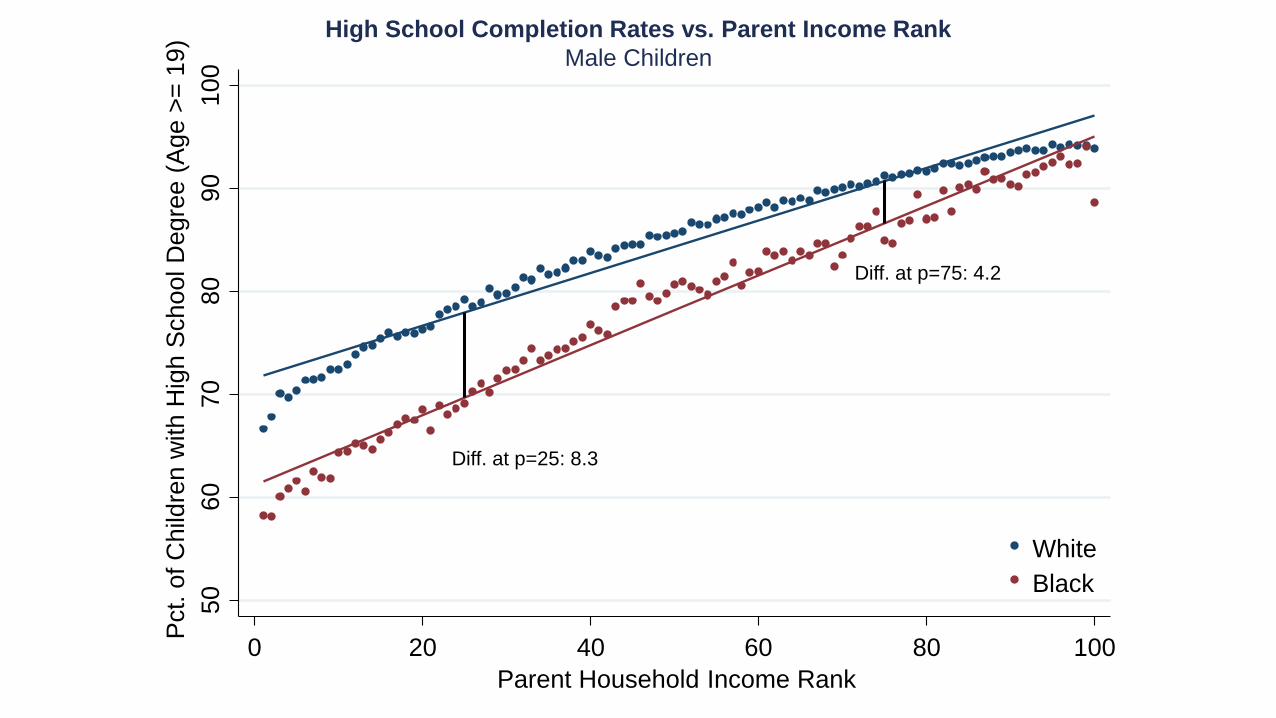
High School Completion Rates vs. Parent Income Rank
Male Children
Diff. at p=25: 8.3
Diff. at p=75: 4.2
50
60
70
80
90
10
0
Pct.
of
Ch
ildre
n w
ith
Hig
h S
ch
oo
l D
eg
ree
(A
ge
>=
19
)
0 20 40 60 80 100
Parent Household Income Rank
White
Black

High School Completion Rates vs. Parent Income Rank
Female Children
Diff. at p=25: 3.5
Diff. at p=75: 1.55
06
07
08
09
01
00
Pct.
of
Ch
ildre
n w
ith
Hig
h S
ch
oo
l D
eg
ree
(A
ge
>=
19
)
0 20 40 60 80 100
Parent Household Income Rank
White
Black
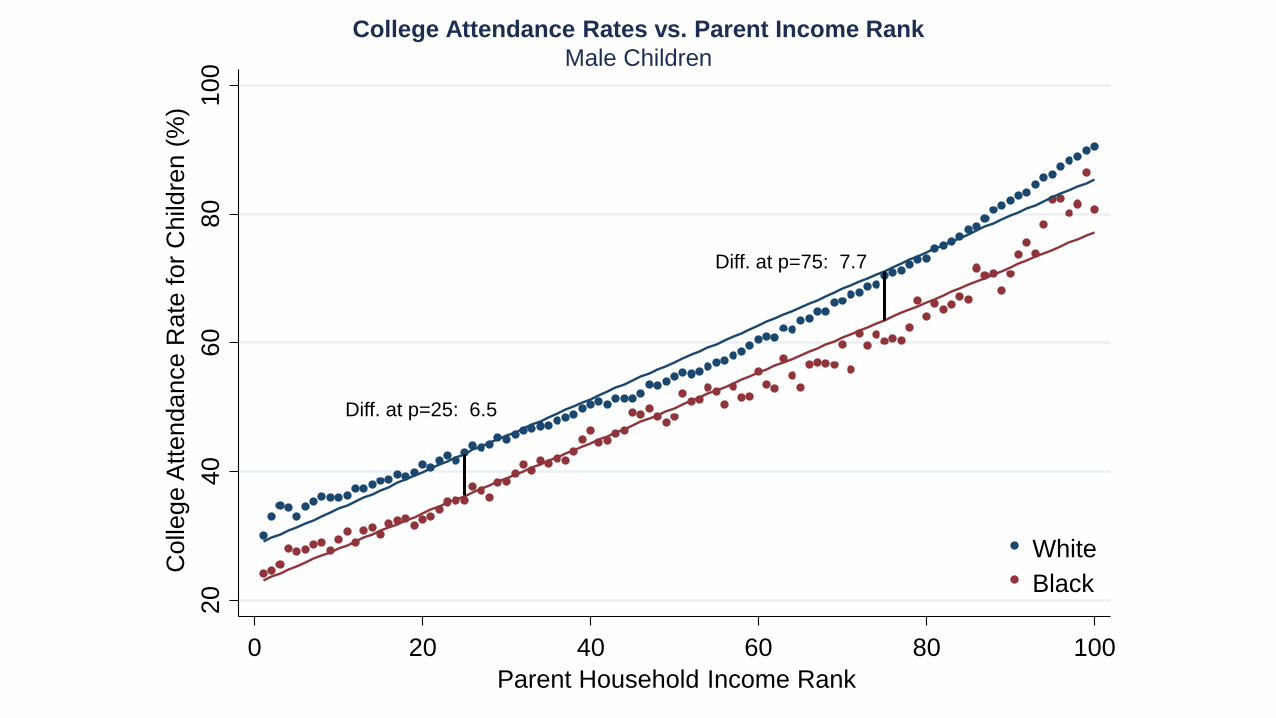
College Attendance Rates vs. Parent Income Rank
Male Children
Diff. at p=25: 6.5
Diff. at p=75: 7.7
20
40
60
80
10
0
Co
lleg
e A
tte
nd
an
ce
Ra
te f
or
Ch
ildre
n (
%)
0 20 40 60 80 100
Parent Household Income Rank
White
Black
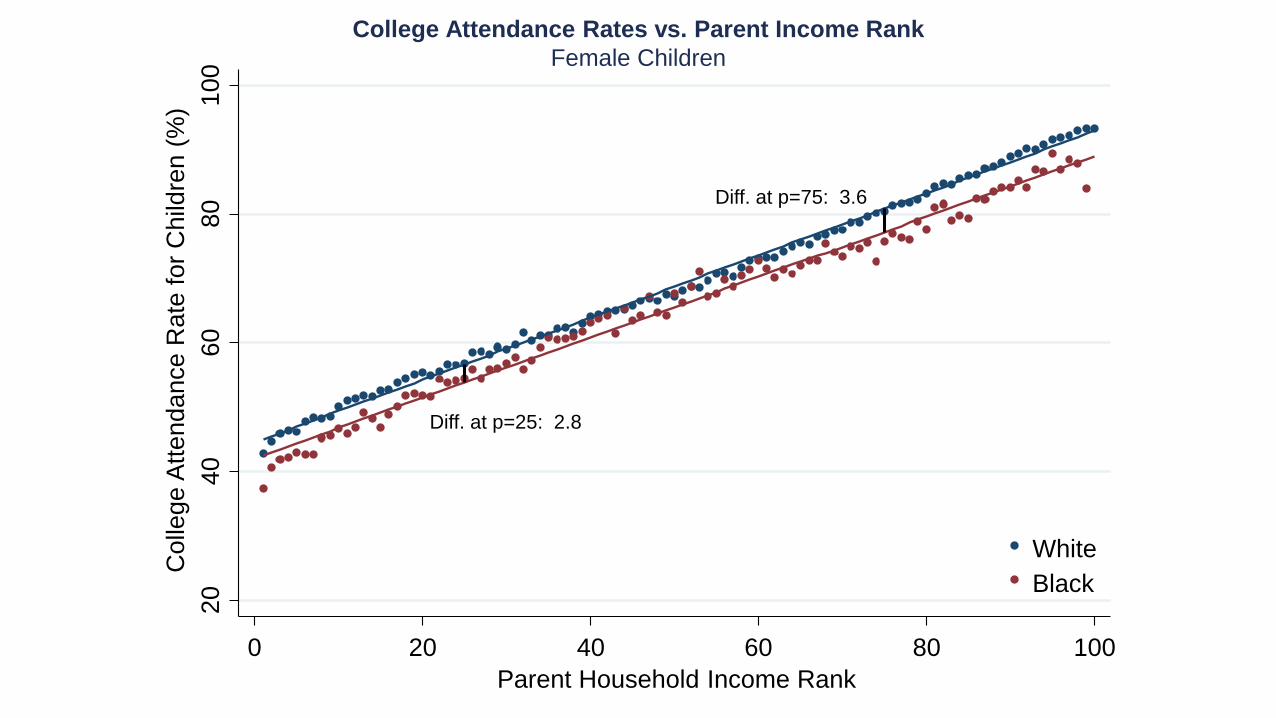
College Attendance Rates vs. Parent Income Rank
Female Children
Diff. at p=25: 2.8
Diff. at p=75: 3.6 2
04
06
08
01
00
Co
lleg
e A
tte
nd
an
ce
Ra
te f
or
Ch
ildre
n (
%)
0 20 40 60 80 100
Parent Household Income Rank
White
Black

Household Income Rank vs. Parent Income Rank
Male Children
Diff. at p=25: 13.6
Diff. at p=75: 16.62
04
06
08
0
Me
an
Ch
ild H
ou
se
ho
ld I
nco
me
Ra
nk
0 20 40 60 80 100
Parent Household Income Rank
White
Black
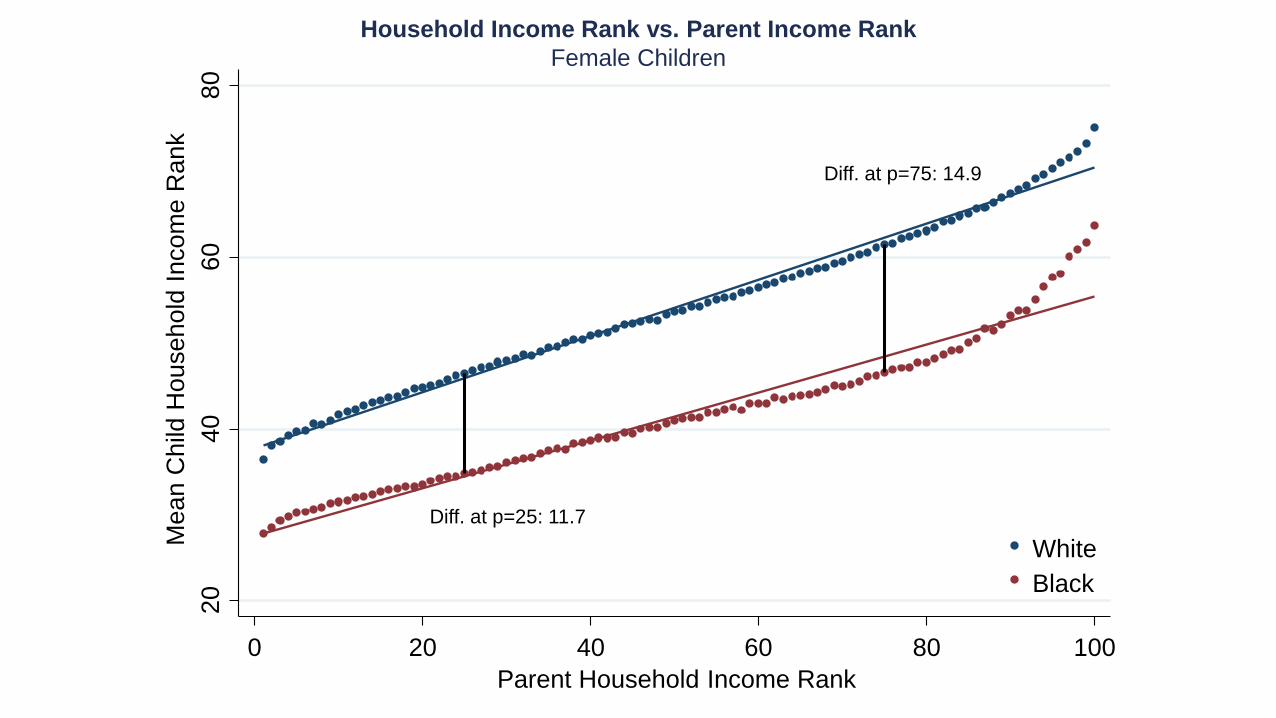
Household Income Rank vs. Parent Income Rank
Female Children
Diff. at p=25: 11.7
Diff. at p=75: 14.9
20
40
60
80
Me
an
Ch
ild H
ou
se
ho
ld I
nco
me
Ra
nk
0 20 40 60 80 100
Parent Household Income Rank
White
Black
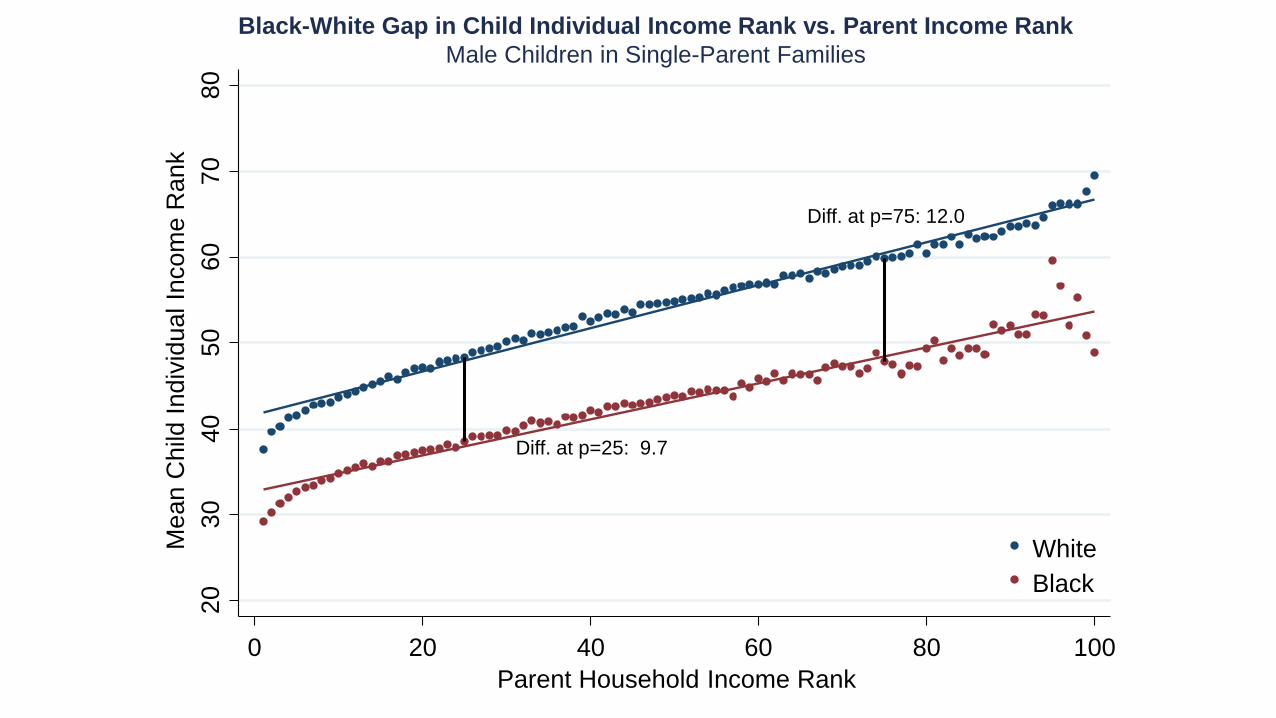
Black-White Gap in Child Individual Income Rank vs. Parent Income Rank
Male Children in Single-Parent Families
Diff. at p=25: 9.7
Diff. at p=75: 12.02
03
04
05
06
07
08
0
Me
an C
hild
Indiv
idu
al In
com
e R
ank
0 20 40 60 80 100
Parent Household Income Rank
White
Black
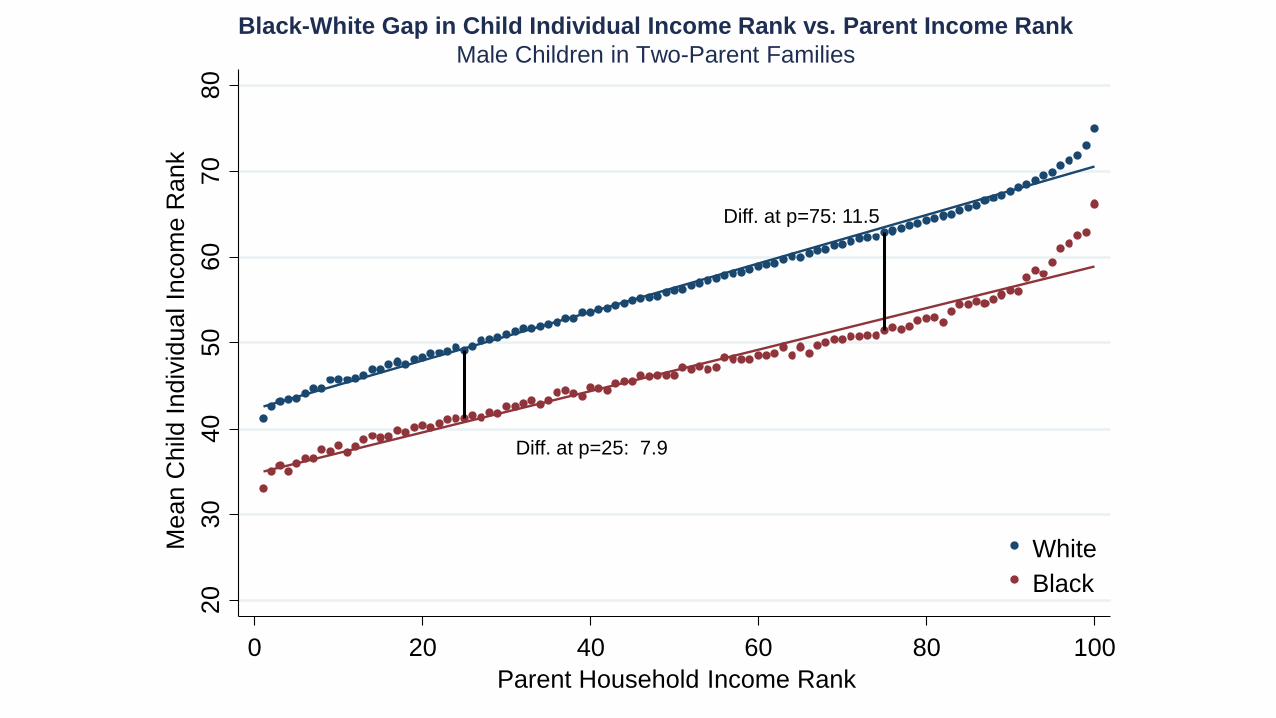
Black-White Gap in Child Individual Income Rank vs. Parent Income Rank
Male Children in Two-Parent Families
Diff. at p=25: 7.9
Diff. at p=75: 11.52
03
04
05
06
07
08
0
Me
an C
hild
Indiv
idu
al In
com
e R
ank
0 20 40 60 80 100
Parent Household Income Rank
White
Black
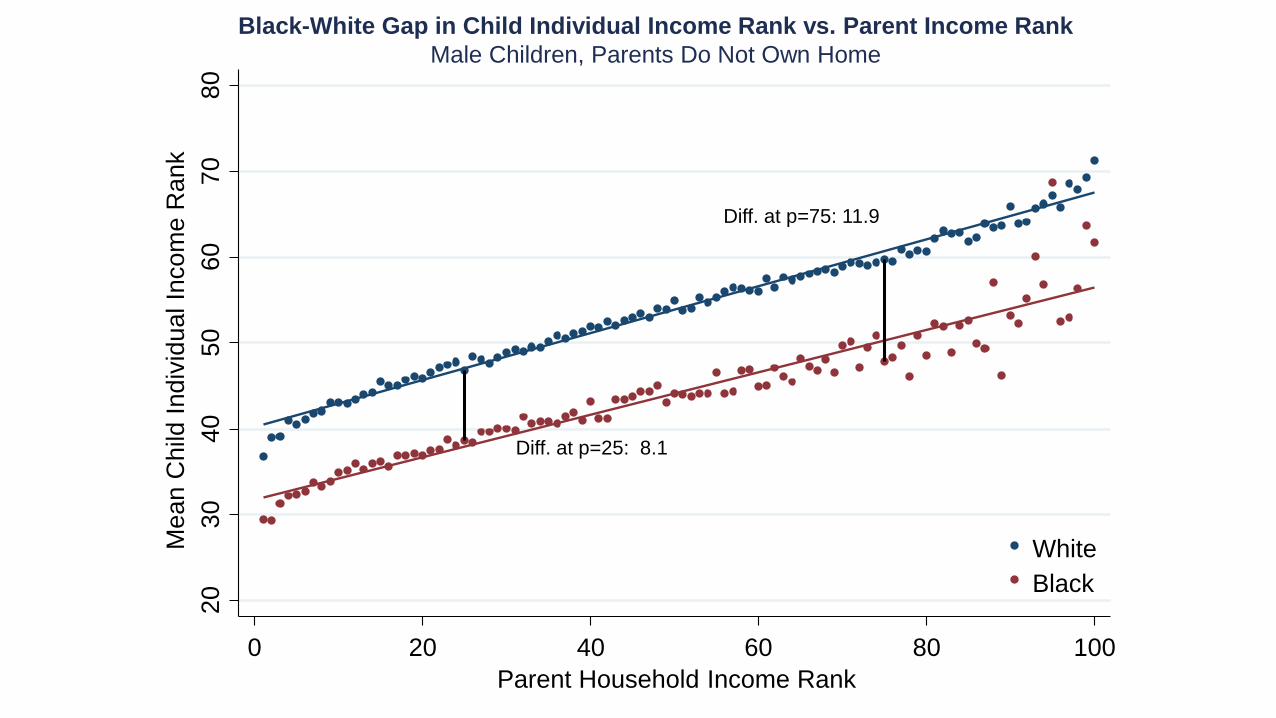
Black-White Gap in Child Individual Income Rank vs. Parent Income Rank
Male Children, Parents Do Not Own Home
Diff. at p=25: 8.1
Diff. at p=75: 11.92
03
04
05
06
07
08
0
Me
an C
hild
Indiv
idu
al In
com
e R
ank
0 20 40 60 80 100
Parent Household Income Rank
White
Black
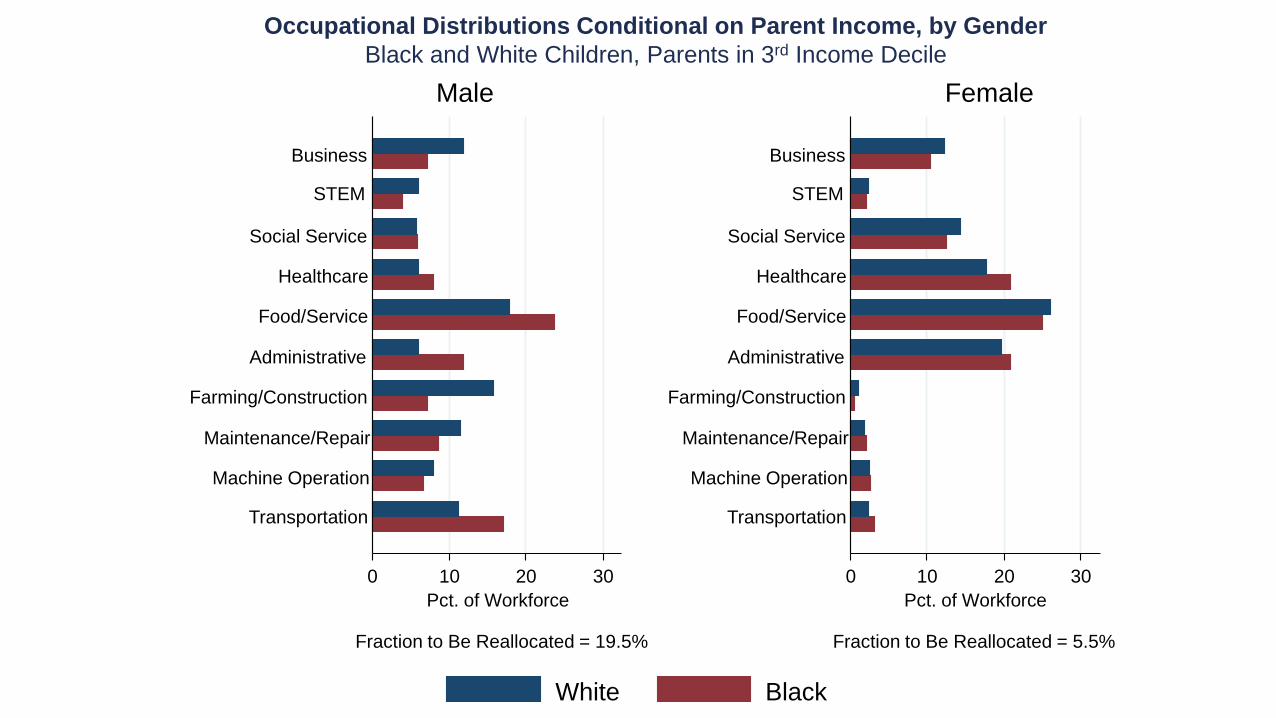
Occupational Distributions Conditional on Parent Income, by Gender
Black and White Children, Parents in 3rd Income Decile
Male
0 10 20 30
Pct. of Workforce
Transportation
Machine Operation
Maintenance/Repair
Farming/Construction
Administrative
Food/Service
Healthcare
Social Service
STEM
Business
Fraction to Be Reallocated = 19.5%
Female
0 10 20 30
Pct. of Workforce
Transportation
Machine Operation
Maintenance/Repair
Farming/Construction
Administrative
Food/Service
Healthcare
Social Service
STEM
Business
Fraction to Be Reallocated = 5.5%
White Black

Occupational Distributions Conditional on Parent Income, by Gender
Black and White Children, Parents in 8th Income Decile
Male
0 10 20 30
Pct. of Workforce
Transportation
Machine Operation
Maintenance/Repair
Farming/Construction
Administrative
Food/Service
Healthcare
Social Service
STEM
Business
Fraction to Be Reallocated = 13.2%
Female
0 10 20 30
Pct. of Workforce
Transportation
Machine Operation
Maintenance/Repair
Farming/Construction
Administrative
Food/Service
Healthcare
Social Service
STEM
Business
Fraction to Be Reallocated = 5.4%
White Black
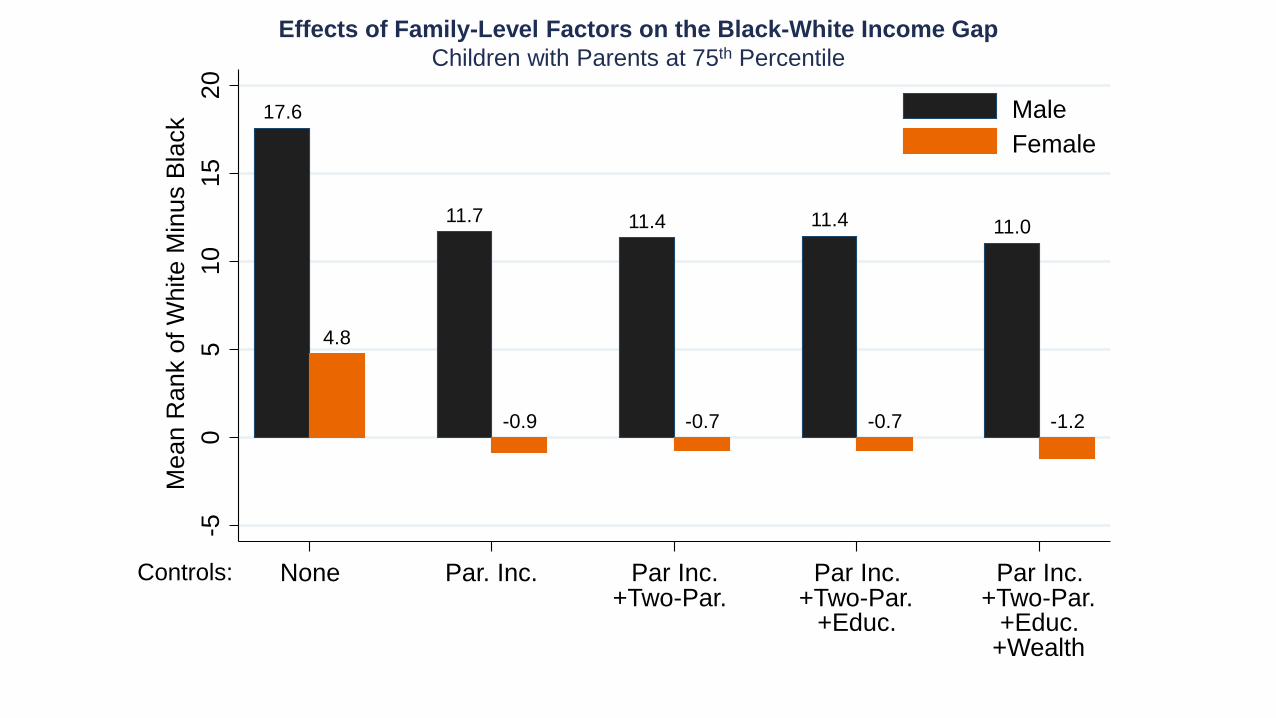
Controls:
Effects of Family-Level Factors on the Black-White Income Gap
Children with Parents at 75th Percentile
17.6
11.7 11.411.4 11.0
4.8
-0.7 -0.7-0.9 -1.2
-50
51
01
52
0
Me
an
Ra
nk o
f W
hite
Min
us B
lack
None Par. Inc. Par Inc.+Two-Par.
Par Inc.+Two-Par.
+Educ.
Par Inc.+Two-Par.
+Educ.+Wealth
Male
Female
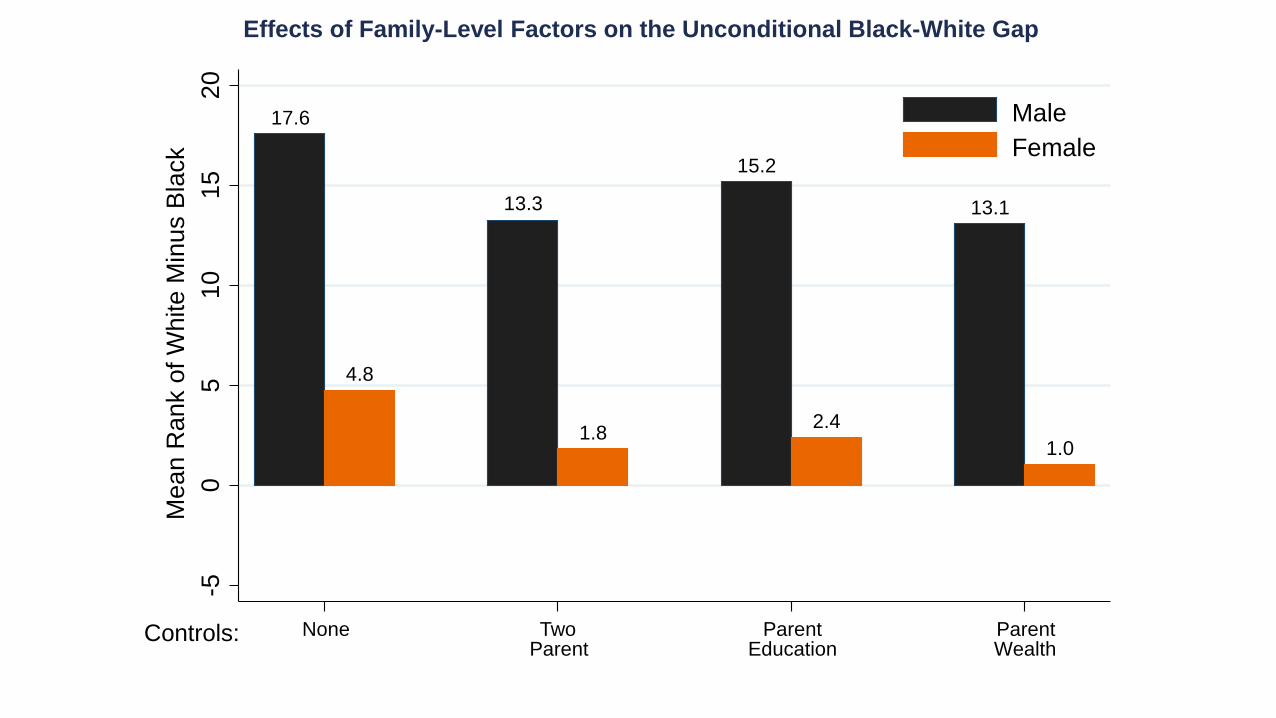
Effects of Family-Level Factors on the Unconditional Black-White Gap
Controls:
17.6
15.2
13.3 13.1
4.8
2.41.8
1.0
-50
51
01
52
0
Me
an
Ra
nk o
f W
hite
Min
us B
lack
None TwoParent
ParentEducation
ParentWealth
Male
Female
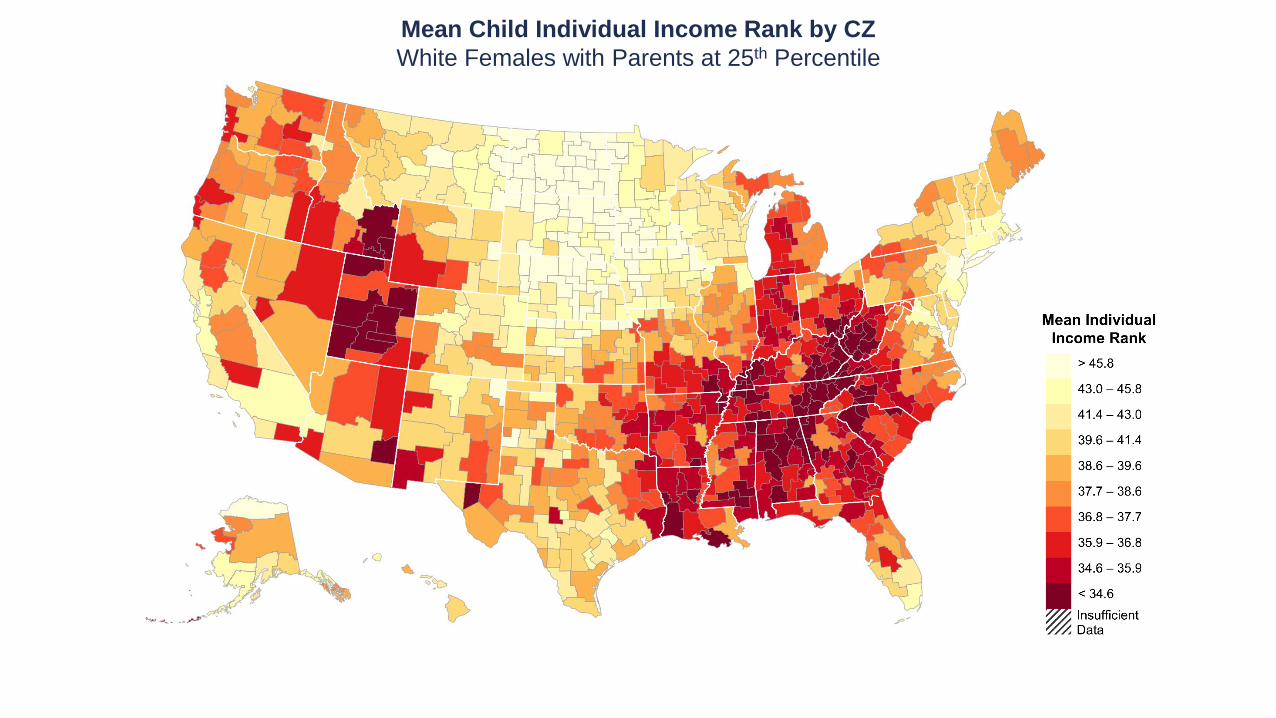
Mean Child Individual Income Rank by CZ
White Females with Parents at 25th Percentile
Mean Child Individual Income Rank by CZ
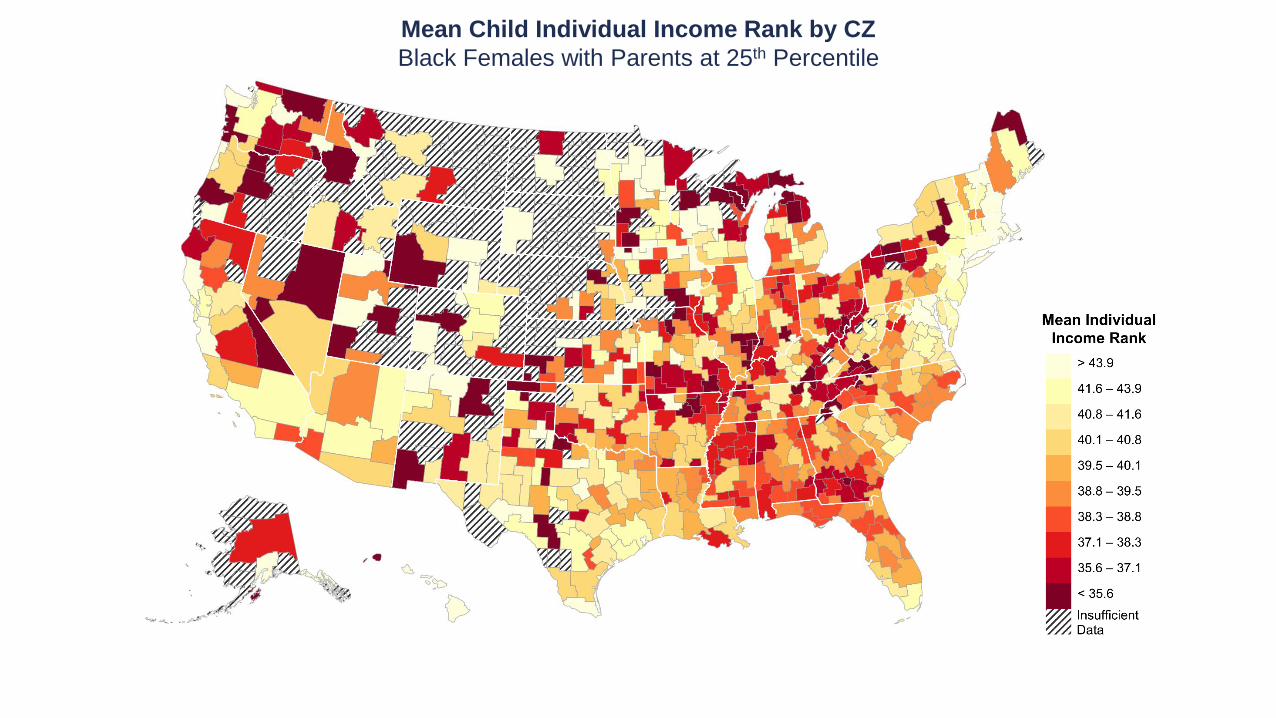
Black Females with Parents at 25th Percentile

Mean Child Household Income Rank Given Parents at 25th Percentile by CZ
Full Population
Mean Household Income Rank
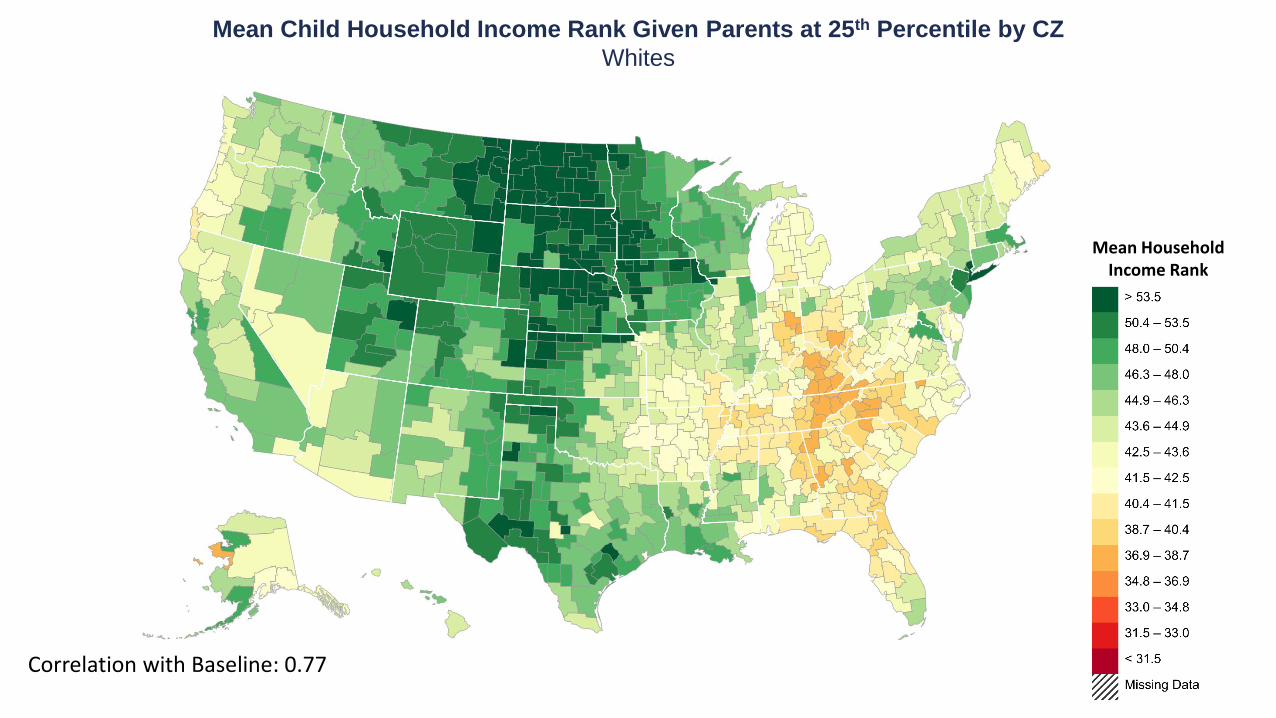
Mean Child Household Income Rank Given Parents at 25th Percentile by CZ
Whites
Correlation with Baseline: 0.77
Mean Household Income Rank
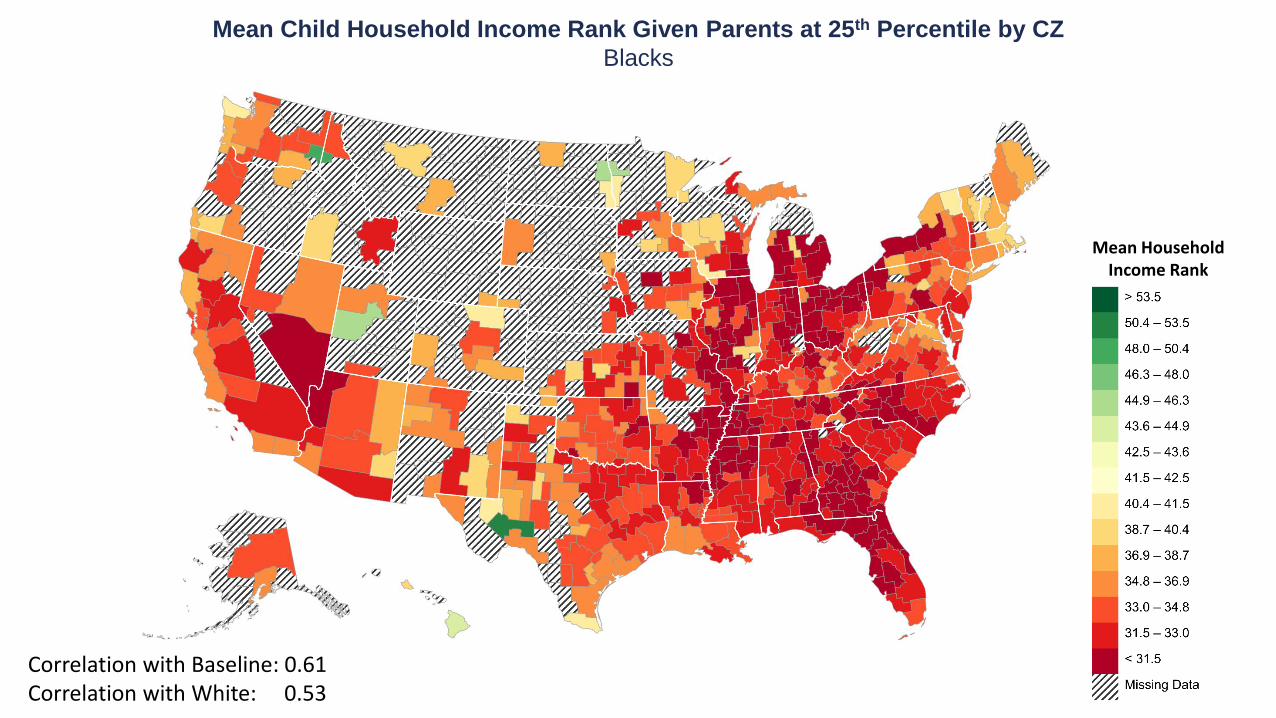
Mean Child Household Income Rank Given Parents at 25th Percentile by CZ
Blacks
Correlation with Baseline: 0.61Correlation with White: 0.53
Mean Household Income Rank
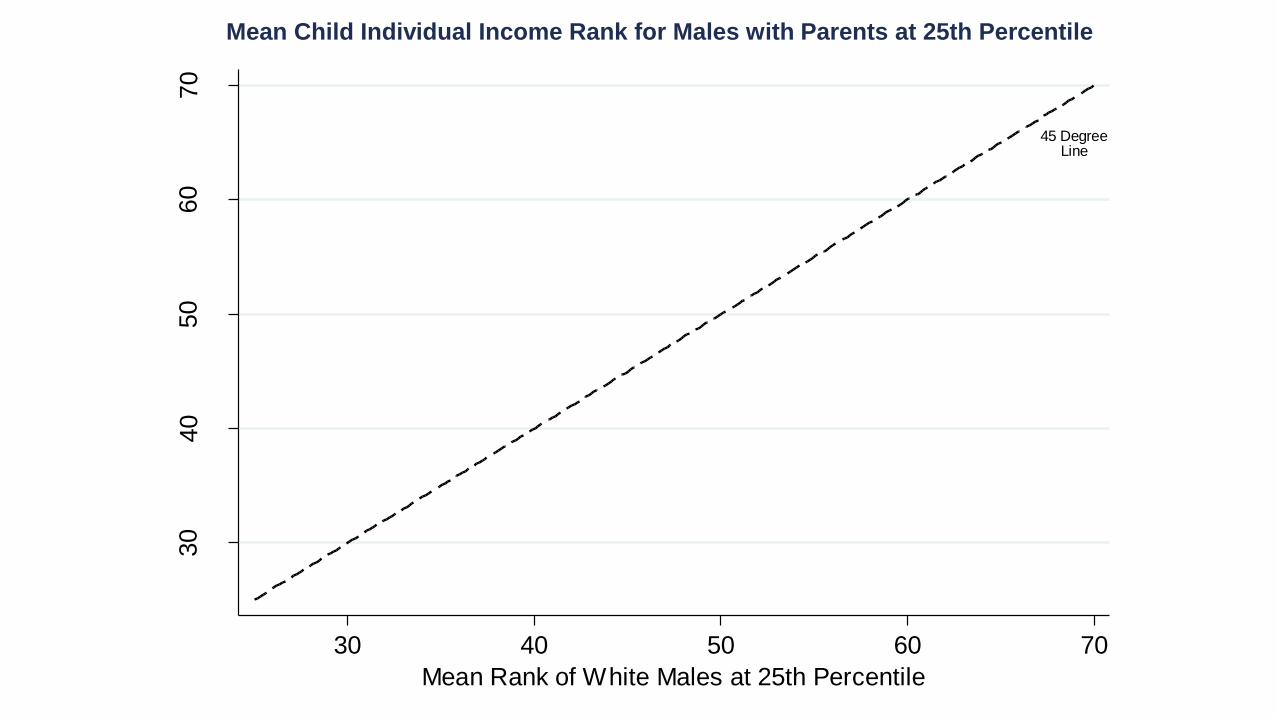
45 DegreeLine
30
40
50
60
70
Mean R
an
k o
f B
lack M
ale
s a
t 25th
Perc
entile
30 40 50 60 70
Mean Rank of White Males at 25th Percentile
Mean Child Individual Income Rank for Males with Parents at 25th Percentile
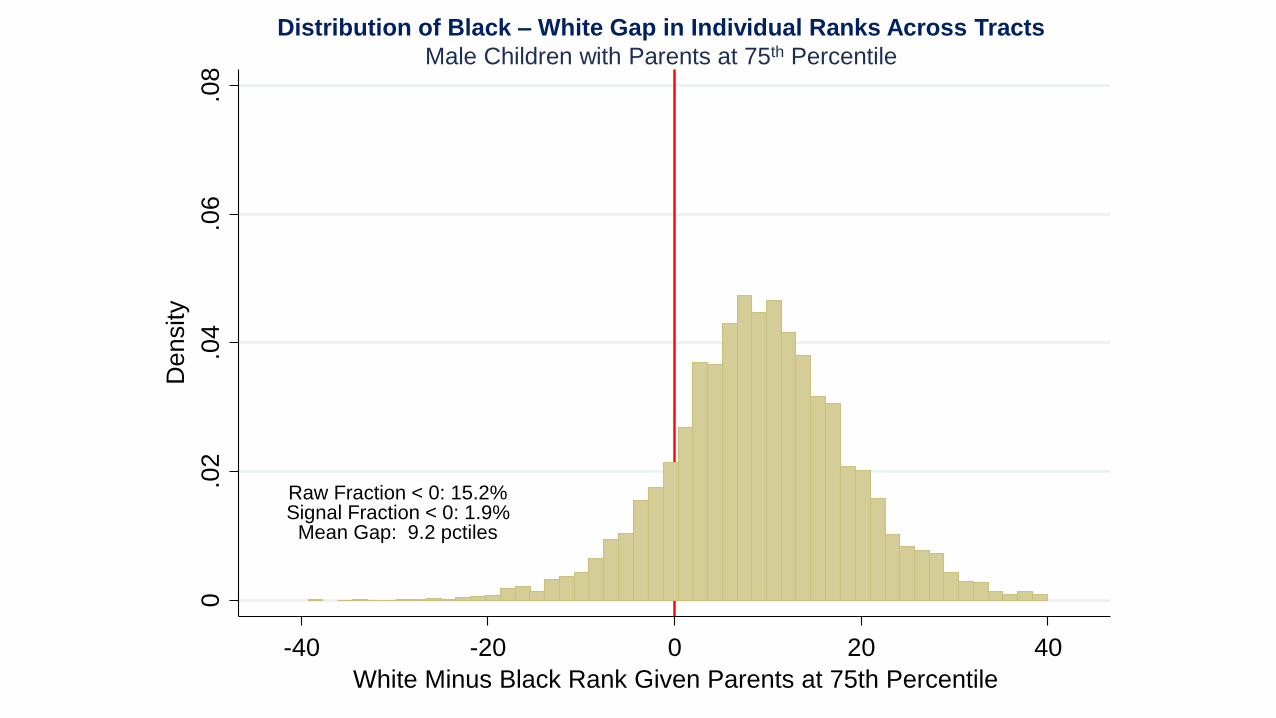
Distribution of Black – White Gap in Individual Ranks Across Tracts
Male Children with Parents at 75th Percentile
Raw Fraction < 0: 15.2%Signal Fraction < 0: 1.9%
Mean Gap: 9.2 pctiles
0.0
2.0
4.0
6.0
8
Density
-40 -20 0 20 40
White Minus Black Rank Given Parents at 75th Percentile
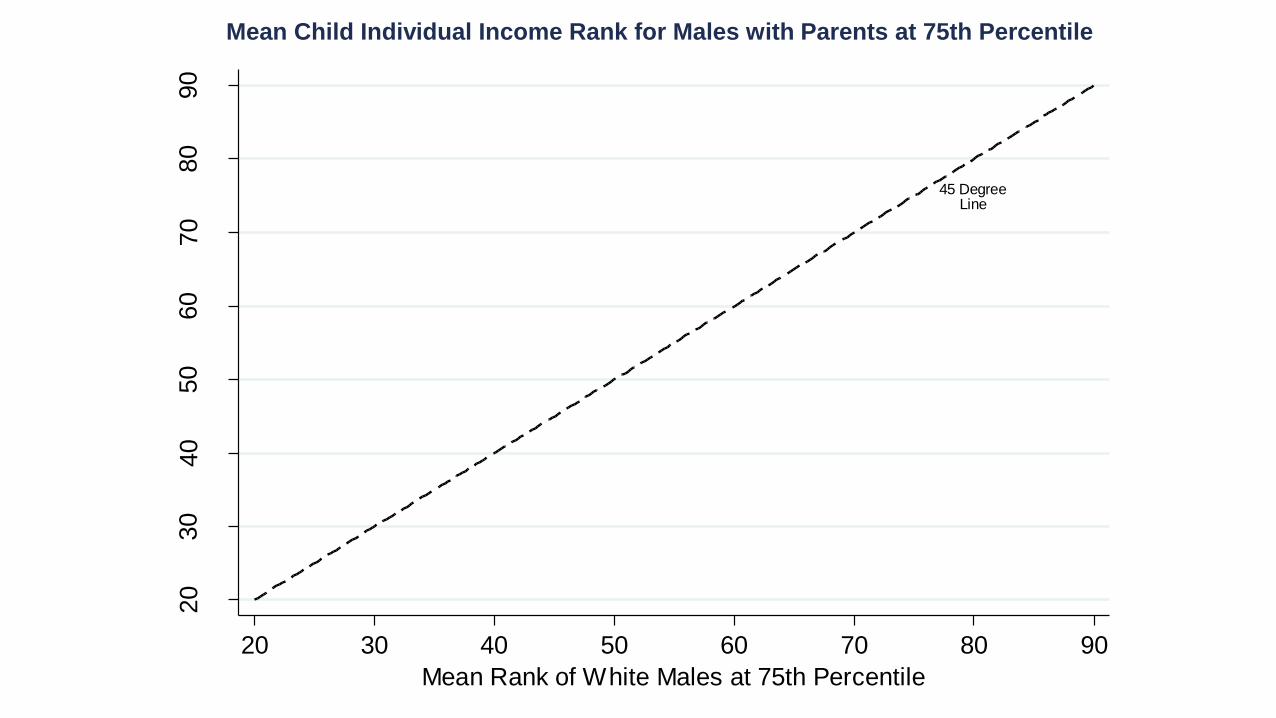
45 DegreeLine
20
30
40
50
60
70
80
90
Mean R
an
k o
f B
lack M
ale
s a
t 75th
Perc
entile
20 30 40 50 60 70 80 90
Mean Rank of White Males at 75th Percentile
Mean Child Individual Income Rank for Males with Parents at 75th Percentile
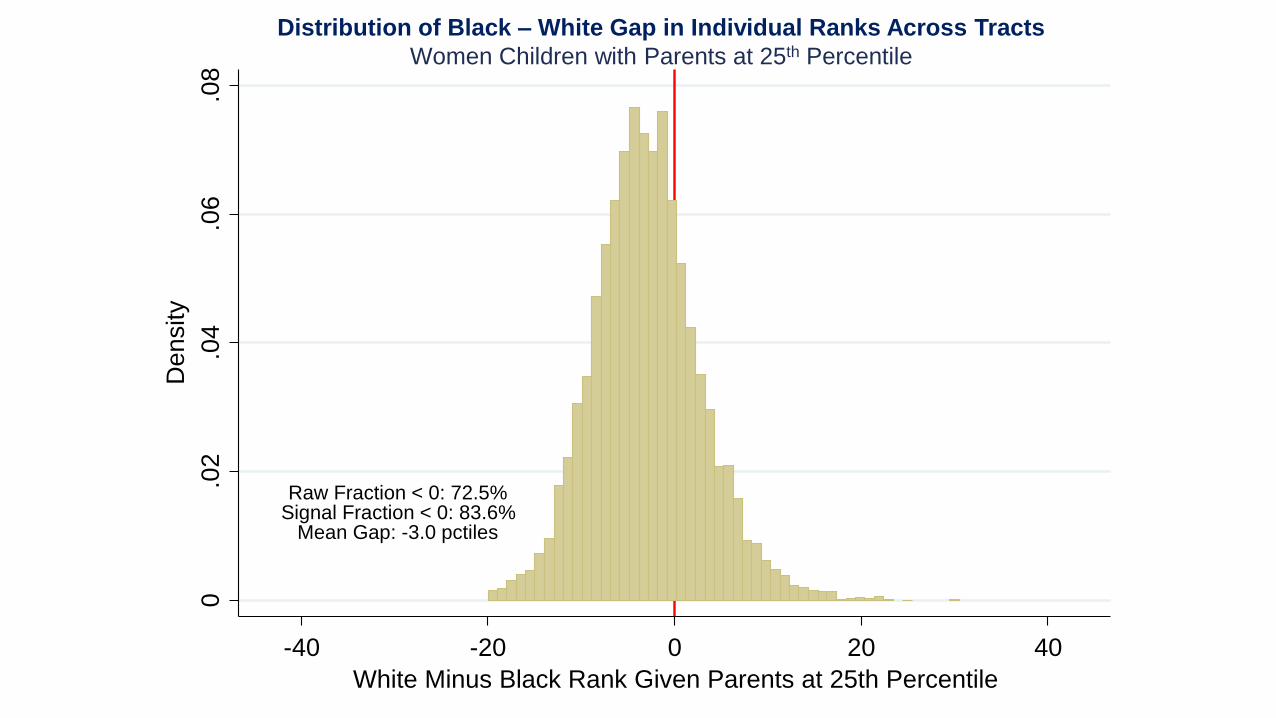
Raw Fraction < 0: 72.5%Signal Fraction < 0: 83.6%
Mean Gap: -3.0 pctiles
0.0
2.0
4.0
6.0
8
Density
-40 -20 0 20 40
White Minus Black Rank Given Parents at 25th Percentile
Distribution of Black – White Gap in Individual Ranks Across Tracts
Women Children with Parents at 25th Percentile
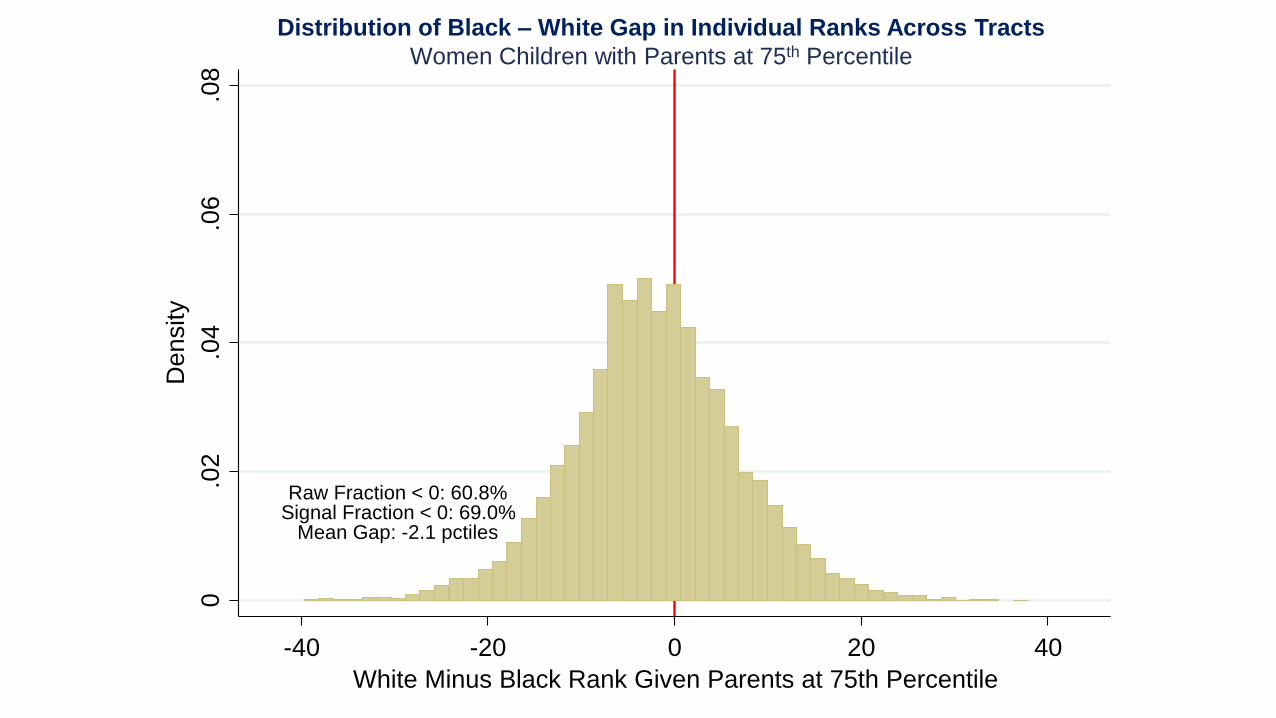
Distribution of Black – White Gap in Individual Ranks Across Tracts
Women Children with Parents at 75th Percentile
Raw Fraction < 0: 60.8%Signal Fraction < 0: 69.0%
Mean Gap: -2.1 pctiles
0.0
2.0
4.0
6.0
8
Density
-40 -20 0 20 40
White Minus Black Rank Given Parents at 75th Percentile
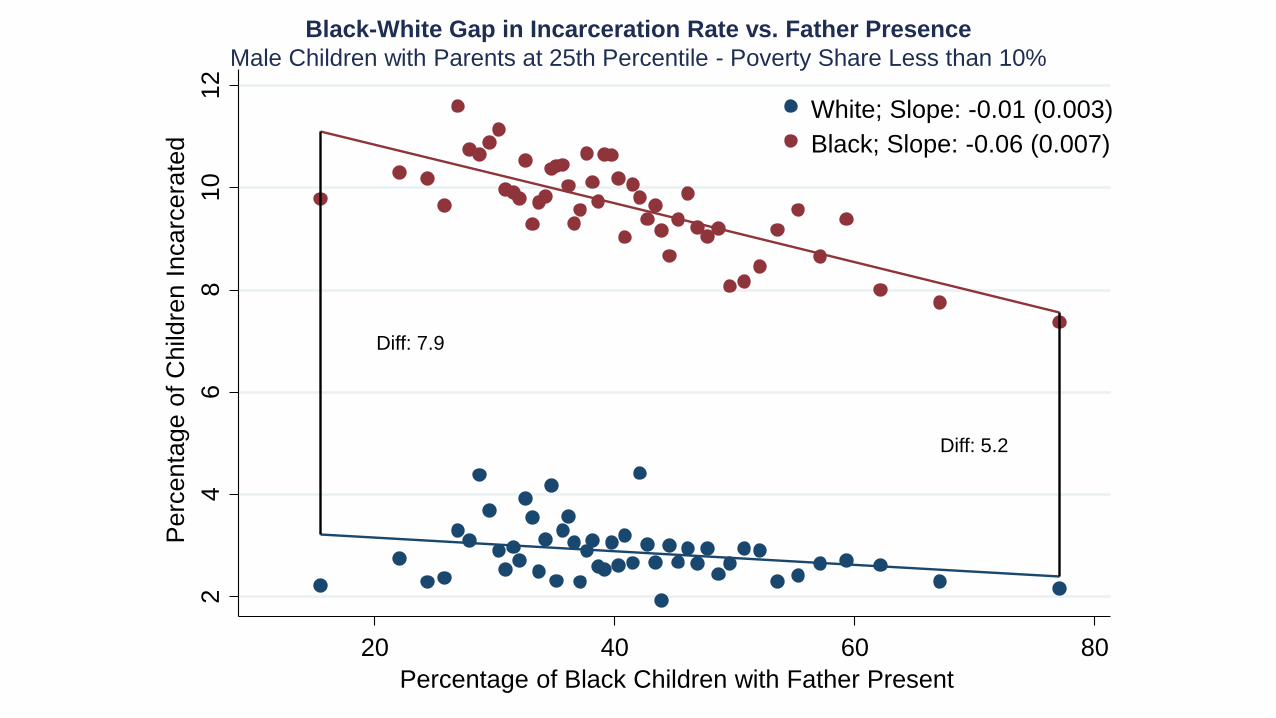
Diff: 7.9
Diff: 5.2
24
68
10
12
Perc
enta
ge o
f C
hild
ren I
ncarc
era
ted
20 40 60 80
Percentage of Black Children with Father Present
White; Slope: -0.01 (0.003)
Black; Slope: -0.06 (0.007)
Black-White Gap in Incarceration Rate vs. Father Presence
Male Children with Parents at 25th Percentile - Poverty Share Less than 10%
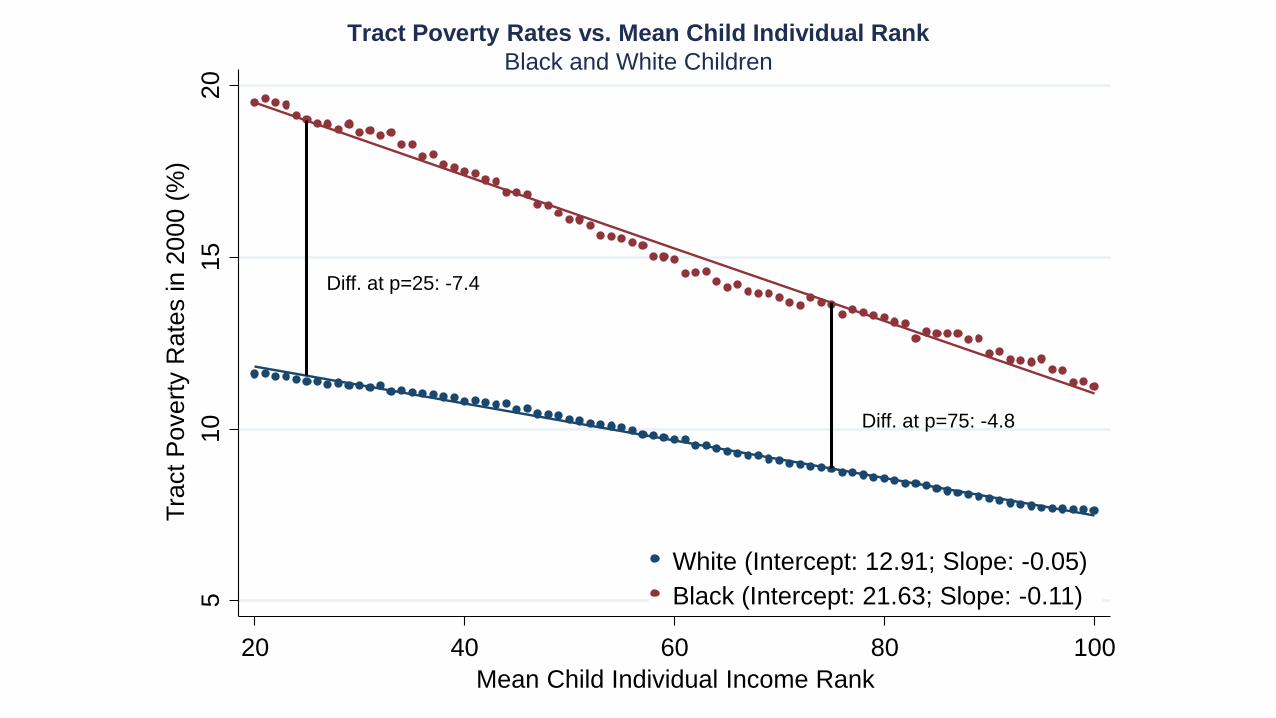
Tract Poverty Rates vs. Mean Child Individual Rank
Black and White Children
Diff. at p=25: -7.4
Diff. at p=75: -4.8
51
01
52
0
Tra
ct P
overt
y R
ate
s in 2
000
(%
)
20 40 60 80 100
Mean Child Individual Income Rank
White (Intercept: 12.91; Slope: -0.05)
Black (Intercept: 21.63; Slope: -0.11)

Fraction of Kids with Father Present vs. Individual Income Rank
Black and White Children
Diff. at p=25: 27.8 Diff. at p=75: 26.9
30
40
50
60
70
Pct.
of
Ch
ildre
n w
ith
Fa
the
r P
rese
nt
(Pa
ren
t p
=2
5)
20 40 60 80 100
Mean Child Individual Income Rank
White (Intercept: 69.20, Slope: -0.02)
Black (Intercept: 41.02, Slope: -0.00)
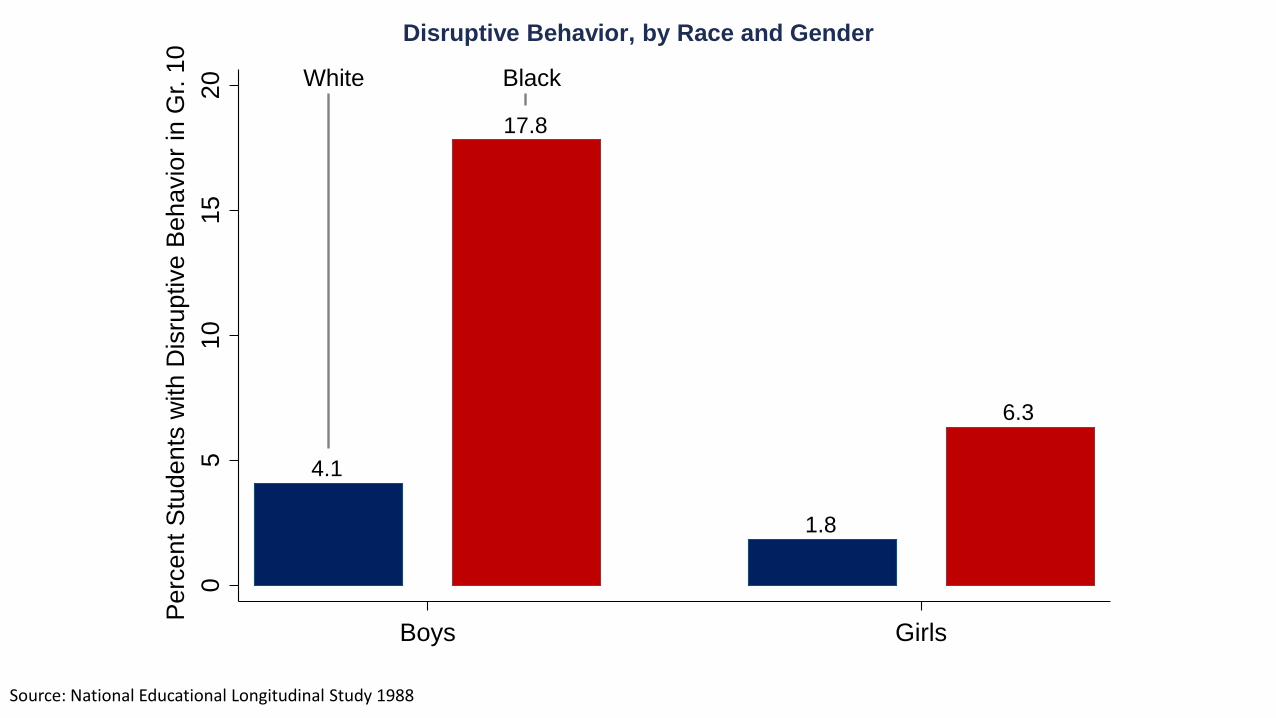
Disruptive Behavior, by Race and Gender
4.1
17.8
1.8
6.3
White Black
05
10
15
20
Perc
ent
Stu
dents
with D
isru
ptive B
ehavio
r in
Gr.
10
Boys Girls
Source: National Educational Longitudinal Study 1988
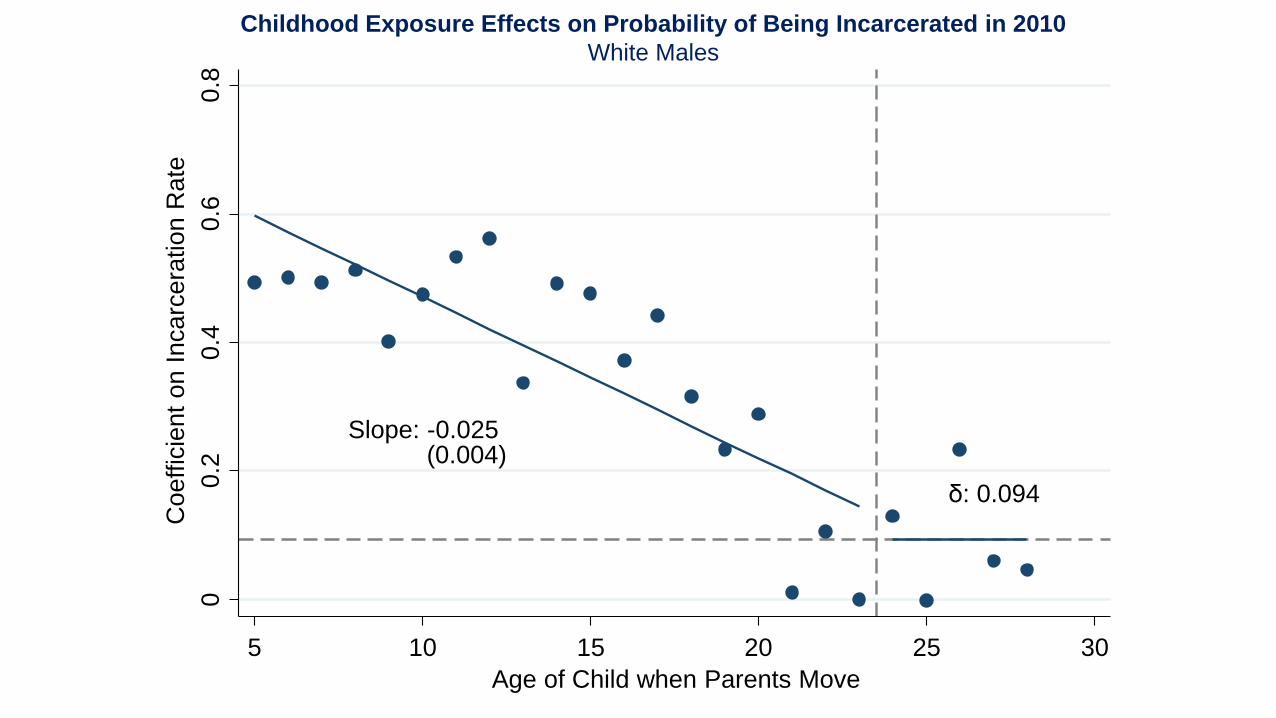
Childhood Exposure Effects on Probability of Being Incarcerated in 2010
White Males
Slope: -0.025(0.004)
δ: 0.094
00
.20
.40
.60
.8
Coeffic
ient
on I
ncarc
era
tion R
ate
5 10 15 20 25 30
Age of Child when Parents Move
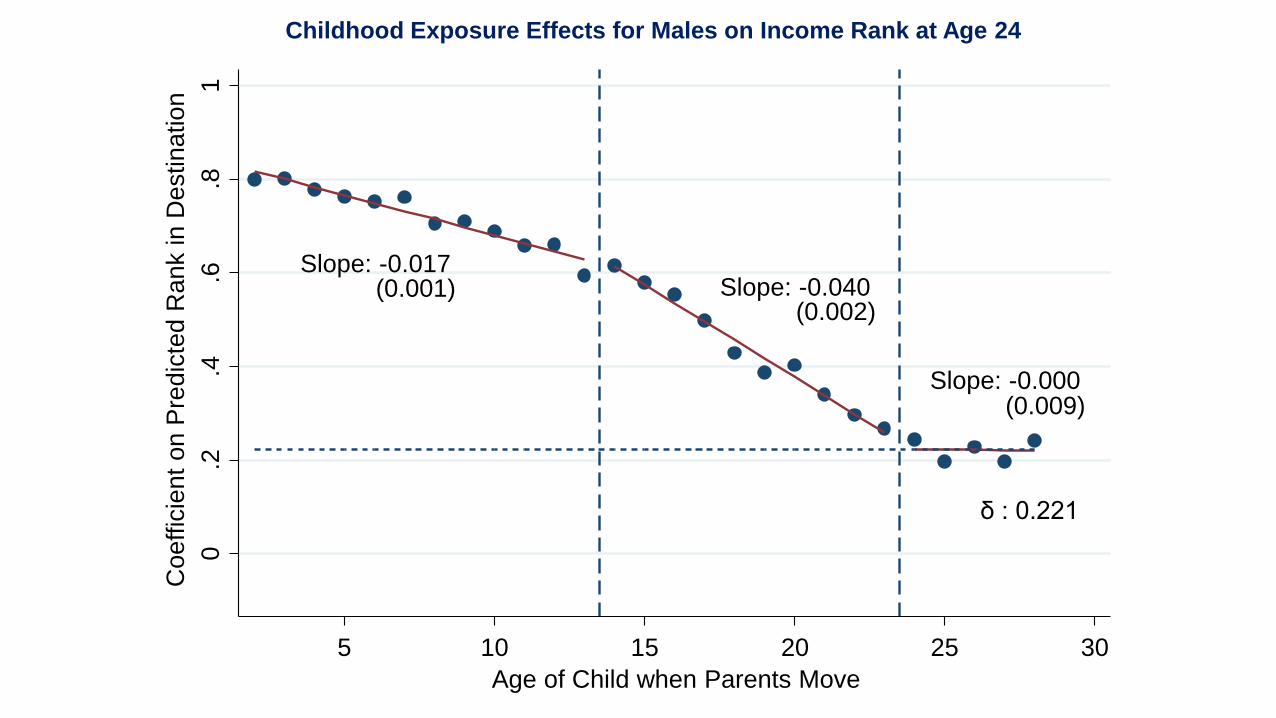
Slope: -0.017(0.001) Slope: -0.040
(0.002)
Slope: -0.000(0.009)
δ : 0.221
0.2
.4.6
.81
Coeffic
ient
on P
redic
ted
Rank in D
estinatio
n
5 10 15 20 25 30
Age of Child when Parents Move
Childhood Exposure Effects for Males on Income Rank at Age 24
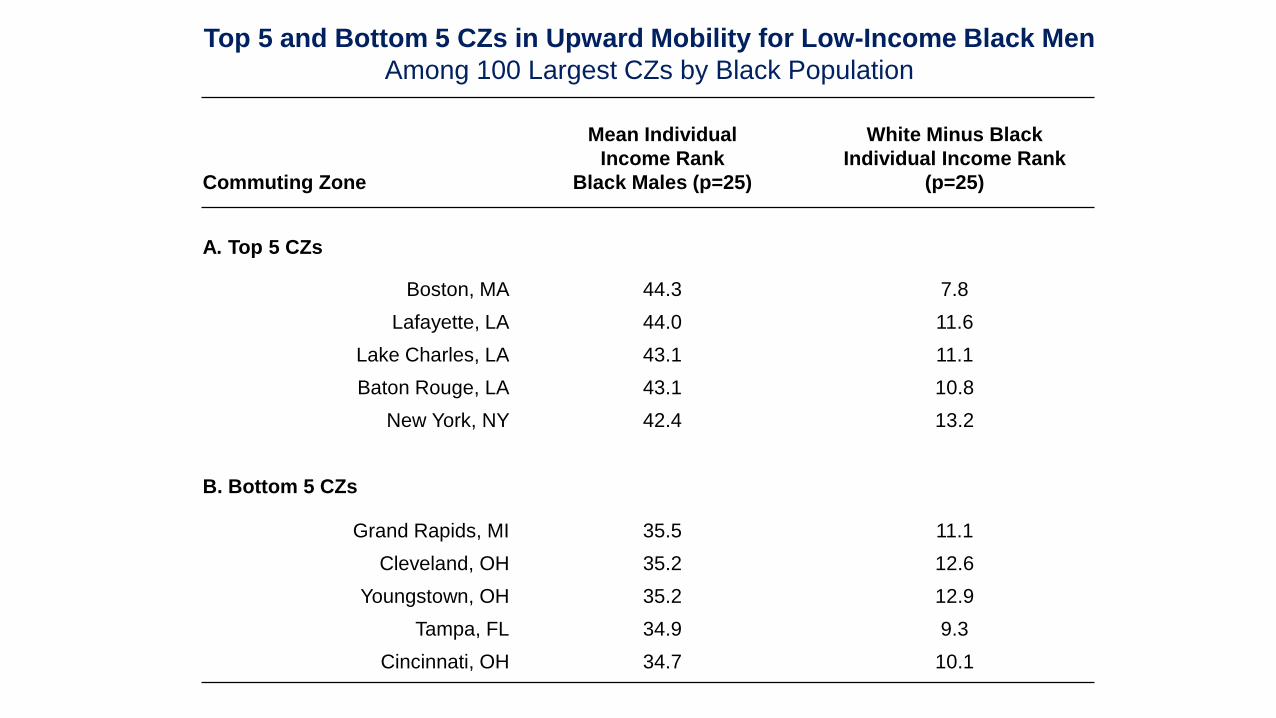
Top 5 and Bottom 5 CZs in Upward Mobility for Low-Income Black Men
Among 100 Largest CZs by Black Population
Commuting Zone
Mean Individual
Income Rank
Black Males (p=25)
White Minus Black
Individual Income Rank
(p=25)
A. Top 5 CZs
Boston, MA 44.3 7.8
Lafayette, LA 44.0 11.6
Lake Charles, LA 43.1 11.1
Baton Rouge, LA 43.1 10.8
New York, NY 42.4 13.2
B. Bottom 5 CZs
Grand Rapids, MI 35.5 11.1
Cleveland, OH 35.2 12.6
Youngstown, OH 35.2 12.9
Tampa, FL 34.9 9.3
Cincinnati, OH 34.7 10.1