Embed Size (px)
Citation preview
RACE AND DRUG LAW ENFORCEMENT IN SEATTLE
Prepared on behalf of the Defender Association’s Racial Disparity Project Seattle, Washington
by
Katherine Beckett Associate Professor
Department of Sociology and Law, Societies & Justice Program University of Washington, Seattle
May 3, 2004

TABLE OF CONTENTS
Introduction……………………………………………………………………….. 1 Summary of Key Findings…………………………………………………….... 6 Methodology………………………………………………………………………… 9 Part I: Assessing Seattle’s Drug Market Characteristics…………………. 13 Estimating the Distribution of Drug Transactions…………………. 14 Race/Ethnicity of Recent Drug Users…………………………………. 20 DASA Household Survey Data………………………………….. 21 Mortality Data………………………………………………………. 23 Emergency Department (DAWN) Data……………………….. . 24
Seattle Needle Exchange Survey………………………………… 25 Race/Ethnicity of Seattle’s Drug Deliverers………………………….. 31
Drug Delivery among Drug Users………………………………. 32 Drug Purchasing Patterns………………….. …………………… 34 Seattle Needle Exchange Study……………………..…………… 37
Drug Delivery Arrests in Seattle…………………………………………. 45 Buy-Bust Operations……………………………………………….. 54 Prioritizing the West Precinct……………………………………… 56 The Focus on Outdoor Markets………………………………….. 58
Part II: Explaining Racial Disparity in Drug Delivery Arrests…………….. 66 Community Complaints …………………………………………… 67
Crime Rates…………………………………………………………… 70 Understanding the Focus on Crack Cocaine…………………………. 76 The Characteristics of the Crack Market………………………. 78 Violence and the Crack Market………………………………….. 82 Crack Cocaine and Public Health………………………………… 84 Conclusion…………………………………………………………………………… 86 References…………………………………………………………………………….. 88 Appendix A. Drug Market Characteristics and Estimated Distribution of Drug Transactions—Unadjusted Calculations…………………………………. 93 Appendix B. Narcotics Sales Arrests per 100,000 Population, 2000……… 94
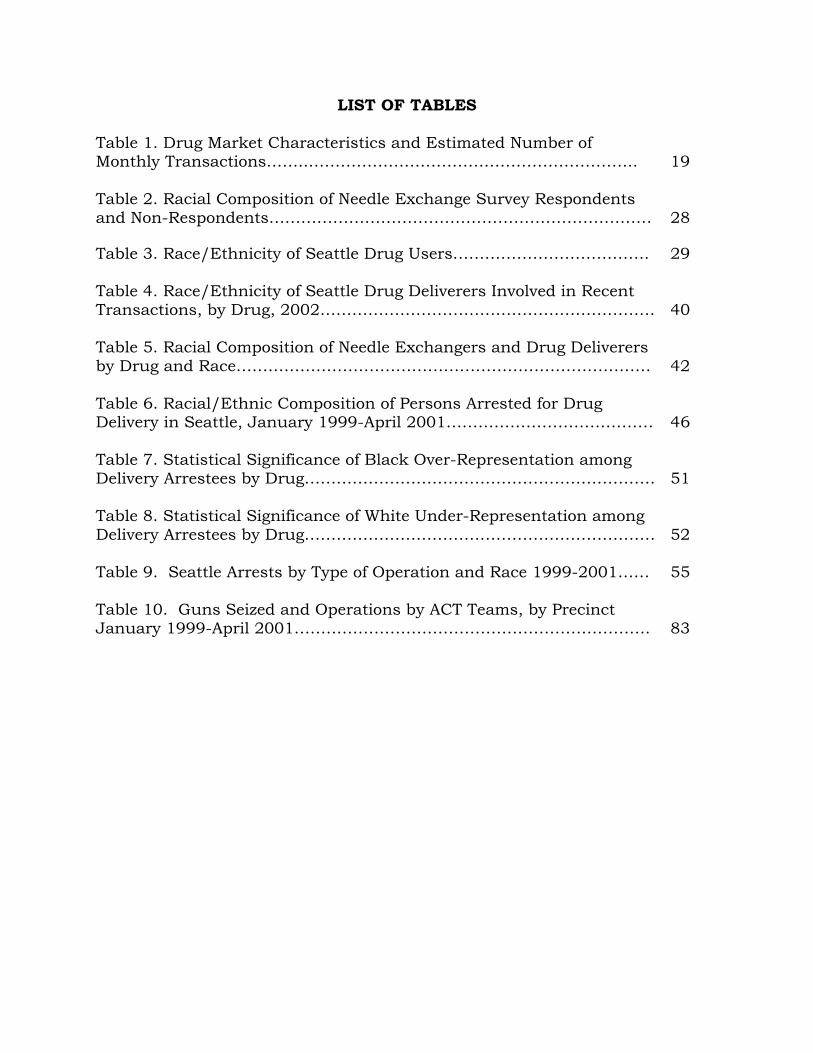
LIST OF TABLES Table 1. Drug Market Characteristics and Estimated Number of Monthly Transactions……..…………………………………………………….. 19 Table 2. Racial Composition of Needle Exchange Survey Respondents and Non-Respondents……………………………………………………………… 28 Table 3. Race/Ethnicity of Seattle Drug Users………………………………. 29 Table 4. Race/Ethnicity of Seattle Drug Deliverers Involved in Recent Transactions, by Drug, 2002……………………………………………………… 40 Table 5. Racial Composition of Needle Exchangers and Drug Deliverers by Drug and Race…………………………………………………………………… 42 Table 6. Racial/Ethnic Composition of Persons Arrested for Drug Delivery in Seattle, January 1999-April 2001………………………………… 46 Table 7. Statistical Significance of Black Over-Representation among Delivery Arrestees by Drug………………………………………………………… 51 Table 8. Statistical Significance of White Under-Representation among Delivery Arrestees by Drug………………………………………………………… 52 Table 9. Seattle Arrests by Type of Operation and Race 1999-2001…… 55
Table 10. Guns Seized and Operations by ACT Teams, by Precinct January 1999-April 2001…………………………………………………………. 83
LIST OF FIGURES
Figure 1. Purposeful Seattle Drug Delivery Arrests by Race/Ethnicity, 1999-2001…………………………………………………………………………… 8 Figure 2. Purposeful Drug Delivery Arrests by Drug, 1999-2001……… 47 Figure 3. Black Drug Deliverers Compared with Purposeful Black Delivery Arrestees………………………………………………………………….. 48 Figure 4. White Drug Deliverers Compared with Purposeful White Delivery Arrestees…………………………………………………………………… 49 Figure 5. Purposeful Seattle Drug Delivery Arrests by Precinct and Race,1999-2001……………………………………………………………………… 56 Figure 6. Percent of Purposeful Delivery Arrests Involving Crack by Precinct, 1999-2001………………………………………………………………… 57 Figure 7. Purposeful Drug Delivery Arrests by Location and Precinct, 1999-2001……………………………………………………………………………. 60 Figure 8. Purposeful Drug Delivery Arrests by Race and Type of Location,1999-2001………………………………………………………………… 61 Figure 9. Purposeful Seattle Drug Delivery Arrests versus Citizen Complaints by Type of Location, 1999-2001…………………………………… 68 Figure 10. Purposeful Drug Delivery Arrests versus Citizen Complaints by Precinct, 1999-2001……………………………………………………………… 69 Figure 11. Correlation between Crimes Known to the Police and Drug Delivery Arrests……………………………………………………………… 72 Figure 12. Seattle Census Tracts with High and Low Numbers of Purposeful Drug Delivery Arrests………………………………………………… 74 Figure 13. Distribution of Outdoor Monthly Exchanges Compared with Purposeful Drug Arrests, by Drug…........................................................ 80
INTRODUCTION
RACE AND DRUG LAW ENFORCEMENT IN SEATTLE
INTRODUCTION
Between 1980 and 2002, the number of people incarcerated in the
United States increased from approximately 500,000 to over 2 million. This
trend has sharply and disproportionately affected racial and ethnic minorities:
over 60% of today’s inmates are black and/or Latino (Sentencing Project, n.d).1
Many analysts have suggested that the policies and practices associated with
the war on drugs are an important cause of these developments (e.g. Blumstein
1993; Duster 1997; Tonry 1995).
The available evidence supports this contention. The number of annual
drug arrests in the United States nearly tripled in recent decades, from
581,000 in 1980 to over 1.5 million in 1997, and has since stabilized at
approximately 1.1 million per year (Sentencing Project 2001; Federal Bureau of
Investigation 2002). At the same time, the national black drug arrest rate
increased from roughly 650 to 2,907 per 100,000 persons in 2000. The drug
abuse arrest rate for whites increased much less dramatically during this
period, from approximately 350 to 463 per 100,000 persons (Donziger et al
1
1 Throughout the report, the terms “black" and “Latino” will be used unless data collectors or survey respondents use other terms. In the context of Seattle, the term “black” (rather than “African-American”) is preferable, for two reasons. First, it is the term used by SPD officers themselves in the Incident Reports analyzed. Second, Seattle is home to comparatively large African immigrant communities, significant Afro-Latino communities, as well as Asian or Pacific Islanders who are either labeled black or who self-identify as black but who are not African-American. Although used by the SPD, the term "Hispanic" typically means Spanish-speaking, a characteristic that is not and cannot be evaluated from any of the data in the report. The more inclusive term “Latino” refers more broadly to ethnic identity, and will be used except where referring to data sources that employ the term Hispanic.
INTRODUCTION
1996; U.S. Department of Justice 2003). Thus, the black arrest rate grew by a
comparatively large margin, and the disparity between the black and white
drug arrest rates increased substantially.
These developments have clearly impacted the size and complexion of the
prison and jail populations. Over the course of the 1990s, drug offenses
accounted for 27% of the increase in the black state prison population, but
only 14% of the increase in the white prison population (Kennedy 2003). The
number of inmates serving time for drug offenses rose by over 1000% between
1980 and 1999, and nearly 80% of those serving time in state prison for drug
offenses are black and/or Latino (King and Mauer 2002).
2
It is thus quite clear that the war on drugs has intensified racial
disparities in the prison and jail populations. Exactly how and why this is the
case is less obvious. Theoretically, the dramatic impact of the war on drugs on
the black and Latino communities may be a consequence of higher rates of
drug law violations, qualitative differences in offending behavior, selective
enforcement of drug laws, and/or post-arrest practices and policies. Most
analysts have directed their attention to the latter, examining whether
prosecutorial discretion and/or judicial decision-making contribute to racially
disparate rates of drug-related incarceration. Many of these studies have found
that black drug defendants are treated more harshly than white drug
defendants once in the justice system (see Austin & Allen 2000; Blumstein
1993; Spohn 2000; Tonry 1995). In Washington State, however, there is
evidence that the differential impact of the war on drugs on black and Latino
INTRODUCTION
communities is not a consequence of differential treatment after arrest
(Minority & Justice Commission Report 1999).2 Possible explanations of
comparatively high rates of drug-related incarceration among blacks resident to
the Seattle area therefore include higher rates of offense behavior, qualitative
differences in offending behavior, and/or the selective enforcement of drug
laws.
This report analyzes a wide range of data sources in order to assess
whether blacks are over-represented among those arrested for delivering
serious drugs in Seattle, and, if so, why. Doing so requires analyzing Seattle’s
drug markets and estimating the racial composition of Seattle’s drug-delivering
populations. This information can then be compared with Seattle Police
Department arrest statistics to determine whether or not blacks are over-
represented, and whites under-represented, among those arrested for narcotics
delivery (or possession with intent to deliver narcotics).
This study was commissioned by the Defender Association’s Racial
Disparity Project, and will be submitted in the case of State of Washington v.
Johnson et al. However, the conclusions reached are based on an independent
review of the available evidence. The defendants in this case were charged
3
2 This report examined the role of race and ethnicity in the processing and sentencing of felony drug offenders in King, Yakima, and Pierce counties. The authors found “no evidence that race and ethnicity are important factors affecting charging decisions for drug offenders (p.2) but also suggested “further study should be done of law enforcement practices” (p. 70). This conclusion was primarily based on the finding that arrest rates roughly correspond to conviction rates among various racial/ethnic groups. However, some have criticized the methodology used in this study (see Davies 2003).
INTRODUCTION
under Washington’s Uniform Controlled Substances Act3 and have been
arrested for delivery of heroin or cocaine. At the time of their arrest, delivery of
heroin and cocaine (including both powder and crack cocaine) was classified by
the state legislature at Level 8 of Washington’s felony sentencing grid. The
report focuses on these two drugs. It also includes methamphetamine and
ecstasy,4 delivery of which is considered by the state legislature to be of equal
or greater seriousness than delivery of heroin or cocaine.5 Throughout the
report, these drugs are referred to as “serious drugs.”
Part 1 of the report assesses the magnitude and characteristics of
Seattle’s ecstasy, methamphetamine, heroin, crack cocaine, and powder
cocaine markets.6 Evidence pertaining to the racial/ethnic composition of
recent users and deliverers of serious drugs in the Seattle area is also
analyzed. The picture of Seattle’s drug markets that emerges from this analysis
is then compared with Seattle Police Department arrest outcomes. This
comparison indicates that blacks are significantly over-represented, and whites
under-represented, among those arrested for delivering serious drugs in
Seattle. The subsequent analysis of SPD practices and arrest outcomes
indicates that this disparity is the result of several inter-related factors. First,
3 Rev. Code Wash. (ARCW) § 69.50.401 (2003). 4 Ecstasy is included in the analysis because it is arguable that the legislature treats it comparably to cocaine and heroin. However, removing ecstasy from the analysis does not substantively alter the findings or conclusions. 5 Possession with intent to deliver any of these four substances is also considered to be of equal seriousness as actual delivery of these substances. The analysis of the arrest data will therefore include arrests for delivery and possession with intent to deliver (PWI). These two offenses are grouped together as “delivery” arrests.
4
6 Throughout the report, the term “cocaine” in includes both powder and crack cocaine. Where appropriate, the type of cocaine involved is specified.
INTRODUCTION
the SPD focuses overwhelmingly on racially diverse drug venues downtown
where crack is more likely to be sold than on other markets, focuses on crack
within those markets, and largely ignores predominantly white outdoor drug
venues where heroin dominates. In addition, blacks are disproportionately
arrested in both outdoor and indoor settings. As a result, blacks are
significantly over-represented, and whites significantly under-represented,
among heroin arrestees. The widespread and selective use of buy-bust
operations, the concentration of resources in the West Precinct, and the focus
on outdoor drug markets lead to large numbers of black arrests, but are not
primary causes of racial disparity in drug delivery arrests.
Part II considers whether the disparity between the racial composition of
those who deliver serious drugs in Seattle and the racial composition of those
who are arrested for this crime can be explained in racially neutral terms. In
particular, this section considers whether SPD arrest outcomes are a function
of the concentration of drug law enforcement in high crime areas or reflect the
distribution of citizen complaints. It also considers whether the focus on crack
cocaine is explicable in racially neutral terms. On the basis of the evidence
considered, the report concludes that there is no known racially neutral
explanation for racially disparate drug delivery arrest rates.
SUMMARY OF KEY FINDINGS
5
This report addresses two questions. First, is there a racial disparity
between those arrested for delivering serious drugs and the racial composition
SUMMARY OF KEY FINDINGS
of those actually delivering these controlled substances in Seattle? Specifically,
are blacks over-represented, and whites under-represented, among those
arrested for delivery of these substances given the rate at which blacks and
whites engage in drug delivery? Key findings include:
• In Seattle, a majority of recent users of serious drugs, with the possible
exception of crack cocaine, are white. All available data sources indicate
that blacks comprise a smaller percentage of recent users of these drugs,
again with the possible exception of crack.
• The majority of Seattle needle exchangers surveyed obtained their drugs
(primarily heroin, methamphetamine, and cocaine) from a white person;
much smaller percentages reported obtaining those substances
(especially heroin and methamphetamine) from a black person.
• 64.2% of those purposefully arrested7 for delivery of serious drugs,
including heroin, methamphetamine, powder cocaine, crack cocaine, and
ecstasy, in Seattle from January 1999-April 2001 were black.
• Approximately one-third of Seattle’s outdoor drug transactions involve
crack cocaine.
• By contrast, the vast majority (over 74%) of purposeful drug delivery
arrests involved crack cocaine, and 79% of those purposefully arrested
for delivering crack cocaine were black. This focus on crack is thus a
leading cause of racial disparity in drug delivery arrests.
7 Arrests that were the result of buy-bust operations, reverse buy-bust operations, search warrants, and other narcotics investigations were classified as “purposeful.” This classification is discussed in more detail in the methodology section.
6
SUMMARY OF KEY FINDINGS
• Blacks are also over-represented among heroin delivery arrestees given
evidence regarding the rate at which blacks deliver that substance.
In sum, the available evidence indicates that the majority of those who
deliver serious drugs in Seattle are white, and that a smaller percentage of
those who do so are black. And yet, according to Seattle Police Department
arrest records, 64.2% percent of those purposefully arrested for this crime from
January 1999-April 2001 were black; 14.1% were Latino, and 17.6% were
white (see Figure 1).8 This disparity assumes even greater significance in light
of evidence that the Seattle Police Department conducts significantly more drug
delivery arrests than comparably sized cities around the United States (see
Appendix B).
8 These percentages are nearly identical if we include all (rather than just purposeful) arrests. Specifically, 64.2% of those arrested in all operations were black; 17.5% were white, and 14% were Latino.
7
SUMMARY OF KEY FINDINGS
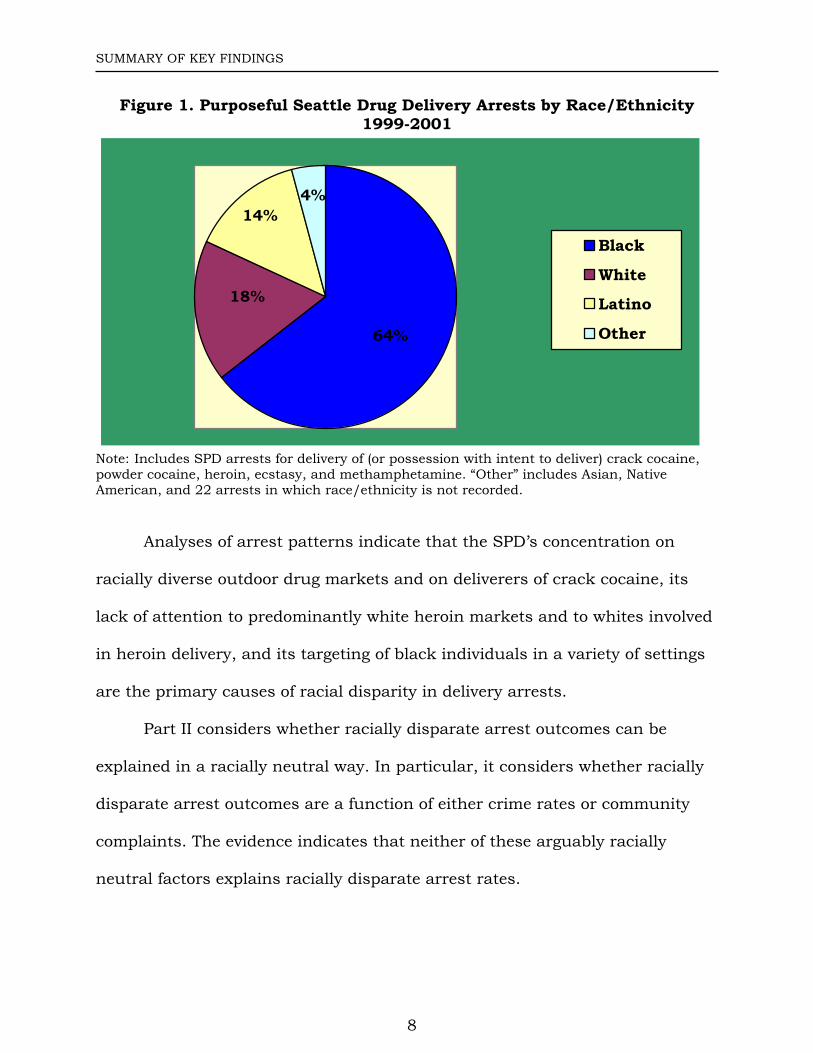
Figure 1. Purposeful Seattle Drug Delivery Arrests by Race/Ethnicity 1999-2001
4%14%
18%
64%
Black
White
Latino
Other
Note: Includes SPD arrests for delivery of (or possession with intent to deliver) crack cocaine, powder cocaine, heroin, ecstasy, and methamphetamine. “Other” includes Asian, Native American, and 22 arrests in which race/ethnicity is not recorded.
Analyses of arrest patterns indicate that the SPD’s concentration on
racially diverse outdoor drug markets and on deliverers of crack cocaine, its
lack of attention to predominantly white heroin markets and to whites involved
in heroin delivery, and its targeting of black individuals in a variety of settings
are the primary causes of racial disparity in delivery arrests.
Part II considers whether racially disparate arrest outcomes can be
explained in a racially neutral way. In particular, it considers whether racially
disparate arrest outcomes are a function of either crime rates or community
complaints. The evidence indicates that neither of these arguably racially
neutral factors explains racially disparate arrest rates.
8
SUMMARY OF KEY FINDINGS
Part II also considers whether the SPD’s focus on those involved in the
crack cocaine market can be explained in racially neutral ways. Race-neutral
explanations of the focus on crack might include the comparative frequency
and location of crack transactions, any unique association of the crack trade
with violence, and public health considerations. The evidence indicates that
none of these factors explain or justify the SPD focus on crack cocaine. It
therefore appears that neither the focus on crack nor the over-representation of
blacks among arrestees more generally can be explained in racially neutral
terms.
METHODOLOGY
Determining whether or not the laws prohibiting the delivery of illegal
narcotics are enforced in a selective manner requires assessing the size and
nature of the various drug markets in Seattle, and comparing the race of those
arrested for delivery of serious drugs with the race of those delivering these
same substances. Because of the illicit nature of the activity and the associated
difficulty of gaining access to all sites where the activity occurs, it is not
possible to observe a representative sample of all drug transactions in Seattle
and to identify the drugs and race/ethnicity of the persons involved. This does
not mean, however, that the nature of each drug market and the demographic
profile of those who deliver serious drugs in Seattle cannot be reliably
assessed.
9
METHODOLOGY
Using multiple indicators of phenomena (like drug delivery) that are not
directly observable to estimate characteristics of those phenomena is quite
common in the social sciences. Such estimates often serve as the basis for
important public policy and funding decisions. For example, multiple
indicators are used to estimate rates of illegal immigration, the volume of illegal
drugs produced, the incidence of underage drinking, the prevalence of certain
diseases, and many other phenomena that escape direct measurement. In such
cases, it is desirable that estimates be based on a wide range of data sources
and methodologies. Often referred to as “triangulation”, the combining of data
sources and methodologies allows researchers to be more confident of their
findings and conclusions. The results that accrue from this kind of process are
considered more reliable when the data sources are consistent with each other
(Jick 1979; Schutt 1996).
Toward this end, this report considers a wide range of data sources in
order to assess the nature of Seattle’s drug markets and to estimate the racial
composition of those who deliver serious drugs in Seattle. First, the relative size
of each drug market is assessed and the frequency with which each drug is
obtained is estimated. A variety of data sources are then used to estimate the
racial composition of Seattle’s recent users of serious drugs. Next, survey
results regarding the race/ethnicity of Seattle’s deliverers of cocaine, heroin,
and methamphetamine are considered. These data indicate that a majority of
those delivering these substances are white and that there is a significant
10
METHODOLOGY
degree of correspondence between the racial composition of the drug-using and
drug-delivering populations.
To ascertain the racial composition of those arrested for delivery of the
serious drugs under consideration here, SPD arrest records were coded along
numerous dimensions, including race of person arrested, the drug involved,
crime of arrest, type of operation, precinct, type of location, and other relevant
factors. Because police officers are not asked to record the ethnicity of
arrestees on their Incident Reports, the percent of the arrestees who are Latino
was estimated using a method called Hispanic surname analysis.9 A numeric
value between 0 and 1 was assigned to all arrestees initially coded as white in
each sub-category (for example, delivery arrestees citywide, cocaine delivery
arrestees in the West Precinct, etc). These numeric values are provided by the
U.S. Census Department, and represent the probability that a given surname
corresponds to persons who identified as Hispanic/Latino in the 1990 U.S.
Census. For each analysis, the mean of these numeric values (e.g. .18, or 18%)
was used to estimate the percent of whites that are Latino. This percentage was
then subtracted from the white category and added to a separate Latino
category.10
9 This method is described in detail in “Building a Spanish Surname List for the 1990’s—A New Approach to an Old Problem”, by Word and Perkins (1996), and is now widely used by social scientists and policy analysts.
11
10 This methodology was applied only to those coded as white in order to avoid double-counting people of color, i.e. counting a black Latino as black and Latino. As a result, black Latinos are included in the black category, but not the Latino category. Although SPD officers are asked not to record the ethnicity of suspects, some did identify the suspect in their Incident Report as “Hispanic.” The percent Latino that resulted from the surname analysis was added to those identified as Hispanic by SPD officers.
METHODOLOGY
In what follows, analyses of “purposeful” narcotics delivery (and
possession with intent to deliver) arrests are presented in the text, tables, and
figures. Arrests that were the result of buy-bust operations, reverse buy-bust
operations, search warrants, and other narcotics investigations were classified
as “purposeful.” Arrests that were the result of other types of operations—“see-
pops” (police observations), traffic stops, and other criminal investigations—
may include some purposeful arrests, but the data coders were not asked to
make this potentially complex determination. Thus, to be cautious, arrests that
resulted from these latter operation types were not classified as “purposeful.”
Separate analyses based on all arrests are also presented, usually in an
adjacent footnote.
12
PART I. ASSESSING SEATTLE’S DRUG MARKET CHARACTERISTICS
PART 1. ASSESSING SEATTLE’S DRUG MARKET CHARACTERISTICS
13
PART I. ASSESSING SEATTLE’S DRUG MARKET CHARACTERISTICS
Estimating the Distribution of Drug Transactions
Assessing the size and characteristics of Seattle’s drug markets involves
estimating the number of recent users of each substance. Unfortunately,
Seattle-specific, drug use prevalence data are not available. However, National
Substance Abuse and Mental Health Services Administration (SAMHSA)
estimates of the number of users of each substance nation-wide can be used
to estimate the number of recent drug users in Seattle. When divided by the
number of U.S. residents aged 12 and older11, these data indicate that in the
year 2000, .416% of the U.S. population aged 12 and older used
hallucinogens in the past month; .406% used powder cocaine; .337% used
stimulants; .166% used methamphetamine, .113% used crack cocaine; and
.056% used heroin (SAMHSA 2001a, Table F1).12 National estimates of past-
month ecstasy use were not available until 2002, at which time .3% of the
U.S. population aged 12 or older reported using ecstasy in the past month
(SAMHSA 2003). In 2000, only 1.8% of the nation’s recent illicit drug users
had used crack in the past month (SAMHSA 2001a).
Indicators of drug use from the Seattle area suggest that drug use is
comparatively widespread in Seattle, and that local drug use patterns diverge
somewhat from the national pattern somewhat. For example, according to
11 U.S. Census data indicate that there were 233,519,590 persons aged 12 and older residing in the United States in the year 2000. This number was calculated by subtracting the number of persons aged 9 and under, as well as 40% of the number of persons aged 10 to 14 years, from the total number of U.S. residents (U.S. Census Bureau, Census 2000 Summary File 4, Table QT-P1, “Age Groups and Sex: 2000”).
14
12 These data are available online at http://www.samhsa.gov/oas/NHSDA/2kNHSDA/appendixf1.htm
PART I. ASSESSING SEATTLE’S DRUG MARKET CHARACTERISTICS
Washington State 1998 Household Survey (DASA) data, 6,531 King County
adults reported using cocaine (powder or crack) in the past 30 days, but
10,661 reported using stimulants (including methamphetamine and
amphetamines) in the same time period (DASA 1998).13 Given evidence that
past-month powder cocaine users outnumber past month crack users by
approximately 4 to 1, the Washington Household Survey (DASA) data indicate
that stimulant users outnumber crack users in the Seattle area by an even
larger margin than suggested by the national data. Similarly, in the year 2000,
the Seattle metropolitan area had the fourth highest rate of Emergency
Department methamphetamine mentions in the country and the seventh
highest rate of Emergency Department cocaine mentions (SAMHSA 2001b).
Seattle has also gained notoriety for the severity of its heroin and ecstasy
problems. In 2000, Seattle (and New York City) had the fifth highest rates of
Emergency Department heroin mentions (SAMHSA 2001b). Similarly, in 2001,
Seattle had the second highest rate of emergency room reports of ecstasy use
(Seattle Times, November 20, 2002; see also Morris 2001).
The NIJ’s ADAM data provide further evidence of comparatively
widespread cocaine, heroin and methamphetamine use in King County. The
ADAM data include the results of urinalysis tests and interviews with a sample
15
13 In 1993-4, the Division of Alcohol and Substance Abuse (DASA) at the Washington State Department of Social and Human Services conducted the Washington Needs Assessment Household Survey to determine the prevalence of drug and alcohol use and abuse in the state of Washington. Since that time, researchers at the University of Texas have extrapolated the original results to estimate the prevalence of drug use and abuse among various racial/ethnic groups in the state and each of its counties for subsequent years. The 1998 data are based on these extrapolations.
PART I. ASSESSING SEATTLE’S DRUG MARKET CHARACTERISTICS
of male arrestees in metropolitan areas around the country regarding their
drug use and drug market participation (see Taylor et al 2001). Those tested
and interviewed in the ADAM studies were arrested for a variety of offenses,
including violent crimes, property crimes, DUIs, and drug offenses. According
to these data, King County arrestees have higher rates of drug use than most
other metropolitan areas studied; King County is therefore classified as one of
the four most active drug market sites in the country. Specifically, in 2000,
male King County arrestees were 1.4 times more likely to report obtaining
powder cocaine in the past month than male arrestees from all jurisdictions
surveyed; 1.5 times more likely to report obtaining crack cocaine; 2.3 times as
likely to report obtaining heroin; and 3.5 times as likely to report acquiring
methamphetamine. In the analysis that follows, SAMHSA’s national prevalence
estimates are applied to the Seattle population and then adjusted by these
figures to reflect the particularities of Seattle-area drug markets.14
16
14 The drug market participation of Seattle (as opposed to King County) arrestees would provide a more direct measure of the particularities of the Seattle drug market, and ADAM survey results for King County arrestees arrested by the Seattle Police Department are available. This subset is used in many of the analyses below. However, when adjusting the estimated number of users, it is more appropriate to use the differences between King County arrestees and the national results because the other jurisdictions surveyed by ADAM are metropolitan areas rather than cities. Comparing only SPD arrestees with the national results would therefore be akin to comparing apples and oranges. Using the King County data does, however, introduce some biases. In particular, SPD arrestees are 1.2 times as likely to report acquiring powder cocaine, 1.3 times as likely to report obtaining crack cocaine, and 1.5 times as likely to report acquiring heroin in the past month as all King County arrestees. On the other hand, King County arrestees as a group were 1.2 times more likely to report obtaining methamphetamine than were King County respondents who were arrested by the Seattle Police Department. Because the results for King County arrestees as a whole are used to adjust the estimated number of users of each substance in Seattle, the estimated number of users shown in Table 1 likely overestimates the number of methamphetamine users and underestimates the number of users of the other substances, especially heroin.
PART I. ASSESSING SEATTLE’S DRUG MARKET CHARACTERISTICS
Obtaining information regarding rates of drug use (i.e. prevalence) is only
a first step toward an assessment of drug market characteristics. Some drugs
tend to be used more frequently than others, and some are more likely to be
purchased outdoors. In particular, there is evidence that crack users obtain
that drug more frequently than users of some other drugs, and are more likely
to obtain that drug outdoors (see Sterling 1997; Riley 1997). Estimating the
distribution of drug offenses by drug type requires combining information
regarding the prevalence of drug use with information regarding the frequency
and location of crack transactions. That is, the distribution of outdoor
transactions involving various drugs is a function of the number of users as
well as the frequency with which those users acquire each substance and the
likelihood that they do so outdoors.
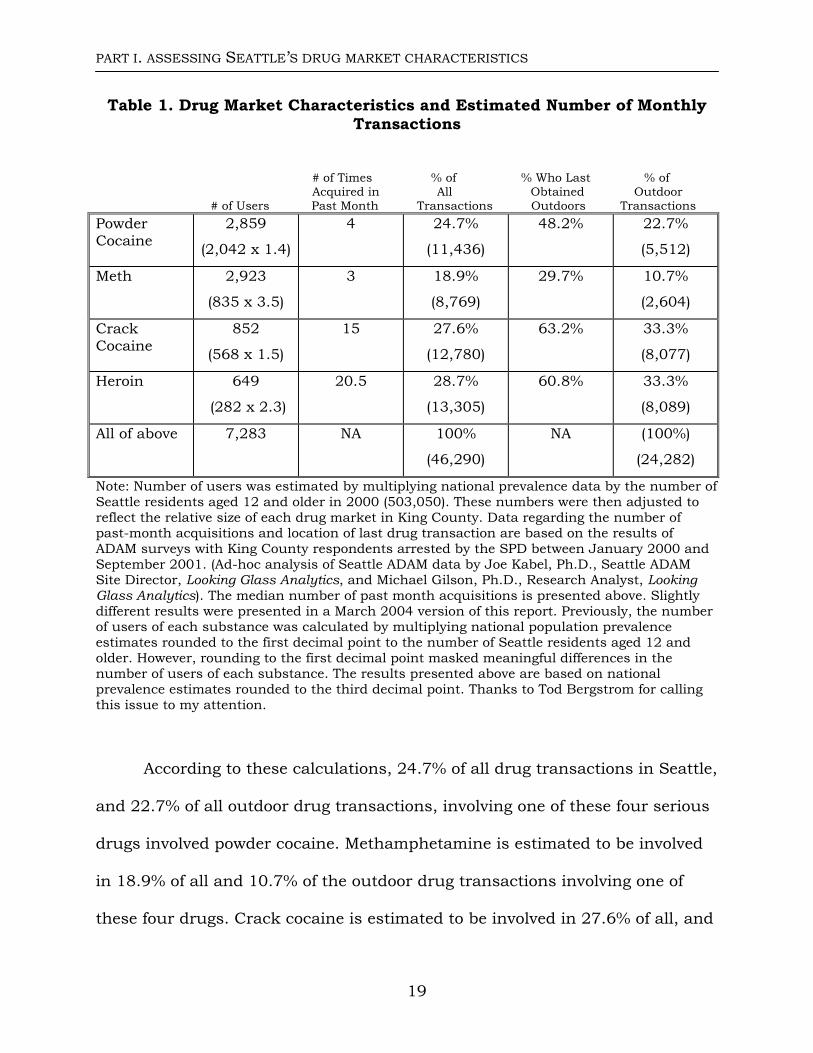
Table 1 combines such information to estimate the number of monthly
transactions involving heroin, methamphetamine, powder cocaine, and crack
cocaine in Seattle. The number of all transactions and outdoor transactions
involving each drug are estimated. Unfortunately, information regarding the
frequency and location of transactions involving ecstasy is not available.
In the first column of Table 1, SAMHSA data regarding the percentages of
the U.S. population aged 12 or older that used each substance in the past 30
days are multiplied by the number of Seattle residents aged 12 and older to
17
PART I. ASSESSING SEATTLE’S DRUG MARKET CHARACTERISTICS
estimate the number of recent drug users in Seattle.15 These numbers are then
adjusted by the difference between the King County and national ADAM data.
For example, the estimated number of current powder cocaine users derived
from national prevalence data is multiplied by 1.4 to reflect the higher rates of
powder cocaine use in the Seattle/King County area.16
Data regarding the frequency with which users of each substance obtain
each drug and the likelihood that these acquisitions are made outdoors are
taken from the NIJ’s ADAM survey of adult males arrested in King County by
the Seattle Police Department between January 2000 and September 2001. It
is possible that arrestees who use illegal drugs obtain them more frequently
than persons who are not arrested. However, there is no evidence that this is
more or less true for particular drugs. These data therefore allow us to compare
the relative frequency with which each drug is obtained.
The estimated number of transactions is calculated by multiplying the
number of recent users by the number of times Seattle arrestees obtained each
drug in the past month. The number of outdoor transactions is then calculated
by multiplying the number of monthly transactions by the proportion of King
County ADAM respondents arrested by the SPD who reported making their last
transaction outdoors. 15 According to Seattle census data, there were 503,050 persons aged 12 and older residing in Seattle in the year 2000. Seattle census population estimates for the year 2000 are available online at http://www.census.gov/population/www/index.html The American Factfinder tool was used to generate a two-by-two table of the Seattle population by race and age. Data are on file with the author.
18
16 See Appendix A for the results obtained if the number of current Seattle users is not adjusted by the difference between the King County and national ADAM results and national data regarding the frequency and location of drug acquisitions are used.
PART I. ASSESSING SEATTLE’S DRUG MARKET CHARACTERISTICS
Table 1. Drug Market Characteristics and Estimated Number of Monthly Transactions
# of Times % of % Who Last % of Acquired in All Obtained Outdoor
# of Users Past Month Transactions Outdoors Transactions Powder Cocaine
2,859
(2,042 x 1.4)
4 24.7%
(11,436)
48.2% 22.7%
(5,512)
Meth 2,923
(835 x 3.5)
3 18.9%
(8,769)
29.7% 10.7%
(2,604)
Crack Cocaine
852
(568 x 1.5)
15 27.6%
(12,780)
63.2% 33.3%
(8,077)
Heroin 649
(282 x 2.3)
20.5 28.7%
(13,305)
60.8% 33.3%
(8,089)
All of above 7,283 NA 100%
(46,290)
NA (100%)
(24,282)
Note: Number of users was estimated by multiplying national prevalence data by the number of Seattle residents aged 12 and older in 2000 (503,050). These numbers were then adjusted to reflect the relative size of each drug market in King County. Data regarding the number of past-month acquisitions and location of last drug transaction are based on the results of ADAM surveys with King County respondents arrested by the SPD between January 2000 and September 2001. (Ad-hoc analysis of Seattle ADAM data by Joe Kabel, Ph.D., Seattle ADAM Site Director, Looking Glass Analytics, and Michael Gilson, Ph.D., Research Analyst, Looking Glass Analytics). The median number of past month acquisitions is presented above. Slightly different results were presented in a March 2004 version of this report. Previously, the number of users of each substance was calculated by multiplying national population prevalence estimates rounded to the first decimal point to the number of Seattle residents aged 12 and older. However, rounding to the first decimal point masked meaningful differences in the number of users of each substance. The results presented above are based on national prevalence estimates rounded to the third decimal point. Thanks to Tod Bergstrom for calling this issue to my attention.
According to these calculations, 24.7% of all drug transactions in Seattle,
and 22.7% of all outdoor drug transactions, involving one of these four serious
drugs involved powder cocaine. Methamphetamine is estimated to be involved
in 18.9% of all and 10.7% of the outdoor drug transactions involving one of
these four drugs. Crack cocaine is estimated to be involved in 27.6% of all, and
19
PART I. ASSESSING SEATTLE’S DRUG MARKET CHARACTERISTICS
33.3% of the outdoor, drug transactions that involve one of these four drugs.
Heroin transactions comprised 28.7% of all and 33.3% of the outdoor drug
transactions involving one these four substances. The omission of ecstasy from
this analysis means that all of these estimates are inflated by an unknown
margin.
In short, although crack is purchased more frequently and is more likely
to be obtained outdoors than powder cocaine and methamphetamine, this does
not mean that the majority of all outdoor drug transactions involve crack
cocaine. According to the evidence presented here—which also includes
information about the number of users of each substance—one–third of all
outdoor drug transactions in Seattle involve crack cocaine. The overwhelming
representation of crack deliverers among delivery arrestees is thus not simply a
function of the frequency with which that drug is bought and sold outdoors.
The next sections analyze data pertaining to the race/ethnicity of Seattle’s
recent users of serious drugs.
Race/Ethnicity of Recent Drug Users
20
An extensive body of ethnographic and survey research suggests that
there is an association between levels of drug use among racial/ethnic groups
and the degree to which those groups are involved in delivery of the drugs
used. As a result, identifying the racial/ethnic composition of recent drug users
is a first step in assessing the race/ethnicity of those involved in delivery of
those drugs. A variety of data sources provide information about the
PART I. ASSESSING SEATTLE’S DRUG MARKET CHARACTERISTICS
racial/ethnic composition of drug users in the Seattle area. In what follows, the
strengths and limitations of each data source are described, and a table
summarizing the results of each is presented.
DASA Household Survey Data
In 1993-4, the Division of Alcohol and Substance Abuse (DASA) at the
Washington State Department of Social and Human Services conducted the
Washington Needs Assessment Household Survey to determine the prevalence
of drug and alcohol use and abuse in the state of Washington. The survey was
used to estimate the prevalence of lifetime, past year, and past month drug
use; past and present drug or alcohol disorder; and “need for treatment” among
various demographic groups. Over 7,000 adults statewide were surveyed;
members of minority racial and ethnic groups were over-sampled to facilitate
demographic analysis. Since that time, researchers at the University of Texas
have extrapolated the original results to estimate the prevalence of drug use
and abuse among various racial/ethnic groups in the state and each of its
counties for subsequent years.17 The data shown below are based on these
extrapolations.
Several of the survey questions measure the prevalence of recent and
frequent drug use among various racial/ethnic groups in King County.
Estimates of past 30-day use are the primary indicator of recent drug use;
17 A more detailed account of the methodology used in these extrapolations is available at:
21
http://psy.utmb.edu/estimation/dasa99/report/cntyrep/wa033/page02.htm
PART I. ASSESSING SEATTLE’S DRUG MARKET CHARACTERISTICS
estimates of past 18-month drug use disorder and current need for substance
abuse treatment provide limited information about those who use drugs
frequently, as these data are not broken down by drug. Of the serious drugs
considered in this report, detailed information is provided only about cocaine
(powder and crack) and “stimulants,” which primarily include
methamphetamine and amphetamines.
A few issues should be kept in mind when interpreting these data. First,
although the extrapolations of the original 1993-4 data do take population
growth and demographic changes into account, they do not reflect the spread
of increasingly popular drugs (such as methamphetamine and ecstasy) since
1993-4. This flaw probably leads to an undercount of the white drug-using
population, as the available evidence suggests that whites are most likely to
use these substances.18 On the other hand, the DASA data pertain to King
County, but the jurisdiction in question in State v. Washington et al is Seattle.
Because whites make up a slightly larger share of the King County population
than the Seattle population,19 these data probably overestimate the proportion
18 In King County, 92.3% of those who died of methamphetamine related causes and 100% of those who died from ecstasy/MDMA-related causes were white (see Table 3 of this report). This pattern exists across much of the United States (see, for example, SAMHSA’s recent report on ecstasy (available online at http://www.samhsa.gov/oas/2k3/ecstasy/ecstasy.htm) and methamphetamine (http://www.samhsa.gov/oas/NHSDA/Treatan/treana13.htm) (see especially Table 2). It is also clear that the use of these drugs increased in the Seattle area during the period in question. For example, between 1994 and 2000, the annual number of MDMA-related Emergency Department episodes in Seattle increased from 2 to 124. The number of methamphetamine-related ED episodes increased from 309 to 540 during the same period. See (http://www.samhsa.gov/centers/clearinghouse/clearinghouses.html, Table 2.4.20).
22
19 Census data indicate that King County’s population was 73.4% white and 5.3% black in 2000; Seattle’s residents that year were 67.9% white and 8.3% black (Klement and Siggins 2001).
PART I. ASSESSING SEATTLE’S DRUG MARKET CHARACTERISTICS
of Seattle drug users who are white by a few percentage points. Also, because
household surveys tend to miss the institutionalized, transient, and homeless
populations, they tend to underestimate the prevalence of drug use. To the
extent that people of color are more likely than white people to be homeless,
institutionalized, or transient, this bias leads to an underestimate of the
prevalence of drug use among people of color.20
Mortality Data
The Office of the King County Medical Examiner estimates the number of
drug-caused deaths in King County. These data record deaths directly caused
by drug overdose; they do not include those caused by poison. Table 2
identifies the race/ethnicity of those who were identified as having each of the
substances in their bloodstream at the time of death. Many individuals who die
of an overdose have more than one drug in their bloodstream. An individual
may therefore be counted in more than one drug category. Because the results
are based on blood tests, the results for cocaine include both powder and crack
cocaine.
Mortality data are typically thought to provide information about the
most serious drug abusers (e.g. Goode 2002), although it is possible that those
23
20 According to U.S. Census data, 6.2% of King County whites, but 19.9% of King County blacks, had incomes that fell below the poverty line in 2000 (U.S. Bureau of the Census 2000). Thus, rates of poverty are roughly three times higher among blacks than whites. However, it is worth noting that in an overwhelmingly white (and, secondarily, Asian) jurisdiction such as King County, the majority of poor people are white. Specifically, census data indicate that in 1999, 79,906 whites, 21,197 Asians, and 17,670 blacks had incomes that fell below the poverty line.
PART I. ASSESSING SEATTLE’S DRUG MARKET CHARACTERISTICS
who die of an overdose are not frequent drug users. Unlike the DASA
household survey data, mortality data do not suffer from clear race/class
biases. However, the fact that these are King County rather than Seattle data
likely leads to an over-estimation of the relative size of the white drug-using
population.
Emergency Department (DAWN) Data
SAMHSA’s Drug Abuse Warning Network (DAWN) provides a third
source of information regarding the race/ethnicity of Seattle’s drug users.
These data track the number of times drugs are “mentioned” by patients in
hospital emergency rooms (SAMHSA 2002). These estimates are based on a
representative sample of non-Federal, short-stay hospitals with 24-hour
emergency departments in the coterminous United States. The results from
participating Seattle hospitals are included here. The drug(s) “mentioned” by
patients may or may not be the reason for the hospital visit. Many patients
mention more than one drug.21 Insofar as the poor and under-insured are more
likely to rely on hospital emergency rooms to obtain health care, these data
likely over-represent the poor and, therefore, people of color (see Morgan and
Zimmer 1998; Wishner et al 1991). Crack and powder cocaine are not
distinguished in these data.
24
21 Heroin is the only major drug for which the majority of Emergency Department visits are related to the use of a single drug (Banta-Green et al 2002, p. 5).
PART I. ASSESSING SEATTLE’S DRUG MARKET CHARACTERISTICS
Seattle Needle Exchange Study
The Seattle Needle Exchange Survey was designed in consultation with
Dr. John Lamberth of Temple University and Kris Nyrop, Director of Street
Outreach Services, and was administered by persons hired on a short-term
basis by the Racial Disparity Project. Over a two-week period in April 2002,
surveyors were present at five needle exchange sites in Seattle during all hours
of operation: Capitol Hill, Downtown Seattle, South Center, the University
District, and White Center. An additional 17 surveys were collected by
surveyors traveling in the public health van.22 The two-week sampling period
was selected because, according to public health experts, the majority of
exchangers utilize the needle exchange services within that time frame (Kris
Nyrop, personal communication, 2003). Surveyors offered needle exchange
clients a piece of chocolate whether or not they completed a survey. Needle
exchangers were asked whether they had already completed the survey;
because exchangers were given chocolate even if they had already been
surveyed, exchangers had no incentive to complete more than one survey.
Needle exchangers were asked to report, among other things, their
race/ethnicity, the drug(s) present in the needle(s) just exchanged, whether or
not they obtained (each of) those drugs in Seattle, and the race/ethnicity of the
person from whom they had obtained those drugs. Respondents were also
asked about “other drugs” (i.e. other than the drugs in the needles they
25
22 The Rainier Valley site was not included because a substantially smaller number of people (i.e. 1-2 per week) exchange needles there (Kris Nyrop, personal communication 2003.)
PART I. ASSESSING SEATTLE’S DRUG MARKET CHARACTERISTICS
exchanged) they had obtained. Five hundred eighty-nine surveys were
completed by individuals who obtained at least one drug in Seattle.
This survey provides important information regarding injection drug
users and their Seattle drug sources. In particular, the survey provides
information about users and deliverers of commonly injected drugs, including
heroin, cocaine, and methamphetamine. The inclusion of questions about other
drugs (i.e. not in the needle(s) just exchanged) means that the survey also
provides more limited information about needle exchangers’ use of other drugs.
Injection drug users are often thought to represent some of the most
serious drug abusers. To the extent that this is the case, injecting drug users
are not representative of the general drug-using population. However, the
majority (more than 70%) of Seattle IDUs are believed to utilize needle
exchange services (Kris Nyrop, personal communication, 2003). The survey
therefore probably captures much of Seattle’s IDU population. Because non-
prescription pharmacy sale of needles is legal in Washington State, it is likely
that Seattle IDUs who are able to purchase their needles do not exchange
needles. As a result, the survey probably under-counts middle and upper
income injecting drug users (who can afford to purchase needles) and,
therefore, white injecting drug users.23
Approximately 47% of those exchanging needles agreed to complete a
survey. The majority of needle exchangers who completed a survey reported
26
23 In addition, several needle exchange surveyors noted that some injecting drug users with “reputable” jobs hired other injecting users to exchange needles for them at needle exchange sites. To the extent that it exists, this practice introduces further class and race biases.
PART I. ASSESSING SEATTLE’S DRUG MARKET CHARACTERISTICS
that the needles they exchanged contained heroin, methamphetamine, cocaine,
or some combination of these substances. Crack can be and sometimes is
injected; the distribution of powder and crack cocaine users in this sample is
therefore unknown. The responses of those who listed heroin, cocaine, and
methamphetamine as an “other” drug were combined with those who listed
these drugs as present in the needles just exchanged. Those who obtained their
drugs outside of Seattle, or whose responses were not legible were not
included, leaving a sample of 553 exchangers.
Of the exchangers whose surveys were included, 70.3% were white, 13%
were black, and 5.4% were Latino. As with all survey research, it is possible
that those who agreed to complete a survey differ in important respects from
those who decline to do so. In order to assess this possibility, surveyors also
recorded the perceived race/ethnicity of those who did not complete a survey.
Of the 677 exchangers recorded as non-respondents, 449 (66.3%) were
identified as white; 132 (19.5%) as black, and 62 (9.2%) as Latino. Black and
Latino/a exchangers were thus less likely than white exchangers to complete a
survey. If these non-respondents are combined with the respondents, the
proportion of white needle exchangers decreases from 70.3% to 68.1%, while
the proportion of black exchangers increases from 13% to 16.6% (see Table 2).
The black share of all needle exchangers is thus 128% of the black share of
respondents; the white share of needle exchangers is 97% of the white share of
27
PART I. ASSESSING SEATTLE’S DRUG MARKET CHARACTERISTICS
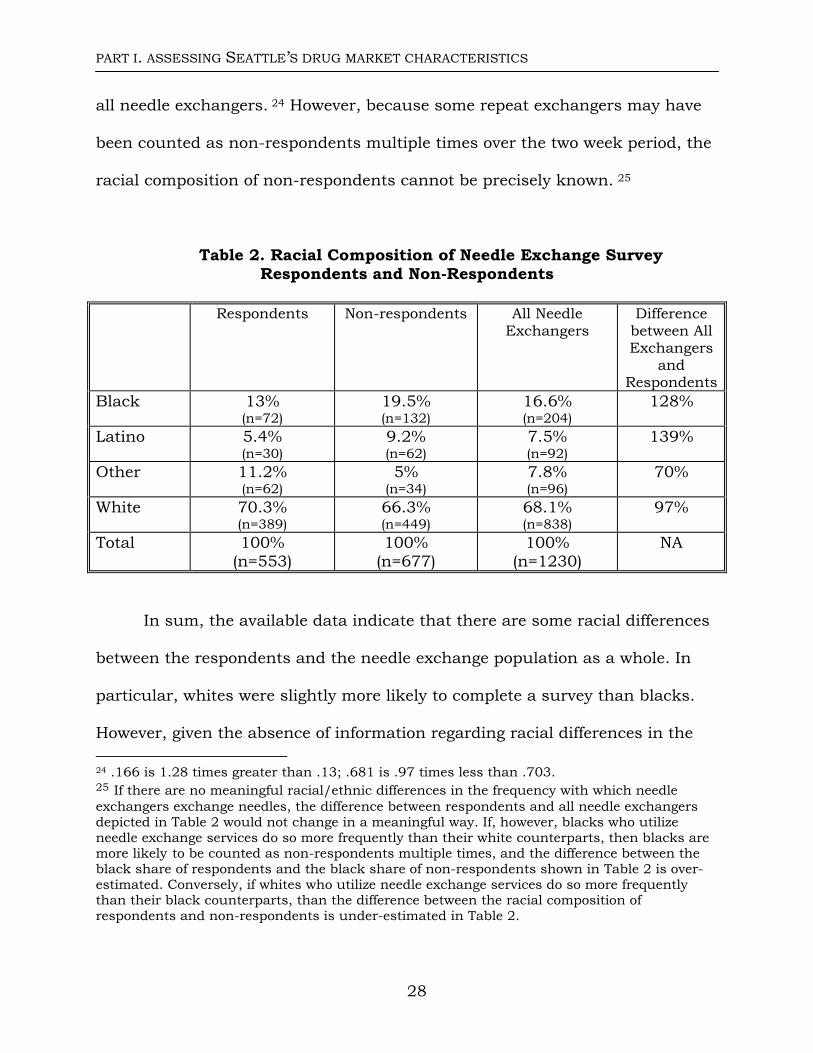
all needle exchangers. 24 However, because some repeat exchangers may have
been counted as non-respondents multiple times over the two week period, the
racial composition of non-respondents cannot be precisely known. 25
Table 2. Racial Composition of Needle Exchange Survey Respondents and Non-Respondents
Respondents Non-respondents All Needle
Exchangers Difference
between All Exchangers
and Respondents
Black 13% (n=72)
19.5% (n=132)
16.6% (n=204)
128%
Latino 5.4% (n=30)
9.2% (n=62)
7.5% (n=92)
139%
Other 11.2% (n=62)
5% (n=34)
7.8% (n=96)
70%
White 70.3% (n=389)
66.3% (n=449)
68.1% (n=838)
97%
Total 100% (n=553)
100% (n=677)
100% (n=1230)
NA
In sum, the available data indicate that there are some racial differences
between the respondents and the needle exchange population as a whole. In
particular, whites were slightly more likely to complete a survey than blacks.
However, given the absence of information regarding racial differences in the 24 .166 is 1.28 times greater than .13; .681 is .97 times less than .703. 25 If there are no meaningful racial/ethnic differences in the frequency with which needle exchangers exchange needles, the difference between respondents and all needle exchangers depicted in Table 2 would not change in a meaningful way. If, however, blacks who utilize needle exchange services do so more frequently than their white counterparts, then blacks are more likely to be counted as non-respondents multiple times, and the difference between the black share of respondents and the black share of non-respondents shown in Table 2 is over-estimated. Conversely, if whites who utilize needle exchange services do so more frequently than their black counterparts, than the difference between the racial composition of respondents and non-respondents is under-estimated in Table 2.
28
PART I. ASSESSING SEATTLE’S DRUG MARKET CHARACTERISTICS
frequency of needle exchange utilization, the magnitude of this difference
cannot be precisely known. The data shown below are based on those
exchangers who completed a survey. The results for each of these data sources
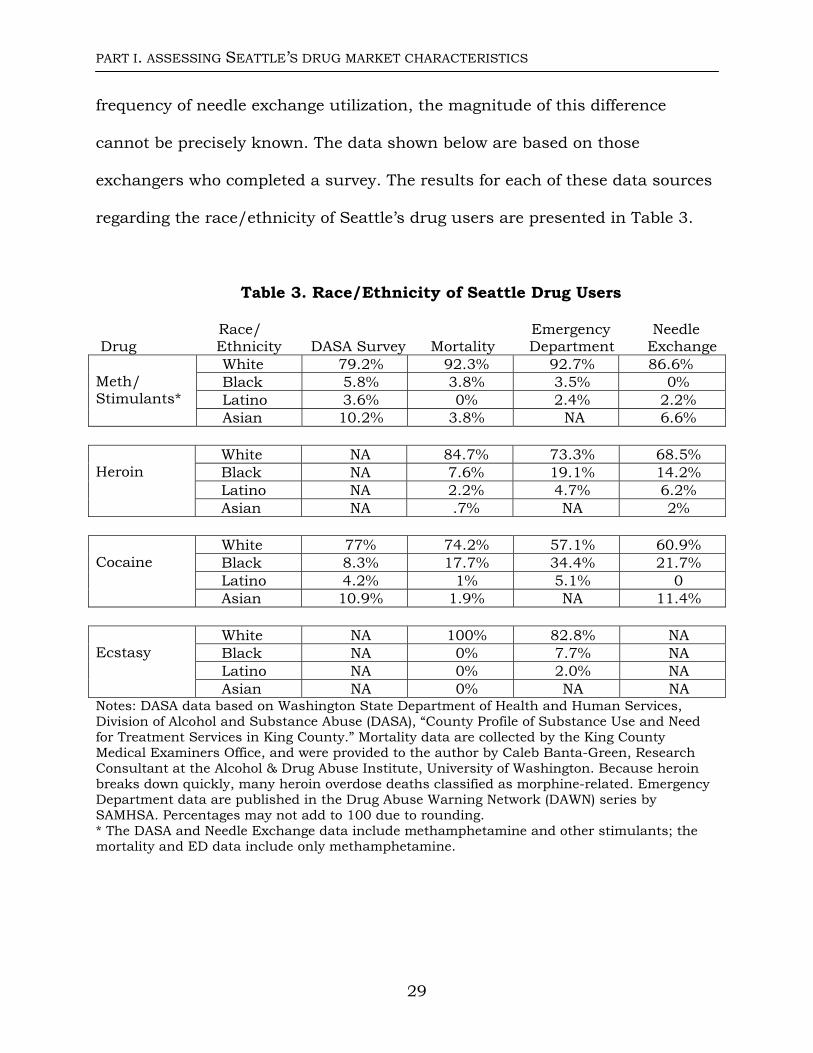
regarding the race/ethnicity of Seattle’s drug users are presented in Table 3.
Table 3. Race/Ethnicity of Seattle Drug Users
Race/ Emergency Needle Drug Ethnicity DASA Survey Mortality Department Exchange
White 79.2% 92.3% 92.7% 86.6% Black 5.8% 3.8% 3.5% 0% Latino 3.6% 0% 2.4% 2.2%
Meth/ Stimulants*
Asian 10.2% 3.8% NA 6.6%
White NA 84.7% 73.3% 68.5% Black NA 7.6% 19.1% 14.2% Latino NA 2.2% 4.7% 6.2%
Heroin
Asian NA .7% NA 2%
White 77% 74.2% 57.1% 60.9% Black 8.3% 17.7% 34.4% 21.7% Latino 4.2% 1% 5.1% 0
Cocaine
Asian 10.9% 1.9% NA 11.4%
White NA 100% 82.8% NA Black NA 0% 7.7% NA Latino NA 0% 2.0% NA
Ecstasy
Asian NA 0% NA NA Notes: DASA data based on Washington State Department of Health and Human Services, Division of Alcohol and Substance Abuse (DASA), “County Profile of Substance Use and Need for Treatment Services in King County.” Mortality data are collected by the King County Medical Examiners Office, and were provided to the author by Caleb Banta-Green, Research Consultant at the Alcohol & Drug Abuse Institute, University of Washington. Because heroin breaks down quickly, many heroin overdose deaths classified as morphine-related. Emergency Department data are published in the Drug Abuse Warning Network (DAWN) series by SAMHSA. Percentages may not add to 100 due to rounding. * The DASA and Needle Exchange data include methamphetamine and other stimulants; the mortality and ED data include only methamphetamine.
29
PART I. ASSESSING SEATTLE’S DRUG MARKET CHARACTERISTICS
Although there are some differences across data sources, the general
pattern of results shown in Table 3 is clear. All of these data sources indicate
that a majority of those who recently used any of the serious drugs listed are
white. This is especially true for methamphetamine and heroin, and is even
true according to the Emergency Department (DAWN) and Needle Exchange
Survey data, both of which over-represent the poor (and, therefore, people of
color).
Interpreting the results for cocaine is complex, as none of the data
sources consistently differentiate between powder and crack cocaine. It is likely
that many of the Emergency Department mentions involve crack and/or
injected cocaine. Still, the results indicate that there are more white than black
users of cocaine in Seattle. Although limited, data from the Needle Exchange
Survey provide further evidence of extensive crack use among whites. Of the 32
needle exchangers who reported acquiring crack in Seattle, 67.7% were white;
16.1% were black; and 16.1% defined their race/ethnicity as “other.”26
Although crack has often been depicted in the media as a “black” drug,
national data also indicate that the majority of recent crack users are white.
For example, according to the U.S. Sentencing Commission (1997: 8), more
than half of U.S. crack cocaine users in 1995 were white; fewer than half were
black. Similarly, if we apply SAMHSA estimates of the prevalence of past-
month crack use to the number of Seattle residents aged 12 and older, the
30
26 Two needle exchangers listed specified that crack was in a needle exchanged; 30 others listed crack as an “other drug” they had recently purchased in Seattle.

PART I. ASSESSING SEATTLE’S DRUG MARKET CHARACTERISTICS
results indicate that there are nearly identical numbers of white and black
recent crack users in Seattle.27
In sum, although none of these data sources is a perfect measure of the
prevalence of serious drug use, collectively, they provide very strong evidence
that a significant majority of Seattle’s recent users of serious drugs are white,
and that a much smaller percentage of that population is black.
Race/Ethnicity of Seattle’s Drug Deliverers
In Washington State, drug delivery includes any knowing physical
transfer of a controlled substance to another party (such as sharing or selling
drugs) or the facilitation of any knowing transfer of these substances.28 As a
result, drug delivery is a broader category than drug selling/distribution, and
the number of people engaged in drug delivery can be assumed to be much
larger than those engaged in drug sales. Research on those who deliver drugs
for all of these purposes is summarized below.
27 Census data indicate that in the year 2000 there were 361,649 whites and 39,602 blacks aged 12 or older living in Seattle. SAMHSA (1999) data indicate that .1% of the white population and .9% of the black population aged 12 and older had used crack in the past month (see Tables 5b and 5c). Applying these rates to the Seattle population aged 12 and older indicates that there were 361 white and 356 black recent crack users in Seattle. Because the SAMHSA Household survey tends to miss transient populations, the actual numbers of both white and black crack users in Seattle is likely higher. (SAMSHA now includes homeless and some institutionalized populations in its survey sample).
31
28 Behaviors that constitute facilitation are included in the definition of delivery by principles of accomplice liability.
PART I. ASSESSING SEATTLE’S DRUG MARKET CHARACTERISTICS
Drug Delivery among Drug Users
Ethnographic and survey research suggest that behaviors that meet the
legal definition of delivery are quite common among drug users, especially
those who use drugs frequently. Researchers have consistently found that
many frequent drug users participate in some aspect of the drug distribution
system in order to support their drug habit and/or generate income (Bourgois
1995; Dunlap, Johnson and Maher 1997; Hagedorn 1994; Maher and Daly
1996; Preble and Casey 1998; Sterk 1999). Such services include working as a
runner, courier, or lookout for drug dealers;29 selling small amounts of drugs;
injecting others; preparing drugs for sale on the street, and so forth. Users who
participate in the drug distribution system to support their drug habit are
especially likely to participate in the lower end of the distribution system,
especially street sales.
Active involvement in the lower end of the drug distribution system
among addicts and frequent drug users is consistently reported in the research
literature. Based on her comprehensive survey of the ethnographic literature
on the subject, Hunt (1990) concludes that many frequent drug users
distribute or sell drugs or provide “drug services,” and therefore that drug
dealing is “endemic” among frequent users (pp. 174-9). In Seattle, too, local
health experts and police officers have observed that many drug users obtain
29 Many of those arrested by the SPD for delivering drugs were serving as a courier or runner at the time of their arrest.
32
PART I. ASSESSING SEATTLE’S DRUG MARKET CHARACTERISTICS
their drugs by providing services for drug dealers or selling small amounts of
drugs (Klement and Siggins 2001: 17).
In addition, an extensive body of survey and ethnographic research
indicates that, independent of their potential involvement in the drug
distribution system, most drug users knowingly transfer (i.e. deliver) drugs in
the course of their using activities (see Adler 1985; Murphy and Waldorf 1998;
Murphy and Rosenbaum 1997; Rosenbaum, Morgan and Beck 1998; Sifaneck
and Neaigus 2001; Waldorf, Reinarman and Murphy 1991; Waldorf 1998). In
this case, these behaviors are not aimed at securing compensation, but rather
are part of drug-using cultures as described by researchers who have observed
those settings. Behaviors that involve drug delivery include “treating” others to
drugs, passing drugs between friends, making collective purchases that are
then divided amongst purchasing parties, and so forth. In her review of the
ethnographic research on drug users and markets, Hunt concluded that “…
persons at almost all levels of drug use distribute drugs, that is, sell or share
them.” This tendency is particularly pronounced among frequent drug users,
although “occasional users may distribute small amounts as part of sharing
drugs or obtaining them for their own use and often do not classify their
activities as dealing or selling” (1990: 166).
33
In sum, the ethnographic and survey research just described suggests
that most frequent drug users knowingly transfer—i.e. deliver—illegal drugs in
the course of their drug-using activities; many also engage in or facilitate drug
sales or distribution. Although not all of this research is specific to Seattle,
PART I. ASSESSING SEATTLE’S DRUG MARKET CHARACTERISTICS
these findings are consistent across a wide range of locales, and it is unlikely
that the behavior of frequent drug users in Seattle is markedly different than
that of users in other cities. Given evidence that the majority of those who use
serious drugs Seattle are white, and that a much smaller share of that
population is black, the research just described suggests that the majority of
those who deliver drugs in Seattle are white, and that a much smaller share of
that population is black.
Drug Purchasing Patterns
Studies of drug purchasing patterns also provide reason to suspect that
the majority of drug deliverers in Seattle are white. This body of research
indicates that drug users tend to purchase their drugs from someone of their
own race/ethnicity, a conjecture that will be referred to as the “racial congruity
thesis.” One implication of this thesis is that racial and ethnic drug use
patterns tend to correspond to racial/ethnic involvement in drug delivery. This
thesis suggests, for example, that if whites are more likely to use
methamphetamine than crack, it is likely that whites are also more likely to
deliver methamphetamine than crack.
34
One of the best known examples of research supporting the racial
congruity thesis is a 1997 NIJ study of drug use and purchase patterns in six
U.S. cities: Portland (0regon), Chicago, Manhattan, San Antonio, San Diego,
and Washington D.C. This study was based on interviews with over 2000 drug-
using arrestees, and focused on powder cocaine, crack cocaine, and heroin.
PART I. ASSESSING SEATTLE’S DRUG MARKET CHARACTERISTICS
The researchers found that among those who reported using a main (single)
source of drugs, “Respondents were most likely to report using a main [drug]
source of their own racial or ethnic background, regardless of the drug
considered” (Riley 1997: 9). Although a significant proportion of drug users did
not have a main (single) source of drugs, the report nonetheless found that “a
tendency to buy disproportionately from a person of the same race existed in
most sites for most racial groups” (p.1). Exceptions to this pattern existed in a
few instances where the number of cases was small. Although Seattle was not
one of the six cities included in this NIJ study, racial congruity between drug
purchasers and drug dealers was found to exist in all six of the cities
examined. As mentioned above, one of these was Portland, Oregon, which is
demographically similar to Seattle.30
Studies consistently report racial/ethnic congruity between sellers and
buyers. For example, a follow-up study by the NIJ that focused on
methamphetamine use and distribution (not included in the study described
above) in five western U.S. cities also found that “meth users tended to buy
from individuals within their own ethnic group, with the exception of 45% of
blacks who were more likely to use a Hispanic source for meth” (Pennell et al
1999: 27). Similarly, in her review of the ethnographic literature on drug
dealing, Hunt found that “dealers with direct contact with their customers…
35
30 According to 2000 census data, Portland’s population is 81.3% white; 7.9% black, 6.8% Latino, and 7.5% Asian (available online at http://www.upa.pdx.edu/CPRC/publications/2000census/1604159000.pdf). According to 2000 census data, 70.1% of Seattle’s population is white; 8.4% is black, 5.3% is Latino, and 13.1% Asian.
PART I. ASSESSING SEATTLE’S DRUG MARKET CHARACTERISTICS
are likely to look like the customers, and in fact be the customers, at other
points in time. Therefore, the cocaine seller in a Wall Street building is likely to
be a white male in his twenties…; a cocaine dealer working Southern California
beach towns looks like, and often is, a surfer…; and the inner city Washington
D.C. cocaine dealer is likely to be a young black or Hispanic man” (1990: 172).
Nyrop’s (2003) observations of two open-air markets in Seattle suggest
that racial congruity also exists in those contexts. In this ethnographic study,
Nyrop compared the Capitol Hill drug market (located along the Broadway
corridor) with the downtown market (concentrated in the 2nd and Pike area).
Nyrop and his assistants observed drug transactions for a total of 100 hours at
the two sites and recorded the race/ethnicity of those involved in the observed
transaction. Contrary to police perceptions (as reported in Klement and Siggins
2001: 24), street drug sales were frequent and easily observed in the Capitol
Hill/Broadway area.31 Nyrop noted several other similarities between the
Capitol Hill and downtown markets. Specifically, both are dominated by heroin,
but contain other “mini-markets,” and the majority of those involved in both
sales and purchasing in the two areas are resident to that area.
Consistent with the racial congruity thesis, this study found that in both
markets, there was a correspondence between each racial/ethnic group’s
involvement in drug purchasing and that group’s involvement in drug delivery
(Nyrop 2003: 9). That is, where whites were the clear majority of drug
purchasers (i.e. in Capitol Hill), whites were also the clear majority of drug
36
31 Nyrop observed 394 drug transactions in 40 hours in the Broadway area (Nyrop 2003).
PART I. ASSESSING SEATTLE’S DRUG MARKET CHARACTERISTICS
sellers/deliverers. Where blacks and Latinos were more likely to be purchasing
drugs (i.e. downtown), blacks and Latinos were also more likely to be delivering
and/or selling drugs (although whites were the largest group purchasing and
delivering drugs downtown). As Nyrop concludes, “it appears that each group
participated in purchases and delivery roughly proportionally to their
percentage in the overall population engaged in drug transactions of any kind.
This is not only true from the aggregate data, but holds up across most
observed time blocks and days as well” (2003: 9). In short, there is a wide body
of evidence indicating that in Seattle and elsewhere, the racial/ethnic
composition of users of particular drugs tends to correspond to the
racial/ethnic composition of those who deliver those substances. Given
evidence that the majority of serious drug users in Seattle are white, this body
of research supports the hypothesis that the majority of those who deliver
these substances are also white.
Seattle Needle Exchange Study
37
The Seattle Needle Exchange Survey provides a unique opportunity to
assess whether, in fact, most deliverers of serious drugs in Seattle are white, as
the research studies just reviewed imply. Because this survey was conducted
in five needle exchange sites around the city, the data derived from this survey
are more comprehensive than Nyrop’s (2003) observations of two open-air
markets. As was discussed previously, most of the exchangers reported
injecting heroin, methamphetamine, cocaine, or some combination of these.
PART I. ASSESSING SEATTLE’S DRUG MARKET CHARACTERISTICS
Typically, each of these drugs is purchased in non-liquid form; injecting drug
users then liquefy and inject them (Murphy and Waldorf 1998). Thus, while
injecting drug users may differ in important respects from non-injecting drug
users, it is likely that those who supply these individuals with heroin, cocaine,
and meth cater to both injecting and non-injecting users.
Drug purchases that occurred outside Seattle or did not involve heroin,
cocaine, or methamphetamine were not included in the analysis. Some of the
respondents exchanged more than one needle, and each needle might contain
more than one drug. Exchangers were therefore asked to identify the drug(s)
and the race/ethnicity of the source of the drug(s) in each needle exchanged
(up to 3). Respondents were also asked about “other drugs’ (i.e. not in the
needles exchanged) they had obtained. As a result, the number of transactions
and drug deliverers identified exceeds the number of needle exchangers
surveyed. Specifically, the 553 exchangers whose surveys were included
described 909 instances of heroin, cocaine (unspecified), methamphetamine,
crack, or ecstasy delivery. Most (59%) of these transactions involved heroin;
another 27.9% involved cocaine (of an unspecified form), 9.1% involved
methamphetamine, 3.5% involved crack, and .7% involved ecstasy. In the
analyses that follow, all acquisitions of these drugs (whether in needles or not)
were combined.32 Results regarding crack cocaine and ecstasy will be
38
32 Most of the drugs identified by respondents were described as having been in a needle that was exchanged. Specifically, heroin was identified as present in 510 needles; there were 24 additional reports of “other” heroin transactions. Similarly, meth/speed was identified as present in 51 needles; respondents provided 32 reports of “other” meth/speed transactions.
PART I. ASSESSING SEATTLE’S DRUG MARKET CHARACTERISTICS
presented separately.
Some social scientists have argued that, for socio-economic reasons,
poorer people who deliver drugs will do so more frequently than wealthier
people who deliver drugs. Insofar as rates of poverty are higher among blacks
than whites, this generalization implies that as a group, blacks who deliver
drugs do so more frequently than whites who deliver drugs (see Goode 2002, p.
43). Because the unit of analysis in the transactions reported by exchangers is
deliveries rather than deliverers, the needle exchange survey results presented
below capture information about frequency of delivery. That is, the needle
exchange survey results provide information about 909 drug transactions,
some of which probably involved the same drug deliverer. If black drug dealers
were delivering drugs more frequently than white dealers, this would be
reflected in the survey results regarding the race/ethnicity of the drug deliverer
involved in the drug transactions described. Because it provides information
about the deliverers involved in 909 drug transactions/deliveries rather than
about 909 drug-delivering individuals, the results of the needle exchange
survey reflect and capture any racial differences in frequency of delivery that
may (or may not) exist. In the analyses that follow, the focus is on the
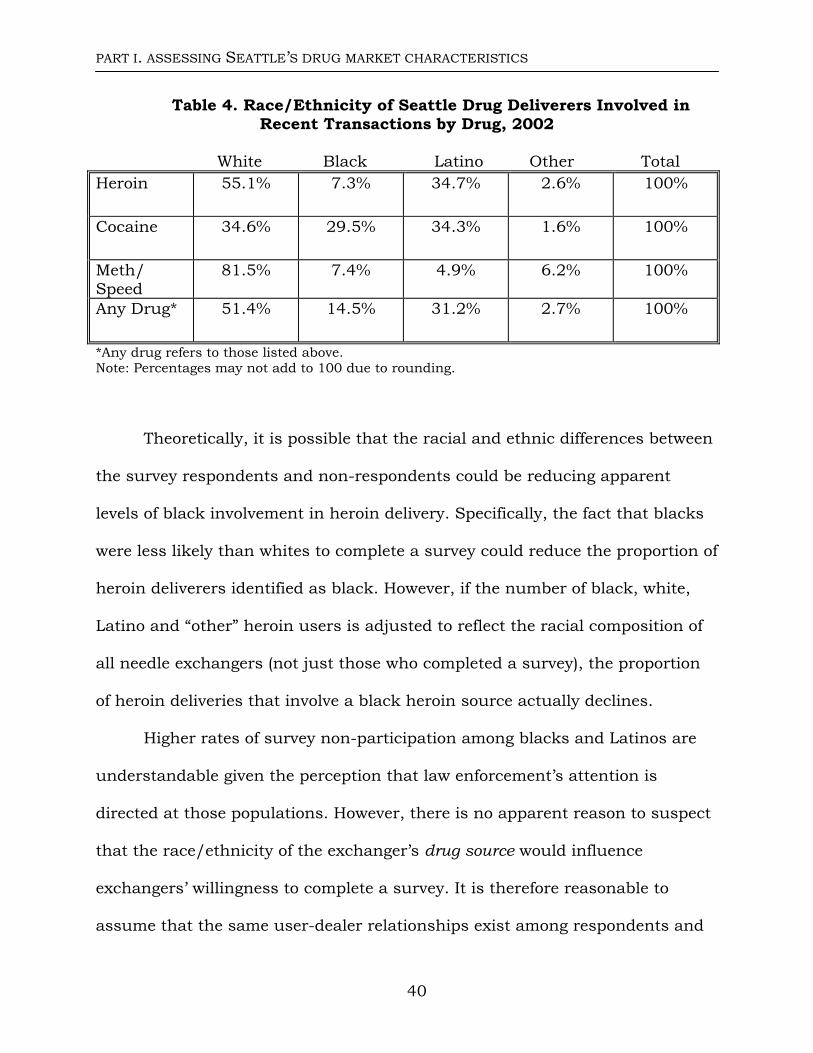
race/ethnicity of the drug deliverers involved in these transactions. As is
shown in Table 4, whites were the largest group of heroin, cocaine, and
methamphetamine deliverers.
39
However, the pattern was the opposite for cocaine. Cocaine was identified as present in 80 needles exchanged; respondents reported an additional 174 cocaine transactions.
PART I. ASSESSING SEATTLE’S DRUG MARKET CHARACTERISTICS
Table 4. Race/Ethnicity of Seattle Drug Deliverers Involved in Recent Transactions by Drug, 2002
White Black Latino Other Total
Heroin 55.1% 7.3% 34.7% 2.6% 100%
Cocaine 34.6% 29.5% 34.3% 1.6% 100%
Meth/ Speed
81.5% 7.4% 4.9% 6.2% 100%
Any Drug* 51.4% 14.5% 31.2% 2.7% 100%
*Any drug refers to those listed above. Note: Percentages may not add to 100 due to rounding.
Theoretically, it is possible that the racial and ethnic differences between
the survey respondents and non-respondents could be reducing apparent
levels of black involvement in heroin delivery. Specifically, the fact that blacks
were less likely than whites to complete a survey could reduce the proportion of
heroin deliverers identified as black. However, if the number of black, white,
Latino and “other” heroin users is adjusted to reflect the racial composition of
all needle exchangers (not just those who completed a survey), the proportion
of heroin deliveries that involve a black heroin source actually declines.
Higher rates of survey non-participation among blacks and Latinos are
understandable given the perception that law enforcement’s attention is
directed at those populations. However, there is no apparent reason to suspect
that the race/ethnicity of the exchanger’s drug source would influence
exchangers’ willingness to complete a survey. It is therefore reasonable to
assume that the same user-dealer relationships exist among respondents and
40
PART I. ASSESSING SEATTLE’S DRUG MARKET CHARACTERISTICS
non-respondents. If non-respondents (whose race/ethnicity was recorded) are
included in the analysis, and we assume that the same user-dealer
relationships that existed for respondents exist for all exchangers, the
proportion of deliveries estimated to involve blacks increases by approximately
two-tenths of one percent.33 The fact that the black share of heroin deliverers
increases by only a fraction of a percentage point even when the relative
proportion of black heroin users increases is a consequence of the fact that
black heroin users were far more likely to acquire their heroin from a white (or
Latino) person than from a black person. The comparatively low level of black
involvement in heroin delivery thus appears not to be a function of lower
survey response rates among blacks. Put differently, even if the composition of
surveyors is adjusted to match those of all needle exchangers, the results
regarding race of deliver are affected very slightly. This is also true for meth.
Two patterns of results from the Needle Exchange Survey are especially
noteworthy. First, whites comprise the largest group of deliverers of each
substance; a substantial share of exchangers also identified their heroin and
cocaine source as Latino. Given that these findings are based on a
geographically comprehensive sample of Seattle’s needle exchangers, they
33 This result was obtained by multiplying the number of black, Latino, white, and “other” heroin users by the difference between the share of each group in the respondent population and total needle exchanger population (shown in Table 2). For example, the number of black heroin respondents was multiplied by 1.28, the number of Latino heroin users by 1.39, and so forth. The newly estimated numbers of black, Latino, white and “other” heroin users were multiplied by the proportion of deliveries reported by persons of that racial/ethnic group who acquired their heroin from members of each racial/ethnic group. This was done for each racial/ethnic group, and the proportion of heroin delivers described as black was re-calculated on the basis of the adjusted user populations.
41

PART I. ASSESSING SEATTLE’S DRUG MARKET CHARACTERISTICS
provide compelling evidence that in Seattle, whites comprise the largest group
of those delivering heroin and methamphetamine. A comparatively small share
of the deliverers of each of these substances is black.
Second, the results of the needle exchange survey provide additional
evidence of a general association between racial patterns of drug use and drug
delivery. For example, according to the survey, whites use and deliver
methamphetamine at similarly high rates; blacks are more likely to use and
deliver cocaine than heroin or methamphetamine. Although this correlation is
much weaker for Latinos, information regarding the racial (as opposed to
ethnic) composition of the drug-using population usually tells us a good deal
about those who deliver that drug, particularly in the case of heroin and
methamphetamine (see Table 5).
Table 5. Racial Composition of Needle Exchangers and Drug Deliverers by Drug and Race
Race Heroin Cocaine Meth/Speed Combo Any Drug* White Users
66.5% 60.9% 86.6% 73.4% 70.3%
White Deliverers
55.1% 34.6% 81.5% NA 51.4%
Black Users
14.2% 21.7% 0% 11.4% 13%
Black Deliverers
7.5% 29.5% 7.4% NA 14.5%
*Any drug refers to those listed above: heroin, cocaine, and methamphetamine/speed.
42
PART I. ASSESSING SEATTLE’S DRUG MARKET CHARACTERISTICS
The needle exchange survey also provides very limited information about
ecstasy users and their sources. In particular, six needle exchangers reported
obtaining ecstasy. All six of these respondents were white; five of their six
sources were identified as white and one as “other.” Local mortality and
Emergency Department data (as well as national survey data) also indicate that
a significant majority of ecstasy users are white.34 Given the general
association between the race of the users and deliverers of particular
substances, as well as research describing the social worlds in which ecstasy in
exchanged and consumed (see Arria et al 2002; Rosenbaum, Morgan and Beck
1998; Millman and Beeder 1998), it appears quite likely that most ecstasy
deliverers are white.
Information about the racial composition of those who deliver crack
cocaine specifically (as opposed to an unspecified form of cocaine) is limited but
nonetheless suggestive. According to the 32 exchangers who reported acquiring
crack cocaine, 40.6% of these crack cocaine transactions involved a white
crack deliverer; 46.9% involved a black crack deliverer. Although based on a
comparatively small sample, this finding is consistent with the research
literature that reports a high degree of racial congruity between users and
deliverers of illicit substances.
43
34 See Table 3 of this report. According to a recent SAMHSA (2003) survey, 8.2% of whites but 3.5% of blacks nationwide aged 18-25 reported having used ecstasy in the past year in 2001.
PART I. ASSESSING SEATTLE’S DRUG MARKET CHARACTERISTICS
In sum, the analyses of Seattle’s drug markets indicate that drug
transactions in Seattle are most likely to involve heroin. If we focus exclusively
on outdoor drug transactions, heroin and crack cocaine are each estimated to
be involved in one-third of the outdoor drug transactions involving serious
drugs (other than ecstasy); the remainder involve powder cocaine and
methamphetamine. Multiple data sources indicate that most users of these
serious drugs are white. Less is known about the race/ethnicity of recent users
of crack cocaine, although there is evidence of significant white crack use.
Consistent with previous research reporting a high degree of overlap
between the racial composition of drug users and drug deliverers, the results of
the Needle Exchange Survey indicate that whites comprise the largest group of
deliverers of cocaine, methamphetamine, and heroin in Seattle. If the survey
results for blacks and whites are converted to ratios, this data source indicates
that heroin transactions involving a white drug deliverer outnumber heroin
transactions involving a black deliverer by a ratio of 7.3 to 1; for
methamphetamine, by 11 to 1; and for cocaine, by 1.2 to 1. When the form of
cocaine is specified to be crack, black deliverers outnumber white delivers by a
ratio of 1.2 to 1.
44
These ratios derive from information that captures frequency of delivery,
strongly suggesting that a significant majority of Seattle’s heroin and
methamphetamine transactions involve white drug deliverers. It is also quite
likely that ecstasy deliveries involving white deliverers also outnumber ecstasy
deliveries involving black deliverers by a significant margin.
PART I. ASSESSING SEATTLE’S DRUG MARKET CHARACTERISTICS
Thus, for all serious drugs with the possible exception of crack cocaine,
the available evidence indicates that the majority of transactions involving
these substances involve white drug deliverers. As is shown below, however,
those arrested for delivery of serious drugs in Seattle are predominantly black.
Drug Delivery Arrests in Seattle
From January 1999-April 2001, the Seattle Police Department made
2,146 purposeful arrests for delivery of the serious drugs under consideration
in this report. Of these, 64.2% involved black suspects; another 14% involved
Latino suspects (see Table 6). Despite evidence that a clear majority of those
who deliver serious drugs in Seattle are white, only 17.6% of those arrested for
delivery of serious drugs were non-Hispanic whites. These numbers translate
to a white drug delivery arrest rate of 120 per 100,000 and a black rate of
3,750 per 100,000 population. The black drug delivery arrest rate in Seattle is
thus 31 times the white drug delivery arrest rate.
Given evidence of the widespread nature of the heroin and
methamphetamine markets in Seattle, and of substantial white involvement in
the distribution of these drugs (as well as ecstasy and cocaine), the
disproportionate representation of black drug deliverers among arrestees is, at
first glance, puzzling.
45
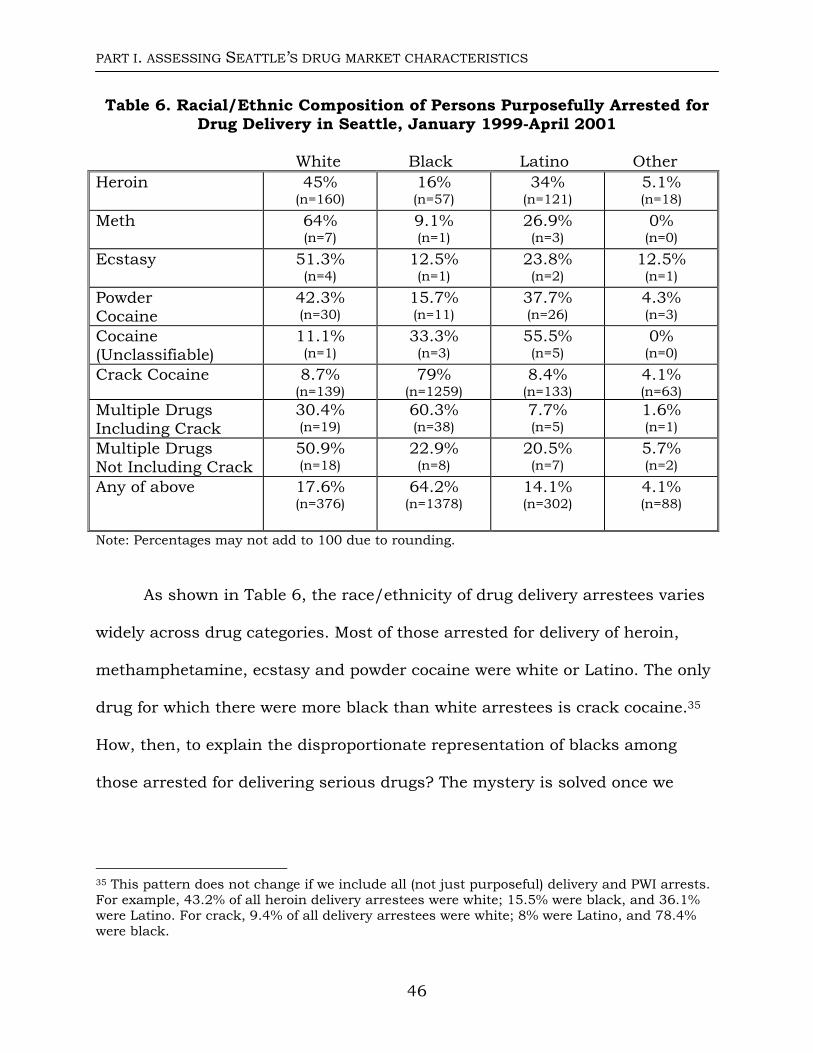
PART I. ASSESSING SEATTLE’S DRUG MARKET CHARACTERISTICS
Table 6. Racial/Ethnic Composition of Persons Purposefully Arrested for Drug Delivery in Seattle, January 1999-April 2001
White Black Latino Other
Heroin
45% (n=160)
16% (n=57)
34% (n=121)
5.1% (n=18)
Meth
64% (n=7)
9.1% (n=1)
26.9% (n=3)
0% (n=0)
Ecstasy
51.3% (n=4)
12.5% (n=1)
23.8% (n=2)
12.5% (n=1)
Powder Cocaine
42.3% (n=30)
15.7% (n=11)
37.7% (n=26)
4.3% (n=3)
Cocaine (Unclassifiable)
11.1% (n=1)
33.3% (n=3)
55.5% (n=5)
0% (n=0)
Crack Cocaine 8.7% (n=139)
79% (n=1259)
8.4% (n=133)
4.1% (n=63)
Multiple Drugs Including Crack
30.4% (n=19)
60.3% (n=38)
7.7% (n=5)
1.6% (n=1)
Multiple Drugs Not Including Crack
50.9% (n=18)
22.9% (n=8)
20.5% (n=7)
5.7% (n=2)
Any of above 17.6% (n=376)
64.2% (n=1378)
14.1% (n=302)
4.1% (n=88)
Note: Percentages may not add to 100 due to rounding.
As shown in Table 6, the race/ethnicity of drug delivery arrestees varies
widely across drug categories. Most of those arrested for delivery of heroin,
methamphetamine, ecstasy and powder cocaine were white or Latino. The only
drug for which there were more black than white arrestees is crack cocaine.35
How, then, to explain the disproportionate representation of blacks among
those arrested for delivering serious drugs? The mystery is solved once we
46
35 This pattern does not change if we include all (not just purposeful) delivery and PWI arrests. For example, 43.2% of all heroin delivery arrestees were white; 15.5% were black, and 36.1% were Latino. For crack, 9.4% of all delivery arrestees were white; 8% were Latino, and 78.4% were black.
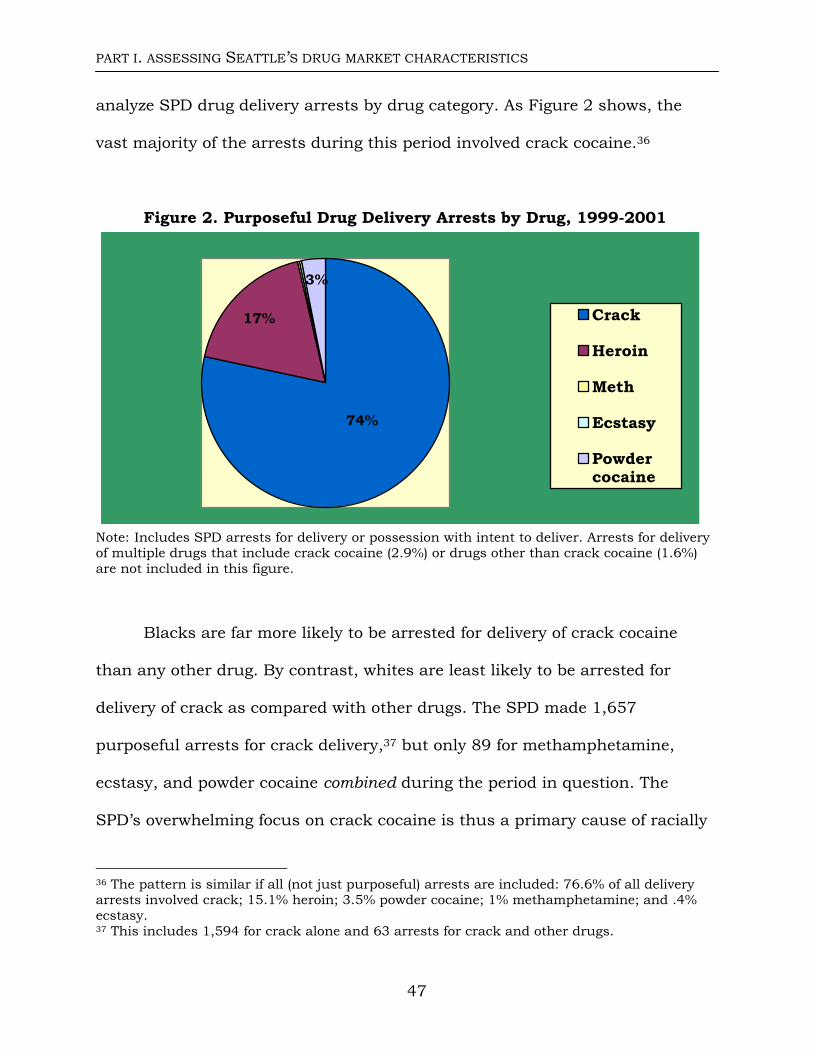
PART I. ASSESSING SEATTLE’S DRUG MARKET CHARACTERISTICS
analyze SPD drug delivery arrests by drug category. As Figure 2 shows, the
vast majority of the arrests during this period involved crack cocaine.36
Figure 2. Purposeful Drug Delivery Arrests by Drug, 1999-2001
3%
17%
74%
Crack
Heroin
Meth
Ecstasy
Powdercocaine
Note: Includes SPD arrests for delivery or possession with intent to deliver. Arrests for delivery of multiple drugs that include crack cocaine (2.9%) or drugs other than crack cocaine (1.6%) are not included in this figure.
Blacks are far more likely to be arrested for delivery of crack cocaine
than any other drug. By contrast, whites are least likely to be arrested for
delivery of crack as compared with other drugs. The SPD made 1,657
purposeful arrests for crack delivery,37 but only 89 for methamphetamine,
ecstasy, and powder cocaine combined during the period in question. The
SPD’s overwhelming focus on crack cocaine is thus a primary cause of racially
36 The pattern is similar if all (not just purposeful) arrests are included: 76.6% of all delivery arrests involved crack; 15.1% heroin; 3.5% powder cocaine; 1% methamphetamine; and .4% ecstasy.
47
37 This includes 1,594 for crack alone and 63 arrests for crack and other drugs.
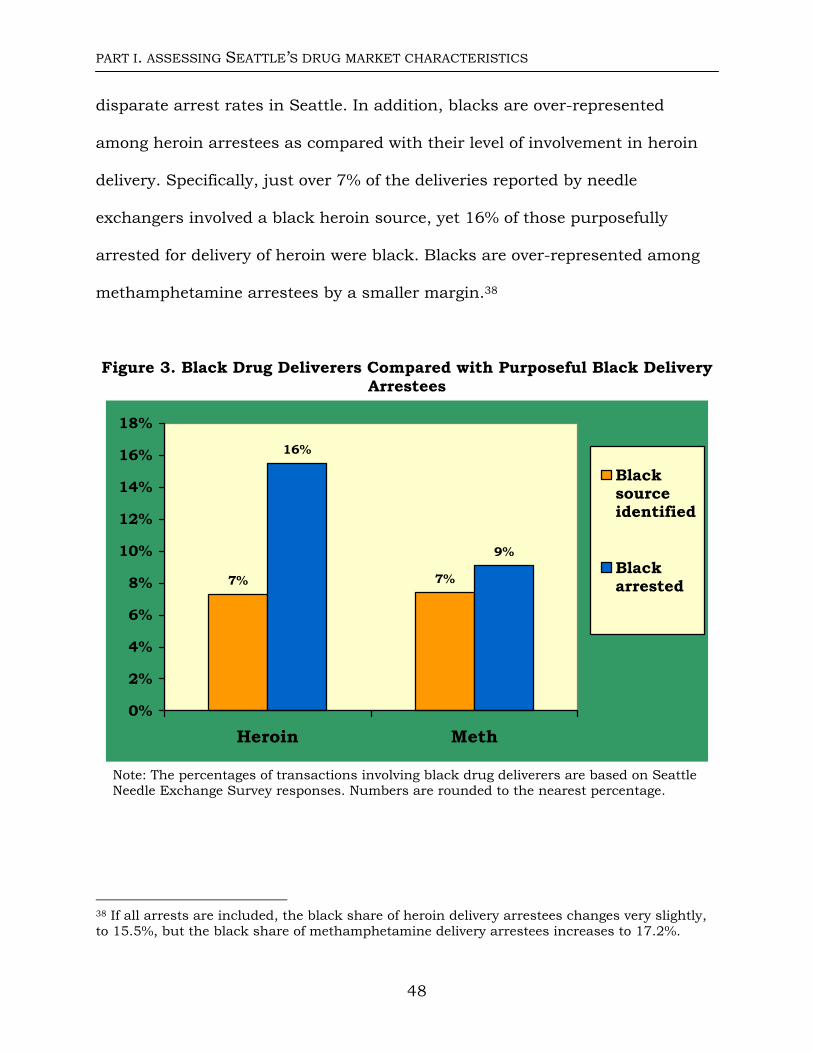
PART I. ASSESSING SEATTLE’S DRUG MARKET CHARACTERISTICS
disparate arrest rates in Seattle. In addition, blacks are over-represented
among heroin arrestees as compared with their level of involvement in heroin
delivery. Specifically, just over 7% of the deliveries reported by needle
exchangers involved a black heroin source, yet 16% of those purposefully
arrested for delivery of heroin were black. Blacks are over-represented among
methamphetamine arrestees by a smaller margin.38
Figure 3. Black Drug Deliverers Compared with Purposeful Black Delivery Arrestees
7% 7%
16%
9%
0%
2%
4%
6%
8%
10%
12%
14%
16%
18%
Heroin Meth
Blacksourceidentified
Blackarrested
Note: The percentages of transactions involving black drug deliverers are based on Seattle Needle Exchange Survey responses. Numbers are rounded to the nearest percentage.
48
38 If all arrests are included, the black share of heroin delivery arrestees changes very slightly, to 15.5%, but the black share of methamphetamine delivery arrestees increases to 17.2%.
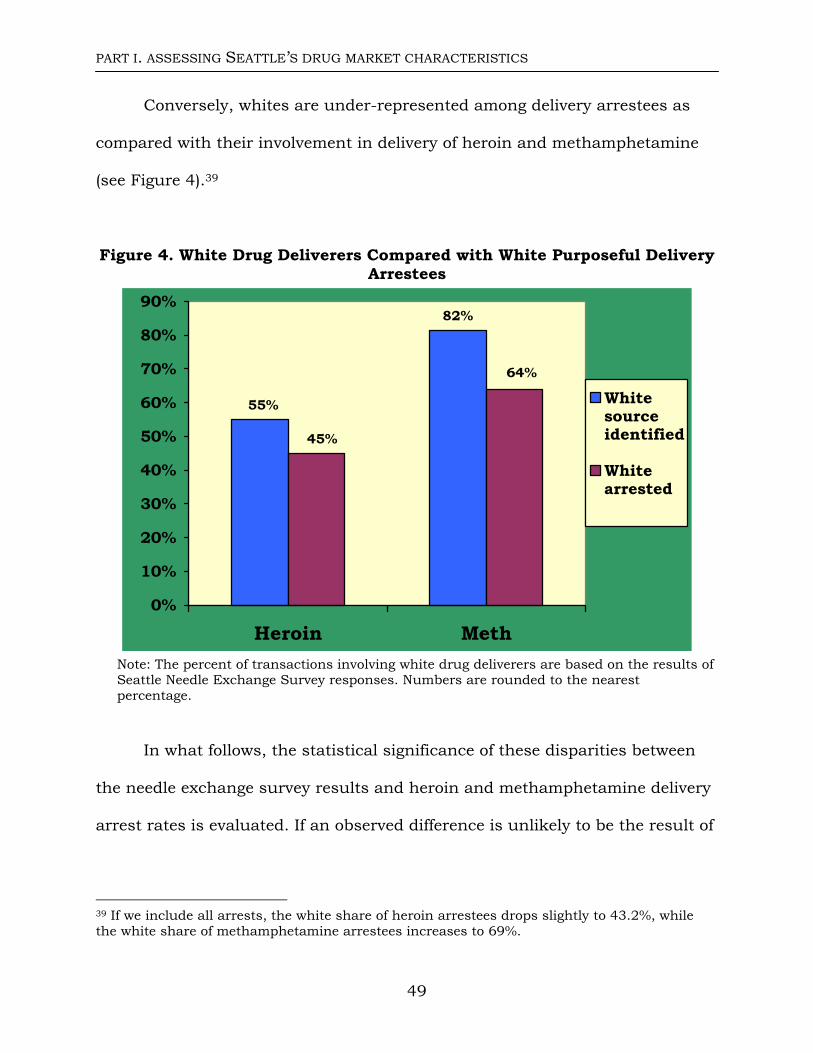
PART I. ASSESSING SEATTLE’S DRUG MARKET CHARACTERISTICS
Conversely, whites are under-represented among delivery arrestees as
compared with their involvement in delivery of heroin and methamphetamine
(see Figure 4).39
Figure 4. White Drug Deliverers Compared with White Purposeful Delivery Arrestees
82%
55%
64%
45%
0%
10%
20%
30%
40%
50%
60%
70%
80%
90%
Heroin Meth
Whitesourceidentified
Whitearrested
Note: The percent of transactions involving white drug deliverers are based on the results of Seattle Needle Exchange Survey responses. Numbers are rounded to the nearest percentage.
In what follows, the statistical significance of these disparities between
the needle exchange survey results and heroin and methamphetamine delivery
arrest rates is evaluated. If an observed difference is unlikely to be the result of
49
39 If we include all arrests, the white share of heroin arrestees drops slightly to 43.2%, while the white share of methamphetamine arrestees increases to 69%.
PART I. ASSESSING SEATTLE’S DRUG MARKET CHARACTERISTICS
chance, researchers conclude that it is statistically significant. By convention,
if the probability that an observed difference between two proportions could be
due to chance is 5% or less it is considered by social scientists to be
statistically significant. In the case at hand, we are dealing with samples that
give us estimates of the proportion of deliverers who are black (or white) and
the proportion of arrestees who are black (or white). Tests of statistical
significance allow us to assess whether, for example, the fact that the
proportion of arrestees who are black is greater than the proportion of
deliverers who are black could be due to the fact that we only have samples of
these two groups. To find this probability, researchers calculate a Z-score that
can be translated into a probability.40
Z-scores with an absolute value of 2 mean that there is at most a 5%
chance of observing a given difference in sample proportions if in fact there is
no difference between the population proportions. Z-scores with an absolute
value of 4 or above mean that there is at most a .01% chance of observing a
given difference in sample proportions if, in fact, there is no difference between
the population proportions. To be concrete, a .01% chance means that that the
likelihood is 1 out of 10,000. Table 7 shows that the likelihood that blacks are
40 The z score for each comparison is calculated according to the following formula:
12 ˆˆ
12
ˆ)ˆˆ(
ππσππ
−
−=z
where 2π̂ is the black (or white) proportion of arrestees and 1π̂ is the black (or white) proportion of drug deliverers. The standard error shown in the denominator is the pooled estimate of the two samples (arrestees and sources).
50
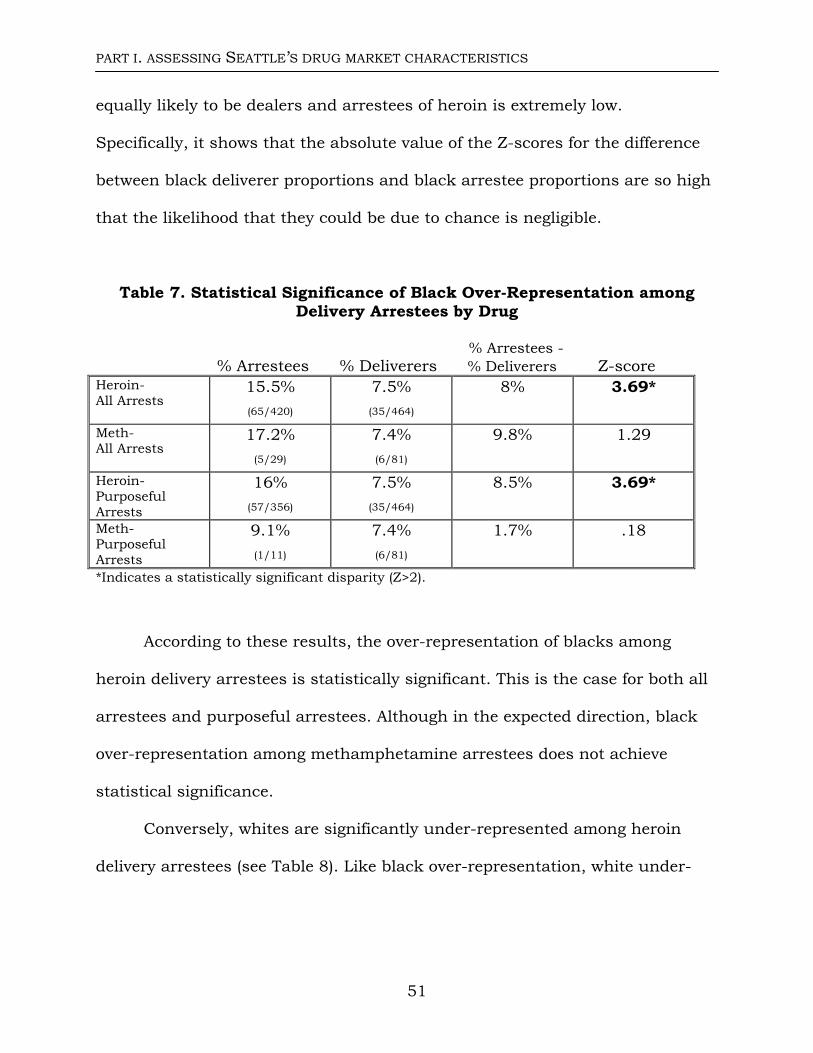
PART I. ASSESSING SEATTLE’S DRUG MARKET CHARACTERISTICS
equally likely to be dealers and arrestees of heroin is extremely low.
Specifically, it shows that the absolute value of the Z-scores for the difference
between black deliverer proportions and black arrestee proportions are so high
that the likelihood that they could be due to chance is negligible.
Table 7. Statistical Significance of Black Over-Representation among Delivery Arrestees by Drug
% Arrestees - % Arrestees % Deliverers % Deliverers Z-score Heroin- All Arrests
15.5% (65/420)
7.5% (35/464)
8% 3.69*
Meth- All Arrests
17.2% (5/29)
7.4% (6/81)
9.8% 1.29
Heroin- Purposeful Arrests
16% (57/356)
7.5% (35/464)
8.5% 3.69*
Meth- Purposeful Arrests
9.1% (1/11)
7.4% (6/81)
1.7% .18
*Indicates a statistically significant disparity (Z>2). According to these results, the over-representation of blacks among
heroin delivery arrestees is statistically significant. This is the case for both all
arrestees and purposeful arrestees. Although in the expected direction, black
over-representation among methamphetamine arrestees does not achieve
statistical significance.
Conversely, whites are significantly under-represented among heroin
delivery arrestees (see Table 8). Like black over-representation, white under-
51
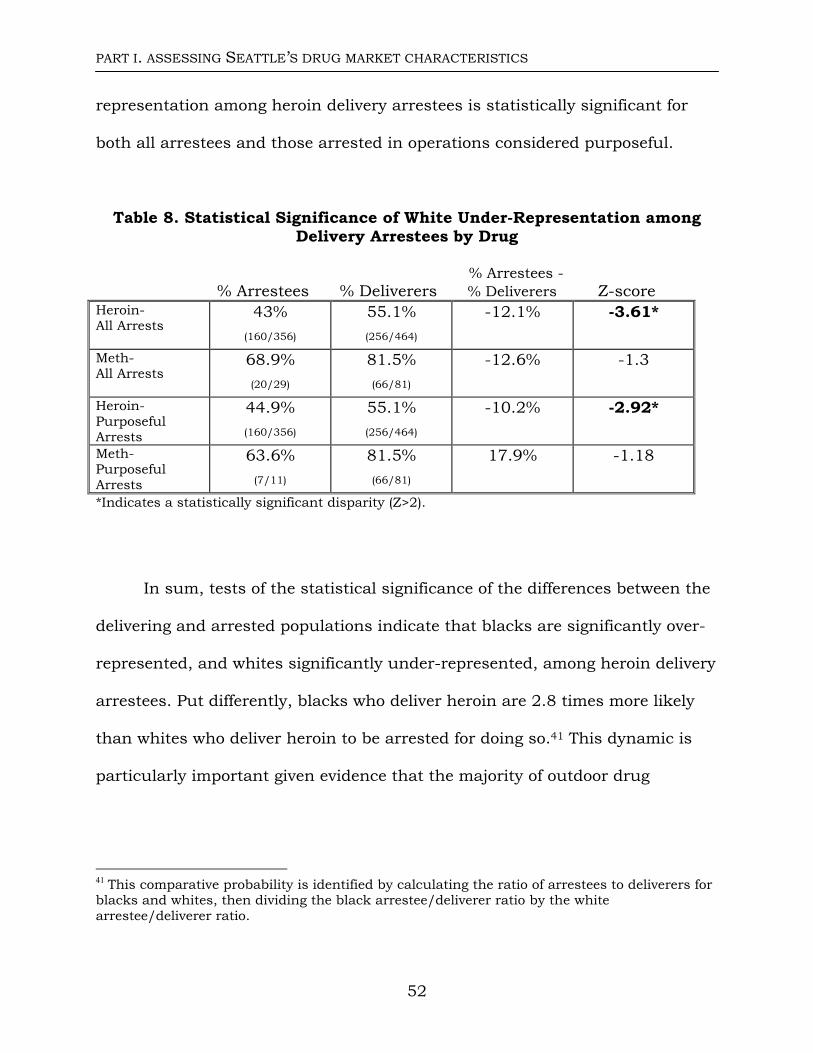
PART I. ASSESSING SEATTLE’S DRUG MARKET CHARACTERISTICS
representation among heroin delivery arrestees is statistically significant for
both all arrestees and those arrested in operations considered purposeful.
Table 8. Statistical Significance of White Under-Representation among Delivery Arrestees by Drug
% Arrestees - % Arrestees % Deliverers % Deliverers Z-score Heroin- All Arrests
43% (160/356)
55.1% (256/464)
-12.1% -3.61*
Meth- All Arrests
68.9% (20/29)
81.5% (66/81)
-12.6% -1.3
Heroin- Purposeful Arrests
44.9% (160/356)
55.1% (256/464)
-10.2% -2.92*
Meth- Purposeful Arrests
63.6% (7/11)
81.5% (66/81)
17.9% -1.18
*Indicates a statistically significant disparity (Z>2). In sum, tests of the statistical significance of the differences between the
delivering and arrested populations indicate that blacks are significantly over-
represented, and whites significantly under-represented, among heroin delivery
arrestees. Put differently, blacks who deliver heroin are 2.8 times more likely
than whites who deliver heroin to be arrested for doing so.41 This dynamic is
particularly important given evidence that the majority of outdoor drug
41 This comparative probability is identified by calculating the ratio of arrestees to deliverers for blacks and whites, then dividing the black arrestee/deliverer ratio by the white arrestee/deliverer ratio.
52
PART I. ASSESSING SEATTLE’S DRUG MARKET CHARACTERISTICS
transactions in Seattle involve heroin and of widespread white involvement in
the outdoor heroin trade.
The neglect of heroin deliverers, and especially white deliverers of heroin,
is the flip side of the SPD’s concentration on those involved in the crack
cocaine market. The predominance of blacks among crack arrestees may or
may not be indicative of actual levels of black involvement in the crack market.
However, it is clear that the predominance of blacks among those arrested for
delivery of serious drugs (including heroin, methamphetamine, powder cocaine,
crack cocaine, and ecstasy) does not reflect the extent of black involvement in
the distribution of all of those substances.
53
These disparities assume even greater significance in light of evidence
that the Seattle Police Department conducts significantly more drug delivery
arrests than comparably sized cities around the country. Specifically, in 2000,
the SPD conducted 187 delivery arrests per 100,000 population; the average
(median) rate of drug delivery arrests from a sample of nine mid-size cities was
42.5 per 100,000. Seattle’s rate of drug delivery arrests was the highest of all
these cities, and tests of statistical significance indicate that the rate of drug
delivery arrests in Seattle is significantly higher than the average rate for these
cities (see Appendix B). Although racial disparity may also exist in cities that
conduct much smaller numbers of drug delivery arrests, the issue assumes
particular importance in Seattle, where the number of drug delivery arrests is
comparatively large. In what follows, the contribution of several other police
practices to racial disparity is assessed.
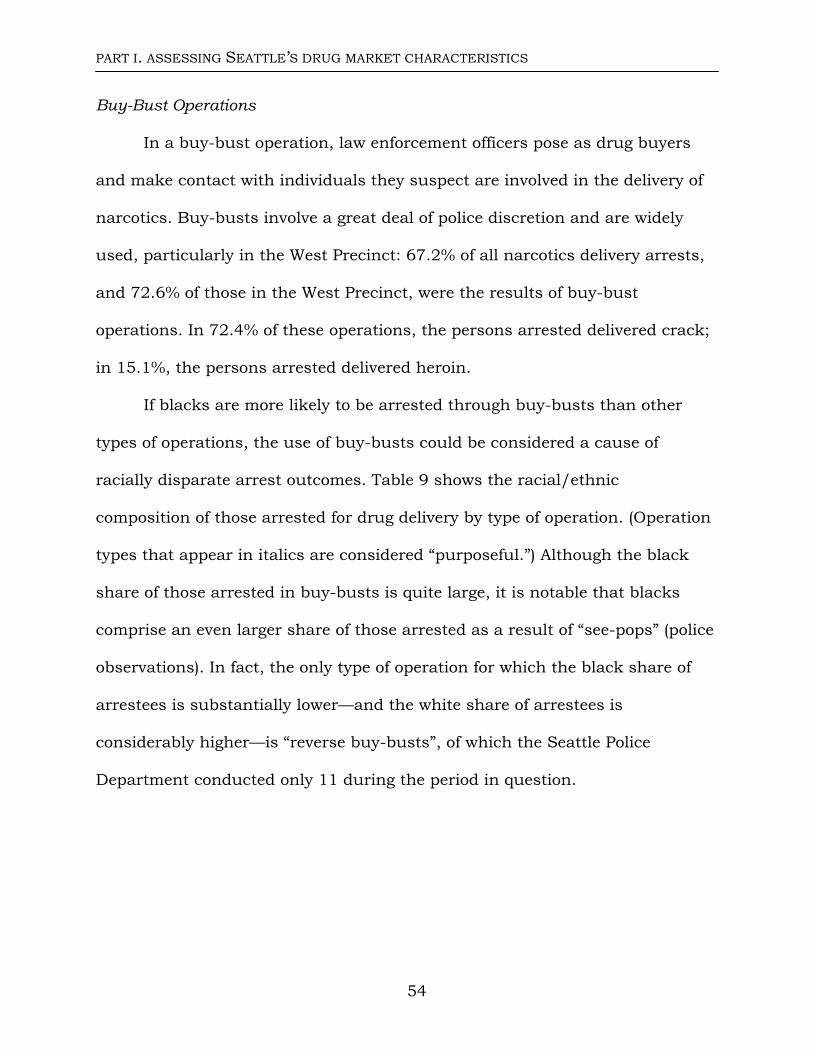
PART I. ASSESSING SEATTLE’S DRUG MARKET CHARACTERISTICS
Buy-Bust Operations
In a buy-bust operation, law enforcement officers pose as drug buyers
and make contact with individuals they suspect are involved in the delivery of
narcotics. Buy-busts involve a great deal of police discretion and are widely
used, particularly in the West Precinct: 67.2% of all narcotics delivery arrests,
and 72.6% of those in the West Precinct, were the results of buy-bust
operations. In 72.4% of these operations, the persons arrested delivered crack;
in 15.1%, the persons arrested delivered heroin.
If blacks are more likely to be arrested through buy-busts than other
types of operations, the use of buy-busts could be considered a cause of
racially disparate arrest outcomes. Table 9 shows the racial/ethnic
composition of those arrested for drug delivery by type of operation. (Operation
types that appear in italics are considered “purposeful.”) Although the black
share of those arrested in buy-busts is quite large, it is notable that blacks
comprise an even larger share of those arrested as a result of “see-pops” (police
observations). In fact, the only type of operation for which the black share of
arrestees is substantially lower—and the white share of arrestees is
considerably higher—is “reverse buy-busts”, of which the Seattle Police
Department conducted only 11 during the period in question.
54
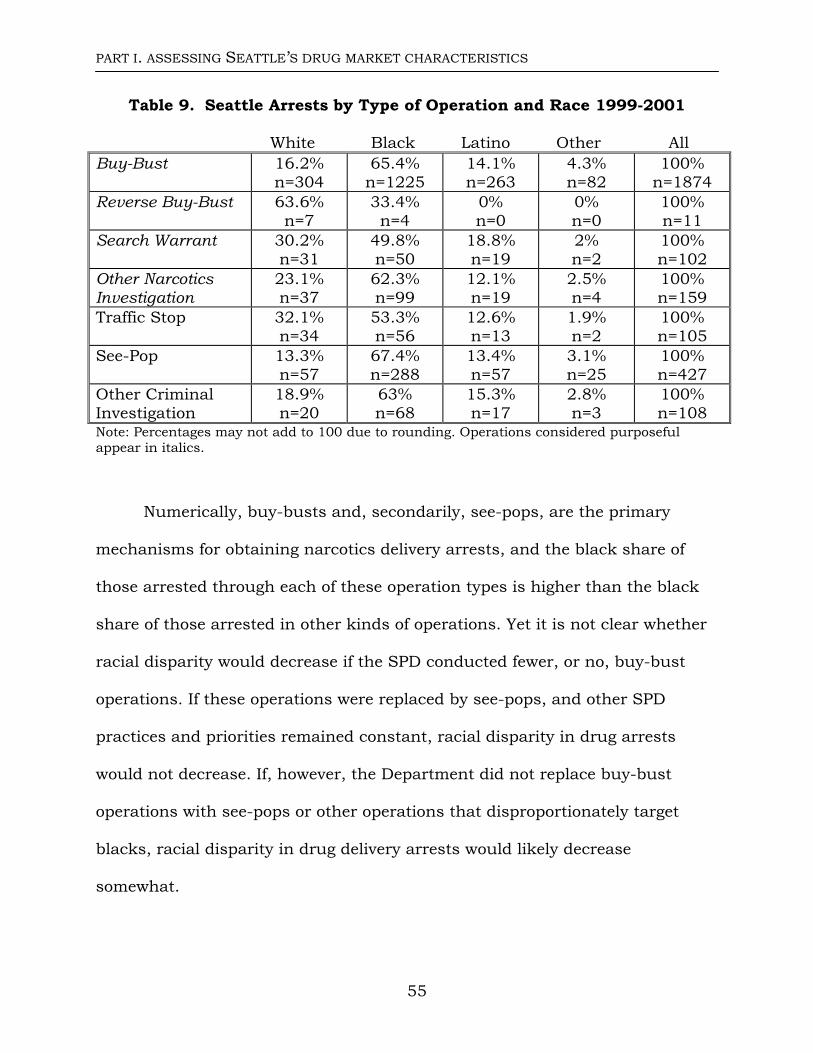
PART I. ASSESSING SEATTLE’S DRUG MARKET CHARACTERISTICS
Table 9. Seattle Arrests by Type of Operation and Race 1999-2001 White Black Latino Other All
Buy-Bust 16.2% n=304
65.4% n=1225
14.1% n=263
4.3% n=82
100% n=1874
Reverse Buy-Bust 63.6% n=7
33.4% n=4
0% n=0
0% n=0
100% n=11
Search Warrant 30.2% n=31
49.8% n=50
18.8% n=19
2% n=2
100% n=102
Other Narcotics Investigation
23.1% n=37
62.3% n=99
12.1% n=19
2.5% n=4
100% n=159
Traffic Stop 32.1% n=34
53.3% n=56
12.6% n=13
1.9% n=2
100% n=105
See-Pop 13.3% n=57
67.4% n=288
13.4% n=57
3.1% n=25
100% n=427
Other Criminal Investigation
18.9% n=20
63% n=68
15.3% n=17
2.8% n=3
100% n=108
Note: Percentages may not add to 100 due to rounding. Operations considered purposeful appear in italics.
Numerically, buy-busts and, secondarily, see-pops, are the primary
mechanisms for obtaining narcotics delivery arrests, and the black share of
those arrested through each of these operation types is higher than the black
share of those arrested in other kinds of operations. Yet it is not clear whether
racial disparity would decrease if the SPD conducted fewer, or no, buy-bust
operations. If these operations were replaced by see-pops, and other SPD
practices and priorities remained constant, racial disparity in drug arrests
would not decrease. If, however, the Department did not replace buy-bust
operations with see-pops or other operations that disproportionately target
blacks, racial disparity in drug delivery arrests would likely decrease
somewhat.
55
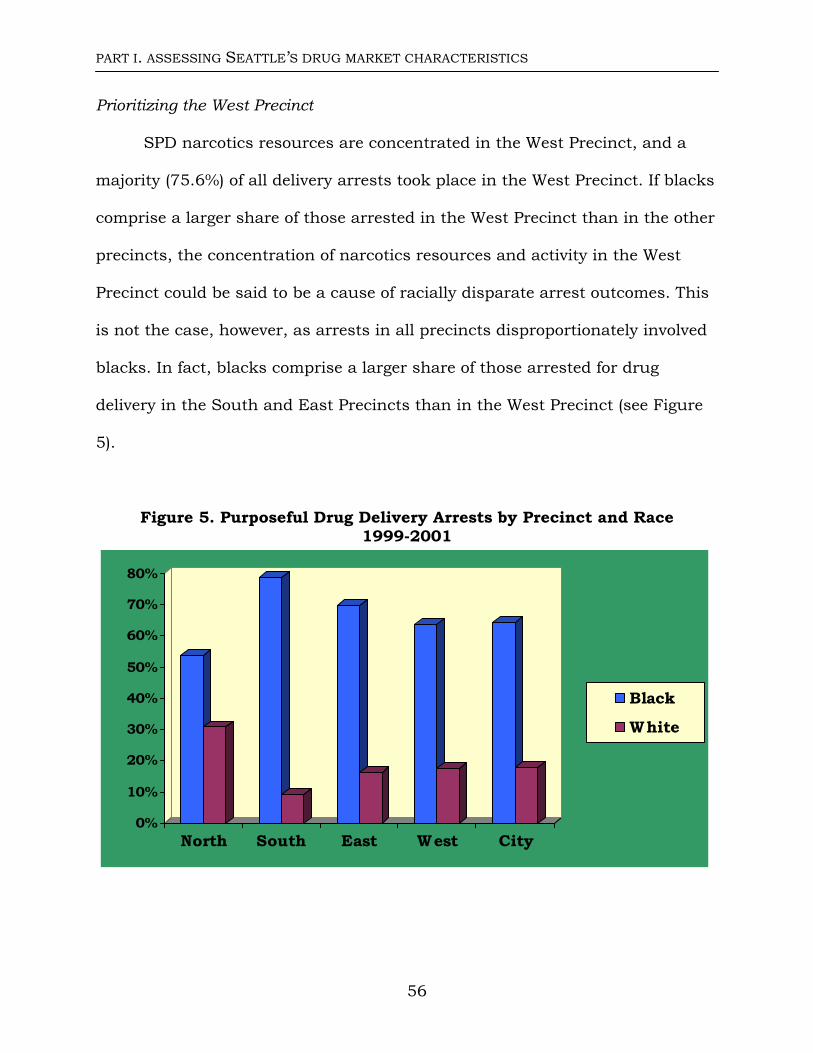
PART I. ASSESSING SEATTLE’S DRUG MARKET CHARACTERISTICS
Prioritizing the West Precinct
SPD narcotics resources are concentrated in the West Precinct, and a
majority (75.6%) of all delivery arrests took place in the West Precinct. If blacks
comprise a larger share of those arrested in the West Precinct than in the other
precincts, the concentration of narcotics resources and activity in the West
Precinct could be said to be a cause of racially disparate arrest outcomes. This
is not the case, however, as arrests in all precincts disproportionately involved
blacks. In fact, blacks comprise a larger share of those arrested for drug
delivery in the South and East Precincts than in the West Precinct (see Figure
5).
Figure 5. Purposeful Drug Delivery Arrests by Precinct and Race 1999-2001
0%
10%
20%
30%
40%
50%
60%
70%
80%
North South East West City
Black
White
56
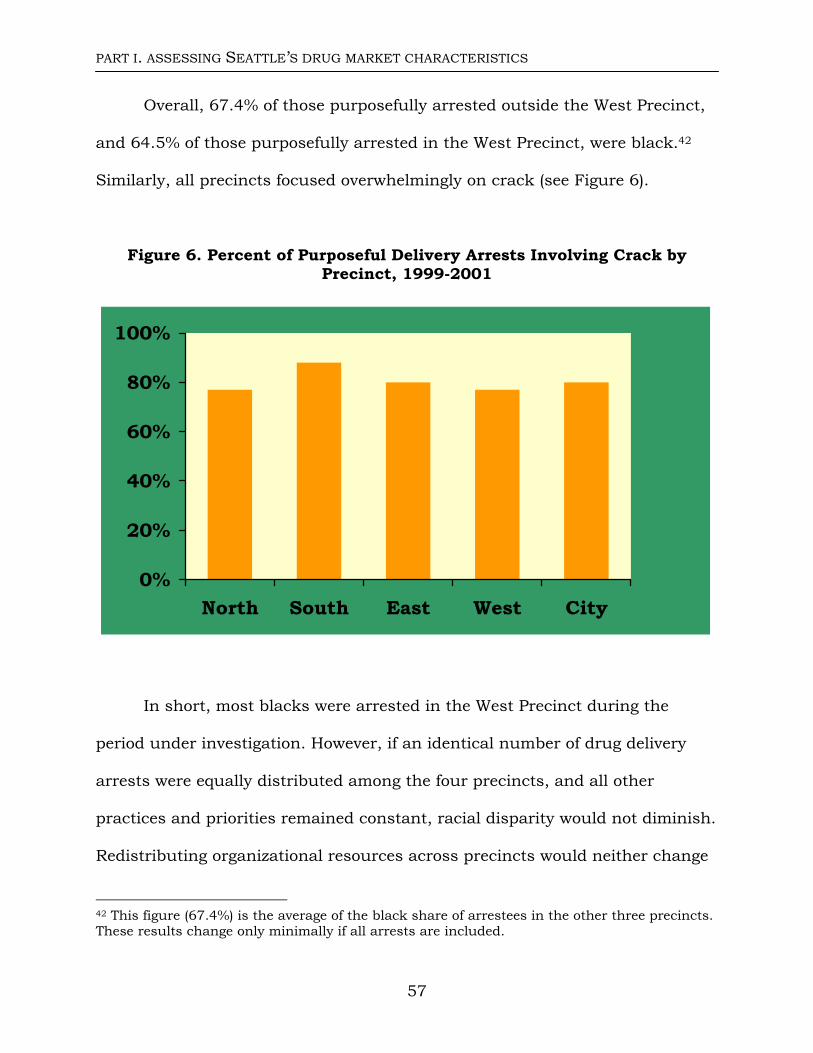
PART I. ASSESSING SEATTLE’S DRUG MARKET CHARACTERISTICS
Overall, 67.4% of those purposefully arrested outside the West Precinct,
and 64.5% of those purposefully arrested in the West Precinct, were black.42
Similarly, all precincts focused overwhelmingly on crack (see Figure 6).
Figure 6. Percent of Purposeful Delivery Arrests Involving Crack by Precinct, 1999-2001
0%
20%
40%
60%
80%
100%
North South East West City
In short, most blacks were arrested in the West Precinct during the
period under investigation. However, if an identical number of drug delivery
arrests were equally distributed among the four precincts, and all other
practices and priorities remained constant, racial disparity would not diminish.
Redistributing organizational resources across precincts would neither change
57
42 This figure (67.4%) is the average of the black share of arrestees in the other three precincts. These results change only minimally if all arrests are included.
PART I. ASSESSING SEATTLE’S DRUG MARKET CHARACTERISTICS
the concentration on crack nor the racial distribution of arrestees unless
enforcement practices and priorities were also altered in more fundamental
ways.
The Focus on Outdoor Drug Markets
In their report, Klement and Siggins (2001) identified the SPD’s focus on
outdoor drug venues as an important cause of racially disparate arrest rates.
The idea that differential access to private space (in the context of law
enforcement’s tendency to conduct narcotics and vice operations in outdoor
settings) introduces race and class biases in arrests has a long pedigree in the
sociological literature (see Chambliss and Seidman 1971; Goode 2002;
Stinchcombe 1963). According to this literature, access to private spaces is
differentially distributed across socio-economic (and hence racial) groups; those
who engage in illicit conduct in public places are more visible to the police and
therefore more likely to be arrested.
58
In these discussions, law enforcement’s tendency to focus on outdoor
venues is often treated as a (racially neutral) organizational and/or legal
necessity. This assumption is not warranted. Although the need to obtain a
search warrant is often cited as an obstacle to indoor narcotics operations,
warrants are not required for entry to commercial establishments.
Furthermore, it is not clear why obtaining a search warrant is an
insurmountable barrier, particularly in light of the tremendous effort and
resources expended to conduct outdoor narcotics operations that yield
PART I. ASSESSING SEATTLE’S DRUG MARKET CHARACTERISTICS
relatively small amounts of drugs.43 Although some outdoor drug arrests are
the incidental consequence of other criminal investigations and traffic stops,
most are the result of proactive efforts to locate and arrest drug deliverers and
buyers. These efforts—mainly buy-bust operations—consume enormous
organizational resources, resources that could be deployed in other ways. In
short, the police focus on outdoor venues is better understood as an
organizational and policy choice than an institutional or legal necessity—one
that has important racial consequences.
Regardless of whether law enforcement’s focus on outdoor drug venues is
understood as racially neutral, the question addressed below is whether the
SPD’s focus on outdoor drug venues explains racially disparate arrest rates.
Over 89.5% of the SPD’s purposeful drug arrests occurred outdoors; only 7.8%
took place indoors (in public or private buildings).44 In the North Precinct,
61.5% of purposeful arrests occurred outdoors, 23.8% indoors. In the South
Precinct, 66.5% of purposeful arrests occurred outdoors, 29.1% indoors. In the
East Precinct, 77.7% of purposeful arrests occurred outdoors, 15.1% indoors.
Finally, in the West Precinct, 96.1% of purposeful arrests occurred outdoors;
only 3% took place indoors. Thus, although this pattern existed across the city,
43 Records of West Precinct ACT operations indicate that buy-bust operations involved an average of 13.3 officers and 76.6 officer hours (49.5 on-duty hours and 27.1 over-time hours). On average, these operations resulted in of 5.6 arrests and the seizure of 6.4 grams of drugs.
59
44 Another 3.8% of drug delivery arrests occurred in or near cars as a result of traffic stops; the location of the remaining 2.4% was not identified. These results change negligibly if all arrests are included. Citywide, 89.5% of all delivery and PWI arrests involving serious drugs occurred outdoors; 7.6% indoors. The pattern also remains constant across precincts.
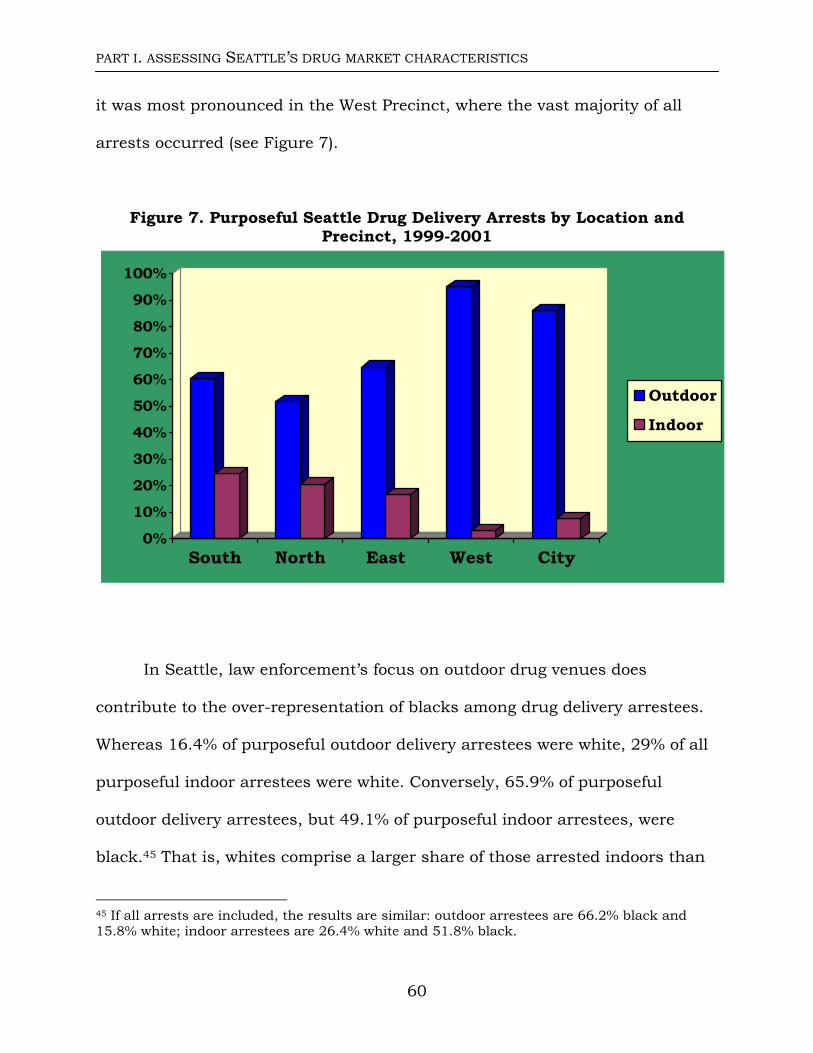
PART I. ASSESSING SEATTLE’S DRUG MARKET CHARACTERISTICS
it was most pronounced in the West Precinct, where the vast majority of all
arrests occurred (see Figure 7).
Figure 7. Purposeful Seattle Drug Delivery Arrests by Location and Precinct, 1999-2001
0%
10%
20%
30%
40%
50%
60%
70%
80%
90%
100%
South North East West City
Outdoor
Indoor
In Seattle, law enforcement’s focus on outdoor drug venues does
contribute to the over-representation of blacks among drug delivery arrestees.
Whereas 16.4% of purposeful outdoor delivery arrestees were white, 29% of all
purposeful indoor arrestees were white. Conversely, 65.9% of purposeful
outdoor delivery arrestees, but 49.1% of purposeful indoor arrestees, were
black.45 That is, whites comprise a larger share of those arrested indoors than
60
45 If all arrests are included, the results are similar: outdoor arrestees are 66.2% black and 15.8% white; indoor arrestees are 26.4% white and 51.8% black.
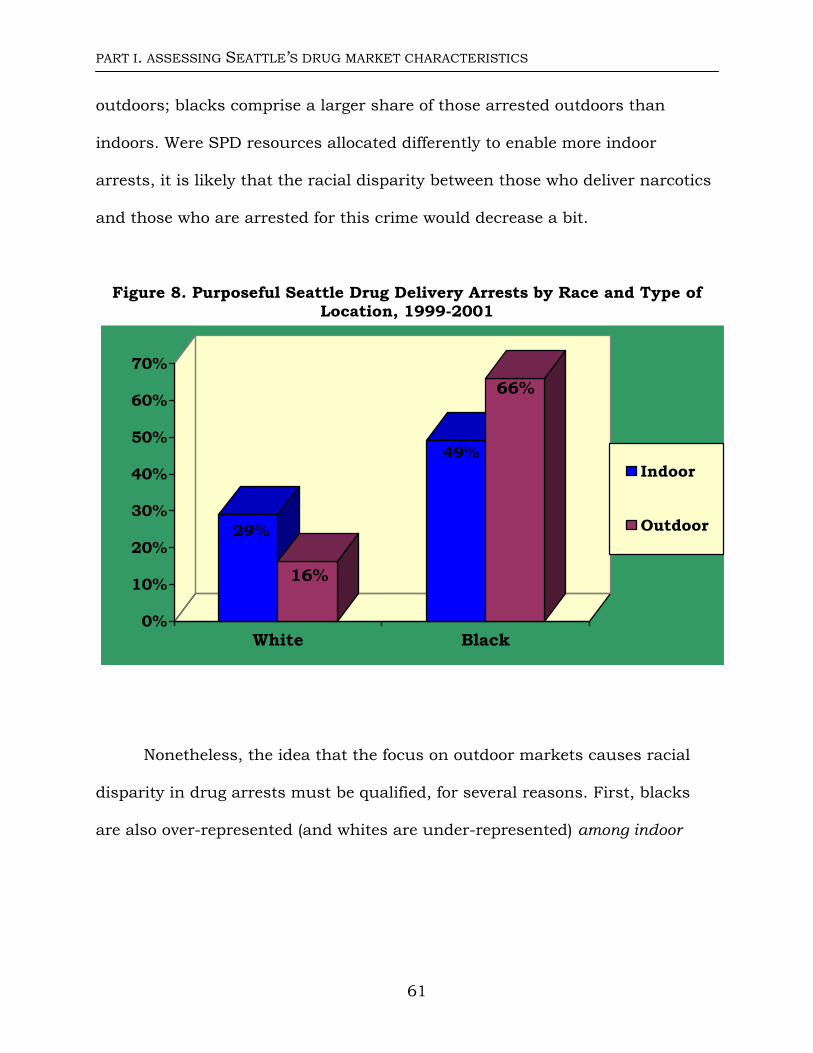
PART I. ASSESSING SEATTLE’S DRUG MARKET CHARACTERISTICS
outdoors; blacks comprise a larger share of those arrested outdoors than
indoors. Were SPD resources allocated differently to enable more indoor
arrests, it is likely that the racial disparity between those who deliver narcotics
and those who are arrested for this crime would decrease a bit.
Figure 8. Purposeful Seattle Drug Delivery Arrests by Race and Type of Location, 1999-2001
29%
16%
49%
66%
0%
10%
20%
30%
40%
50%
60%
70%
White Black
Indoor
Outdoor
Nonetheless, the idea that the focus on outdoor markets causes racial
disparity in drug arrests must be qualified, for several reasons. First, blacks
are also over-represented (and whites are under-represented) among indoor
61
PART I. ASSESSING SEATTLE’S DRUG MARKET CHARACTERISTICS
arrestees compared to their involvement in the delivery of serious drugs.46
Perhaps not coincidentally, 53.3% of those arrested indoors were arrested for
delivering crack. This is pattern is especially puzzling given crack’s reputation
as a drug that is primarily bought and sold outdoors. In fact, if the estimated
number of monthly purchases presented in Table 1 is multiplied by the percent
of ADAM respondents who made their last drug purchase indoors, the results
indicate that only 17% of the indoor drug transactions involving one of the four
drugs for which these data are available involved crack cocaine. It thus appears
that blacks, and crack, are over-represented in indoor delivery arrests.
Second, all outdoor drug markets are not treated alike. In particular,
outdoor drug markets dominated by white buyers and sellers of heroin and
methamphetamine receive significantly less police attention than racially
diverse markets where crack is more likely to be sold. For example, in the
comparison of the Capitol Hill and downtown markets discussed previously
(e.g. Nyrop 2003), researchers were able to observe hundreds of outdoor drug
transactions in the Capitol Hill area, and reported that the vast majority of
these transactions involved only white people. These observations are
consistent with the results of the needle exchange survey: 87% of the drug
transactions described by those who exchanged needles in Capitol Hill involved
a white drug deliverer; only 5% involved a black deliverer.
62
46 The magnitude of these disparities cannot be reliably assessed by drug category given the small number of indoor arrestees.
PART I. ASSESSING SEATTLE’S DRUG MARKET CHARACTERISTICS
Nyrop also noted the near-complete absence of police activity and patrol
in Capitol Hill. By contrast, he and his colleagues observed a good deal of
police activity in the downtown market in which both whites and people of
color participate. The arrest data confirm these observations. From January
1999-April 2001, only 18 persons were purposefully arrested for delivery of
serious drugs in census tracts 74-75 (which encompass the Broadway corridor
in Capitol Hill). By contrast, 548 such arrests occurred in census tract 81, in
which the drug market concentrated around 2nd and Pike is located. That is,
the SPD arrested over 30 times more deliverers of serious drugs in the census
tract encompassing the downtown market at 2nd and Pike than in the two tracts
encompassing the Capitol Hill market. Clearly, this racially diverse downtown
market is accorded a good deal more police attention and resources than the
predominantly white, outdoor market in Capitol Hill.
Although Nyrop did observe more drug activity downtown than in Capitol
Hill, this difference cannot explain the magnitude of the difference between the
arrest rates in the two areas. In 40 hours of observations in the Capitol Hill
area, Nyrop observed 102 drug deliveries—roughly 2.6 deliveries observed per
hour. Downtown, Nyrop observed 690 deliveries in 60 hours, or 11.5 deliveries
per hour. Thus, observed drug deliveries in the downtown market
outnumbered observed drug deliveries in Capitol Hill by a ratio of 4.4 to 1.
63
PART I. ASSESSING SEATTLE’S DRUG MARKET CHARACTERISTICS
However, purposeful downtown delivery arrests outnumbered Capitol Hill
delivery arrests by over 30 to 1.47
The concentration of law enforcement activity in racially diverse or
predominantly black drug markets where crack is more likely to be sold to the
exclusion of predominantly white outdoor drug markets appears not to be
confined to these two areas. For example, in their Incident Reports, police
officers indicate that sections of University Avenue in the University District are
characterized by significant narcotics activity. (Based on the needle exchange
data, the University District market appears to be two-thirds of the size of the
Capitol Hill market.) As in the Capitol Hill area, the overwhelming majority
(90.7%) of the drug transactions reported by University District needle
exchangers involved white drug deliverers; only 1.5% of these transactions
involved a black deliverer.) Nonetheless, the SPD made only 13 purposeful
arrests for delivery of serious drugs in census tracts 53(01) and 53(02), the
tracts that encompass the University District, during the period in question. By
contrast, the SPD made 305 purposeful arrests for delivery of serious drugs in
census tract 92, the tract that encompasses the Pioneer Square market, widely
perceived as a racially diverse or predominantly black drug market. This
comparison thus provides further evidence that predominantly white outdoor
drug markets are treated quite differently by the Seattle Police Department
than the racially diverse or predominantly black drug markets.
64
47 Similarly, there were 724 delivery arrests involving serious drugs downtown, but 28 in the Capitol Hill area—a ratio of over 25 to 1.
PART I. ASSESSING SEATTLE’S DRUG MARKET CHARACTERISTICS
Finally, there is evidence that blacks are over-represented among those
arrested in predominantly white and racially diverse outdoor markets. For
example, based on 60 hours of observation, Nyrop (2003) concluded that there
were slightly more whites than blacks delivering drugs in the 2nd and Pike
vicinity. However, 52.4% of those purposefully arrested for delivery in census
tract 81 (which encompasses this area) from 1999-2001 were black, and 38.2%
of those purposefully arrested were white.48 Blacks also appear to be over-
represented among the suspected drug deliverers arrested in the Capitol Hill
area. According to Nyrop’s observations, the vast majority of drug transactions
in Capitol Hill involved only whites. However, 44.4% of the small number of
persons purposefully arrested for delivery of drugs in that area (i.e. census
tracts 74-5) were black; only 36.4% of those purposefully arrested for delivery
of these substances in that location were white.
In sum, racial disparity in drug delivery arrests is primarily a function of
the SPD’s concentration on racially diverse and predominantly black outdoor
drug venues downtown where crack is more likely to be sold, its targeting of
blacks in those and other venues, and comparative lack of attention to the
heroin trade, and especially to whites who deliver heroin. The next section
considers whether these priorities, and the resulting racial disparity in drug
delivery arrests, can be explained in a racially neutral way.
48 Because they are being compared with Nyrop’s figures, which were not broken down by drug, these figures include those arrested for delivering any illegal drug. If we include only serious drugs, those purposefully arrested in census tract 81 (downtown) were 56.6% black and 22.6% white. The figures for the University District include only those arrested for serious drugs.
65
PART II. EXPLAINING RACIAL DISPARITY IN DRUG DELIVERY ARRESTS
PART II. EXPLAINING RACIAL DISPARITY IN DRUG DELIVERY ARRESTS
66
PART II. EXPLAINING RACIAL DISPARITY IN DRUG DELIVERY ARRESTS
Assessing Racially Neutral Explanations of Racial Disparity
Theoretically, racially disparate drug delivery arrest rates could be an
unintentional by-product of racially neutral practices and priorities. In what
follows, the contribution of two racially neutral factors—community complaints
and crime rates—to racially disparate arrest outcomes is assessed. In addition,
this section considers whether the SPD concentration on crack cocaine can be
explained or justified in racially neutral terms.
Community Complaints
Many officials have suggested that SPD arrest patterns are a response to
community concern (see Klement and Siggins 2001). The Seattle Police
Department keeps records of citizen complaints regarding suspected narcotics
activities in its Narcotics Activity Reports (NARs), and these data can be used to
assess whether or not arrest outcomes are a response to citizen concern
regarding narcotics activity in Seattle. The race/ethnicity of the suspect is
unknown or unidentified in 36% of the reports, and the drug involved is
unknown or unidentified in 58.5% of the records. As a result, these data do not
shed much light on the racial composition of those suspected of delivering
serious illegal drugs, or the particular drugs involved in these activities.
However, data about some of the descriptors (especially type of location and
67
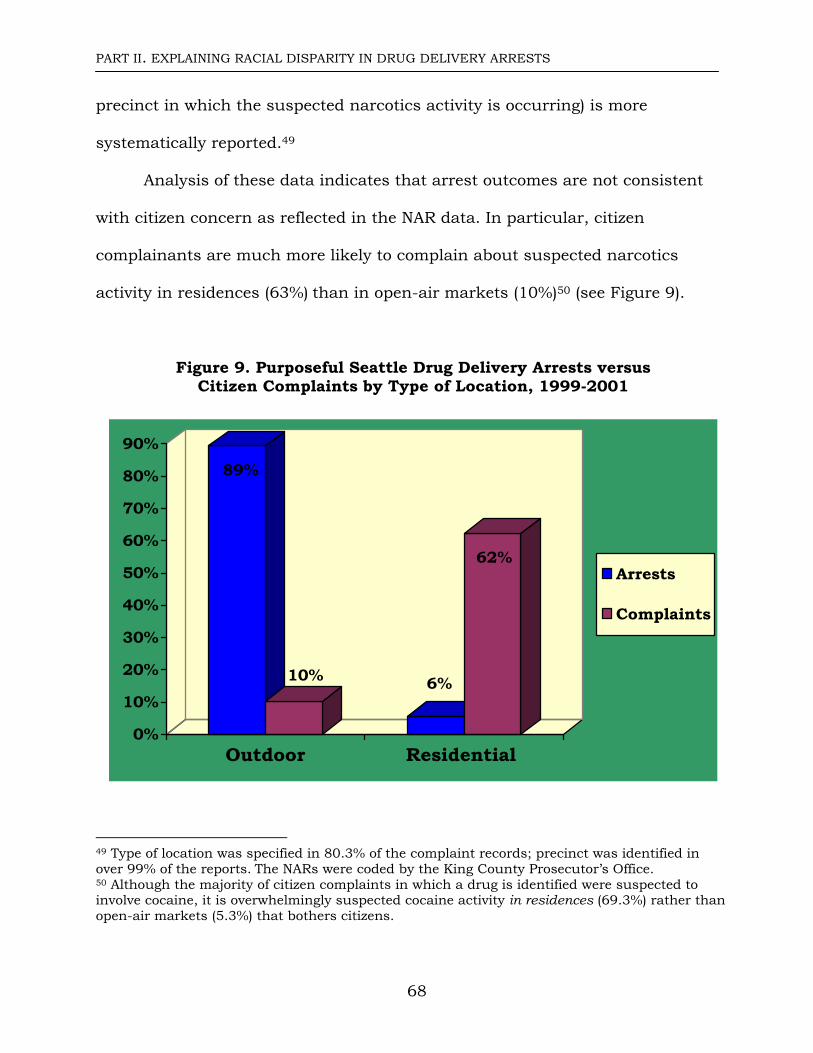
PART II. EXPLAINING RACIAL DISPARITY IN DRUG DELIVERY ARRESTS
precinct in which the suspected narcotics activity is occurring) is more
systematically reported.49
Analysis of these data indicates that arrest outcomes are not consistent
with citizen concern as reflected in the NAR data. In particular, citizen
complainants are much more likely to complain about suspected narcotics
activity in residences (63%) than in open-air markets (10%)50 (see Figure 9).
Figure 9. Purposeful Seattle Drug Delivery Arrests versus Citizen Complaints by Type of Location, 1999-2001
89%
10% 6%
62%
0%
10%
20%
30%
40%
50%
60%
70%
80%
90%
Outdoor Residential
Arrests
Complaints
49 Type of location was specified in 80.3% of the complaint records; precinct was identified in over 99% of the reports. The NARs were coded by the King County Prosecutor’s Office. 50 Although the majority of citizen complaints in which a drug is identified were suspected to involve cocaine, it is overwhelmingly suspected cocaine activity in residences (69.3%) rather than open-air markets (5.3%) that bothers citizens.
68
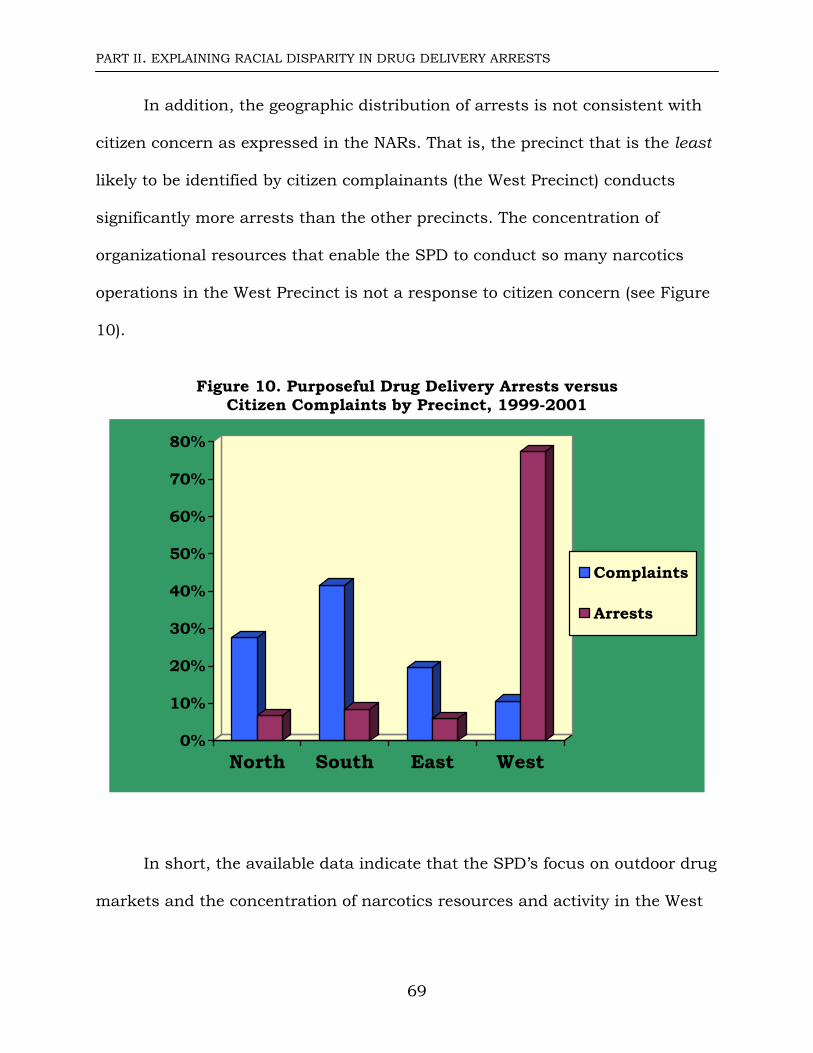
PART II. EXPLAINING RACIAL DISPARITY IN DRUG DELIVERY ARRESTS
In addition, the geographic distribution of arrests is not consistent with
citizen concern as expressed in the NARs. That is, the precinct that is the least
likely to be identified by citizen complainants (the West Precinct) conducts
significantly more arrests than the other precincts. The concentration of
organizational resources that enable the SPD to conduct so many narcotics
operations in the West Precinct is not a response to citizen concern (see Figure
10).
Figure 10. Purposeful Drug Delivery Arrests versus
Citizen Complaints by Precinct, 1999-2001
0%
10%
20%
30%
40%
50%
60%
70%
80%
North South East West
Complaints
Arrests
In short, the available data indicate that the SPD’s focus on outdoor drug
markets and the concentration of narcotics resources and activity in the West
69
PART II. EXPLAINING RACIAL DISPARITY IN DRUG DELIVERY ARRESTS
Precinct are not a function of the citizen concern. In fact, these practices are in
direct contrast to citizen concern as expressed in the NAR data.
Crime Rates
Another possible race-neutral explanation for the uneven nature of drug
law enforcement emphasizes the link between drug markets and crime, and
suggests that particular areas are targeted for drug law enforcement because
they are more crime-ridden than other areas.51 A regression analysis of the
correlation between crimes known to the police and purposeful drug arrests
partially supports this hypothesis, but shows that this association is quite
weak in the census tracts in which the vast majority of drug arrests occur.
Social scientists use regression analysis to assess the strength of an
association (or correlation) between two or more variables. Put differently,
regression analysis allows us to assess how well one variable predicts another.
In this case, we are interested in the correlation between the number of violent
and property crimes known to the police and the number of purposeful drug
delivery arrests.
In this instance, Ordinary Least Squares (OLS) regression techniques
were used to assess the relationship between these two variables. The least
squares regression line in the scatter plot diagram below (Figure 11) shows that
70
51 This approach rests on the assumption that arresting drug sellers and users will decrease crime in those areas. This assumption may not be warranted. In New York, heightened drug law enforcement appears to increase rather than decrease levels of crime (Shepard and Blackley 2003). Others have also noted that disrupting drug markets can actually stimulate competition over turf and thereby increase the violence associated with drug markets (see Blumstein 1995; Taylor and Brownstein 2003.)
PART II. EXPLAINING RACIAL DISPARITY IN DRUG DELIVERY ARRESTS
there is a strong association between the number of crimes known to the police
and the number of purposeful drug delivery arrests, as most observations
(census tracts) fall on or near the line. Analysis of this relationship indicates
that the number of crimes known to the police explains 48.8% of the variation
in the number of purposeful drug delivery arrests across census tracts
(r2=.488). However, the line does a poor job of predicting the relationship
between crimes known to the police and drug delivery arrests in census tracts
80, 81, 91, 92, and 53(01). For example, the slope of the regression line
suggests that when there are approximately 3000 crimes known to police, we
would expect approximately 100 arrests for drug delivery. Yet in census tract
80, where there were approximately 3000 known crimes to police, there were
approximately 300 arrests—3 times what we would expect given the patterns in
arrests across the city as a whole.
In some cases, the number of drug delivery arrests is much higher than
what would be predicted based on crimes known to the police in that tract. In
others, the number of drug delivery arrests is lower than would be predicted on
the basis of the crimes known to the police. The difference between the
predicted number of arrests and the actual number of arrests is referred to as
the residual. The tracts with the largest residuals are called outliers (in this
case, census tracts 80, 81, 91, 92, and 53(01)), and are identified in the scatter
plot below.
71
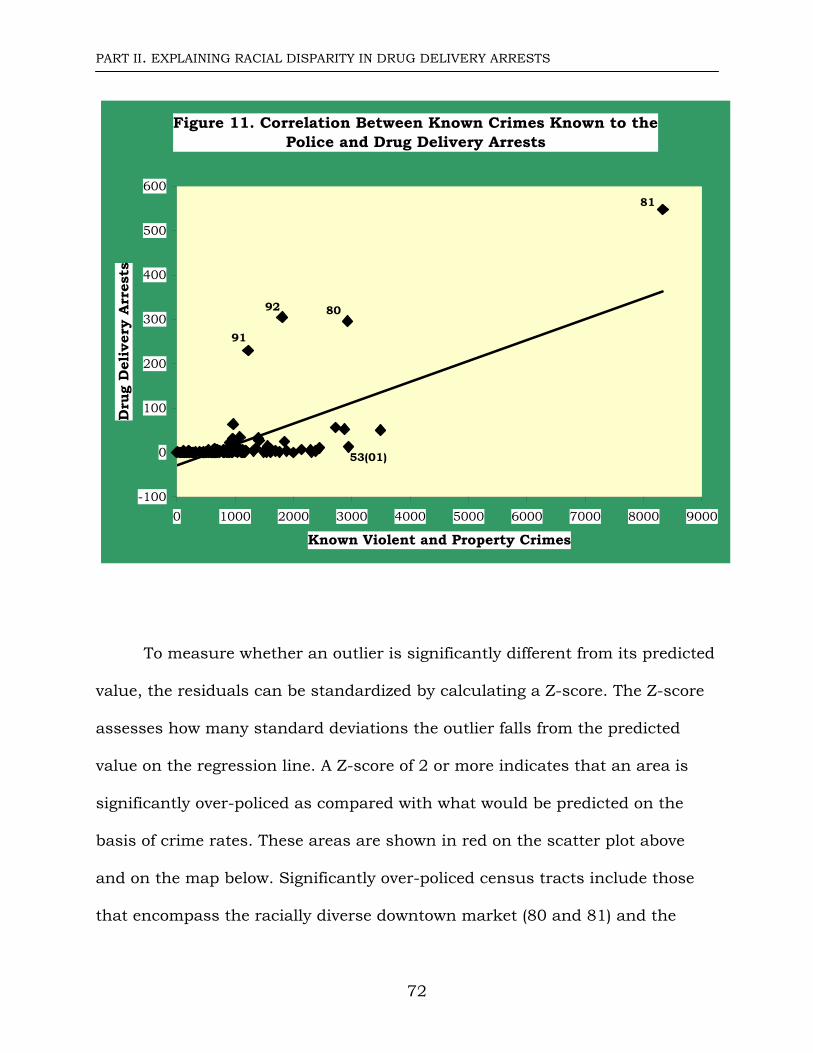
PART II. EXPLAINING RACIAL DISPARITY IN DRUG DELIVERY ARRESTS
Figure 11. Correlation Between Known Crimes Known to the Police and Drug Delivery Arrests
-100
0
100
200
300
400
500
600
0 1000 2000 3000 4000 5000 6000 7000 8000 9000
Known Violent and Property Crimes
Dru
g D
eliv
ery
Arr
ests
91
8092
81
53(01)
To measure whether an outlier is significantly different from its predicted
value, the residuals can be standardized by calculating a Z-score. The Z-score
assesses how many standard deviations the outlier falls from the predicted
value on the regression line. A Z-score of 2 or more indicates that an area is
significantly over-policed as compared with what would be predicted on the
basis of crime rates. These areas are shown in red on the scatter plot above
and on the map below. Significantly over-policed census tracts include those
that encompass the racially diverse downtown market (80 and 81) and the
72
PART II. EXPLAINING RACIAL DISPARITY IN DRUG DELIVERY ARRESTS
markets in Pioneer Square (91 and 92). Census tract 83, shaded pink on the
map below, is comparatively over-policed, although the Z-score for this tract
does not reach conventional levels of statistical significance.
Conversely, a Z-score of less than -2 indicates that an area is
significantly under-policed given the number of crimes known to the police.
Under-policing only reaches conventional levels of statistical significance in
census tract 53(01), the University District, shaded bright blue in the map
below. However, several other tracts, including those that encompass the
predominantly white Capitol Hill drug market (74-5), are also comparatively
under-policed. These tracts are shaded pale blue on the map below (see Figure
12).
73
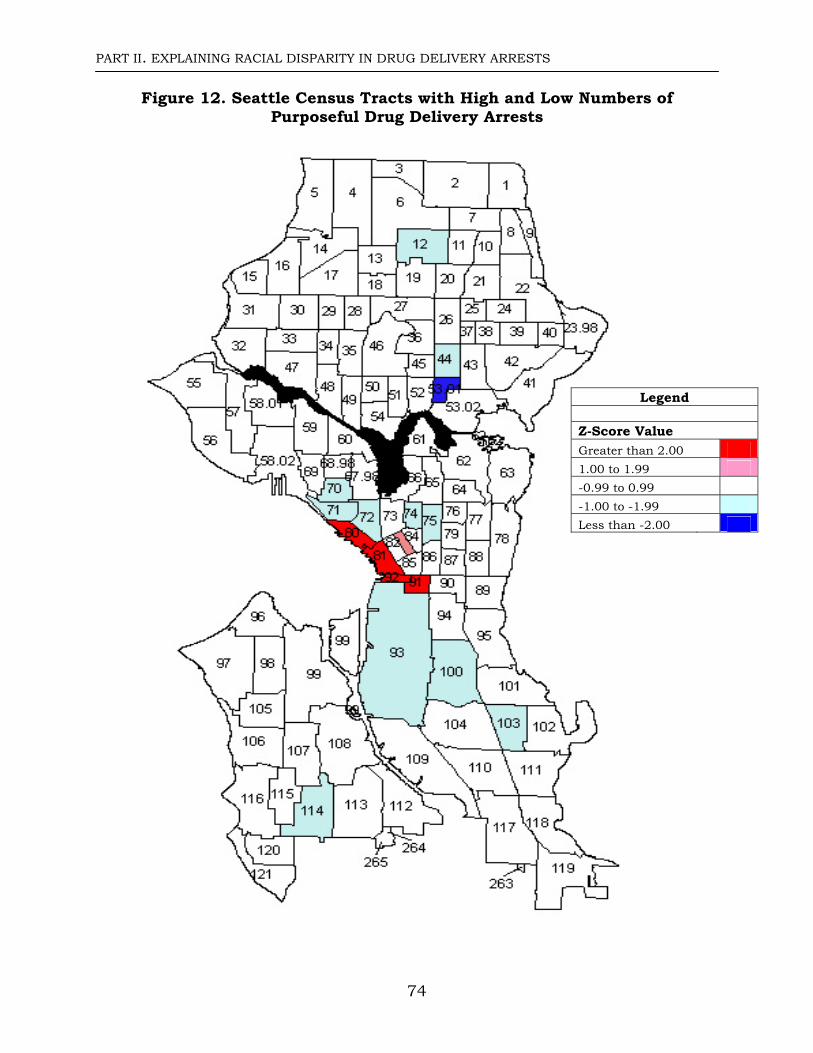
PART II. EXPLAINING RACIAL DISPARITY IN DRUG DELIVERY ARRESTS
Figure 12. Seattle Census Tracts with High and Low Numbers of Purposeful Drug Delivery Arrests
74
Legend
Z-Score Value Greater than 2.00 1.00 to 1.99 -0.99 to 0.99 -1.00 to -1.99 Less than -2.00
PART II. EXPLAINING RACIAL DISPARITY IN DRUG DELIVERY ARRESTS
In short, census tracts 80 and 81 downtown and the Pioneer Square area
experience a significantly greater number of purposeful drug delivery arrests
than would be predicted on the basis of the number of crimes known to the
police in those areas. Although only four census tracts that are significantly
over-policed, the majority—64.3%—of purposeful delivery arrests involving
serious drugs occur in these tracts. Conversely, significantly fewer purposeful
drug delivery arrests the take place in the University District than would be
predicted on the basis of the number of crimes known to the police; Capitol Hill
and several census tracts in the South Precinct are also somewhat under-
policed. Thus, although there is a general correlation between the number of
crimes known to the police and the number of purposeful drug delivery arrests
across the city as a whole, this relationship is quite weak in the downtown
areas where the vast majority of purposeful drug delivery arrests occur. The
overwhelming concentration of narcotics activity in these areas is thus not a
function of the number of crimes known to the police in those areas.
This section considered whether SPD practices and arrest outcomes are
a function of two racially neutral factors—community complaints and crime
rates. The evidence presented indicates that neither of these factors explains
racially disparate arrest outcomes. The remainder of the report considers
whether the SPD’s focus on crack cocaine can be explained or justified in
racially neutral terms.
75
PART II. EXPLAINING RACIAL DISPARITY IN DRUG DELIVERY ARRESTS
Understanding the Focus on Crack
In the 1970s and early 1980s, many cocaine users smoked a relatively
pure form of cocaine called freebase. Because freebase was relatively expensive,
its use was limited to predominantly white, middle and upper class cocaine
users. Although of some concern to public health experts, freebase (smoked
cocaine) was not the subject of much public discussion, and free-basers were
not singled out for more punitive treatment. Despite the fact that an estimated
10-20% of the nation’s cocaine users smoked their cocaine, the typical cocaine-
related news media story focused on white recreational cocaine users who
snorted the drug in its powder form. These stories frequently relied on experts
associated with the drug treatment industry and emphasized the possibility of
recovery (Reeves and Campbell 1994; Beckett and Sasson 1998).
The situation changed rapidly with the arrival of crack, a new and less
expensive form of smokable cocaine, to urban centers of the United States in
the 1980s. By late 1985, a new "siege paradigm” depicting transgressors as
poor and overwhelmingly black users and dealers of crack cocaine dominated
news overage of the drug problem. At the same time, law enforcement officials
took the place of the medical and treatment experts previously identified as
76
drug authorities. As the eighties progressed, camera crews began using
hand-held cameras to cover crack house raids from the vantage point of the
police (Reeves and Campbell 1994; see also Beckett and Sasson 1998;
Reinarman and Levine 1998). Since that time, crack cocaine has been the
subject of an extraordinary amount of media and political attention, and in
PART II. EXPLAINING RACIAL DISPARITY IN DRUG DELIVERY ARRESTS
many jurisdictions, those who use and sell it are subject to more severe
penalties than are those involved with other drugs. It was also during this time
when the national black drug arrest rate began to ascend rapidly.
Those who support policies and practices that treat those who use or sell
crack more harshly than other serious drugs argue that these policies are
appropriate given the greater harm associated with crack market than other
serious drugs (see United States Sentencing Commission 2002). In particular,
the comparative violence of the crack trade is often cited as justification for
policies that target crack offenders for particularly severe penalties. Those
focusing on drug arrests have suggested that the characteristics of the crack
market—particularly the frequency with which it is bought and sold and the
propensity of those who buy or sell it to do so outdoors—explain comparatively
high rates of arrest among crack users and sellers.
By contrast, critics argue that although crack is a powerful and
potentially harmful substance, the charges against crack have been overstated
(see especially Morgan and Zimmer 1998; Reinarman and Levine 1997). From
this perspective, it appears that the association of crack with urban blacks,
rather than the characteristics of crack or the crack market, accounts for the
extraordinary cultural, political, and policy response to those who use or sell
crack cocaine.
77
Indeed, it is difficult to discern whether the SPD’s focus on crack is a
cause or consequence of its concentration on geographic areas in which blacks
are present and on black individuals more generally. There are two
PART II. EXPLAINING RACIAL DISPARITY IN DRUG DELIVERY ARRESTS
possibilities. Either the SPD is targeting blacks and therefore mostly arresting
those involved in the crack market, or it is targeting crack, and therefore
mostly arresting blacks. Assuming the latter, the following analyses consider
whether the overwhelming concentration of SPD resources and attention on the
crack market can be explained in a racially neutral way.
The Characteristics of the Crack Market
As noted previously, some analysts have suggested that racially disparate
arrest rates are a consequence of the fact that crack is purchased more
frequently, and is more likely to be obtained outdoors, than marijuana,
methamphetamine, or powder cocaine (Riley 1997; Sterling 1997). According to
this argument, it is not the race of those involved in the crack market, but
rather the unique characteristics of the crack market that explains high rates
of crack—and black—drug arrests.
78
As was discussed in Part I of this report, data regarding frequency and
location of drug transactions must be combined with data regarding the
number of users to determine whether arrests actually mirror the distribution
of drug transactions. The evidence that accrues from this exercise indicates
that the preponderance of crack offenders among delivery arrestees is not a
function of the distribution of outdoor drug transactions. In particular,
comparison of the estimated number of monthly transactions involving each
drug with the arrest outcomes indicates that there is little correlation between
the frequency of drug transactions and drug arrest patterns in Seattle. This
PART II. EXPLAINING RACIAL DISPARITY IN DRUG DELIVERY ARRESTS
remains true when we compare the distribution of outdoor drug transactions
and the drugs involved in SPD arrests.
The estimated number of monthly transactions shown below is based on
the calculations presented in Table 1 of this report. The results of that analysis
indicate that 27% of all drug transactions in Seattle involving one of the four
serious drugs considered involved crack, yet the vast majority of purposeful
delivery arrests involve crack. Even if we accept the SPD’s focus on outdoor
drug venues, the focus on crack is not explicable in terms of the frequency of
crack transactions. That is, there is little correspondence between the
representation of drugs in outdoor transactions and the representation of drugs
in SPD arrests.
79
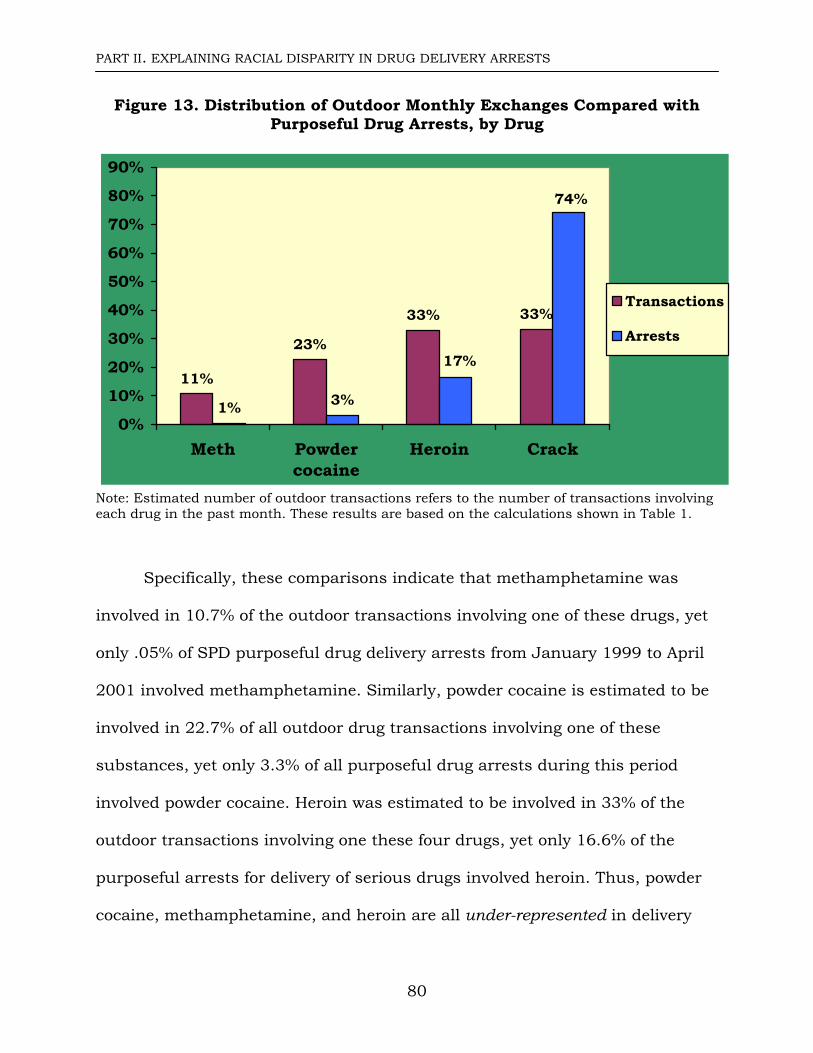
PART II. EXPLAINING RACIAL DISPARITY IN DRUG DELIVERY ARRESTS
Figure 13. Distribution of Outdoor Monthly Exchanges Compared with Purposeful Drug Arrests, by Drug
33% 33%
1%
11%
23%
74%
17%
3%0%
10%
20%
30%
40%
50%
60%
70%
80%
90%
Meth Powdercocaine
Heroin Crack
Transactions
Arrests
Note: Estimated number of outdoor transactions refers to the number of transactions involving each drug in the past month. These results are based on the calculations shown in Table 1.
Specifically, these comparisons indicate that methamphetamine was
involved in 10.7% of the outdoor transactions involving one of these drugs, yet
only .05% of SPD purposeful drug delivery arrests from January 1999 to April
2001 involved methamphetamine. Similarly, powder cocaine is estimated to be
involved in 22.7% of all outdoor drug transactions involving one of these
substances, yet only 3.3% of all purposeful drug arrests during this period
involved powder cocaine. Heroin was estimated to be involved in 33% of the
outdoor transactions involving one these four drugs, yet only 16.6% of the
purposeful arrests for delivery of serious drugs involved heroin. Thus, powder
cocaine, methamphetamine, and heroin are all under-represented in delivery
80
PART II. EXPLAINING RACIAL DISPARITY IN DRUG DELIVERY ARRESTS
arrests. By contrast, crack cocaine is dramatically over-represented in these
arrests: although an estimated 33% of all outdoor drug transactions involving
one of these four drugs involve crack, over 74% of the purposeful arrests for
delivery of these serious drugs involved crack cocaine.
In short, the best available evidence indicates that the arrest of
comparatively large numbers of crack deliverers is not a function of the
frequency with which crack is delivered outdoors. This finding is further
supported by evidence that the downtown drug market that is the source of so
many SPD drug arrests is dominated by heroin rather than crack (Nyrop
2003).52 Nonetheless, of those purposefully arrested downtown for delivering
the serious drugs considered in this report, 60% were arrested for crack
delivery; 33.9% were arrested for delivering heroin. Thus, it does not appear
that prevalence of crack use in the Seattle area, the frequency with which it is
delivered outdoors, or even the geographic concentration of police attention to
the downtown area can explain the preponderance of crack deliverers among
arrestees.
52 The results of the needle exchange survey provide further evidence of widespread heroin use downtown. Historically, the downtown needle exchange site has served the largest numbers of clients; of the 368 needle exchangers surveyed downtown, 305 identified heroin as their primary drug. Of these heroin users, 43.7% report having acquired their heroin from a white person; 33.7% from Latino person; and 8.8% from someone who is black. However, over 15% of those arrested downtown for heroin delivery were black.
81
PART II. EXPLAINING RACIAL DISPARITY IN DRUG DELIVERY ARRESTS
Violence and the Crack Market
The extent and nature of the violence associated with the crack trade is
of particular concern to those debating sentencing laws that target crack users
and deliverers for especially severe penalties. It is possible that any association
of the crack market with an unusual degree of violence could also justify law
enforcement’s focus on crack.53 However, the evidence indicates that Seattle’s
crack market is not more violent than other illegal drug markets.
Although the crack trade has been associated with high levels of
systemic violence54 in some cities during some periods of time (Blumstein
1995; Brownstein et al 1992; Goldstein et al 1989), police officials have noted
that this association does not appear to exist in Seattle during the period in
question (quoted in Klement and Siggins 2001: 37). 55 SPD Anti-Crime Teams
(ACT) records identifying weapons seized in the course of narcotics operations
53 This logic is contestable, however. First, even if there is more violence associated with the crack trade than with other drug markets, many of those involved in that trade do not resort to violence, and a more individualized approach to the problem of violence is therefore warranted. Second, insofar as most of the violence associated with illegal drugs is a function of the illegal and unregulated nature of the markets for those drugs, the violence may be better understood as a consequence of criminal law rather than the drugs themselves. Finally, there is evidence that drug arrests actually disrupt drug markets and increase violence rather than vice versa (Shepard and Blackley 2003). 54 Systemic violence results from the illegal and unregulated nature of the drug trade rather than the psychotropic effects of the drug (see Goldstein et al 1989).
82
55 There is evidence that the association between the crack market and systemic violence in the 1980s and early 1990s may have been a function of the novelty of the drug and resulting instability of the drug market (Blumstein 1995; Taylor and Brownstein 2003.) As the crack market has stabilized, the connection between the crack market and systemic violence, as well as the difference between the crack market and other drug markets, has diminished. For example, the Sentencing Commission reports that a minority of federal level crack offenders, and only a slightly smaller share of federal level powder cocaine offenders, possessed a weapon at the time of their arrest in 2000 (USSC 2002).
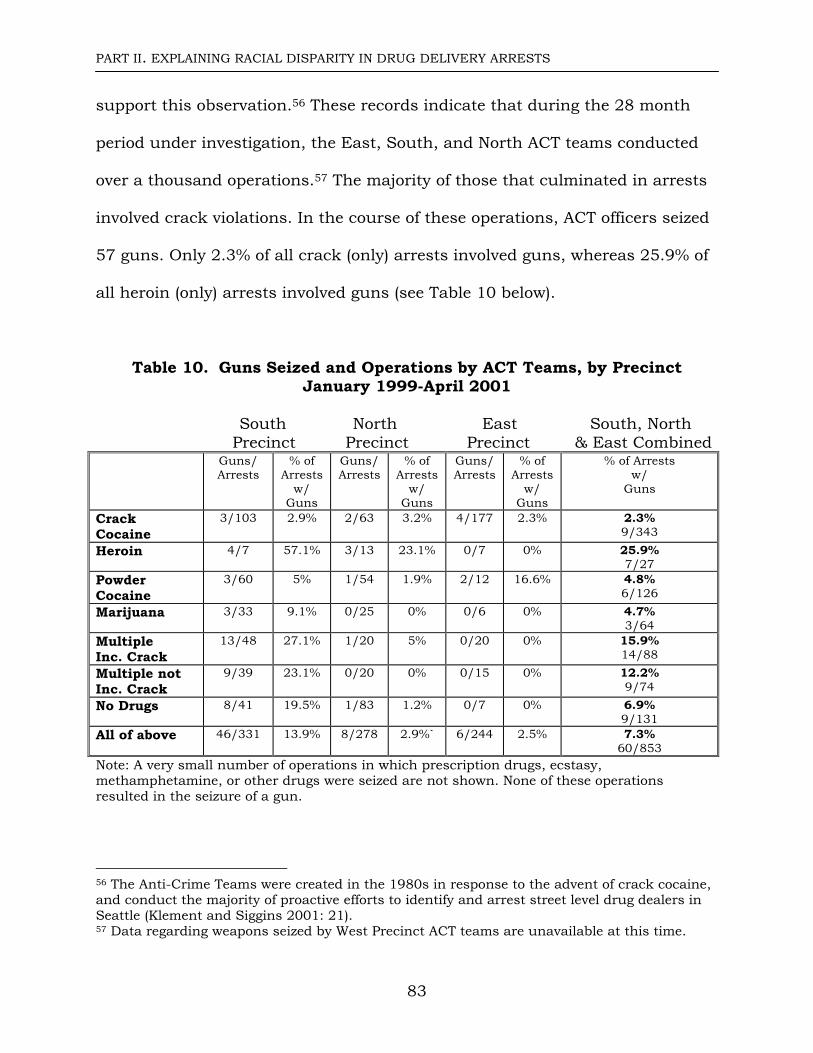
PART II. EXPLAINING RACIAL DISPARITY IN DRUG DELIVERY ARRESTS
support this observation.56 These records indicate that during the 28 month
period under investigation, the East, South, and North ACT teams conducted
over a thousand operations.57 The majority of those that culminated in arrests
involved crack violations. In the course of these operations, ACT officers seized
57 guns. Only 2.3% of all crack (only) arrests involved guns, whereas 25.9% of
all heroin (only) arrests involved guns (see Table 10 below).
Table 10. Guns Seized and Operations by ACT Teams, by Precinct January 1999-April 2001
South North East South, North Precinct Precinct Precinct & East Combined
Guns/ Arrests
% of Arrests
w/ Guns
Guns/ Arrests
% of Arrests
w/ Guns
Guns/ Arrests
% of Arrests
w/ Guns
% of Arrests w/
Guns
Crack Cocaine
3/103 2.9% 2/63 3.2% 4/177 2.3% 2.3% 9/343
Heroin 4/7 57.1% 3/13 23.1% 0/7 0% 25.9% 7/27
Powder Cocaine
3/60 5% 1/54 1.9% 2/12 16.6% 4.8% 6/126
Marijuana 3/33 9.1% 0/25 0% 0/6 0% 4.7% 3/64
Multiple Inc. Crack
13/48 27.1% 1/20 5% 0/20 0% 15.9% 14/88
Multiple not Inc. Crack
9/39 23.1% 0/20 0% 0/15 0% 12.2% 9/74
No Drugs 8/41 19.5% 1/83 1.2% 0/7 0% 6.9% 9/131
All of above 46/331 13.9% 8/278 2.9%` 6/244 2.5% 7.3% 60/853
Note: A very small number of operations in which prescription drugs, ecstasy, methamphetamine, or other drugs were seized are not shown. None of these operations resulted in the seizure of a gun.
56 The Anti-Crime Teams were created in the 1980s in response to the advent of crack cocaine, and conduct the majority of proactive efforts to identify and arrest street level drug dealers in Seattle (Klement and Siggins 2001: 21).
83
57 Data regarding weapons seized by West Precinct ACT teams are unavailable at this time.
PART II. EXPLAINING RACIAL DISPARITY IN DRUG DELIVERY ARRESTS
In short, the available evidence indicates that crack arrests are less, not
more, to involve gun seizure by the SPD.
Crack and Public Health
A final, race-neutral explanation for law enforcement’s focus on crack
emphasizes the adverse health consequences of that particular substance.
While such adverse health effects surely exist, the extent of the focus on crack
cannot be justified in public health terms. As is now well known among social
scientists, early claims regarding crack’s propensity to cause addiction were
wildly exaggerated (see Morgan and Zimmer 1998; Reinarman and Levine
1998; Reinarman, Murphy and Waldorf 1994; Waldorf, Murphy and Reinarman
1991). For example, the vast majority of those who try crack cocaine do not go
on to be regular users of crack (Morgan and Zimmer 1998: 143-4). In fact,
there is some evidence that those who use cocaine (in any form) are less likely
to report being unable to stop using the drug than users of most other drugs
(ibid: 146).
Similarly, the harm posed to fetal and infant health by crack use has
been exaggerated. Researchers have found that more than two-thirds of crack-
exposed infants suffer no adverse consequences at birth, and that both
prenatal and postnatal interventions may prevent or ameliorate developmental
problems for those infants who are harmed as a result of their prenatal
exposure to drugs (Chasnoff et al 1992; Humphries 1993; Mathias 1992). A
meta-analysis of the available research shows that the babies of women who
84
PART II. EXPLAINING RACIAL DISPARITY IN DRUG DELIVERY ARRESTS
use crack have similar health outcomes as those born to women who use any
drug (legal or illegal) during pregnancy (Lutiger et al 1991). Thus, while efforts
to reduce drug use among pregnant women are warranted, there is no reason
to single out those who use crack.
Local mortality data are also inconsistent with a public health rationale
for the focus on crack. From 1999-2001, the Office of the King County Medical
Examiner found that 279 narcotics overdose deaths involved heroin, and
another 123 involved other opiates, whereas 213 overdose deaths involved
cocaine (which may have been snorted, smoked, or injected).58 Furthermore,
the public health consequences of intravenous drug use—which is most likely
to involve heroin—are arguably far greater than those posed by crack use. Of
course, all of this begs the question of whether a public health problem can be
effectively addressed through law enforcement, but the point here is that there
is no clear public health rationale for law enforcement’s prioritization of crack
cocaine over other serious drugs considered in this report.
85
58 These data record deaths directly caused by drug overdose; they do not include those caused by poison. Many individuals who die of an overdose have more than one drug in their bloodstream. The numbers presented in the text represent the number of times each type of narcotic is listed as a cause of death. Data were provided to the author by Caleb Banta-Green, Research Consultant at the Alcohol & Drug Abuse Institute, University of Washington.
CONCLUSION
CONCLUSION
This report examines a wide range of data sources to assess whether
blacks are over-represented, and whites under-represented, among those
arrested for drug delivery given the racial composition of those who deliver
heroin, methamphetamine, powder cocaine, crack cocaine, and ecstasy in
Seattle. The evidence indicates that Seattle has comparatively high drug use
rates, especially for heroin and methamphetamine. The available data further
indicate that crack cocaine and heroin are each involved in approximately one-
third of Seattle’s outdoor drug transactions. A variety of data sources indicate
that the majority of those using and delivering serious drugs, with the possible
exception of crack cocaine, are white.
Comparison of these findings with the arrest outcomes indicates that
blacks are significantly over-represented and whites under-represented among
those arrested for delivering serious drugs in Seattle. Several inter-related
police practices and priorities appear to account for this disparity. First, the
Seattle Police department concentrates its narcotics enforcement activities
overwhelmingly on areas that include racially diverse drug markets in which
crack is more likely to be sold. By contrast, the SPD conducts very few
operations in open-air drug markets where whites, and heroin, predominate. In
addition, blacks are over-represented among those arrested indoors and among
those arrested in racially diverse or predominantly white outdoor settings.
Finally, blacks are significantly over-represented, and whites significantly
86
CONCLUSION
under-represented, among heroin delivery arrestees given their involvement in
heroin delivery.
Although it is difficult to disentangle the SPD’s focus on crack from its
focus on blacks, it appears that the Seattle Police Department’s overwhelming
focus on those involved in the crack market is a leading cause of racially
disparate arrest outcomes. This focus on crack cocaine is not explicable in
terms of the frequency or location of crack transactions: although an estimated
one-third of all outdoor drug transactions involving serious drugs involve
crack, over 74% of those arrested for delivering these drugs in Seattle were
arrested for delivery of crack cocaine. Nor is the focus on crack a consequence
of any particular association of Seattle’s crack trade with violence or public
health considerations. More generally, SPD arrest patterns do not appear to be
explicable in terms of crime rates or community complaints.
In short, neither racially disparate arrest outcomes, nor the focus on
crack, appear to be explicable in a racially neutral way. Rather, these patterns
appear to reflect a racialized conception of who and what comprises the drug
problem in Seattle. This apparent racialization of the drug problem and of drug
law enforcement is a particularly important problem given the comparatively
high number of drug delivery arrests that take place in Seattle. Remedying
racial disparity in drug law enforcement will require a thorough re-thinking
and reorientation of Seattle Police Department drug law enforcement practices.
87
REFERENCES
REFERENCES
Adler, Patricia. 1985. Wheeling and Dealing: An Ethnography of an Upper-Level Drug Dealing and Smuggling Community. New York: Columbia University Press. Arria, A.M., G.S. Yacoubian Jr., E. Fost, and E.D. Wish. 2002. “The Pediatric Forum: Ecstasy Use among Club Rave Attendees.”Archives of Pediatrics & Adolescent Medicine 156, 3, 295-6. Austin, Roy L. and Mark D. Allen. 2000. “Racial Disparity in Arrest Rates as an Explanation of Racial Disparity in Commitment to Pennsylvania’s Prisons.” Journal of Research in Crime and Delinquency 37, 2, 200-221. Banta-Green, Caleb et al. 2002. “Recent Drug Abuse Trends in the Seattle-King County Area.” Epidemiologic Trends in Drug Abuse (December 2002). Beckett, Katherine and Theodore Sasson. 1998. “The Media and the Construction of the Drug Crisis in America.” In The New War on Drugs: Symbolic Politics and Criminal Justice Policy, edited by Eric Jensen and Jurg Gerber. New York: Anderson Publishers. Beckett, Katherine and Theodore Sasson. 2004. The Politics of Injustice. Beverly Hills, CA: Sage Publications, 2nd edition. Blumstein, Alfred. 1993. “Racial Disproportionality of U.S. Prison Populations Revisited.” University of Colorado Law Review 64. Bourgois, Philippe. 1995. In Search of Respect: Selling Crack in El Barrio. Cambridge University Press. Brownsberger, William N. 2002. “Race Matters: Disproportionality of Incarceration for Drug Dealing in Massachusetts.” Journal of Drug Issues 30 (2), 345-374. Chasnoff, Ira J., D.R. Griffith, C. Freier, and J. Murray. 1992. Cocaine/Polydrug Use in Pregnancy: Two-year Follow-Up. Pediatrics 89, 337-9. Davies, Sharon L. “Study Habits: Probing Modern Attempts to Assess Minority Offender Disproportionality.” Law and Contemporary Problems 66, 17, 17-48. Donziger, Steven R., editor. 1996. The Real War on Crime: The Report of the National Crime Commission (New York: HarperPerennial).
88
REFERENCES
Dunlap, Eloise, Bruce D. Johnson, and Lisa Maher. 1997. “Female Crack Sellers in New York City: Who They Are and What They Do.” Women and Criminal Justice 1997, 8, 4, 25-55. Goode, Erich. 2002. “Drug Arrests at the Millennium.” Society 39, 5 (259), 41-5. Hagedorn, John M. 1994. “Homeboys, Dope Fiends, Legits, and New Jacks.” Criminology 32, 2, 197-219. Humphries, Drew. 1993. “Crack Mothers, Drug Wars, and the Politics of Resentment.” In Kenneth D. Tunnell (Ed), Political Crime in Contemporary America: A Critical Approach. New York: Garland Press. Hunt, Dana E. 1990. “Drugs and Consensual Crimes: Drug Dealing and Prostitution.” Pp. 159-202 in Drugs and Crime, edited by Michael Tonry and James Q. Wilson. (Crime and Justice: A Review of Research, Vol 13). Chicago: University of Chicago Press. Jick, Todd D. 1979. “Mixing Qualitative and Quantitative Methods: Triangulation in Action.” Administrative Science Quarterly, 24, 4, 602-22. Johnson, Weldon T., Robert E. Peterson, and Edward Wells. 1977. “Arrest Probabilities for Marijuana Users as Indicators of Selective Law Enforcement.” American Journal of Sociology 83, 3, 681-99. Kennedy, Joseph E. 2003. “Drug Wars in Black and White.” Law and Contemporary Problems, Volume 66, 3, 153-82. Lutiger, B., and K. Graham, T.R. Einarson and G. Koren. 1991. “The Relationship between Gestational Cocaine Use and Pregnancy Outcome: A Meta-analysis.” Teratology 44, 405-414. Maher, Lisa and Kathleen Daly. 1996. “Women in the Street-Level Drug Economy: Continuity or Change?” Criminology 34, 4, 465-491. Mathias, Robert (1992). Developmental Effects of Prenatal Drug Exposure may be overcome by Postnatal Environment. NIDA Notes, 7, 14-17. Millman, Robert B. and Ann Bordwine Beeder. 1998. “The New Psychedelic Culture: LSD, Ecstasy, ‘Rave’ Parties, and the Grateful Dead.” Chapter 21 in The American Drug Scene: An Anthology, edited by James A. Inciardi and Karen McElrath. Roxbury Publishing.
89
REFERENCES
Minority & Justice Commission, Washington State Supreme Court. 1999. “The Impact of Race and Ethnicity on Charging and Sentencing Processes for Drug Offenders in Three Counties in Washington State.” Morris, Keiko. 2001. “Party Drugs Are No Fun for Police, Doctors.” Seattle Times, June 12. Murphy, Sheigla and Marsha Rosenbaum. 1997. “Two Women Who Used Cocaine Too Much: Class, Race, Gender, Crack, and Coke.” Chapter 4 in Crack in America: Demon Drugs and Social Justice, edited by Craig Reinarman and Harry G. Levine. Berkeley, CA: University of California Press. Murphy, Sheigla and Dan Waldorf. 1998. “Kickin’ Down to the Street Doc: Shooting Galleries in the San Francisco Bay Area.” Chapter 15 in The American Drug Scene: An Anthology, edited by James A. Inciardi and Karen McElrath. Roxbury Publishing. Nyrop, Kris. April 2003. “An Ethnographic Comparison of Public Venue Drug Markets in Two Seattle Neighborhoods.” Office of Applied Studies, SAMHSA, Drug Abuse Warning Network, 2001. (03/2002 update). Data on file with author. Pennell, Susan, Joe Ellett, Cynthia Rienick, and Jackie Grimes. 1999. “Meth Matters: Report on Methamphetamine Users in Five Western Cities.” Washington D.C.: Office of Justice Programs, National Institute of Justice. Preble, Edward and John J. Casey. 1998. “Taking Care of Business—The Heroin Addict’s Life on the Street.” Chapter 13 in The American Drug Scene: An Anthology, edited by James A. Inciardi and Karen McElrath. Roxbury Publishing. Riley, Jack K. 1997. “Crack, Powder Cocaine, and Heroin: Purchase and Use Patterns in Six Cities.” National Institute of Justice and Office of National Drug Control Policy. Rosenbaum, Marsha, Patricia Morgan, and Jerome E. Beck. 1998. “Ethnographic Notes on Ecstasy Use among Professionals.” Chapter 22 in The American Drug Scene: An Anthology, edited by James A. Inciardi and Karen McElrath. Roxbury Publishing. Schutt, Russell K. 1996. Investigating the Social World: The Process and Practice of Research. Thousand Oaks, CA: Pine Forge Press.
90
REFERENCES
Seattle Times. November 20, 2002. “Local Anti-Drug Campaign to Target Ecstasy.” Sentencing Project, n.d. “Facts About Prisons and Prisoners.” Available online at: http://www.sentencingproject.org/brief/pub1035.pdf Accessed 5/21/03 Shepard, Edward M. and Paul Blackley. 2003. “Drug Enforcement and Crime: Recent Evidence from New York State.” Presented at the meetings of the Drug Policy Alliance, New Jersey, November 2003. Sifaneck, Stephen J. and Alan Neaigus. 2001. “The Ethnographic Accessing, Sampling and Screening of Hidden Populations: Heroin Sniffers in New York City.” Addiction Research and Theory 9, 6: 519-543. Silverman, Ellen et al. 2001. “Recent Drug Abuse Trends in the Seattle-King County Area.” Epidemiologic Trends in Drug Abuse, December 2001. Spohn, Cassia C. “Thirty Years of Sentencing Reform: The Quest for Racially Neutral Sentencing Process.” Criminal Justice 2000, Vol 3. Sterk, Claire E. 1999. Fast Lives: Women Who Use Crack Cocaine. Philadelphia: Temple University Press. Sterling, Eric. 1997. “Drug Policy: A Smorgasbord of Conundrums Spiced by Emotions Around Children and Violence.” Valproraiso Law Review 32, 2: 597-645. Stinchcombe, Arthur. 1963. “Institutions of Privacy in the Determination of Police Administrative practices.” American Journal of Sociology 69: 150-60. Substance Abuse and Mental Health Services Administration (SAMHSA). (1999) National Household Survey on Drug Abuse: Population Estimates 1998 (Office of Applied Studies, DHHS). Rockville, MD. Substance Abuse and Mental Health Services Administration (SAMHSA). (2001a). Results from the 2000 National Household Survey on Drug Abuse: National Findings (Office of Applied Studies, DHHS). Rockville, MD. Substance Abuse and Mental Health Services Administration (SAMHSA). (2001b). The DAWN Report, July 2001 (Office of Applied Studies, DHHS). Rockville, MD.
91
Substance Abuse and Mental Health Services Administration (SAMHSA). (2003). Results from the 2002 National Survey on Drug Use and Health: National
REFERENCES
Findings (Office of Applied Studies, NHSDA Series H-22, DHHS Publication No. SMA 03–3836). Rockville, MD. Taylor, Bruce G., Nora Fitzgerald, Dana Hunt, Judy A. Reardon, and Henry Brownstein. 2001. “2000 Findings on Drug Use and Drug Markets: Adult Male Arrestees.” Washington D.C.: Office of Justice Programs, National Institute of Justice. Terrell, Terri R. 2001. “Rock Goes Into the Closet: An Elitist Community of Crack Cocaine Users.” Paper presented at the annual meetings of the Society for the Study of Social Problems. Tonry, Michael. 1995. Malign Neglect: Race, Crime, and Punishment in America. New York: Oxford University Press. U.S. Department of Justice, Federal Bureau of Investigation. November 2003. Age-Specific Arrest Rates and Race-Specific Arrest Rates for Selected Offenses, 1993-2001. United States Sentencing Commission (USSC). 2002. Report to Congress: Cocaine and Federal Sentencing Policy. Available online at http://www.ussc.gov/r_congress/02crack/2002crackrpt.htm Waldorf, Dan. 1998. “Becoming a Heroin Addict.” Chapter 12 in The American Drug Scene: An Anthology, edited by James A. Inciardi and Karen McElrath. Roxbury Publishing. Waldorf, Dan, Craig Reinarman, and Sheigla Murphy. 1991. Cocaine Changes: The Experience of Using and Quitting. Temple University Press. Word, David L. and R. Colby Perkins Jr. 1996. “Building a Spanish Surname List for the 1990’s—A New Approach to al Old Problem.” Population Division, U.S. Bureau of the Census, Washington D.C.
92

APPENDIX A.
Appendix A. Drug Market Characteristics and Estimated Distribution of Drug Transactions—Unadjusted Calculations
# of Times % Who Last Acquired in All Obtained Outdoor
# of Users Past Month Transactions Outdoors Transactions Powder Cocaine
1,961 4 26.6%
(7,844)
48.2% 23.4%
(3,781)
Meth 1,006 3 10.2%
(3,018)
29.7% 5.5%
(896)
Crack Cocaine
553 15 28.1%
(8,295)
63.2% 32.4%
(5,242)
Heroin 503 20.5 35%
(10,312)
60.8% 38.7%
(6,270)
Note: Estimates of the number of current drug users are based on 2000 SAMHSA data indicating that 2.4% of the U.S. population aged 12 and older used marijuana, .4% used powder cocaine, .33% used stimulants, .13% used crack, and .1% used heroin in the past month. These prevalence estimates were then multiplied by the number of Seattle residents aged 12 and older to estimate the number of Seattle users. Unlike in Table 1, the estimated number of users that resulted was not adjusted by the figures suggested by the ADAM data.
93
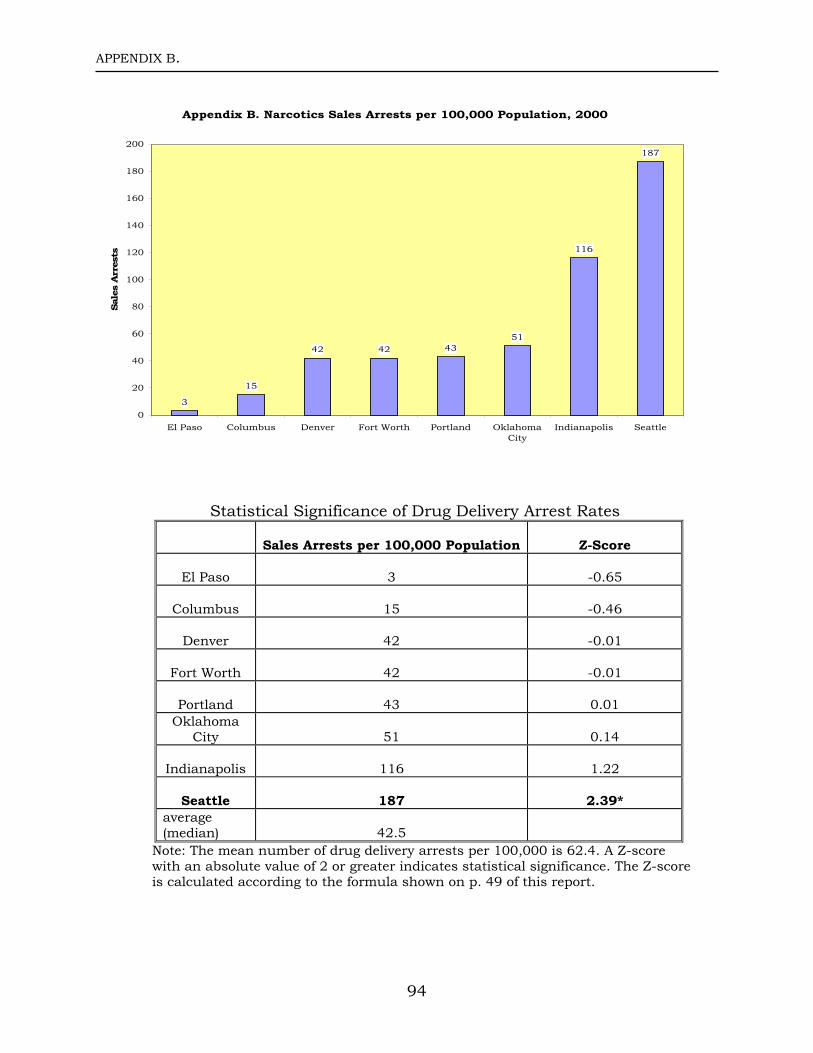
APPENDIX B.
Appendix B. Narcotics Sales Arrests per 100,000 Population, 2000
3
15
42 42 4351
116
187
0
20
40
60
80
100
120
140
160
180
200
El Paso Columbus Denver Fort Worth Portland OklahomaCity
Indianapolis Seattle
Sale
s Arr
ests
Statistical Significance of Drug Delivery Arrest Rates
Sales Arrests per 100,000 Population Z-Score
El Paso 3 -0.65
Columbus 15 -0.46
Denver 42 -0.01
Fort Worth 42 -0.01
Portland 43 0.01 Oklahoma
City 51 0.14
Indianapolis 116 1.22
Seattle 187 2.39* average (median) 42.5
Note: The mean number of drug delivery arrests per 100,000 is 62.4. A Z-score with an absolute value of 2 or greater indicates statistical significance. The Z-score is calculated according to the formula shown on p. 49 of this report.
94