Embed Size (px)
Citation preview

LUMEX INSTRUMENTS CANADA
(0890278 B.C. Ltd)
RA-915М MERCURY ANALYZER
OPERATION MANUAL
В0100-00-00-00-00 OM
2015

Read the instructions in this manual carefully before operating the RA-
915М analyzer. Neither LUMEX INSTRUMENTS CANADA nor its repre-
sentatives will accept any liability for the damage caused by non-
observance of the requirements of this manual.
RA-915М MERCURY ANALYZER is subject to improvements and the infor-
mation in this manual may not include the latest updates on the RA-915М
MERCURY ANALYZER design.
No part of this manual may be reproduced or transmitted in any form or
by any means, neither electronically nor mechanically, without the prior
written permission of LUMEX INSTRUMENTS CANADA.
Manufacturer’s address: 0890278 B.C. Ltd 207-31510 Gill Ave, Mission, B.C., V4S0A1, Canada
TEL: +1 604 820 4488
E-mail: [email protected],
http://lumexinstruments.ca
Version 3.2
Created 20.03.2015

Operation manual RA-915M В0100-00-00-00-00 OM
I
About this manual
This manual is designed to familiarize you with the principle of
operation and structure of the RA-915M analyzer (hereinafter re-
ferred to as the «analyzer»), its design, performance characteristics
and operating conditions. It contains information that will provide
proper operation and comprehensive utilization of the analyzer’s ca-
pabilities. Please take time to read the manual in order to attain the
best results in operation and to gain the greatest benefit from your
analyzer. This manual contains:
List of important safety measures, warnings and precau-
tions, which you should follow when operating with the analyz-
er.
The purpose of the analyzer, its basic performance and
analytical characteristics, and operating conditions.
Brief description of the physical foundations and the prin-
ciple of operation of the analyzer, and of its design.
Functional controls of the analyzer, their purpose and op-
eration.
Procedures for preparation of the analyzer for operation in
different configurations using appropriate operation modes.
Procedures for handling the analyzer in all of the opera-
tion modes using the display and control unit.
Brief description of procedures for analyzer operation us-
ing a PC.
Procedures for analyzer maintenance.
Instructions for troubleshooting.

Operation manual RA-915M В0100-00-00-00-00 OM
II
Symbols used in this manual
Danger:
Used when failure to observe a safety precaution may result in a seri-
ous injury.
Warning:
Used when there is a danger of a minor injury or a serious damage to
the analyzer if you do no follow the precautions.
Caution:
Used when there is a danger of a minor damage to the analyzer if you
do no follow the precautions.
Used to indicate supplementary information or to call attention to
recommendations which may simplify daily operation.
Safety guidelines
Important safety precautions
Read these rules completely before starting operation with
analyzer.
Carefully study all the sections of this operation manual,
analyzer design and control functions.
To avoid electrical shock, never work with the analyzer
covers taken off.
Do not put extraneous objects inside the analyzer through
its ports.
Do not allow the ingress of liquids on the case or inside
the analyzer.
Use only the power supply which is provided.
Never use a defective power supply cable, do not put any
objects on the power supply cable, and locate it in a manner to
avoid a trip hazard.

Operation manual RA-915M В0100-00-00-00-00 OM
III
Do not try to repair the analyzer or adjust its optical units
and electronic boards by yourself, except for cases stipulated
in troubleshooting section (Appendix 1).
Call an authorized agent or certified service engineer in
the following cases:
If the analyzer does not operate properly or its pa-
rameters have noticeably deteriorated.
If the analyzer has fallen down or if its case is dam-
aged.
If there has been ingress of any liquid inside the ana-
lyzer.
If you hear unusual sounds or sense unusual smell
coming from the analyzer.
Keep the analyzer at a minimum distance of 1 meter from
heating devices and heat sources. Do not transport analyzer in
the boot of your car.
Do not forget to switch the analyzer off when the working
day is over and to disconnect the power supply unit from the
mains if the analyzer is not used for more than 6 hours.
Never work without sorption and dust filters.
The analyzer should be switched off before any mainte-
nance operations.
When measuring mercury concentration, it is necessary
to follow instructions and documents stating safety regulations
for operation in chemical laboratories and safety rules for oper-
ation with electric appliances.
Observe the following rules during any transportation of the
device, as well as when performing measurements from a moving
vehicle (car, helicopter, etc.):
To avoid strong vibration effects, do not place the device
on a hard surface (baggage compartment, floor of a vehicle,
etc.).

Operation manual RA-915M В0100-00-00-00-00 OM
IV
Place the device on shock-insulated surfaces (a seat,
damping support, etc.).
Secure the device on a working surface to prevent its fall
or incidental contact with other objects.
Observe the following safety precautions during outdoor opera-
tion:
Do not work in rainy or foggy weather and avoid precipita-
tion ingress inside the analyzer.
Do not work in dusty ambient air.
Staff members permitted to operate the device are rec-
ommended to undergo training at the supplier’s premises or at
a regional service centre.

Contents I
Contents
1 Introduction .............................................................................................. 1
1.1 General description ................................................................................ 1
1.2 Performance characteristics and specifications ..................................... 2
1.3 Operating conditions .............................................................................. 3
1.4 Analyzer design ...................................................................................... 3
1.5 Analyzer Description and Principle of Operation .................................... 5
1.5.1 General Principles of Operation ................................................................... 5
1.5.2 Description of Analyzer ................................................................................ 5
1.5.3 Display and Control Unit .............................................................................. 8
2 Analyzer operation .................................................................................. 9
2.1 Pre-operational Procedures and Setup .................................................. 9
2.1.1 Unpacking and Installation ........................................................................... 9
2.1.2 Analyzer installation and starting up ........................................................... 10
2.1.3 Charging the Battery .................................................................................. 11
2.1.4 Setting Parameters .................................................................................... 12
2.1.5 Checking Analyzer Serviceability ............................................................... 16
2.2 Analyzer Operation .............................................................................. 18
2.2.1 Operation in the On Stream Mode.............................................................. 18
2.2.2 Operation in the “High Concentration” Mode .............................................. 20
2.2.3 Operation in the Monitoring Mode .............................................................. 23
3 Analyzer Maintenance ........................................................................... 26
4 Troubleshooting .................................................................................... 27
5 Analyzer Storage and Transportation .................................................. 28
6 Warranty ................................................................................................. 29
Annex A (informative) Physical Foundation and Principle of Operation . 30


List of Figures I
List of Figures
Fig. 1-2 - Rear side of the analyzer .................................................................................. 6
Fig. 1-3 - Left side panel of the analyzer .......................................................................... 7
Fig. 1-4 - Right side panel of the analyzer ........................................................................ 7
Fig. 1-5 - Display and control unit ..................................................................................... 8
Fig. 2-1 - Splash screen ................................................................................................. 10
Fig. 2-2 - Main menu window ......................................................................................... 11
Fig. 2-3 – Settings menu window ................................................................................... 13
Fig. 2-4 - Parameters Menu............................................................................................ 15
Fig. 2-5 – Save parameters dialog ................................................................................. 16
Fig. 2-6 - Test mode window .......................................................................................... 17
Fig. 2-7 - On Stream mode window ................................................................................ 18
Fig. 2-8 - Protocol mode window .................................................................................... 19
Fig. 2-9 – High Concentration mode window .................................................................. 21
Fig. 2-10 - High Concentration Protocol Mode display ................................................... 22
Fig. 2-11 – Initial screen of the Monitoring mode ............................................................ 24
Fig. 2-12 - Monitoring mode display ............................................................................... 25
Fig. 3-1 - Location of the sorption and dust filters of RA-915M analyzer ........................ 26
Fig.А-1 - Principle of operation of the RA-915M mercury analyzer ................................. 30
Fig.А-2 - Block diagram of the RA-915M mercury analyzer ........................................... 32


В0100-00-00-00-00 OM Section 1 Introduction 1
1 Introduction
1.1 General description
The RA-915М Analyzer is intended for measuring mercury va-
pour concentration in the ambient air and in the air of residential
quarters and production areas as well as in natural gas and in facto-
ry smokestack emissions.
The analyzer can be used for on-stream measuring of mercury
vapour concentration in the air both in a stationary mode and for con-
tinuous survey from vehicles (car, helicopter, boat).
The analyzer is a useful tool in industrial hygiene, ecological
monitoring, technological process control and scientific research.
The analyzer and its attachments constitute the system, which
enables the determination of mercury content in potable, natural and
waste water samples, soils, foodstuff and feed stocks, biological
samples, oil and its processing products in accordance with estab-
lished techniques.
Read this manual carefully before starting operation with the analyz-
er.

2 Operation manual RA-915M В0100-00-00-00-00 OM
1.2 Performance characteristics and specifications
Measuring range of the mercury vapour mass concentration in air
(response time 30 s)*, ng/m3
2 – 200000
Relative intrinsic error of measurement (0), not more than, % 20
Standard deviation of zero readings, ng/m3, not more than 2**
Measurement repeatability (span) for the mercury vapour mass
concentration of 100 ng/m3 and higher, %, not more than
5
Drift of zero readings within 5 min, not more than, ng/m3 2
Transitory time of analyzer readings, s, not more than 20
Analyzer warm-up time, min, not more than 20
Volume air flow rate of the analyzed air at the analyzer input,
dm3/min, not less than
10
Sorption coefficient of mercury vapour by the built-in sorption filter,
not less than, %
98
Complementary error caused by the ambient temperature change
within the operating range for each 10°С, not more than, %
0.50
Complementary error caused by the ambient pressure change
within the operating range for each 3.3 kPa is not more than, %
0.20
Analyzer power supply:
built-in battery
12 V DC
AC power source through external power supply unit
(hereinafter referred to as PSU)
100…240 V АС,
50/60 Hz,
40 VA
Analyzer continuous operation with the built-in battery, h, not less
than
8
Analyzer dimensions (LхWхH), not more than, mm 470х110х220
Weight, kg, not more than 7
* The measuring range starts at 20 ng/m3 for the response time of 1 s.
** Response time is 1 s.

В0100-00-00-00-00 OM Section 1 Introduction 3
1.3 Operating conditions
Ambient air temperature, C 1- 40
Ambient pressure, кPа 84.0-106.7
Relative humidity at 35°C, not more than, % 95
Sinusoidal vibrations in the frequency range:
displacement amplitude (mm) at transition frequency
(60 Hz) and below, not more than
0,35
acceleration amplitude at frequencies exceeding the tran-
sition frequency, m/s2, not more than
49 (5g)
Content of unmeasured components in the analyzed gas mixture, mg/m3, not more
than:
carbon monoxide (СО) 40
nitrogen monoxide (NO) 90
hydrogen sulphide (H2S) 100
nitrogen dioxide (NO2) 100
sulphur dioxide (SO2) 10
ammonia (NH3) 30
benzene (C6H6) 1
1.4 Analyzer design
The RA-915М Mercury Analyzer can be controlled either by the built-
in display and control unit (hereinafter referred to as the control panel) or
by the PC connected to the analyzer with the interface cable.
The components which constitute the basic delivery kit are shown in
Table 1-1.

4 Operation manual RA-915M В0100-00-00-00-00 OM
Table 1-1
№ Item Quantity,
pcs. Catalogue
code
1 RA-915М MERCURY ANALYZER 1 5-020-001
2 Power supply unit for AC power mains 1 5-024-003
3 Power cord 1 5-014-033
4 CD with software 1 5-022-001
5 Interface cable 1 5-024-038
Spares Kit:
6 Sorption filter 1 5-024-028
7 Dust filter 1 5-024-029
8 Tool set 1 5-024-045
Accessories Kit:
9 Analyzer transfer bag 1 5-024-026
10 Air intake hose 1 5-024-030
Documentation:
11 Certificate of Quality 1 5-023-014
12 Operation Manual 1 5-023-007
13 Software User’s Manual 1 5-023-010
14 Short Guide (HIGH CONCENTRATION MODE)
1 5-023-002
15 Short Guide (ON STREAM MODE) 1 5-023-004
16 Short Guide (DATA LOGGER MODE) 1 5-023-006

В0100-00-00-00-00 OM Section 1 Introduction 5
1.5 Analyzer Description and Principle of Operation
1.5.1 General Principles of Operation
The RA-915M analyzer operation is based on differential Zeeman
atomic absorption spectrometry using high frequency modulation of light
polarization (ZAAS-HFM). For more details, refer to Annex A.
1.5.2 Description of Analyzer
The RA-915M analyzer can be operated either as a portable one with
the use of the control panel or as a stationary laboratory device controlled
by PC software.
The following marks are located on the right side of the analyzer:
Analyzer name;
Manufacturer’s trademark.
The nameplate with the following information is placed on the left-
hand side of the analyzer:
Manufacturer’s trademark;
Analyzer name;
Analyzer serial number;
Operations conditions;
Year of manufacture;
Power supply ratings;
Certification marks.
The upper panel of the analyzer contains the built-in display and con-
trol unit.

6 Operation manual RA-915M В0100-00-00-00-00 OM
The analyzer panels are displayed in the figures Fig. 1-1 - Fig. 1-4.
Fig. 1-1 - Front panel of the analyzer
1 - Inlet (marked with yellow) is used for determination of the mercury vapour content in the air (or
gas) – labelled as ;
2 - Inlet (marked with blue) is intended for the air intake into the multi-path cell through the built-in
sorption filter - labelled as ;
3 - Outlet of the multipath cell air flow – labelled as
Fig. 1-2 - Rear side of the analyzer
1 – Compartment for the single-path analytical cell (single-path cell is used for the analyzer valida-
tion, analysis of water, natural gas etc.);
2 – Slot for a holder of the external optical units of the RP-91С and PYRO-915+ attachments;
3 – Power supply cable connector.

В0100-00-00-00-00 OM Section 1 Introduction 7
Fig. 1-3 - Left-hand side panel of the analyzer
1 – PC Interface cable connector, RS-232 standard;
2 – PC Interface cable connector, USB standard;
3 – Service connector.
Fig. 1-4 - Right-hand side panel of the analyzer
1 – Slot for mounting the analytical cell external optical units of the RP-91С and PYRO-915+ at-
tachments;
2 – Removable decoration cover of the sorption and dust filters.

8 Operation manual RA-915M В0100-00-00-00-00 OM
1.5.3 Display and Control Unit
The display and control unit of the analyzer is shown in Fig. 1-5.
Fig. 1-5 - Display and control unit
1 – Display panel for the visualization of signal indications, parameters and operating mode;
2 – Ent (Enter) button to switch to the lower menu level;
3 – Esc (Escape) button t o return on the upper menu level;
4 – , buttons to navigate through the menu at a particular level;
5 – On/Off button.

В0100-00-00-00-00 OM Section 2 Analyzer operation 9
2 Analyzer operation
2.1 Pre-operational Procedures and Setup
2.1.1 Unpacking and Installation
Unpack the analyzer in the following order:
Use a sharp tool to cut the packing straps and carefully open
the transportation box;
Remove the foam frame to uncover the analyzer, documen-
tation and analyzer accessories;
Take the analyzer out of the transportation box and put it on
a table;
Take out the documentation;
Take out the accessories.
Make sure that the package with the analyzer is stored indoors for at
least ten hours after the transportation at temperatures below 0C and then
start unpacking the analyzer.
For transportation the analyzer should be packed in the reverse or-
der.
Before starting the operation with the analyzer make sure that there
are no external damages of the analyzer and its accessories. Check if the
delivery set is complete in accordance with the enclosed packing list.
In the case of any inconsistency please contact your Supplier

10 Operation manual RA-915M В0100-00-00-00-00 OM
2.1.2 Analyzer installation and starting up
Place the analyzer horizontally on a working surface so that the dis-
play and control unit is on the top.
Switch on the analyzer by pressing the On/Off button (pos.5, Fig.
1-5) and hold it down for 1-2 seconds (to switch the analyzer off press the
On/Off button and hold it down for 4-5 seconds). The splash screen that
contains the model name, the manufacturer’s name, the serial number,
software versions and the current date and time will appear on the display
(Fig. 2-1).
Fig. 2-1 - Splash screen
Check the battery charge level in case of the stand-alone use. The
indicator located in the right top corner of the display shows the current
charge level of the battery. If necessary, charge the battery as described in
section 2.1.3.
Press the Ent button to enter the Main menu (see Fig. 2-2).
If you only need to recharge the battery and/or to download the
monitoring data from the analyzer to the computer, it is recom-
mended not to ignite the lamp to extend its lifetime.

В0100-00-00-00-00 OM Section 2 Analyzer operation 11
Fig. 2-2 - Main menu window
Wait at least 20 minutes for the completion of the instrument warm-up
before starting measurements.
If the analyzer does not respond to any action, press the On/Off
button (pos.5, Fig. 1-5) and the Esc button (pos.3, Fig. 1-5) simul-
taneously to restart the analyzer. To restart the analyzer with
06.25 or a higher version of the console software, press the
On/Off button (pos.5, Fig. 1-5) and the Ent button (pos.2, Fig. 1-5)
simultaneously.
2.1.3 Charging the Battery
The battery is being charged when the analyzer is connected to the
AC power mains 90…240V AC, 48…62 Hz via the power supply unit from
the delivery set.
If you need only to charge the analyzer battery without performing
any measurements, it is not recommended to enter the Main menu (ref.
2.1.2).
Warning:
Make sure that the mains supply voltage indicated on the analyzer
nameplate at the left-hand panel of the analyzer corresponds to the
mains supply voltage.
The total time of charging a flat battery is 5 hours.

12 Operation manual RA-915M В0100-00-00-00-00 OM
Longer charging time does not damage the battery.
The fully charged battery ensures the continuous operation of the an-
alyzer for not less than 8 hours.
Caution:
Long-term (more than 10 days) storage of a flat battery may dam-
age it and is not allowed.
You can check the battery charge level using the indicator in the top
right corner of the control panel:
- The battery is charged at 100% of the resource;
- The battery is charged at 80% of the resource;
- The battery is charged at 60% of the resource;
- The battery is charged at 40% of the resource;
- The battery is charged at 20% of the resource;
- Low battery, charging it is necessary.
If the analyzer is connected to the AC mains via the external power
supply unit, the indicator is displayed on the control panel.
2.1.4 Setting Parameters
To set the operation parameters, select the Settings menu item from
the Main menu (Fig. 2-2) by using the navigation buttons ( and ) and
press the Ent button. The Settings menu window will appear on the dis-
play (Fig. 2-3).

В0100-00-00-00-00 OM Section 2 Analyzer operation 13
Fig. 2-3 – Settings menu window
In this menu, you can set and modify the following operation parame-
ters and view options:
Select Language
To choose the display language, select the Select Language
menu item from the Settings menu by using the and navigation
buttons and press the Ent button.
The Select Language window will appear. Russian and Eng-
lish are available for selection.
Use the , and navigation buttons to pick the required lan-
guage and press the Ent button.
The Main menu window will be displayed in the selected lan-
guage.
Time/Date
It is crucial to set the time and data correctly especially in the Mon-
itoring mode as the measurement results are stored along with the
time and date stamp.
To set the date and time, select the Time/Date menu item by
using the and navigation buttons and press the Ent button. The
Time/Date dialog will be displayed.
Use the Ent button to select a time/date parameter (hour, mi-
nute, date) and the and navigation buttons to modify it.

14 Operation manual RA-915M В0100-00-00-00-00 OM
Press the Esc button to store the set values. The Setting
Menu window will be displayed (Fig. 2-3).
Sound
To switch on/off the sound, select the Sound menu item by us-
ing the and navigation buttons and press the Ent button. The
Sound dialog will be displayed.
Use the and On/Off mode.
Press the Esc button to store the chosen option and to return
to the Settings Menu (Fig. 2-3).
If the sound is on, the analyzer will produce a sound when you press
any button on the control panel or if some events occur such as excess of
mercury concentration over the preset value or a complete discharge of the
battery.
STP normal.
This parameter is to enable/disable recalculation (“normalization”) of
the measured mercury vapour concentration for a normal (standard) tem-
perature and pressure (20C and 101.3 kPa or 760 mm Hg by default). If it
is set ON, the data will be normalized. Otherwise, they remain unchanged.
To switch on/off the normalization, select the Normalized STP item,
choose the option (ON or OFF) you need by the and navigation buttons
and press the Ent button. The Settings menu window (Fig. 2-3) will ap-
pear on the display and the current status (ON or OFF) will be shown in the
line of the Normalized STP menu item.
Parameters
Select the Parameters menu item from the Settings menu by
using the and navigation buttons and press the Ent button.
The Parameters menu window will be displayed (Fig. 2-4).

В0100-00-00-00-00 OM Section 2 Analyzer operation 15
Fig. 2-4 - Parameters Menu
In this menu you can set a value for a list of parameters:
Zero Corr. Time is the period of time (tzero) in the range from
40 to 255 s (default value is 40 s) within which the signal cor-
responding to the zero mercury vapour concentration in the
analytical cell will be measured;
Frame time is the period of time in the range from 1 to 600 s
(default value is 10 s) over which the signal is averaged;
Monit. Duration is the time of measurement in the Monitor-
ing mode (default value is 30 min, working range is form 5
min to 99 h 59 min);
Zero Check in is the period of time between two consequent
checks of the zero signal in the Monitoring mode (default
value is 10 min, working range is 5...30 min);
Alarm limit is the mercury concentration upon exceeding of
which the blinking “A” symbol appears on the screen and a
sound alert is produced when the analyzer is operating in the
Continuous mode (default value is 100 ng/m3, accessible
range is 1 to 50000 ng/m3).
To modify a parameter, proceed as follows:
Use the and menu navigation buttons to select the pa-
rameter that needs to be changed and press the Ent button.
The selected parameter value starts to blink;

16 Operation manual RA-915M В0100-00-00-00-00 OM
Use the and navigation buttons to set the required value
and press the Ent button;
When the required values of all parameters are set, press
the Esc button. The Save parameters dialog will be dis-
played over the Parameters menu window (Fig. 2-5). Three
options are available: Save – to save all changes, Cancel –
to reject all changes, Default – to restore default parame-
ters.
Fig. 2-5 – Save parameters dialog
To execute the required command, select it with the and buttons
and press the Ent button. The desired action will be carried out and the
Settings Menu window (Fig. 2-3) will appear.
2.1.5 Checking Analyzer Serviceability
To check the analyzer serviceability, select the Test mode in the
Main menu (Fig. 2-2) by using the and navigation buttons and press
the Ent button.
Upon pressing the Ent button, the Analyzer starts self-testing accord-
ing to the standard algorithm. After about 30 s the D value will appear in
the left bottom corner of the display (Fig. 2-6).

В0100-00-00-00-00 OM Section 2 Analyzer operation 17
If the absolute value of D is less than 20% (or less than 30% at the
ambient temperature out of the 15 to 25С range), the analyzer is ready for
operation. If the absolute value of D goes beyond these norms, repeat the
test procedure. If the absolute value of D exceeds the norms at the repeat-
ed check, the analyzer readings may be not adequate.
Press the Esc button to return to the Main menu window (Fig. 2-2).
Fig. 2-6 - Test mode window
1 – Current value (S), i.e. the measured value of the mercury vapour concentration in the test cell
(displayed every second in conventional units).
2 – Check value (Sk), i.e. the conventional true value for the mercury vapour concentration in the
test cell.
3 – Mean value (Si), i.e. the mean mercury vapour concentration value over the frame time, in the
conventional units.
4 – Frame time countdown, in seconds.
5 – Name of the measurement mode. TM stands for the Test Mode.
6 - D - It is the relative deviation of the measured mercury vapour concentration in the test cell from
the check value: D= 100*(Si- Sk)/Sk.

18 Operation manual RA-915M В0100-00-00-00-00 OM
2.2 Analyzer Operation
2.2.1 Operation in the On Stream Mode
The On Stream mode is used for the measurement of mercury va-
pour concentration in the range of 20 to 20000 ng/m3, the range of indica-
tions ranging from 0 to 50000 ng/m3.
Select the On stream mode from the Main menu (Fig. 2-2) by
the and navigation buttons and press the Ent button. The zero
check procedure, duration of which (tzero) was set in the Parameters
menu (Fig. 2-4), starts. Immediately after the zero check procedure
is completed, the measurement of mercury vapour concentration in
the multi-path cell occurs. An example of the measurements results
is shown in Fig. 2-7.
Fig. 2-7 - On Stream mode window
1 – Current value (S) is the current mercury vapour concentration in the pumped air flow (displayed
every second).
2 – Mean value (Si) is the mean value of the mercury vapour concentration over the frame time
(displayed once per frame time) (ref. 2.1.4, Fig. 2-3).
3 – Frame time countdown, in seconds.
4 – Name of the measurement mode, SM stands for On Stream Mode
5 – Measurement units of the mercury vapour concentration (ng/m3): 1 ng/m
3 = 0,001 g/m
3 =
0,000001 mg/m3.
6 – ST is displayed if the automatic procedure of data normalization is set on (ref. 2.1.4, Fig. 2-3).

В0100-00-00-00-00 OM Section 2 Analyzer operation 19
Upon pressing the Еnt button in the On Stream mode the analyzer
switches over to the Protocol mode (Fig. 2-8), in which three consecutive
mean values of the mercury vapour concentration and the resulting mean
value are displayed.
This mode is useful if the measurements results are recorded manu-
ally in a logbook without data logging.
Fig. 2-8 - Protocol mode window
1 – Current value (Si) is the current of the mercury vapour concentration in the air (displayed at a
frequency of 1 Hz).
2 – Mean value (Si) is the mean value of the mercury vapour concentration over the frame time
(displayed once per frame time) (ref. 2.1.4, Fig. 2-4).
3 - Frame time countdown, in seconds.
4 - Name of the measurement mode: SM stands for On Stream Mode.
5 – Measurement units of the mercury vapour concentration (ng/m3): 1 ng/m
3 = 0,001 g/m
3 =
0,000001 mg/m3.
6 – Three consecutive mean values of the mercury vapour concentrations.
7 – Resulting value (Sa). The resulting value is the arithmetic mean of three consecutive mean val-
ues Si. If the Sa value is less than 5 ng/m3, the Sa<5 message will be displayed. If Sa is over the
upper limit of indication, which can be set using external software; the default value is 50000 ng/m3,
the message Sa >50000 is displayed (true for the upper level value by default).
8 - Range (R, %). It is the relative difference between the maximum and minimum values of mercu-
ry vapour concentration taken from the three latest consecutive measurements:
100S
SSR
а
minimaxi
9 – ST is displayed if the automatic procedure of data normalization is set on (ref. 2.1.4, Fig. 2-3).
20 Operation manual RA-915M В0100-00-00-00-00 OM
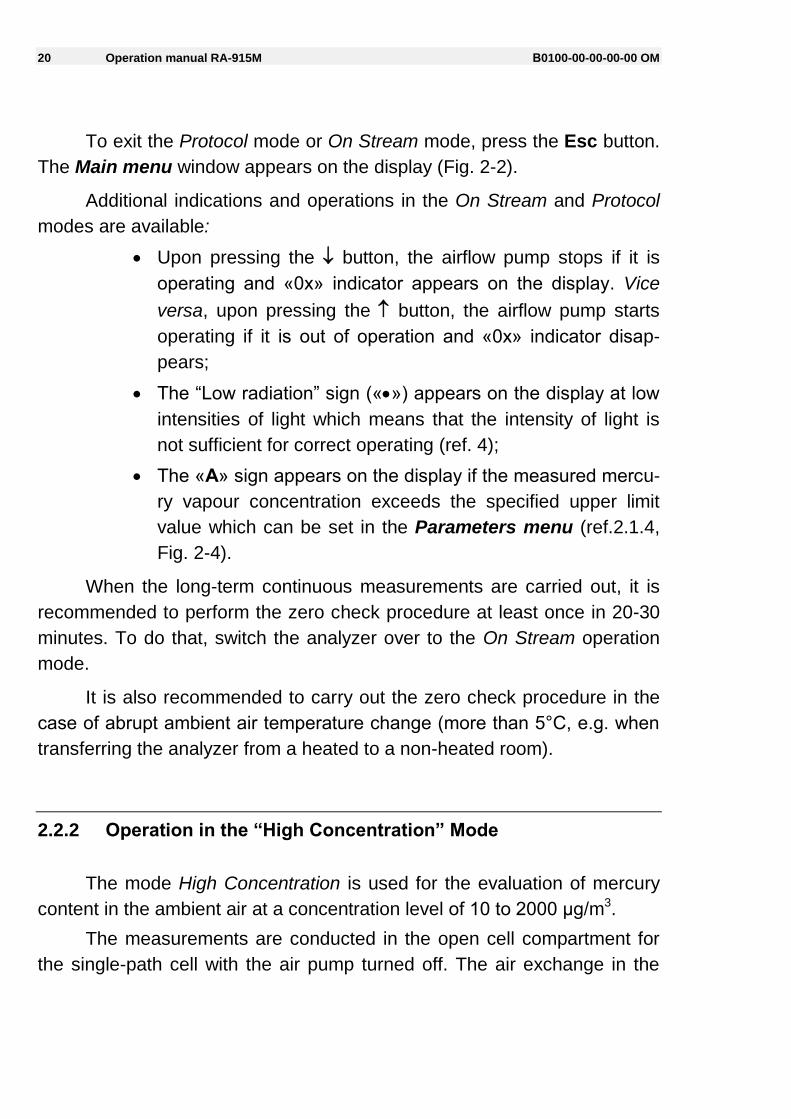
To exit the Protocol mode or On Stream mode, press the Esc button.
The Main menu window appears on the display (Fig. 2-2).
Additional indications and operations in the On Stream and Protocol
modes are available:
Upon pressing the button, the airflow pump stops if it is
operating and «0x» indicator appears on the display. Vice
versa, upon pressing the button, the airflow pump starts
operating if it is out of operation and «0x» indicator disap-
pears;
The “Low radiation” sign («») appears on the display at low
intensities of light which means that the intensity of light is
not sufficient for correct operating (ref. 4);
The «А» sign appears on the display if the measured mercu-
ry vapour concentration exceeds the specified upper limit
value which can be set in the Parameters menu (ref.2.1.4,
Fig. 2-4).
When the long-term continuous measurements are carried out, it is
recommended to perform the zero check procedure at least once in 20-30
minutes. To do that, switch the analyzer over to the On Stream operation
mode.
It is also recommended to carry out the zero check procedure in the
case of abrupt ambient air temperature change (more than 5°С, e.g. when
transferring the analyzer from a heated to a non-heated room).
2.2.2 Operation in the “High Concentration” Mode
The mode High Concentration is used for the evaluation of mercury
content in the ambient air at a concentration level of 10 to 2000 μg/m3.
The measurements are conducted in the open cell compartment for
the single-path cell with the air pump turned off. The air exchange in the

В0100-00-00-00-00 OM Section 2 Analyzer operation 21
compartment is induced by movement of the analyzer. To operate in this
mode:
Put the analyzer for zero check in the area where the concen-
tration of mercury does not exceed 0.5 μg/m3;
Remove the analyzer from the bag and open the door of the
single-path cell compartment (pos.1, Fig. 1-2);
Select the High Concentration mode In the Main menu using
the , buttons and press the Ent button. The analyzer auto-
matically started the zero check procedure duration of which
was set in the Parameters menu (ref. 2.1.4, Fig. 2-4);
After the zero check is completed, transfer the analyzer to the
point of interest and read the mercury concentration that is dis-
played.
An example of the measurements results is shown in Fig. 2-9.
Fig. 2-9 – High Concentration mode window
1 – Current value (Si) is the current concentration of mercury vapour in the air (displayed every
second).
2 – Average value (Si) is the average concentration of mercury vapour over the frame time (dis-
played once per frame time) (ref. 2.1.4, Fig. 2-4).
3 - Frame time countdown, in seconds.
4 - Name of the measurement mode: HC stands for High Concentration.
5 – Measurement units of the mercury vapour concentration (g/m3): 1 g/m
3 = 1000 ng/m
3 =
0,001 mg/m3.
6 – ST is displayed if the automatic procedure of data normalization is set on (ref. 2.1.4, Fig. 2-3).

22 Operation manual RA-915M В0100-00-00-00-00 OM
Upon pressing the Еnt button in the High Concentration mode, the
High Concentration Protocol mode appears (Fig. 2-10), in which three con-
secutive mean values of the mercury vapour concentrations and the result-
ing mean value are displayed.
Fig. 2-10 - High Concentration Protocol Mode display
1 – Current value (Si) is the current mercury vapour concentration in the air (displayed every sec-
ond).
2 – Average value (Si) is the average mercury vapour concentration over the frame time (displayed
once per frame time) (ref. 2.1.4, Fig. 2-4).
3 - Frame time countdown, in seconds.
4 - Name of the measurement mode: HC stands for High Concentration.
5 – Measurement units of the mercury vapour concentration (g/m3): 1 g/m
3 = 1000 ng/m
3 =
0,001 mg/m3.
6 – Three consecutive mean values of the mercury vapour concentrations.
7 – Resulting value (Sa). Resulting averaged value over three mercury vapour concentrations on
the display. If the Sa value is less than 0.5 g/m3, the Sa<0,5 message will be displayed. If Sa is
over the upper level (the upper level value can be set using external software, the default value is
2000 g/m3), the message Sa >2000 is displayed (example for the upper level value by default).
8 - Range (R, %). It is the relative difference between the maximum and minimum values of mercu-
ry vapour concentration taken from the three latest measurements (ref.6):
100S
SSR
а
minimaxi
9 – ST is displayed if the automatic procedure of data normalization is set on (ref. 2.1.4, Fig. 2-3).
This mode is useful if the measurements results are recorded manu-
ally in a logbook without data logging.

В0100-00-00-00-00 OM Section 2 Analyzer operation 23
To exit the Protocol mode or High Concentration mode, press the
Esc button. The Main menu window appears on the display (Fig. 2-2).
If the “Low radiation” sign («») appears on the display signalling the
low level of light intensity, consult the Troubleshooting section.
When long-term continuous measurements are carried out, it is rec-
ommended to perform the zero check procedure at least once in 20-30
minutes. To do this, transfer the analyzer in the area where the mercury
concentration does not exceed 0.5 g/m3 and carry out the zero check pro-
cedure (exit and re-enter the High Concentration mode).
It is also recommended to carry out the zero check procedure in the
case of abrupt ambient air temperature change (more than 5°С, e.g. when
transferring the analyzer from a heated to a non-heated room).
Caution:
In contrast to the On Stream Mode the zero check in the High Concen-
tration Mode is conducted in the compartment of the single-path cell.
Therefore, during the zero check analyzer must be performed in the
area where the mercury vapour concentration is below 0.5 μg/m3.
2.2.3 Operation in the Monitoring Mode
Monitoring mode is intended for the measurement of mercury con-
centration in the air using multi-path cell with periodical zero check and da-
ta logging.
In some dialogs, the Monitoring mode is designated as Data Log-
ger (ref. Fig. 2-2, Fig. 2-11).
The data logger has the capacity of data storage for 122 h of meas-
urement with 10 s averaging. With the maximum accumulation period of
600 s the data storage capacity covers 7330 h (305 days) of continuous
operation. This mode consists of a set of measurements of mercury vapour
concentration interrupted by zero checks on a regular basis.

24 Operation manual RA-915M В0100-00-00-00-00 OM
It is recommended to set the averaging interval to at least 10 sec-
onds and clean the data logger memory if necessary.
To operate in the Monitoring mode:
Select the Monitoring mode with the , navigation buttons in
the Main menu window (Fig. 2-2) and press the Ent button.
The initial screen of the Monitoring mode will be displayed (Fig.
2-11) in which the Monit. duration and Available time items
are for reference. The monitoring duration and the interval be-
tween two consecutive zero checks should be set in the Pa-
rameters menu (Fig. 2-4) beforehand. If the data logger
memory is full (available time is 0), the message «Not enough
memory. Press Esc» will be displayed.
To clear the data logger memory, select the Clear memory
item using the , buttons and press the Ent button. After an
affirmative reply to the additional alert, the data logger memory
will be cleared without the possibility to recover the information.
Fig. 2-11 – Initial screen of the Monitoring mode
Select the Start option with the , navigation buttons and
press the Ent button to launch the measurements.
The analyzer automatically starts operating with the zero check pro-
cedure duration of which should be set in the Parameters menu (ref. 2.1.4,
Fig. 2-4). After the zero check procedure is completed, the measurement of

В0100-00-00-00-00 OM Section 2 Analyzer operation 25
mercury vapour concentration starts. The zero check is repeated periodi-
cally with an interval set in the Parameters menu (ref. 2.1.4, Fig. 2-4).
Before the completion of the monitoring cycle (i.e. after the monitor-
ing time set in the Parameters menu (ref. 2.1.4, Fig. 2-4) has elapsed), the
final zero check procedure is always carried out. The «Monitoring com-
pleted» message will be displayed. Press any button except for the On/Off
one to display the initial screen of the Monitoring mode. If during the meas-
urement the data logger memory becomes overflowed, the «Monitoring
completed» message will be displayed.
An example of the measurements results is shown at the Fig. 2-12.
Fig. 2-12 - Monitoring mode display
1 – Current value (S) is the current mercury vapour concentration in the air (displayed every sec-
ond).
2 – Average value (Si) is the average concentration of mercury vapour over the frame time (dis-
played once per frame time) (ref. 2.1.4, Fig. 2-4).
3 - Frame time countdown, in seconds.
4 - Name of the measurement mode: MN stands for Monitoring Mode.
5 – Measurement units of the mercury vapour concentration (ng/m3): 1 ng/m
3 = 0,001 μg/m
3 =
0,000001 mg/m3.
6 – Completed in is the time remaining to the termination of the measurements.
7 – ST is displayed if the automatic procedure of data normalization is set (ref. 2.1.4, Fig. 2-3).
To download and treat the data stored in the data logger memory,
use the RA-915M data logger software.

26 Operation manual RA-915M В0100-00-00-00-00 OM
3 Analyzer Maintenance
The analyzer maintenance includes the following:
Daily inspection;
Quarterly preventive maintenance.
Daily inspection includes external examination of the analyzer (ref.
2.1.1) and the analyzer serviceability check-up (ref. section 2.1.5).
Quarterly preventive maintenance includes the following procedures:
Inspection of the housing panels fastenings;
Cables inspection;
Replacement of the built-in sorption filter (Fig. 3-1) which
should be carried out if the analyzer has been operated for
about 500 hours in the On Stream mode, but not less than once
per year.
Fig. 3-1 - Location of the sorption and dust filters of RA-915M analyzer
1- Sorption filter; 2- Sorption (zero) filter cover; 3- Dust filter; 4- Dust filter cover.

В0100-00-00-00-00 OM Section 4 Troubleshooting 27
4 Troubleshooting
The RA-915М Analyzer should be repaired at an authorized service
centre or by the manufacturer.
Refer to Table 4-1 for possible causes of minor malfunction and find
tips how to deal with them. Other cases of and malfunction please advise
your Supplier or the Manufacturer and follow the instruction received.
Table 4-1
Fault symptom Possible cause Remedial measure
Some segments of the dis-
play or the display as a
whole go out
Battery is discharged Connect the external PSU
to recharge the battery
In the Test mode, the rela-
tive deviation D is more
than 20%
The ambient temperature is
out of the range (205)С
Perform the test at a tem-
perature within the range
(205)С or take into ac-
count the complementary
error
The “Lamp is not ignited”
message is displayed upon
entering the Main menu
window
1. Lamp ignition failure 2. No photomultiplier signal
Check the single-path cell
compartment, and remove
the cell (if it is there) and
repeat the ignition
“Low radiation” sign («»)
is displayed on the screen
or a sound (if enabled) is
produced
1. No photomultiplier signal 2. Optical switch is in a
wrong position
Check the single-path cell
compartment, and remove
the cell (if it is there). If the
sign does not disappear,
restart the analyzer
The analyzer does not re-
spond to pressing any but-
ton
Hardware bust Press simultaneously the
ON/OFF button (pos.5, Fig.
1-5) and the Esc button
(pos.3, Fig. 1-5) to restart
the analyzer

28 Operation manual RA-915M В0100-00-00-00-00 OM
5 Analyzer Storage and Transportation
The analyzer battery should be fully charged before the storage
Only the analyzer which is packed according to the requirements
shown in 2.1.1 can be transported.
The analyzer may be transported by any kind of transportation with-
out the limitations in speed and distance under the following conditions:
Ambient air temperature from minus 50 to 50°C
Relative humidity up to 100% at 25°C.
Placing and fastening of boxes with the analyzers on transportation
vehicles should guarantee the steady position throughout the delivery, lack
of displacements and instrument shocks. Instructions given by cargo signs
should be followed at all stages of the delivery from the manufacturer to the
customer.
Analyzer storage conditions within the transportation box:
Ambient air temperature from 5 to 40°C
Relative humidity not more than to 80% at 25°C.
Should other conditions be applied, they must be specified in the con-
tract for the supply.
The content of dust, fumes of acids and alkalis and other corrosion-
active agents shall not exceed the content of those for laboratories.
During the storage period, the analyzer should be placed so that a
distance to the walls of the room should be not less than 0.1 m. Distance to
heating devices should be not less than 0.5 m.

В0100-00-00-00-00 OM Section 6 Warranty 29
6 Warranty
The Manufacturer warrants each analyzer complies with the Specifi-
cation given in this manual if the customer observes the rules of analyzer
operation, transportation and storage conditions established by this Opera-
tion manual.
For more information please refer to Certificate of Quality В0100-00-
00-00-00 CQ.

30 Operation manual RA-915M В0100-00-00-00-00 OM
Annex A
(informative)
Physical Foundation and Principle of Operation The RA-915M analyzer operation is based on differential Zeeman atomic absorp-
tion spectrometry using high frequency modulation of light polarization (ZAAS-HFM).
Fig.А-1 - Principle of operation of the RA-915M mercury analyzer

В0100-00-00-00-00 OM Annex A Physical Foundation and Principle of Operation 31
The radiation source (a mercury lamp) is placed in permanent magnetic field H.
The mercury resonance line =254 nm is split into three polarized Zeeman components
(, + and - respectively). When radiation propagates along the direction of the mag-
netic field, only the radiation of the -components one of these falling within the absorp-
tion line profile and another one lying outside reaches the photo detector. When mercu-
ry vapour is absent in the analytical cell, the radiation intensities of both - components
are equal. When mercury atoms appear in the cell, the difference between the intensi-
ties of the -components increases as the mercury vapour concentration grows.
The -components are separated by the polarization modulator. The spectral
shift of the -components is significantly smaller than the widths of molecular absorption
bands and scattering spectra, hence the background absorption by interfering compo-
nents does not affect analyzer’s readings. A multi-path cell with an effective length
about 10 m is used to enhance the sensitivity of analysis.
The block diagram of the analyzer is presented in Fig.А-2, where:
1 - Mercury EDL lamp,
2 - Polarization modulator,
3 - Test cell,
4 - Multi-path cell,
5 - Optical bridge with the automatic channel switch,
6 - Single-path cell compartment,
7 - Photo detector,
8 - Removable optical unit of analytical external cell (a part of the RP-91C or Py-
ro-915+ attachment),
9 - High-frequency generator,
10 - Gas flow commutation unit,
11 - Mercury absorption filter,
12 - Air pump of the multi-path cell,
13 - Electronic signal-processing unit,
14 - Display and control unit,
15 – PC.

32 Operation manual RA-915M В0100-00-00-00-00 OM
Fig.А-2 - Block diagram of the RA-915M mercury analyzer
Mercury EDL lamp (1), which is placed in the gap between the poles of the mag-
net, is excited by the high frequency generator (9). The light successively passes
through the polarization modulator (2) to the optical bridge (5), which automatically
switches the light beam direction depending on the selected operation mode. Three po-
sitions of the optical bridge are available. In the «Multi-path cell» position the radiation
goes through the test cell (3) (if it is inserted into the light path in the Test mode), multi-
path cell (4), single-path cell compartment (6) and is finally detected by photo detector
(7). In the «Single-path cell» position the light beam passes only through the single-path
cell compartment before reaching the photo detector. In the «External cell» position the
radiation passes through the removable optical unit of the external analytical cell (8),
single-path cell compartment and arrives at the photo detector.
The photo detector signal arrives at electronic signal-processing unit (13), where
the signal is separated at the modulation frequency and the analytical signal is formed.
After that the information is displayed on the screen of the display unit (14) or to a PC
(15).