Embed Size (px)
Citation preview

Location choices of external technology search
1
LOCATION CHOICES OF EXTERNAL TECHNOLOGY SEARCH: THE
ROLE OF UPSTREAM AND DOWNSTREAM IPR ASSETS
ABSTRACT
Previous literature postulates the importance of external technology search (ETS) for firms’ competitiveness,
especially in case of technology intensive industries. We combine insights from innovation management,
external technology search and the geographic component of firm strategy to examine the effect of intellectual
property rights (IPR) on firms’ isolation strategy of ETS compared to rivals. This study distinguishes two types
of ETS: acquisitions and strategic technology alliances. We argue whether firms are able to realize less intensity
of geographic overlap in ETS locations compared to competitors, is a function of upstream (patents) and
downstream (trademarks) IPR tools that can also vary along a generality (at patents) and a diversification (at
trademarks) dimension. When distinguishing firm resources by patent stock, generality of patent stock, stock of
live trademarks, and diversity of live trademark stock, we obtain that for acquisitions only the generality of
patent stock and the diversity of live trademark stock, for strategic technology alliances the generality of patent
stock and both trademark-related covariates influence the spatial isolation of ETS vis-à-vis competitors.
Consequently, the paper reveals some subtleties concerning the effects of diverse IPR assets on the intensity of
geographic overlap in external technology search locations vis-à-vis industry rivals. In addition, we find that
similarity in technological background and in place of origin can also influence location decisions for ETS. We
test our hypotheses using a novel data set on firms’ global ETS location decisions from the technology intensive
Security Software Industry by considering firm dyad as the unit of analysis.
KEYWORDS: external technology search, intellectual property rights-related upstream and
downstream assets, location index of external technology search, security software

Location choices of external technology search
2
LOCATION CHOICES OF EXTERNAL TECHNOLOGY SEARCH: THE ROLE OF
UPSTREAM AND DOWNSTREAM IPR ASSETS
1. Introduction
Air Products and Chemicals seeks ideas outside of its organizational boundaries as a central
aspect of its business strategy (Rigby and Zook, 2002). The geographically widespread search
for external R&D labor provides access for untapped expertise and extends greatly its
capacity for innovation. In addition, these external technology links “save the company
hundreds of thousands of dollars in net research costs” while generating abundant profit.
External technology search has primary importance at Procter & Gamble, too (Sakkab, 2002).
The firm pursues a “connect and develop” strategy to enrich its innovation portfolio with tools
that embrace joint technology development, licensing of intellectual property, and tapping
government and university sources, among others.
Correspondingly, the knowledge and technology search branch of strategic
management literature does highlight the imperative role of knowledge and technology
seeking for firms (Kim and Kogut, 1996; Rosenkopf and Nerkar, 2001). Such organizational
behavior that aims to source externally generated knowledge is more pronounced if the focal
industry undergoes a rapid technological change (Chung and Alcácer, 2002), and if
technology development exhibits a clear pattern for complexity due to technological
interdependencies (Dodgson, 1989). Prior research indicates a strong correspondence between
external technology search (ETS) and geography owing to the significant variation in

Location choices of external technology search
3
innovative activity that can take place across regions within the same country (Almeida and
Kogut, 1999; Saxenian, 1994), and to the specific factors that can be tapped at distinct
locations (Cantwell, 1989). Such crucial external factors can be even accessed from resource-
poor firms if those are located in resource-rich areas that promote them to invest in
technology innovation (Forman, Goldfarb and Greenstein, 2008).
At the same time, however, there exists another argument that can trigger a
geographically isolated realization of ETS from rival entities. As knowledge spillovers can be
captured from geographically proximate competitors (Jaffe, Trajtenberg and Henderson,
1993), a defensive argument concentrates on firms’ interest in protecting their own
technological knowledge from rivals by a means of locating apart and avoiding geographic
clustering (Shaver and Flyer, 2000). As a matter of fact, studies recognize that firms can
perceive the balance of knowledge in- and outflows (Cassiman and Veugelers, 2002), and
corresponding to possible knowledge spillover benefits, they can actively shape location
strategies to preserve or augment their technical capabilities vis-à-vis rivals in the industry
(Alcácer and Chung, 2007).
In his article, Alcácer (2006) investigated a possible link that might exist between the
ability level of firms and the geographic component of their strategies. He pointed out that the
actual location behavior of R&D, production and sales subsidiaries is a function of firms’
organizational strength, which permits more-capable firms to collocate less (and isolate more)
than less-capable firms. In this paper we concentrate on the organizational strength dimension
and attempt to examine its role on organizations’ geographic location decisions of external
technology search (ETS). We explore this issue through distinguishing firms’ relative strength
in intellectual property right (IPR) at upstream and downstream levels. A vertical distinction
has its raison d`étre as the level of these organizational resources can significantly vary

Location choices of external technology search
4
between upstream and downstream levels (Arora, Fosfuri and Gambardella, 2001; Gans and
Stern, 2003; Teece, 1986).
In this context we formulate the following four research hypotheses: (a) firms with
larger stock of patents are more likely to have less intensity of geographic overlap in external
technology search locations compared to rivals; (b) firms with more general stock of patents
are more likely to have less intensity of geographic overlap in external technology search
locations compared to rivals; (c) firms with larger stock of trademarks are more likely to have
less intensity of geographic overlap in external technology search locations compared to
rivals; (d) firms with more diversified stock of trademarks are more likely to have less
intensity of geographic overlap in external technology search locations compared to rivals.
We empirically test these propositions on a unique dataset that is built upon the
worldwide Security Software Industry (SSI). The practice of external technology search in
SSI is a widespread activity because (i) it is a technology-based industry with enhanced
product innovation, (ii) competition is fierce implied by low entry barriers and a high hazard
rate of firm exit, (iii) new lucrative product categories proliferate, and (iv) the design of a
security software system is a complex undertaking.(Giarratana, 2004; Giarratana and Fosfuri,
2007).
We examine two distinct mechanisms of ETS, such as acquisitions and strategic
technology alliances to which we assemble a comprehensive panel dataset of four years
between 1999 and 2002. As the hypothesized relationships are inherently dyadic, we built up
our sample of dyadic pairs of firms for which we incorporated 119 security software firms
that performed at least one ETS in the study period. We use the quadratic assignment
procedure that permits us to analyze the sampled firms’ geographic dispersion of ETS in a
dyadic fashion. To study the hypothesized links with more precision, following Alcácer

Location choices of external technology search
5
(2006) we apply three units of geographical classification: clusters, countries and economic
regions.
Our empirical results suggest that almost all core covariates –patent generality,
trademark stock and trademark diversification – except patent stock support a geographic
isolation of external technology search compared to rivals. However, they play different roles
depending on the type of the search activity, and partly on the level of geographic gradation
applied. Our results suggest that the preexisting stock of industry-core patents does not
influence the intensity of geographic overlap vis-à-vis industry competitors. An exception
emerges only because its effect for acquisitions is significant only at cluster level, suggesting
that patent stock plays a major role for those acquirer firms that acquire targets located in
geographically closer places which may bear with a similarly structured patent stock. A more
general preexisting stock of industry specific patents augments the geographic isolation at
both strategic technology alliances and acquisitions. The stock of a firm’s live trademarks is
only an important IPR-related covariate for strategic technology alliances as it lowers the
extent of geographic overlap compared to rivals. The last important covariate, the
diversification of an organization’s live trademark portfolio causes less intensity of spatial
overlap compared to rivals at both search mechanisms. In sum, a spatially divergent portfolio
of acquisitions vis-à-vis rivals is supported by patent generality and trademark diversification.
Additionally, the generality of patents, the stock of live trademarks and trademark
diversification are primarily responsible for the geographic isolation of strategic technology
alliances compared to industry competitors.
This work links together several branches in the literature, such as innovation, external
technology search and the geographic component of firm strategy. We are able to demonstrate
the strategic value of location choices where firm upstream and downstream intellectual
property rights play an indispensable role. An important contribution of the study is that it

Location choices of external technology search
6
jointly incorporates technology alliances and acquisitions as key external knowledge and
technology channels for organizations. By constructing a panel dataset, we are able to assess
in a dynamic style that the location patterns of external technology search are a direct
consequence of firm IPR-related assets. In addition, we can enhance our understanding on
firms’ location patterns of ETS via applying a diverse geographical classification. Finally, we
follow prior research that considers trademarks as important assets for firm strategy (e.g.
Fosfuri, Giarratana and Luzzi, 2008; Fosfuri and Giarratana, 2009). This paper offers a value
addition in terms of measurement as it directly captures the diversification dimension of this
downstream IPR asset.
2. Theoretical background
The ability to compete in high-technology industries depends on the acquisition of
competitive knowledge, implying, that a firm has to attain experience with the underlying
science and related technological fields (Kim and Kogut, 1996). Some of these newly
acquired capabilities serve the firm to respond rapidly to market changes and allow for
expansion during windows of opportunity (Kim and Kogut, 1996). Studying patenting activity
in optical disc technology, Rosenkopf and Nerkar (2001) show that exploration spanning
organizational boundaries consistently generates higher impact on subsequent technological
evolution, thereby it can provide for the explorer organization a competitive advantage within
the industry, and an option to diversify. Resorting to external exploration is desirable as
technological evolution is generated by communities of organizations (Rosenkopf and
Tushman, 1998). For instance, the evolution of products with the underlying components can
be viewed as the result of variation, selection and retention processes that take place by a
broad community of organizational actors (Rosenkopf and Nerkar, 1999). This feature

Location choices of external technology search
7
influences a firm’s technological trajectory and make all industrial actors mutually
interdependent.
To maintain or enhance competitive edge, firms might be motivated to employ ETS
for search of new capabilities, and presumably to recombine those newly acquired or accessed
capabilities with existing skills. This motive has been termed technology or knowledge
seeking, and such organizational search behavior may be more prevalent if a firm competes in
a technology intensive industry (Chung and Alcácer, 2002). We expect some firms to value
locations’ traits that reflect the level of localized technical activity. The uniqueness of a
location relies much on location-specific factors that can nurture technologies not available
elsewhere (Cantwell, 1989). Even a relatively resource-poor firm but being situated in a
bigger resource abundant location can considerable improve chances to realize investment in
innovative processes (Forman, Goldfarb and Greenstein, 2008). Tapping localized technology
source is greatly enhanced by frequent inter-partner interaction as relevant knowledge can be
tacit and the prerequisite of its transfer depends on physical propinquity (Kogut and Zander,
1992). This idea that firms seeking new knowledge have to approach the target locations is
reaffirmed by Almeida and Kogut (1999). They demonstrate that localized knowledge builds
upon cumulative ideas within regional boundaries, and as knowledge is frequently tacit that
knowledge resides with engineers of a particular geographic community. Cantwell and Odine
(1999) bring evidence that firms emanating from leading technical centers are also likely to
pursue technological strategies in which they geographically differentiate their innovative
activities abroad. In contrast to firms from more laggards technical centers whose primary
interest relies in catch-up, they are primarily focused on sourcing more diverse technical
knowledge. Studying inward FDI into the United States, Chung and Alcácer (2002) make a
parallel inference, arguing that knowledge seeking takes place not only among technical
laggards, but is also ubiquitous among technically leading firms.

Location choices of external technology search
8
Acknowledging the potential for higher added value and nonredundant knowledge to
be captured from geographically distant organizations, a defensive argument puts emphasis on
geographically isolating external technology search vis-à-vis competitors. Certain industries
are based upon technical competition, which may force all participants to seek spillovers from
competitors. The study by Shaver and Flyer (2000) argues that firms with the best
technologies have strong motivation to geographically distance themselves, otherwise their
technologies with other key resources spill over to competitors which become stronger and
eventually endanger the competitive position of the former. Chung and Alcácer (2002) arrive
to a similar conclusion in connection with foreign technically leader, flagship firms as those
ones opt to spatially isolate themselves from existing clusters in the United States to prevent
outward knowledge spillovers to rivals. Such unwanted outgoing knowledge spillover can
occur as the level of knowledge in- and outflows is not exogenous to the firm, but the
recipient firm can affect the extent of incoming spillovers through a deliberate innovation
strategy (Cassiman and Veugelers, 2002). In a related paper, Alcácer and Chung (2007)
recognize that firms are active entities in making decisions upon location strategies in terms
of net spillover benefits they may get, and thus are aware of the possible cost of outward
spillovers. A link between organizational strength of firms and location choice appears in
Alcácer’s paper (2006), in which he finds that technologically more advanced firms favor to
collocate less their R&D, production and sales subsidiaries as opposed to less capable firms.
As it becomes clear from the above discussion, an organizational strategy to flock with
or flee from within-industry competitors in ETS relates closely to firm resources. Our attempt
is to show that downstream and upstream organizational resources in intellectual property
right can potentially act as driving forces for firms to geographically isolate their external
technology search networks. As a matter of fact, we examine patents and trademarks, the two
types of IPR tools along the verticality from upstream to downstream. In deriving our

Location choices of external technology search
9
hypotheses, we also take into consideration the generality and diversification dimension of
patents and trademarks, respectively.
3. Hypotheses
Upstream resource: patents
A larger, industry-core patent portfolio provides greater resilience and latitude in ETS that
lowers the extent of geographic overlap vis-à-vis competitors through three main mechanisms.
The first reason touches upon some intellectual property right-related benefits. Patents
provide a tight appropriability regime (Teece, 1986) that affords the innovator firm with
sufficient time to perform and take advantage on a throrough search for external technology
links in the techno-geographic space. Such a lead-time advantage comes from the
impenetrable thicket of patents that renders a technology simply difficult to copy legally. On
the one hand, this lead-time advantage may provide time to spatially expand the selection of
the applicable and the best external available technologies to be recombined. An important
aspect to be considered, as firms often tend to outsource technologies instead of in-house
elaboration (Cesaroni, 2004). On the other hand, it leaves time to perform a joint undertaking
with external partners.
The second reason is strategic. A firm with a portfolio of large stock of industry
specific patents is more effective at applying competitive pressures to rivals in forming ETS
links. Particularly, greater stock of patents look more attractive for generating knowledge
flows in the eyes of potential partners, thus the focal firms can easier approach those firms
that are located in capability rich areas. By a related consideration, owning a large patent
stock can signal a technology leader position in the industry (Garud and Kumaraswamy,
1993) which might offer a possibility for exploiting this reputation of a technology champion,
whereby creating a spatially divergent set of technology search locations with respect to less

Location choices of external technology search
10
capable rivals. Therefore, less-capable competitors will prove to be less attractive candidates
that reduce their opportunities to break in geographically divergent set of locations. An
additional source of advantage is that, a large industry-core patent portfolio facilitates broader
partner selection with complementary patens and technologies.
The third mechanism is defensive and also indicates a lower extent of geographic
overlap in technology search network. Patents represent strong IPR protection that reduces the
cost of leakage of relevant knowledge to partners or to competitors in the environment. By a
large portfolio of patents, the owner can enjoy stronger bargaining position in a technology
cooperation which increases productivity (Makhija and Ganesh, 1997). Similarly, because of
legal control through patents (Arora and Ceccagnoli, 2006), they decrease expropriation and
reverse-engineering committed by partners or third entities in ETS endeavors. When
establishing multiple technological cooperations involves risk for the firm to infringe patents
held by other entities. However, a larger patent portfolio of the searcher organization through
stronger bargaining power elevates chances to avoid litigation or to establish friendly
agreements with potential litigators. Studying the semiconductor sector, Hall and Ziedonis
(2001) and Ziedonis (2004) demonstrate that when there is a fragmented market for
technologies, large patent portfolios help resolve hold-up problems via the use of cross-
licensing agreements.
So taking into account all the positive consequences of a large patent portfolio for the
isolation of external technology search, we make the following hypothesis:
HYPOTHESIS 1. Firms with larger preexisting stock of patents will have less intensity of
geographic overlap in external technology search locations compared to rivals.

Location choices of external technology search
11
Firms with a more general patent portfolio can enjoy a different sort of benefits whereby they
are able to increase the geographic isolation of technology their search channels against
competitors. A more general knowledge base creates a higher potential absorptive capacity
(Lane and Lubatkin, 1998; Zahra and George, 2002) that extends an organization’s possibility
to value and assimilate external knowledge. This component increases the overall level of
absorptive capacity that let firms manage external knowledge flows more efficiently, and,
consequently, stimulate innovative outcomes (Escribano, Fosfuri and Tribo, 2009). This leads
to less information asymmetry in evaluating the quality of the skills of potential partners or
acquisition targets that operate in a different segment of the industry. Lower expected costs
due to higher absorptive capacity gives the firm more freedom for trial and error
experimentation. Therefore, a firm incurs less search costs of ETS which permit to augment
the spatial divergence of its ETS locations from rivals. Another benefit of greater absorptive
capacity is that it can lead to differential learning in knowledge intensive interfirm
collaborations (Kumar and Nti, 1998). This positively impacts the knowledge appropriated
and the claims to the fruits of collaboration vis-à-vis rivals. Higher levels of absorptive
capacity can also prove to be beneficial to spot firms with good technology in the external
environment. Relatedly, wider absorptive capacity through more general knowledge
background can borrow more awareness on the stance of technology evolution. Like an alarm,
it can compel senior managers to update the firm knowledge base in case of necessity.
A more general patent portfolio provides more general skills that can increase
knowledge coordination in ETS links. Improved knowledge coordination contributes to the
better exploitation of synergies and to the rate of organizational learning (Zollo and Winter,
2002). Also, organizational members might have better abilities to integrate contextually
different knowledge in a resilient way across disciplinary boundaries. As a consequence, it
makes worthwhile to exploring other locations if such contextually different knowledge is

Location choices of external technology search
12
only available elsewhere. Owen-Smith and Powell (2004) show that centrality in a
geographically dispersed network positively affects the level of innovation. An implication of
this finding could be that if an organization has a more general knowledge base, then it can
better occupy a central position in such a network gradually establishing new technology
search links in the outer environment. Furthermore, a more general knowledge base with
enhanced learning potential can promote a “connect and develop” strategy that leverages
external capabilities in order to enrich the connecting firm’s innovation portfolio (Sakkab,
2002).
There is a dominant trend showing that new technologies start to have an increasing
tendency for complexity according to contemporary technological interdependencies
(Dodgson, 1989). Consequently, products that are based heavily on research and innovation,
become complex and start to increasingly rely on more generalized and abstract knowledge –
a pattern that has been observed by Arora and Gambardella (1994) in industries like
biotechnology, semiconductors and software. The more general technological background a
firm has, the better it can face to this challenge in science-driven environments through being
effectively equipped for ETS with firms of divergent knowledge background.
Hence:
HYPOTHESIS 2. Firms with more general preexisting stock of patents will have less
intensity of geographic overlap in external technology search locations compared to
rivals.
Downstream resources: trademarks
Our next proposition suggests that firms with large complementary or downstream assets to
product commercialization have strong incentives to spread external technology search in the

Location choices of external technology search
13
geographic space. Teece (1986) argues that, in almost all cases, the successful
commercialization of an innovation requires complementary assets and that the ownership of
such assets can position the innovator advantageously. Correspondingly, the lack of those
assets can force a technology entrepreneur to sell its technology instead of commercialization
(Gans and Stern, 2003; Arora and Ceccagnoli, 2006). For instance, brand advertising can
contribute to the creation of stronger downstream assets either by greater brand loyalty due to
higher perceived customer differentiation (Lancaster, 1984), or by elevating entry barriers to
competitors when the brand acts as a reference in its category (Kapferer, 1997).
An efficient form of creating downstream assets is through registering trademarks that
secure legal protection of technological investments by boosting the rate of appropriability
(Fosfuri, Giarratana and Luzzi, 2008). A large stock of trademarks key to the scope of
operation is a signal of conscious investments into a firm’s own brands, reputation for
perceived quality, customer loyalty and distribution channels (Mendonça, Santos Pereira and
Mira Godinho, 2004). Investment into trademarks provides good protection of marketing
efforts as a strong brand along a reputation for quality transforms into an intangible asset that
is not easily imitable for competitors. Linking this with the fact that an efficacious way to
own markets is to own brands (Aaker, 1991), trademark registration represents valuable
efforts to develop and strengthen a business. Trademarks also protect brands against low-
priced copycats as the aggrieved party can seek legal remedies for any market advantage
enjoyed by the copycat due to confusion, mistake or deception (Warlop, Ratneshwar and van
Osselaer, 2005). In consequence of the vantage-point for a successful commercialization,
firms with larger number of trademarks can enjoy more freedom in selecting external
technology partners.
Past research points out correspondence between a firm’s own trademarks and its
pecuniary features. For instance, Fosfuri and Giarratana (2009) find that filed trademarks

Location choices of external technology search
14
relevant to the industry in question, imply larger financial firm value. Prior studies also detect
that trademarks strongly correlate with company sales (Seethamraju, 2003) and stock market
value (Smith and Parr, 2000). Furthermore, many trademarks within a category that might
involve highly-ranked brands and more inferior perceived ones by customers, can imply to
pursue a strategy that Shapiro and Varian (1998) label “linking price to value”: a firm can
subtract more profit from the same product category enriched by accessed knowledge via ETS
when it segments customers along the application of different prices and version the same
product along different characteristics. As a consequence one can expect larger stock of
trademark piled up in the focal industry to contribute to the financial fit of the firm. Then, in
theory, more resources to be allocated can increase the geographic isolation of technology
search channels vis-à-vis competitors with less volume of such downstream assets.
We capture this set of arguments to hypothesize:
HYPOTHESIS 3. Firms with larger preexisting stock of trademarks will have less
intensity of geographic overlap in external technology search locations compared to
rivals.
We start with the observation that a more diversified trademark stock generally encompasses
brands from a broad range of product categories. To achieve wide product scope, the
organization had to undergo a continuous and repeated sequence of changes that identifies the
underlying organizational routines of this group of firms (Sorenson et al., 2006). Therefore,
they might continue the strategy of growth in future. Such firms might develop the ability to
accommodate new technologies due to former expansions, and the acumen to analyse the
potential use of a technology due to the experience with a wide range of products. A more
dispersed product portfolio might also represent task to the holder organization as a wider

Location choices of external technology search
15
product portfolio needs to be updated with more new knowledge elements. This can require
numerous novel technologies to embed that, chasing the firm to explore partners with
potential technologies, may involve a spatially divergent external search compared to rivals.
Firms having stakes in many product categories through its trademark diversification
can enjoy some sorts of positional advantages like increased stability in a more uncertain
business environment (Dobrev, Kim and Carroll, 2002), more strategic latitude for managers
to hedge their bets (Sorenson, 2000), and increased entry barriers against newcomers
(Lancaster, 1990). Furthermore, consumers might find it convenient to buy on the idea of one-
stop shopping (Siggelkow, 2003), and, should consumer preference be positively correlated, a
product bundling strategy might be implemented (Gandal, Markovich and Riordan, 2005). In
unison, these effects provide more secure positions in the product markets which may justify
small overlap in external technology search with more focused competitors.
Finally, a diversified brand portfolio can prove to be beneficial from cost-efficiency
considerations, too. Cohen and Klepper (1996) find that the returns to R&D are closely
dependent on the range of a firm’s output because fixed costs related to R&D activities can be
better spread on more business applications and market niches. As a consequence, firms with
more diversified brands and product portfolio are in a more advantageous position vis-à-vis
rivals with narrow product space, because they can devote either more budget to, or expect
better cost efficiency ex post in external technology links. In addition, if a general purpose
technology (Arora and Gambardella, 1994) is the objective of external technology
cooperation, it might also boost a quicker recovery of the development cost according to
wider potential application opportunities by brands in different product categories. More
degrees of financial freedom will eventually pose more pressure on less capable competitors
and expel them from key ETS locations. Thus, an organization with a diverse set of brands
can take advantage on this opportunity augmenting the divergence of its ETS locations.

Location choices of external technology search
16
HYPOTHESIS 4. Firms with more diversified preexisting stock of trademarks will have
less intensity of geographic overlap in external technology search locations compared
to rivals.
4. Data and methodology
Sample construction
To test these ideas, we resort to the Security Software Industry (SSI) which has its
technological origins in the 1970s due to large investments made by the US government in
military projects related to security of data transmissions. As a result, a sound scientific
background in cryptography and encryption emerged through the involvement of large ICT
firms and university departments that manifested in a historical, USPTO-registered patent
stock. This process created a publicly available source of knowledge spillovers that benefited
enormously the birth of the SSI with a clear commercial focus at the turn of 1980s and 1990s.
At that time, several favorable environmental factors supported the industry evolution such as
the fabulously growing PC market, the development of the Internet accompanied with the
need toward secure Internet-based financial transactions. Consequently, the worldwide sales
of security software products between 1997 and 2002 tripled from USD2.2 billion to USD6.9
billion (International Data Corporation 2000 and 2003). Rising demand enlarged the spectrum
of market supply which embraces not only basic products of encryption such as firewall or
antivirus programs, but comprehensive and advanced security services linked to protection of
operating systems and applications, network security management packages, and sensible data
and hardware protection (Giarratana and Fosfuri, 2007). The emergence of new market niches
altogether with fierce market competition spurred widespread trademark issuance in SSI that
enables firms to forge brand protection, to take advantage on reputation of superior product

Location choices of external technology search
17
quality, and to forge customer loyalty, which ultimately enhance the commercialization
potential of the trademark issuer. Table 1 exemplifies the various motives and applications of
trademark issuance in the sector. A notable technical characteristic of the industry has to do
with the mathematical crypto algorithm that is the principal component of a security software
product through transforming plain text data into cipher text, and what it can be strongly
protected by patents. The task of crypto algorithm is to execute the encryption and decryption
processes of the data, and its quality in terms of security level and speed of mathematical
calculations is a decisive factor to provide competitive advantage for the owner organization
(Giarratana, 2004). For instance, the US Patent 5,768,373 filed on May 6th 1996 by Symantec
Corp. is directed toward providing a secure method to access data when the user has lost or
forgotten the user password. The patent description employing several block diagrams
explains that the decryption of an access key gives access to data and that two encrypted
versions of the access key are created. If the password is forgotten, access to data is
accomplished by decrypting the second encrypted version of the access key with the private
key from the public-private key pair which is required to be stored in a remote site. A further
illustrative example is the US Patent 6,141,420 filed by Certicom Corp. in January 29th 1997
which applies an elliptic curve cryptosystem method instead of integer calculus, performing
the encoding-decoding process quicker and requiring less computer space expressed in bits
(Giarratana, 2004).
------------------------------------------ Insert Table 1 about here
------------------------------------------
There are several industry traits that emphasize the importance of external technology search
for security software manufacturers. First, product innovation plays a major role accompanied
by the proliferation of lucrative new product categories (The Economist, 2002). Second, it is a

Location choices of external technology search
18
technology-based industry with continuous innovation where the complexity of a security
software system requires incorporating problem solutions from distinct technological areas,
for instance mathematics, hardware engineering, software development and network design
(Giarratana, 2004). Third, competition is intense implying low entry barriers, paucity of first-
mover advantages for survival and a high hazard rate of firm exit (Giarratana and Fosfuri,
2007). Therefore, we believe that the worldwide SSI proves an ideal setting to study firms’
collocation patterns of external technology search.
To verify the hypotheses, we constructed a longitudinal data set tracing SSI firms’
locations for acquisitions and strategic technology alliances on a global base. We found out
the population of SSI organizations via security software product introduction data from
Infotrac’s General Business File ASAP and PROMT database (former Predicast) that, from a
large set of trade journals, magazines and other specialized press (e.g. eWeek, PC Magazine,
PR Newswire, Telecomworldwire), reports several categories of events classified by
industrial sectors. This data source is the more recent version of the former Predicast database
and was applied in various studies (e.g. Pennings and Harianto, 1992; Fosfuri, Giarratana and
Luzzi, 2008). We have searched for all press articles that reported a “Product announcement”,
a “New software release” and a “Software evaluation” in SSI at SIC Code 73726 (Encryption
Software Sector) from 1980 to 2002. These steps determined that the first product had been
introduced in 1989.
Prior contributions point at the pivotal role that acquisitions (Haspeslagh and Jemison,
1991; Hitt el al., 1996; Pisano, 1991; Vermeulen and Barkema, 2001) and strategic
technology alliances (Dussauge, Garrette and Mitchell, 2000; Hamel, 1991; Kumar and Nti,
1998; Lane and Lubatkin, 1998) can play when external sources of knowledge and technology
have become relevant. Therefore, we take into consideration these inter-organizational
mechanisms to study external technology search patterns of firms. Resorting to the same

Location choices of external technology search
19
Infotrac database, we downloaded all the articles for SSI firms that report an acquisition and
an alliance event under SIC 73726. For all types of events, we carefully read the text of
business news, and removed the equivocal events from the sample. Considering alliance texts,
we selected only those events for the variable strategic technology alliance where partners are
involved in combined innovative activities or exchange of technologies (Hagedoorn and
Duysters, 2002). Hence, equivocal cases or marketing alliances were excluded. It is worth
noting that acquisitions are often used to increase CEO power or to penetrate in a new and
untapped geographic market (especially at older sunk-cost industries). Notwithstanding, an
acquisition in SSI has primarily a technology or knowledge acquisition orientation, as target
organizations can have a valuable (protected) technology or can employ skilled software
engineers. For instance Cisco Systems that is also heavily interested in the network, content
and web security business uses a considerable part of its profits to purchase firms with R&D
capabilities (Shapiro and Varian, 1999).
We studied all the security software firms that realized at least one external technology
search during the 4-year spell 1999-2002. By this period, SSI developed to a mature industry
where the use of the above three mechanisms became ubiquitous. The sample consists of 119
security software firms that are undoubtedly the leading players in the industry. The panel
data structure tracks a dynamic link between firm resources and location patterns that
eliminates any potential endogeneity problems. In constructing the database, we made firm
dyads as the unit of analysis which was motivated by the following reasons: it captures a
firm’s relative position, it provides a consistent comparison across organizations, and it
efficiently reflects the competitive engagements of firms (Alcácer, 2006; Baum and Korn,
1999; Chen, 1996; Sirmon, Gove and Hitt, 2008). Table 2 offers descriptive statistics on the
different types of external technology search that the sampled firms realized across the whole
study period.

Location choices of external technology search
20
------------------------------------------ Insert Table 2 about here
------------------------------------------
Dependent variable
Following Alcácer’s study (2006), we apply a similar measure in its construction for our
dependent variable. This location index (LOCI) allows for comparing the geographic
convergence or dispersion of ETS networks to any two sample firm (i and j) in giving an in-
between value of complete coincidence or total dissimilarity. The sign i t’ is a 1xn row vector
while j t denotes a nx1 column vector. Each element, of i tl or j tl takes on either 1 or 0,
depending on whether the given firm has realized an ETS activity in location l at time t. From
the viewpoint of firm i, the LOCIijt measure is a percentage value of ETS locations overlapped
by both firms in year t, mathematically:
LOCIijt = tt
tt
ii
ji
∗∗
'
'
= ∑
∑=
=
=
=
∗
∗nl
l tltl
nl
l tltl
ii
ji
1
1 .
The LOCI measure is dyadic by construction and varies theoretically from 0
(dispersion) to 1 (similarity). If the index reaches its maximum value 1, it means that firm j
explored exactly the same geographical sites as firm i in time t. In the reversed case, firm i
and j don’t share any geographically coinciding locations in their explorative undertakings,
and so the index takes the value of zero. Alcácer’s index is a quite precise and convenient way
to compare the location choices of any two sample firms, as it represents a multidimensional
relationship with a single value, and the interpretation is intuitive. Additionally, the index
weights only those elements that equal 1, and it is independent of the number of elements in
the vectors, in contrast to correlation or covariance which “vary when more null elements are
added to the vectors (Alcácer 2006, p. 1461)”. Ultimately, the LOCI measure inherently is not
symmetric for firm pairs i-j and j-i owing to the scale applied in the denominator that is

Location choices of external technology search
21
always related to the focal firm. In fact, this feature reflects competitive asymmetry (Chen,
1996) by recording differently the presence in geographic factor markets for participants in a
given firm dyad.
To calculate LOCI, first, we had to identify the exact location of all organizations with
which the sample SSI firms had ETS links. For firm i in year t, we considered the acquired
firms by i, and its technology alliance partners. Second, we also included sample firms’
headquarter locations to be able to operationally compare firms with the LOCI measure for
those years when they don’t realize ETS, and to account for the importance of local search for
knowledge spillovers (Jaffe, et al., 1993; Tallman et al., 2004). Third, we had to devise an
appropriate policy with regard to possible geographic divisions because isolation patterns of
external technology search grasped by the location index might be sensitive to units of
geographical classification. Let’s consider a South-Californian security software maker that
locating ETS only in a geographically limited territory, for example in the neighbouring
counties, might obtain higher and higher values for LOCI with respect to the same rivals if
one increases the size of geographic units. As a consequence we apply a similar geographic
gradation to that of Alcácer (2006), for which we determine the value of LOCI for three
geographic levels: clusters, countries and economic regions. Operationally, clusters are equal
to US counties, or equal official geographic units outside of the US; country level refers to
independent states or US states; and an economic region is related to a group of countries that
culturally, economically share common traits. The involvement of the spatially greater
regions can amplify our understanding on ETS location patterns as country (and cluster) level
can underestimate the extent of geographic extension of an ETS network. In addition, a
cluster-level measure for LOCI can provide a more sophisticated insight of location choices
because some firms may concentrate external technology search to a geographically limited
area. We identified all actual geographic locations properly through the Geographic Names

Location choices of external technology search
22
Information System for US locations and the Getty Thesaurus of Geographic Names for
foreign, non-US locations. Finally, we calculate the LOCI value for all geographic levels
considering the type of ETS activities separately (acquisition, strategic technology alliances).
Consequently, we obtained six LOCI measures depending on geographic gradation and
activity type. Table 3a summarizes the dyadic and firm level location indices by the type of
ETS activities (acquisition and strategic technology alliances) calculated at the cluster,
country and regional levels, whereas Table 3b shows the geographic profile of ETS channels
at the country level. This latter table reveals that the US-state California was the most popular
location for the establishment of any type of ETS links.
------------------------------------------ Insert Table 3a and 3b about here
------------------------------------------
Estimation procedure
We hypothesize that the location of boundary-spanning external technology search vis-à-vis
rivals is generated by the function LOCIij = f (Xij , β), where the dependent variable is the
location index for the convergence or dispersion of technology exploration networks, Xij is the
set of explanatory dyadic variables, and β is a vector of parameters to be estimated. One
econometric challenge has to deal with the fact that dyadic data are assumed not to consist of
independent observations, but rather have varying amounts of dependence on one another
which can lead to autocorrelation in the error terms (Krackhardt, 1988). The lack of such
independence is best illustrated by a firm that purposefully decides to separate its ETS
allocation from the rest of competitors due to some unknown reasons, whereby a chain of
positive autocorrelation for all dyadic observation related to the deviating firm is introduced
that can generate small standard errors and thus inflated t-statistics (Alcácer, 2006).
Additionally, the existing row or column interdependence can bias ordinary-least-squares

Location choices of external technology search
23
(OLS) tests of significance (Krackhardt, 1988). To deal with this problem of bias, we
therefore use a method based on Krackhardt (1988), who proposes a nonparametric solution
called the Quadratic Assignment Procedure (QAP) that provides unbiased tests for regression
coefficients. The QAP algorithm proceeds by first performing an OLS regression on the
original data set. Then the rows and columns of the dependent variable matrix are permuted to
provide a new, scrambled matrix. The OLS regression calculation is then repeated with the
new dependent variable. The program stores coefficient estimates and R2 values. Next,
another permutation of the dependent variable is drawn that is subjected to a new OLS
regression whose coefficients and R-square values are again stored. This permutation-
regression step is repeated 500 times that yields a reference, empirical sampling distribution
for the stored betas of independent variables under the null hypothesis of no relationship
between the independent variables and the dependent variable. In the end, one can compare
each actual coefficient of the first OLS regression with the empirical distribution to reject the
null hypothesis at an extreme high or low percentile.
Independent variables
We controlled for upstream intellectual property right-related assets of firms with two
variables. The Firmpatent variable is defined as the count of the cumulative number of
unexpired patents granted to an SSI firm. Patents have been used extensively in the
innovation literature to measure technological capabilities (e.g. Henderson and Cockburn,
1994), and provide externally validated measures of innovative success that closely resonate
to a firm’s level of technological competence (Narin, Noma and Perry, 1987). This time
variant variable is lagged by one year, depreciated with a usual perpetual inventory formula of
15% and was downloaded from the US Patent and Trademark Office (www.uspto.gov).
Furthermore, we only considered the fundamental technological classes pertaining to the SSI

Location choices of external technology search
24
which include the 380, 382, 705, 709, 713 and 726 3-digit patent classes (Giarratana, 2004).
The Patentgenerality variable strictly builds upon the patents applied at the former measure.
We calculate the Jaffe-Trajtenberg index of generality which is essentially a one minus
Herfindhal index on forward citations of patents (based upon the same patents that an SSI
firm obtains in the same strategic patent classes at the previous patent stock measure) in 3-
digit SIC codes. This variable is time variant and comes from the USPTO database as well.
We apply two trademark-related measures of theoretical interest to grasp the
downstream intellectual property right strength of our sampled firms. Like at patent records,
we resorted to the USPTO database and downloaded only the annual number of LIVE
software trademarks. To obtain the stock of trademarks for our focal organizations, we
followed the method by Fosfuri et al. (2008) in which we applied a search algorithm through
strings of words to the text of the trademark description of goods and services. We call this
measure Livetrademark. The last core variable, Trademarkdiversification is the one minus
Herfindhal index on the industrial class trademark codes from the yearly set of LIVE software
trademarks of a firm. Both trademark variables are time variant and lagged by one-year.
Controls
We introduce a set of controls that may be alternate explanation for firms’ external
technology search behavior. Experience in the market is captured by the number of years a
firm is competing in SSI (Age in market) where it enhances firm survival (Giarratana and
Fosfuri, 2007). This variable is the difference between a firm’s entry year and the current
year. We account for any possible distorsion of a firm’s scale through the variable Sales in
software business which is the logarithm of the share of LIVE software trademarks on the
total LIVE trademarks multiplied by the firm sales (the source of this latter: Bureau Van
Dijk’s Osiris). We inserted a subsidiary control constructed at country level that is one minus
Location choices of external technology search
25
Herfindhal index on the geographic extension of sampled firms’ subsidiary locations, to grasp
its possible impact on the dependent variable. Higher extent of industry competition at firm
entry was found to deteriorate survival options for security software makers (Giarratana and
Fosfuri, 2007). To control for different industry conditions at the time of entry we employ a
measure of organizational population density at the time a firm enters the market (Density
delay), as initial competition conditions can exert lasting effects on the extent of overlap in
technology search locations. Past literature studied the magnitude and sustainability of first-
mover advantages (Lieberman and Montgomery, 1988). Early entrants might benefit from
first-mover advantages through economies of learning, established reputation and the
existence of switching costs that is common in the entire software industry (Torrisi, 1998).
Such favorable conditions might influence technology search channels when permitting first-
movers to oversearch their rivals. Accordingly, we insert the dummy variable “Pioneers” in
our estimations if a firm entered in the formative period 1989-91, the first 3 years of the
industry. Firms’ core business can influence the way how ETS is spatially distanced or
converged from competitors because a firm’s core sector could exhibit common patterns in
searching external knowledge and technology. Moreover, SSI can also host de alio companies
as implied by Giarratana (2008). Hence, we employ three dummies that address the core
business of the sampled organizations: Hardware (SIC code 357), Software (SIC 737), or
Electronics (SIC 359-370). Data on firm core business was taken from Bureau Van Dijk’s
Osiris and Hoover’s. In addition, we implement in the QAP regressions two geographical
dummies that take the value 1 if the headquarter of a firm is situated in North America, or in
Europe (0 otherwise). Dummies on firms’ technological background and place of origin were
also introduced by Alcácer (2006) in its study on subsidiary location choices.
Given that we employ a dyadic dataset, all independent and control variables similarly
to the dependent variable are also dyadic: either differences from the focal firm’s perspective,

Location choices of external technology search
26
or dummies with a value of 1 if both firms in a given dyad share the same feature described in
the discussion of the proxy variable. To construct the database, we applied a pairing algorithm
using the statistical software package R. The data table on which we perform the regressions
consist of 56644 lines according to the number of firms involved and the time span
considered. Table 4 provides the basic descriptive statistics for the independent variables and
controls.
------------------------------------------ Insert Table 4 about here
------------------------------------------
5. Results and discussion
We run regressions using Multiple Regression Quadratic Assignment Procedure with the
above covariates. Table 5 presents results that are shown in three main sets. Sets reflect how
the dependent variable formation is affected by the type of geographic classification applied.
Each column within a set displays results related to the specific sort of external technology
search mechanism: acquisitions (AQU) and strategic technology alliances (STA). The
dependent variable is the location index (LOCI) of external technology search whose
construction varies either by ETS type, or by geographic unit. To begin, we describe the effect
of our core variables on the isolation of those ETS types where they display significant
impact. Taking into consideration the conceptualization of the hypotheses, one must expect
negative signs for the variables of theoretical interest.
------------------------------------------ Insert Table 5 about here
------------------------------------------
The preexisting stock of industry-core patents (Firmpatent) does not influence the intensity of
geographic overlap vis-à-vis industry competitors. An exception emerges only because its

Location choices of external technology search
27
effect for acquisitions is significant only at cluster level, suggesting that patent stock plays a
major role for those acquirer firms that acquire targets located in geographically closer places
which may bear with a similarly structured patent stock. The reason is that the location index
of this firm group can significantly increase from cluster to regional level. A more general
preexisting stock of industry specific patents (Patentgenerality) expands the geographic
isolation of strategic technology alliances and acquisitions. Livetrademark is only an
important IPR-related covariate for strategic technology alliances as it enhances isolation for
this type of ETS. The last core variable, Trademarkdiversification enjoys explanatory power
both at acquisitions and strategic technology alliances causing less intensity of spatial overlap
compared to rivals.
Recapitulating the strongest links for each ETS tie, we can conclude that the isolation
of acquisitions is largely supported by almost all types of intellectual property right
covariates; the only exception is the patent stock variable. An acquisition is a complex
undertaking as it often demands knowledge complementarity and financial power from the
part of the acquirer, and the ability to integrate the acquired entity into its organization. The
absorptive capacity (Kumar and Nti, 1998; Zahra and George, 2002) and the exploitation of
synergies arguments at patent stock generality, and, the organizational routines argument used
at the diversity of trademarks promote these findings. Taking a look at Table 5, one can
observe that the generality of patent stock, the number of live trademarks and the
diversification of an organization’s trademark portfolio are the primary motives for a spatially
dissimilar network of strategic technology alliances vis-à-vis rivals. The absorptive capacity
with an enhanced ability for differential learning (Kumar and Nti, 1998; Zahra and George,
2002), and the potential for a “connect and develop” strategy (Sakkab, 2002) (ideas
mentioned at generality of patent stock), good prospects for technology commercialization
(Mendonça et al., 2004) accompanied by increased financial latitude (Seethamraju, 2003;

Location choices of external technology search
28
Smith and Parr, 2000) (ideas mentioned at trademark stock), and the positional advantages by
a more diversified trademark portfolio altogether with cost-efficiency considerations (ideas
mentioned at trademark diversification) corroborate such a pattern of behavior. To interpret
our findings better, we provide a succinct summary in Table 6. Table 7 reports a sensibility
test for changes in the Location Index (country level). For instance, when making a two
standard deviation increase on the mean value of Trademarkdiversification, the value of the
location index for acquisitions and strategic technology alliances decreases by 6.9% and
15.2%, respectively. Since trademark is a downstream IPR tool, and Trademarkdiversification
shows that the firm is involved in various industrial segments. Perhaps, company senior
managers may think that at strategic technology alliances more knowledge would leak out to
rivals compared to aquisitions, therefore they try to isolate more the technology alliance
network from industry competitors.
------------------------------------------ Insert Table 6 and 7 about here
------------------------------------------
As far as it concerns our control variables, only few play a role in developing a
geographically dispersed external technology search in the in the Security Software Industry.
Similarities in technological background induce divergence or convergence in locating ETS.
For instance, software firms exhibit an isolation pattern in ETS which is observable at
aquisitions, but strictly at country level (Models III in Table 5). Conversely, de alio
organizations with background in electronics choose to converge in locations for strategic
technology alliances, though particularly at regional level (Model VI in Table 5). In contrast
to company background in software and electronics, hardware firms follow neither flocking,
nor fleeing with each other in ETS. Finally, security software firms that are originated from

Location choices of external technology search
29
North America develop a geographically similar network of ETS. This finding is uniform
across activity types and geographic units. For example, if both firms come from North
America, they increase location levels at country level by 0.30 and 0.15 for acquisition and
strategic technology alliances, respectively (Model III and IV in Table 5).
6. Conclusions
According to prior contributions (Chung and Alcácer, 2002; Kim and Kogut, 1996;
Rosenkopf and Nerkar, 2001), this research started with the premise that external technology
and knowledge search is an important mechanism for firms. However, the geographic
isolation of external technology search channels must critically depend on firm resources. In
this paper we have investigated empirically the role of upstream and downstream intellectual
property right tools on influencing the spatial dissimilarity of ETS networks of firms
compared to rivals. Therefore, we studied how much firms share the extent of geographic
overlap in external technology search locations given the investments made in patents and
trademarks. Our evidence suggests that the preexisting stock of industry-core patents does not
influence the intensity of geographic overlap vis-à-vis industry competitors.. The generality
dimension is also not negligible as more general preexisting stock of industry specific patents
augments the divergence of strategic technology alliances and acquisitions. It is worth noting
in connection with the downstream IPR tool under study that the stock of a firm’s live
trademarks is only an important IPR-related covariate for strategic technology alliances as it
promotes isolation compared to rivals. The diversification of an organization’s live trademark
portfolio causes less intensity of spatial overlap compared to rivals at both search
mechanisms. We were able to get a more ample picture on location patterns of external
technology search through incorporating some control variables into our analysis.

Location choices of external technology search
30
Correspondingly, similarity in technological background and in place of origin can also
influence location decisions for ETS vis-à-vis industry competitors.
The main contribution of our work is that, although there is an ample literature on
external technology search channels, it has not been empirically linked to geographic
considerations. We provide one of the first attempts to bring together external technology
search approaches and the geographic components of firm strategy. Additionally, we found
that the strategic decision on ETS location choices depends on upstream and downstream
IPR-related covariates. This research adds some empirical contributions, too. First, a notable
trait of this study that it jointly involves acquisitions and strategic technology alliances as
crucial external knowledge and technology sources for business organizations. Second, we
applied a panel dataset that makes possible a dynamic study of firm resources and location
patterns, required by past studies (Alcácer, 2006). Third, adherence to the research line
hallmarked by contributions from Fosfuri, Giarratana and Luzzi (2008) or Fosfuri and
Giarratana (2009) that promote trademarks as strategic assets, we also use it for our purposes.
However, we involve not only the pure number of this downstream IPR asset, but we directly
measure the diversity dimension offering a value addition.
The findings of this study offer several implications for management practice. The
general message of this paper for practicing managers is that firms having IPR-related
resources can be better positioned in the quest for external knowledge and technology. It is an
important factor to have in mind as there is a strong competition for external partners that are
located in a geographically dispersed manner in the environment. Firms better equipped with
key IPR assets can themselves set the pace of competition that eventually crowd out rivals
from crucial technology input factor markets. Our results stress the indispensable role of
internal innovation for firms to be able to approach remote partners that might have different
knowledge background. This is underpinned by the significant impact of patent generality

Location choices of external technology search
31
which might motivate senior management to develop organization skills with a more ample
spectrum. Senior management might also want to develop wide IPR resources because
external technology strategies are alternative mechanisms, and the optimal choice for the
appropriate one in a given business situation can depend on some idiosyncratic factors to be
considered (Dyer, Kale and Singh, 2004). This internal policy can help firms not to be
unprepared if it has to opt for any type of external mechanism, because, as our study suggests
there is a correspondence between the type of technology acquisition tool and the proper IPR-
assets. The last implication for management practice refers to boosting organizational ability
to issue trademarks and patents. One way is by hiring patent and trademark experts that can
shorten the IPR-grant process promoting external technology search.
This study also sends important messages for policy makers. For instance, more able
firms in terms of IPR resources tend to source technical diversity through various channels of
ETS in which they are willing to make a widespread geographical exploration. This is a good
piece of news for economic decision-makers of technologically laggard regions: if those
regions are developed with an appropriate economic policy, this creates the opportunity
through nurturing local firms with specialized expertise that sooner or later local enterprises
can connect to and potentially form part of an industrial network, and consequently profit
from technology business with a larger community of firms.
This study is not exempt from limitations. The single-industry nature of data (with
limited technology focus) applied in the analyses demands the results to be examined in other
technology-based contexts. However, the characteristics of the Security Software Industry
like the overall focus on product innovation, the fierce nature of competition and the product
complexity of security software systems (Giarratana, 2004) can easily match with other young
and technology-based environments. Further limitations rely in the relatively short time
window of our study that might be improved in future research.

Location choices of external technology search
32
References
Aaker DA. 1991. Managing Brand Equity: Capitalizing on the Value of a Brand. The
Free Press: New York.
Alcácer J. 2006. Location choices across the value chain: how activity and capability
influence collocation. Management Science 52(10): 1457-1471.
Alcácer J. Chung W. 2007. Location strategies and knowledge spillovers.
Management Science 53(5): 760-776.
Almeida P. Kogut B. 1999. Localization of knowledge and the mobility of engineers
in regional networks. Management Science 45(7): 905-917.
Arora A. Gambardella A. 1994. The changing technology of technological change:
general and abstract knowledge and the division of innovative labour. Research Policy 23(5):
523-532.
Arora A. Fosfuri A. Gambardella A. 2001. Markets for technology and their
implications for corporate strategies. Industrial and Corporate Change 10(2): 419-451
Arora A. Ceccagnoli M. 2006. Patent protection, complementary assets, and firms’
incentives for tecnology licensing. Management Science 52(2): 293-308.
Baum JAC. Korn HJ. 1999. Dynamics of dyadic competitive interaction. Strategic
Management Journal 20(3): 251-278.
Cantwell J. 1989. Technological Innovation and Multinational Corporations. Basil
Blackwell: Oxford, U.K.
Cantwell J. Odine J. 1999. Technological globalisation and innovative centres: the role
of corporate technological leadership and locational hierarchy. Research Policy 28(2-3): 119-
144.

Location choices of external technology search
33
Cassiman B. Veugelers R. 2002. R&D cooperation and spillovers: some empirical
evidence from Belgium. American Economic Review 92(4): 1169-1184.
Cesaroni F. 2004. Technological outsourcing and product diversification: do markets
for technology affect firms’ strategies? Research Policy 33(10): 1547-1564.
Chen M-J. 1996. Competitor analysis and interfirm rivalry: toward a theoretical
integration. Academy of Management Review 21(1): 100-134.
Chung W. Alcácer J. 2002. Knowledge seeking and location choice of foreign direct
investment in the United States. Management Science 48(12): 1534-1554.
Cohen WM. Klepper S. 1996. A reprise of size and R&D. Economic Journal
106(437): 925-951.
Dobrev SD. Kim TY. Carroll GR. 2002. The evolution of organizational niches: US
automobile manufacturers. 1885-1981. Administrative Science Quarterly 47(2): 233-264.
Dodgson M (Ed.). 1989. Technological Strategy and the Firm: Management and
Public Policy. Longman: London.
Dussauge P. Garrette B. Mitchell W. 2000. Learning from competing partners:
outcomes and durations of scale and link alliances in Europe, North America and Asia.
Strategic Management Journal 21(2): 99-126.
Dyer JH. Kale P. Singh H. 2004. When to ally and when to acquire? Harvard Business
Review 82(7/8): 109-115.
Economist (The). 2002. A survey of digital security: securing the cloud. October 26th.
Escribano A. Fosfuri A. Tribo JA. 2009. Managing external knowledge flows: the
moderating role of absorptive capacity. Research Policy 38(1): 96-105.
Forman C. Goldfarb A. Greenstein S. 2008. Understanding the inputs into innovation:
do cities substitute for internal firm resources? Journal of Economics & Management Strategy
17(2): 295-316.

Location choices of external technology search
34
Fosfuri A. 2006. The licensing dilemma: understanding the determinants of the rate of
technology licensing. Strategic Management Journal 27(12): 1141-1158.
Fosfuri A. Giarratana MS. Luzzi A. 2008. The penguin has entered the building: the
commercialization of open source software products. Organization Science 19(2): 292-305.
Fosfuri A. Giarratana MS. 2009. Masters of war: rivals’ product innovation and new
advertising in mature product markets. Management Science 55(2): 181-191.
Gandal N. Markovich S. Riordan M. 2005. Ain’t it “suite”? Bundling in the PC office
software market. Unpublished manuscript.
Gans JS. Stern S. 2003. The product market and the market for “ideas”:
commercialization strategies for technology entrepreneurs. Research Policy 32(2): 333–350.
Garud R. Kumaraswamy A. 1993. Changing competitive dynamics in network
industries: an exploration of Sun Microsystems’ open system strategy. Strategic Management
Journal 14(5): 351-369.
Giarratana MS. 2004. The birth of a new industry: entry by startups and the drivers of
firm growth. The case of encryption software. Research Policy 33(5): 787-806.
Giarratana MS. Fosfuri A. 2007. Product strategies and survival in Schumpeterian
Environments: evidence from the US Security Software Industry. Organization Studies 28(6):
909-929.
Giarratana MS. 2008. Missing the starting gun: de alio entry order in new markets,
inertia and real option capabilities. European Management Review 5: 115-124.
Grindley PC. Teece DJ. 1997. Managing intellectual capital: licensing and cross-
licensing in semiconductors and electronics. California Management Review 39(2): 8-41.
Hagedoorn J. Duysters G. 2002. External sources of innovative capabilities: the
preference for strategic alliances or mergers and acquisitions. Journal of Management Studies
39(2): 167-188.

Location choices of external technology search
35
Hall BH. Ziedonis RH. 2001. The patent paradox revisited: an empirical study of
patenting in the U.S. semiconductor industry 1979–1995. RAND Journal of Economics 32(1)
101–128.
Hamel G. 1991. Competition for competence and inter-partner learning within
international strategic alliances. Strategic Management Journal, Summer Special Issue 12: 83-
103.
Haspeslagh P. Jemison D. 1991. Managing acquisitions: creating value through
corporate renewal. Free Press: New York.
Henderson R. Cockburn I. 1994. Measuring competence? Exploring firm effects in
pharmaceutical research. Strategic Management Journal. Winter Special Issue 15: 63-84.
Hitt MA. Hoskisson RE. Johnson RA. Moesel DD. 1996. The market for corporate
control and firm innovation. Academy of Management Journal 39(5): 1084-1119.
International Data Corporation (IDC). 2000. Security Software Market Analysis.
Annual Report.
International Data Corporation (IDC). 2003. Security Software Market Analysis.
Annual Report.
Jaffe A,. Trajtenberg M. Henderson R. 1993. Geographic localization of knowledge
spillovers as evidenced by patent citations. Quarterly Journal of Economics 108(3): 577-598.
Johnson DKN. 2002. “Learning-by-licensing”: R&D and technology licensing in
Brazilian invention. Economics of Innovation and New Technology 11(3): 163-177.
Kapferer J-N. 1997. Strategic Brand Management: Creating and Sustaining Brand
Equity Long Term. Kogan Page: London.
Kim D-J. Kogut B. 1996. Technological platforms and diversification. Organization
Science 7(3): 283-301.

Location choices of external technology search
36
Kogut B. Zander U. 1992. Knowledge of the firm, combinative capabilities, and the
replication of technology. Organization Science 3(3): 383-397.
Krackhardt D. 1988. Predicting with networks: nonparametric multiple regression
analysis of dyadic data. Social Networks 10(4): 359-381.
Kumar R. Nti KO. 1998. Differential learning and interaction in alliance dynamics: a
process and outcome discrepancy model. Organization Science 9(3): 356-367.
Lancaster K. 1990. The economics of product variety: a survey. Marketing Science
9(3): 189-206.
Lancaster K. 1984. Brand advertising competition and industry demand. Journal of
Advertising 13(4): 19-30.
Lane PJ. Lubatkin M. 1998. Relative absorptive capacity and interorganizational
learning. Strategic Management Journal 19(5): 461-477.
Lieberman M. Montgomery D. 1988. First-mover advantages. Strategic Management
Journal. Summer Special Issue 9: 41-58.
Makhija MV. Ganesh U. 1997. The relationship between control and partner learning
in learning-related joint ventures. Organization Science 8(5): 508-527.
Mendonça S. Santos Pereira T. Mira Godinho M. 2004. Trademarks as an indicator of
innovation and industrial change. Research Policy 33(9): 1385-1404.
Narin F. Noma E. Perry R. 1987. Patents as indicators of corporate technological
strength. Research Policy 16(2-4):143-155.
Owen-Smith J. Powell WW. 2004. Knowledge networks as channels and conduits: the
effects of spillovers in the Boston biotechnology community. Organization Science 15(1): 5-
21.
Pennings JM. Harianto F. 1992. The diffusion of technological innovation in the
commercial banking industry. Strategic Management Journal 13(1): 29-46.

Location choices of external technology search
37
Pisano GP. 1991. The governance of innovation: vertical integration and collaborative
arrangements in the biotechnology industry. Research Policy 20(3): 237-249.
Rigby D. Zook C. 2002. Open-market innovation. Harvard Business Review
(October).
Rosenkopf L. Nerkar A. 1999. On the complexity of technological evolution:
exploring coevolution within and across hierarchical levels in optical disc technology. In
Variations in Organization Science: In Honor of D. T. Campbell, Baum J., McKelvey W.
(eds). Sage: Thousand Oaks, CA; 169–183.
Rosenkopf L. Tushman ML. 1998. The coevolution of community networks and
technology: lessons from the flight simulation industry. Industrial and Corporate Change 7(2):
311–346.
Rosenkopf L. Nerkar A. 2001. Beyond local search: boundary-spanning, exploration,
and impact in the optical disk industry. Strategic Management Journal 22(4): 287-306.
Sakkab NY. 2002. Connect & develop complements research & develop at P&G.
Research Technology Management 45(2): 38-45.
Saxenian A. 1994. Regional Advantage: Culture and Competition in Silicon Valley
and Route 128. Harvard University Press: Cambridge, USA.
Seethamraju C. 2003. The value relevance of trademarks. In Intangible Assets: Values.
Measures and Risks. Hand JRM. Lev B (eds). Oxford University Press: New York; 228-247.
Shapiro C. Varian HR. 1998. Versioning: the smart way to sell information. Harvard
Business Review. November-December.
Shapiro C. Varian HR. 1999. Information Rules: A Strategic Guide to the Network
Economy. Harvard Business School Press: Boston.
Shaver JM. Flyer F. 2000. Agglomeration economies, firm heterogeneity, and foreign
direct investment in the United States. Strategic Management Journal 21(12): 1175-1193.

Location choices of external technology search
38
Siggelkow N. 2003. Why focus? A study of intra-industry focus effects. Journal of
Industrial Economics 51(2): 121-150.
Sirmon DG. Gove S. Hitt MA. 2008. Resource management in dyadic competitive
rivalry: the effects of resource bundling and deployment. Academy of Management Journal
51(5): 919-935.
Smith GV. Parr RL. 2000. Valuation of intellectual property and intangible assets. 3rd
ed. John Wiley & Sons: New York.
Sorenson O. 2000. Letting the market work for you: an evolutionary perspective on
product strategy. Strategic Management Journal 21(2): 277-292.
Sorenson O. Mcevily S. Ren CR. Roy R. 2006. Niche width revisited: organizational
scope, behavior and performance. Strategic Management Journal 27(10): 915-936.
Tallman S. Jenkins M. Henry N. Pinch S. 2004. Knowledge, clusters, and competitive
advantage. Academy of Management Review 29(2): 258-271.
Teece D. 1986. Profiting from technological innovation. Research Policy 15(6): 285-
305.
Torrisi S. 1998. Industrial Organization and Innovation: An International Study of the
Software Industry. Edward Elgar: Cheltenham. UK.
Vermeulen F. Barkema H. 2001. Learning through acquisitions. Academy of
Management Journal 44(3): 457-476.
Warlop L. Ratneshwar S. Van Osselaer SMJ. 2005. Distinctive brand cues and
memory for product consumption experiences. International Journal of Research in Marketing
22(1): 27-44.
Zahra SA. George G. 2002. Absorptive capacity: a review, re-conceptualization, and
extension. Academy of Management Journal 27(2): 185-203.
Location choices of external technology search
39
Ziedonis RH. 2004. Don’t fence me in: fragmented markets for technology and the
patent acquisition strategies of firms. Management Science 50(6): 804-820.
Zollo M. Winter SG. 2002. Deliberate learning and the evolution of dynamic
capabilities. Organization Science 13(3): 339-351.

Location choices of external technology search
40
Table 1
SSI trademarks with the scope of application filed by prominent security software
producers
Objective of the trademark from goods and services heading
Registrant Filing date Serial
number Emblematic design or the object of legal protection
Brand protection with logo
Security Dynamics August 23,
1996 75,154,776
Brand name protection through an image
Symantec August 27,
1997 75,347,874
Protection of a specific service
Verisign April 22, 1997 75,279,016 “NETSURE”
Protection of a specific product category
Security Dynamics January 11,
1996 75,041,170 “SOFTID”
Product/service protection through using an image
Security Dynamics December 5,
1996 75,208,517
Slogan protection Symantec April 25, 1997 75,281,282 “VIRTUALLY ANYWHERE”
Logo to provide recognizable designations
Checkpoint Systems November 14,
1996 75,197,809
Source: Our collections from the USPTO database.
Table 2
Descriptive statistics on the types of ETS
N. of firms Total n. of ETS Mean S.d. Min Max Type of ETS Acquisitions 119 178 1,50 3,17 0 22 Strategic technology alliances 119 767 6,45 13,21 0 86
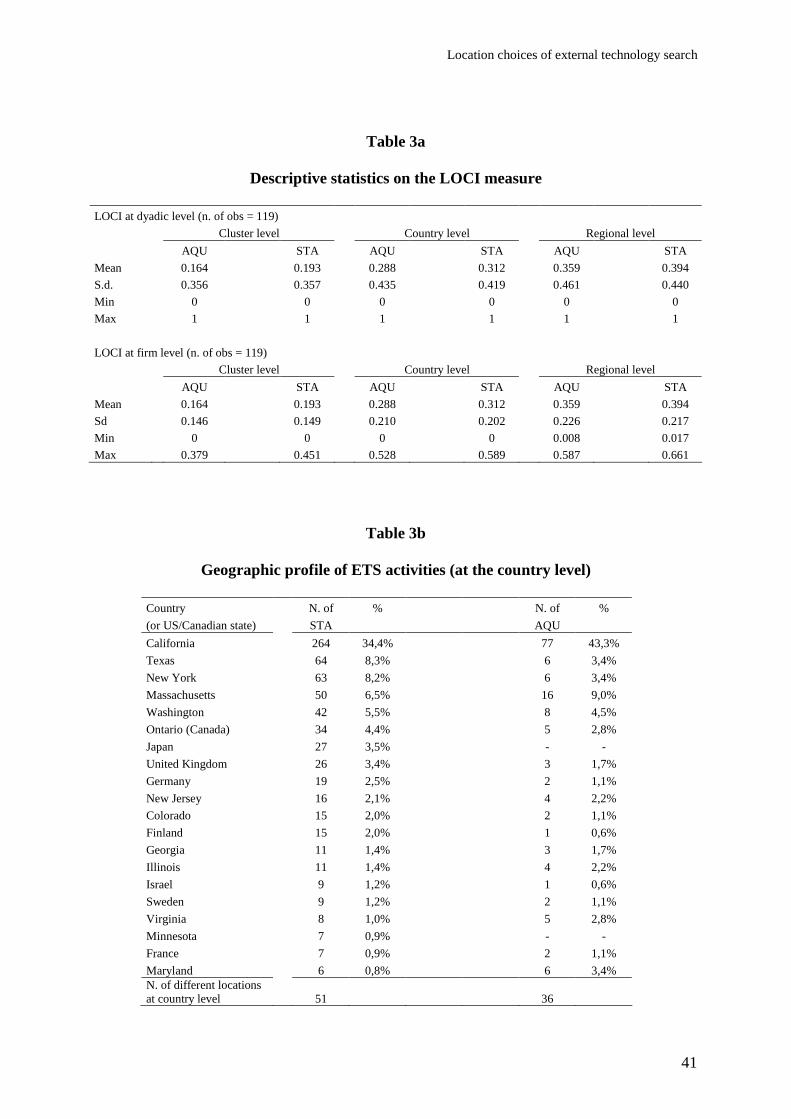
Location choices of external technology search
41
Table 3a
Descriptive statistics on the LOCI measure
LOCI at dyadic level (n. of obs = 119)
Cluster level Country level Regional level
AQU STA AQU STA AQU STA
Mean 0.164 0.193 0.288 0.312 0.359 0.394
S.d. 0.356 0.357 0.435 0.419 0.461 0.440
Min 0 0 0 0 0 0
Max 1 1 1 1 1 1
LOCI at firm level (n. of obs = 119)
Cluster level Country level Regional level
AQU STA AQU STA AQU STA
Mean 0.164 0.193 0.288 0.312 0.359 0.394
Sd 0.146 0.149 0.210 0.202 0.226 0.217
Min 0 0 0 0 0.008 0.017
Max 0.379 0.451 0.528 0.589 0.587 0.661
Table 3b
Geographic profile of ETS activities (at the country level)
Country N. of % N. of %
(or US/Canadian state) STA AQU
California 264 34,4% 77 43,3%
Texas 64 8,3% 6 3,4%
New York 63 8,2% 6 3,4%
Massachusetts 50 6,5% 16 9,0%
Washington 42 5,5% 8 4,5%
Ontario (Canada) 34 4,4% 5 2,8%
Japan 27 3,5% - -
United Kingdom 26 3,4% 3 1,7%
Germany 19 2,5% 2 1,1%
New Jersey 16 2,1% 4 2,2%
Colorado 15 2,0% 2 1,1%
Finland 15 2,0% 1 0,6%
Georgia 11 1,4% 3 1,7%
Illinois 11 1,4% 4 2,2%
Israel 9 1,2% 1 0,6%
Sweden 9 1,2% 2 1,1%
Virginia 8 1,0% 5 2,8%
Minnesota 7 0,9% - -
France 7 0,9% 2 1,1%
Maryland 6 0,8% 6 3,4% N. of different locations at country level
51 36

Location choices of external technology search
42
Table 4
Simple statistics of variables
Independent variables Mean S.d. Min Max
Core variables Firmpatent 21.01 80.04 0 646.84 Patentgenerality 0.01 0.08 0 0.83 Livetrademark 26.83 69.75 0 605 Trademarkdiversification 0.21 0.25 0 0.84 Controls Age in market 2.20 2.02 0 11 Sales in software business 4.58 2.31 0 7.74 Subsidiary 0.61 0.39 0 0.98 Density delay 136.97 35.95 12 256 Pioneers♠ 0.05 0.22 0 1 Hardware♠ 0.07 0.25 0 1 Software♠ 0.82 0.38 0 1 Electronics♠ 0.05 0.22 0 1 North America♠ 0.94 0.24 0 1 Europe♠ 0.03 0.16 0 1
Source. Our elaborations spawn from the use of various data sources that embrace Infotrac’s General Business File ASAP and PROMPT, US Patent and Trademark Office, Compustat and Osiris databases. Notes. ♠ denotes dummy variables.

Location choices of external technology search
43
Table 5
Results of QAP estimation (cluster, country and regional level)
Geographic unit Cluster level Country level Regional level
Type of search activity AQU STA AQU STA AQU STA
Models I II III IV V VI
Core variables
Firmpatent -0.0006 (0.040)* -0.0012 (0.054)† -0.0005 (0.116) -0.0013 (0.094)† -0.0004 (0.166) -0.0015 (0.082)† Patentgenerality -0.0996 (0.010)* -0.1069 (0.032)* -0.1580 (0.002)** -0.1399 (0.020)* -0.1849 (0.002)** -0.1673 (0.010)* Livetrademark 0.0001 (0.302) -0.0019 (0.010)* -0.0003 (0.210) -0.0025 (0.004)** -0.0006 (0.100) -0.0028 (0.010)* Trademarkdiversification -0.0301 (0.002)** -0.0488 (0.018)* -0.0290 (0.012)** -0.0658 (0.026)* -0.0279 (0.052)† -0.0695 (0.030)* Controls
Age in market 0.0016 (0.318) 0.0010 (0.494) -0.0071 (0.098)† -0.0062 (0.276) -0.0085 (0.078)† -0.0075 (0.292) Sales in softw. Business -0.0007 (0.254) 0.0014 (0.278) -0.0012 (0.220) 0.0032 (0.148) -0.0011 (0.264) 0.0030 (0.264) Subsidiary -0.0043 (0.230) -0.0135 (0.210) -0.0030 (0.352) -0.0208 (0.116) -0.0075 (0.226) -0.0247 (0.116) Density delay 0.0000 (0.382) 0.0002 (0.338) -0.0003 (0.086)† 0.0001 (0.464) -0.0004 (0.080)† 0.0000 (0.450) Pioneers♠ -0.1143 (0.154) 0.0309 (0.318) -0.1392 (0.218) 0.0545 (0.322) -0.1732 (0.142) 0.0273 (0.420) Hardware♠ -0.0536 (0.316) -0.0630 (0.278) -0.0218 (0.474) -0.0511 (0.368) -0.0660 (0.360) -0.0879 (0.276) Software♠ -0.0419 (0.146) -0.0404 (0.114) -0.0855 (0.046)* -0.0730 (0.050)† -0.0868 (0.070)† -0.0660 (0.080)† Electronics♠ 0.1714 (0.114) 0.1724 (0.074) † 0.0527 (0.326) 0.1240 (0.176) 0.2532 (0.096)† 0.2934 (0.040)* North America♠ 0.1568 (0.000)** 0.0828 (0.048)* 0.2940 (0.000)** 0.1426 (0.016)* 0.3709 (0.000)** 0.1923 (0.002)** Europe♠ 0.3215 (0.064)† 0.1370 (0.162) 0.3036 (0.162) 0.151 (0.188) 0.3007 (0.166) 0.1270 (0.240) Constant 0.0535 (0.018)* 0.1467 (0.176) 0.0860 (0.000)** 0.2348 (0.124) 0.0894 (0.000)** 0.2677 (0.046)* Observations 56,644 56,644 56,644 56,644 56,644 56,644
e(R2) 0.0267 (0.000)** 0.0413 (0.000)** 0.0577 (0.000)** 0.0580 (0.000)** 0.0773 (0.000)** 0.0701 (0.000)** e(F) 110.05 (0.000)** 172.76 (0.000)** 245.52 (0.000)** 246.98 (0.000)** 335.86 (0.000)** 302.22 (0.000)**
Notes. Dependent variable: LOCI of focal firm i with respect to reference firm j, data on dependent variables from 1999-2002. Time-variant independent and control variables are lagged by one-year. † indicates p < 0.1. * indicates p < 0.05. ** indicates p < 0.01. Values in parentheses are pseudo p-values. ♠ denotes dummy variables.

Location choices of external technology search
44
Table 6
Overview of support for the hypotheses in terms of activity type
Type of search activity AQU STA Comments
Hypotheses and core variables
H1 Firmpatent - - Significance of Firmpatent for acquisitions only at cluster level
H2 Patentgenerality Yes Yes -
H3 Livetrademark - Yes -
H4 Trademarkdiversification Yes Yes Partial support of Trademarkdiversification for acquisitions at regional level
Table 7
Sensibility test for changes in the Location Index (country level)
2SD increase
Core variables SD AQU STA
Firmpatent 17.69 - -
Patentgenerality 0.11 -10.4% -9.8%
Livetrademark 15.40 - -25.6%
Trademarkdiv. 0.36 -6.9% -15.2%
Notes. We made a two standard deviation increase on the mean value of the core variables to see the change in the value of the dependent variable (location index). Empty cells below acquisitions and strategic technology alliances refer to fact that the given independent variable exerted an insignificant effect on the location index constructed with the corresponding external search mechanism.