Embed Size (px)
Citation preview

R: Programming and Looping Functions
140.776 Statistical Computing
September 29, 2011
140.776 Statistical Computing R: Programming and Looping Functions

Recursive functions
Functions can be recursive. For example, suppose x = 2d . Nowgiven an integer x , we want to compute d = log2(x). You canimplement using a loop:
g<-function(x) {d<-0while(x>=2) {
x<-x/2d<-d+1
}}
> y<-g(32)> y[1] 5
140.776 Statistical Computing R: Programming and Looping Functions
Recursive functions
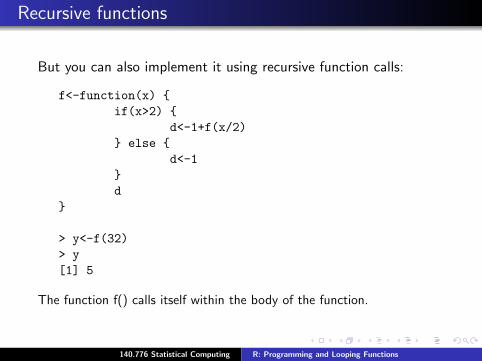
But you can also implement it using recursive function calls:
f<-function(x) {if(x>2) {
d<-1+f(x/2)} else {
d<-1}d
}
> y<-f(32)> y[1] 5
The function f() calls itself within the body of the function.
140.776 Statistical Computing R: Programming and Looping Functions

Tree
> load("tree.rda")
140.776 Statistical Computing R: Programming and Looping Functions

Tree
preferred
biostatistician to
most that approach analyzing
agree the
140.776 Statistical Computing R: Programming and Looping Functions

Tree traversal
scantree<-function(t) {
leftn<-t$left
rightn<-t$right
if(is.list(leftn) == TRUE) {
strl<-scantree(leftn)
} else {
strl<-""
}
if(is.list(rightn) == TRUE) {
strr<-scantree(rightn)
} else {
strr<-""
}
str<-c(strl, t$key, strr)
}
mystr<-scantree(mytree)
print(paste(mystr, collapse= " "))
140.776 Statistical Computing R: Programming and Looping Functions

Looping functions
The for, while loops can often be replaced by looping functions:
lapply: loop over a list and evaluate a function on eachelement
sapply: same as lapply but try to simplify the result
apply: apply a function over the margins of an array
tapply: apply a function over subsets of a vector
mapply: multivariate version of lapply
140.776 Statistical Computing R: Programming and Looping Functions

lapply
lapply(X, FUN, ...)
lapply takes three arguments: a list X, a function FUN, and otherarguments ... If X is not a list, it will be converted to a list usingas.list().
It returns a list of the same length as X, each element of which isthe result of applying FUN to the corresponding element of X.
140.776 Statistical Computing R: Programming and Looping Functions

lapply
Examples:
> u<-list(x=1:10,y=rnorm(100))> lapply(u,mean)$x[1] 5.5
$y[1] -0.06615078
> v<-c("bio","stat","comput")> lapply(v,nchar)[[1]][1] 3
[[2]][1] 4
[[3]][1] 6
140.776 Statistical Computing R: Programming and Looping Functions

lapply
> lapply(1:4, runif)[[1]][1] 0.7082681
[[2]][1] 0.1966707 0.3025155
[[3]][1] 0.1872824 0.1093319 0.1641600
[[4]][1] 0.29028286 0.74228311 0.03167801 0.44816463
140.776 Statistical Computing R: Programming and Looping Functions

lapply
lapply makes heavy use of anonymous functions.
> x<-list(a=matrix(1:4,2,2),b=matrix(1:6,3,2))> x$a
[,1] [,2][1,] 1 3[2,] 2 4
$b[,1] [,2]
[1,] 1 4[2,] 2 5[3,] 3 6
140.776 Statistical Computing R: Programming and Looping Functions

lapply
An anonymous function for extracting the first column of each matrix.
> lapply(x,function(elt) elt[,1])$a[1] 1 2
$b[1] 1 2 3
140.776 Statistical Computing R: Programming and Looping Functions

sapply
sapply is a user-friendly version of lapply.
If the result is a list where every element is length 1, then avector is returned.
If the result is a list where every element is a vector of thesame length (>1), a matrix is returned.
If it cannot figure things out, a list is returned.
140.776 Statistical Computing R: Programming and Looping Functions
sapply
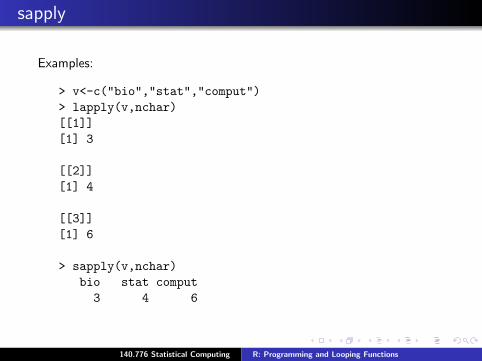
Examples:
> v<-c("bio","stat","comput")> lapply(v,nchar)[[1]][1] 3
[[2]][1] 4
[[3]][1] 6
> sapply(v,nchar)bio stat comput3 4 6
140.776 Statistical Computing R: Programming and Looping Functions

apply
apply(X, MARGIN, FUN, ...)
Applying a function to margins of an array X.
If X is not an array but has a dimension attribute, apply attempts tocoerce it to an array via as.matrix if it is two-dimensional (e.g., dataframes) or via as.array
MARGIN is an integer vector indicating which margins should be“retained”.
FUN is a function to be applied
. . . is for arguments to be passed to FUN
140.776 Statistical Computing R: Programming and Looping Functions

apply
If each call to FUN returns a vector of length n, then apply returnsan array of dimension c(n, dim(X)[MARGIN]) if n>1. If n equals 1,apply returns a vector if MARGIN has length 1 and an array ofdimension dim(X)[MARGIN] otherwise.
If the calls to FUN return vectors of different lengths, apply returnsa list of length prod(dim(X)[MARGIN]) with dim set to MARGIN ifthis has length greater than one.
140.776 Statistical Computing R: Programming and Looping Functions

apply
> x<-matrix(1:6,3,2)> x
[,1] [,2][1,] 1 4[2,] 2 5[3,] 3 6
> apply(x,1,function(u) sum(u))[1] 5 7 9
> apply(x,1,mean)[1] 2.5 3.5 4.5
140.776 Statistical Computing R: Programming and Looping Functions

apply
Quantiles of the rows of a matrix.
> x<-matrix(rnorm(100),5,20)
> apply(x,1,quantile,probs=c(0.25,0.75))[,1] [,2] [,3] [,4]
25% -0.7463242 -0.1705673 -0.6468663 -0.767197475% 0.4318116 0.9564692 0.4955044 0.4381032
[,5]25% -0.961255375% 1.4259372
140.776 Statistical Computing R: Programming and Looping Functions
col/row sums and means
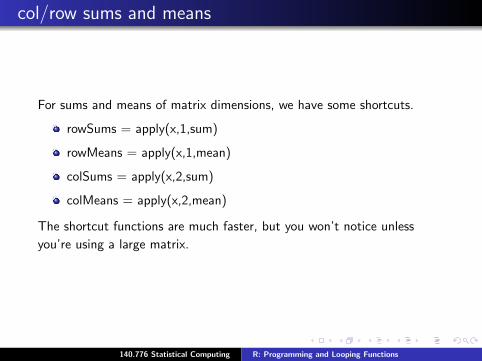
For sums and means of matrix dimensions, we have some shortcuts.
rowSums = apply(x,1,sum)
rowMeans = apply(x,1,mean)
colSums = apply(x,2,sum)
colMeans = apply(x,2,mean)
The shortcut functions are much faster, but you won’t notice unless
you’re using a large matrix.
140.776 Statistical Computing R: Programming and Looping Functions

col/row sums and means
> x<-array(rnorm(2*2*10),c(2,2,10))> apply(x,c(1,2),sum)
[,1] [,2][1,] 4.2774538 2.407804[2,] -0.5435999 3.988917
> rowSums(x,dims=2)[,1] [,2]
[1,] 4.2774538 2.407804[2,] -0.5435999 3.988917
> rowSums(x)[1] 6.685258 3.445317
140.776 Statistical Computing R: Programming and Looping Functions
tapply
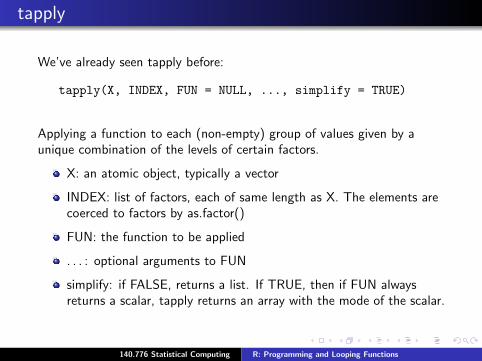
We’ve already seen tapply before:
tapply(X, INDEX, FUN = NULL, ..., simplify = TRUE)
Applying a function to each (non-empty) group of values given by aunique combination of the levels of certain factors.
X: an atomic object, typically a vector
INDEX: list of factors, each of same length as X. The elements arecoerced to factors by as.factor()
FUN: the function to be applied
. . . : optional arguments to FUN
simplify: if FALSE, returns a list. If TRUE, then if FUN alwaysreturns a scalar, tapply returns an array with the mode of the scalar.
140.776 Statistical Computing R: Programming and Looping Functions

tapply
> x<-c(rnorm(5),rnorm(5,1),rnorm(5,2),rnorm(5,3))> f1<-factor(rep(1:2,each=10))> f1[1] 1 1 1 1 1 1 1 1 1 1 2 2 2 2 2 2 2 2 2 2
Levels: 1 2> f2<-factor(rep(rep(3:4,each=5),times=2))> f2[1] 3 3 3 3 3 4 4 4 4 4 3 3 3 3 3 4 4 4 4 4
Levels: 3 4> f<-list(f1,f2)> tapply(x,f,mean)
3 41 0.4687781 0.97279932 1.7442365 3.4148615
140.776 Statistical Computing R: Programming and Looping Functions

tapply
> x<-c(rnorm(10),rnorm(10,1),rnorm(10,2))> f<-gl(3,10)> f[1] 1 1 1 1 1 1 1 1 1 1 2 2 2 2 2 2 2 2 2 2 3 3 3 3 3 3
[27] 3 3 3 3Levels: 1 2 3
> tapply(x,f,mean)1 2 3
0.3104300 0.9665058 2.0069397
> tapply(x,f,mean,simplify=FALSE)$‘1‘[1] 0.3104300$‘2‘[1] 0.9665058$‘3‘[1] 2.006940
140.776 Statistical Computing R: Programming and Looping Functions

tapply
Find group ranges.
> tapply(x,f,range)$‘1‘[1] -1.087020 1.801051
$‘2‘[1] -0.3175924 2.4043049
$‘3‘[1] 0.9338877 3.4817331
140.776 Statistical Computing R: Programming and Looping Functions

mapply
mapply(FUN, ..., MoreArgs = NULL, SIMPLIFY = TRUE,USE.NAMES = TRUE)
mapply is a multivariate version of sapply. mapply applies FUN to thefirst elements of each ... argument, the second elements, the thirdelements, and so on. Arguments are recycled if necessary.
FUN: the function to be applied
. . . : arguments to apply over
MoreArgs: a list of other arguments to FUN
SIMPLIFY: logical; whether the result should be simplified to avector or matrix.
140.776 Statistical Computing R: Programming and Looping Functions

mapply
Example:
## tedious to type> list(rep(1,4),rep(2,3),rep(3,2),rep(4,1))
## use mapply instead> mapply(rep,1:4, 4:1)[[1]][1] 1 1 1 1
[[2]][1] 2 2 2
[[3]][1] 3 3
[[4]][1] 4
140.776 Statistical Computing R: Programming and Looping Functions

Vectorizing a function
noise<-function(n,mean,sd) {rnorm(n,mean,sd)
}
> noise(3,1,2)[1] 5.164179 1.353838 -2.573485
> noise(1:3,1:3,2)[1] -3.8190429 1.6455998 0.4092931
140.776 Statistical Computing R: Programming and Looping Functions

Instant vectorization
> mapply(noise,1:3,1:3,2)[[1]][1] 3.619997
[[2]][1] 5.641030 -2.344175
[[3]][1] 0.7557551 -0.4642377 4.8742734
which is the same as
list(noise(1,1,2),noise(2,2,2),noise(3,3,2))
140.776 Statistical Computing R: Programming and Looping Functions

split
split(x, f, drop = FALSE, ...)
split divides the data in the x into the groups defined by a factor or list offactors. It is often followed by lapply.
x: a vector or data frame
f: a factor or a list of factors
drop: logical; whether empty levels should be dropped
140.776 Statistical Computing R: Programming and Looping Functions

split
> x<-c(rnorm(4),runif(4),rgamma(4,1,1))> f<-gl(3,4)> split(x,f)$‘1‘[1] -2.03109144 -0.08146077 -0.17701322 -0.78487670
$‘2‘[1] 0.1401723 0.6657537 0.6366146 0.7639057
$‘3‘[1] 0.4280483 0.6125946 1.6261508 1.6642573
140.776 Statistical Computing R: Programming and Looping Functions

split
> lapply(split(x,f),mean)$‘1‘[1] -0.7686105
$‘2‘[1] 0.5516116
$‘3‘[1] 1.082763
140.776 Statistical Computing R: Programming and Looping Functions

Splitting on more than one level
> x<-rnorm(10)> f1<-gl(2,5)> f2<-gl(5,2)> f1[1] 1 1 1 1 1 2 2 2 2 2
Levels: 1 2> f2[1] 1 1 2 2 3 3 4 4 5 5
Levels: 1 2 3 4 5> interaction(f1,f2)[1] 1.1 1.1 1.2 1.2 1.3 2.3 2.4 2.4 2.5 2.5
Levels: 1.1 2.1 1.2 2.2 1.3 2.3 1.4 2.4 1.5 2.5
140.776 Statistical Computing R: Programming and Looping Functions

Splitting on more than one level
Interactions can create empty levels.
> str(split(x,list(f1,f2)))List of 10$ 1.1: num [1:2] 0.23 0.862$ 2.1: num(0)$ 1.2: num [1:2] -0.849 0.511$ 2.2: num(0)$ 1.3: num -1.33$ 2.3: num -3.12$ 1.4: num(0)$ 2.4: num [1:2] 1.3 -2.11$ 1.5: num(0)$ 2.5: num [1:2] -0.726 0.839
140.776 Statistical Computing R: Programming and Looping Functions

Splitting on more than one level
Empty levels can be dropped.
> str(split(x,list(f1,f2), drop=TRUE))List of 6$ 1.1: num [1:2] 0.23 0.862$ 1.2: num [1:2] -0.849 0.511$ 1.3: num -1.33$ 2.3: num -3.12$ 2.4: num [1:2] 1.3 -2.11$ 2.5: num [1:2] -0.726 0.839
140.776 Statistical Computing R: Programming and Looping Functions

![FXCPU Structured Programming Manual [Application Functions] · FXCPU Structured Programming Manual [Application Functions] FXCPU Structured Programming Manual [Application Functions]](https://img.dokumen.tips/doc/110x75/5f7c3a0ec7c4c4492f38781e/fxcpu-structured-programming-manual-application-functions-fxcpu-structured-programming.jpg)