Embed Size (px)
Citation preview

R & D Report 1995:5. Statistical metadata : a tutorial / Bo Sundgren. Digitaliserad av Statistiska centralbyrån (SCB) 2016. urn:nbn:se:scb-1995-X101OP9505
INLEDNING
TILL
R & D report : research, methods, development / Statistics Sweden. – Stockholm :
Statistiska centralbyrån, 1988-2004. – Nr. 1988:1-2004:2.
Häri ingår Abstracts : sammanfattningar av metodrapporter från SCB med egen
numrering.
Föregångare:
Metodinformation : preliminär rapport från Statistiska centralbyrån. – Stockholm :
Statistiska centralbyrån. – 1984-1986. – Nr 1984:1-1986:8.
U/ADB / Statistics Sweden. – Stockholm : Statistiska centralbyrån, 1986-1987. – Nr E24-
E26
R & D report : research, methods, development, U/STM / Statistics Sweden. – Stockholm :
Statistiska centralbyrån, 1987. – Nr 29-41.
Efterföljare:
Research and development : methodology reports from Statistics Sweden. – Stockholm :
Statistiska centralbyrån. – 2006-. – Nr 2006:1-.

STATISTICAL METADATA
A TUTORIAL
Bo Sundgren
R&D Report Statistics Sweden
Research - Methods - Development 1995:5
Från trycket Producent Ansvarig utgivare
December 1995 Statistiska centralbyrån, utvecklingsavdelningen Lars Lyberg
Förfrågningar Bo Sundgren tel 08-783 41 48 telefax 08-783 45 99
© 1995, Statistiska centralbyrån, 115 81 STOCKHOLM ISSN 0283-8680
Printed Producer Publisher
December, 1995 Statistics Sweden Lars Lyberg
Inquiries Bo Sundgren telephone +46 8 783 41 48 telefax +46 8 783 45 99
© 1995, Statistics Sweden, S-115 81 STOCKHOLM, Sweden ISSN 0283-8680

STATISTICAL METADATA - A TUTORIAL
Bo Sundgren Statistics Sweden
S-11581 STOCKHOLM
0 Abstract
The paper consists of five chapters. In chapter 1 a conceptual foundation is proposed, introducing the concepts of statistical metadata, statistical data, and statistical information systems. Chapter 2 discusses which subjects (users and producers of statistical data) and objects (software tools) have needs for statistical metadata, and for which purposes. In chapter 3 the contents of these metadata needs are analysed more systematically, and in more detail; particular emphasis is given to the metadata needs of users of statistical data. Chapter 4 investigates possible sources for the statistical metadata needed. Finally, chapter 5 discusses how the metadata infrastructure of a statistical service could best be organised.
1 Conceptual foundation
1.1 Statistical metadata - what are they, and why are they needed?
Statistical metadata are data which are needed for proper production and usage of statistical data. They describe statistical data and - to some extent - processes and tools involved in the production and usage of statistical data. Expressed briefly, statistical metadata are data about statistical data.
Strictly speaking, metadata are physical representations of metainformation, just like data in general are physical representations of information (knowledge). If we turn the relationship between metadata and metainformation the other way around, we can say that metainformation is the semantical contents (or the meaning) of metadata. Here we shall not pay too much attention to the distinction between metadata and metainformation.
Like data in general occur in connection with information systems, metadata occur in connection with metainformation systems. Thus metainformation systems are systems which use and produce, process and store, metadata, informing about data. Analogously, statistical metainformation systems are systems which use and produce, process and store, statistical metadata, informing about statistical data.
A metainformation system can be active or passive. An active metainformation system is physically integrated with the information system containing the data that the metadata in the metainformation system informs about. A user of an active metainformation system, who has identified some potentially interesting data, can immediately proceed to retrieve the data from the same system. Thus this system is an integrated information/metainformation system.
A passive metainformation system contains only references to data, not the data themselves. A user of a passive metainformation system, who has identified some potentially interesting data, will have to retrieve these data from another system.
1

1.2 Statistical data
Statistical data are the primary objects of the descriptions provided by statistical metadata. Thus in order to understand the meaning and contents of statistical metadata, we must have some understanding of what statistical data are, and what it is about them that may have to be described.
Figure 1.1 attempts to highlight the essence of statistical data and of the processes resulting in statistical data.
Statistical data may be microdata or macrodata, defined as follows.
1.2.1 Microdata
Microdata, sometimes called observation data or measurement data are the result of observations or measurements of a set of object characteristics (states and events). An object. characteristic can be formalized as an ordered pair
(1.1) C0 = <0(t), V(t)> or, with dot notation, C0 = 0(t).V(t)
where O is an object type, V is a variable, and t is a time parameter. Sometimes O will rather be a vector of object types, in which case V will be a relation or a variable that is based upon a relation, e g "quantity (of a commodity) exported (from one country to another country)".
O(t) is a population of objects existing at time t, and V(t) is the status at time t of a variable V, which is relevant for the objects in O(t). In the most general case the time parameter t may not have the same value in V(t) as in O(t).
The basic building-blocks of information about observations and measurements of object characteristics are so-called elementary messages (e-messages) with the semantical structure
(1.2) m0 = <0j, p, t> or, with an alternative notation, m0 = [Oj.V(t) = VJ]
where Oj is an object instance belonging to the object type O, p is a property, typically expressed as a value aj of a variable V, and t is an instance of time (point or interval) at/during which the object is supposed to have (had) the property p. Alternatively OJ could be a vector of objects, p being a relation (like "married") or a <V, vp pair, where V is based upon a relation (like in the "export" example above).
In a typical interaction between a statistical information system and an input provider, the latter receives a set of questions, often hierarchically structured by respondent. The respondent is sometimes identical with (one of) the object(s) observed. The questions are accompanied by some metadata in the form of explanations, instructions, etc. In some systems additional metadata may be requested interactively by the respondent, if and when it they are needed. When observation messages are returned to the statistical information system, they may be accompanied by other types of metadata, informing about, say, some exceptional circumstances noted in connection with the observation process.
When the hierarchically structured sets of observation messages enter the statistical information system, they are often - sooner or later - transformed into flat files or relational tables in accordance with relatively well standardized procedures, supported by many commercial software products (cf form handling tools of relational database management systems). The accompanying metainformation should ideally be systematically taken care of by a parallel process, but this process has not yet reached any degree of standardization.
2

Figure 1.1. Illustration of some fundamental concepts in statistical information processing.
3

Observation registers, containing observed and/or derived microdata, are - beside collections of statistics/macrodata (cf next section) - the most important type of data output from statistical surveys. More and more competent users of statistics demand access to microdata, for their own analyses, in their own computer environments. Statistical services may respond to such demands by preparing files of anonymized microdata, for example so-called public files.
An external (re) of an observation register may not be in a position where he or she has access to the staff, who once (maybe years earlier) produced the data. Thus the observation register will have to be accompanied by an appropriate set of metadata.
1.2.2 Macrodata: statistics
Macrodata, in daily talk simply referred to as "statistics", are the result of estimations of a set of statistical characteristics (statistical concepts). The estimations are made on the basis of a set of microdata, that is, a set of observations of a set of object characteristics. A statistical characteristic can be formalized as a triple
(1.3) <0(t), V(t), f> or, with dot notation, Cs = 0(t).V(t).f
where 0(t).V(t) is an object characteristic, and f is a statistical measure, that is, an aggregation function (count, sum, average, correlation, etc) summarizing the true values of V(t) for the objects in O(t). In the most general case, V is a vector of variables, each one of which may be qualified by a separate time parameter, that is, t is a vector, too.
The basic building-blocks of the aggregated statistical information contained in statistical tables are statistical e-messages with the semantical structure
(1.4)
where
(i) 0(ti ) is a population of objects existing at/during time X\ ; (ii) V(t2) is the status of a (vector of) variable(s) at/during time(s) 1%, (iii) f is a statistical measure; (iv) e is an estimator, that is, a function providing estimates of the true values of a
statistical characteristic Cs on the basis of observed values of one or more object characteristics.
Statistical macrodata are organized in certain typical structures. For example, statistics users are often interested to obtain estimated values of "the same" statistical characteristic for
• a series of time periods (rather than a signle one) - "time series data"; and/or • a sturctured set of object populations (rather than a single one) - "cross-sectional data".
The following format is general enough to cover most structures of statistical metainformation that are demanded by statistics users:
(1.5)
where
(i) 0(ta) is a (series of) population(s) of objects existing at/during ta, which, in the case of time series data, is a parameter varying over a certain range of times;
(ii) pa is a property, the alfa property, selecting a subset of 0(ta);
4
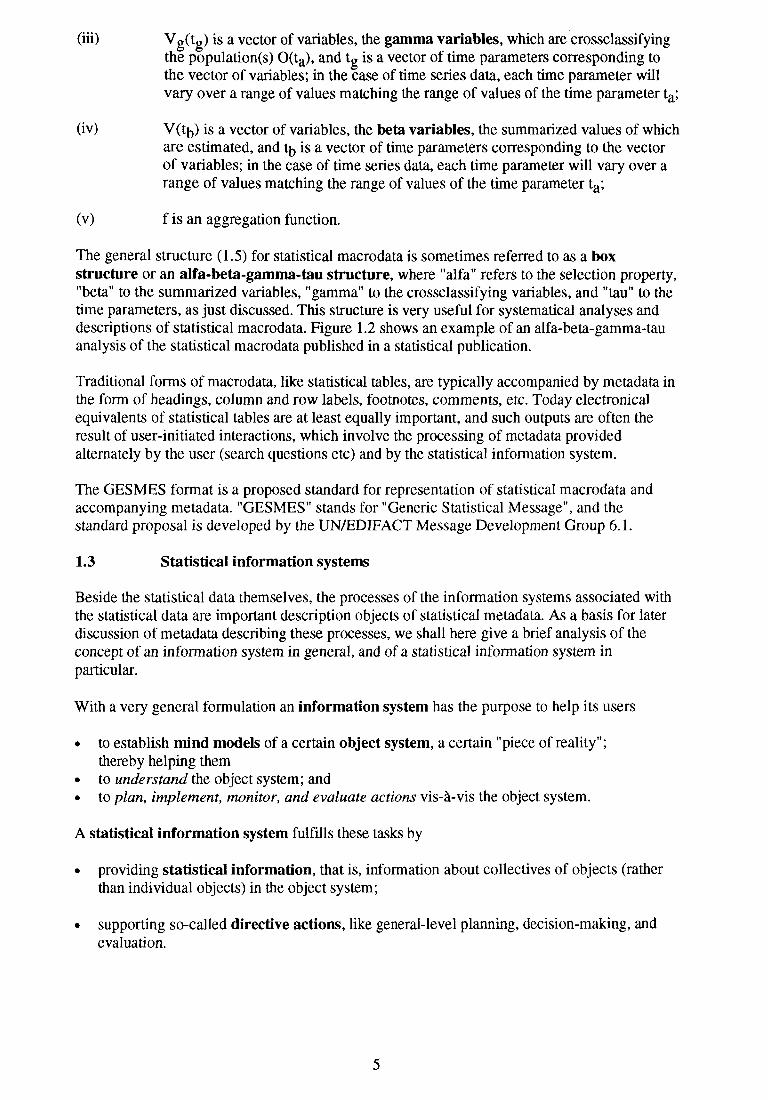
(Hi) vg^tg) is a v e c t o r °f variables, the gamma variables, which are crossclassifying the population(s) 0(ta), and tg is a vector of time parameters corresponding to the vector of variables; in the case of time series data, each time parameter will vary over a range of values matching the range of values of the time parameter ta;
(iv) V(tb) is a vector of variables, the beta variables, the summarized values of which are estimated, and % is a vector of time parameters corresponding to the vector of variables; in the case of time series data, each time parameter will vary over a range of values matching the range of values of the time parameter ta;
(v) f is an aggregation function.
The general structure (1.5) for statistical macrodata is sometimes referred to as a box structure or an alfa-beta-gamma-tau structure, where "alfa" refers to the selection property, "beta" to the summarized variables, "gamma" to the crossclassifying variables, and "tau" to the time parameters, as just discussed. This structure is very useful for systematical analyses and descriptions of statistical macrodata. Figure 1.2 shows an example of an alfa-beta-gamma-tau analysis of the statistical macrodata published in a statistical publication.
Traditional forms of macrodata, like statistical tables, are typically accompanied by metadata in the form of headings, column and row labels, footnotes, comments, etc. Today electronical equivalents of statistical tables are at least equally important, and such outputs are often the result of user-initiated interactions, which involve the processing of metadata provided alternately by the user (search questions etc) and by the statistical information system.
The GESMES format is a proposed standard for representation of statistical macrodata and accompanying metadata. "GESMES" stands for "Generic Statistical Message", and the standard proposal is developed by the UN/EDIFACT Message Development Group 6.1.
1.3 Statistical information systems
Beside the statistical data themselves, the processes of the information systems associated with the statistical data are important description objects of statistical metadata. As a basis for later discussion of metadata describing these processes, we shall here give a brief analysis of the concept of an information system in general, and of a statistical information system in particular.
With a very general formulation an information system has the purpose to help its users
• to establish mind models of a certain object system, a certain "piece of reality"; thereby helping them
• to understand the object system; and • to plan, implement, monitor, and evaluate actions vis-à-vis the object system.
A statistical information system fulfills these tasks by
• providing statistical information, that is, information about collectives of objects (rather than individual objects) in the object system;
• supporting so-called directive actions, like general-level planning, decision-making, and evaluation.
5

Figure 1.2. Part of an alfa-beta-gamma-tau analysis of the tables in "Monthly Summary of Statistics Australia". Cf Sundgren (1991d).
6

A statistical information system accomplishes its tasks by performing three major functions:
(F1 ) an input acquisition function, which directly and/or indirectly observes (measures) certain object system characteristics, and which prepares and stores the observation data obtained as microdata in an observation register;
(F2) an aggregation function, which transforms the microdata produced by the input acquisition function into macrodata, or "statistics", which are estimated values of statistical characteristics.
(F3) an output delivery function, which makes macrodata (statistics) available to the users, and which assists the users to interpret and analyze the data further.
Figure 1.3 illustrates a break-down of the three major functions into more concrete subfunctions and tasks. In a traditional survey-processing system the functions, subfunctions, and tasks have been carried out more or less serially, in the order indicated by figure 1.3: from top to bottom, and from left to right.
Modern technology permits a much more flexible organization of the processes for producing and disseminating statistics. The production system in figure 1.4 is assumed to be:
• database-oriented: the microdata and macrodata, which are stored and processed, are communicated within and between the functions and subfunctions via a database;
• self-describing: the microdata and macrodata are described by means of accompanying metadata, which are stored in the database, and which are consistently transformed, whenever the described data are transformed.
The architecture visualized in figure 1.4 covers many different types of statistical information systems: survey processing systems, register management systems, user-driven retrieval systems, to mention the most important ones.
A survey processing system focuses on a data collection process, resulting in a collection of microdata, which are aggregated into estimated values of certain statistical characteristics.
A user-driven retrieval system focuses on the needs of a particular category of statistics users, and aims at making available macrodata and microdata from different surveys (and other sources), which may be relevant for the particular category of users.
Register management is an important auxiliary process for statistics production. There are two kinds of registers, which are particularly important for statistical information systems: base registers and code registers. A base register establishes and maintains an authorized list of the objects belonging to a certain population. A code register establishes and maintains an authorized list of the values belonging to the value set of a certain variable or classification.
A complex statistical information system may contain many statistical surveys, retrieval systems, and registers as subsystems. "The statistical information system of a country" is an example of such a complex statistical information system.
7

Figure 1.3. A functionally oriented model of a statistical information system.
8

Figure 1.4. A model of a self-describing database-oriented statistical information system.
9

2 Who needs statistical metadata - and for what purposes?
Users and producers of statistical data are obvious users of statistical metadata. In this chapter we shall identify the major purposes for which people belonging to these two categories actually need statistical metadata. Then, in the next chapter, we shall make a more detailed analysis of which kinds of the metadata that they need. In addition we shall treat separately the needs for statistical metadata that are associated with the software tools that are used in the production and usage of statistical data. Naturally these needs for statistical metadata can directly or indirectly be derived from the needs of users and producers of statistical data. However, software tools have such a special and important role that we find it appropriate to pay special attention to these needs.
2.1 Users of statistical data
Schematically the usage process proceeds as follows. First, a would-be user with some kind of question or problem is looking for statistical data of potential relevance for his/her problem. Second, the user identifies some statistical data of potential interest and decides to retrieve these data. Third, the user analyses and interprets the statistical data thus retrieved, and then possibly reiterates parts of the search, retrieval, and analysis procedure again.
In each one of the steps of the outlined usage procedure the user of statistical data will need some metadata. The width and depth of the statistical metadata needed will among other things depend on the pre-knowledge of the user. Different categories of users have different prerequisites and requirements.
Figure 2.1 gives an overview of some important categories of users and usages of statistical data and statistical information systems.
Figure 2.1. Users and usages of statistical data and statistical information systems.
Different users may have very different needs, and as a consequence a modern statistical service will have to offer a wide range of different products and services. Figures 2.2a and 2.2b illustrate two ways of analysing this situation. Figure 2.2a shows how the characteristics of a number of "typical" user categories can be described and analyzed, and figure 2.2b shows a way of structuring the range of products and services provided by a statistical service.
10

Figure 2.2a. A scheme for analyzing the profiles of different categories of statistics users.
11

Figure 2.2b. "The stairs of services".
2.2 Producers of statistical data
"Production of statistical data" can be given a broad or a narrow interpretation. In a narrow sense the production process includes the operative production steps as outlined in figure 1.3 earlier in this paper. In a broad sense "production" covers the whole life cycle of a statistical survey or a statistical information system, including design, implementation, operation, monitoring, maintenance, and evaluation.
Here we shall use the broader interpretation of "production", and "producers of statistical data" will include
• designers of statistical surveys and statistical information systems: subject matter statisticians, statistical methodologists, and information system specialists;
• input data providers: respondents, contact persons etc;
• production statisticians (here "production" is given a narrower interpretation).
All these categories of producers of statistical data have their typical metadata needs. For example, a designer of a statistical survey will need to know about user needs, how similar surveys have been designed in the past and/or by other statistical services. A data provider to a statistical survey will be interested to know about the purposes of the survey and about the costs and benefits of his/her participation. A production statistician will need check-lists and other production system documentation in order to remember how to carry out the production steps properly, and in order to be able to train new staff members whenever necessary. An auditor evaluating a statistical information system will need metadata concerning the functioning of the system, including feed-back information from the users.
2.3 Software tools 12

A software tool needs certain metadata for its proper functioning. For example, it needs a formal description of the data that it is requested to process, that is, something like a file and record description. It also needs textual metadata in order to be able to present output data and communicate properly with the software tool users.
Thus a software tool needs metadata. On the other hand the its users need metadata informing about the software tool as such. For example, a user of a software tool for some kind of statistical analysis will need information about the tool in order to be able to handle the tool properly, and in order to be able to interpret the results from the analysis in a responsible way.
3 What statistical metadata are needed?
In this chapter we shall analyse what statistical metadata are needed by users and producers of statistical data and by software tools. We shall put particular emphasis on the metadata needed by users of statistical data.
3.1 Metadata needed by users of statistical data
3.1.1 Declarative metadata concerning specific sets of statistical data
In order to judge the usefulness of some specific statistical data (macrodata and/or microdata) for his/her purpose, a potential user needs to know something about
• the contents (meaning) of the statistical data, making it possible for the user to judge the relevance of the data with regard to his/her question or problem;
• the accuracy (precision, reliability) of the statistical data, that is, how well the measurements/estimations actually measure/estimate what was intended (by the designers) to be measured/estimated;
• the availability of the statistical data, that is, how the user can get access to them.
These three aspects of statistical data are often regarded as three major dimensions of the quality of statistical data, and a description of the contents, accuracy, and availability of a set of statistical data may be termed a quality declaration of the data.
The term "quality" has actually two basically different meanings. According to one interpretation, "quality" is identical with "good quality". This interpretation assumes that there is a general agreement on what "good quality" means in terms of properties of the entity whose quality is measured. For statistical data it is not easy to establish absolute quality criteria. The same statistical data (based on certain definitions and measurement procedures) may be quite adequate for one usage and completely inadequate for another, depending on how relevant the definitions and measurement procedures are for the respective purposes. The most fundamental quality requirement on statistical data is that the quality-relevant properties of the statistical data should be known, that is, the statistics should have known quality, and this quality should be well documented in some kind of quality declaration. If (and only if) these conditions are satisfied, a potential user of certain statistical data can (independently of the producer) asses the quality of the data relative to his/her particular needs.
13

Recalling figure 1.1 we may identify three conceptual levels, the relations between which are fundamental for understanding the quality concept that we are discussing here (cf figure 3.1):
(L1) the level of a statistical characteristic of interest to a user, that is, the "ideal" statistical characteristic to be estimated, if there were no practical restrictions or contradictory needs of different users;
(L2) the level of the statistical characteristic decided to be estimated, after practical restrictions and contradictory needs have been taken into account by the designers;
(L3) the level of the actually achieved estimated value of the statistical characteristic, as produced by the implemented production system, affected by different kinds of errors and uncertainties.
The discrepancy between levels LI and L2 may be called the relevance discrepancy. It can be finally judged only by the user. What the producer can do in order to make it easier for the user to reach his/her judgement is to provide certain contents-oriented metadata as will be further discussed below.
The discrepancy between levels L2 and L3 may be called the accuracy discrepancy. It can be described by the producer of the statistical data.
Note. The conceptual discussion that we have just carried out for statistical characteristics (and thus for macrodata) can be carried out analogously for object characteristics (and thus for microdata); cf section 1.2.
The quality declaration templet in figure 3.2 provides a possible structuring of the metadata needed by a user who wants to judge the potential usefulness of a certain set of statistical data for a certain question or problem. With some minor modifications the templet can be used for microdata as well as for macrodata.
statistical characteristic of interest to the user, the Ideal" statistical characteristic to be estimated
statistical characteristic to be estimated according to design decision of the producer
actually achieved estimated value of the statistical characteristic, as produced and affected by errors and uncertainties
Figure 3.1. The quality of statistical data from a user's point of view.
14
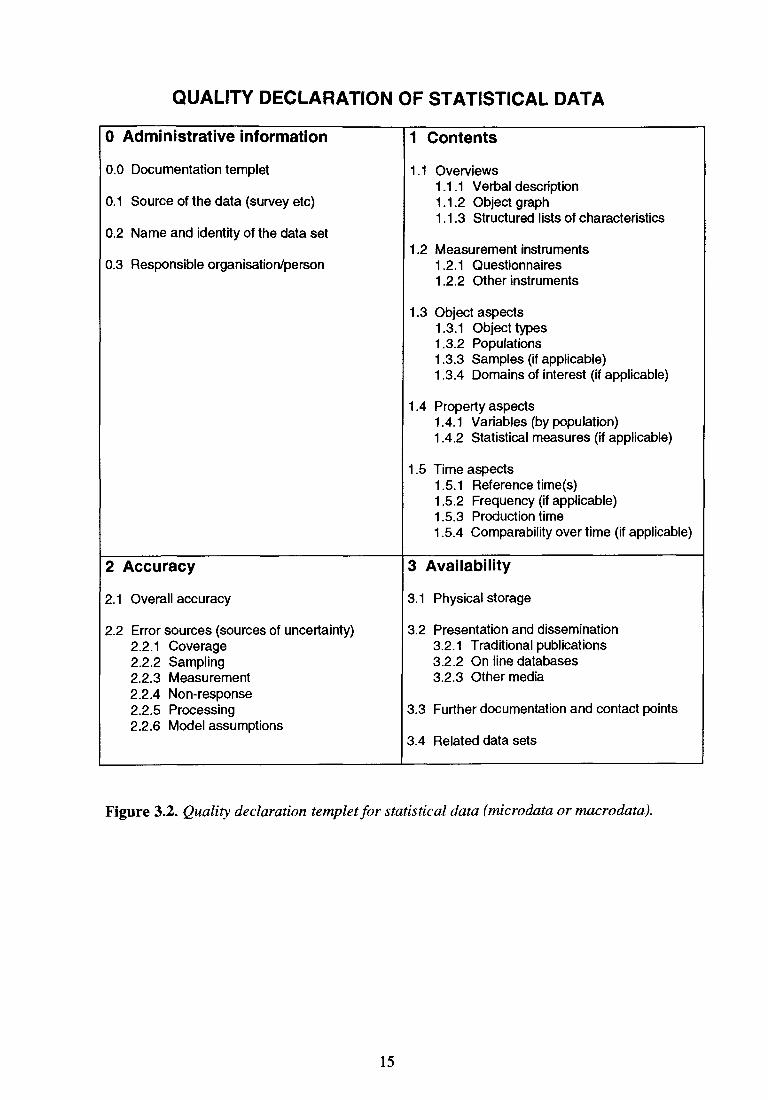
QUALITY DECLARATION OF STATISTICAL DATA
Figure 3.2. Quality declaration templet for statistical data (microdata or macrodata).
15
3.1.2 Process-oriented metadata concerning specific sets of statistical data
Declarative metadata are not always sufficient to give a user of a set of statistical data an adequate understanding of the data. Sometimes it may be necessary for the user to get more detailed information about how the production processes behind the statistical data were actually carried out.
The documentation templet in figure 3.3 illustrates what kinds of process-oriented metadata that a user of a set of statistical microdata (a so-called observation register) could need, and how these metadata could be organised.
3.1.3 Global metadata and general knowledge
A user looking for statistical data which are possibly relevant for his/her question or problem will need global metadata spanning over many statistical surveys in order to be able to identify and locate the possibly relevant statistical data. Examples of such global metadata are:
• descriptions - more or less formalized - of available statistics and observation registers;
• well-structured and informative tables of contents - as global as possible - specifying available statistics and observation registers and giving references to the more detailed descriptions;
• indexes to the tables of contents
• thesauri for supporting the process of specifying search questions by providing broader terms, narrower terms, and related terms
When analysing statistical data resulting from a retrieval operation, a user will need metadata belonging to the category of general knowledge like handbooks describing different methods of statistical analysis.
3.2 Metadata needed by producers of statistical data
A producer of statistical data needs
• the same metadata as the users (in order to be able to help them)
• detailed information about the production process (in order to remember how to carry out the production steps correctly, and in order to train new staff members)
• feed-back information from the users and input data providers (respondents etc) in order to tune and improve the production processes
• general knowledge and global metadata (in order to design/redesign production processes)
3.2.1 Survey-specific metadata concerning the production process
Figure 3.4 suggests a templet for organising the survey-specific metadata needed by those who are responsible for monitoring, operating, maintaining, and redesigning a survey production system.
16

OBSERVATION REGISTER DOCUMENTATION
Figure 3.3. Documentation templet for an observation register and the survey behind it.
17

DOCUMENTATION TEMPLET FOR A STATISTICAL SURVEY
Figure 3.4. Documentation templet for a statistical survey and its production system.
18

3.2.2 Global metadata and general knowledge
3.2.3 Feed-back information from the users
3.3 Metadata related to software tools
This category includes
• metadata needed by software tools
• metadata about software tools, needed by the users of the tools
Both kinds of metadata needs are directly or indirectly related to user/producer needs.
3.3.1 Factual metadata Semi-structured, ranging from highly formalized metadata concerning representation formats (file descriptions, record layouts, code descriptions etc) to text labels (names etc) and free-text descriptions. Important global metadata of this kind: information about classifications.
3.3.2 Algorithmic metadata
The algorithms as such behind statistical procedures, including procedures for statistical analysis.
Descriptions of the algorithms.
4 Sources of statistical metadata
A good principle for data management in general, and metadata management in particular, is to capture data/metadata as early as possible and only once. Ideally data/metadata should be captured with as little human effort as possible, and as a direct result of events that imply the "birth" of the data/metadata. For example, a decision to design a statistical survey in a certain way may imply the birth of (some of) the metadata describing the definition of a statistical characteristic.
In the previous chapter we identified a large number of metadata items, which are needed to satisfy important metadata needs of users and producers of statistical data. A systematical analysis of when these metadata items could best be captured could start from an analysis of the typical life histories of statistical characteristics, statistical surveys, and statistical information systems. Major phases of these life histories are
• design processes • operation and evaluation processes • maintenance and redesign processes
4.1 Design processes
We have already discussed how designers of statistical surveys and statistical information systems can make use of metadata originating from other surveys and information
19

systems. However, design processes do not only make use of metadata; they also (as a side-effect) give rise to new metadata, which can be most useful for many different purposes, if they are properly taken care of.
A design process produces a number of design decisions, and if these decisions are properly documented - as they should be anyhow - the decision documents (which will typically be computer-stored today) will be excellent sources of statistical metadata.
Schematically, a design process for a statistical survey will consist of a series of design steps, corresponding to the boxes in figure 1.3 earlier in this paper. Each one of these design steps results in a number of design decisions, and these design decisions consist of metadata concerning the planned survey, which have their natural "slots" in the structures of documentation templets such as those proposed in figures 3.2, 3.3, and 3.4 above.
The natural way of taking care of the metadata flow from a design process may be to incrementally update a growing production system documentation of the survey, starting from an empty documentation templet and ending with a more or less completely filled one (cf figure 3.4).
4.2 Operation and evaluation processes
Similarly as the design process for a statistical survey produces a natural flow of metadata that can be used for updating an incrementally growing production system documentation, the operation of the survey (cf figure 1.3 again) can be so organised as to produce a flow of metadata incrementally updating documentations of the observation registers and statistics that are produced by the survey.
For example, an observation register documentation based on the templet in figure 3.3 can be incrementally filled as follows. First, the slots of chapters 0,1, and 2 are filled by copying the corresponding metadata from the production system documentation completed during the design process. Then, chapter 3 is filled, slot by slot, as the different production steps are carried out. Some of the original design decisions may have to be modified already during the first operation of the survey, and then some slots of the already completed parts of the production system documentation will have to be updated.
A survey production system should be designed to give some automatical feed-back to the producers.
4.3 Maintenance and redesign processes
5 Organising flows and holdings of statistical metadata
5.1 Experiences from the past and implications for the future
Many statistical metainformation systems in the past have failed for various reasons:
• Metadata collection is dull, expensive, and time-consuming.
• The natural metadata providers, those who know something about the object data to which the metadata refer, are difficult to motivate. They do not themselves need the
20

metadata. At least they do not need the metadata as a formalised part of a system, since they have the metadata in their own heads.
• The metadata users, on the other hand, will not find a metainformation system to be of much value, until the metadatabase covers data from many surveys. This is so, because users of statistical data are usually interested in several (related) collections of data, which have been collected by different surveys..
• There is an unfortunate disjunction between users and producers of metadata. Those who need the metadata cannot themselves produce the metadata. On the other hand, those who "own" the knowledge about statistical data, do not benefit very much from formalized and automated availability of the metadata.
• In comparison with a well-functioning market, a typical metainformation system from the past has been lacking some important features: (a) relations between the supply side and the demand side have been virtually non-existing; (b) the supply side has had most of the costs but little benefit, whereas the demand side, which has been intended to get the benefits, have not had to pay for them, or, if they have had to pay, the payments may not have been routed back to the metadata suppliers, and have thus failed to have the "self-regulating" effect that such payments usually have in a market.
From the past experiences we can learn some lessons concerning the desirable architecture of future metainformation systems:
• Metadata collection activities should be minimized in the sense that no metadata should have to be entered more than once, and derivable metadata should be automatically derived rather than manually entered.
• Huge retrospective metadata collection activities should be avoided. Instead as much as possible of the metadata input flow should be generated as a side-effect of other activities. For example, the more or less formalized descriptions that are typically generated by systems analysis and design activities should be automatically captured and organised as potential metadata for the information system under development;
• Some type of cost/benefit mechanism needs to be introduced into the architecture of a metainformation system in order to relate users and producers of metadata in a constructive way. The mechanism needs to be relatively sophisticated, since there is a many-to-many relation between users and producers of metadata: the same metadata may be used by many different users, and the same user may need metadata concerning many several data collections from several producers.
Statistical information systems are valuable assets. However, without properly integrated metainformation systems, the value of the information systems is drastically reduced. Since today's statistical information systems are by and large formalized and computerized, the metainformation systems must also be formalized and automated, if the pace of the metadata flow is to keep up with the pace of the object data flow.
There may be exceptional cases, where a single survey (or a small set of closely related surveys) has a statical and well-known set of users, who essentially need data from this survey (or set of surveys) alone, and who can rely on person-to-person contacts with the survey staff, together with oral traditions between themselves, for satisfying their needs of metadata. However, most survey data will be used by many different users, and most users of statistical data need to interpret and combine data from different sources.
21

5.2 Metadata holdings
The statistical metadata managed by a statistical service need to be stored in metadata holdings, organised into one or more statistical metadatabases. A statistical metadatabase may be active (integrated with a statistical database) or passive (separate from a statistical database). It may contain local metadata concerning individual surveys and/or global metadata concerning a wide range of surveys and data collections. It may be physically stored and maintained locally or centrally in the organisation.
As we have seen earlier in this paper, there is a need to store a lot of different kinds of metadata in a statistical metainformation system. The metadata can be categorized in several different dimensions, for example:
• by metaobject type; • by being microdata-oriented or macrodata-oriented; • by data type (quantitative, qualitative, textual); • by type of formalism (fixed-format facts, logical expressions, mathematical
expressions, algorithms, graphs, free text); • by being data-oriented or process-oriented; • by being procedural or declarative; • by representing specific facts or general knowledge.
Since the metadata will be in many different forms, relatively advanced database management software will be needed for handling metadata holdings properly.
In many respects a statistical metadatabase can be designed in the same way as any other kind of database. For example, it is advisable to use a so-called object graph (or EntityRelationship graph) for modelling the contents of a statistical metadatabase. Figure 5.1 shows an example of such a metaobject graph, containing metaobjects, metavariables, etc. The metaobject types should be interpreted as follows:
BOX a structured set of statistical characteristics (cf section 1.2), a socalled box; POP population of objects (statistical units); SAM sample of objects from a population; XCL crossclassification of the population into (sub)domains of interest; PAR parameter, statistical characteristic; VAR variable; VAS value set of one or more variables; VAL value in value set; SUR survey;
In figure 5.1 most (meta)object types occur in three versions: an occurrence version (occ), a series version (ser), and a type version (typ); corresponding to three layers of the conceptual model: an occurrence layer, a series layer, and a type layer. The division into three layers has the following background.
A typical production pattern is that "the same" survey is repeated at regular time intervals, for example monthly, quarterly, or yearly. In such cases it is appropriate to speak about a survey series. Surveys producing indexes and other indicators (like unemployment rates) are typical examples of such time series of "similar" surveys.
The individual survey repetitions within a survey series are never identical. Some component or aspect of the survey design is often changed, if only marginally. For example, a new data item may be added, another one may be redefined, etc. Even if the survey design should be the same between survey repetitions, the conditions under which
22

TYPE LAYER
Figure 5.1. A metaobject graph modelling the contents of a statistical metadatabase.
23

the survey is carried out will change, which will result in changes in response rates and other aspects of the quality of the survey data.
Thus the metadata for different survey repetitions within a survey series will be different to a certain extent. Both the metadata generated by survey design decisions and the metadata generated by the survey process itself will change over time.
In principle, every metadata item may change from one survey repetition to the next one. On the other hand, many relevant metadata items will not change between survey repetitions. A failure to recognize properly both the similarities and the dissimilarities between different survey repetitions will negatively affect the comparability in time, an extremely important quality component for many users of statistics.
A similar problem concerns comparability in space, where "space" is a generic concept, covering not only geographical subdivisions, but also many other forms of classifications, where it is meaningful to recognize some kind of proximity and/or (fuzzy) similarity between different instances (occurrences) of one and the same type. For example, populations and variables with "similar" definitions may be good substitutes for each other with respect to certain needs.
The three-layer model in fiugre 5.1 is one way of taking care of the user needs for comparability in time and space. The type layer should contain metadata, which are "usually" the same, or at least "similar" for different members of the same type. The type level metadata have the character of "general rules" or "typical descriptions"; exceptions to the rules can be given for subtypes and/or occurrences of the types.
Analogously, the series layer should contain metadata, which are "more or less" the same for different repetitions within a time series. Once again exceptions to the typical descriptions can be given on the occurrence level.
The occurrence layer should primarily contain metadata, which are known to be different between different occurrences within the same series, or the same type, respectively. High variability in this sense is typical for most operation-based metavariables, like "measurement problems" and "non-response rate". Design-based metavariables will not change their values between repetitions of "the same" survey to the same extent.
To summarize, many metavariables will have to be recorded on the occurrence level. However, if a metavariable is known to be relatively stable over time, it could be recorded on the series level, provided that there is an option to record occurrence level exceptions from the series level rule. The exceptions could result in footnotes in appropriate places, when the data are presented.
For example, if the measurement procedure for a variable is usually the same from survey repetition to survey repetition, the information about the measurement procedure could be given for the "VAR series" metaobject. If something unusal should occur with the measurement procedure during some particular repetition of the survey, this could be noted as an exception from the general rule, and the exceptional information would be recorded for the appropriate "VAR occurrence" metaobject.
If a metavariable is less stable, but still does not vary too much over time, it may be better to make the primary recordings on the occurrence level, but complement this information with some "overview information", which is given on such a level of abstraction that it becomes stable over time.
24

For example, if response rates vary rather modestly over time, one could give information about the "normal" response rate span on the series level and give an "alarm signal" on the occurrence level, whenever the response rate falls outside the "normal span".
One could apply similar principles for determining the distribution of metadata between the type layer and the series layer of the metadatabase. "Normal" values of metavariables could be given on the type level, and exceptions from what is regarded as "normal" could be signalled on the series and occurrence levels.
5.3 Metadata flows
Every statistical service function, which somehow manages data, should also manage the metadata, which is associated with the data.
In fact automation and computerization of survey management has up to recently implied disintegration of the natural relationships between statistical data and metadata, which existed in earlier manual systems. For example, consider a questionnaire. When it has been completed, it contains both data (answers to questions) and the associated metadata (the questions themselves and accompanying instructions for answering the questions). As long as the forms were processed manually, the data and metadata continued to go "hand in hand" throughout all the processing steps, until the final tables had been produced. Automation primarily aimed at rationalizing the counting process, a process which deals with the object data only. Thus the object data became separated from the metadata. When a programmer, in a later production step, was to compose readable tables, he or she would have to (re)introduce metadata, explaining the meaning of the data in the tables, but at that stage the original metadata (questions, instructions, etc) might very well have been lost track of. Thus the metadata in the presented tables would not normally be the result of systematical, formalized transformations of the metadata in the questionnaires.
An essential feature of modern metadata management is that it is reintegrated with object data management, so that for example the metadata describing the figures in presented tables would in fact be the result of a chain of systematical, formally well-defined, and automated transformation processes, starting with the metadata in the questionnaire, or maybe even earlier, with the metadata generated by design decisions preceding the (computer-aided) construction of the questionnaire.
During all activities of all phases of the life-cycle of a statistical system, the different actors produce decisions, documents, etc, which contain metadata. If the metadata are properly captured and organized, they may become very useful, when the same statistical information system, or other ones, require metadata input.
It should be a challenge for every statistical service to organize its metadata flows in such a way that
• as many metadata as possible can be obtained from existing metadata holdings, whenever they are needed by a certain actor in a certain statistical system;
• as few metadata as possible have to be produced for its own sake, rather than as a side-effect of other (necessary) activities of the statistical systems monitored by the statistical office.
Sharing of metadata (as well as sharing of object data) within and between systems is essential for any statistical service aiming at rational, computer-supported planning and
25

operation of its statistics production. Systematical, automated exchange of metadata between different activities promotes two good causes at the same time:
• it decreases the burden on metadata providers; • it increases the benefits gained from metadata, which are already available.
International standards (like GESMES) for the storage and exchange of statistical data and metadata should significantly facilitate the efforts of statistical services to systematize and automate exchange of data and metadata, both internally and externally.
5.4 Interdependencies between metadata flows
There are important interdependencies in the metadata flows between
• local and global metadata holdings • different statistical information systems • different phases of the life cycle of each statistical information system..
For example, many metadata are naturally generated and captured as the result of design processes and design decisions, and many of these metadata (for example names, definitions, and storage formats of different statistical characteristics and their components) are later needed (at operation time) by producers and users of statistical data, as well as by software products supporting the tasks of users and producers.
Figure 5.2 shows an important feed-back loop from the local metadatabases of a number of (different types of) statistical information systems to a common global metadatabase. The local databases contain detailed knowledge concerning specific systems and then-data (observation registers and statistics). The local metadata have to be processed (as automatically as possible) in order to create extracts and summaries, which can be managed in the global metadatabase, from which metadata can be retrieved by local as well as global and external systems. In order to make the retrieval of global metadata as efficient and user-friendly as possible, the extracts and summaries have to be further processed (once again as automatically as possible) in order to create and maintain reference data like tables of contents and indexes.
The generation of extracts, summaries, and reference data is one part of the knowledge acquisition process for the global metadatabase. Another part is the acquisition of general knowledge: handbooks, encyclopedia, thesauri, standards, software, etc. The acquisition of general knowledge can be performed rather independently of the feed-back loop just described. However, there is a potential for creating an "intelligent" inductive learning loop from the local and global specific knowledge to the global general knowledge. At the present state of the art this inductive learning loop will be highly dependent on human efforts, but artificial intelligence may contribute increasingly in the future.
Figure 5.3 focuses on the metadata flows for one statistical information system only, a survey production system. However, for this single system, figure 5.3 gives a more precise description of the metadata flows for each one of three major phases of the life cycle of the system: design, operation, and evaluation.
26

Figure 5.2. Metadata flows for a system of different kinds of statistical information systems.
27

Figure 5.3. Metadata flows for the three major phases of the life cycle of a survey production system.
28
References
Appel, G. (1993) Metadata Driven Statistical Information Systems Proceedings of the Statistical Metainformation Systems Workshop in Luxemburg, February 1993.
Fröschl, K. A. (1993) Towards an Operative View of Semantic Metadata Proceedings of the Statistical Metainformation Systems Workshop in Luxemburg, February 1993.
Klas, A. (1985) "The Metainformation System: Its Structure and Role in the Statistical Information System" Journal of Official Statistics Vol. 1 No. 4, pp 413-426.
Lamb, J. (1993) Metadata in Survey Processing Proceedings of the Statistical Metainformation Systems Workshop in Luxemburg, February 1993.
Langefors B. (1966) "TheoreticalAnalysis ofinformation Systems" Studentlitteratur, Lund.
Malmborg, E. and Lisagor, L. (1993) Implementing a Statistical Meta-Information System Proceedings of the Statistical Metainformation Systems Workshop in Luxemburg, February 1993. Also in Statistical Journal of the United Nations UN/ECE 2/1993. Also available from Statistics Sweden.
Malmborg, E. and Sundgren, B. (1994) Integration of statistical information systems - theory and practice Proceedings of the Seventh International Conference on Scientific and Statistical Database Management, University of Virginia, USA, September 1994, IEEE Computer Society Press
Nordbotten, S. (1993) Statistical Meta-Knowledge and -Data Invited opening lecture for the Statistical Metainformation Systems Workshop in Luxemburg, February 1993.
Rosén, B. & Sundgren, B. (1991) "Documentation for reuse ofmicrodatafrom the surveys carried out by Statistics Sweden" Statistics Sweden. Original report in Swedish. English translation available.
Silver, M. S. (1993) The Role of Footnotes in a Statistical Meta-Information System Proceedings of the Statistical Metainformation Systems Workshop in Luxemburg, February 1993.
Statistical Computing Project (1984) "Users Guide to Metainformation Systems in Statistical Offices" United Nations, Economic Commission for Europe, Conference of European Statisticians.
Sundgren B. (1973) "An Infological Approach to Data Bases" Statistics Sweden.
Sundgren, B. (1980) "Meta-Information in Statistical Agencies" Statistics Sweden.
Sundgren B. (1984) "Conceptual Design of Data Bases and Information Systems" Statistics Sweden.
Sundgren, B. (1989) "Conceptual Modelling as an Instrument for Formal Specification of Statistical Information Systems" ISI 47 th Session, Paris.
Sundgren, B. (1991a) "What metainformation should accompany statistical macro-data?" Report for the June 1991 Meeting of Working Party 9 of the OECD Industrial
29

Committee as a basis for a discussion on the topic of Standards for Metadata in International Databases. Also available from Statistics Sweden.
Sundgren, B. (1991b) "Statistical Metainformation and Metainformation Systems" Report for the UN/ECE METIS Group, established within the programme of work of the Conference of European Statisticians. Also available from Statistics Sweden.
Sundgren, B. (1991c) "Towards a Unified Data and Metadata System at the Australian Bureau of Statistics" Consultancy report for the Australian Bureau of Statistics (ABS). By permission of the ABS, the report is also available from the author.
Sundgren, B. (1991d) "Some Properties of Statistical Information: Pragmatics, Semantics, and Syntactics" Statistics Sweden 1991.
Sundgren, B. (1992a) "Organizing the Metainformation Systems of a Statistical Office" Report for the UN/ECE METIS Group, established within the programme of work of the Conference of European Statisticians. Also available from Statistics Sweden.
Sundgren, B. (1992b) "Statistical Metainformation Systems - Pragmatics, Semantics, and Syntactics" Invited paper for the Statistical Metainformation Systems Workshop in Luxemburg, February 1993. Also available from Statistics Sweden.
Sundgren, B. (1993) Guidelines on the Design and Implementation of Statistical Metainformation Systems Report for the UN/ECE METIS Group, established within the programme of work of the Conference of European Statisticians. Also available from Statistics Sweden.
Sundgren, B. (1994a) Statistical information systems in a modern society: roles, functions, and system designs Invited paper for the Baltic Workshop on National Infrastructure Databases, Vilnius, Lithuania, May 1994. Also available from Statistics Sweden.
Sundgren, B. (1994b) Statistics production in the 1990's Invited paper for Eurostat's High-Level Seminar on "Strategy for Statistical Computing" in Luxemburg, July 1994. Also available from Statistics Sweden.
UN Western European EDIFACT Borard, Message Development Group 6 Statistics (1993) GESMES 93 For the exchange of multidimensional statistical arrays and time-series data: "Guidance to users" and "Reference Guide" Published by Eurostat, Luxemburg
30