Embed Size (px)
Citation preview

QUT Digital Repository: http://eprints.qut.edu.au/
Ren, Cizao and Williams, Gail M. and Mengersen, Kerrie L. and Morawska, Lidia and Tong, Shilu (2008) Does temperature modify short-term effects of ozone on total mortality in 60 large eastern US communities? — An assessment using the NMMAPS data. Environment International 34(4):pp. 451-458.
© Copyright 2008 Elsevier
1
Does Temperature Modify Short-Term Effects of Ozone
on Total Mortality in 60 large Eastern US Communities? --
An Assessment using the NMMAPS data
Cizao Ren 1, Gail M Williams 2, Kerrie Mengersen 3, Lidia Morawska 4, Shilu Tong 1
1 School of Public Health, Queensland University of Technology, Australia 2 School of Population Health, University of Queensland, Australia 3 School of Mathematical and Physical Sciences, University of Queensland University of Technology, Australia
4 School of Chemical and Physical Sciences, Queensland University of Technology, Brisbane, Australia
Word count: Text 3713; Abstract 211; 2 Figures, 37 References
Key words: Air pollution, Bayesian meta-analysis, Bivariate, Interaction, Mortality,
Temperature

2
Abstract
Many studies have indicated that ozone is associated with morbidity and mortality. A few
studies have reported that the association is heterogeneous across seasons and geographic
regions. However, little information is available on whether both temperature and geographic
factors simultaneously modify the ozone effect. This study used a Poisson regression model to
explore whether temperature modifies the effect of ozone on mortality in the 60 large eastern
US communities during April to October, 1987-2000. Results show that temperature modified
ozone-mortality associations and that such modification varied across geographic regions. In
the northeast region, a 10-ppb increment in ozone was associated with an increase of 2.22%
(95% posterior interval [PI]: 1.19%, 3.13%), 3.06% (95% PI: 2.21%, 3.76%) and 6.22% (95%
PI: 4.77%, 7.56%) in mortality at low, moderate and high temperature level, respectively,
while in the southeast region a 10-ppb increment in ozone was associated with an increase of
1.13% (95% PI: -1.12%, 3.18%), 1.50% (95% PI: 0.22%, 2.81%) and 1.29% (95% PI: -0.33%,
2.96%) in mortality, respectively. We concluded that temperature positively modified the
ozone-mortality association in the northeast region, but such a pattern was not apparent in the
southeast region. Thus, both temperature and geographic factors should be considered in the
assessment of ozone effects.
3
Introduction
A large number of community-based time series studies have indicated that high
concentrations of ambient air pollutants are associated with increased cardiovascular and
respiratory mortality (Daniels et al., 2000; Pope et al., 2002; Samet et al., 2000a). Ozone is
one of the most toxic photochemical pollutants. Several recent large multi-community studies
and meta-analyses have shown that ambient ozone is consistently associated with
cardiorespiratory or all-cause mortality (Bell et al., 2004, 2005; Ito et al., 2005; Levy et al.,
2005; Schwartz, 2005).
An assessment of effect modification is an important methodological issue in air pollution
research and has important implications in understanding etiological mechanisms of air
pollution and in planning public health interventions. A small number of studies have found
that demographic characteristics, pre-existing health conditions and season possibly modify
air pollution effects (Katsouyanni et al., 2001; Bateson and Schwartz, 2004; Jerrett et al.,
2004). Patterns of air pollution are generally driven by weather, and concentrations of air
pollutants are largely affected by climate conditions. Several studies have investigated
interactive effects between air pollution and temperature on health outcomes (Katsouyanni et
al., 1997; Ren and Tong, 2006; Ren et al., 2006; Roberts, 2004; Samet et al., 1998) but
produced conflicting results.
Ozone is a photochemical air pollutant, and the generation of ozone is influenced by weather
conditions such as sunlight and temperature. Other pollutants such as nitrogen oxide can also
influence the concentration of ozone (Samet et al., 1998). Many studies have reported

4
seasonal differences in the observed health effects of ozone, ie, stronger effects in summer
than in winter (Ito et al., 2005; Levy et al., 2005; Moolgavkar, 2003). Such differences are
usually considered to be due to temperature-related variation in the concentration of ozone.
However, this also implies that temperature potentially modifies the ozone effect. Therefore,
examination of the interactive effect between temperature and ozone on human health is
necessary.
The present study investigated whether temperature modified the ozone effects on total non-
external cause mortality, and whether the effect modification was heterogenous across the
different US regions, April to October, 1987-2000, using the data from the National
Morbidity, Mortality, and Air Pollution Study (NMMAPS) (iHAPPS, 2007; Samet et al.,
2000b).

5
Materials and Methods
Study Area
The NMMAPS data include information on air pollution, health outcomes and weather
conditions for over one hundred large urbanized areas of the US, divided into seven
geographic areas, i.e., Northeast, Industrial Midwest, Upper Midwest, Northwest, Southeast,
Southwest and Southern California (iHAPPS, 2007; Samet et al., 2000b). It has been shown
that temperature-mortality patterns in the northeast USA are different from the southeast
(Curiero et al., 2002), possibly related to climatic difference. Therefore, we restricted this
study to the eastern areas of the United States (Northeast, Industrial Midwest and Southeast in
the NMMAPS data). To examine whether ozone-mortality effects differed with geographic
area, we first divided these areas into two regions: northeast or southeast. We merged the
Northeast and Industrial Midwest areas in the NMMAPS, into the northeast region. The
southeast region corresponded to the Southeast in the NMMAPS database (Samet et al.,
2000b). Because approximately one-third of these communities, mainly in the northeast
United States, measured ozone values only during the peak ozone season, April to October,
and because previous studies have shown that the ozone effect is highest in summer (Huang et
al, 2005), we used data between April 1st and October 31, 1987-2000.
This study included a total of 60 communities based on the sufficiency of the available
data: 34 communities in the northeast region and 26 in the southeast. The 60
communities had 59 million of population, 36.1 million in the northeast and 22.9 million
in the southeast. The study areas cover 48,116 and 62,032 square kilometres in the
northeast and southeast, respectively. In the southeast region, temperature and relative

6
humidity were higher and seasonal variations were weaker compared with those in the
northeast. Seasonal means of temperature in spring (March to May), summer (June to
August), autumn (September to November) and winter (December to February) were
19.48, 27.19, 19.44 and 10.97 ºC in the southeast region, 11.22, 23.66, 12.74 and 0.33 ºC
in the northeast, respectively. Seasonal means of dew point temperature for spring,
summer, autumn and winter were 53.45, 70.01, 56.18 and 40.87 ºC in the southeast
region, 38.48, 61.79, 44.16 and 23.26 in the northeast region, respectively. The
distribution of air pollution monitors has been described by other previous researchers
(Bell et al, 2004; Samet et al, 2000b).
Data Collection
A full description of the construction of the NMMAPS database can be found elsewhere. 18
The most recent NMMAPS data are publicly available at the website of the Internet-based
Health and Air Pollution Surveillance System (iHAPSS, 2007). All data used were extracted
from this site, and includes health outcomes, weather conditions and air pollution. The data
structure used in our study was as follows:
This analysis included daily counts of cause-specific mortality from 1987 to 2000 for each of
sixty selected urbanized areas at the county level (either a single county or multiple adjacent
counties representing the metropolitan areas). All cases were classified according to the
International Classification of Diseases version 9 (ICD-9) or version 10 (ICD-10). Data on
total deaths of non-external causes excluded deaths of non-residents or deaths from injuries
and other external causes (ICD-9 codes 800 and above and ICD-10 codes S and above). ICD-
7
9 and ICD-10 were used for the disease classification between 1987 and 1998 and between
1999 and 2000, respectively. Mortality data, aggregated at the city level, were divided into
three age categories <65, ≥ 65 and <75, and ≥ 75 years. Data for weather conditions included
daily maximum temperature and dew point temperature. Air pollution time series data
included daily average ozone concentrations across different communities. To avoid a
disproportional impact of outliers on analytic outcomes, a 10% trimmed mean was used to
average across monitors in the NMMAPS database (Bell et al., 2004). We used the 10%
trimmed mean of ozone for each community. All analyses were restricted to days with
complete data.
Analytical Protocol
Several methods used to examine interaction between temperature and air pollution have been
described in other papers (Ren and Tong, 2006; Ren et al., 2006; Roberts, 2004). In this study,
we first used a Poisson generalized additive model (GAM) to fit a bivariate response surface
in order to examine patterns of interaction of both ozone and temperature on mortality in each
community (Chambers and Hastie, 1993; Hastie and Tibshirani, 1990; Ren and Tong, 2006;
Ren et al., 2006; Roberts, 2004). GAM is a flexible approach to exploring the relationships
between the dependent and predictors with smoothing functions without a rigid linear
assumption between the dependent variable and predictors. It can also involve a
biviariate term with smoothing functions to explore the joint effects of two continuous
predictors on the dependent. GAM has been widely employed in air pollution time-series
studies due to its powerful adjusting for potential nonlinear confounders such as
seasonality and temperature. We then used a Poisson generalized linear model (GLM) to
8
examine whether the ozone-mortality associations were heterogeneous across temperature
levels (McCullagh and Nelder, 1989). Data analyses were conducted with S-Plus software
version 6 (Chambers and Hastie, 1993; Insightful Cooporation, 2001). A stricter convergence
criterion (i.e. 1.0×10⁻¹⁰) was adopted in the GAM analyses for both the local score algorithm
and the backfitting algorithm, as the default criteria in the software may bias the effect
estimates (Dominici et al., 2002a).
A bivariate response surface model is a flexible approach to examining the interactive effect
of maximum temperature and ozone on total deaths in individual communities (Chambers and
Hastie, 1993; Greenland, 1993; Hastie and Tibshirani, 1990). This model can capture the
patterns of both ozone and temperature on mortality without a rigid linear assumption
(Chambers and Hastie, 1993; Hastie and Tibshirani, 1990). We included similar covariates in
this study as used in NMMAPS study (Bell et al, 2004). Maximum temperature was used as
the indicator of temperature in this study due to both data availability and the likelihood of its
interaction with ozone. We used days of the year to adjust for seasonality, years to adjust for
long-term variations and the day of the week to control for short-term fluctuations. We also
adjusted for dew point temperature, an indicator of humidity. As particulate matter (PM10)
was measured only every six days for most communities, the proportion of missing data for
PM10 was high. Some studies have shown that PM10 does not confound ozone effect
estimates using the NMMAPS data (Bell et al., 2004; Huang et al., 2005; Samet et el., 2000a;
Schwartz, 2005) and therefore, we did not adjust for PM10 in this study. Because mortality
was extremely low, the daily number of death counts is assumed to have an
overdispersed Poisson distribution. A Poisson data is often analysed as Gaussian data
after a logarithm transformation (Dominici et al., 2004). The model is described as follows
(Ren and Tong, 2006; Ren et al., 2006; Roberts, 2004):

9
)25.0,,())|(( =+= spantempozoneloXYELog ttt α + Ageλ )7,( =+ dfseasonns t tDowγ+
)4,( =+ dfyearns t )4,( =+ dfdptempns t tε+ (1)
where the subscript t denotes the time of the observation; )|( XYE t denotes daily expected
deaths at time t; )(⋅ns and )(⋅lo separately mean natural cubic smoothing and LOESS
smoothing splines.α is the intercept term; we used three-day moving averages of ozone and
maximum temperature in this study (concurrent day, lags of 1 and 2 days) to avoid potential
bias caused by selectively reporting the most significant lags. Age refers to age category
(<65, ≥ 65 and <75, and ≥ 75 years) and λ is a vector of the coefficients; tozone and
ttemp refer to three-day moving average of ozone and maximum temperature at time t,
respectively; tseason means seasonality using days of calendar time of the year at time t.
From the literature (Daniels et al., 2000; Dominici et al., 2002b), we used 4 dfs for tseason
when fitting the model because the dataset used included seven consequent months (April to
October). tDow is the day of week at time t, and γ is a vector of coefficients; tdptemp refers
to the three-day moving average of dew point temperature at time t; tε is the residual.
An alternative approach to examining the interactive effect between temperature and ozone on
deaths is a stratification model, which stratifies the ozone effect by temperature. This
approach allows us to examine the heterogeneity of the ozone effect across temperature strata.
We used the first and third quartiles of temperature within each community as a cut-offs,
designated low, moderate and high temperature levels, for each community. We used a
Poisson GLM to fit this model because preliminary analysis showed that convergence could

10
not be obtained in some communities when we used the gam.exact function to conduct
parametric estimates even using a large number of the iterations (Ren and Tong, 2006; Ren et
al., 2006). Maximum likelihood estimates of GLM were computed using an iteratively re-
weighted least squares (IRLS) procedure and therefore avoided the above problems in GAM
(Hastie and Tibshirani, 1990). We modified Equation 1 as follows:
ktktttt temptempozoneozoneYELog 321 ):())(( βββα +++= + Ageλ )7,( =+ dfseasonns t
tDowγ+ )4,( =+ dfyears t )4,( =+ dfdptemps t tε+ (2)
where kttemp denotes levels of the moving average of temperature at time t . 1β signifies the
main effect of ozone. 2β is a vector for coefficients of the interactive term between ozone and
temperature levels, and 3β is a vector for coefficients of temperature levels. Other terms are
the same as Equation 1.
Meta-analysis
A two-stage hierarchical model was used to estimate the overall relative rate of total mortality
associated with short-term ozone exposure across temperature levels and the regions. In stage
one, we obtained estimates cβ̂ and variance ( cβ̂ ) for each community c in the above
stratification model. In stage two, we divided these estimates into two groups (northeast and
southeast regions) and three temperature levels (low, moderate and high). Within each group
and level we assumed that cβ̂ was normally distributed with mean effect cβ and variance c2σ
estimated by variance ( cβ̂ ). In turn, the true cβ was assumed to be normally distributed with

11
overall mean μ and variance 2τ . We used Bayesian meta-analysis to estimate the posterior
distribution of each pooled effect μ by taking into account the within-community variance
( c2σ ) and the between-community variance 2τ (Dominici et al., 2000). In addition, for each
region, we calculated the community-specific differences for high and low temperature levels
and corresponding overall differences inμ for these levels. We used non-informative priors,
that is μ ~N (0, 0.0001) andτ ~Unif (0,100). We used the software WinBUGS to conduct the
Bayesian meta-analysis (Gelman et al., 2004; Spiegelhaltter, et al., 2000). We then combined
estimates of the means μ for the northern and southern regions at low, moderate and high
temperature levels using a fixed-effect method.

12
Results
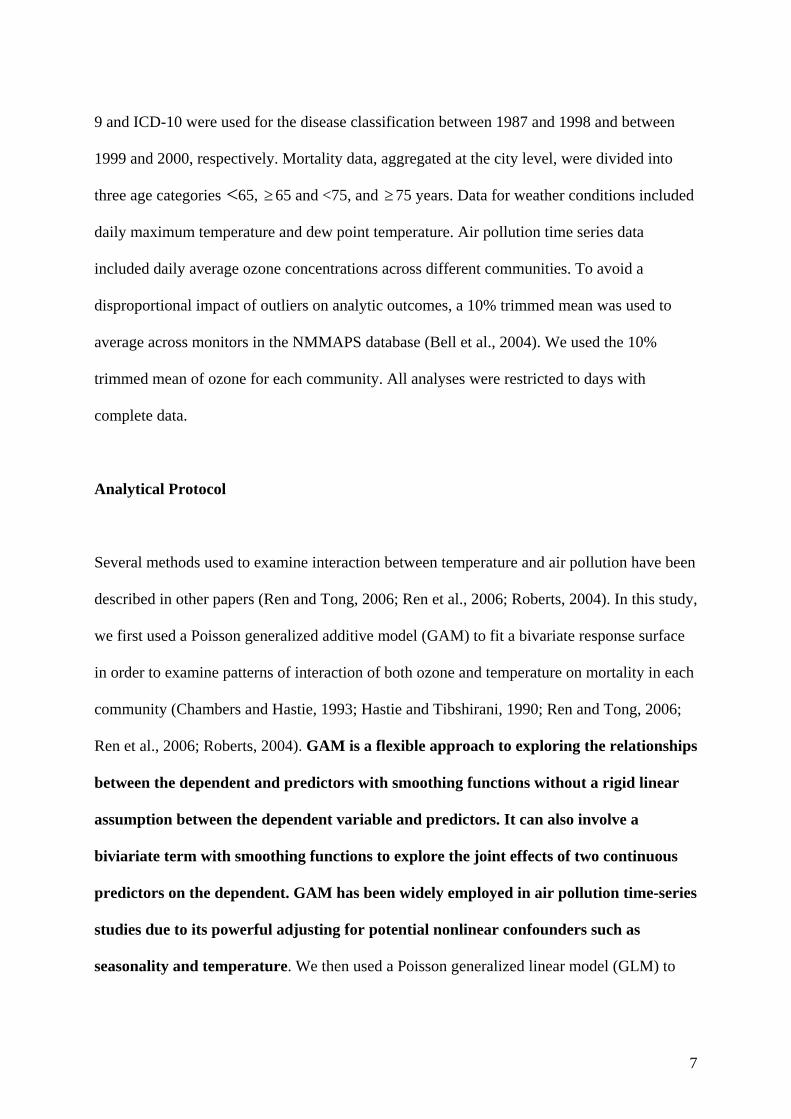
To visually examine potential interactive effects between ozone and temperature on mortality,
we fitted bivariate models (Model 1) using three-day averages of ozone and temperature for
individual communities. The bivariate response surfaces show that while both ozone and
temperature were associated with mortality, the joint impacts of temperature and ozone on
mortality varied considerably across communities and regions. In most of the 34 northeast
communities, temperature positively modified the ozone-mortality associations but negative
modification by temperature was observed in a few communities such as Arlington and
Louisville. In the 26 southeast communities, there was greater variation in the patterns of
modifications. For example, significant and positive modification occurred in New Orleans,
Shreveport and Tampa, but significant and negative modification appeared in Jacksonville
and Miami. Figure 1 presents the bivariate response surfaces for the 8 largest communities in
the northeast region and the 8 largest communities in the southeast region. It illustrates that
temperature positively modified ozone effects in Chicago, Cleveland, Columbus (OH),
Detroit, New York, Philadelphia and Pittsburgh in the northeast region, but no effect
modification occurred in those communities in the southeast region. In contrast, negative
modifications appeared in some southeast communities, such as Atlanta, Houston, Miami and
Dallas/Fort Worth.
[Figure 1 about here]
To quantify the heterogeneity of the ozone effects at different temperature levels in specific
communities, we separately fitted the stratification model for each community. Results for the
northeast region show that temperature significantly and positively modified ozone-mortality

13
associations in Akron, Baltimore, Boston, Chicago, Cincinnati, Detroit, New York, Newark,
Philadelphia, Providence, Rochester and Worcester but had a negative modification in
Arlington. In the southeast region, temperature significantly modified the association,
negatively in Jacksonville and Miami, but positively in New Orleans, Shreveport and Tampa.
No significant modification was observed in other communities.
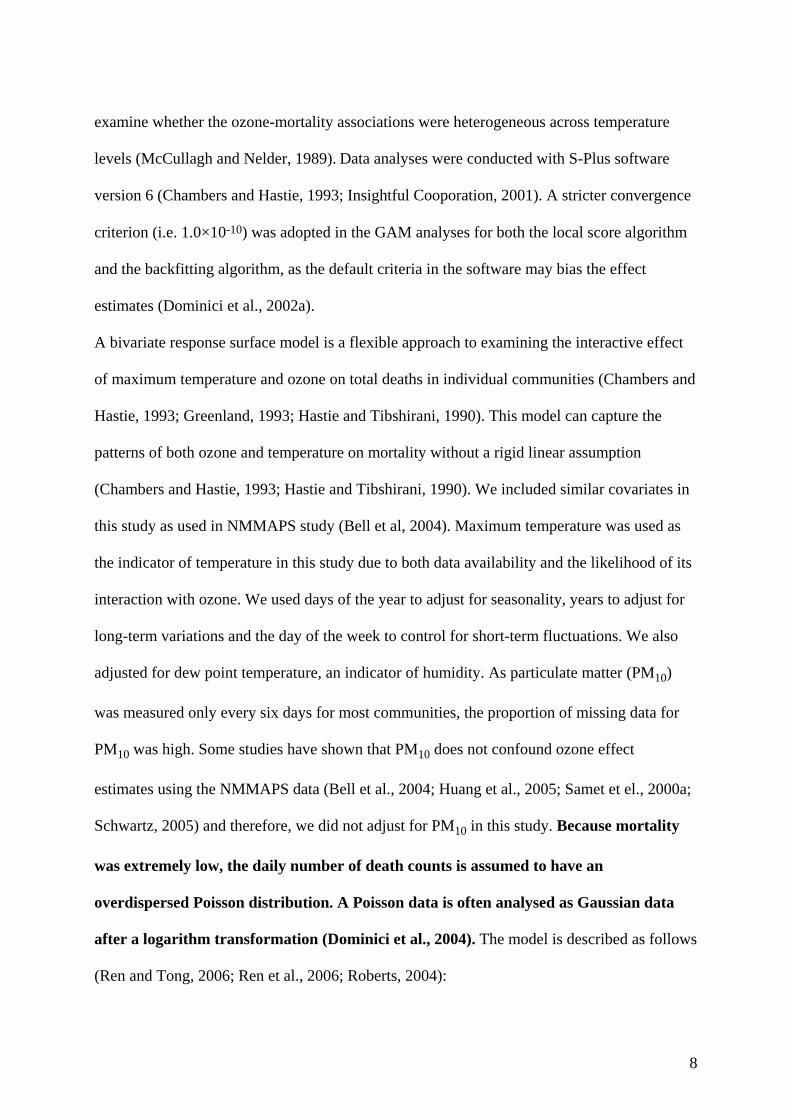
Bayesian meta-analysis shows that ozone effects varied with temperature and geographic
region (Figure 2). Ozone effects were higher at higher levels of temperature than at a low
level of temperature in the northeast region, but changed little across temperature levels in the
southeast region. In the northeast region, a 10-ppb increase in ozone (three day average) was
associated with an increment of 2.22% (95% posterior interval [PI]: 1.19%, 3.13%), 3.06%
(95% PI: 2.21%, 3.76%) and 6.22% (95% PI: 4.77%, 7.56%) in total mortality for low,
moderate and high levels of temperature, respectively; while in the southeast region, it was
associated with an increase of 1.13% (95% PI: -1.12%, 3.18%), 1.50% (95% PI: 0.22%,
2.81%) and 1.29% (95% PI: -0.33%, 2.96%) in mortality, respectively. Overall, a 10-ppb
increment in ozone was associated with an increase of 1.74% (95% PI: 0.80%, 2.61%),
2.58% (95% PI: 1.87%, 3.24%) and 4.26% (95% PI: 2.99%, 5.47%) in mortality for low,
moderate and high level of temperature, respectively.
[Figure 2 about here]

14
Discussion
In this multi-site time-series study, we used bivariate and stratification models separately to
estimate the interactive effects between maximum temperature and ozone on total non-
external mortality in the 60 eastern US communities between April and October, 1987-2000.
The 60 communities covered a population of nearly 59 million with nearly 6.6 million non-
external deaths during the study period. The results provide evidence that temperature
modified the ozone-mortality association and that modification varied across geographic
regions. In the northeast region, the magnitude of ozone-mortality associations generally
increased as temperature rose, but this pattern was not obvious in the southeast region.
A bivariate model is a flexible approach to examining interactive effects between both
continuous predictors on the dependent variable without a rigid linear assumption (Chambers
and Hastie, 1993; Greenland, 1993; Hastie and Tibshirani, 1990). This approach has been
used in several air pollution studies (Ren et al. 2006; Roberts, 2004). The disadvantage of this
model is that it is sometimes difficult to judge whether effect modification occurs because
parametric estimates are not provided. In contrast, the stratification model can provide
quantitative estimates, but presents a challenge in the selection of cut-offs as different cut-offs
may result in different estimates.
Several large multi-site studies have been conducted to estimate ozone effects on
cardiovascular or all-cause mortality (Bell et al., 2004; Huang et al., 2005; Schwartz, 2005),
and all these studies showed that ozone effects varied across geographic locations. For
example, two recent multi-site studies which assessed the ozone effect using the NMMAPS
15
database found that ozone was associated with both cardiovascular and non-external cause
mortality (Bell et al., 2004; Huang et al., 2005).Bell et al. (2004) estimated the relationship
between ozone and mortality in ninety-five US urbanized communities and found increments
of 0.52% (95% PI: 0.27%, 0.77%) and 0.64% (95% PI: 0.31%, 0.98%) in all cause mortality
and cardiorespiratory mortality, respectively, for a 10-ppb increase in ozone in the previous
week. Huang et al. (2005) estimated the ozone effect on cardiorespiratory mortality in the 19
large US cities during the summer (June to September) and found that a 10-ppb increase in
summer ozone level over the previous week was associated with a 1.25% increment in
cardiorespiratory mortality (95% PI: 0.47%, 2.03%). However, these studies did not consider
temperature as a modifier although they adjusted for temperature as a confounder.
A few studies have separately examined seasonal or geographic heterogeneities of ozone
effects, but did not explore these factors as modifiers simultaneously (Bell et al., 2005;
Gryparis et al., 2004; Ito et al., 2005; Levy et al. 2005). For example, Gryparis et al. (2004)
examined seasonal variation in the ozone effect on mortality in European cities and found that
the ozone effect in summer was higher than that for the whole year or in winter. They also
found that the ozone effect was higher in the southern European region (0.80% increase of
cardiovascular deaths per 10 µg/m³ increment of ozone) than in northwest (0.54%) and central
eastern regions (0.19%), but they did not investigate whether seasonal heterogeneity existed
across geographic regions. Two meta-analyses also showed that season was a modifier for the
ozone effects (Ito et al., 2005; Levy et al., 2005). Levy et al. (2005) found that the ozone
effect was higher in summer than in winter. Ito et al. (2005) found that the ozone effect was
negatively correlated with mean temperature. Our study found that temperature not only
modified ozone effects, but also the effect modification was heterogeneous across geographic

16
regions, viz. temperature positively modified the ozone effect in the northeast US region, but
not obviously in the southeast region.
Several previous studies have examined whether temperature modified effects of air
pollutants. Some studies found an interaction between weather conditions and ambient air
pollutants (Katsouyanni et al., 1997; Ren and Tong, 2006; Ren et al., 2006; Roberts, 2004),
but others did not (Samet et al., 1998). For example, Katsouyanni et al. (1997) examined the
interaction between air pollution and high temperature during the 1987 Athens heatwave and
found an interaction between high levels of sulphur dioxide and high temperature. Our recent
study also found that temperature modified the effects of PM10 on health outcomes in
Brisbane, Australia, between 1996 and 2000 (Ren and Tong, 2006). Samet at el. (1998)
examined the variability of the effect estimates of ambient particles on mortality from 1973 to
1980 in Philadelphia, but found little evidence of interaction between TSP and temperature.
Reasons for this inconsistency between studies might include differences in methodology,
population characteristics, geographic conditions and potential misclassifications for both
outcomes and exposures. This study shows that temperature modified the ozone effect, and
the patterns of effect modification varied considerably across communities and geographic
regions. The conflicting findings of other studies may have arisen because they were
conducted in a single community or a small number of communities, in which there was
an insufficient variability in temperature.
It remains largely unclear why temperature modification in the ozone-mortality association
differed across geographic regions. Several reasons may explain the difference. Firstly, both
air conditioning use and the decrease in outdoor activities in summer may partly explain the

17
difference. Ozone is a reactive chemical, its concentrations being much lower indoors than
outdoors (Gryparis et al., 2004). In the southeast region, air conditioning might encourage
people to stay indoors to escape high summer temperatures, and thus their personal exposure
to ozone and temperature might be much lower than that suggested by the ambient measures.
However, this factor might be of less significance in the northern region due to relatively
lower temperatures or relatively shorter periods of high temperature in summer. Reduced
personal outdoor activity in summer may also potentially increase the measurement error in
personal exposure to ozone in the southeast region, since ambient measures were used as
personal exposure. Secondly, physical adaptation of local residents might explain part of the
regional difference in the effect modification. Due to relatively high levels of ozone and
temperature throughout the whole year in the southeast region, residents may become to some
degree adapted to high level exposure to ozone. Therefore, the physiological response might
be less sensitive to variability of ozone and temperature in the southeast. Some studies have
reported that after prolonged exposure to ozone, pulmonary functions become adapted, but
there is also evidence that inflammation continues (Folinsbee et al., 1994; Jörres et al., 2000).
Thirdly, climate might also be a contributory factor. Our study shows that, in general, ozone
was highly correlated with temperature in the northeast region, but the correlation varied
considerately and was generally weaker in the southeast region. In the northeast, high levels
of ozone and temperature usually appear simultaneously, and thus, the observed effect
modification might be actually related to limitation of modelling, in which high levels of
temperature and ozone might make it difficult to some extent to separate their individual
effects (Thurston and Ito, 1999). However, Schwartz used a case-crossover design to explore
the relationship between ozone and mortality by matching temperature and found that the
association between ozone and mortality was unlikely to be confounded by temperature

18
(Schwartz, 2005). In addition, ozone may represent a mixture of other environmental
influences and may therefore be only a surrogate of exposure.
This study found that temperature synergistically modified the association between ozone and
mortality. However, biomedical mechanisms for such interaction are very complex because
causal path ways for both risks are unclear and the biological or physiological reactions are
complicated. A number of biological and toxicological studies show the biological plausibility
of temperature modification of the ozone effect. Both temperature and ozone are risk factors
for human health. Significant ambient temperature change can result in physiological and
psychological stress, and therefore alter personal physiological response to toxic agents
(Jörres et al., 2000). Many experimental studies show that exposure to ozone has significant
biological effects on the respiratory system, including acute and chronic effects (Thurston and
Ito, 1999). Exposure to ozone can result in injuries to the nasal cavity, trachea and proximal
bronchi and central acinar bronchioles and alveolar ducts at three levels: cellular response,
metabolic activity and physiological changes in respiratory function (Thursont and Ito, 1999).
In consequence, simultaneous exposure to high temperature and high ozone levels may lead to
synergistic effect.
These findings may have important implications for planning public health interventions to
control and prevent the health effects of exposure to ambient ozone. Firstly, ozone is a
secondary pollutant formed by reactions of nitrogen oxides and volatile compounds (VOCs)
under the influence of sunlight (Thursont and Ito, 1999). VOCs constitute the hydrocarbons
and oxygenates and their main sources are petroleum, solvent, road transport and industrial
process (Holman, 1999). Therefore, it is important to control the emissions of VOCs,

19
especially in hot days. In addition, it is important to provide warnings to the public during
days with high temperature and high ozone and to encourage residents to stay indoors to
reduce their exposure to ambient ozone. Finally, these findings may assist with efficient
implementation of the public health interventions to minimize residential exposure to high
concentrations of ambient ozone on hot days (eg, educating community residents not to
drive or use few vehicles during hot days). The evidence will be helpful to the regulatory
authority to consider re-setting ozone restriction to lower levels in hot period.
There are several opportunities for future research. First, further methodological advances are
needed, particularly to examine lag effects in the assessment of the interaction between air
pollution and weather. In addition, investigation of air conditioning use and its influence on
the effect estimates in air pollution studies is needed. Finally, effect modification by other
weather conditions, such as wind and humidity, should be explored.
In conclusion, the results of this study show an association between ozone and total non-
external mortality which was substantially heterogeneous across urbanized communities.
Temperature modified the ozone effects, but the directions and magnitudes of the
modification varied across communities. While temperature positively modified the ozone
effects in the northeast US region, such modification was not observed in the southeast region.
These findings may have implications in control and prevention of air pollution and weather-
related health impacts.

20
Acknowledgements
We obtained original data from Internet-based Health & Air Pollution Surveillance System
(iHAPSS) and thank them for their allowing public accessible data. We thank Dr. Peng and
his colleagues, Bloomberg School of Public Health, Johns Hopkins University, for preparing
this database and making it publicly accessible. Dr. Shilu Tong is supported by an NHMRC
Research Fellowship (#290515). This study is partly funded by the Australian Research
Council (#DP 346777).

21
References
Bateson T, Schwartz J. Who is sensitive to the effects of particulate air pollution on mortality:
a case-crossover analysis of effect modifiers. Epidemiology 2004; 15:143-49.
Bell M, McDermott A, Zeger S, Samet J, Dominici F. Ozone and short-term mortality in 95
US urban communities, 1987-2000. JAMA 2004; 292:2372-8.
Bell M, Dominici F, Samet J. A meta-analysis of time-series studies of ozone and mortality
with comparison to the National Morbidity, Mortality, and Air Pollution Study.
Epidemiology 2005; 16:436-45.
Chambers JM, Hastie TJ. Statistical Models in S. London: Champman & Hall 1993.
Curriero F, Heiner K, Samet J, Zeger S, Strug L, Patz J. Temperature and mortality in 11
cities of the eastern United States. Am J Epidemiol 2002; 155:80-7.
Daniels M, Dominici F, Samet J, Zeger S. Estimating particulate matter-mortality dose-
response curves and threshold levels: an analysis of daily time-series for the 20 largest
US cities. Am J Epidemiol 2000; 152:397-406.
Dominici F, Samet J, Zeger S. Combining evidence on air pollution and daily mortality from
the 20 largest US cities: a hierarchical modelling strategy. J R Stat Soc [series A] 2000;
163:263-302.
Dominici F, McDermott A, Zeger S, Samet J. On the use of generalized additive models in
time-series studies of air pollution and health. Am J Epidemiol 2002a; 156:193-203.
Dominici F, Daniels M, Zeger S, Samet J. Air pollution and mortality: estimating regional and
national dose-response relationship. J Am Stat Assoc 2002b; 97:100-11.
Dominici F, McDermott A, Hastie TJ. Improved semiparametric time series models of air
pollution and mortality. J Am Stat Assoc 2004; 99:938-48.
Folinsbee L, Horstman D, Kehrl H, Harder S, Abdul-Salaam S, Ives P. Respiratory responses
to repeated prolonged exposure to 0.12 ppm ozone. Am J Respir Crit Care Med 1994;
149: 98-105.
Gelman A, Carlin JB, Stern HS, Rubin DB. Bayesian data analysis 2nd. Champ & Hall, New
York. 2004.
Greenland S. Basic problems in interaction assessment. Environ Health Perspect 1993;
101(s4): s59-s66.

22
Gryparis A, Forsberg B, Katsouyanni K, Analitis A, Touloumi G, Schwartz J, et al. Acute
effects of ozone on mortality from the “air pollution and health: A European Approach”
project. Am J Respir Crit Care Med 2004; 170:1080-7.
Hastie T, Tibshirani R. Generalized additive model. New York, Chapman and Hall 1990.
Holman C. Sources of air pollution. In: Holgate ST, Samet JM, Koren HS, Maynard RL. Eds.
Air Pollution and Health. London: Academic Press.1999:115-148
Huang Y, Dominici F, Bell M. Bayesian hierarchical distributed lag models for summer
ozone exposure and cardio-respiratory mortality. Environmentrics 2005; 16:547-62.
Insightful Cooporation. S-Plus 6 Guide to Statistics for windows. Washington 2001;
Internet-based Health & Air Pollution Surveillance System (iHAPSS). Software for
computing the asymptotically exact standard errors in GAM. Available at:
http://ihapss.biostat. jhsph.edu/software/gam.exact/gamDoc.htm. [Accessed April 13,
2007].
Ito K, De Leon S, Lippmann M. Association between ozone and daily mortality—Analysis
and meta-analysis. Epidemiology 2005; 16:446-57.
Jerrett M, Burnett RT, Brook J, Kalaroglou P, Giovis C, Finkelstein N, et al. Do
socioeconomic characteristics modify the short term association between air pollution
and mortality? Evidence from a zonal time series in Hamilton, Canada. J Epidemiol
Community Health 2004; 58:31-40
Jörres R, Holz O, Zachgo W, Timm P, Koschyk S, Muller B, et al. The effect of repeated
ozone exposures on inflammatory markers in bronchoalveolar lavage fluid and mucosal
biopsies. Am J Respir Crit Care Med 2000; 161:1855-61.
Katsouyanni K, Touloumi G, Spix C, Schwartz J, Balducci F, Medina S, et al.. Short-term
effects of ambient sulphur dioxide and particulate mater on mortality in 12 European
cities: results from time series data from the APHEA project. BMJ 1997; 314:1658-63.
Katsouyanni K, Touloumi G, Samoli E, Gryparis A, Tertre Al, Monopolis Y, et al.
Confounding and effect modification in the short-term effects of ambient particles on
total mortality: results from 29 European cities within the APHEA2 project.
Epidemiology 2001;12:521-31.
Levy J, Chemerynsky S, Sarnat J. Ozone exposure and mortality—An empiric Bayes
metaregression alaysis. Epidemiology 2005; 16:458-68.

23
McCullagh P, Nelder JA. Generalized linear models (2nd). New York. Chapman and Hall.
1989.
Moolgavkar SH. Air pollution and daily mortality in two U.S. counties: season-specific
analyses and exposure-response relationships. Inhal Toxicol 2003; 15:877-907.
Pope C, Burnett R, Thun M, Calle E, Krewski D, Ito K, et al. Lung cancer, cardiopulmonary
mortality, and long-term exposure to fine particulate air pollution. JAMA 2002;
287:1132-41.
Roberts S. Interaction between particulate air pollution and temperature in air pollution
mortality time series studies. Environ Res 2004; 96:328-37.
Ren C, Tong S. Temperature Modifies the Health Effects of Particulate Matter in Brisbane,
Australia. Int J Biometeorol 2006; 51:87-96.
Ren C, Williams GM, Tong S. Does Particulate Matter Modify the Association between
Temperature and Cardiorespiratory Diseases? Environ Health Perspect 2006; 114:1690-
6.
Samet J, Zeger S, Kelshall J, et al. Does weather confound or modify the association of
particulate air pollution with mortality? An analysis of the Philadelphia data, 1973-1980.
Environ Res 1998; 77:9-19.
Samet J, Dominici F, Curriero F, Coursac I, Zeger S. Fine particulate air pollution and
mortality in 20 U.S. cities. N Engl J Med 2000a; 343:1742-49.
Samet J, Zeger S, Dominici F, et al. The National Morbidity, Mortality, and Air Pollution
Study, part II: morbidity and mortality from air pollution in the United States. Research
Report 94, part II. 2000b. Health Effects Institute, Boston MA, USA.
Schwartz J. How sensitive is the association between ozone and daily deaths to control for
temperature? Am J Respir Crit Care Med 2005; 171:627-31.
Spiegelhaltter D, Thomas A, Best N. 2000. Winbugs version 1.3. software.
Thurston G, Ito K. Epidemiological studies of ozone exposure effects. In: Holgate ST, Samet
JM, Koren HS, Maynard RL. Air Pollution and Health. London: Academic Press.1999.
p.485-510.

24
Legends
Figure 1 Bivariate response surfaces of three-day moving averages of maximum
temperature and ozone on total non-external deaths between April and October,
1987-2000 in Buffalo(A), Chicago(B), Cleveland(C), Columbus, OH(D), Detroit (E),
New York(F), Philadelphia (G), Pittsburgh(H) in the northeast areas; Atlanta(I),
Dallas/Fort Worth(J), Houston (K), Memphis (L), Miami(M), St. Petersburg (N) and
Tampa (O) in the southeast areas, respectively.
Figure 2 Percent increase in daily mortality per 10 ppb increase in three day moving
average of ozone (log relative risk) with Bayesian estimates for specific communities
by temperature levels and the estimate differences between low and high
temperature levels across areas (error bars represent 95% posterior intervals).

25
1020
3040
5060
Ozone.Av20
25
30
35
Max.Temperature.Av
-0.2
5-0.
2-0.
15-0
.1-0
.05
00.
050.
1Lo
g R
elat
ive
Ris
k
1020
3040
5060
Ozone.Av20
25
30
35
Max.Temperature.Av
00.
050.
1Lo
g R
elat
ive
Ris
k
1020
3040
5060
Ozone.Av
22
24
26
28
30
32
34
Max.Temperature.Av
-0.1
-0.0
5 0
0.05
0.1
0.15
Log
Rel
ativ
e R
isk
2030
4050
60
Ozone.Av
10
15
20
25
30
35
40
Max.Temperature.Av
-0.0
6-0
.04
-0.0
2 0
0.02
0.04
Log
Rel
ativ
e R
isk
1020
3040
5060
Ozone.Av
15
20
25
30
35
40
Max.Temperature.Av
-0.0
4-0.0
2 0
0.02
0.04
0.06
0.08
0.1
Log
Rel
ativ
e R
isk
1020
3040
5060
Ozone.Av15
20
25
30
35
40
Max.Temperature.Av
-0.0
5 0
0.05
Log
Rel
ativ
e R
isk
1020
3040
5060
Ozone.Av
10
15
20
25
30
35
Max.Temperature.Av
-0.1
5-0
.1-0
.05
00.
050.
10.
15Lo
g R
elat
ive
Ris
k
010
2030
4050
60
Ozone.Av
5
10
15
20
25
30
35
Max.Temperature.Av
-0.1
-0.0
5 0
0.05
0.1
0.15
Log
Rel
ativ
e R
isk
0
20
40
60
Ozone.Av10
15
20
25
30
35
Max.Temperature.Av
-0.1
-0.0
5 0
0.05
0.1
0.15
0.2
Log
Rel
ativ
e R
isk
1020
3040
5060
Ozone.Av
10
15
20
25
30
35
Max.Temperature.Av
-0.1-
0.05
00.
050.
10.
150.
20.
25Lo
g R
elat
ive
Ris
k
1020
3040
5060
Ozone.Av
5
10
15
20
25
30
35
Max.Temperature.Av
-0.1-
0.05
00.
050.
10.1
50.
20.
25Lo
g R
elat
ive
Ris
k
1020
3040
5060
Ozone.Av
5
10
15
20
25
30
35
Max.Temperature.Av
-0.1
5-0
.1-0
.05
00.
050.
1Lo
g R
elat
ive
Ris
k
1020
3040
5060
Ozone.Av
5
10
15
20
25
30
35
Max.Temperature.Av
00.
050.
1Lo
g R
elat
ive
Ris
k
1020
3040
50
Ozone.Av10
20
30Max.Temperature.Av
-0.1-
0.05
00.
050.
10.1
50.
20.
25Lo
g R
elat
ive
Ris
k
20
40
60
80
Ozone.Av
5
10
15
20
25
30
Max.Temperature.Av
-0.0
5 0
0.05
0.1
0.15
0.2
Log
Rel
ativ
e R
isk
A B C D E F G H I J K L M N O Figure 1

26
Difference (High-Low)High TempModerate TempLow TempAkron
ArlingtonBaltimore
BostonBuffalo
ChicagoCincinnatiCleveland
Columbus, OHCoventry
DaytonDetroit
EvansvilleFort Wayne
Grand RapidsIndianapolis
Jersey CityJohnstown
KingstonLexingtonLouisville
MadisonMilwaukeeNew York
NewarkPhiladelphia
PittsburghProvidenceRochesterSt. LouisSyracuse
ToledoWashington
WorcesterNortheast
AtlantaBaton RougeBirmingham
CharlotteColumbus, GA
Dallas/Fort WorthGreensboro
HoustonHuntsville
JacksonJacksonville
KnoxvilleLafayette
Lake CharlesLittle Rock
MemphisMiami
MobileNashville
New OrleansOrlandoRaleigh
ShreveportSt. Petersburg
TampaTulsa
SoutheastEastern Areas
151050-5-10-15 151050-5-10-15 151050-5-10-15 151050-5-10-15
Figure 2


![Kerrie Mengersen Fabrizio Ruggeri arXiv:1703.02151v3 [stat.CO] … · 2019. 10. 21. · Anthony Ebert, Paul Wu, Kerrie Mengersen, Fabrizio Ruggeri 3 then customers must wait in the](https://img.dokumen.tips/doc/110x75/60df293485441e5e500f3cb0/kerrie-mengersen-fabrizio-ruggeri-arxiv170302151v3-statco-2019-10-21-anthony.jpg)