Embed Size (px)
Citation preview

IAEAInternational Atomic Energy Agency
Questionnaires/Surveys

IAEA
Exercise
• Complete mini engagement survey
• Hand in to course leaders to compile results

IAEA
Why surveys?
• To capture attitudes and impressions of a large
population
• To make sure that everyone in a organization
has had an opportunity to make his/her voice
heard
• To establish a baseline and be able to track
changes over time

IAEA
Advantages of surveys
• Everyone has an opportunity to provide their view
• The survey itself is a message – ’we care about your view’!
• Data can be processed statistically to identify differences
between groups (e.g. functional groups or hierarchical
levels)
• Areas for further investigation, with other methods, can be
identified
• Survey data gives a
’baseline’ for comparisons
over time

IAEA
Disadvantages of surveys
• It is resource-intensive to plan, distribute, analyse and
communicate survey results
• Surveys identify symptoms rather than causes
• The information collected is about what employees think
they think – this is not the same as how they really act!
• Surveys are subject to response bias, e.g. respondents
may feel that they should respond in certain ways
• Questionnaires say more about what the person asking
questions thinks is important than what the respondent
feels is important!
IAEA
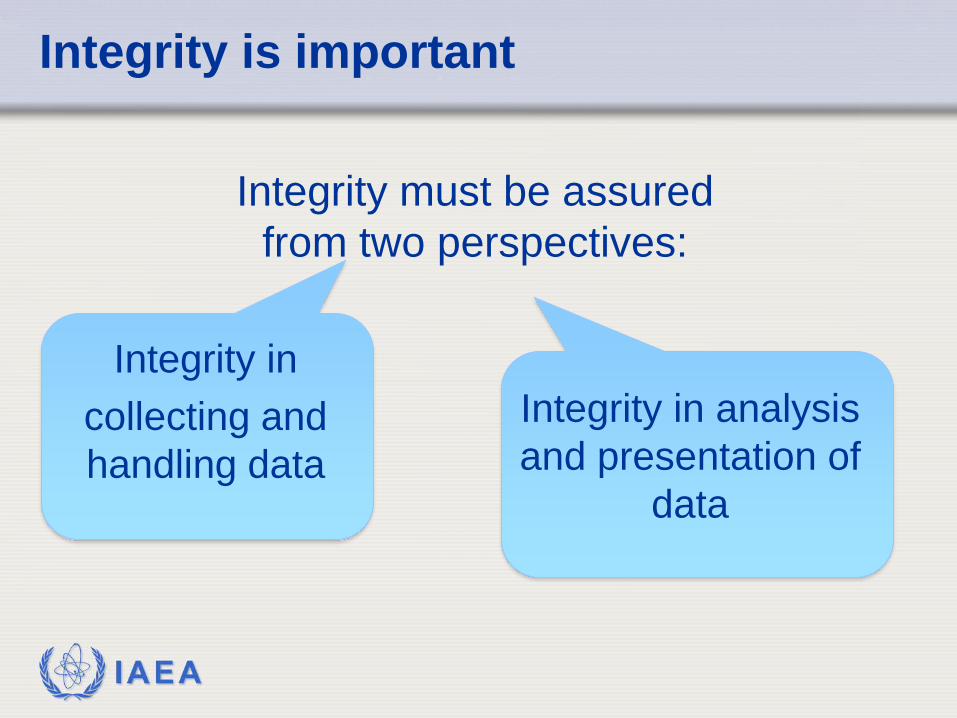
Integrity is important
Integrity must be assured
from two perspectives:
Integrity in
collecting and
handling data
Integrity in analysis
and presentation of
data

IAEA
Distribution strategy
Response rate is very important for statistical validity
• Communication strategy, how results will be taken care of =
increased motivation to take part
• Management championing the survey
• Allocate work time for filling it out
• Rewards for filling in the questionnaire on time
• Reminders
• Response rate can be increased by monitoring the progress within
different departments (’competition’)

IAEA
Distribution strategy (cont’d)
• Group sessions to fill out questionnaire can be arranged
• Ensure that the integrity of the situation for filling out the
questionnaire is maintained for all respondents and for the
entire response period
• E.g. paper and electronic versions available and accessible;
arrangements for shift workers
IAEA
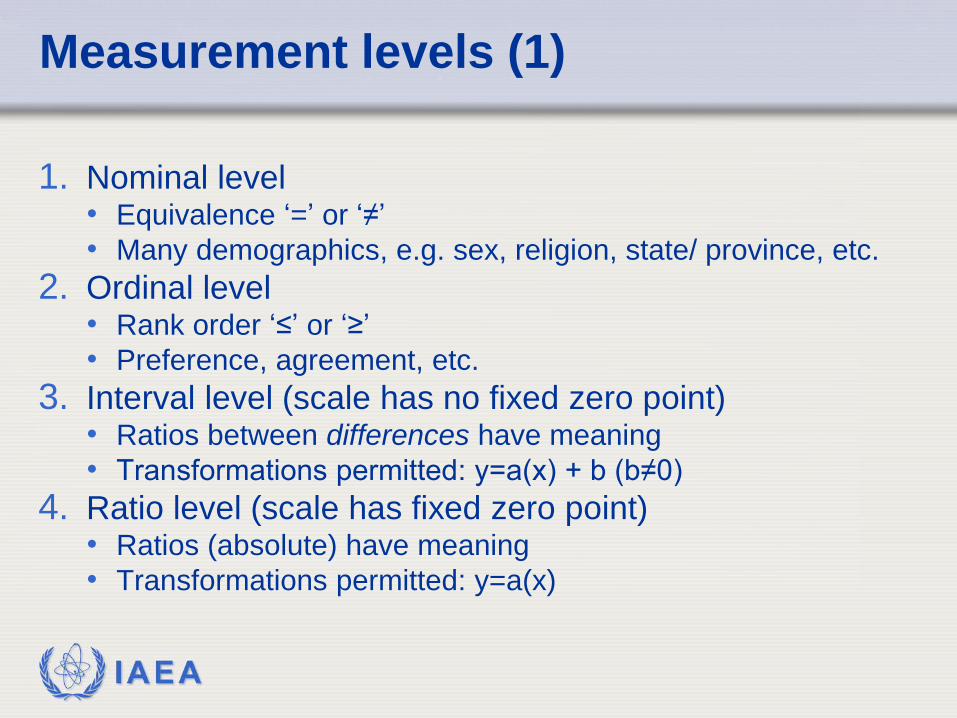
Measurement levels (1)
1. Nominal level• Equivalence ‘=’ or ‘≠’
• Many demographics, e.g. sex, religion, state/ province, etc.
2. Ordinal level• Rank order ‘≤’ or ‘≥’
• Preference, agreement, etc.
3. Interval level (scale has no fixed zero point)• Ratios between differences have meaning
• Transformations permitted: y=a(x) + b (b≠0)
4. Ratio level (scale has fixed zero point)• Ratios (absolute) have meaning
• Transformations permitted: y=a(x)

IAEA
Measurement levels (2)
Limited or unlimited amount of scale values:
discrete or continuous
• Nominal level: discrete
• Ordinal level: discrete or continuous
• Interval- and ratio level: continuous
IAEA
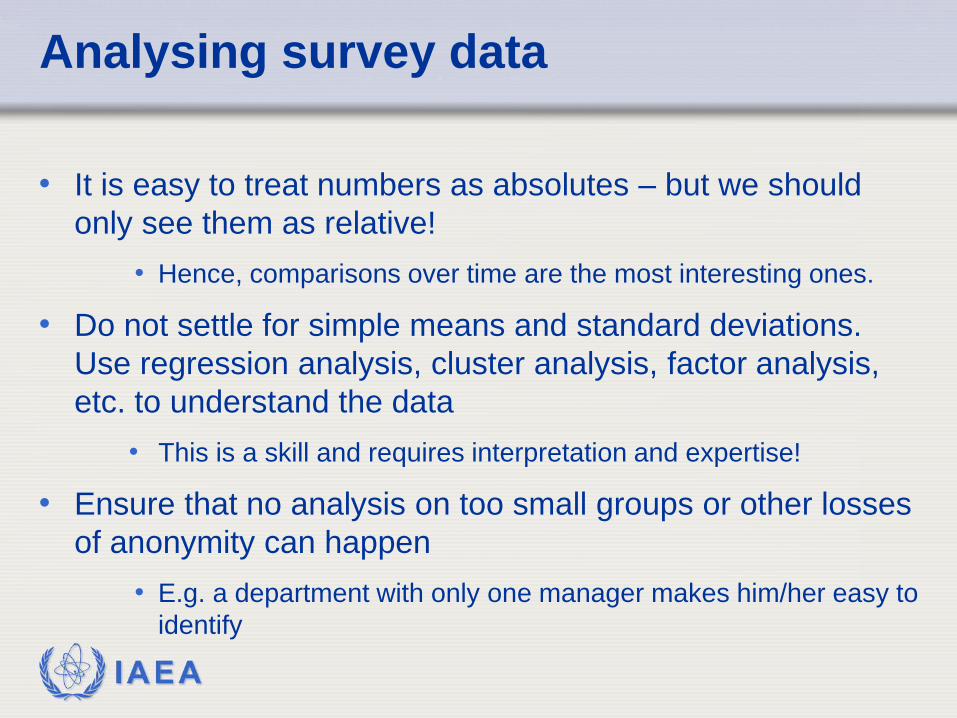
Analysing survey data
• It is easy to treat numbers as absolutes – but we should
only see them as relative!
• Hence, comparisons over time are the most interesting ones.
• Do not settle for simple means and standard deviations.
Use regression analysis, cluster analysis, factor analysis,
etc. to understand the data
• This is a skill and requires interpretation and expertise!
• Ensure that no analysis on too small groups or other losses
of anonymity can happen
• E.g. a department with only one manager makes him/her easy to
identify

IAEA
Pitfalls
”There are three types of lies:
lies, damned lies and statistics.”

IAEA
Pitfalls
• Being deceived by precision
• Pre-determined levels of what is acceptable or not; red-
yellow-green indicators
• Failing to understand that this is a question of interpretation
just as much as qualitative approaches are

IAEA
Pitfalls
4. I think the communication of safety culture
values is…
• We know nothing about
response rate. Is this 27
out of 3000?
• We know nothing about
standard deviation. Are
the differences
statistically significant?
• What is a ’good’ level
here?

IAEA
Handling the results
• Communicate results by various media, e.g. intranet and
face-to-face meetings – highlights relevance to groups
• Be careful about how statistical results are communicated
in order to prevent over-confidence
• If we consider all items with a response of 70 % or higher as
strengths…
.... what to make of the fact that 70 % of the employees find it
important to follow rules and procedures?
• It also means that 30 % do not!
....which may or may not be a problem depending on the
circumstances.

IAEA
Handling the results (cont’d)
• ‘Waking the sleeping giant’ – using open fields where
suggestions will be made. How to handle these?
• A low response rate can indicate a safety culture issue
• Survey results should not be communicated
separately from the rest of the self-assessment
findings
• Remember, the organization’s responses to the
communication of results is another good input for the
safety culture self assessment!

IAEA
Results of our mini-survey
• What did we learn about our views?

IAEA
Summary
• Valid surveys are difficult to develop
• Surveys are a good way to gather perceptions
from large populations
• Surveys cannot be used alone because they say
as much about what the surveyor thinks as what
the respondents think
• Surveys are most useful for watching trends in
responses over time
• Surveys must be analyzed by people with
expertise in statistics and social sciences