Embed Size (px)
Citation preview
II-H / 1
WORKSHOP ON QUESTIONAIRE DESIGN
Resource Paper
Question Formulation and Instrument DesignArnim H. Meyburg
School of Civil and Environmental EngineeringCornell University
Helen M. A. MetcalfPlanTrans
INTRODUCTION, RATIONALE, AND BACKGROUND
ommon sense should dictate in large part the design of survey instruments, once adecision about the appropriate survey procedure has been made. And it should also
dominate the issue of question formulation. Nowhere in the whole travel surveymethodology is it more true that the development of travel surveys resembles an art ratherthan a science. In the context of survey instrument design and question formulation, we areconcerned with controlling possible bias that can be introduced through poor design. Thediscussion is outside the more tangible and precise statistical assessment of (sampling)error. However, the two major concerns, namely, that of undesirable variability[“instrument uncertainty”, (1), p. 148] in the data collected, and that of ending up with datathat are not what were the intended data (“instrument bias”), are prevalent in surveyresearch and practice.
It is a truism that anybody can develop a questionnaire. It is, however, acompletely different issue whether such a questionnaire will generate the information thatthe developer and analyst are interested in obtaining, and that is suitable for answering thesurvey objectives. And this question needs to be asked with respect to the quality, as wellas with respect to the quantity (nonresponse issue), of the data.
This resource paper focuses on the issue of question formulation and surveyinstrument design. No standardized procedures for question formulation and surveyinstrument design have been developed, nor is it likely that they will be developed in thenear future, given the variety of survey objectives, client expectations, social, cultural, andlanguage environments, etc. At best, guidelines that reflect lots of empirical evidence canbe put together to provide practical guidance to the travel survey designer. One example ofan extensive set of guidelines is presented in Richardson, Ampt, and Meyburg (1).Another example is the 1996 Travel Survey Manual, prepared by Cambridge Systematics,Inc., for USDOT (13). Other treatments can be found in more specialized contexts. Themost recent U.S. example is being developed by the National Opinion ResearchCorporation (at the University of Chicago), in the context of nonresponse issues (14).
This paper has three main objectives: First, it examines some theoretical andmethodological elements of the social science literature on data quality, as it relates toquestionnaire formulation and survey design. Second, the paper provides discussions ofpractical aspects of question formulation and survey design. And third, it develops a set ofsuccinct state-of-the-practice recommendations for improved question formulation andsurvey design.
C
TRB Transportation Research Circular E-C008: Transport Surveys: Raising the Standard II-H / 2
DATA QUALITY IN RELATION TO SURVEY QUESTION ANDDESIGN CHARACTERISTICS
A large amount of research concerning the quality of survey data has been conducted in thesocial sciences, especially in the fields of social and cognitive psychology. This sectionexamines the aspect of response quality in relation to question formulation and surveydesign. While much of this work concentrates on determining validity and reliabilty ofattitudinal survey data, the insights gained and the research methodology are applicableacross all types of survey topics.
Scherpenzeel and Saris (2) have tackled in a systematic manner the validity andreliability of survey responses as a function of variations in survey question characteristics.While there is a plethora of anecdotal and empirical evidence that suggests certainfundamental guidelines about question characteristics, as documented later in this paper,Scherpenzeel and Saris (2) report on their research efforts in the Netherlands to overcomethe lack of “general rules connecting the degree of measurement error with differentcombinations of these characteristics” (p. 341).
They acknowledge that for each survey, choices have to be made about questionwording, response scale (especially for attitudinal questions), question context, and datacollection technique. While each of these choices can introduce different errors, little isknown about the magnitude of these errors and their effect on the validity and reliability ofsurvey responses. Their 1997 study reports on how data quality is affected by a set ofsurvey question characteristics. Their objective was to state in quantitative terms therelationship of measurement errors to these characteristics, in order to facilitate theprediction and optimization of data quality. Their study also “shows how relationshipsbetween variables can be corrected for measurement error on the basis of this information.”
They use so-called multitrait-multimethod (MTMM) models to first estimate thevalidity and reliability based on a substantial number of survey measures. Subsequently, inthe “second stage” (or “meta-analysis”) of this approach, “the variation in these qualityestimates is related to variation in the characteristics of the survey questions.”
Other researchers working on survey research in the fields of social and cognitivepsychology have made earlier similar attempts to gain systematic insights into data qualityand various aspects of question wording, context and sequencing, retrieval method, lengthof survey, etc. Specifically, Andrews (3) was the first to use the MTMM approach.Rogers, Andrews, and Herzog (4) built on this approach using North American samples, asdid Költringer (5) in Austria. Scherpenzeel and Saris (6) also conducted an internationalcomparison of data quality for an individual topic.
Another noteworthy effort along this line of enquiry is a 1991 study by Alwin andKrosnick (7) on the reliability of survey attitude measurement. They define reliability asthe “normed linear relationship between two attempts to measure the same thing, net oftrue change.” This definition is based on Lord and Novick (8).
Alwin and Krosnick (7) tested 96 attitude measures from five U.S. national panelsurveys. Their paper includes a rather important discussion of definitions of reliability andvalidity, terms that seem to be used with various interpretations throughout the literature.Given that the overall objective of systematic studies of attitude measurement error is todetermine the degree of reliability and variability in the response data in order to improve,if not optimize, survey and survey question design, it is crucial that a high degree ofcommonality on these definitions be developed. Only then can practitioners actually draw
Meyburg and Metcalf II-H / 3
proper conclusions from the results of these methodological studies. And only then can weassume that optimization of design and determination of reliabilty and validity can beperformed consistently across surveys. Otherwise, the methodological efforts tosystematically determine reliabilty and variability across sets of surveys and questioncharacteristics will not be much different from the frequently used basis of “anecdotal”empirical improvements from survey to survey.
The special significance of the 1997 study by Scherpenzeel and Saris (2) lies, inpart, in the fact that their meta-analysis also includes the effects that were investigated byAndrews (3), Rodgers, Andrews, and Herzog (4), Költringer (5), and Alwin and Krosnick(7). In this respect, their research represents an advance over and a synthesis of the meta-analyses performed in a variety of contexts and cultural and language environments. Theystate that their research can be used “to construct optimal questions” and “to correctunavoidable measurement errors in survey research.”
One should caution, though, against transferring results of such analyses blindlyacross different language and cultural, as well as social and educational, environments.Scherpenzeel and Saris (2) themselves acknowledge these limitations and admit that thetransferabilty (“generalizability”) is limited. They specifically state that they do not see itsapplicability beyond the Dutch language environment.
However, it should be clearly acknowledged here that their methodologicalresearch into reliability and validity of data resulting from attitude measurements is ofsubstantial significance for others to build on in other language and cultural contexts. Thecomparison and the potential merging of research results, where commonality of approachand results warrants such actions, has far-reaching consequences for improving the state ofthe art of survey research and practice.
Tourangeau and Rasinski (9) address the question of “context effects” on attitudemeasurements. Based on an emerging agreement among social psychologists, they defineattitudes as “structures in long-term memory”. Their analysis of the cognitive process thatis required to answer attitude questions is based on the assertion that a four-stage process isinvolved on the part of the respondent. The four stages are assumed to be the following:
1. Interpretation of the question (“What is the attitude about?”).2. Retrieval of relevant beliefs and feelings.3. Application of these beliefs and feelings to generate appropriate judgment.4. Use of this judgment to formulate response.
An understanding of this process is deemed necessary for the understanding of thereliability of respondents’ answers to attitudinal questions. Each of these stages is likely tobe influenced by psychological variables that, in turn, may covary with the data collectionmethod [Schwarz et al. (10)]. If the response is to be entered into a given set of responseoptions, as is the case in many survey instruments, the translation of the response into onethat appears on the list can distort the true attitude. Also, given the fact that the surveyanalyst may edit the response in line with consistency checks among answers, the finalanswer about an attitude may be quite different from the true attitude the respondent carriesin his/her long-term-memory structure.
Furthermore, they claim that all four stages can be affected by “prior items”, i.e.,certain conditioning of the respondents’ minds that occurred because of having answeredrelated questions earlier in the survey. They are either building on that thought process in a
TRB Transportation Research Circular E-C008: Transport Surveys: Raising the Standard II-H / 4
constructive way, or they may aim for “matching” the earlier responses for maximumconsistency. The issue of social and political correctness, as well as the pressure to appearintelligent, consistent, rational, timely, etc., plays into this process in a significant way.
Answers to survey questions, particularly those that reflect attitudes and opinions,are subject to a number of influences, as discussed above and as well-documented in theliterature. However, the cognitive processes that are at the root of these influences havereceived increased attention and have been subjected to systematic studies only fairlyrecently [e.g., Tourangeau and Rasinski (9)].
Tourangeau and Rasinski (9) showed that the retrieval method, i.e., the surveymethod, generated different pressures on the respondents with respect to time and socialand political correctness. The retrieval process may produce the most easily recalled(“accessible”) aspect, rather than the most relevant and important for the question at hand.More careful, i.e., more time consuming reflection may be necessary to access the less-than-spontaneous and/or intuitive response. This reflection may not be possible underphone or personal interview pressure (p. 301). Hence, it is likely that a shortened orsuperficial retrieval process from the long-term memory bank takes place and generates anattitudinal response that is not reflective of the true attitude carried by the respondent. Asurvey suffering from these handicaps will result in a “sample of pertinent beliefs thatoverrepresents the most accessible ones” (p. 301).
Another aspect of potential unreliability of attitude measurements results from thefact that respondents simply may not have a well-formulated attitude in their beliefstructure. Hence, their response to attitudinal questions may easily be swayed by the waythe issue is posed, the sequencing of questions, the particular wording of a question, andthe item context. Schumann and Presser (11) have shown that such variations can havepronounced effects on the responses.
This aspect obviously has important implications with respect to the survey methodused (issue of time, social and political correctness pressures) and the sequencing ofattitudinal questions (“prior items” issue). Ignoring these aspects will certainly affect thereliability of attitude measurements.
Schwarz et al. (10) demonstrated the importance of a “psychological approach tosurvey methodology that incorporates cognitive and communicational variables.”Specifically, by means of experimental evidence, they investigated question answering inrelation to different survey methods (self-administered, phone and personal interview).They found significant differences in response data quality, depending on the surveymethod, with respect to question wording, recall period, and question order. Also, theydemonstrated the well-known interviewer effects on response quality. For a discussion of astructural modeling approach (including MTMM models) for the evaluation ofmeasurement instruments, see, for example, Saris and Andrews (12).
FACTORS THAT AFFECT INSTRUMENT DESIGN
Question formulation is very much dependent on the objectives of the survey and the targetpopulation to be surveyed. These preliminary, yet fundamental, survey planningconsiderations give rise to decisions about the most appropriate survey method to beemployed, which, in turn, determines the most suitable instrument design (1).
Meyburg and Metcalf II-H / 5
Survey Objectives
The basic objectives of a survey may be self-evident; for instance, the main objective ofmost household travel surveys is to collect information about how and why people travelor do not travel during a certain period of time. But a more specific, and more important,objective may be to collect particular information for use in modeling procedures.Secondary objectives may include the desire to create a survey that can be easily comparedwith other household surveys. The objective of many transit surveys is to collectinformation about how people use the local transit system, or to collect attitudinalinformation to be sure that the service is meeting the needs of the customer. In most cases,no matter what type of survey is to be conducted, the objective of the survey will definethe target population to be surveyed.
Target Population
The definition of the target population, or sample, may be as simple as “anyone whotravels,” or as complex as “people who began riding peak buses on a daily basis in aparticular region within the last six months.” In most surveys, a secondary definition willlikely include a restriction on the age of potential respondents. But whether the definitionof the sample is simple or complex, the population selected will partially or completelydetermine the method of collecting data. This is because the method of collecting datafrom a population is dependent on the ease of locating that population. For instance, whenconducting a survey where the objective is to collect origin-destination data from transitriders, the easiest method of finding transit riders in most regions is by intercepting them attransit stops or stations. It would not be wise to conduct a random-digit householdtelephone survey of transit riders if the incidence of transit riders in the region to besurveyed is 3%. Once the target population has been identified, it is crucial to the successof the survey to identify the easiest and most efficient way of locating and surveying them.
Survey Methods
There are a number of survey methods that can be employed for most surveys, amongthem face-to-face interviews, mail-out/mail-back surveys, onboard self-administeredsurveys, telephone interviews using paper surveys, computer-aided telephone interviews(CATI), computer-aided personal interviews (CAPI), a combination of these, and others.Basically these methods involve paper or computerized survey instruments that are eithercompleted by an interviewer in the presence of the respondent, completed by aninterviewer who is in contact with the respondent over the telephone, or completed by therespondent on his/her own. As explained in the previous section, choosing the appropriatemethod has much to do with the objectives and the target population of the survey.However, a number of other factors also contribute to this decision, such as the resourcesavailable, the time frame in which the survey must be completed, the literacy of thepopulation to be surveyed, and the desired number of completed surveys. For instance, aCATI survey would not be a wise choice for most small-sample surveys, since thedevelopment and programming of the questionnaire take a significant amount of time andmoney. Although there are no standard guidelines for the size of CATI surveys, it wouldbe safe to say that a survey of fewer than 2,500 would not be a good candidate for CATI,
TRB Transportation Research Circular E-C008: Transport Surveys: Raising the Standard II-H / 6
while a survey of 5,000 or more would definitely benefit from CATI. Researchers whohave experience with the costs of both paper and CATI surveys (and these costs will varyfrom region to region and from company to company) will be able to pinpoint the numberof surveys at which one method is more cost-effective than the other.
Basic Instrument Design
There are numerous resources available to the survey designer, including an extensive listof guidelines for proper physical design and layout for personal interview surveys, self-completion surveys, and intercept surveys, provided by Richardson, Ampt and Meyburg(1). The most fundamental consideration when beginning the design of a surveyinstrument is whether or not the respondent is going to see the survey instrument. Thefollowing sections discuss different aspects of survey design, depending on whether thesurvey is to be self-administered or interviewer-administered. Additionally, there are someunique aspects of CATI surveys that should be utilized by the questionnaire designer.
Self-Administered Surveys
Self-administered surveys require special attention to appearance, since they will be placedin the hands of potential respondents. A self-administered survey is usually mailed to therespondents, or handed to them, for instance, on a bus. In the case of self-completionsurveys, the professional appearance, or lack thereof, can literally determine the fate of thequestionnaire during the first minute of encounter with the potential respondent. Ofparticular concern are:
• The length of the questionnaire,• The spacing of questions,• The size of typefaces used,• The layout of questions and answers,• A logical order to questions,• Minimized writing,• Simple language, and• The provision of survey/question instructions.
The length of a questionnaire is often a factor of the resources available for asurvey, and is more broadly defined by the objectives of the survey and the analyst’s desireto know, rather than by the potential respondent’s willingness to provide the type andamount of information requested. Experience shows that the length of a questionnaire hasa significant impact, both on the quality of the information gathered, and on thewillingness of the respondent to complete the survey. It is obvious that if a survey bookletis placed in a respondent’s hands, the respondent will likely react differently than if he/shewere given a survey the size of a 3” x 5” card. It is imperative, therefore, that onlyquestions that are absolutely necessary for answering the objectives of the survey beincluded. This is especially important for self-administered surveys, since the respondentcan see at a glance what is being asked of him/her. A secondary issue relating to surveysthat have to be mailed out or mailed back is postage, which could seriously impact asurvey’s budget if the questionnaire consists of several pages.
Meyburg and Metcalf II-H / 7
The spacing of questions is also a concern for self-administered questionnaires.Related to the perceived length of the questionnaire is the question of whether to create asmall, compact survey or a longer, more openly spaced survey. Generous spacing resultsin greater ease of writing responses, and allows the use of larger typefaces for easierreading, while at the same time adding to the bulk of the survey instrument. The size ofthe typeface used is of particular importance for collecting responses from the elderly, andif the population to be surveyed contains a large number of elderly persons, designing asurvey instrument in a large typeface is essential. Most often, the answer lies in acompromise between compactness and ease of use. Only pretests will provide thedefinitive answer as to what approach is preferable for the specific target population to besurveyed.
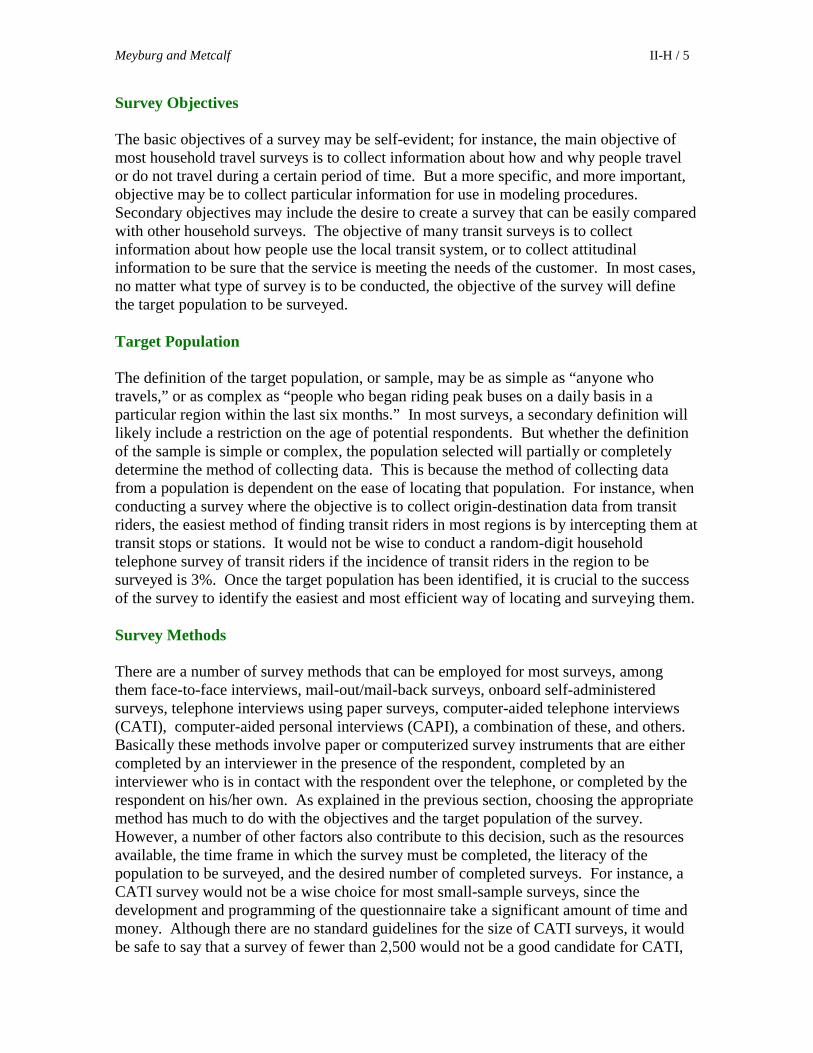
Another item of consideration for self-administered surveys is the layout ofquestions and answers. A good layout not only looks pleasing, it also can help to utilizespace more efficiently and should make it easier for the respondent to easily identify whichanswers correspond with which questions. In Figure 1 below, Example A illustrates agood layout design of the question, while Example B shows a poor one. In Example A, thequestion is set apart from the answers, the answers are lined up next to the tick-off boxes,and the box around the entire question will help to distinguish it from questions 5 and 7.
FIGURE 1 Examples of question-and-answer layout.
In Example B, the question and answers run into each other; the answers are more difficultto quickly identify (as opposed to the answers in Example A); the answers and boxes arenot lined up, making them look messy and taking up more space; and the question will notbe easily distinguished from the questions that come before and after it.
The guidelines for logical question ordering are fairly simple and obvious. Theguiding principle ought to be to arrange the questions in categories, where both theordering of categories and the sequencing within categories follow a logical and intuitivelyobvious path. It should avoid forcing the respondent to make mental jumps, which wouldgive the appearance of a haphazardly composed survey instrument. Using boxes tosurround each block of questions, headings, and even a sentence of introduction to eachsection can be helpful.
It is extremely important that a minimum amount of writing be required of therespondent to a self-administered survey. Questionnaires containing many open-ended
TRB Transportation Research Circular E-C008: Transport Surveys: Raising the Standard II-H / 8
questions will cause a writing burden on the respondent and make processing completedquestionnaires difficult and time-consuming. Even in closed questions, an obvious way ofminimizing the amount of writing required is to provide tick-off boxes, lined up incolumns next to the most frequently expected responses. Using simple, non-technicallanguage, avoiding jargon and slang, has to be an overriding principle of questionwording, as is the use of short and simple words. Obviously, many respondents will notknow anything about a subject that is technical, and will not be familiar withcorresponding technical words, phrases or acronyms. And while it is important to avoidusing language that appears to be insulting to some respondents’ intelligence, it is equallyimportant to remember that the sample of respondents will presumably represent a cross-section of the population, including all levels of literacy. Using short and simple wordsand sentences also makes a questionnaire easier to read, and therefore may cut down on theamount of time it takes the respondent to complete the survey. For instance, using “Howdid you get here?” is easier on the respondent than “How did you arrive at yourdestination?”
Another item of consideration for a self-administered survey instrument is theinclusion of survey and/or question instructions. Whenever possible, it is advisable toplace instructions directly in the survey instrument, as opposed to providing a separatesheet of instructions, which could be totally overlooked. In a booklet survey, an entirepage in the front of the booklet could be devoted to instructions, but too many instructionscan also overwhelm respondents and encourage nonresponse. Items of particularimportance, such as when to complete a travel diary and what to do with it when it hasbeen completed, can be provided in a prominent place in a large typeface. One goodstrategy is the provision of a filled-in replica (possibly miniaturized) of the survey forms,particularly for time-sequenced travel and/or activity reporting sheets. Occasionally, itmay be necessary to provide instructions at the beginning of a block of questions, orperhaps preceding a particular question. However, since many respondents will never readinstructions, good survey design practice suggests that the questions ought to beformulated in such a manner that they are unambiguous and easily understood, even by themore moderately literate respondents.
Interviewer-Administered Surveys
Surveys that are administered by an interviewer are usually completed over the telephoneor in person with the respondent. While the designer of a self-administered survey needsto be concerned with what the respondent sees in his/her survey, the designer of aninterviewer-administered survey needs to pay particular attention to what the respondenthears. Of particular concern to the designer is:
• The length of the questionnaire,• The introductory paragraph(s),• Minimized writing,• Simple language, and• The provision of an interviewer manual.
Although the length of a questionnaire may not be initially obvious to a respondentover the telephone, it is still important to avoid developing an overly lengthy questionnaire.
Meyburg and Metcalf II-H / 9
While a lengthy questionnaire may cause respondent fatigue and result in the respondenthanging up the telephone before the survey is completed, overly lengthy surveys that willbe conducted long-distance can seriously impact the cost of the telephone calls. Surveysthat are conducted face-to-face should also not be overly long, since the interviewer mayhave trouble physically handling the long survey, and because the respondent may be ableto recognize that the survey will be lengthy and may decline to participate. Length is alsoof particular concern if the survey involves intercepting potential respondents at transitstops or stations, since the interviewer may have a limited amount of time betweenintercepting the respondent and the arrival of the bus or train.
Thoughtful wording and sequencing of an introductory statement in an interviewer-administered survey will significantly affect the interviewer success rate within the veryfirst few moments of a phone call or intercept. Thus, the opening paragraph of aninterviewer-administered survey needs to be designed in such a manner that trust is builtquickly, before losing the contact. It is a requirement for success to put the respondent atease about the legitimacy of the survey, the importance of the subject matter to therespondent, and the sincerity of the interviewer. Only after these essential steps have beenaccomplished is it feasible to expect success in the actual survey questions. Hence, it isimportant to stress to interviewers the importance of conscientiously adhering to thewording of an introductory paragraph. It may also be helpful to test several openingstatements during a pretest, to determine which one provides a better response.
Interviewer-administered surveys should require a minimum amount of writing orcomputer input on the part of the interviewer. Similar to self-administered surveys,questionnaires containing many open-ended questions will cause a writing burden on theinterviewer, cause the respondent to spend time waiting for the interviewer to write or type,and make processing completed questionnaires difficult and time-consuming. As in self-administered surveys, use of simple, nontechnical language, avoiding jargon and slang,and use of short and simple words and sentences are important in interviewer-administeredsurveys, however, for different reasons. An interviewer who trips over long sentences,multisyllabic words or technical jargon is in danger of appearing unprofessional, whichcould compromise the trust of the respondent. Additionally, if a respondent cannotunderstand what the interviewer is saying, he/she may abandon the survey before it iscomplete, or he/she may pretend to understand and guess at the answers because of fear ofembarrassment.
Although it is not part of the survey instrument, one item of particular importancefor the interviewer-administered survey is an extensive interviewer instruction manual.This is essential, both as part of the interviewer training program and for referencepurposes, should the interviewer become unsure about proper conduct and proper answersto respondents’ questions in the course of the survey. The interviewer manual shouldreview the basic purpose of the survey; indicate the sponsor or agency for whom thesurvey is being conducted; provide a name and telephone number, as appropriate, forrespondents to call to check on the validity of the survey or ask questions; and discuss anyissues of particular importance. The survey developer should review the completed surveyinstrument and determine what questions might cause particular problems for respondentsor interviewers. A survey pretest is particularly helpful in determining what kind ofassistance the interviewer may need, or what survey questions are particularly bothersometo respondents.
TRB Transportation Research Circular E-C008: Transport Surveys: Raising the Standard II-H / 10
Computer-Aided Telephone Interviews (CATI)
While CATI surveys are interviewer-administered and can benefit from all of the itemsmentioned in the previous section, there are some special items to consider for CATIsurveys. Although CATI can be used for many types of surveys, this section will refer toCATI in terms of a household travel survey, which is generally a more complex surveythat can very effectively utilize the benefits of CATI.
The computerized aspect of CATI provides a number of tools to the questionnairedeveloper that should be utilized very carefully. Specifically, the following items are veryimportant:
• Developing of complex skip patterns,• Double-checking responses,• Referring to information already collected, and• Testing the programming.
One tremendous advantage of CATI surveys is the ability to build complex skippatterns into the survey. For instance, respondents are to be asked two questions abouttravel from “Point A” to “Point B”. Question 1 asks the respondents what mode oftransportation they used. Question 2 is actually three different questions, depending on therespondents’ answer to Question 1: If they traveled by car, the interviewer wants to knowwhere they parked it and how much it cost; if they traveled by bus or by train, theinterviewer wants to know how they paid their fare and how much they paid; and if theytraveled by bicycle, it is important to find out what they did with their bicycles when theygot there. Using CATI means that the computer can skip directly to the appropriateQuestion 2 based on the answer the respondent gives to Question 1, without theinterviewer having to identify which question to ask.
CATI is also capable of significantly reducing erroneous data, because a well-written CATI program will double-check responses. For instance, we ask for the ages ofeach member of the household, and we ask how each member traveled during the travelday. If a household member traveled by car, we ask whether he/she was a driver or apassenger. If a household member indicates that he/she was the driver of a car on aparticular trip, the computer can double-check the age of that member, to be sure that theanswer is plausible. Without CATI, it would be the responsibility of the interviewer toremember that 30 questions ago he/she was told that this household member was 5 yearsold. With CATI, the computer program can identify the problem immediately and havethe interviewer verify the age of the household member and the method of travel, and makenecessary changes. Probably the most difficult aspect of using this benefit of CATI islocating all the answers in a survey that can be double-checked.
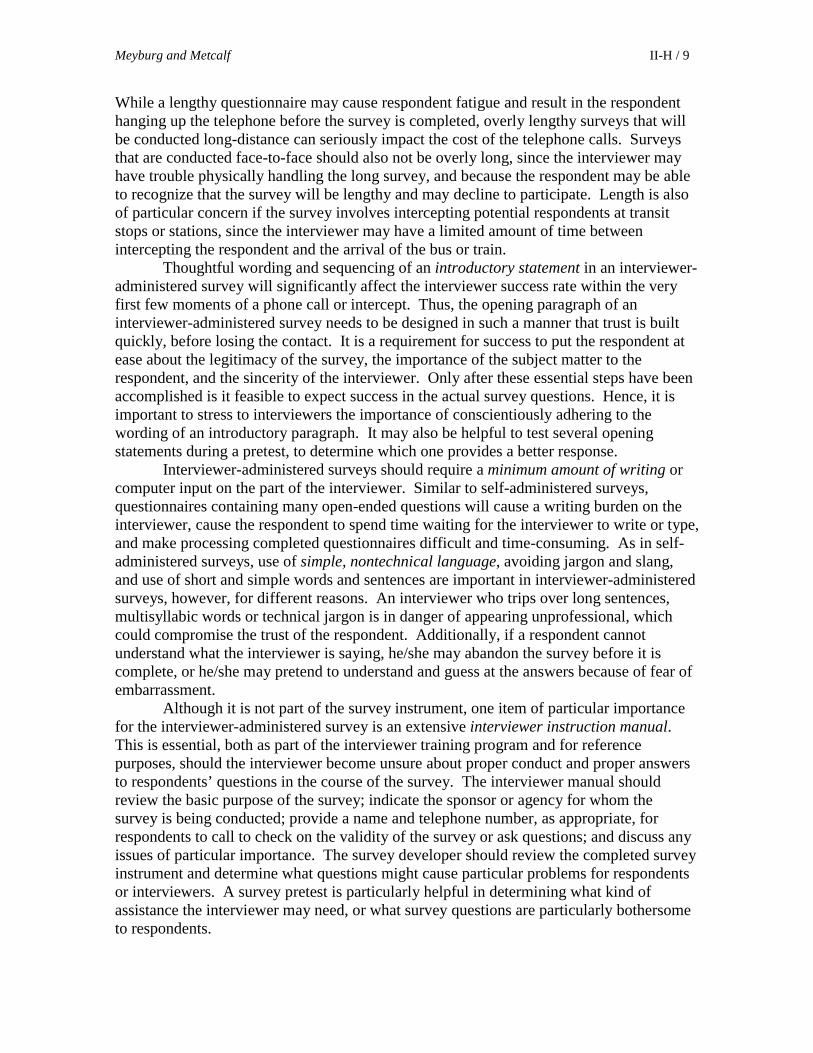
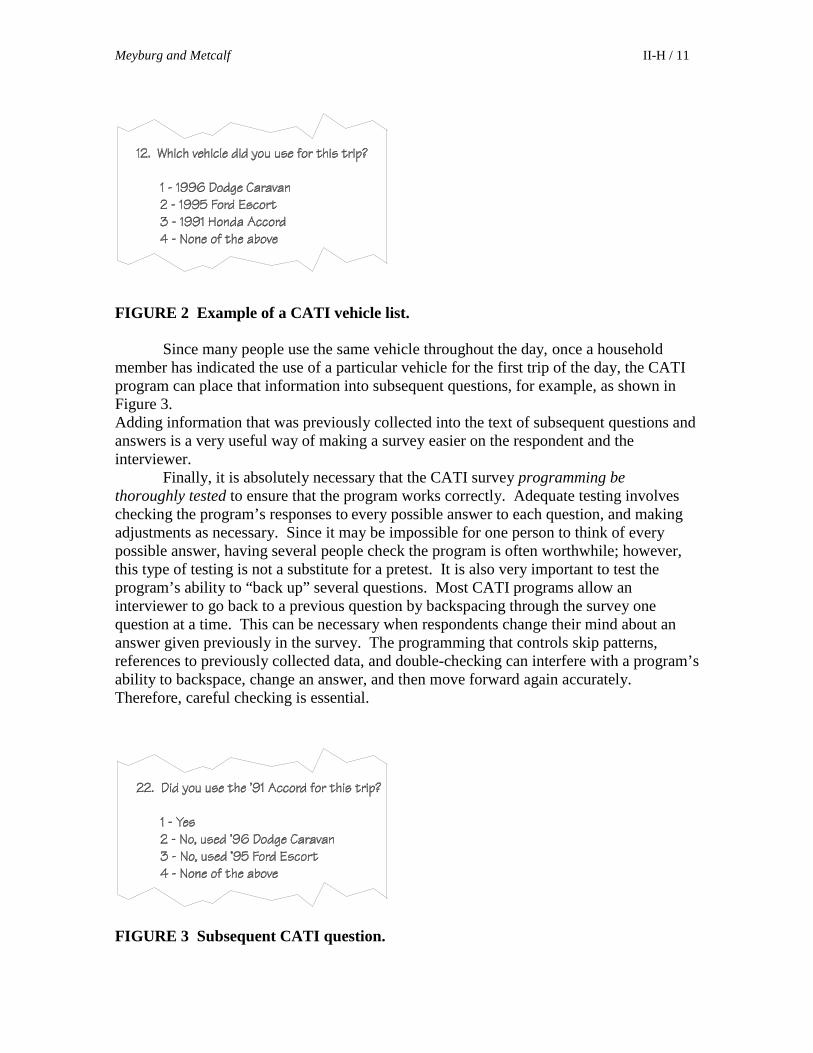
A CATI survey can also refer to information that has previously been collected. Ina household travel survey, this aspect of CATI is particularly helpful. For example,suppose a household travel survey collects detailed information about the vehicles that areavailable to a household (e.g., make, model and year), and then asks the respondent toindicate which vehicle was used for each trip taken on the travel day. Once the data oneach vehicle are collected, a CATI program can present a list of the vehicles for theinterviewer to select from for each trip taken in the household. Figure 2 provides anexample of this.
Meyburg and Metcalf II-H / 11
FIGURE 2 Example of a CATI vehicle list.
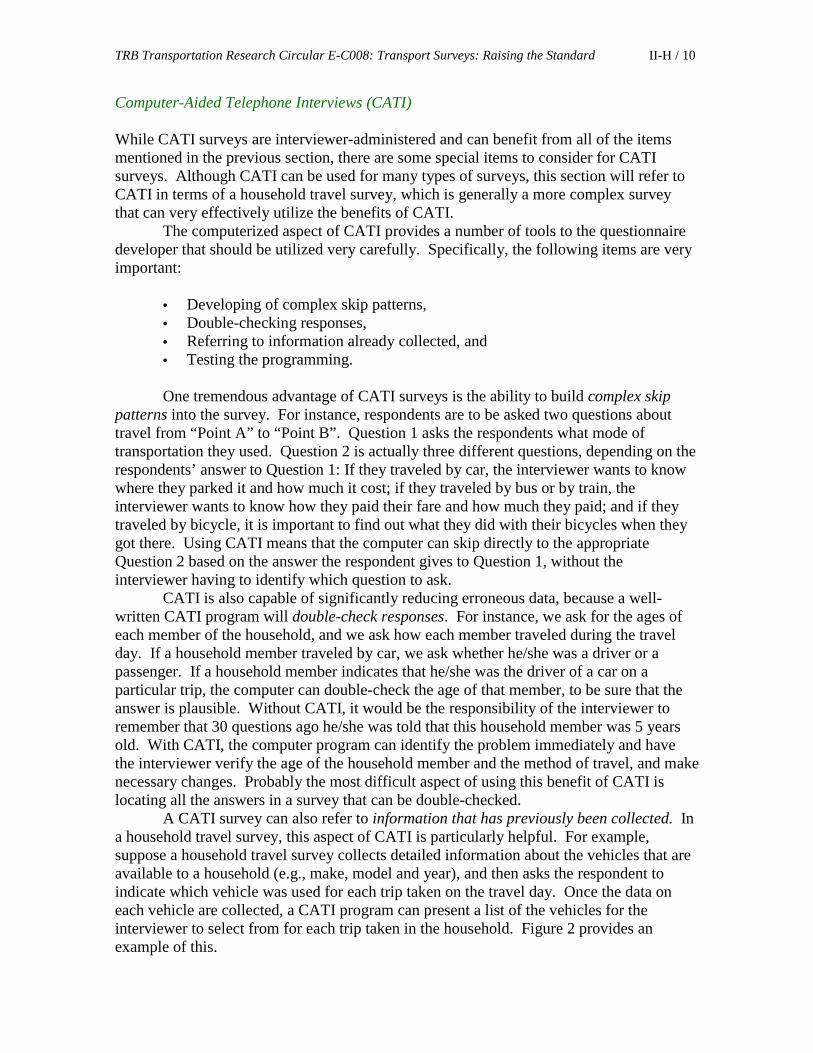
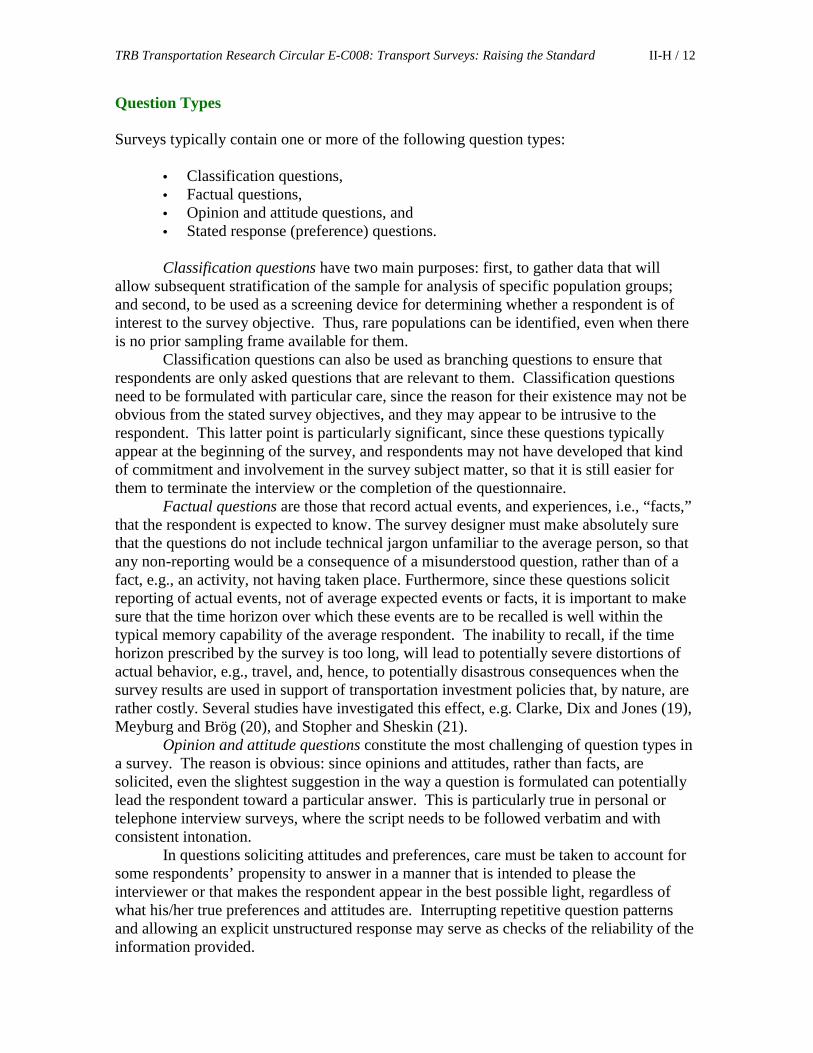
Since many people use the same vehicle throughout the day, once a householdmember has indicated the use of a particular vehicle for the first trip of the day, the CATIprogram can place that information into subsequent questions, for example, as shown inFigure 3.Adding information that was previously collected into the text of subsequent questions andanswers is a very useful way of making a survey easier on the respondent and theinterviewer.
Finally, it is absolutely necessary that the CATI survey programming bethoroughly tested to ensure that the program works correctly. Adequate testing involveschecking the program’s responses to every possible answer to each question, and makingadjustments as necessary. Since it may be impossible for one person to think of everypossible answer, having several people check the program is often worthwhile; however,this type of testing is not a substitute for a pretest. It is also very important to test theprogram’s ability to “back up” several questions. Most CATI programs allow aninterviewer to go back to a previous question by backspacing through the survey onequestion at a time. This can be necessary when respondents change their mind about ananswer given previously in the survey. The programming that controls skip patterns,references to previously collected data, and double-checking can interfere with a program’sability to backspace, change an answer, and then move forward again accurately.Therefore, careful checking is essential.
FIGURE 3 Subsequent CATI question.
TRB Transportation Research Circular E-C008: Transport Surveys: Raising the Standard II-H / 12
Question Types
Surveys typically contain one or more of the following question types:
• Classification questions,• Factual questions,• Opinion and attitude questions, and• Stated response (preference) questions.
Classification questions have two main purposes: first, to gather data that willallow subsequent stratification of the sample for analysis of specific population groups;and second, to be used as a screening device for determining whether a respondent is ofinterest to the survey objective. Thus, rare populations can be identified, even when thereis no prior sampling frame available for them.
Classification questions can also be used as branching questions to ensure thatrespondents are only asked questions that are relevant to them. Classification questionsneed to be formulated with particular care, since the reason for their existence may not beobvious from the stated survey objectives, and they may appear to be intrusive to therespondent. This latter point is particularly significant, since these questions typicallyappear at the beginning of the survey, and respondents may not have developed that kindof commitment and involvement in the survey subject matter, so that it is still easier forthem to terminate the interview or the completion of the questionnaire.
Factual questions are those that record actual events, and experiences, i.e., “facts,”that the respondent is expected to know. The survey designer must make absolutely surethat the questions do not include technical jargon unfamiliar to the average person, so thatany non-reporting would be a consequence of a misunderstood question, rather than of afact, e.g., an activity, not having taken place. Furthermore, since these questions solicitreporting of actual events, not of average expected events or facts, it is important to makesure that the time horizon over which these events are to be recalled is well within thetypical memory capability of the average respondent. The inability to recall, if the timehorizon prescribed by the survey is too long, will lead to potentially severe distortions ofactual behavior, e.g., travel, and, hence, to potentially disastrous consequences when thesurvey results are used in support of transportation investment policies that, by nature, arerather costly. Several studies have investigated this effect, e.g. Clarke, Dix and Jones (19),Meyburg and Brög (20), and Stopher and Sheskin (21).
Opinion and attitude questions constitute the most challenging of question types ina survey. The reason is obvious: since opinions and attitudes, rather than facts, aresolicited, even the slightest suggestion in the way a question is formulated can potentiallylead the respondent toward a particular answer. This is particularly true in personal ortelephone interview surveys, where the script needs to be followed verbatim and withconsistent intonation.
In questions soliciting attitudes and preferences, care must be taken to account forsome respondents’ propensity to answer in a manner that is intended to please theinterviewer or that makes the respondent appear in the best possible light, regardless ofwhat his/her true preferences and attitudes are. Interrupting repetitive question patternsand allowing an explicit unstructured response may serve as checks of the reliability of theinformation provided.
Meyburg and Metcalf II-H / 13
The complexity of the topic is reflected, in part, by a large body of literature dealing withopinion and attitude surveys, and question formulation in those types of surveys.
Stated response (preference) questions are a special case of attitude and opinionquestions. They represent a multidimensional scaling technique, most typically used intravel choice situations. The analyst presents the respondent with a series of hypotheticalcombinations of attribute levels, and asks the respondent to rank them in order ofpreference, assign a rating to each combination, or choose between paired comparisons fora series of two-way choices. Of course, another option is to simply ask for the top choicefrom among the alternatives presented to the respondent.
When hypothetical questions are used, it is imperative to include cross-referencingto these questions, in order to determine how committed respondents are to their answers,and also to show consistency in preferences and attitudes. Another technique for makingthe answers to hypothetical questions useful is to include meaningful trade-off questionsthat test respondents’ preferences in view of a sacrifice or concession to be made elsewhere.
One typical pitfall of this category of questions, aside from the conceptualdrawback inherent in the fact that they pose hypothetical situations, is that, frequently, toomany combinations and choices are presented to the respondent, who simply finds itimpossible to make meaningful assessments that will subsequently allow the analyst todraw conclusions about true preferences for attributes or attribute combinations pertainingto travel choices. Also, while much work has been done toward developing sophisticatedexperimental designs, a perennial problem remains the quality of the questions, so that theyremain understandable to the respondent. Bradley and Daly (22), among others, haveaddressed this issue in a systematic manner.
Answer Formats
There are three main ways to format the answers to questions: open-ended, field-coded,and closed. Many questionnaires effectively utilize all of these formats, but it is importantto understand the advantages and disadvantages of each format.
Open-ended questions are those that allow respondents to write in or speak theiranswer freely, without having to choose a predetermined response category. Open-endedquestions are useful for allowing the respondent to express opinions, attitudes, orpreferences, and they are appropriate in cases where the response categories do not fit intoa concise pattern or set that can be anticipated by the survey designer. Hence, they can beused effectively in pretests designed to develop proper response categories for the mainsurvey. While open questions are likely to reveal interesting facts about and opinions ofthe respondent, they can constitute a real challenge for the analyst with respect to theircoding and evaluation. Furthermore, the quality, detail, and length of answers are veryhighly correlated with the respondent’s literacy level and propensity to give rather long-winded answers. Hence, open questions should be used with discretion and caution. Onthe other hand, if an open question has the effect of making the respondent feel that his/heropinion is of importance, the existence of such a question can have a constructive effect onthe quality and completeness of the remainder of the response.
Even in surveys where open questions are not deemed necessary or appropriate, itis important to have a “Comments” space for respondents (both in personal and phoneinterviews and in self-administered questionnaires), for some of the same reasons that wereidentified in the preceding paragraph.
TRB Transportation Research Circular E-C008: Transport Surveys: Raising the Standard II-H / 14
Field-coded questions pertain to interviewer-administered surveys. In this case, thequestion appears to be an open-ended question to the respondent, while the interviewerextracts the essential information from the “open answer” to record it into predeterminedcategories. While this procedure has the obvious advantage that it reduces the need forpost facto processing, it clearly is subject to potential bias introduced by the interviewer,who determines the appropriate answer category. The advantages, of course, are the sameas those identified for open questions in self-administered instruments.
Closed questions, which provide predetermined response categories, are and shouldbe the most frequently used type of question, because they leave the decision up to therespondent as to where an answer fits. They record factual information, as the respondentsees it. At least two important guidelines need to be observed here. First, sufficientresponse categories need to be provided to ensure that the respondent is likely to find theappropriate answer. With the exception of “yes/no” questions, it may be nearly impossibleto identify all possible answers to closed questions. Therefore, including “Other, pleasespecify” in most closed questions is a good idea. This is particularly important so as toavoid forcing a respondent to choose an answer that is not at all appropriate. Second, greatcare must be taken to formulate closed questions in as unambiguous a manner as possible,in order to avoid respondent frustration and bias.
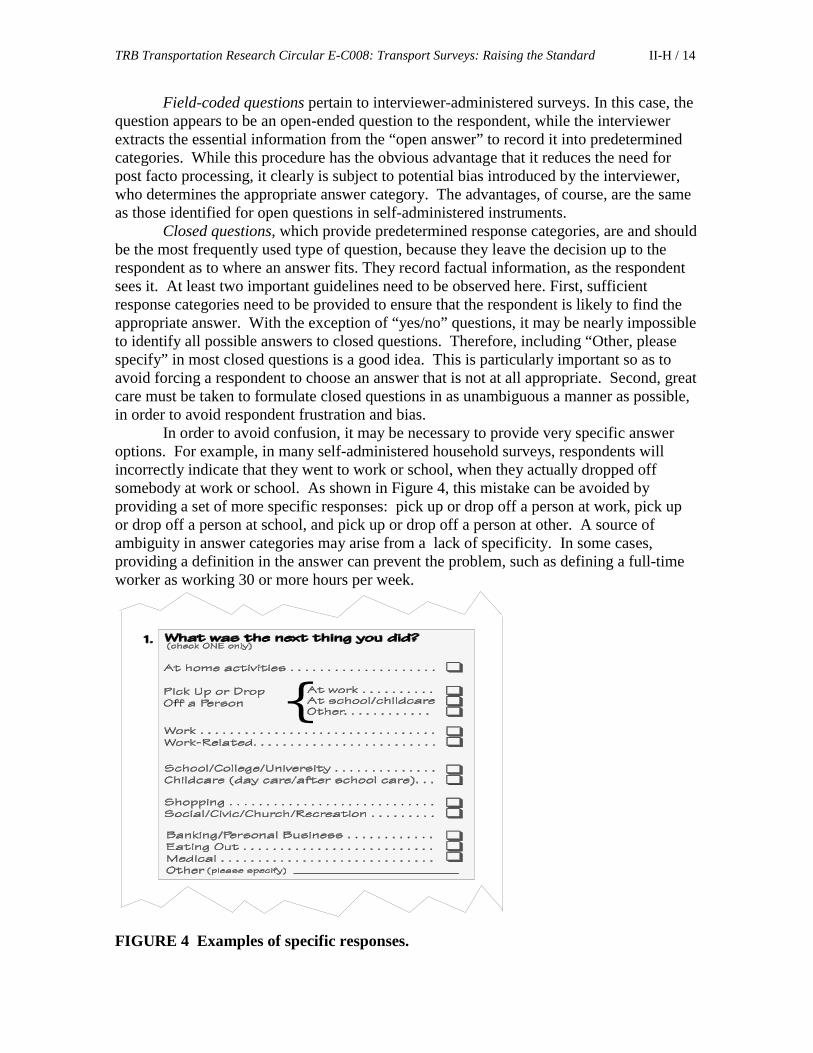
In order to avoid confusion, it may be necessary to provide very specific answeroptions. For example, in many self-administered household surveys, respondents willincorrectly indicate that they went to work or school, when they actually dropped offsomebody at work or school. As shown in Figure 4, this mistake can be avoided byproviding a set of more specific responses: pick up or drop off a person at work, pick upor drop off a person at school, and pick up or drop off a person at other. A source ofambiguity in answer categories may arise from a lack of specificity. In some cases,providing a definition in the answer can prevent the problem, such as defining a full-timeworker as working 30 or more hours per week.
FIGURE 4 Examples of specific responses.
Meyburg and Metcalf II-H / 15
The order in which the answer options are provided can be critical in obtaining thecorrect responses, as well. In general, the broader and more-common answer categoriesshould appear near the end of the list, and the more-specific and less-common ones nearthe top, since the respondent is likely to stop checking a list if an apparently applicableanswer has been encountered. An example of this is provided in Figure 4, where “at work”appears after “pick up or drop off a person”; while the “pick up or drop off” answer is aless common activity, listing it first may prevent many respondents from checking the boxfor “at work”, before they get to the “pick up or drop off” option. Similarly, since respondentsfrequently will not think of them as modes of transportation, it is prudent to list less-frequent modes like walk and bicycle first, so that respondents do not ignore or miss them.
Other Items for Consideration
This section discusses a number of items that can be problematic or should be seriouslyconsidered during the survey development process. Among these are:
• relevance of the questions,• language problems,• vague words,• loaded and leading questions, and• sensitive questions.
It is important to consider the relevance of the questions from the respondents’point of view, as well as in relation to the survey purpose. All too often, the analyst, beingdeeply involved in the survey purpose and survey design, loses track of the fact that therespondent typically perceives the survey in a totally different frame of mind. A relatedissue is that of the reasonableness of a question, i.e., can we reasonably expect therespondent to answer either in fact or in terms of an opinion, attitude, or preference?
One effective technique for testing the adequacy of the instrument design withrespect to content, length, and relevance of the questions was proposed by Oppenheim(17), namely by running through the survey stages in the reverse order. This meansconducting tabulations and analyses with the expected, albeit hypothetical, data derivedfrom the survey. This test tells, among other things, which questions are essential, andwhich are unnecessary.
If the survey sample consists of a specific sociodemographic segment of thepopulation, the wording should be adjusted to take the population characteristics intoaccount. This guideline pertains especially to situations where the respondents’ nativelanguage is most likely not the national language. If travel characteristics and travelbehavior of specific nonnative speakers are the subject of the investigation, then the use ofthe appropriate foreign language is obviously mandatory (e.g., in the case of increasedtransit use in New York City, attributable to a recent immigration wave from the formerSoviet Union.) Of course, the principles of question wording discussed here are pertinentto any language environment.
Stopher et al. (18) developed a creative onboard survey design solution in order toovercome previously experienced very low response rates due to rider disinterest andsevere language barriers in Dade County (Florida) bus ridership surveys. It is an interestingexample of successful data collection under difficult conditions, where the survey designwas instrumental for the success in generating a data set of sufficient size and quality to
TRB Transportation Research Circular E-C008: Transport Surveys: Raising the Standard II-H / 16
make it useful to the transit operator for evaluating service improvements. The languageproblem was overcome by virtually eliminating the need for verbal or writtencommunications through the use of color-coded cards, whose distribution and collectionwere carefully monitored to provide the correct trip counts along the selected bus routes.Pictorials, prominently displayed on the bus, “explained” the card distribution andcollection procedure to the riders. The problem of cooperation was resolved by making thewhole process simple, and by the survey staff’s maintaining fairly tightly controlled surveyconditions.
Another aspect of question ambiguity is the use of vague words; for example, theterm “usual” conjures up different interpretations in different respondents. In general, it isadvisable to avoid such terms, and ask instead about an actual event or activity for aspecific day. Otherwise, the analyst will be put into the impossible position of trying toevaluate statistically what the “usual” event or behavior is. Also, when asking aboutactivities during a certain time period, it is important to specify exactly the beginning andend of such a period (e.g., avoid using references like “last week”), since the beginning andend are subject to an individual’s interpretation.
Even survey designer neophytes will know not to use loaded questions (i.e., thosethat appear to solicit potentially embarrassing information, an example being “What wasthe purpose of your trip to the hotel?”). The appropriate strategy is to use filter questions inorder to determine whether the next questions to be asked are actually relevant to therespondent.
Also to be avoided are leading questions. Leading questions are those that tend toinfluence the respondent (intentionally or not) in the direction of certain answers. Forinstance, if examples of possible answers are provided, the respondent will more likelydraw an answer from the list of options provided, rather than bother to think of others thatwere not mentioned. Another example is the case where the question asked of therespondent implies that a certain answer will make the respondent appear in a better light.Richardson et al. (1) provide an extensive list of examples and discussions covering both“loaded” and “leading” questions.
The problem, however, is to recognize when a question has the undesirableattribute of being “loaded” or “leading”. Clearly, the analyst does not intend to formulatesuch questions, but it happens nevertheless. This is particularly true for leading questions,the answers to which will introduce serious bias, since they are likely to be consistentacross respondents. There is a particular danger of leading respondents in interviewer-administered surveys, in the form of interviewer gestures and intonation, if the intervieweris not trained sufficiently to avoid such situations. In particular, when opinions and attitudesare solicited, violation of question neutrality can be devastating to the survey results.
A commonly accepted principle is to put more sensitive questions (e.g., aboutincome) near the end of the instrument or interview, in the hopes that by that time,sufficient commitment to the survey topic has been generated to have increased the“comfort level” in the respondent to such a degree that it is easier and more natural toprovide answers to those questions. One strategy that has been used to reduce nonresponseto the question of income in a household travel survey is to ask the question twice, onceduring recruitment, and then again in the household form sent to the respondent. Stopherand Metcalf used this strategy and created a new income variable by combining theresponses from both questions when one of them was not answered. When two differentresponses were received, they used the second answer, on the assumption that this answer
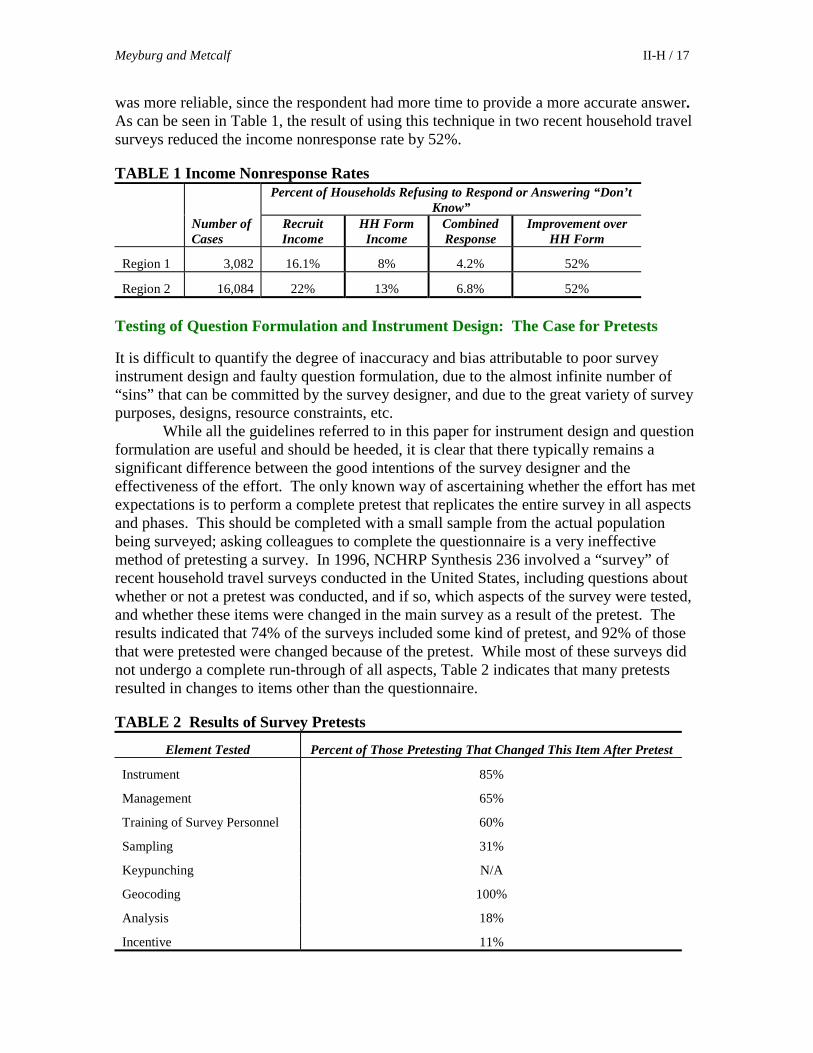
Meyburg and Metcalf II-H / 17
was more reliable, since the respondent had more time to provide a more accurate answer.As can be seen in Table 1, the result of using this technique in two recent household travelsurveys reduced the income nonresponse rate by 52%.
TABLE 1 Income Nonresponse RatesPercent of Households Refusing to Respond or Answering “Don’t
Know”Number ofCases
RecruitIncome
HH FormIncome
CombinedResponse
Improvement overHH Form
Region 1 3,082 16.1% 8% 4.2% 52%
Region 2 16,084 22% 13% 6.8% 52%
Testing of Question Formulation and Instrument Design: The Case for Pretests
It is difficult to quantify the degree of inaccuracy and bias attributable to poor surveyinstrument design and faulty question formulation, due to the almost infinite number of“sins” that can be committed by the survey designer, and due to the great variety of surveypurposes, designs, resource constraints, etc.
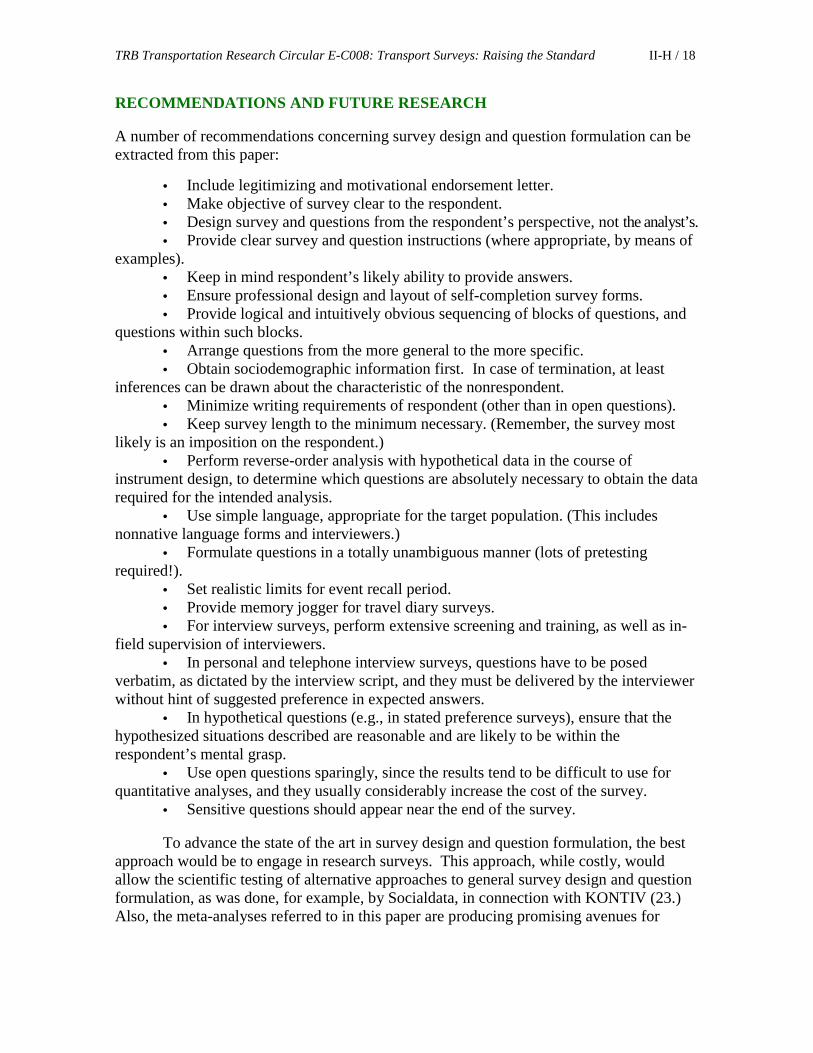
While all the guidelines referred to in this paper for instrument design and questionformulation are useful and should be heeded, it is clear that there typically remains asignificant difference between the good intentions of the survey designer and theeffectiveness of the effort. The only known way of ascertaining whether the effort has metexpectations is to perform a complete pretest that replicates the entire survey in all aspectsand phases. This should be completed with a small sample from the actual populationbeing surveyed; asking colleagues to complete the questionnaire is a very ineffectivemethod of pretesting a survey. In 1996, NCHRP Synthesis 236 involved a “survey” ofrecent household travel surveys conducted in the United States, including questions aboutwhether or not a pretest was conducted, and if so, which aspects of the survey were tested,and whether these items were changed in the main survey as a result of the pretest. Theresults indicated that 74% of the surveys included some kind of pretest, and 92% of thosethat were pretested were changed because of the pretest. While most of these surveys didnot undergo a complete run-through of all aspects, Table 2 indicates that many pretestsresulted in changes to items other than the questionnaire.
TABLE 2 Results of Survey Pretests
Element Tested Percent of Those Pretesting That Changed This Item After Pretest
Instrument 85%
Management 65%
Training of Survey Personnel 60%
Sampling 31%
Keypunching N/A
Geocoding 100%
Analysis 18%
Incentive 11%
TRB Transportation Research Circular E-C008: Transport Surveys: Raising the Standard II-H / 18
RECOMMENDATIONS AND FUTURE RESEARCH
A number of recommendations concerning survey design and question formulation can beextracted from this paper:
• Include legitimizing and motivational endorsement letter.• Make objective of survey clear to the respondent.• Design survey and questions from the respondent’s perspective, not the analyst’s.• Provide clear survey and question instructions (where appropriate, by means of
examples).• Keep in mind respondent’s likely ability to provide answers.• Ensure professional design and layout of self-completion survey forms.• Provide logical and intuitively obvious sequencing of blocks of questions, and
questions within such blocks.• Arrange questions from the more general to the more specific.• Obtain sociodemographic information first. In case of termination, at least
inferences can be drawn about the characteristic of the nonrespondent.• Minimize writing requirements of respondent (other than in open questions).• Keep survey length to the minimum necessary. (Remember, the survey most
likely is an imposition on the respondent.)• Perform reverse-order analysis with hypothetical data in the course of
instrument design, to determine which questions are absolutely necessary to obtain the datarequired for the intended analysis.
• Use simple language, appropriate for the target population. (This includesnonnative language forms and interviewers.)
• Formulate questions in a totally unambiguous manner (lots of pretestingrequired!).
• Set realistic limits for event recall period.• Provide memory jogger for travel diary surveys.• For interview surveys, perform extensive screening and training, as well as in-
field supervision of interviewers.• In personal and telephone interview surveys, questions have to be posed
verbatim, as dictated by the interview script, and they must be delivered by the interviewerwithout hint of suggested preference in expected answers.
• In hypothetical questions (e.g., in stated preference surveys), ensure that thehypothesized situations described are reasonable and are likely to be within therespondent’s mental grasp.
• Use open questions sparingly, since the results tend to be difficult to use forquantitative analyses, and they usually considerably increase the cost of the survey.
• Sensitive questions should appear near the end of the survey.
To advance the state of the art in survey design and question formulation, the bestapproach would be to engage in research surveys. This approach, while costly, wouldallow the scientific testing of alternative approaches to general survey design and questionformulation, as was done, for example, by Socialdata, in connection with KONTIV (23.)Also, the meta-analyses referred to in this paper are producing promising avenues for
Meyburg and Metcalf II-H / 19
advancing the evaluation and understanding of cognitive processes involved in generatingsurvey responses.
However, since research surveys are expensive, and furthermore, typically do nothave immediate payoff for mission-oriented (transportation and planning) agencies,sponsorship tends to be difficult to obtain. Yet the long-term benefits in terms of obtainingdata of greater validity and reliability, as a consequence of better response rates (quantity)and better quality (accuracy), would be significant.
In the meantime, the use of best-practice information should be increasedsubstantially. A very significant body of knowledge and experience about travel surveyshas been accumulated from around the globe over the last 15 to 20 years. And, asmentioned before, several explicit state-of-the-practice documents are available.
However, it can be observed time and again that the average transportation andplanning agency staff member is frequently unaware of the many pitfalls of designingsurveys and survey instruments, while remaining somewhat oblivious to the existence ofhelpful state-of-the-practice documents. A lot of publicity work remains to be done by thetravel survey research community to bring current knowledge and experience to a wideraudience.
ACKNOWLEDGMENT
The authors gratefully acknowledge the constructive comments provided by Mr.Ambrosius Baanders, Dr. Peter Jones, and Dr. Nelly Kalfs, as well as by anonymousreviewers, on the earlier drafts of this paper.
REFERENCES
1. Richardson, A.R., E.S. Ampt, and A.H. Meyburg. Survey Methods for TransportPlanning, Eucalyptus Press, Melbourne, Australia, 1995.
2. Scherpenzeel, A.C., and W.E. Saris. “The Validity and Reliability of SurveyQuestions: A Meta-Analysis of MTMM Studies.” Sociological Methods and Research25(3), 1997, pp. 341-384.
3. Andrews, F.M. “Construct Validity and Error Components in Survey Measures: AStructural Modeling Approach.” Public Opinion Quarterly 48, 1984, pp. 409-422.
4. Rogers, W.L., F.M. Andrews, and A.R. Herzog. “Quality of Survey Measures: AStructural Modeling Approach.” Journal of Official Statistics 8, 1992, pp. 251-275.
5. Költringer, R. “Measurement Quality in Austrian Personal Interview Surveys.” In: TheMultitrait-Multimethod Approach to Evaluate Measurement Instruments, Chapter 12,edited by W.E. Saris and A. Münnich. Budapest, Hungary, Eötvös University Press,1995.
6. Scherpenzeel, A.C., and W.E. Saris. “The Evaluation of Measurement Instruments byMeta-Analysis of Multitrait-Multimethod Studies.” Bulletin de MethodologieSociologique 39, 1993, pp. 3-19.
7. Alwin, D.F., and J.A. Krosnick. “The Reliability of Survey Attitude Measurement.”Sociological Methods and Research 20(1), 1991, pp. 139-181.
8. Lord, F., and M.R. Novick. Statistical Theories of Mental Test Scores. Addison-Wesley, Reading, MA, 1968.

TRB Transportation Research Circular E-C008: Transport Surveys: Raising the Standard II-H / 20
9. Tourangeau, R., and K.A. Rasinski. “Cognitive Processes Underlying Context Effectsin Attitude Measurement.” Psychological Bulletin 103, 1988, pp. 299-314.
10. Schwarz, N., F. Strack, H.J. Hippler, and G. Bishop. “The Impact of AdministrationMode on Response Effects in Survey Measurement.” Applied Cognitive Psychology 5,1981, pp. 193-212.
11. Schuman, H., and S. Presser. Questions and Answers in Attitude Surveys:Experiments on Question Form, Wording and Context. New York, Academic Press,1981.
12. Saris, W.E., and F.M. Andrews. “Evaluation of Measurement Instruments Using aStructural Modeling Approach.” In: P.R. Biemer et al. (eds.), Measurement Errors inSurveys, Wiley Interscience, New York, 1991, Chapter 28, pp. 574-597.
13. U.S. Department of Transportation and U.S. Environmental Protection Agency.“Travel Survey Manual” (Travel Model Improvement Program), prepared byCambridge Systematics, Inc., Washington, D.C., July 1996.
14. National Opinion Research Corporation (NORC). “Reducing Nonresponse.”Unpublished preliminary draft chapter of report on travel survey nonresponseproblems. Sponsored by US DOT, FHWA, Office Highway Information Management,March 1997.
15. Heberlein, T.A., and R. Baumgartner. “Factors affecting response rates to mailedquestionnaires: A quantitative analysis of the published literature.” American SociologicalReview 43, 1978, pp. 447-462.
16. Yammarino, F.J., S.J. Skinner, and T.L. Childers. “Understanding mail survey responsebehavior.” Public Opinion Quarterly 55, 1991, pp. 613-639.
17. Oppenheim, A.N. Questionnaire Design, Interviewing and Attitude Measurement.Pinter Publishers, London, 1992.
18. Stopher, P.R., L. Shillito, D.T. Grober, and H.M.A. Stopher. “On-Board Bus Surveys: NoQuestions Asked.” Transportation Research Record 1085, National Research Council,Washington, D.C., 1986, pp. 50-57.
19. Clarke, M.I., M.C. Dix, and P.M. Jones. “Error and Uncertainty in Travel Surveys.”Transportation 10, 2, 1981, pp. 105-126.
20. Meyburg, A.H., and W. Brög. “Validity Problems in Empirical Analyses of Non-HomeActivity Patterns.” Transportation Research Record 807, National Research Council,Washington, D.C., 1981, pp. 46-51.
21. Stopher, P.R., and Sheskin. “A Method for Determining and Reducing NonresponseBias.” Transportation Research Record 886, National Research Council, Washington,D.C., 1982, pp. 35-41.
22. Bradley, M., and A. Daly. “Use of the Logit Scaling Approach to Test for Rank-Orderand Fatigue Effects in Stated Preference Data.” Transportation 21, 2, 1994, pp. 167-184.
23. Brög, W., K. Fallast, H. Katteler, G. Sammer, and B. Schwertner. “Selected Results ofa Standardized Survey Instrument for Large-Scale Travel Surveys in Several EuropeanCountries.” In E.S. Ampt, A.J. Richardson, and W. Brög (eds.), New Survey Methodsin Transport. VNU Science Press: Utrecht, The Netherlands, 1985, pp. 173-192.
24. NCHRP Synthesis of Highway Practice 236. “Methods for Household Travel Surveys”(prepared by Peter R. Stopher and Helen M.A. Metcalf). Transportation ResearchBoard, National Research Council, Washington, D.C., 1996.
Meyburg and Metcalf II-H / 21
25. Stecher, C.C., S. Bricka, and L. Goldenberg. “Travel Behavior Survey Data CollectionInstruments.” Conference Proceedings 10, Conference on Household Travel Surveys:New Concepts and Research Needs (Irvine, CA, March 12-15, 1995). TransportationResearch Board, National Research Council, Washington, D.C., 1996, pp. 154-169.
26. Bonsall, P., M. Wardham, C. Nash, and P. Hopkinson. “Development of a SurveyInstrument to Measure Subjective Valuations of Non-Use Benefits of Local PublicTransport Services.” In: E.S. Ampt, A.R. Richardson, and A.H. Meyburg (eds.),Selected Readings in Transport Survey Methodology. Proceedings of the 3rdInternational Conference on Survey Methods in Transportation (Washington, D.C.,January 5-7, 1990). Eucalyptus Press, Melbourne, Australia, 1992, pp. 71-87.
27. Brög, W., A.H. Meyburg, and M.J. Wermuth. “Development of Survey Instruments Suitablefor Determining Non-Home Activity Patterns.” Transportation Research Record 944, NationalResearch Council, Washington, D.C., 1983, pp. 1-12.
II-H / 22
Workshop Summary
Ambrosius BaandersTransport Research Centre AVV
Netherlands Ministry of Transport, Public Works and Water Management
Stephen ArrowsmithStatistics Canada, Ottawa, Ontario, Canada
INTRODUCTION
he act of asking respondents about their attitudes and behavior can influence both ofthese; as in physics, the observer can influence the subject of the research. In addition,
the answers obtained can be influenced by the precise wording of the questions, and thesequencing and general context in which they are asked. The medium of communicationcan have a more general influence on the quality of response. The aim of workshop 12 onquestionnaire design was to identify and address these issues and make recommendationson best practice, giving an indication, where possible, of the size and direction of anybiases, and advice on how to reduce such problems.
The workshop discussion started from the resource paper by A. Meyburg (1997),and its presentation by the discussant H. Metcalf. The participants felt that many of thetechniques that should be implemented to avoid problems when designing a questionnaireare well-known in the transport research profession and are well-documented in theliterature. The resource paper lists many of those. But the problem, it was felt, is that thereis a big difference between the state of the art and the state of the practice. The problemwith the state of the practice is indicated in the preface of Fowler’s book, Improving SurveyQuestions: Design and Evaluation, when he opens by stating:
I believe that the design and evaluation of survey questions is themost fertile current methodological area for improving surveyresearch. Poor question design is pervasive, and improving questiondesign is one of the easiest, most cost-effective steps that can be takento improve the quality of survey data (1995, p. vii).
To assist in efforts to enhance the state of the practice, the workshop produced anumber of guidelines for designing transport survey questionnaires. In its discussions, theworkshop touched on a number of subjects where it was felt that more research is needed.In this way, it produced a research agenda. Finally, the workshop came up with a numberof recommendations on how to organise the further development of research onquestionnaire design.
The workshop noted that many different types of questionnaires are found intransport research. They may differ by the way the respondent is approached, be it apersonal interview, a telephone interview or a written (self-completion) questionnaire,handed out or sent through the mail. The written questionnaires may either be mailed backor reviewed in a later telephone interview. The respondent may be interviewed at home orbe intercepted during a trip. It is also possible that commercial enterprises and theiremployees, such as freight shippers or truck drivers, could be respondents. In sum, almost
T
Baanders and Arrowsmith II-H / 23
anyone could be a respondent to a transportation survey, contingent on the objectives ofthe survey.
This report deals separately with each of the items in terms of potential guidelines,future research and organizational recommendations. Within each of the item components,there is no delineation made by questionnaire type, unless there is a requirement forseparation. We have assumed that many of the criteria are the same, as was the case duringthe discussions.
GUIDELINES
The guidelines identified below reflect the items that were discussed during the workshop.As workshop discussions tend to move around, the items are not listed in any particularsequence.
PREPARATION TIME, TESTS, AND PILOTS
The big difference between the state of the art and the state of the practice is caused to alarge extent by client ignorance, poor survey practices, timelines and cost considerations.
Many clients of transport surveys are unaware of the pitfalls of questionnairedesign, and, often, the time between the decision by the client to go ahead and the actualstart of the interviewing phase is too short to properly design the survey instruments. Thismay be because the time at which the respondents have to be interviewed is constrained,e.g., by the wish to use a “shoulder period” in order to exclude unwanted seasonal effects.In light of this problem, the workshop felt that the questionnaire designer should convincethe client that it is absolutely necessary to think about the design, and to undertakecognitive testing, some combination of field-testing, and/or a full “dress rehearsal” pilot.This process will enable the careful checking of the design, and allow time required toincorporate the ensuing modifications. Although this may sound trivial, the workshopparticipants knew of many instances where this was not done properly, resulting indownstream data problems either prior to or during the analysis phase of the project. Thispoint cannot be overemphasized.
While there are many important elements to be tested in pretests, the ability andaccuracy with which the respondents are able to provide answers to questions may be themost important. If people cannot provide an answer, cannot provide an accurate answer, orhave various interpretations of a question, the data are of little or no use. It is alwayscritical to ask, do we know what we are measuring, and are we measuring what we thinkwe are measuring?
In the case of trips, it is possible that the feasible recall period increases when thetrip in question is made less frequently (becomes more of a special event in the perceptionof the respondent). For daily mobility, the recall period is very short, and therefore, the useof trip diaries/logs is recommended.
It was pointed out that, in some cases, the above considerations may mean that thedesigner will have to say “no” to the client, because there is not enough time to prepare thesurvey properly (there may also be ethical reasons to do this). This may be very difficultwhen the survey practioner is in a competitive situation, but it may be necessary toconvince the client that proper preparation is absolutely necessary. The old adage “garbagein - garbage out” is also true here.
TRB Transportation Research Circular E-C008: Transport Surveys: Raising the Standard II-H / 24
Language
Some societies have always known a mix of languages, while in other societies, thecoexistence of different languages is a fairly recent phenomenon, e.g., throughimmigration. But even in a country where only one language is spoken, the problem ofdifferent languages will arise in such surveys as those monitoring international airtravellers. Therefore, it is incumbent on the questionnaire design team to take into accountlanguage issues that may be pertinent to the survey.
The nature of languages is such that the problem of language should be handledvery carefully. A translation that is correct in a general context does not always convey thesame meaning when used in describing travel behavior. An example of how complicatedthis can be was given by P. van der Reis, describing travel questionnaires in South Africa(1997). The English word “convenient”, which translates into “gerieflik” in Afrikaans andinto “lungile” in Xhosa, was found to have a totally different meaning for mostrespondents in each of the three languages when used in the context of travel to and fromwork (“close to work”, “close to home” and “uncrowded”, respectively) . A good way tocheck for such problems is to have the questionnaire text translated back into the originallanguage, to see if it is the same.
In a number of cases, pictorials are used to overcome the problems of havingdifferent languages in the group to be surveyed. However, even in these cases, verificationis essential to ensure that the pictorials convey the intended meaning. In another examplefrom South Africa, it was noted that certain African cultures understand pictures in a waytotally different from European cultures.
Another important element in questionnaire wording is to use the language of therespondent. In this context, “language”should be taken in a broad sense. With anylanguage, there are groups of people who think and speak in a different way, and whoattach different meanings to the same words. The”language” of truck drivers is an exampleof this, and in a survey of truck drivers, the peculiarities of this “language” should berespected. In the same way, one should avoid the typical jargon used in transport research,which will not be understood by the average member of the public, given that most peopleare not very familiar with transport issues.
Reverse Analysis and Respondent Burden
A common experience in the workshop was that, often, some of the questions asked duringthe survey were not used later in the analysis. If you know in advance that a certainquestion can or will not be used in the analysis (due to low levels of incidence, hence alack of reliability, or because, at the end of the day, the variable in question is just not thatimportant), then the question should not be asked. By not asking the question, respondentburden is reduced. A way to do this, as was suggested in the resource paper, is by firstdoing a “reverse analysis”, i.e., do the analysis first with imaginary data. This will showwhich variables are really needed, and only these should be used when designing thequestionnaire. Another approach is to have those doing the analysis create a set of tableshells (based on a set of hypotheses) to determine where data are required. This, of course,takes time at the preparation stage of the survey, but ultimately saves time later.
Participants stressed that a good questionnaire design should minimise the burdenplaced on the respondent in every respect. The length of the questionnaire in terms of time
Baanders and Arrowsmith II-H / 25
to complete, the thickness of the document in terms of the perceived burden forself-completed forms, and the complexity of the questions in terms of difficulty tocomplete are all important considerations. But as workshop 6 dealt specifically withrespondent burden (Muranami, 1997), the other aspects of burden were not discussedfurther.
Questionnaire Typography and Layout
The use of clearly readable letters (font size and font type) in written questionnaires is veryimportant in the experience of the participants. In the case of the Latin alphabet, questionsshould be typed in lowercase letters, because that makes reading easier. The ease ofreading should be tested in the pilots.
Elaborate instructions make a questionnaire (especially a written one) look morecomplicated. They should be kept to a minimum. Definitions and explanations of whatexactly is meant should be incorporated into the question itself as much as possible, orshould precede the question.
As geocoding is important in many surveys, sufficient space should be provided onthe forms to write all the necessary details; this is especially the case for self-completedquestionnaires. Items such as street name and number, building or landmark should beasked for explicitly. The name of the municipality needs extra care in the case of largeurban areas, where the municipal boundaries are often not obvious to many people.
Using recycled paper for the written questionnaires, and indicating that by use ofthe “recycling” logo, was found to increase the response rate in some countries.
A Research Agenda
As mentioned previously, the workshop participants felt that many clients of transportsurveys are unaware of the pitfalls of questionnaire design, and the relationship to finaloutput. Moreover, their concerns are immediate and, typically, problem-centered.Consequently, they are typically not willing to fund research on questionnaire design anddevelopment as part of the research projects they commission. As a consequence,innovation in questionnaire design was found to be slow.
In the course of the workshop discussion, there were points where participants feltthere was insufficient knowledge to formulate a guideline, and it was therefore suggestedthat the item in question be considered for further research. Identified below are the items,which could constitute a kind of research agenda:
Improving the Effectiveness of Questionnaires
Improving the effectiveness of questionnaires was thought to be possible by:
• Finding ways to reduce repetition in both written and oral questionnaires (e.g.,when respondents are traveling together, or when a respondent makes the same trip everyday during a multiday survey);
• Developing pictograms to be used instead of words in self-completionquestionnaires where literacy or language differences are a problem (but the understandingof the pictograms should be checked;
TRB Transportation Research Circular E-C008: Transport Surveys: Raising the Standard II-H / 26
• Increasing our understanding of the effects of layout and colour in the formsused for self-completion questionnaires;
• Testing the differences in quality and response rates through an examination ofthe effects of sending one long questionnaire or holding one long oral interview (face-to-face or by telephone) versus multiple shorter questionnaires or interviews;
• Finding ways to overcome the problem of the underreporting of trips (payingspecial attention to the propensity of respondents, under some circumstances, to report thatthey stayed at home when they did make some trips);
• Finding ways to reduce the impact of normative behavior on respondentanswers;
• Undertaking research into the recall periods for long distance trips (which arenot frequent enough to be surveyed using a trip diary);
• Finding ways to overcome the dilemma between open-ended responses andprecoded response categories; identifying the types of questions where one approach isbetter than the other;
• Conducting more tests on the use of instructions for the respondents, both inself-completion and in oral questionnaires; and
• Undertaking more comparison tests between asking all questions throughself-completion forms sent by mail, or using a hybrid approach where some of thequestions are asked by telephone and other questions are asked on a mailed self-completedform.
With regard to self-completion trip diaries, the discussion was whether columns orrows should be used for the different attributes that have to be recorded for each trip.Another question was whether a trip diary should preferably be administered in bookletform, or as separate sheets that form a log upon completion.
The dilemma between open-ended responses and precoded responses is that thelatter require less thinking from the respondent and thus are easier to give, but they directthe respondent toward the preestablished alternatives. Open-ended responses are morelikely to generate answers that the designer did not think of beforehand, thus giving moreinsight into the respondent’s behavior. However, the coding of answers to open questionsrequires more skill from the person doing the coding. Another problem with precodedanswers is the choice of the number of answer alternatives. If the number is small, therespondents may not find an answer that applies to their situation. If the number of choicesis large, the respondents may find it difficult to make a choice. In any case, the answeralternatives should be worded very carefully to ensure that categories are mutuallyexclusive. These problems are particularly relevant for self-completion questionnaires.
In the case of oral interviews, a possible solution is that the interviewer poses anopen question, and interprets the answer by choosing from a set of precoded answers. Thisrequires special skill from the interviewer, but with proper training, this is not consideredto be an insurmountable problem. The issue of combining precoded and open- endedresponse categories was discussed by the workshop, with thoughts directed toward thecreation of a decision-tree approach to asking the questions. This is an area for furtherresearch, both conceptually and operationally.
Baanders and Arrowsmith II-H / 27
Trip Stage Information and the Use of GPS
More research is needed, it was felt, to find the best way to collect data on the differentstages of a trip or journey (e.g., for time information, how much rounding off should beallowed?), and to distinguish changes of mode. In this context, experiments usinggeo-positioning systems (GPS) were noted. This was seen as one possible way forward,but other methods should also be examined.
Better definitions are needed for “trip” and “mode”, to describe a walking trip, andto describe working from home (teleworking).
The Linking Between CATI and GIS
For oral interviews, computer-aided interview techniques (CATI, etc.) were an innovationwell-appreciated by the participants. It was suggested that by linking CATI software withgeographic information systems (GIS), the checking for mistakes in addresses given byrespondents could be much improved in some situations.
Use the Knowledge from Other Behavioral Sciences
Despite the fact that interviewing of respondents is done in many behavioral sciences, theparticipants felt that transport analysts do not sufficiently use the experience from otherfields. It was recommended that a thorough literature review be conducted into the relevantexperience from other fields, notably, cognitive psychology.
SOME RECOMMENDATIONS
The workshop came up with two recommendations, which require the initiative to be takenby an overarching organisation. It is hoped that the organization that was recommended byWorkshop 8, on practitioner’s needs (Liss, 1997), will be able to take such initiatives. Therecommendations are:
• Create a system or platform for the exchange of research methodology andexperience between those involved in questionnaire design.
• Develop a standardization of concepts for use in transport surveyquestionnaires.
• Develop a set of ISO norms for this.
REFERENCE
1. Floyd J. Fowler. Improving survey questions: design and evaluation. Applied SocialResearch Methods Series, Vol. 38. Sage Publications, Thousand Oaks, Calif., 1995.


![Instrument Question Answer[1].Doc.r](https://img.dokumen.tips/doc/110x75/577ce0901a28ab9e78b39b13/instrument-question-answer1docr.jpg)