Embed Size (px)
Citation preview

Queensland region construction
supply and demand analysis:
1995-2026 and quarterly
indicators to June 2018
A report for the
DEPARTMENT OF HOUSING AND PUBLIC WORKS
Prepared by the
National Institute of Economic and Industry Research (NIEIR)
ABN: 72 006 234 626
416 Queens Parade, Clifton Hill, Victoria, 3068
Telephone: (03) 9488 8444; Facsimile: (03) 9482 3262
Email: [email protected]
July 2016
PJB1197-QDH&PW-Annual report/QldDPW/2016/July
While the National Institute endeavours to provide reliable forecasts and believes the material is accurate it will not be liable for any claim by any party acting on such information.
Contents
Page no.
Executive summary i
1. Introduction 1
2. The economic outlook for the world, Australia and Queensland 2
2.1 The world economy 2 2.2 The Australian economic outlook 4 2.3 The Queensland economic outlook 11 2.4 Queensland housing affordability 15
3. Queensland construction activity in the Australian context 23
3.1 Queensland construction: The headline outcomes 23 3.2 Total construction: A comparison with last year’s Annual Report 23 3.3 The Queensland dwelling market 24 3.3.1 New dwelling construction 24 3.3.2 Other dwelling expenditure 24 3.3.3 Total Queensland private dwelling construction expenditures 24 3.3.4 Dwelling commencements 25 3.4 Non-residential building 28 3.4.1 Private non-residential building 28 3.4.2 Public non-residential building activity 30 3.4.3 Major Queensland non-residential building projects 31 3.4.4 Total non-residential building activity 32 3.5 Engineering construction 32 3.5.1 Engineering: The segment drivers 33 3.5.2 Mining investment and output 33 3.5.3 Engineering construction: The outlook 33 3.5.4 Major Queensland engineering projects 36 3.6 Queensland’s construction share of total Australian construction 38 3.7 The regional dimension 47 3.7.1 Brisbane 47 3.7.2 Gold Coast 50 3.7.3 Sunshine Coast 54 3.7.4 West Moreton 58 3.7.5 Wide Bay/Burnett 61 3.7.6 Darling Downs 65 3.7.7 South West 69 3.7.8 Fitzroy 72 3.7.9 Central West 76 3.7.10 Mackay 79 3.7.11 Northern 83 3.7.12 Far North 86 3.7.13 North West 90

Contents (cont.)
Page no.
4. Queensland construction: Resources, capacity and price pressures 103
4.1 Utilisation of capacity 103 4.2 Labour shortages 103 4.3 Queensland construction sector unemployment rates 103 4.4 Construction cost inflation 104
5. Quarterly profiles 111
Appendix A: Additional annual tables 120
Appendix B: Additional quarterly tables 133

List of tables
Page no.
E.1 Australia and Queensland gross product and construction activity indicators vi E.2 Annual growth and % contribution to construction activity by major construction segment vi E.3 Construction activity by Queensland region vii E.4 Share of total construction activity by Queensland region vii E.5 Total construction – average annual growth rates by Queensland regions viii E.6 Drivers of construction growth by Queensland region 2012-2023 viii E.7 Shortage of construction labour by Queensland region ix E.8 Queensland construction industry – real quarterly price growth at annual rates ix
2.1 Australian economy: Population and labour market 8 2.2 Australian economy: Formation of real GDP – Demand side 9 2.3 Australian economy: Commodity prices, terms of trade and the balance of payment 10 2.4 Formation of Queensland Gross State Product 12 2.5 Formation of Queensland population 14 2.6 Average annual population change by region 15 2.7 Housing affordability – Brisbane City 16 2.8 Housing affordability – Gold Coast 17 2.9 Housing affordability – West Moreton 17 2.10 Housing affordability – Logan Redland 18 2.11 Housing affordability – Moreton Bay 18 2.12 Housing affordability – Sunshine Coast 19 2.13 Housing affordability – Darling Downs South West 19 2.14 Housing affordability – Far North Torres 20 2.15 Housing affordability – Fitzroy Central West 20 2.16 Housing affordability – Mackay 21 2.17 Housing affordability – Townsville North West 21 2.18 Housing affordability – Wide Bay Burnett 22
3.1(a) Australia and Queensland construction industry activity 41 3.1(b) Australian construction industry activity 42 3.2(a) Queensland construction industry activity 43 3.2(b) Fiscal year construction activity growth rates – Queensland CVM construction activity indicators 44 3.2(c) Fiscal year construction activity indicator contribution to total Queensland construction growth rate 45 3.3 Annual growth and % contribution to Queensland construction activity by major construction segment 46 3.4 Sector contribution to Queensland engineering construction growth 46 3.5 Formation of construction in Brisbane 94 3.6 Formation of construction in Gold Coast 94 3.7 Formation of construction in Sunshine Coast 95 3.8 Formation of construction in West Moreton 95 3.9 Formation of construction in Wide Bay/Burnett 96

List of tables (cont’d)
Page no.
3.10 Formation of construction in Darling Downs 96 3.11 Formation of construction in South West 97 3.12 Formation of construction in Fitzroy 97 3.13 Formation of construction in Central West 98 3.14 Formation of construction in Mackay 98 3.15 Formation of construction in Northern 99 3.16 Formation of construction in Far North 99 3.17 Formation of construction in North West 100 3.18 Total construction: average annual growth rates by Queensland regions 101 3.19 Drivers of construction growth by Queensland region 2012-2023 101 3.20 Contribution of each region to Queensland construction growth 102
4.1 Unutilised capacity in Queensland construction sectors 106 4.2 Construction industry employment by Queensland regions 106 4.3 Queensland regional construction excess capacity utilisation rates 107 4.4 Queensland regional construction – excess demand 107 4.5 Queensland regional construction – labour shortage (+) or surplus (–) 108 4.6 Regional construction industry employment by segment 108
5.1 Value of work done: Residential new construction (including major additions) by region 112 5.2 Value of work done: Non-residential building by region 113 5.3 Value of work done: Residential other renovations by region 114 5.4 Value of work done: Residential building by region 115 5.5 Value of work done: Total engineering construction activity by region 116 5.6 Value of work done: Total construction activity by region – chain volume measure 2012-13 reference year ($ million) 117 5.7 Value of work done: Total construction activity by region – chain volume measures 2012-13 reference year – Qtr. 3 2014-15 = 100 118 5.8 Queensland construction industry 119 5.9 Shortage of construction labour by Queensland region 119
A.1 Total regional population 121 A.2 Share of regional population in total Queensland population 121 A.3(a) Total Queensland construction by region – share of residential activity in total regional activity 122 A.3(b) Total Queensland construction by region – share of non-residential activity in total regional activity 122 A.3(c) Total Queensland construction by region – share of total engineering activity in total regional activity 123 A.4 Share of public expenditures in regional total expenditures 123 A.5(a) Queensland construction by region – share of public residential expenditure in total regional residential expenditure 124 A.5(b) Queensland construction by region – share of public non-residential building expenditure in total regional non-residential building expenditure 124

List of tables (cont’d)
Page no.
A.5(c) Queensland construction by region – share of public engineering in total regional engineering expenditure (including Commonwealth) 125 A.6 Queensland regional construction value of work done: chain volume measure – Private housing expenditure on new construction and alterations (excluding other work done) 125 A.7 Queensland regional construction value of work done: chain volu28 measure – Public housing 126 A.8 Queensland regional construction value of work done: chain volume measure – Non-residential building private 126 A.9 Queensland regional construction value of work done: chain volume measure – Non-residential building public 127 A.10 Queensland regional construction value of work done: chain volume measure – Private engineering 127 A.11 Queensland regional construction value of work done: chain volume measure – Public engineering 128 A.12 Queensland regional construction value of work done: chain volume measure – Non-residential building total 128 A.13 Queensland regional construction value of work done: chain volume measure – Engineering total 129 A.14 Queensland regional construction value of work done: chain volume measure – Total residential (excluding other work done) 129 A.15 Queensland regional construction value of work done: chain volume measure – Total public sector engineering (including Commonwealth) 130 A.16 Queensland regional construction value of work done: chain volume measure – Private residential (other work done) 130 A.17 Queensland regional construction value of work done: chain volume measure – Total construction 131 A.18 Queensland regional construction value of work done: chain volume measure – Total construction expenditure share of State total 131 A.19 Queensland regional dwelling units commenced – Total residential units 132
B.1 Private dwelling value of work done: new construction (including alterations and additions) 134 B.2 Private dwelling: other value of work done 135 B.3 Private dwelling: total value of work done 136 B.4 Private non-residential building value of work done 137 B.5 Public non-residential building value of work done 138 B.6 Total non-residential building value of work done 139 B.7 Public sector engineering value of work done 140 B.8 Private sector engineering value of work done 141 B.9 Total engineering value of work done 142 B.10 Public dwelling value of work done 143 B.11 Total construction: value of work done 144 B.12 Total dwelling units commenced 145

List of tables (cont’d)
Page no.
C.1 New residential dwelling construction by LGA 148 C.2 Housing affordability by LGA: Average established dwelling price 151 C.3 Housing affordability by LGA: Average household income from labour market 153 C.4 Housing affordability by LGA: Ratio of average mortgage costs on established dwellings to average household catchment income 155 C.5 Housing affordability by LGA: Ratio of average mortgage costs on new dwellings to average household catchment income 157
List of figures
Page no.
E.1 Australian GDP and Queensland GSP v
2.1 World GDP growth rate 4 2.2 Australia’s international borrowing requirement 6 2.3 Australia – Real GDP growth rate 7
3.1 Queensland dwelling – new construction approvals ($ million) 25 3.2 Queensland dwelling – new construction approvals (number) 26 3.3 Queensland non-residential building approvals 26 3.4 Real Queensland established house prices 27 3.5 Queensland housing rental vacancy rate 27 3.6 Queensland housing approvals 28 3.7 Queensland – Private non-residential building work done and private non-residential building approvals 29 3.8 Excess demand for dwellings – Queensland 29 3.9 Queensland share of national population increase and national approvals 30 3.10 Queensland non-residential building approvals and work done 31 3.11 Queensland non-residential projects under construction, committed and under consideration 32 3.12 Queensland mining, LNG and metal ore investment 34 3.13 Queensland real mining output % rate of growth 35 3.14 Queensland mining investment 35 3.15 LNG expansion 36 3.16 Queensland engineering – work done 37 3.17 Queensland total engineering – work yet to be done 37 3.18 Queensland engineering projects under construction, committed and under consideration 38 3.19 Share of public engineering in total engineering 39 3.20 Share of Queensland construction industry in GSP 39 3.21 Queensland non-residential construction and private non-residential building expenditure share in GSP and GSP growth 40 3.22 Queensland regional construction value of work done – Brisbane 50 3.23 Queensland regional construction value of work done – Gold Coast 54 3.24 Queensland regional construction value of work done – Sunshine Coast 57 3.25 Queensland regional construction value of work done – West Moreton 61 3.26 Queensland regional construction value of work done – Wide Bay-Burnett 65 3.27 Queensland regional construction value of work done – Darling Downs 68 3.28 Queensland regional construction value of work done – South West 72 3.29 Queensland regional construction value of work done – Fitzroy 75 3.30 Queensland regional construction value of work done – Central West 79 3.31 Queensland regional construction value of work done – Mackay 82 3.32 Queensland regional construction value of work done – Northern 86 3.33 Queensland regional construction value of work done – Far North 90 3.34 Queensland regional construction value of work done – North West 93
4.1 Unused capacity in Queensland’s construction sector 104 4.2 Real construction costs versus labour shortage 105 4.3 Annual growth in Queensland construction employment 105

Queensland region construction supply and demand analysis: 1995-2026 and quarterly
indicators to June 2018 – June Annual Report 2016
i
Executive summary
A review of the core findings
In the 2016 fiscal year the Queensland economy is projected to be growing in the vicinity of 3% per annum. Despite a large subtraction from growth coming from the fall in mining investment this is being offset by the recovery in dwelling investment and the production effects of completed mining projects in general and LNG projects in particular. This state of affairs is projected to continue for at least another 18 months to two years.
As in the two previous annual reports, Australia’s economic growth is projected to be relatively strong over the 2016 to 2017 period, with Queensland’s economic growth, despite further large falls in private investment expenditure, projected to be higher than the Australian growth. That is, a little over 3% per annum. The reason for this expectation is the contribution of:
(i) current low interest rates which could go lower;
(ii) an exchange rate that will track down to levels where Australian cost competitiveness is established (an exchange rate of around 66 to 70 cents for the US$); and
(iii) high house prices maintaining net household wealth and therefore supporting high levels of consumption expenditure.
It goes without saying that the highest risk component is the exchange rate projection. However unless the policy authorities can engineer a lower exchange rate over the next 12 to 18 months Australia’s sources of growth post 2018 will be particularly weak.
For Queensland economic growth, as measured by gross state product (GSP), growth is returning to levels which if not normal compared to historical benchmarks pre-2009 will at least be similar to the national average outcomes in terms of the key economic and demographic aggregates.
Looking beyond 2018 the current drivers of Queensland economic growth, namely dwelling investment and mining production will come to an end in terms of their current high relative contribution. To maintain a growth rate similar to the national average Queensland will nead a lower Australian exchange rate to drive service exports in general and tourism exports in particular.
1. Currently (as measured by the indicators of the March Quarter 2016) the growth rate of the world is near 2.8%.
The world economy is at the crossroads. Politicians and advanced economies only made to realise that their legitimacy depends very much on their ability to deliver quality employment opportunities for their citizens in proportion to the growth in the working age population. How the current political backlash in North America and Europe translates into influencing economic activity nobody can state with certainty. All that can be said is that the solution lies with coordinated fiscal expansion across a number of key economies financed by supportive central bank policies in terms of public sector debt management. That is financing by so-called “helicopter money”. Quality political leadership needs to emerge across a number of countries which at this stage appears unlikely with instead political leadership adopting narrow protectionist policies framed purely in the national interest akin to what happened in the 1930s. A key assumption of the projections in this report is that in effect the world does manage to “muddle through” with enough positive action taken to sustain world growth near the 3% per annum range. Hopefully this assumption does not prove to be hopelessly optimistic.
Queensland region construction supply and demand analysis: 1995-2026 and quarterly
indicators to June 2018 – June Annual Report 2016
ii
2. Provided China continues to grow at least at moderate growth rates (that is, in excess of 5.5%), then Australia will not meltdown with a financial/balance of payments crisis as would otherwise have been possible given the world difficulties. There are macroeconomic imbalances in the Chinese economy but the extensive public sector ownership of assets of all types, and especially financial enterprises, the Chinese government control of vast array of economic policy instruments coupled with a $US trillion international reserves renders it highly likely that China will “muddle through” with the maintenance of reasonable economic performance.
The largest threat to the Australian and Queensland economy from China is likely to stem from geopolitical considerations rather than the performance of the Chinese economy. Tensions in the China seas if not contained is likely to see China exercise her long stated position that Australia cannot expect to successfully exploit the opportunities of the Chinese economy and remain in alliance with United States. This could at the very least result in discrimination against Australia imports and for Queensland discrimination against cold imports. Alternatively if China maintains its aggressive position in relation to the China seas it may well be that the nations of the regions will have no option but to implement at the very least a gradual build-up in an informal trade embargo against China based on a platform around the proposed TPP treaty. The current projections assume that these eventualities are not realise to a significant extent.
3. After reaching 300,000 over the 2008 and 2009 period, Australia’s immigration intake fell to an average of 178,000 over the 2014 to 2015 period with an average population growth rate of 1.4% per annum. Over the next four years that is between 2016 and 2019 the average net immigration intake is projected 186,000 with the population growth rate maintaining the 1.4% per annum growth rate. Subdued economic conditions and in particular the maintenance of relatively high unemployment rates at near 6% will constrain the immigration rate from increasing significantly above current levels forcing the National population growth rate falling to 1.3% per annum.
Over 2014 and 2015 the level of foreign net migration into Queensland has averaged in the vicinity of 20,000. This represents approximately half the level of net foreign migration into Queensland that prevailed in the five years preceding 2014. The level of net interstate migration into Queensland has remained reasonably stable over the last few years at approximately 7000 per annum. As a result the Queensland population growth rate over the last two years has fallen slightly to below the national average.
4. After growing between 4% and 6% over the years prior to the GFC, Queensland’s gross state product has averaged 12.1% per annum for the fiscal years 2009 to 2015. For the 2015 fiscal year the Queensland growth rate was 0.5% per annum which was the same outcome for 2011. Despite the fall in mining investment for 2016 and 2017 the Queensland GSP growth rate is projected to average around 3% per annum due to the recovery in dwelling investment and the production effect of completed mining projects in general and LNG projects in particular. If the weakening of the current drivers of growth and any substantial recovery in mining investment delayed until the mid-2020s at the earliest the Queensland economic growth rate should fall to around 2.4% per annum for the remainder of the projection period.
The mining production effect from the completed mining projects will come to an end by 2018 with the dwelling cycle turning down by 2020. At this stage the downside of the current dwelling cycle is projected to be reasonably mild with further growth in renovation expenditures partially offsetting the decline in new construction expenditures.
5. The Queensland construction industry has been dominated by engineering construction for the last eight years. The engineering construction share of total construction rose from just 40% in 2008 to a peak of 67% in 2014 due to the strong investment in mining and LNG projects

Queensland region construction supply and demand analysis: 1995-2026 and quarterly
indicators to June 2018 – June Annual Report 2016
iii
over that period. In 2008 engineering work done was valued at $18 billion by 2014 it had peaked at almost $46 billion. Engineering construction has now returned to 2008 levels. This LNG construction phase is now finished. The next phase in the LNG story is LNG production, this has begun, but low world commodity prices have meant that there is no urgency to bring the established plant on line. Lack of demand for LNG in the short to medium term will delay further investment in new LNG plant.
The low commodity prices are also affecting investment in other engineering construction sectors, such as coal mining, with large projects now delayed, or cancelled. Global uncertainties, such as the economic cycles of our major trading partners such as China, conflict across the globe, US presidential elections, BREXIT, low commodity prices and fluctuating exchange rates all have the effect of discouraging investment in commodities for the global market. The result of all this uncertainty is that over the next two years engineering investment will remain at similar levels to those that occurred in 2008.
Over the last eight years, when total engineering construction was reaching record heights, the public sector investment in engineering was just over $4 billion, this was not dissimilar to the levels of investment in the eight years prior to 2008 when public sector engineering investment was $3.7 billion.
Residential construction is comprised of; the building of dwellings, alterations and additions to dwellings and other work done. The latter figure is measured in the National Accounts and covers various types of work such as odd jobs, painting, plumbing or works not requiring a permit. Until 2008 residential construction dominated the Queensland construction sector. Over the period 1990 to 2008 the average residential share of total construction was 53%. Over that period the share was never below 40%. Around 2008 two things happened; one was the global financial crisis, which lowered consumer confidence, the other was the economic rise of China, which had been begun earlier in the decade but by 2008 had reached the point where the need for coal, iron ore, other minerals and other energy sources was almost insatiable. The double effect was that the investment in dwellings was falling at the same time as the investment in engineering such as LNG plant and coal mines was booming. Hence from 2009 residential construction was no longer the major construction industry.
However the Queensland population has continued to grow. Perhaps not as fast as had been expected. The Queensland government recently revised its long term projections, with around 200,000 less people residing in Queensland in 2021 than expected in the 2013 medium projection. NIEIR has similarly adjusted the structure of the population projections used in this report. Between 2008 and 2016 the population of Queensland grew by over 600,000. This combined with declining residential construction investment since 2008 have led to a shortfall in the number of dwellings available to meet the needs of the expanding population. This shortfall and the record low interest rates that Australia is experiencing have provided the impetus needed for the dwelling construction cycle to return to the growth phase. The dwelling cycle trough occurred in 2013 when dwelling investment was just $14 billion. Currently dwelling investment is worth almost $19 billion per year. The peak in the cycle will occur around 2019, when the current shortfall has been met.
Public sector dwelling expenditure has historically averaged 2% of total expenditure in the residential sector. The last five years have seen levels of expenditure consistently below this average, this is partly because the private sector has performed reasonably well over this period, that is, the relative share of investment has increased for the private sector. However the long term average expenditure in public sector dwelling investment has be around $200 million per annum, the average for 2010 and 2011 was $500 million per annum. The average figure for 2012 to 2016 is just $135 million.

Queensland region construction supply and demand analysis: 1995-2026 and quarterly
indicators to June 2018 – June Annual Report 2016
iv
Over the first five years of the Twenty-first century the value of non-residential construction was averaging $4 billion per annum. Over the three years to the Global Financial Crisis in 2008 in response to the flow-on effects of the beginning of the mining boom, the value of non-residential construction averaged $6 billion per annum. Post GFC the expected decline in non-residential investment didn’t occur. An average of $8 billion a year was invested from 2009 to 2012, twice the pre-GFC level. The reasons for this are well documented. From 1990 until 2008 public sector investment in non-residential projects averaged around $1 billion per year, that is 26% of the total non-residential investment. For the period 2009 to 2013 the value of public sector investment steadily rose to reach $4 billion in 2011, this was largely due to the Australian Government’s stimulus packages. This stimulus was worth a total of at least $8 billion above the average long term expenditure for those four years. The types of projects included school buildings and hospitals. In the short term such spending helped prevent the Queensland economy from slipping into recession. In the longer term the bringing forward of these projects has meant that public sector non-residential investment in Queensland has had a long period of decline. From the peak of $4 billion in 2011, public sector non-residential construction expenditure was just $0.7 billion in 2016. However, population demands are ever present and in the long term public sector expenditure must return to more normal levels.
Summarising the current situation in the Queensland residential building and non-residential building sector.
■ The residential building and non-residential building sectors together make up the building sector.
■ In 2015-16 building sector activity contributed 8.1% to Queensland Gross State Product.
■ The $25 billion sector contributes one in every 12 dollars to the state's economic activity.
■ A steady recovery in the building sector is under way with average annual growth over the last two financial years of 7.4%.
■ Growth in residential building activity for the 2015/16 financial year was 15.2%. New South Wales and Tasmania were the only states to experience faster growth in dwelling expenditure over this period.
■ In the 12 months ended May 2016 the number of new dwellings approved was 11% above the corresponding period in the previous year.
■ There were 505,000 new dwellings approved in the year to the end of May 2016.
■ The Building and Construction Services sector, which is comprised of residential building, non-residential building, and construction services, is one of the largest employing industries in Queensland.
■ On average over 2015-16 the building and construction services sector employed one in every 13 jobs or 7.8% of the state's total workforce, making it the state's third biggest employing industry behind Health Care and Social Assistance (13.6%), and Retail Trade (10.7%).

Queensland region construction supply and demand analysis: 1995-2026 and quarterly
indicators to June 2018 – June Annual Report 2016
v
■ Trend figures for the June quarter 2016 show that 228,000 persons were employed on average in construction in Queensland, with 206,000 employed in construction services and building, of these, 11.5% were employed in residential building, 5% were employed in non-residential building and 83.4% were employed in construction services.
■ Persons employed in the building industry in Queensland worked and average of 38.3 hours per week in 2014-15, compared to 38.1 hours per week nationally.
6. Historically prior to 2011, the region with the largest share of Queensland construction expenditure has been Brisbane with a long term average of 43% of the total. Whilst Brisbane still has the highest proportion of construction expenditure its share fell over the period of the mining boom so that the average share of Queensland construction for Brisbane was 33% for 2011 to 2016. In contrast the mining regions have seen their share of the state’s construction rise over this same period. The share for Fitzroy has risen from a long term average of 6% to a post 2011 average of 21%, similarly Mackay’s long term average to 2010 of 4% has risen to a 9% share of the state’s construction expenditure. Longer term it is to be expected that the distribution across the state of construction expenditure will return to the more normal pattern, where the most populous regions experience the bulk of the growth in the construction sector. However the mining regions will revert to levels that are lower than the recent past but higher than the long term trend. The total effect looking forward is that Brisbane’s construction expenditure levels should average just under $20 billion per annum over the next ten years, Gold Coast and Fitzroy between $5 billion and $6 billion per annum, Sunshine Coast and Mackay should average around $3 billion per annum. Darling Downs, Northern and Far North will all average between $2.5 billion and $3.0 billion per year.
Figure E.1: Australian GDP and Queensland GSP

Queensland region construction supply and demand analysis: 1995-2026 and quarterly
indicators to June 2018 – June Annual Report 2016
vi
Table E.1 Australia and Queensland gross product and construction activity indicators
2011-12
2012-13
2013-14
2014-15
2015-16
2016-17
2017-18
Average 2019-2026
Gross product
Australia (2013-14 =100) 95.2 97.6 100.0 102.4 104.7 107.3 110.9 123.8
Queensland (2013-14 =100) 94.9 97.3 100.0 100.5 103.3 106.6 109.5 122.2
Dwelling expenditure
Australia (2013-14 =100) 98.7 95.0 100.0 108.3 119.9 131.2 132.5 140.4
Queensland (2013-14 =100) 104.9 95.2 100.0 110.1 126.8 136.3 141.7 149.6
Non-residential building expenditure
Australia (2013-14 =100) 98.6 95.0 100.0 99.9 94.8 98.2 98.2 101.0
Queensland (2013-14 =100) 104.4 95.2 100.0 90.4 91.8 91.3 94.5 86.9
Engineering construction
Australia (2013-14 =100) 94.0 105.9 100.0 84.9 80.0 81.0 88.1 87.3
Queensland (2013-14 =100) 83.6 93.1 100.0 66.3 41.5 40.4 41.0 47.2
Total construction expenditure
Australia (2013-14 =100) 96.2 100.7 100.0 94.8 95.3 100.0 104.1 106.7
Queensland (2013-14 =100) 90.5 93.8 100.0 78.5 65.6 66.9 68.8 75.2
Table E.2 Annual growth and % contribution to construction activity by major construction segment
2009-10
2010-11
2011-12
2012-13
2013-14
2014- 15
2015- 16
2016- 17
2017- 18
Annual percentage rate of change (%)
Dwellings -1.3 -8.2 -7.1 -9.3 5.1 10.1 15.2 7.5 4.0
Total non-residential building 4.2 6.3 -9.6 -8.8 5.0 -9.6 1.5 -0.5 3.5
Total engineering construction -5.1 22.0 51.0 11.5 7.4 -33.7 -37.5 -2.5 1.4
Total construction -2.2 7.5 21.6 3.7 6.6 -21.5 -16.5 2.1 2.9
Contribution to total construction growth (%)
Dwellings -0.5 -2.8 -1.8 -2.1 1.1 3.1 6.5 3.4 1.8
Total non-residential building 0.7 1.0 -1.2 -0.9 0.5 -1.2 0.2 -0.1 0.5
Total engineering construction -2.2 11.0 31.8 7.7 5.0 -19.2 -16.0 -1.0 0.6

Queensland region construction supply and demand analysis: 1995-2026 and quarterly
indicators to June 2018 – June Annual Report 2016
vii
Table E.3 Construction activity by Queensland region – 2013-14 = 100
2010- 11
2011- 12
2012-13
2013-14
2014-15
2015-16
2016-17
2017-18
Average 2019-26
Brisbane 115 117 101 100 100 99 113 113 109
Gold Coast 131 107 91 100 108 120 138 140 150
Sunshine Coast 126 102 81 100 105 93 97 97 112
West Moreton 128 105 102 100 92 82 92 98 126
Wide Bay/Burnett 132 118 112 100 105 92 97 96 108
Darling Downs 66 82 89 100 55 47 45 43 51
South West 28 68 86 100 55 32 14 16 22
Fitzroy 31 72 89 100 68 38 29 27 27
Central West 35 59 90 100 160 135 150 138 210
Mackay 41 70 95 100 51 36 23 29 36
Northern 84 90 98 100 69 58 60 72 88
Far North 118 118 111 100 91 86 91 101 164
North West 56 78 94 100 50 42 88 140 66
Queensland 74 90 94 100 78 66 67 69 73
Table E.4 Share of total construction activity by Queensland region (%)
2010- 11
2011- 12
2012-13
2013-14
2014-15
2015-16
2016-17
2017-18
Average 2019-26
Brisbane 40.0 33.5 27.8 26.0 32.9 39.3 43.7 42.5 38.1
Gold Coast 10.4 7.0 5.7 5.9 8.2 10.8 12.3 12.1 12.2
Sunshine Coast 7.7 5.1 3.9 4.5 6.1 6.5 6.6 6.4 7.1
West Moreton 1.5 1.0 0.9 0.9 1.0 1.1 1.2 1.2 1.5
Wide Bay/Burnett 3.5 2.6 2.3 2.0 2.6 2.8 2.8 2.7 2.9
Darling Downs 6.8 6.9 7.2 7.6 5.4 5.4 5.1 4.7 5.6
South West 1.7 3.5 4.2 4.6 3.2 2.2 1.0 1.1 1.4
Fitzroy 11.3 21.5 25.6 27.0 23.5 15.6 11.8 10.5 10.1
Central West 0.3 0.5 0.7 0.7 1.4 1.4 1.6 1.4 2.0
Mackay 6.7 9.4 12.3 12.2 7.9 6.7 4.2 5.2 6.4
Northern 4.7 4.2 4.4 4.2 3.7 3.7 3.8 4.4 5.1
Far North 3.7 3.1 2.8 2.4 2.7 3.1 3.2 3.5 5.6
North West 1.6 1.8 2.1 2.1 1.4 1.4 2.8 4.3 1.9
Queensland 100.0 100.0 100.0 100.0 100.0 100.0 100.0 100.0 100.0

Queensland region construction supply and demand analysis: 1995-2026 and quarterly
indicators to June 2018 – June Annual Report 2016
viii
Table E.5 Total construction – average annual growth rates by Queensland regions (%)
1995-2014 2014-2019 2019-2026
Brisbane 3.1 1.5 1.0
Gold Coast 2.0 7.3 2.8
Sunshine Coast 3.0 0.7 3.6
West Moreton 2.6 0.6 6.7
Wide Bay/Burnett 1.2 -0.4 3.8
Darling Downs 9.9 -16.5 12.6
South West 19.1 -23.9 -7.9
Fitzroy 15.1 -24.4 4.1
Central West 8.6 33.8 -7.3
Mackay 13.1 -19.5 8.3
Northern 5.2 -3.7 3.1
Far North 0.3 3.4 10.6
North West 10.6 -14.7 20.3
Queensland 6.2 -7.1 3.7
Table E.6 Drivers of construction growth by Queensland region 2014-2026 (average annual $ million change between span years)
2013-2018 2018-2026
Dwellings
Non-residential
con-struction
Engineer- ing
Total con-struction Dwellings
Non-residential
con-struction
Engineer- ing
Total con-struction
Brisbane 961.7 8.2 -545.3 424.5 -29.8 25.7 76.9 72.8
Gold Coast 360.4 77.3 -41.0 396.8 123.1 -8.8 48.2 162.5
Sunshine Coast 151.0 3.0 -50.8 103.2 96.7 15.1 22.4 134.2
West Moreton 4.6 6.2 -15.5 -4.7 13.7 6.8 26.1 46.6
Wide Bay/Burnett 30.7 24.0 -97.7 -43.0 23.7 2.7 25.1 51.5
Darling Downs 1.0 41.6 -512.9 -470.3 16.1 -17.7 324.5 322.9
South West -5.5 -3.1 -426.7 -435.2 2.5 0.8 -11.4 -8.2
Fitzroy -77.0 -73.4 -2119.3 -2269.6 42.1 15.8 77.2 135.0
Central West -1.1 0.5 46.2 45.6 0.0 -0.2 67.7 67.6
Mackay -78.5 -43.8 -960.6 -1082.9 42.9 11.4 253.8 308.1
Northern -8.4 -24.4 -113.4 -146.2 48.5 12.6 46.6 107.8
Far North 44.0 -20.4 -56.9 -33.4 92.6 22.4 161.5 276.5
North West 3.9 -5.9 132.8 130.8 1.8 2.1 40.0 43.9
Queensland 1386.8 -10.2 -4761.0 -3384.4 473.9 88.7 1158.7 1721.2

Queensland region construction supply and demand analysis: 1995-2026 and quarterly
indicators to June 2018 – June Annual Report 2016
ix
Table E.7 Shortage of construction labour by Queensland region – number (shortage is denoted by +/surplus -)
2010-11 2011-12 2012-13 2013-14 2014-15 2015-16 2016-17 2017-18
Average 2019-26
Brisbane 53 3670 -6554 -2676 -6465 -9280 -175 -1796 -12336
Gold Coast 1264 -2479 -5484 -2095 -865 1783 6465 6164 6266
Sunshine Coast 2667 -657 -2477 2539 2810 -241 -81 -412 1355
West Moreton -582 -1230 -816 -833 -1158 -1510 -1299 -1227 -643
Wide Bay/Burnett -252 -1261 -550 -1133 -980 -1992 -1800 -1923 -1193
Darling Downs 1185 377 -280 2730 -2664 -3734 -4089 -4331 -3087
South West 131 384 45 350 -285 -594 -833 -793 -700
Fitzroy -89 5902 2728 4472 -1198 -6343 -5810 -6593 -8198
Central West 35 189 155 -40 330 175 261 184 668
Mackay -678 2053 1736 3722 -3404 -5574 -7438 -6674 -5733
Northern 51 730 1023 2127 -2881 -4811 -4623 -3093 -1290
Far North -755 -747 -999 -2013 -3418 -4257 -3883 -2956 4795
North West 168 269 229 666 -354 -512 374 1357 -54
Queensland 3198 7199 -11246 7817 -20532 -36889 -22932 -22093 -20149
Table E.8 Queensland construction industry – real quarterly price growth at annual rates (%)
2015-16 Jun.
2016-17 Sep.
2016-17 Dec.
2016-17 Mar.
2016-17 Jun.
2017-18 Sep.
2017-18 Dec.
2017-18 Mar.
2017-18 Jun.
Average 2015-16
and 2017-18
Actual Forecast
Non-residential building 7.8 -2.6 -1.6 3.8 3.8 2.5 2.5 1.1 0.1 2.4
Residential building 4.3 -0.2 0.2 3.1 3.5 1.6 1.8 1.5 1.0 2.1
Engineering construction 4.3 3.7 -1.3 4.9 -1.1 6.1 3.1 0.1 0.1 1.5
Total construction 5.0 0.5 -0.6 3.8 2.2 3.1 2.3 1.0 0.5 1.9

Queensland region construction supply and demand analysis: 1995-2026 and quarterly
indicators to June 2018 – June Annual Report 2016
1 1 1
1. Introduction
This study has the following objectives:
(i) to undertake an historical analysis of Queensland regional construction activity to 2016;
(ii) to project Queensland regional construction activity to 2026; and
(iii) to analyse both historically and to project the capacity of Queensland regions to meet construction demands.
The Queensland regional analysis is undertaken at the Australian Bureau of Statistics’ Statistical Division level.
Section 2 overviews the Australian and Queensland economies for the next few years. Section 3 analyses the construction sector from the Queensland and Queensland regions’ perspective.
Section 4 analyses capacity utilisation and cost pressures in the Queensland construction sector as well as by region.
There are two very important points to remember when reading the text. There are no nominal values used in the study. All dollar million or dollar billion values referred to are in constant prices or technically chain volume measure (CVM) prices which in this report is the prices of the 2013-14 fiscal year. Also in terms of the domestic economy the calendar years are not in general referred to unless otherwise explicitly noted. That is all years are fiscal years so 2016 would refer to the 2015-16 fiscal year. The exception is for the world economy section where all years referred to are calendar years.
Queensland region construction supply and demand analysis: 1995-2026 and quarterly
indicators to June 2018 – June Annual Report 2016
2 2 2
2. The economic outlook for the world, Australia and Queensland
This chapter is divided into three segments. Each segment considers the macroeconomic environment for the world, Australia and Queensland.
2.1 The world economy
The world economy continues on in its sluggish growth rate recovery from the Global Financial Crisis (GFC). The current world economic growth rate is running in the order of 2.8% per annum.
The key reasons for this outcome is what, in current economic analyses, is termed ‘hysteresis. Hysteresis is commonly interpreted as if there is a sharp increase in the unemployment rate which is not quickly reversed by expansionary monetary and fiscal policies the future unemployment rate is likely to remain close to its initial elevated value. The main reason for this given by US economists is explained in terms of the fact that the longer the initially retrenched workers remain out of employment the less they are likely to be re-employed because skills degrade and experience becomes more remote to current labour market requirements. In short, the capacity of economy declines from what otherwise would have been the case.
The problem with this interpretation of hysteresis is that the US post GFC unemployment rate has fallen largely as a result of the decline in the participation rate. However, the trend rate of growth since the GFC (Global Financial Crisis) has been well below pre-GFC trends. An alternative, more realistic, explanation of hysteresis would run along the following lines:
(i) the post-GFC fiscal and monetary expansion was not maintained long enough to restore quickly pre-GFC capacity utilisation rates;
(ii) as a result investment continued to fall past 2010 or, at the very least, was held below the share necessary to maintain pre-GFC capacity growth rates;
(iii) as new investment is the main conduit by which new technology was introduced into the economy the result was not only a decline in capacity growth rates but also the rate of productivity growth. Normal capacity utilisation rates have been restored at relatively low levels of capacity output; and
(iv) the economy, therefore, becomes locked into a low trend growth rate (based on the past 5 to 10 year trend) because firstly, the capacity of the economy to accommodate a sharp increase in investment to restore pre-GFC capacity growth rates has evaporated and secondly, because expectations used for investment formation is based on subdued growth realised outcomes of the recent past.
Hence the concept of hysteresis is best thought of as meaning that the longer an economy experiences a growth rate that is below historical benchmarks the greater the probability that growth rate will become the future growth rate without further positive or negative external shocks. This is in evidence throughout the projection tables with the key driver being investment.

Queensland region construction supply and demand analysis: 1995-2026 and quarterly
indicators to June 2018 – June Annual Report 2016
3 3 3
Because many economies have been impacted by hysteresis over the past decade, this has led to the concept of secular stagnation from the world perspective. That is, the world is locked in to a period of relatively low economic growth because of the wide-spread Hysteresis. This means that once a country attempts to lift its capacity growth rate by expansionary fiscal and monetary policies it would quickly run into balance of payments constraints to growth because the failure of trading parties to expand means that imports would grow rapidly compared to exports forcing downward pressure on the exchange rate and upward pressure on interest rates. Unless the country had a strong balance of payments position before expansion, that is, low foreign debt and current account surplus, the expansionary policies would have to be curtailed.
The fundamental cause of this outcome is the failure to sustain expansionary fiscal policies post-2010 and reliance on ineffective/inefficient monetary policies leading to rapid expansions in liquidity, but not expenditures. This overhang of liquidity, in conjunction with circumstances demanding control of this liquidity, such as a sharp upward movement in the US and/or Euro inflation rate, would threaten a second GFC.
The term ‘secular stagnation’ was coined in 1938 just as the Second World War forced massive co-ordinated expansion in military expenditures which elevated the balance of payments constraint to growth and rendered the concept irrelevant for 80 years.
There are signs that the developed economies in general, and the European and Japanese economies in particular, are slowly moving towards acceptance that coordinated fiscal expansion financed by the Central Bank issuing irredeemable assets is going to be required for any acceleration in the world economic growth rate.
Such a policy approach would at least place a floor under the world economic growth rate and, therefore, justify a medium-term growth rate in the range of 2.8% to 3.3% per annum.
However, there are significant downside risks. The following are not assumed to have a significant impact on the world economy:
(i) in exiting from quantitative easing policies and the gradual return to more normal interest rates, the resulting capital losses on bonds does not trigger a herd like exit from bond markets forcing up market interest rates compared to official interest rates plunging the United States in particular into a recession;
(ii) the rise in United States interest rates does not trigger a large outflow of capital from emerging economies (the reverse of the capital inflows 2011-2013) forcing defaults in one or more of these countries;
(iii) Brexit does not force further breakup of the EU. Given the full election cycle, this probability requires the United Kingdom to slide into a recession over 2017 and 2018 and exhibit a great deal of political instability to ensure stable election cycle outcomes in Europe over 2017-2018;
(iv) the political tension in the South China Sea does not result in a new cold war with trade sanctions imposed on China;
(v) quality political leadership in the United States and Europe is maintained; and
(vi) domestically Australia does not lose the confidence of international investors that it can service and repay its two trillion dollar gross foreign debt.
Time will tell if disregarding these possibilities or assuming that they can be offset by policy reaction is justified or not.

Queensland region construction supply and demand analysis: 1995-2026 and quarterly
indicators to June 2018 – June Annual Report 2016
4 4 4
Figure 2.1: World GDP growth rate (%)
2.2 The Australian economic outlook
Tables 2.1 to 2.3 profile the projected outcome for key indicators of Australian economic performance. In the short-term, that is, over 2016 and 2017, Australia’s economic growth is likely to be in the vicinity of 3% per annum. However, this acceleration in the Australian growth rate from the 2014-2015 average of 2.4% will be largely due to the sustained growth in exports driven by the completion of mining projects in general, and LNG projects in particular, as well as the recovery in dwelling investment.
After 2017, these sources of growth will decline. This is especially the case for dwelling investment. Any significant extension of the current dwelling investment recovery beyond 2017, for example by adopting ultra-low interest rates, will simply be reflected by offsetting negative contributions of dwelling investment to economic growth in 2021 or 2022. This would take the Australian economic growth rate to near 1.5% in these years.
It can be seen from the tables that exports also continue to grow by in excess of 4% over 2018 and 2019. This is due to the exchange rate profile. The exchange rate is projected to decline to around the 65 cent rating for the US dollar and maintains a rate near that level for a considerable period of time. If this occurs, then continued export expansion and import replacement will make a significant positive contribution to economic growth. If, on the other hand, the exchange rate remains high at close to current levels, then for the 2018 to 2020 period Australia’s economic growth is likely to again fall to 1.5% or lower.

Queensland region construction supply and demand analysis: 1995-2026 and quarterly
indicators to June 2018 – June Annual Report 2016
5 5 5
Little more can be expected from the other drivers of economic activity. Government consumption expenditure growth is constrained by government deficit reduction objectives while private consumption expenditure growth is constrained by debt saturation, that is, upper limits of current household debt to income ratios. The downward pressure on household consumption will be aggravated by real declines in established dwelling prices which is likely to happen from 2019 onwards from the natural dynamics of the current housing price cycle. That is, increased housing supply and reductions in the population growth rate place downward pressure on house prices. The loss of household wealth will force households to increase savings rates by reducing expenditure to reduce relative debt levels.
The exchange rate and the balance of payments
At the centre of the reasons for the subdued economic outlook is Australia’s deteriorating current account deficit. The fall, in terms of trade, over the last two years means that Australia will be facing a period when the current account deficit will return to the 4% to 5% of GDP range for a considerable period of time. In part this is because the terms of trade are likely to remain relatively low over the medium-term due to:
(i) continued oversupply in iron ore and coal markets;
(ii) subdued world economic growth; and
(iii) more aggressive CO2 reduction strategies by India and China reducing coal requirements below what was previously expected.
The current account balance will also deteriorate as the expected increase in US interest rates over the next three years will directly increase as Australia’s foreign debt interest burden.
Australia’s international borrowing requirement
With the return of high current account deficits Australia’s annual international borrowing requirement will move to centre stage of policy focus. Figure 2.2 shows Australia’s short-term borrowing requirement as a percentage of GDP. The short-term borrowing requirement is defined as the level of foreign debt that falls due over the next 12 months from a given quarter less current foreign reserves plus the expected current account deficit over the next 12 months.
It can be seen from Figure 2.2 that Australia’s international borrowing requirement has gone from 35% of GDP in March 2014 to 46% by the September quarter. It has returned to GFC peaks. In 2009 it was China’s stimulus package that restored Australia’s international borrowing requirement to sustainable levels by 2012. There is no prospect of this happening now and if anything the probability is a further deterioration so that by 2017, with further devaluation of the currency, the borrowing requirement will be approaching $900 billion. Any substantial negative shocks may make it difficult for Australia to maintain the confidence of international investors and therefore avoid an international debt default. This of course result in a very different economic scenario.

Queensland region construction supply and demand analysis: 1995-2026 and quarterly
indicators to June 2018 – June Annual Report 2016
6 6 6
Figure 2.2: Australia’s international borrowing requirement (per cent of GDP)
Interest rates
The projection outlook is built around the assumption that the US will increase interest rates by at least between 1 and 2 percentage points over the next two to three years. This is likely to occur irrespective of the contraction of subdued economic growth in the US. This is because the policy of quantitative easing in the US since 2011 has led to a situation where the excess revenues of the US banking system are around US$2.6 trillion, which could be quickly mobilised to significantly expand credit to accommodate an inflation threatening unexpected acceleration in the US real economic growth rate, or an unexpected direct positive shock to inflate inflationary expenditures. Prudent monetary policy would be one which reduced the incentive to mobilise the excess reserves by increasing interest rates as well as to enable large-scale Central Bank sale of securities to reduce the level of reserves.
Given Australia’s high current international borrowing requirement, Australia will be forced to follow any increase in US interest rates despite the fact that in the short-run Australia’s interest rates are likely to fall further.
Population and migration
The subdued Australian outlook is reinforced by the fact that the lower the economy’s growth rate the lower will be the employment growth rate, which will force a reduction in the net foreign immigration rate to stabilise the unemployment rate at around 6%. Accordingly, over the medium-term the Australian net foreign immigration intake is likely to remain in the 170,000 to 200,000 range.
As a result, the population growth rate is held to a growth rate in the range of 1.3% to 1.5% per annum. That is, this will be the maximum growth rate the economy can support given the economic outlook.

Queensland region construction supply and demand analysis: 1995-2026 and quarterly
indicators to June 2018 – June Annual Report 2016
7 7 7
The inflation rate
The current general policy concern is the rate of inflation. That is, its low level. For the projections the rate of inflation returns to the 2% to 3% range. The key driver of this outcome is the low exchange rate. This reinforces the point that Australia’s and Queensland’s economic outlook depends critically on a long-term low exchange rate regime being successfully realised. Post the mining boom, with a debt saturated household sector by choice, a deficit constrained government sector and a subdued world economy there is no other credible driver of growth
Figure 2.3: Australia – Real GDP growth rate (%)

Queensland region construction supply and demand analysis: 1995-2026 and quarterly indicators to June 2018 – June Annual Report 2016 8
Table 2.1 Australian economy: Population and labour market
2000-2005
2005-2010 2011 2012 2013 2014 2015 2016 2017 2018 2019 2020 2021
2021-2026
Total population Annual growth rates Per cent 1.2 1.8 1.4 1.6 1.8 1.6 1.4 1.4 1.5 1.4 1.4 1.3 1.3 1.3
Net foreign arrivals Annual level Ths. 115.6 230.6 180.4 229.4 227.1 186.4 176.5 184.8 192.0 184.0 184.0 176.0 172.0 202.9
Population 18 and over Annual growth rates Per cent 1.5 2.0 1.6 1.8 1.9 1.7 1.6 1.8 1.7 1.4 1.4 1.3 1.3 1.4
Total hours worked Annual growth rates Per cent 1.3 1.8 2.8 1.4 -0.9 0.8 1.0 2.4 1.5 1.1 1.2 1.4 1.3 0.8
Average hours worked per working age population per week
Annual level Ths. 21.1 21.4 21.2 21.2 20.6 20.4 20.3 20.4 20.4 20.3 20.3 20.3 20.3 20.0
Total employment Annual growth rates Per cent 2.0 2.3 2.4 1.2 1.2 0.5 1.2 2.2 1.7 1.5 1.5 1.6 1.6 1.3
Total employed per working age population
Annual growth rates Per cent 0.6 0.3 0.8 -0.6 -0.6 -1.1 -0.5 0.5 -0.2 0.0 0.1 0.2 0.2 -0.1
Total workforce Annual growth rates Per cent 1.7 2.4 1.9 1.3 1.5 1.0 1.5 2.3 1.4 1.5 1.4 1.5 1.4 1.3
Number unemployed Annual level Ths. 597.9 532.0 590.6 614.0 655.2 710.7 762.4 760.1 779.2 801.7 807.3 806.0 804.1 855.1
Unemployment rate Annual level Per cent 6.1 4.8 5.0 5.2 5.4 5.8 6.2 5.9 6.1 6.2 6.1 6.0 5.9 6.0
Participation rate Annual level Per cent 63.4 65.1 65.5 65.3 65.1 64.7 64.7 65.1 64.9 64.9 65.0 65.1 65.1 65.1
Queensland region construction supply and demand analysis: 1995-2026 and quarterly indicators to June 2018 – June Annual Report 2016 9
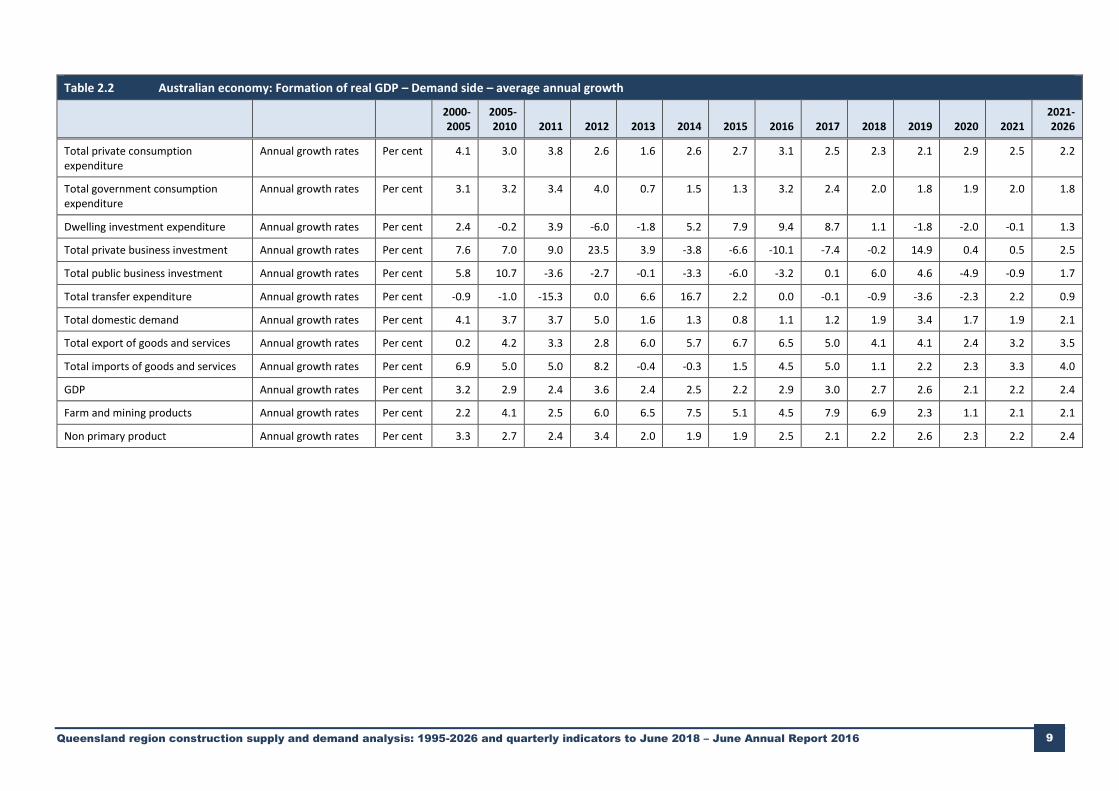
Table 2.2 Australian economy: Formation of real GDP – Demand side – average annual growth
2000-2005
2005-2010 2011 2012 2013 2014 2015 2016 2017 2018 2019 2020 2021
2021-2026
Total private consumption expenditure
Annual growth rates Per cent 4.1 3.0 3.8 2.6 1.6 2.6 2.7 3.1 2.5 2.3 2.1 2.9 2.5 2.2
Total government consumption expenditure
Annual growth rates Per cent 3.1 3.2 3.4 4.0 0.7 1.5 1.3 3.2 2.4 2.0 1.8 1.9 2.0 1.8
Dwelling investment expenditure Annual growth rates Per cent 2.4 -0.2 3.9 -6.0 -1.8 5.2 7.9 9.4 8.7 1.1 -1.8 -2.0 -0.1 1.3
Total private business investment Annual growth rates Per cent 7.6 7.0 9.0 23.5 3.9 -3.8 -6.6 -10.1 -7.4 -0.2 14.9 0.4 0.5 2.5
Total public business investment Annual growth rates Per cent 5.8 10.7 -3.6 -2.7 -0.1 -3.3 -6.0 -3.2 0.1 6.0 4.6 -4.9 -0.9 1.7
Total transfer expenditure Annual growth rates Per cent -0.9 -1.0 -15.3 0.0 6.6 16.7 2.2 0.0 -0.1 -0.9 -3.6 -2.3 2.2 0.9
Total domestic demand Annual growth rates Per cent 4.1 3.7 3.7 5.0 1.6 1.3 0.8 1.1 1.2 1.9 3.4 1.7 1.9 2.1
Total export of goods and services Annual growth rates Per cent 0.2 4.2 3.3 2.8 6.0 5.7 6.7 6.5 5.0 4.1 4.1 2.4 3.2 3.5
Total imports of goods and services Annual growth rates Per cent 6.9 5.0 5.0 8.2 -0.4 -0.3 1.5 4.5 5.0 1.1 2.2 2.3 3.3 4.0
GDP Annual growth rates Per cent 3.2 2.9 2.4 3.6 2.4 2.5 2.2 2.9 3.0 2.7 2.6 2.1 2.2 2.4
Farm and mining products Annual growth rates Per cent 2.2 4.1 2.5 6.0 6.5 7.5 5.1 4.5 7.9 6.9 2.3 1.1 2.1 2.1
Non primary product Annual growth rates Per cent 3.3 2.7 2.4 3.4 2.0 1.9 1.9 2.5 2.1 2.2 2.6 2.3 2.2 2.4

Queensland region construction supply and demand analysis: 1995-2026 and quarterly indicators to June 2018 – June Annual Report 2016 10
Table 2.3 Australian economy: Commodity prices, terms of trade and the balance of payments
2000-2005
2005-2010 2011 2012 2013 2014 2015 2016 2017 2018 2019 2020 2021
2021-2026
Terms of trade Annual level Index 0.6 0.9 1.1 1.1 1.0 1.0 0.9 0.8 0.8 0.8 0.8 0.8 0.8 0.8
Balance of trade Annual level $Billion -12.9 -15.5 14.2 -3.0 -18.9 -7.0 -23.0 -42.0 -56.9 -61.2 -72.1 -73.5 -80.7 -86.5
Net income paid overseas Annual level $Billion -23.1 -46.5 -58.4 -47.3 -40.5 -44.1 -35.8 -35.3 -41.2 -42.4 -43.1 -43.5 -45.2 -34.9
Current account balance Annual level $Billion -35.9 -62.0 -44.1 -50.3 -59.4 -51.1 -58.7 -77.3 -98.3 -103.6 -115.2 -117.0 125.9 -121.4
Current account balance – % of GDP Annual level Index -4.5 -5.4 -3.1 -3.4 -3.9 -3.2 -3.6 -4.8 -5.8 -5.8 -6.1 -6.0 -6.3 -4.9
International debt – % of GDP Annual level Index 41.7 49.4 46.8 49.0 50.9 54.6 59.1 62.7 68.0 73.2 73.9 78.2 85.0 88.8
90 day rate Annual level Index 5.3 5.6 4.9 4.4 3.2 2.6 2.5 2.2 2.0 2.4 3.0 3.0 3.1 3.4
10 year bond rate Annual level Index 5.0 4.8 4.6 3.5 2.9 3.8 3.0 2.8 2.9 3.5 3.9 3.9 3.8 4.2
Oil price Annual growth rates $US 29.9 72.4 92.7 105.4 102.3 105.5 69.5 50.8 52.4 57.2 62.2 66.5 70.1 79.7
World GDP Annual growth rates Per cent 3.7 3.6 4.4 3.2 2.5 2.6 2.9 3.1 3.2 3.1 3.1 2.8 3.0 3.3
Exchange rate Annual level Index 0.62 0.81 0.99 1.04 1.03 0.92 0.84 0.73 0.70 0.65 0.64 0.64 0.63 0.68
Implicit consumption deflator Annual growth rates Per cent 2.6 3.0 2.1 2.5 2.7 2.4 1.6 1.4 1.9 2.2 1.9 1.3 1.4 2.2
$ per hour wage and mixed income Annual growth rates Per cent 5.6 4.6 5.7 5.2 4.2 1.8 2.1 2.1 2.1 2.2 2.5 2.6 2.8 3.4
Average weekly earnings Annual growth rates Per cent 5.0 4.5 4.3 4.6 4.6 2.9 2.2 2.2 2.1 2.2 2.3 2.3 2.2 2.7
Queensland region construction supply and demand analysis: 1995-2026 and quarterly
indicators to June 2018 – June Annual Report 2016
11 11 11 11
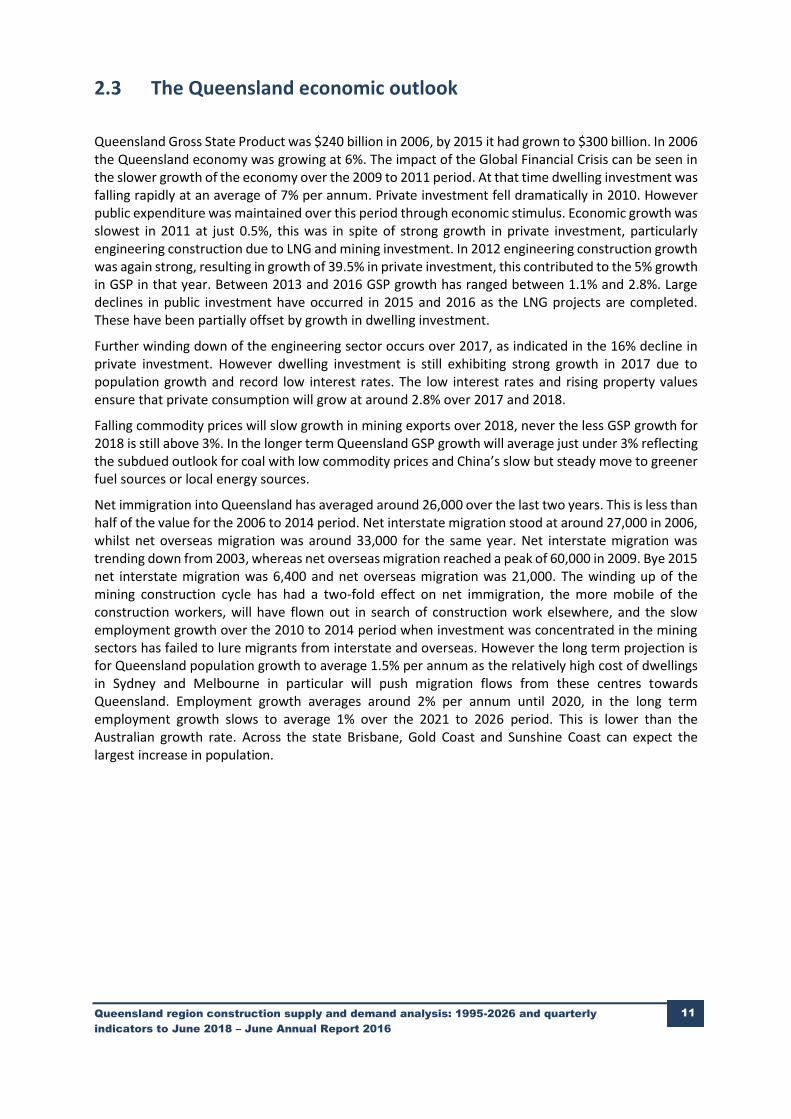
2.3 The Queensland economic outlook
Queensland Gross State Product was $240 billion in 2006, by 2015 it had grown to $300 billion. In 2006 the Queensland economy was growing at 6%. The impact of the Global Financial Crisis can be seen in the slower growth of the economy over the 2009 to 2011 period. At that time dwelling investment was falling rapidly at an average of 7% per annum. Private investment fell dramatically in 2010. However public expenditure was maintained over this period through economic stimulus. Economic growth was slowest in 2011 at just 0.5%, this was in spite of strong growth in private investment, particularly engineering construction due to LNG and mining investment. In 2012 engineering construction growth was again strong, resulting in growth of 39.5% in private investment, this contributed to the 5% growth in GSP in that year. Between 2013 and 2016 GSP growth has ranged between 1.1% and 2.8%. Large declines in public investment have occurred in 2015 and 2016 as the LNG projects are completed. These have been partially offset by growth in dwelling investment.
Further winding down of the engineering sector occurs over 2017, as indicated in the 16% decline in private investment. However dwelling investment is still exhibiting strong growth in 2017 due to population growth and record low interest rates. The low interest rates and rising property values ensure that private consumption will grow at around 2.8% over 2017 and 2018.
Falling commodity prices will slow growth in mining exports over 2018, never the less GSP growth for 2018 is still above 3%. In the longer term Queensland GSP growth will average just under 3% reflecting the subdued outlook for coal with low commodity prices and China’s slow but steady move to greener fuel sources or local energy sources.
Net immigration into Queensland has averaged around 26,000 over the last two years. This is less than half of the value for the 2006 to 2014 period. Net interstate migration stood at around 27,000 in 2006, whilst net overseas migration was around 33,000 for the same year. Net interstate migration was trending down from 2003, whereas net overseas migration reached a peak of 60,000 in 2009. Bye 2015 net interstate migration was 6,400 and net overseas migration was 21,000. The winding up of the mining construction cycle has had a two-fold effect on net immigration, the more mobile of the construction workers, will have flown out in search of construction work elsewhere, and the slow employment growth over the 2010 to 2014 period when investment was concentrated in the mining sectors has failed to lure migrants from interstate and overseas. However the long term projection is for Queensland population growth to average 1.5% per annum as the relatively high cost of dwellings in Sydney and Melbourne in particular will push migration flows from these centres towards Queensland. Employment growth averages around 2% per annum until 2020, in the long term employment growth slows to average 1% over the 2021 to 2026 period. This is lower than the Australian growth rate. Across the state Brisbane, Gold Coast and Sunshine Coast can expect the largest increase in population.

Queensland region construction supply and demand analysis: 1995-2026 and quarterly indicators to June 2018 – June Annual Report 2016 12
Table 2.4 Formation of Queensland Gross State Product
2010 2011 2012 2013 2014 2015 2016 2017 2018 2019 2020 2021 2022 2023 2024 2025 2026
Annual growth – $CVM m (%)
Private consumption expenditure 1.3 3.6 3.4 2.0 2.7 2.4 2.9 2.6 2.9 2.2 2.9 2.7 2.0 2.4 2.7 2.7 2.7
Government expenditure 1.1 5.0 4.1 0.0 0.8 1.7 3.8 1.7 1.3 1.4 1.3 1.7 2.0 2.1 1.8 2.0 1.8
Dwelling investment -2.9 -9.4 -4.8 -8.8 4.7 8.6 15.2 7.5 4.0 1.4 -1.5 -2.1 3.0 4.2 3.7 4.2 4.1
Private investment -15.0 22.1 39.5 5.4 -3.5 -21.7 -22.7 -16.5 -1.1 10.8 -4.3 4.3 3.5 3.7 -2.0 -0.5 8.2
Public investment 6.5 -7.3 -3.4 -7.4 0.1 -8.5 -6.3 2.3 0.9 4.1 2.5 5.3 6.0 7.6 6.6 4.7 0.9
Total state final demand -1.3 4.4 8.6 1.3 1.1 -3.0 -0.9 1.2 1.2 2.4 1.3 2.5 2.2 2.6 2.0 2.3 3.1
Net trade and stocks – percentage point contribution 2.7 -4.0 -3.5 1.0 1.6 3.7 3.8 2.1 1.5 0.0 1.0 0.2 0.4 0.0 0.4 -0.1 -0.5
Gross State Product 1.3 0.5 5.8 2.4 2.8 0.5 2.8 3.3 2.7 2.4 2.3 2.6 2.6 2.5 2.3 2.1 2.5
Percentage point contribution to Queensland GSP growth
Private consumption expenditure 0.8 2.1 2.0 1.2 1.5 1.4 1.7 1.5 1.7 1.3 1.7 1.6 1.1 1.4 1.6 1.6 1.6
Government expenditure 0.2 0.9 0.7 0.0 0.1 0.3 0.6 0.3 0.2 0.2 0.2 0.3 0.3 0.3 0.3 0.3 0.3
Dwelling investment -0.2 -0.6 -0.3 -0.5 0.2 0.4 0.8 0.4 0.2 0.1 -0.1 -0.1 0.2 0.2 0.2 0.3 0.2
Private investment -2.6 3.1 6.8 1.2 -0.8 -4.8 -3.9 -2.1 -0.1 1.1 -0.5 0.4 0.4 0.4 -0.2 -0.1 0.8
Public investment 0.5 -0.6 -0.3 -0.5 0.0 -0.5 -0.4 0.1 0.0 0.2 0.1 0.3 0.3 0.4 0.4 0.3 0.1
Total state final demand -1.4 4.5 9.3 1.4 1.2 -3.2 -1.0 1.2 1.2 2.4 1.3 2.4 2.2 2.5 2.0 2.2 3.0
Net trade and stocks - percentage point contribution 2.7 -4.0 -3.5 1.0 1.6 3.7 3.8 2.1 1.5 0.0 1.0 0.2 0.4 0.0 0.4 -0.1 -0.5
Gross State product 1.3 0.5 5.8 2.4 2.8 0.5 2.8 3.3 2.7 2.4 2.3 2.6 2.6 2.5 2.3 2.1 2.5

Queensland region construction supply and demand analysis: 1995-2026 and quarterly indicators to June 2018 – June Annual Report 2016 13
Table 2.4 Formation of Queensland Gross State Product (continued)
2010 2011 2012 2013 2014 2015 2016 2017 2018 2019 2020 2021 2022 2023 2024 2025 2026
Supply side contribution to GSP growth – average annual growth rate $CVM
Agriculture -0.5 4.6 2.9 -4.3 -4.0 0.5 4.6 5.6 4.4 3.6 3.0 2.7 2.5 2.4 2.2 2.1 2.1
Mining 14.0 -10.0 5.9 5.0 9.9 6.7 11.0 9.8 3.4 2.1 2.5 2.8 2.8 1.5 1.8 1.0 0.8
Manufacturing -4.2 -1.5 4.2 -1.4 0.7 -0.3 -0.4 2.2 3.9 4.8 5.1 5.7 6.5 6.9 6.5 5.0 5.3
Construction -4.6 6.9 14.4 6.2 10.3 -21.1 -9.3 2.1 2.9 0.6 0.3 -0.6 0.6 3.2 11.1 5.8 5.9
Distribution -2.0 2.0 6.0 5.3 1.3 9.7 2.1 4.6 2.0 1.3 0.6 0.6 1.4 2.0 1.3 1.5 2.5
Finance 1.3 1.0 3.4 4.5 5.2 8.1 5.8 3.5 3.5 3.8 3.8 3.2 2.8 3.0 2.3 1.8 1.9
Business services -0.8 2.0 3.8 1.8 2.6 0.4 1.6 5.7 3.5 3.3 2.6 2.6 2.8 3.1 2.6 2.5 3.5
Community services 4.2 1.6 4.1 2.3 5.3 3.6 5.4 4.6 3.0 2.6 2.6 2.9 3.3 3.4 3.2 3.2 3.0
Ownership of dwellings -1.9 -1.9 0.9 1.6 2.0 2.3 2.2 2.9 3.1 3.0 2.9 2.8 2.7 2.6 2.6 2.7 2.7
Indirect taxes and other 1.4 -0.3 1.0 -0.2 -0.9 -0.1 0.9 -1.0 -0.2 -0.1 0.1 0.4 0.0 -0.3 -0.8 -0.5 -0.5
GDP 1.3 0.5 5.8 2.4 2.8 0.5 2.8 3.3 2.7 2.4 2.3 2.6 2.6 2.5 2.3 2.1 2.5
Supply side contribution to GSP growth – percentage point contribution to growth
Agriculture 0.0 0.1 0.1 -0.1 -0.1 0.0 0.1 0.1 0.1 0.1 0.1 0.1 0.1 0.1 0.1 0.1 0.1
Mining 0.9 -0.7 0.4 0.3 0.7 0.5 0.8 0.8 0.3 0.2 0.2 0.2 0.2 0.1 0.2 0.1 0.1
Manufacturing -0.3 -0.1 0.3 -0.1 0.1 0.0 0.0 0.1 0.2 0.3 0.3 0.4 0.4 0.5 0.5 0.4 0.4
Construction -0.5 0.6 1.4 0.7 1.1 -2.5 -0.9 0.2 0.2 0.0 0.0 0.0 0.0 0.2 0.8 0.5 0.5
Distribution -0.3 0.3 0.9 0.8 0.2 1.5 0.3 0.6 0.3 0.2 0.1 0.1 0.2 0.3 0.2 0.2 0.3
Finance 0.1 0.1 0.2 0.3 0.3 0.5 0.4 0.2 0.2 0.2 0.3 0.2 0.2 0.2 0.2 0.1 0.1
Business services -0.2 0.5 1.0 0.5 0.7 0.1 0.4 1.5 0.9 0.9 0.7 0.7 0.7 0.8 0.7 0.7 0.9
Community services 0.4 0.2 0.4 0.2 0.6 0.4 0.6 0.5 0.4 0.3 0.3 0.4 0.4 0.4 0.4 0.4 0.4
Ownership of dwellings -0.2 -0.2 0.1 0.1 0.2 0.2 0.2 0.2 0.3 0.3 0.3 0.2 0.2 0.2 0.2 0.2 0.2
Indirect taxes and other 1.4 -0.3 1.0 -0.2 -0.9 -0.1 0.9 -1.0 -0.2 -0.1 0.1 0.4 0.0 -0.3 -0.8 -0.5 -0.5
GDP 1.3 0.5 5.8 2.4 2.8 0.5 2.8 3.3 2.7 2.4 2.3 2.6 2.6 2.5 2.3 2.1 2.5
Queensland region construction supply and demand analysis: 1995-2026 and quarterly indicators to June 2018 – June Annual Report 2016 14
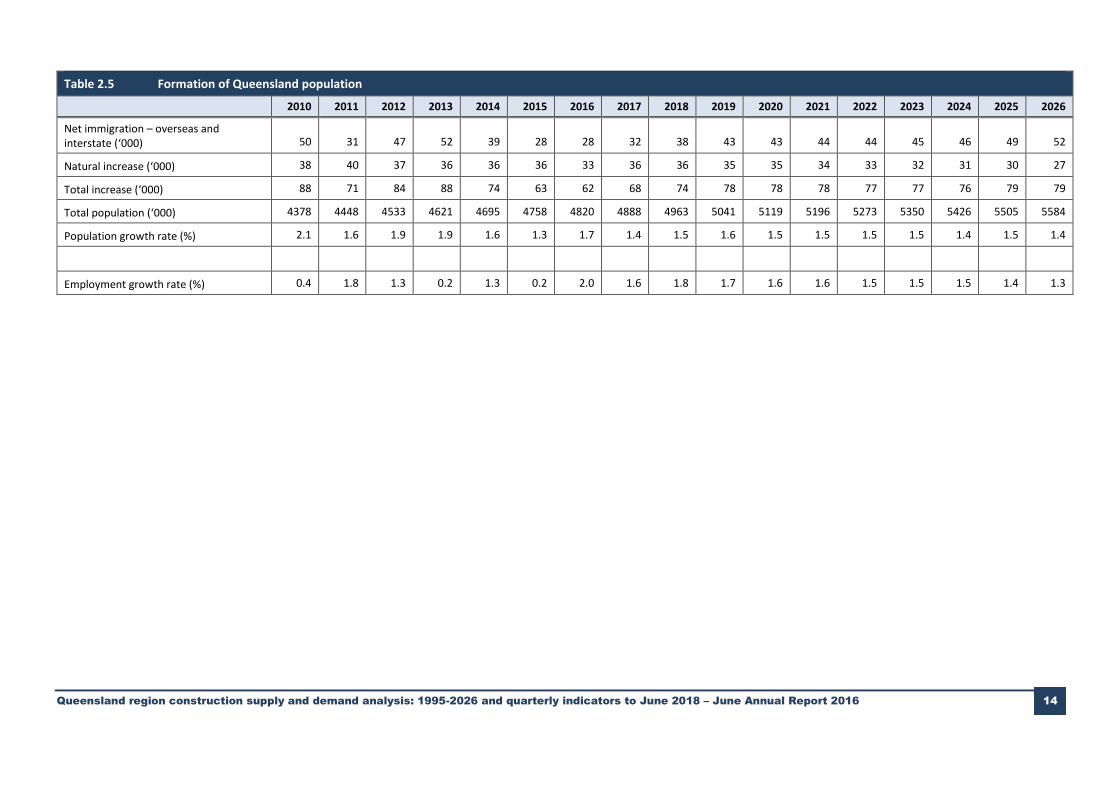
Table 2.5 Formation of Queensland population
2010 2011 2012 2013 2014 2015 2016 2017 2018 2019 2020 2021 2022 2023 2024 2025 2026
Net immigration – overseas and interstate (‘000) 50 31 47 52 39 28 28 32 38 43 43 44 44 45 46 49 52
Natural increase (‘000) 38 40 37 36 36 36 33 36 36 35 35 34 33 32 31 30 27
Total increase (‘000) 88 71 84 88 74 63 62 68 74 78 78 78 77 77 76 79 79
Total population (‘000) 4378 4448 4533 4621 4695 4758 4820 4888 4963 5041 5119 5196 5273 5350 5426 5505 5584
Population growth rate (%) 2.1 1.6 1.9 1.9 1.6 1.3 1.7 1.4 1.5 1.6 1.5 1.5 1.5 1.5 1.4 1.5 1.4
Employment growth rate (%) 0.4 1.8 1.3 0.2 1.3 0.2 2.0 1.6 1.8 1.7 1.6 1.6 1.5 1.5 1.5 1.4 1.3

Queensland region construction supply and demand analysis: 1995-2026 and quarterly
indicators to June 2018 – June Annual Report 2016
15 15 15 15
Table 2.6 Average annual population change by region (‘000)
2001-2005 2005-2015 2015-2018 2018-2026
Brisbane 42.5 42.5 37.3 38.6
Gold Coast 14.6 11.9 10.7 12.6
Sunshine Coast 9.0 6.3 7.0 7.1
West Moreton 1.6 2.0 1.5 2.1
Wide Bay/Burnett 4.9 4.3 1.7 2.8
Darling Downs 2.5 2.9 1.6 2.0
South West -0.2 0.1 -0.1 0.0
Fitzroy 2.9 4.0 2.3 3.4
Central West -0.2 0.0 -0.1 -0.1
Mackay 3.2 3.5 1.4 2.5
Northern 2.9 4.0 2.4 3.7
Far North 3.3 4.4 2.8 3.3
North West -0.3 0.3 0.0 0.1
Queensland 86.8 86.0 68.3 78.0
2.4 Queensland housing affordability
In the annual ALGA/NIEIR “State of the Regions” reports NIEIR has developed a range of indicators to assess the affordability of housing in Australian regions. The results for the Queensland regions are attached. The regions referred to in this section of the report are those used in the ALGA report, however as their names suggest they can be in this context, broadly compared to the regions used elsewhere in this report. For brevity only a selection of years are included the tables. Appendix C contains LGA level data for some of these series and further commentary.
As discussed in previous reports sustainable dwelling markets are those that are able to where dwelling construction keeps pace with population growth. Regions that achieve this generally meet the two criteria listed below;
1. a construction cost for new dwellings that is not significantly below the average market prices for established dwellings; and
2. the expected average income from the labour market catchment must be able to support the average mortgage on new dwelling construction.
If criteria (1) is not satisfied in that the cost of new dwelling construction is well above the average established dwelling prices, then new construction will be discouraged because of the risk of capital losses if the dwelling is on-sold within the first few years of completion.
If condition (2) is not satisfied then new households relying on income to support mortgage payments will not be able to afford new dwellings. In other words, a region that is attractive to new residents will have average household incomes in the catchment region, that are able to support the mortgage levels required to build new dwellings.
The attached tables have a range of indicators that drive local housing markets. It should also be noted that the mortgage costs are calculated on a long-run average mortgage interest rates. In the short-run, mortgage costs may well be below the estimates in the tables.

Queensland region construction supply and demand analysis: 1995-2026 and quarterly
indicators to June 2018 – June Annual Report 2016
16 16 16 16
Ideally, the average ratio of new dwelling costs to established house prices should be less than 85% to 90%, while the mortgage costs for new dwelling construction to labour market catchment average income should be no more than 35% to 40%. Sydney has mortgage costs for new dwelling construction to labour market catchment average income of around 44%, although in 2008 it was over 60%. The figure for the greater Brisbane region is 23% down from 37% in 2008.
A comparison across the regions of the indicators in the tables can be informative. At a glance it can be seen that the Brisbane region has the highest average established dwelling price at $560,000. The Gold Coast has the second highest at just over $500,000, with Sunshine Coast, Logan Redland and Moreton Bay all having values between $400,000 and $500,000. The remaining ALGA regions have values of less than $400,000 but greater than $270,000. All else being equal one could assume that housing affordability in Queensland follows this pattern. However it is important to consider the other indicators in the tables.
The figures for adjusted income per dwelling indicate that it is not Brisbane that has the highest incomes but Mackay, with $132,000 compared to Brisbane with $130,000. However as Mackay house prices are less than $317,000 the ratio of adjusted dwelling price to adjusted average household disposable income is only 2.9 for Mackay but 4.1 for Brisbane. The region with the highest ratio is Gold Coast.
Looking more broadly at catchment incomes, that is the incomes obtainable within commuting distance, Mackay and Brisbane have the highest catchment incomes and Moreton Bay has the lowest. However although Moreton Bay has mid-range dwelling values, the catchment income is low.
The next two indicators show that Moreton Bay residents are the hardest pressed in regards to the two ratios of average mortgage costs on dwellings to average household catchment income. The large values these ratios for Moreton Bay show that in spite of the relatively low housing prices, the ability for the region to attract new residents is hampered by lack of opportunity to earn high incomes within commuting distance.
Table 2.7 Housing affordability – Brisbane City
Housing indicator 1991 1997 2001 2008 2012 2015 2016
Average growth 1997 to
2016 (%)
Average established dwelling price ($cvm '000s) 208725 227618 270438 531375 509386 549130 559976 4.9
Average adjusted household income per occupied dwelling
76746 78339 78329 118612 142509 130944 130444 2.7
Ratio of adjusted dwelling price to adjusted average household disposable income
2.7 2.8 2.9 3.7 3.8 4.0 4.1 2.1
Average household income from labour market catchment
59342 68048 79887 104966 105462 95672 89687 1.5
Ratio of average mortgage costs on established dwellings to average household catchment income
36.5 22.3 22.3 42.1 33.0 33.8 35.3 2.4
Ratio of average mortgage costs on new dwellings to average household catchment income
78.4 42.1 35.5 37.3 27.6 23.8 23.2 -3.1
Share of flats in dwelling stock 18.4 17.2 17.7 19.7 20.5 23.6 25.5 2.1
Ratio of houses in new dwelling approvals na 0.6 0.6 0.4 0.4 0.2 0.2 -6.1
Adults per occupied dwelling 2.2 2.1 2.1 2.1 2.2 2.2 2.1 0.2

Queensland region construction supply and demand analysis: 1995-2026 and quarterly
indicators to June 2018 – June Annual Report 2016
17 17 17 17
Table 2.8 Housing affordability – Gold Coast
Housing indicator 1991 1997 2001 2008 2012 2015 2016
Average growth 1997 to
2016 (%)
Average established dwelling price ($cvm '000s) 225947 255717 284090 550014 469038 492548 504667 3.6
Average adjusted household income per occupied dwelling 51490 52617 53417 89194 108205 106704 110361 4.0
Ratio of adjusted dwelling price to adjusted average household disposable income 4.4 4.8 4.8 5.4 4.7 4.4 4.3 -0.5
Average household income from labour market catchment 51654 54609 62032 77894 76403 69692 66364 1.0
Ratio of average mortgage costs on established dwellings to average household catchment income 45.3 31.3 30.1 58.7 41.9 41.5 43.0 1.7
Ratio of average mortgage costs on new dwellings to average household catchment income 70.8 42.7 38.8 53.6 44.0 39.6 41.1 -0.2
Share of flats in dwelling stock 33.0 23.6 24.2 23.2 21.6 22.2 22.8 -0.2
Ratio of houses in new dwelling approvals na 0.5 0.6 0.5 0.6 0.4 0.5 -0.5
Adults per occupied dwelling 1.9 1.9 1.9 2.0 2.1 2.2 2.2 0.8
Table 2.9 Housing affordability – West Moreton
Housing indicator 1991 1997 2001 2008 2012 2015 2016
Average growth 1997 to
2016 (%)
Average established dwelling price ($cvm '000s) 132112 135990 136730 356165 330125 328259 327502 4.7
Average adjusted household income per occupied dwelling 65201 64559 64457 93560 107753 102175 103129 2.5
Ratio of adjusted dwelling price to adjusted average household disposable income 2.0 2.1 2.1 3.3 3.3 3.2 3.1 2.2
Average household income from labour market catchment 52758 59960 68115 87443 88673 81416 77262 1.3
Ratio of average mortgage costs on established dwellings to average household catchment income 26.7 15.6 14.0 36.8 27.4 25.6 25.3 2.6
Ratio of average mortgage costs on new dwellings to average household catchment income 56.1 31.7 28.3 42.3 31.9 29.3 28.0 -0.6
Share of flats in dwelling stock 3.2 3.1 3.5 3.3 3.2 3.7 4.2 1.7
Ratio of houses in new dwelling approvals na 0.9 0.9 0.9 0.9 0.9 0.8 -0.6
Adults per occupied dwelling 2.3 2.1 2.1 2.1 2.1 2.2 2.2 0.2

Queensland region construction supply and demand analysis: 1995-2026 and quarterly
indicators to June 2018 – June Annual Report 2016
18 18 18 18
Table 2.10 Housing affordability – Logan Redland
Housing indicator 1991 1997 2001 2008 2012 2015 2016
Average growth 1997 to
2016 (%)
Average established dwelling price ($cvm '000s) 173398 182663 196305 431379 403651 400876 401817 4.2
Average adjusted household income per occupied dwelling 72372 71854 71960 99544 115206 102441 102091 1.9
Ratio of adjusted dwelling price to adjusted average household disposable income 2.4 2.5 2.5 3.6 3.7 3.8 3.9 2.3
Average household income from labour market catchment 33829 38494 43652 56049 56350 50567 47606 1.1
Ratio of average mortgage costs on established dwellings to average household catchment income 54.4 32.2 30.0 66.0 50.5 48.6 49.1 2.2
Ratio of average mortgage costs on new dwellings to average household catchment income 89.2 50.6 44.7 67.3 51.7 52.9 52.9 0.2
Share of flats in dwelling stock 4.2 3.4 3.5 3.7 3.7 4.6 4.9 2.0
Ratio of houses in new dwelling approvals na 0.8 0.9 0.7 0.7 0.8 0.8 0.0
Adults per occupied dwelling 2.2 2.1 2.1 2.2 2.2 2.2 2.2 0.2
Table 2.11 Housing affordability – Moreton Bay
Housing indicator 1991 1997 2001 2008 2012 2015 2016
Average growth 1997 to
2016 (%)
Average established dwelling price ($cvm '000s) 163391 180763 196393 423551 396282 400143 402095 4.3
Average adjusted household income per occupied dwelling 65553 64067 64489 94031 112728 108045 109416 2.9
Ratio of adjusted dwelling price to adjusted average household disposable income 2.5 2.8 2.8 3.9 3.8 3.7 3.6 1.4
Average household income from labour market catchment 27694 29714 31413 38782 39791 35306 33432 0.6
Ratio of average mortgage costs on established dwellings to average household catchment income 61.1 40.6 41.1 90.9 68.0 68.1 68.0 2.8
Ratio of average mortgage costs on new dwellings to average household catchment income 106.1 62.9 59.1 93.3 67.8 68.1 65.0 0.2
Share of flats in dwelling stock 6.9 6.0 5.9 6.0 6.9 8.8 9.5 2.5
Ratio of houses in new dwelling approvals na 0.8 0.9 0.8 0.7 0.7 0.6 -1.6
Adults per occupied dwelling 2.2 2.1 2.1 2.1 2.1 2.1 2.1 0.1

Queensland region construction supply and demand analysis: 1995-2026 and quarterly
indicators to June 2018 – June Annual Report 2016
19 19 19 19
Table 2.12 Housing affordability – Sunshine Coast
Housing indicator 1991 1997 2001 2008 2012 2015 2016
Average growth 1997 to
2016 (%)
Average established dwelling price ($cvm '000s) 195794 232152 254224 520518 453928 477604 483668 3.9
Average adjusted household income per occupied dwelling 50327 50260 51229 80317 103024 104437 106987 4.1
Ratio of adjusted dwelling price to adjusted average household disposable income 3.9 4.5 4.5 5.9 4.8 4.4 4.3 -0.1
Average household income from labour market catchment 42398 44646 50972 65814 64896 58557 55735 1.2
Ratio of average mortgage costs on established dwellings to average household catchment income 47.9 34.9 32.9 66.0 47.9 48.0 49.2 1.8
Ratio of average mortgage costs on new dwellings to average household catchment income 86.4 53.2 46.4 67.8 53.9 53.7 53.4 0.0
Share of flats in dwelling stock 21.7 15.7 15.6 15.0 12.9 13.2 13.4 -0.8
Ratio of houses in new dwelling approvals na 0.7 0.7 0.7 0.8 0.8 0.7 0.4
Adults per occupied dwelling 2.0 1.9 1.9 2.0 2.1 2.2 2.2 0.7
Table 2.13 Housing affordability – Darling Downs South West
Housing indicator 1991 1997 2001 2008 2012 2015 2016
Average growth 1997 to
2016 (%)
Average established dwelling price ($cvm '000s) 131005 143646 141128 275103 290317 305589 301366 4.0
Average adjusted household income per occupied dwelling 72046 71468 71189 100427 108650 101034 101439 1.9
Ratio of adjusted dwelling price to adjusted average household disposable income 1.9 2.0 2.1 2.7 2.8 3.1 3.1 2.4
Average household income from labour market catchment 42016 54840 65476 72467 75433 69398 67344 1.1
Ratio of average mortgage costs on established dwellings to average household catchment income 33.4 18.2 14.7 32.3 26.8 27.1 25.7 1.9
Ratio of average mortgage costs on new dwellings to average household catchment income 81.4 40.3 33.6 40.5 33.1 31.3 30.0 -1.5
Share of flats in dwelling stock 7.9 7.3 7.3 7.8 8.3 9.1 9.5 1.4
Ratio of houses in new dwelling approvals na 0.9 0.9 0.8 0.8 0.7 0.7 -1.1
Adults per occupied dwelling 2.2 2.0 2.0 2.0 2.0 2.0 2.0 -0.3

Queensland region construction supply and demand analysis: 1995-2026 and quarterly
indicators to June 2018 – June Annual Report 2016
20 20 20 20
Table 2.14 Housing affordability – Far North Torres
Housing indicator 1991 1997 2001 2008 2012 2015 2016
Average growth 1997 to
2016 (%)
Average established dwelling price ($cvm '000s) 161245 197131 184395 381160 319276 329979 336355 2.9
Average adjusted household income per occupied dwelling 71882 73252 73388 108389 106440 97532 99611 1.6
Ratio of adjusted dwelling price to adjusted average household disposable income 2.3 2.8 2.8 3.1 3.3 3.3 3.3 0.8
Average household income from labour market catchment 43411 49074 54444 67846 66026 59123 56563 0.8
Ratio of average mortgage costs on established dwellings to average household catchment income 39.7 27.7 23.0 47.4 33.7 33.9 34.4 1.1
Ratio of average mortgage costs on new dwellings to average household catchment income 95.7 53.8 48.3 60.5 51.6 50.8 50.0 -0.4
Share of flats in dwelling stock 17.4 16.2 17.0 17.1 17.2 17.1 17.0 0.3
Ratio of houses in new dwelling approvals na 0.7 0.8 0.7 1.0 0.9 0.9 1.2
Adults per occupied dwelling 2.1 2.1 2.0 2.0 2.1 2.1 2.1 0.2
Table 2.15 Housing affordability – Fitzroy Central West
Housing indicator 1991 1997 2001 2008 2012 2015 2016
Average growth 1997 to
2016 (%)
Average established dwelling price ($cvm '000s) 116872 137987 135284 357120 371741 314717 292200 4.0
Average adjusted household income per occupied dwelling 82221 79858 79884 113378 128755 122724 125424 2.4
Ratio of adjusted dwelling price to adjusted average household disposable income 1.5 1.8 1.8 2.5 2.8 2.8 2.7 2.2
Average household income from labour market catchment 46384 61675 72512 96581 95451 82704 79588 1.4
Ratio of average mortgage costs on established dwellings to average household catchment income 26.9 16.0 14.0 34.6 29.2 26.5 23.2 2.0
Ratio of average mortgage costs on new dwellings to average household catchment income 73.6 36.9 31.8 40.6 33.7 32.1 29.1 -1.2
Share of flats in dwelling stock 8.4 7.4 7.9 7.5 7.6 7.8 7.9 0.3
Ratio of houses in new dwelling approvals na 0.8 0.9 0.8 0.8 0.9 0.9 0.2
Adults per occupied dwelling 2.3 2.1 2.0 2.1 2.1 2.1 2.1 -0.1

Queensland region construction supply and demand analysis: 1995-2026 and quarterly
indicators to June 2018 – June Annual Report 2016
21 21 21 21
Table 2.16 Housing affordability – Mackay
Housing indicator 1991 1997 2001 2008 2012 2015 2016
Average growth 1997 to
2016 (%)
Average established dwelling price ($cvm '000s) 136317 174909 166003 429352 435974 346545 317095 3.2
Average adjusted household income per occupied dwelling 83611 84947 84647 122293 146789 132220 132807 2.4
Ratio of adjusted dwelling price to adjusted average household disposable income 1.7 2.2 2.2 3.3 2.9 3.0 2.9 1.5
Average household income from labour market catchment 51224 62253 69149 105595 107398 95935 91806 2.1
Ratio of average mortgage costs on established dwellings to average household catchment income 28.6 21.3 18.9 41.8 33.0 30.6 25.3 0.9
Ratio of average mortgage costs on new dwellings to average household catchment income 78.3 43.3 39.9 47.9 38.5 36.2 32.6 -1.5
Share of flats in dwelling stock 10.0 10.6 10.0 10.6 10.0 10.7 10.7 0.1
Ratio of houses in new dwelling approvals na 0.8 0.8 0.7 0.8 0.7 0.8 0.0
Adults per occupied dwelling 2.2 2.1 2.1 2.2 2.2 2.2 2.1 0.1
Table 2.17 Housing affordability – Townsville North West
Housing indicator 1991 1997 2001 2008 2012 2015 2016
Average growth 1997 to
2016 (%)
Average established dwelling price ($cvm '000s) 135433 171293 168559 375629 342709 309460 296999 2.9
Average adjusted household income per occupied dwelling 91741 90078 89999 114118 126724 112666 112876 1.2
Ratio of adjusted dwelling price to adjusted average household disposable income 1.5 1.9 2.0 2.6 2.9 2.9 2.9 2.4
Average household income from labour market catchment 51474 61630 63686 85653 83621 75187 73013 0.9
Ratio of average mortgage costs on established dwellings to average household catchment income 27.2 18.7 17.7 36.7 28.4 26.5 23.8 1.3
Ratio of average mortgage costs on new dwellings to average household catchment income 76.7 39.9 38.2 43.0 36.4 33.9 32.8 -1.0
Share of flats in dwelling stock 13.3 12.1 12.5 12.7 12.5 13.2 13.4 0.5
Ratio of houses in new dwelling approvals na 0.8 0.8 0.7 0.8 0.7 0.8 0.2
Adults per occupied dwelling 2.3 2.1 2.1 2.1 2.1 2.1 2.1 -0.1
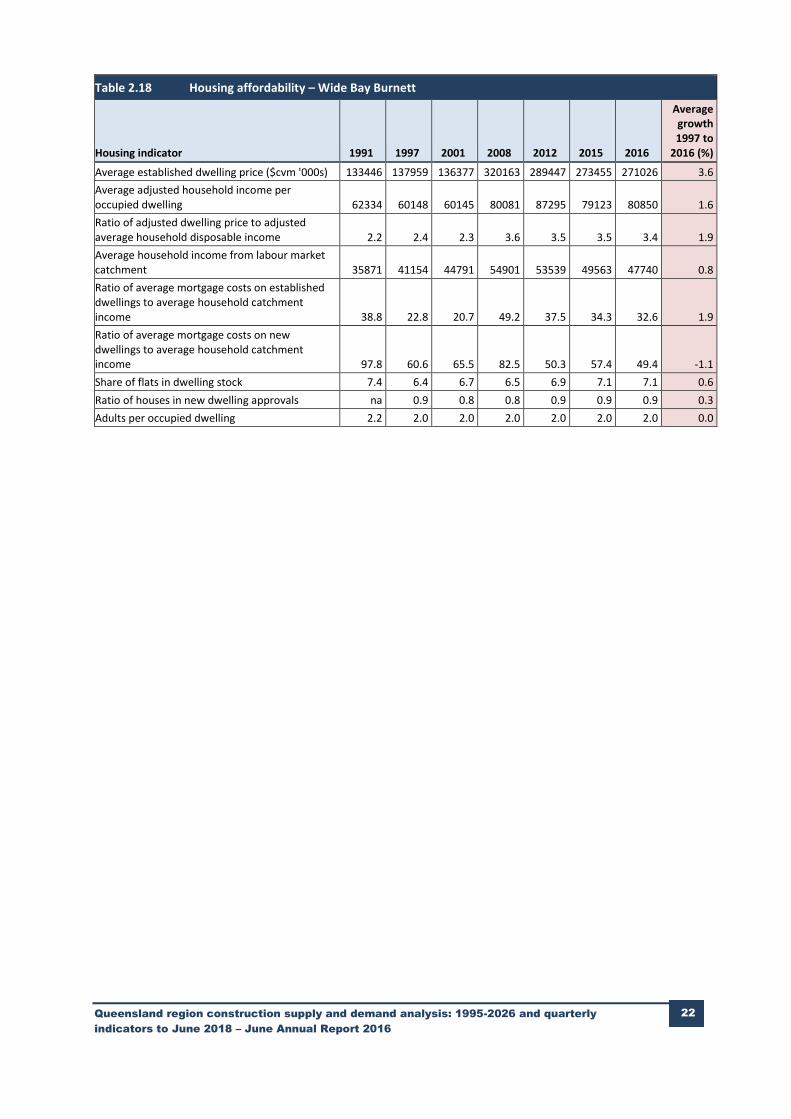
Queensland region construction supply and demand analysis: 1995-2026 and quarterly
indicators to June 2018 – June Annual Report 2016
22 22 22 22
Table 2.18 Housing affordability – Wide Bay Burnett
Housing indicator 1991 1997 2001 2008 2012 2015 2016
Average growth 1997 to
2016 (%)
Average established dwelling price ($cvm '000s) 133446 137959 136377 320163 289447 273455 271026 3.6
Average adjusted household income per occupied dwelling 62334 60148 60145 80081 87295 79123 80850 1.6
Ratio of adjusted dwelling price to adjusted average household disposable income 2.2 2.4 2.3 3.6 3.5 3.5 3.4 1.9
Average household income from labour market catchment 35871 41154 44791 54901 53539 49563 47740 0.8
Ratio of average mortgage costs on established dwellings to average household catchment income 38.8 22.8 20.7 49.2 37.5 34.3 32.6 1.9
Ratio of average mortgage costs on new dwellings to average household catchment income 97.8 60.6 65.5 82.5 50.3 57.4 49.4 -1.1
Share of flats in dwelling stock 7.4 6.4 6.7 6.5 6.9 7.1 7.1 0.6
Ratio of houses in new dwelling approvals na 0.9 0.8 0.8 0.9 0.9 0.9 0.3
Adults per occupied dwelling 2.2 2.0 2.0 2.0 2.0 2.0 2.0 0.0

Queensland region construction supply and demand analysis: 1995-2026 and quarterly
indicators to June 2018 – June Annual Report 2016
23 23 23 23
3. Queensland construction activity in the Australian context
3.1 Queensland construction: The headline outcomes
The headline outcomes for total Queensland construction, from Table 3.2(c), are the following.
(i) In 2014-15 Queensland construction activity (or total work done across the dwelling, non-residential building and engineering segments) is estimated to have declined by 21.5%. The figure for 2015-16 is a decline of 16.5%. The large falls in engineering construction over 2015-16 are only partially offset by the increase in dwelling and non-residential expenditure.
(ii) The projected construction activity growth rate for 2016-17 is an increase in expenditure of 2.1%. This is the result of the slower falls in engineering construction expenditures being offset by continued growth in residential construction. Dwelling construction is projected to grow at 7.5% or $1.4 billion. This will comfortably offset the projected fall across engineering and non-residential construction of $0.5 billion. The level of engineering construction expenditure is projected to be less than half of the peak level of 2014. Record low interest rates combined with steady population growth have ensured that dwelling expenditure continues to rise. Other dwelling expenditures have also been rising since 2014 with strong growth of 11% over 2016 to be followed by further growth of 7.8% and 6.1% over 2017 and 2018. Non-residential construction expenditures are projected to remain unchanged over 2016-17. The overall rise in construction activity after two years of decline is the result of the projected rise in both new residential construction and alterations and renovations in the dwelling sector.
(iii) In 2017-18 total Queensland construction is projected to grow by just under 3%, all three major components are growing. Dwelling construction is projected to grow at 4.0% contributing 1.8 percentage points to total construction growth. Non-residential construction is projected to grow at 3.5% with a contribution to total growth of 0.5 percentage points. Engineering construction will return to growth at 1.4%. However the timing of individual major projects could shift the growth into later years.
3.2 Total construction: A comparison with last year’s Annual Report
If the projections of the 2015 annual report are adjusted to the price base of this year's report a comparison of the projections can be made. In the 2015 Report the projected growth in the total level of Queensland construction activity for 2016 was at a decline of 6.6%, in this year’s report the estimate for 2016 total construction activity is for growth of 6.6%. This is due in part to revisions in the historical data for 2016, and to falling world commodity prices delaying mining investment at the same time as the construction on the LNG projects were finishing.

Queensland region construction supply and demand analysis: 1995-2026 and quarterly
indicators to June 2018 – June Annual Report 2016
24 24 24 24
For the 2017 fiscal year, the projection in last year’s report was for the decline in 2016 to be reversed by growth in 2017, in this report we have the decline of 6.6% for 2016 being only partially offset by the growth of 2.1% for 2017, due largely to the low commodity prices delaying mining and related projects. As has been indicated in previous reports the timing of the ramp up and wind down of the large engineering projects, such as the coal and LNG investments have significant outcomes in short term.
3.3 The Queensland dwelling market
3.3.1 New dwelling construction
For the 2015 fiscal year total new construction in private dwelling grew by 15.1% to reach at $10.9 billion. For 2016 it is an estimated that the increase in private new dwelling construction will be 17.2%. The peak levels of 2008 will be exceeded over the 2017 fiscal year. This is apparent from Figure 3.1 where it can be seen that dwelling approvals are now around similar levels to those that occurred in the year prior to the 2008 dwelling construction peak.
Queensland’s population increased by over 100,000 per annum over the years 2007 to 2009. Currently the population is increasing at less than 65,000 per year. Between 2003 and 2009 Queensland employment was growing at between 3% and 5%, between the years 2010 to 2015 the growth in employment averaged just under 1% per annum. Currently employment is growing at 2%. Hence the indicators are that improved employment growth should herald faster population growth which combined with low interest rates should ensure that private new dwelling construction continues to grow until the end of 2018.
3.3.2 Other dwelling expenditure
Queensland’s other renovation expenditures increased by 1.7% over 2015 contributing just 0.1 percentage points to total construction growth for that year. Growth is estimated 11.1% over 2016. The next two years will have an average annual growth of 7%. The percentage point contribution to total construction growth for these two years are 1.2 for 2017 and 0.8 for 2018
Other renovation expenditure is currently $6.0 billion per annum and is still under 86% of the pre-GFC peak of $6.9 billion from 2007. This level is likely to be reached within the next two to three years.
3.3.3 Total Queensland private dwelling construction expenditures
There have now been three straight years of positive growth in private dwelling. In 2014 growth reached 4.7% followed by 10.3% in 2015 and 15.2% in 2016. The projection is for growth of 7.3% in 2017 and 4.1% in 2018.
In terms of contribution to total construction growth private dwelling expenditures contributed 2.2 percentage points growth reducing the 2015 total construction decline of 21.5%. In 2016 private dwelling expenditure contributed a positive 4.7 percentage points to the total decline of 16.5% in the following two years private dwelling expenditure contributes an average of 2.5 percentage points to total construction average growth of just under 2.5%.

Queensland region construction supply and demand analysis: 1995-2026 and quarterly
indicators to June 2018 – June Annual Report 2016
25 25 25 25
3.3.4 Dwelling commencements
From Appendix Table A.19 it can be seen that the number of dwelling units commenced in 2015 was just under the pre-GFC peak of 45,400 but higher than the pre-GFC five year trend. In the five years after 2008 the average was 31,000. Since the GFC the number of dwelling units commenced has been below trend, this is in-spite of 1.9% per annum population growth. Dwelling commencements for 2016 are likely to pass the 50,000 mark as the pent-up demand for dwellings is slowly relieved. Over the next two years the number of dwellings commenced is to average around 50,200 dwellings.
Figure 3.1: Queensland dwelling – new construction approvals

Queensland region construction supply and demand analysis: 1995-2026 and quarterly
indicators to June 2018 – June Annual Report 2016
26 26 26 26
Figure 3.2: Queensland dwelling – new construction approvals
Figure 3.3: Queensland non-residential building approvals

Queensland region construction supply and demand analysis: 1995-2026 and quarterly
indicators to June 2018 – June Annual Report 2016
27 27 27 27
Figure 3.4: Real Queensland established house prices
Figure 3.5: Queensland housing rental vacancy rate
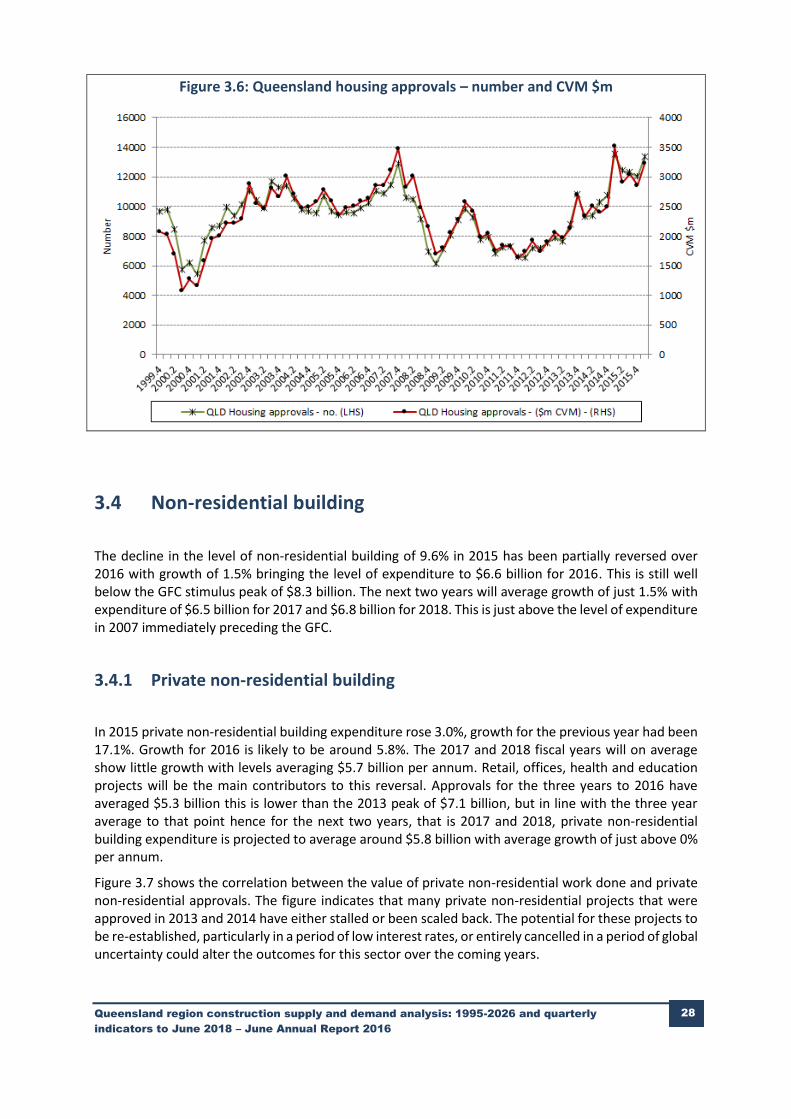
Queensland region construction supply and demand analysis: 1995-2026 and quarterly
indicators to June 2018 – June Annual Report 2016
28 28 28 28
Figure 3.6: Queensland housing approvals – number and CVM $m
3.4 Non-residential building
The decline in the level of non-residential building of 9.6% in 2015 has been partially reversed over 2016 with growth of 1.5% bringing the level of expenditure to $6.6 billion for 2016. This is still well below the GFC stimulus peak of $8.3 billion. The next two years will average growth of just 1.5% with expenditure of $6.5 billion for 2017 and $6.8 billion for 2018. This is just above the level of expenditure in 2007 immediately preceding the GFC.
3.4.1 Private non-residential building
In 2015 private non-residential building expenditure rose 3.0%, growth for the previous year had been 17.1%. Growth for 2016 is likely to be around 5.8%. The 2017 and 2018 fiscal years will on average show little growth with levels averaging $5.7 billion per annum. Retail, offices, health and education projects will be the main contributors to this reversal. Approvals for the three years to 2016 have averaged $5.3 billion this is lower than the 2013 peak of $7.1 billion, but in line with the three year average to that point hence for the next two years, that is 2017 and 2018, private non-residential building expenditure is projected to average around $5.8 billion with average growth of just above 0% per annum.
Figure 3.7 shows the correlation between the value of private non-residential work done and private non-residential approvals. The figure indicates that many private non-residential projects that were approved in 2013 and 2014 have either stalled or been scaled back. The potential for these projects to be re-established, particularly in a period of low interest rates, or entirely cancelled in a period of global uncertainty could alter the outcomes for this sector over the coming years.
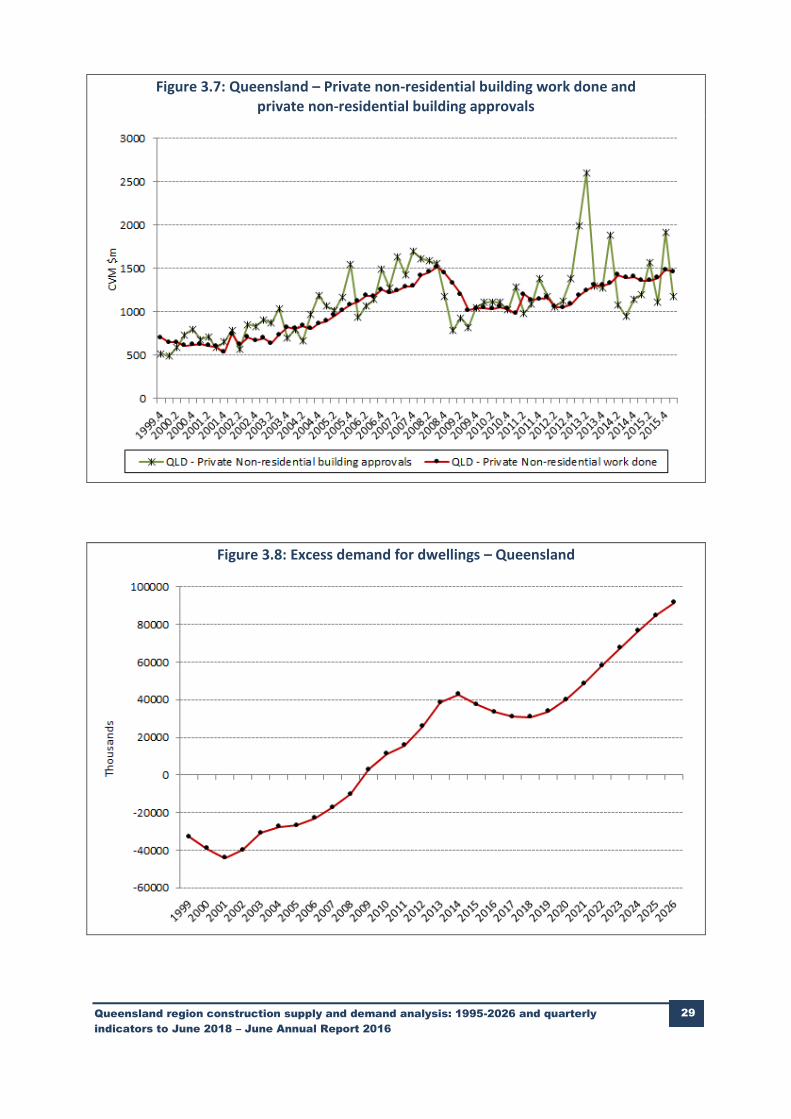
Queensland region construction supply and demand analysis: 1995-2026 and quarterly
indicators to June 2018 – June Annual Report 2016
29 29 29 29
Figure 3.7: Queensland – Private non-residential building work done and private non-residential building approvals
Figure 3.8: Excess demand for dwellings – Queensland

Queensland region construction supply and demand analysis: 1995-2026 and quarterly
indicators to June 2018 – June Annual Report 2016
30 30 30 30
3.4.2 Public non-residential building activity
The fiscal year 2016 looks set to have the lowest public non-residential building expenditure for at least 16 years. The GFC stimulus packages brought forward many projects that would normally have been allocated to recent years. The years since the stimulus peak of $4 billion in 2011 have seen a steady decline in government non-residential building expenditure, for 2016 public non-residential building expenditure is expected to be just $731 million.
The stimulus policy expenditures brought sudden large growth rates. In 2009 public sector non-residential expenditure increased by 41%, contributing 1.3 percentage points to total construction growth of 5.4%. The following year the increase was in the order of 82% contributing a positive 3.4 percentage points to a construction sector in decline. In 2011 the increase was 10% and the contribution to growth was 0.8 percentage points. The ending of the stimulus has resulted in very large falls averaging over 28% per annum over the 2012 to 2016 period. The pull forward effect mentioned above and the policies of debt consolidation of both the federal and state government are the cause of the dramatic declines since 2011.
The decline for 2016 has been smaller at 23.6%, however by 2017 the cumulative population increases should necessitate that expenditures be increased. The projection is for a 22.8% increase in public non-residential construction for 2017 and 3.2% for 2018.
Figure 3.9: Queensland share of national population increase and national approvals (%)

Queensland region construction supply and demand analysis: 1995-2026 and quarterly
indicators to June 2018 – June Annual Report 2016
31 31 31 31
3.4.3 Major Queensland non-residential building projects
In real terms over the last six months the value of non-residential building projects under construction or committed have declined by 8.6% or $152 million, projects under consideration have declined by 32.1% or $254 million.
Projects that have recently moved to the construction phase or are committed are;
The $350 million Industry and business park, Westgate at Wacol, the $250 million Project LIFT: upgrades to Gold Coast Airport - includes a three-level terminal building and five new air bridges, the $100 million Brisbane Airport Domestic Terminal Expansion - Includes construction of 11 new gates and expansion of the northern apron, the $23 million Gympie Aquatic Recreation Centre and the $20 million The Point - retail centre.
Other Current major projects under construction or committed are; the $1.9 billion Sunshine Coast University Hospital, the $1 billion ICON Ipswich - Ipswich CBD renewal, the $0.97 billion Jewel mixed use development at Surfers Paradise and the $0.815 billion Parklands Commonwealth Games Village construction on the Gold Coast.
Recently completed projects include the $210 million Gold Coast Private Hospital, the $61 million Brisbane State High School Redevelopment and the $50 million Rydges Hotel Development.
Figure 3.10: Queensland non-residential building approvals and work done
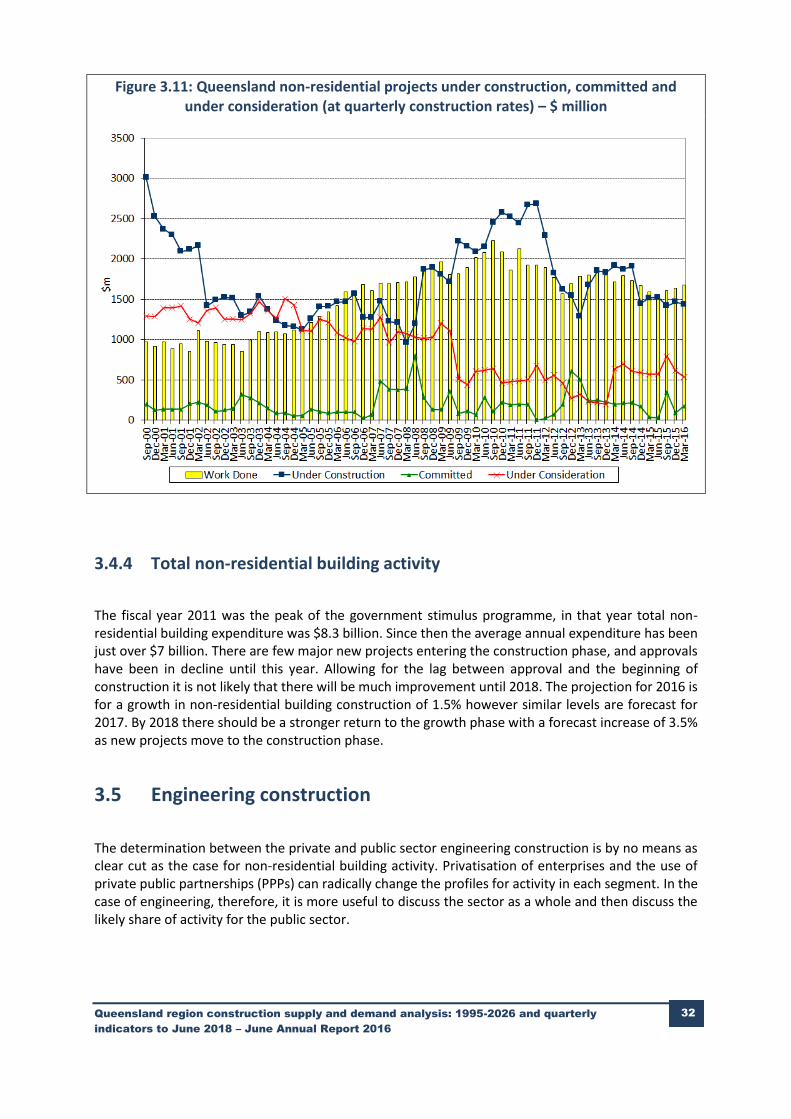
Queensland region construction supply and demand analysis: 1995-2026 and quarterly
indicators to June 2018 – June Annual Report 2016
32 32 32 32
Figure 3.11: Queensland non-residential projects under construction, committed and under consideration (at quarterly construction rates) – $ million
3.4.4 Total non-residential building activity
The fiscal year 2011 was the peak of the government stimulus programme, in that year total non-residential building expenditure was $8.3 billion. Since then the average annual expenditure has been just over $7 billion. There are few major new projects entering the construction phase, and approvals have been in decline until this year. Allowing for the lag between approval and the beginning of construction it is not likely that there will be much improvement until 2018. The projection for 2016 is for a growth in non-residential building construction of 1.5% however similar levels are forecast for 2017. By 2018 there should be a stronger return to the growth phase with a forecast increase of 3.5% as new projects move to the construction phase.
3.5 Engineering construction
The determination between the private and public sector engineering construction is by no means as clear cut as the case for non-residential building activity. Privatisation of enterprises and the use of private public partnerships (PPPs) can radically change the profiles for activity in each segment. In the case of engineering, therefore, it is more useful to discuss the sector as a whole and then discuss the likely share of activity for the public sector.

Queensland region construction supply and demand analysis: 1995-2026 and quarterly
indicators to June 2018 – June Annual Report 2016
33 33 33 33
3.5.1 Engineering: The segment drivers
The growth in engineering construction expenditures are summarised in Table 3.4. The table gives the percentage point contribution of each of the major engineering segments, that is; roads, water storage, heavy industry etc. to total engineering construction growth.
Between 2006 and 2014 the heavy industry segment has been the largest contributor to total engineering growth averaging 13.4 percentage points of average annual engineering growth of 19.6% per annum. Over the same period the roads, highways and subdivisions segment was the second largest contributor to growth contributing on average 2.1 percentage points per annum.
In contrast, in 2015 heavy industry is the major contributor to the decline in engineering. The heavy industry contribution was -23.8 percentage points of the total decline of -33.7% for total engineering construction. A $15 billion decline in engineering expenditure occurred over 2015, of which $11 billion was lost in heavy industry. No segments exhibited strong positive growth over 2015.
This pattern was repeated in 2016 with engineering construction declining by 37.5%. In terms of contributing segments, -33.1 percentage points of this decline will be from heavy industry as the construction phase of the current LNG projects ends, and the remaining projects, such as the Arrow LNG plant are stalled or cancelled as a result of continued low oil prices. Roads and highways offer a small positive contribution in 2016 with a 0.9 percentage point contribution. On average 2015 and 2016 total engineering construction declined by $13 billion per annum.
Over the next two years the average decline in Queensland heavy industry expenditures is projected to be an average of $870 million per annum. The decline in total engineering expenditures averages $1065 million per annum, hence the other engineering sectors will contribute around $765 million per annum.
3.5.2 Mining investment and output
The consequences of a long period of elevated mining investment are now having an impact on Queensland’s mining output. Mining output is estimated to have expanded by an average of 13.7% per annum over 2015 and 2016, followed by an 8.7% gain in 2017 and 3% in 2018.
Figure 3.15 clearly shows the relationship of LNG investment to LNG output. The sharp rise in investment beginning in 2012, peaks in 2014 and then wanes over 2015 to 2018. In response output is seen to be coming online beginning in 2015 and rapidly ramping up to reach a steady level by 2017.
World economic conditions will be the main determinant of any second wave of LNG investment.
3.5.3 Engineering construction: The outlook
In 2016 the estimated decline in Queensland engineering construction expenditure was 37.5%, with the decline being driven by a 40.9% decrease in private engineering construction expenditure. This decline contributed -20.5 percentage points to the total Queensland construction decline.
In 2017 private engineering construction is predicted to decline by 5.2%, reducing Queensland’s total construction activity growth by -1.8 percentage points. Public engineering is projected to increase by 11.0%, raising the overall construction industry growth rate by 0.8 percentage points.
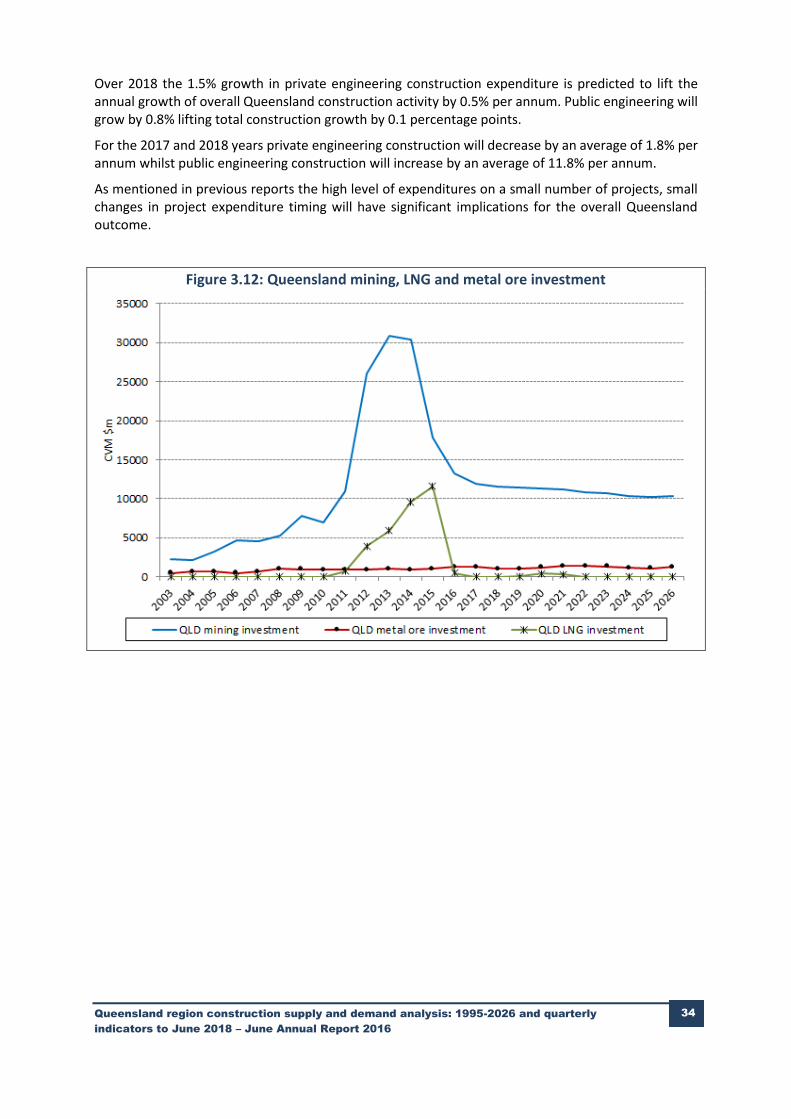
Queensland region construction supply and demand analysis: 1995-2026 and quarterly
indicators to June 2018 – June Annual Report 2016
34 34 34 34
Over 2018 the 1.5% growth in private engineering construction expenditure is predicted to lift the annual growth of overall Queensland construction activity by 0.5% per annum. Public engineering will grow by 0.8% lifting total construction growth by 0.1 percentage points.
For the 2017 and 2018 years private engineering construction will decrease by an average of 1.8% per annum whilst public engineering construction will increase by an average of 11.8% per annum.
As mentioned in previous reports the high level of expenditures on a small number of projects, small changes in project expenditure timing will have significant implications for the overall Queensland outcome.
Figure 3.12: Queensland mining, LNG and metal ore investment

Queensland region construction supply and demand analysis: 1995-2026 and quarterly
indicators to June 2018 – June Annual Report 2016
35 35 35 35
Figure 3.13: Queensland real mining output % rate of growth
Figure 3.14: Queensland mining investment (2011 $m)
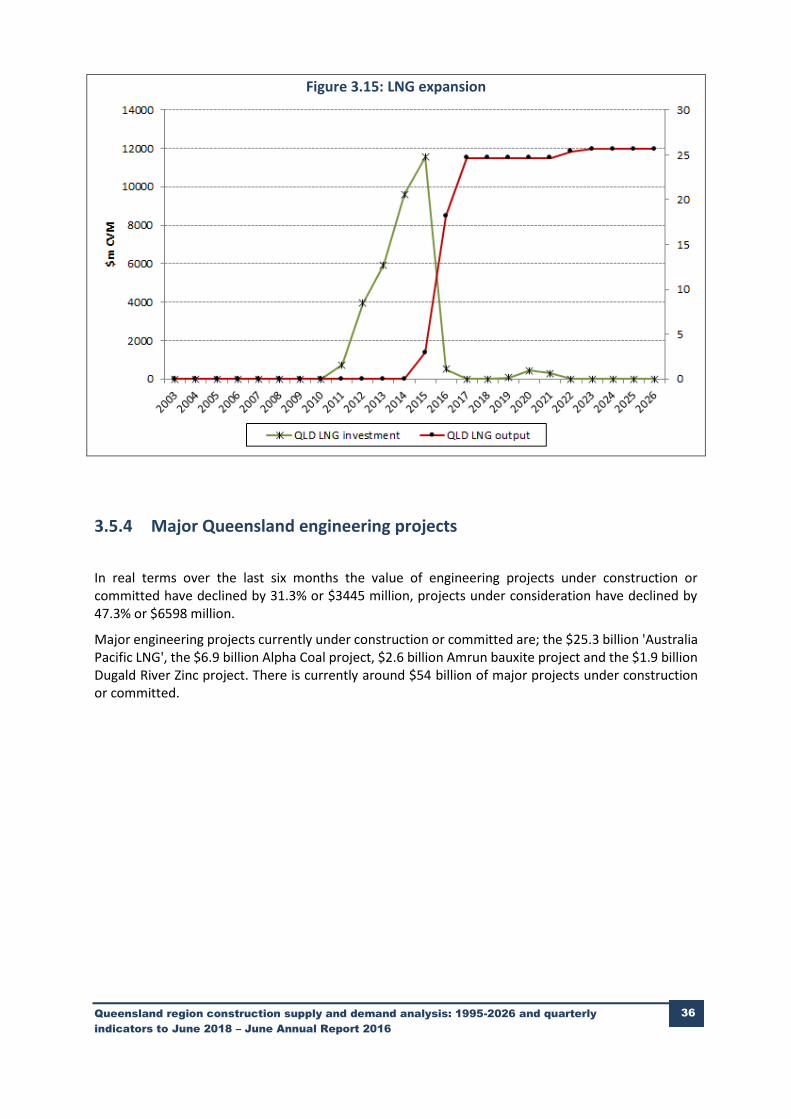
Queensland region construction supply and demand analysis: 1995-2026 and quarterly
indicators to June 2018 – June Annual Report 2016
36 36 36 36
Figure 3.15: LNG expansion
3.5.4 Major Queensland engineering projects
In real terms over the last six months the value of engineering projects under construction or committed have declined by 31.3% or $3445 million, projects under consideration have declined by 47.3% or $6598 million.
Major engineering projects currently under construction or committed are; the $25.3 billion 'Australia Pacific LNG', the $6.9 billion Alpha Coal project, $2.6 billion Amrun bauxite project and the $1.9 billion Dugald River Zinc project. There is currently around $54 billion of major projects under construction or committed.

Queensland region construction supply and demand analysis: 1995-2026 and quarterly
indicators to June 2018 – June Annual Report 2016
37 37 37 37
Figure 3.16: Queensland engineering – work done
Figure 3.17: Queensland total engineering – work yet to be done

Queensland region construction supply and demand analysis: 1995-2026 and quarterly
indicators to June 2018 – June Annual Report 2016
38 38 38 38
Figure 3.18: Queensland engineering projects under construction, committed and under consideration (at quarterly construction rates) – $ million
3.6 Queensland’s construction share of total Australian construction
In 2014, Queensland’s construction share of total Australian construction was 29.6%, this was a high point and in contrast for the years 1997 to 2006 the Queensland share of Australian construction activity was 22.4%. By 2016 this share had fallen to 20%. For the following three years 2017 to 2018 inclusive, the Queensland share of total construction expenditure averages 19.7%.
In 2016 Residential building in Queensland accounts for 21.1% of the nation’s expenditure in the segment, whilst the non-residential building share of the national non-residential building has averaged 20.5% since 2011. The share for residential should average around 21% through to 2018. Non-residential construction in Queensland, however is expected to have a diminishing share of the national expenditure averaging 18.5% per annum over 2017 and 2018.

Queensland region construction supply and demand analysis: 1995-2026 and quarterly
indicators to June 2018 – June Annual Report 2016
39 39 39 39
Figure 3.19: Share of public engineering in total engineering (%)
Figure 3.20: Share of Queensland construction industry in GSP (%)
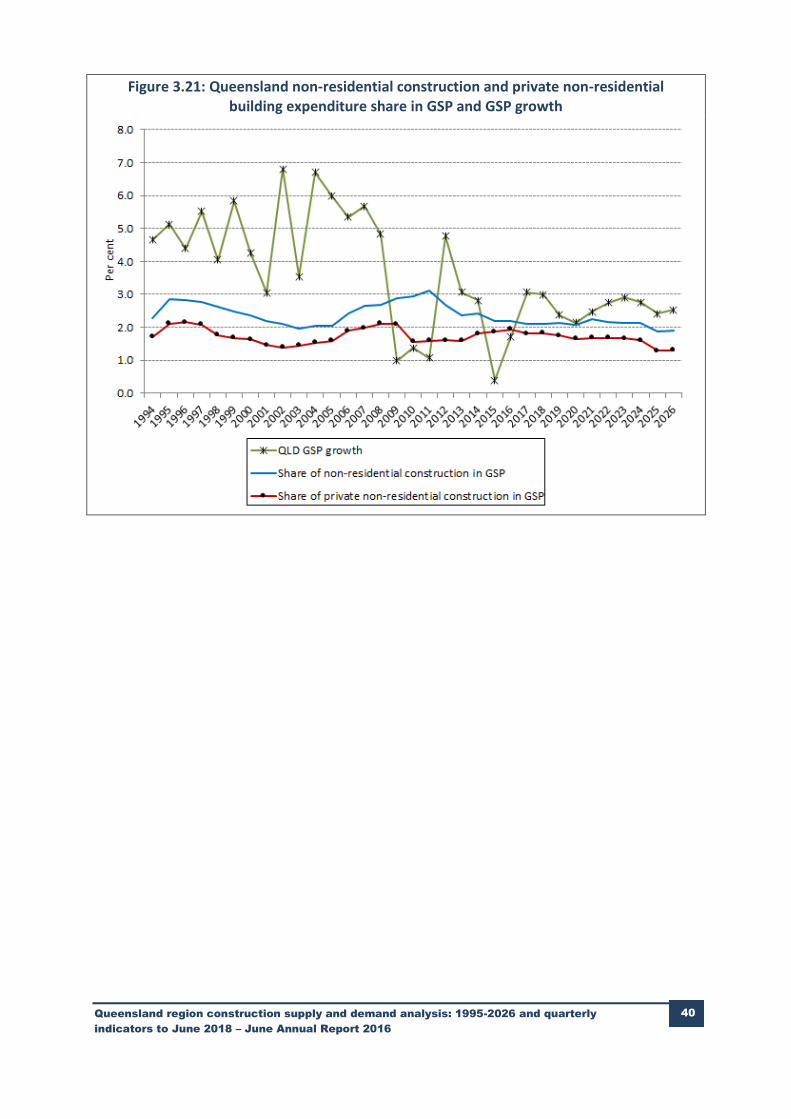
Queensland region construction supply and demand analysis: 1995-2026 and quarterly
indicators to June 2018 – June Annual Report 2016
40 40 40 40
Figure 3.21: Queensland non-residential construction and private non-residential building expenditure share in GSP and GSP growth

Queensland region construction supply and demand analysis: 1995-2026 and quarterly indicators to June 2018 – June Annual Report 2016 41
Table 3.1(a) Australia and Queensland construction industry activity – value of work done (the National Institute of Economic and Industry Research's June 2015 forecasts) (constant prices chain volume measure – 2013-14)
Fiscal years 2011 2012 2013 2014 2015 2016 2017 2018 2019 2020 2021 2022 2023 2024 2025 2026
AUSTRALIA (2013 $m)
Total Residential Building 78351 73728 72392 76118 82259 90134 98277 99257 97641 95825 96469 100350 105161 110255 115533 119990
Total Non-Residential Building 36970 34742 33685 35450 35597 33931 31656 31613 31364 30494 31485 34979 32081 32260 32701 33005
Total Engineering Construction 91377 124220 135063 131786 111565 97185 93537 99583 105087 101183 95594 96871 95950 95065 94380 100637
Total Australian construction activity 206698 232689 241140 243354 229422 221251 223470 230454 234092 227502 223548 232200 233191 237579 242614 253632
QUEENSLAND (2013 $m)
Total Residential Building 16820 15624 14167 14888 16391 18878 20292 21101 21388 21068 20618 21239 22136 22951 23923 24892
Total Non-Residential Building 8296 7500 6840 7184 6495 6593 6557 6789 6979 6964 7710 7653 7748 8003 7195 7498
Total Engineering Construction 25264 38148 42522 45653 30262 18928 18461 18717 18503 18958 18374 18079 18599 22913 25883 27986
Total Queensland construction activity 50380 61272 63529 67725 53147 44399 45310 46607 46870 46989 46702 46971 48483 53867 57002 60377
QUEENSLAND (% OF AUSTRALIAN TOTALS)
Total Residential Building 21.5 21.2 19.6 19.6 19.9 20.9 20.6 21.3 21.9 22.0 21.4 21.2 21.0 20.8 20.7 20.7
Total Non-Residential Building 22.4 21.6 20.3 20.3 18.2 19.4 20.7 21.5 22.3 22.8 24.5 21.9 24.2 24.8 22.0 22.7
Total Engineering Construction 27.6 30.7 31.5 34.6 27.1 19.5 19.7 18.8 17.6 18.7 19.2 18.7 19.4 24.1 27.4 27.8
Total Queensland construction activity 24.4 26.3 26.3 27.8 23.2 20.1 20.3 20.2 20.0 20.7 20.9 20.2 20.8 22.7 23.5 23.8
QUEENSLAND (ANNUAL GROWTH LESS REST OF AUSTRALIA GROWTH) – % per annum
Total Residential Building -15.9 -1.5 -9.5 -0.1 2.5 7.0 -2.0 3.8 3.8 0.5 -3.6 -1.3 -0.7 -1.5 -0.7 0.2
Total Non-Residential Building 8.0 -4.6 -7.3 -0.3 -12.6 7.6 7.7 4.6 4.6 3.3 9.7 -15.7 12.2 3.6 -15.2 4.2
Total Engineering Construction 13.1 20.8 3.9 14.3 -28.1 -33.7 1.6 -6.3 -8.2 7.5 3.0 -3.6 4.7 29.9 18.0 2.1
Total Queensland construction activity 1.3 12.0 0.1 7.7 -21.9 -16.8 1.3 -0.3 -1.3 3.8 1.4 -4.2 3.5 11.6 4.8 1.8
QUEENSLAND (% OF QUEENSLAND TOTAL)
Total Residential Building 33.4 25.5 22.3 22.0 30.8 42.5 44.8 45.3 45.6 44.8 44.1 45.2 45.7 42.6 42.0 41.2
Total Non-Residential Building 16.5 12.2 10.8 10.6 12.2 14.8 14.5 14.6 14.9 14.8 16.5 16.3 16.0 14.9 12.6 12.4
Total Engineering Construction 50.1 62.3 66.9 67.4 56.9 42.6 40.7 40.2 39.5 40.3 39.3 38.5 38.4 42.5 45.4 46.4
Total Queensland construction activity 100.0 100.0 100.0 100.0 100.0 100.0 100.0 100.0 100.0 100.0 100.0 100.0 100.0 100.0 100.0 100.0
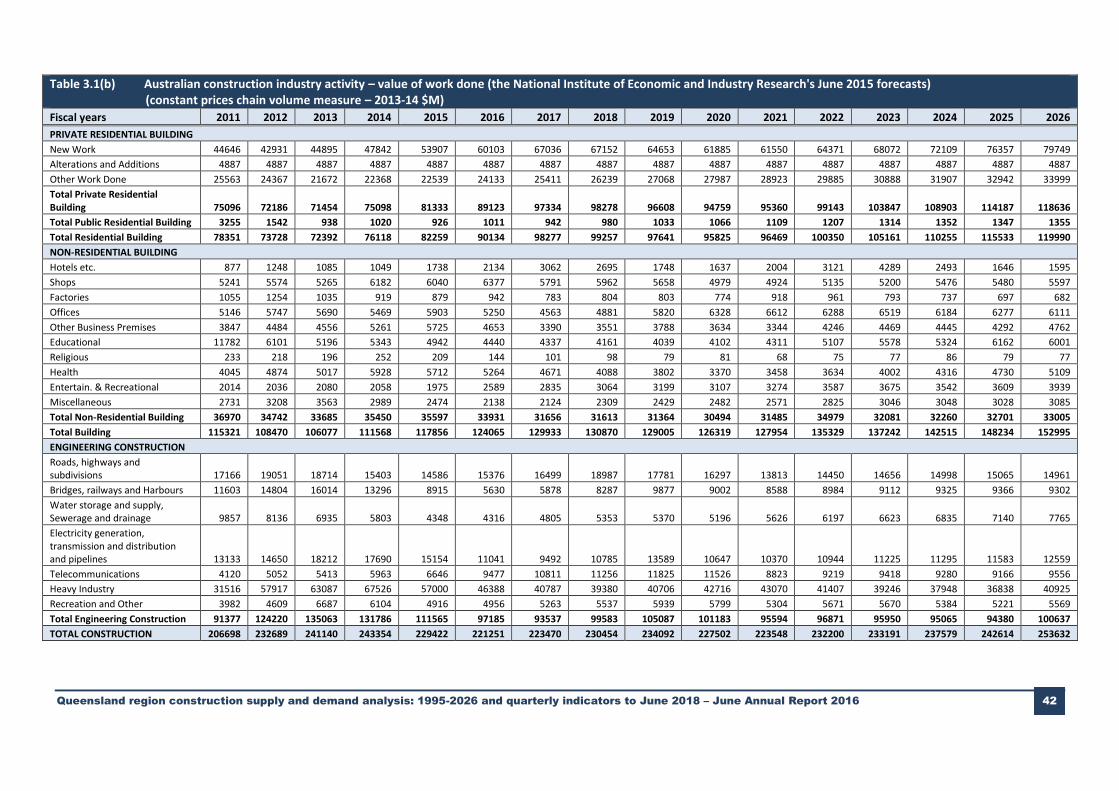
Queensland region construction supply and demand analysis: 1995-2026 and quarterly indicators to June 2018 – June Annual Report 2016 42
Table 3.1(b) Australian construction industry activity – value of work done (the National Institute of Economic and Industry Research's June 2015 forecasts) (constant prices chain volume measure – 2013-14 $M)
Fiscal years 2011 2012 2013 2014 2015 2016 2017 2018 2019 2020 2021 2022 2023 2024 2025 2026
PRIVATE RESIDENTIAL BUILDING
New Work 44646 42931 44895 47842 53907 60103 67036 67152 64653 61885 61550 64371 68072 72109 76357 79749
Alterations and Additions 4887 4887 4887 4887 4887 4887 4887 4887 4887 4887 4887 4887 4887 4887 4887 4887
Other Work Done 25563 24367 21672 22368 22539 24133 25411 26239 27068 27987 28923 29885 30888 31907 32942 33999
Total Private Residential Building 75096 72186 71454 75098 81333 89123 97334 98278 96608 94759 95360 99143 103847 108903 114187 118636
Total Public Residential Building 3255 1542 938 1020 926 1011 942 980 1033 1066 1109 1207 1314 1352 1347 1355
Total Residential Building 78351 73728 72392 76118 82259 90134 98277 99257 97641 95825 96469 100350 105161 110255 115533 119990
NON-RESIDENTIAL BUILDING
Hotels etc. 877 1248 1085 1049 1738 2134 3062 2695 1748 1637 2004 3121 4289 2493 1646 1595
Shops 5241 5574 5265 6182 6040 6377 5791 5962 5658 4979 4924 5135 5200 5476 5480 5597
Factories 1055 1254 1035 919 879 942 783 804 803 774 918 961 793 737 697 682
Offices 5146 5747 5690 5469 5903 5250 4563 4881 5820 6328 6612 6288 6519 6184 6277 6111
Other Business Premises 3847 4484 4556 5261 5725 4653 3390 3551 3788 3634 3344 4246 4469 4445 4292 4762
Educational 11782 6101 5196 5343 4942 4440 4337 4161 4039 4102 4311 5107 5578 5324 6162 6001
Religious 233 218 196 252 209 144 101 98 79 81 68 75 77 86 79 77
Health 4045 4874 5017 5928 5712 5264 4671 4088 3802 3370 3458 3634 4002 4316 4730 5109
Entertain. & Recreational 2014 2036 2080 2058 1975 2589 2835 3064 3199 3107 3274 3587 3675 3542 3609 3939
Miscellaneous 2731 3208 3563 2989 2474 2138 2124 2309 2429 2482 2571 2825 3046 3048 3028 3085
Total Non-Residential Building 36970 34742 33685 35450 35597 33931 31656 31613 31364 30494 31485 34979 32081 32260 32701 33005
Total Building 115321 108470 106077 111568 117856 124065 129933 130870 129005 126319 127954 135329 137242 142515 148234 152995
ENGINEERING CONSTRUCTION
Roads, highways and subdivisions 17166 19051 18714 15403 14586 15376 16499 18987 17781 16297 13813 14450 14656 14998 15065 14961
Bridges, railways and Harbours 11603 14804 16014 13296 8915 5630 5878 8287 9877 9002 8588 8984 9112 9325 9366 9302
Water storage and supply, Sewerage and drainage 9857 8136 6935 5803 4348 4316 4805 5353 5370 5196 5626 6197 6623 6835 7140 7765
Electricity generation, transmission and distribution and pipelines 13133 14650 18212 17690 15154 11041 9492 10785 13589 10647 10370 10944 11225 11295 11583 12559
Telecommunications 4120 5052 5413 5963 6646 9477 10811 11256 11825 11526 8823 9219 9418 9280 9166 9556
Heavy Industry 31516 57917 63087 67526 57000 46388 40787 39380 40706 42716 43070 41407 39246 37948 36838 40925
Recreation and Other 3982 4609 6687 6104 4916 4956 5263 5537 5939 5799 5304 5671 5670 5384 5221 5569
Total Engineering Construction 91377 124220 135063 131786 111565 97185 93537 99583 105087 101183 95594 96871 95950 95065 94380 100637
TOTAL CONSTRUCTION 206698 232689 241140 243354 229422 221251 223470 230454 234092 227502 223548 232200 233191 237579 242614 253632

Queensland region construction supply and demand analysis: 1995-2026 and quarterly indicators to June 2018 – June Annual Report 2016 43
Table 3.2(a) Queensland construction industry activity – value of work done (the National Institute of Economic and Industry Research's June 2016 forecasts) (constant prices chain volume measure – as a % of major segment totals)
Fiscal years 2011 2012 2013 2014 2015 2016 2017 2018 2019 2020 2021 2022 2023 2024 2025 2026
SHARE OF TOTAL RESIDENTIAL BUILDING
PRIVATE RESIDENTIAL BUILDING
New Work 58.6 58.5 62.7 63.4 66.3 67.4 67.2 66.6 64.4 62.6 60.5 60.4 60.8 61.0 61.5 61.9
Other Work Done 37.9 40.4 36.7 35.7 32.9 31.8 31.9 32.5 34.7 36.3 38.4 38.6 38.2 37.9 37.4 37.0
Total Private Residential Building 96.5 98.9 99.4 99.0 99.2 99.2 99.0 99.1 99.1 99.0 98.9 99.0 98.9 98.9 98.9 98.9
Total Public Residential Building 3.5 1.1 0.6 1.0 0.8 0.8 1.0 0.9 0.9 1.0 1.1 1.0 1.1 1.1 1.1 1.1
Total Residential Building 100.0 100.0 100.0 100.0 100.0 100.0 100.0 100.0 100.0 100.0 100.0 100.0 100.0 100.0 100.0 100.0
NON-RESIDENTIAL BUILDING: SHARE OF NON-RESIDENTIAL BUILDING TOTAL
Hotels etc. 2.0 2.3 2.9 2.9 3.7 6.8 17.7 18.4 9.9 7.0 9.9 24.1 34.8 18.8 6.8 7.1
Shops 12.6 16.4 15.4 20.9 24.2 19.8 15.8 19.3 22.9 20.0 17.4 16.3 13.2 13.0 14.2 13.8
Factories 2.3 2.6 3.6 2.6 0.4 4.5 3.5 3.4 3.6 4.6 4.9 3.8 2.9 3.4 3.7 3.7
Offices 14.4 13.6 17.2 12.0 15.7 18.1 13.3 9.2 9.0 11.3 13.2 11.6 10.2 13.5 15.5 14.6
Other Business Premises 9.6 10.1 11.3 13.6 15.4 10.9 7.3 9.4 13.0 10.0 8.0 9.5 8.1 11.9 11.3 12.7
Educational 29.3 17.6 15.1 13.0 15.4 12.3 12.1 11.9 11.9 14.3 14.3 10.8 11.7 14.2 17.4 16.4
Religious 0.3 0.5 0.7 0.3 0.6 0.4 0.5 0.7 0.7 1.1 0.7 0.6 0.4 0.6 0.8 0.7
Health 13.3 18.8 18.0 23.0 15.7 17.5 16.9 12.3 12.2 11.5 10.9 7.9 6.2 8.9 12.3 13.8
Entertain. & Recreational 5.2 5.3 3.8 2.9 2.6 4.9 6.8 7.3 7.3 8.6 8.5 6.3 5.0 6.3 7.4 7.2
Miscellaneous 11.0 12.9 11.9 8.9 6.4 4.9 6.0 8.1 9.5 11.9 12.1 9.1 7.5 9.3 10.6 10.0
Total Non-Residential Building 100.0 100.0 100.0 100.0 100.0 100.0 100.0 100.0 100.0 100.0 100.0 100.0 100.0 100.0 100.0 100.0
ENGINEERING CONSTRUCTION: SHARE OF ENGINEERING TOTAL
Roads, highways and subdivisions 22.9 19.5 12.5 10.5 10.4 18.0 18.9 17.7 15.0 15.1 14.9 16.5 17.0 17.4 16.5 12.4
Bridges, railways and Harbours 8.0 4.8 3.7 3.0 4.5 4.4 6.4 11.0 14.3 14.5 14.9 16.5 17.0 17.4 16.5 12.4
Water storage and supply, Sewerage and drainage 12.5 6.8 5.9 4.7 4.5 6.3 7.6 7.6 7.4 7.7 8.6 9.2 10.2 10.5 11.0 12.0
Electricity generation, transmission and distribution and pipelines 11.2 9.1 10.7 9.4 6.5 6.7 6.8 7.4 8.8 8.8 9.2 8.7 8.7 9.0 9.6 11.3
Telecommunications 3.1 2.6 2.6 2.5 3.5 5.5 5.7 5.7 5.8 5.8 5.3 5.2 5.4 5.5 5.7 6.4
Heavy Industry 38.1 54.0 62.3 68.2 67.0 54.3 49.5 45.6 43.8 43.1 42.9 39.7 37.7 36.1 36.6 40.7
Recreation and Other 4.3 3.2 2.3 1.8 3.6 4.6 5.2 5.0 5.0 5.0 4.3 4.1 4.0 4.0 4.2 4.7
Total Engineering Construction 100.0 100.0 100.0 100.0 100.0 100.0 100.0 100.0 100.0 100.0 100.0 100.0 100.0 100.0 100.0 100.0
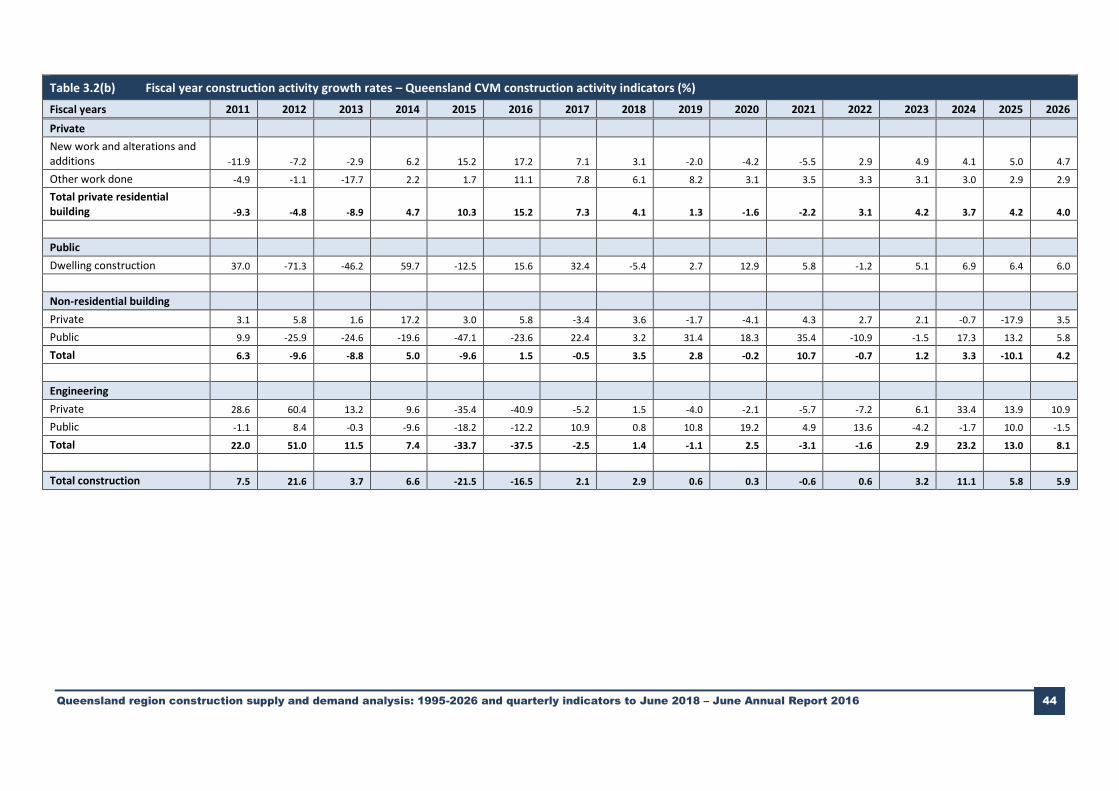
Queensland region construction supply and demand analysis: 1995-2026 and quarterly indicators to June 2018 – June Annual Report 2016 44
Table 3.2(b) Fiscal year construction activity growth rates – Queensland CVM construction activity indicators (%)
Fiscal years 2011 2012 2013 2014 2015 2016 2017 2018 2019 2020 2021 2022 2023 2024 2025 2026
Private
New work and alterations and additions -11.9 -7.2 -2.9 6.2 15.2 17.2 7.1 3.1 -2.0 -4.2 -5.5 2.9 4.9 4.1 5.0 4.7
Other work done -4.9 -1.1 -17.7 2.2 1.7 11.1 7.8 6.1 8.2 3.1 3.5 3.3 3.1 3.0 2.9 2.9
Total private residential building -9.3 -4.8 -8.9 4.7 10.3 15.2 7.3 4.1 1.3 -1.6 -2.2 3.1 4.2 3.7 4.2 4.0
Public
Dwelling construction 37.0 -71.3 -46.2 59.7 -12.5 15.6 32.4 -5.4 2.7 12.9 5.8 -1.2 5.1 6.9 6.4 6.0
Non-residential building
Private 3.1 5.8 1.6 17.2 3.0 5.8 -3.4 3.6 -1.7 -4.1 4.3 2.7 2.1 -0.7 -17.9 3.5
Public 9.9 -25.9 -24.6 -19.6 -47.1 -23.6 22.4 3.2 31.4 18.3 35.4 -10.9 -1.5 17.3 13.2 5.8
Total 6.3 -9.6 -8.8 5.0 -9.6 1.5 -0.5 3.5 2.8 -0.2 10.7 -0.7 1.2 3.3 -10.1 4.2
Engineering
Private 28.6 60.4 13.2 9.6 -35.4 -40.9 -5.2 1.5 -4.0 -2.1 -5.7 -7.2 6.1 33.4 13.9 10.9
Public -1.1 8.4 -0.3 -9.6 -18.2 -12.2 10.9 0.8 10.8 19.2 4.9 13.6 -4.2 -1.7 10.0 -1.5
Total 22.0 51.0 11.5 7.4 -33.7 -37.5 -2.5 1.4 -1.1 2.5 -3.1 -1.6 2.9 23.2 13.0 8.1
Total construction 7.5 21.6 3.7 6.6 -21.5 -16.5 2.1 2.9 0.6 0.3 -0.6 0.6 3.2 11.1 5.8 5.9

Queensland region construction supply and demand analysis: 1995-2026 and quarterly indicators to June 2018 – June Annual Report 2016 45
Table 3.2(c) Fiscal year construction activity indicator contribution to total Queensland construction growth rate (%)
Fiscal years 2011 2012 2013 2014 2015 2016 2017 2018 2019 2020 2021 2022 2023 2024 2025 2026
Private
New work and alterations and additions -2.9 -1.4 -0.4 0.9 2.1 3.5 2.0 0.9 -0.6 -1.2 -1.6 0.8 1.3 1.1 1.3 1.2
Other work done -0.7 -0.1 -1.8 0.2 0.1 1.1 1.0 0.9 1.2 0.5 0.6 0.6 0.5 0.5 0.5 0.5
Total private residential building -3.6 -1.5 -2.3 1.0 2.2 4.6 3.1 1.8 0.6 -0.7 -1.0 1.3 1.9 1.6 1.8 1.7
Public
Dwelling construction 0.3 -0.8 -0.1 0.1 0.0 0.0 0.1 0.0 0.0 0.1 0.0 0.0 0.0 0.0 0.0 0.0
Non-residential building
Private 0.3 0.5 0.1 1.2 0.2 0.6 -0.4 0.4 -0.2 -0.5 0.5 0.3 0.3 -0.1 -2.0 0.3
Public 0.8 -2.1 -1.2 -0.7 -1.3 -0.4 0.4 0.1 0.6 0.5 1.1 -0.5 -0.1 0.6 0.5 0.2
Total 1.0 -1.6 -1.1 0.5 -1.0 0.2 -0.1 0.5 0.4 0.0 1.6 -0.1 0.2 0.5 -1.5 0.5
Engineering
Private 9.8 24.8 7.2 5.7 -21.5 -20.5 -1.8 0.5 -1.3 -0.7 -1.7 -2.1 1.6 9.1 4.5 3.8
Public -0.1 0.8 0.0 -0.7 -1.2 -0.8 0.8 0.1 0.8 1.6 0.5 1.4 -0.5 -0.2 1.0 -0.2
Total 9.7 25.6 7.1 4.9 -22.7 -21.3 -1.1 0.6 -0.5 1.0 -1.2 -0.6 1.1 8.9 5.5 3.7
Total construction 7.5 21.6 3.7 6.6 -21.5 -16.5 2.1 2.9 0.6 0.3 -0.6 0.6 3.2 11.1 5.8 5.9

Queensland region construction supply and demand analysis: 1995-2026 and quarterly indicators to June 2018 – June Annual Report 2016 46
Table 3.3 Annual growth and % contribution to Queensland construction activity by major construction segment
Fiscal years 2011 2012 2013 2014 2015 2016 2017 2018 2019 2020 2021 2022 2023 2024 2025 2026
Annual percentage rate of change (%)
Dwellings -8.2 -7.1 -9.3 5.1 10.1 15.2 7.5 4.0 1.4 -1.5 -2.1 3.0 4.2 3.7 4.2 4.1
Total non-residential building 6.3 -9.6 -8.8 5.0 -9.6 1.5 -0.5 3.5 2.8 -0.2 10.7 -0.7 1.2 3.3 -10.1 4.2
Total engineering construction 22.0 51.0 11.5 7.4 -33.7 -37.5 -2.5 1.4 -1.1 2.5 -3.1 -1.6 2.9 23.2 13.0 8.1
Total construction 7.5 21.6 3.7 6.6 -21.5 -16.5 2.1 2.9 0.6 0.3 -0.6 0.6 3.2 11.1 5.8 5.9
Contribution to total construction growth ($ million)
Dwellings -1511 -1196 -1457 721 1503 2487 1413 809 287 -320 -450 621 897 816 972 969
Total non-residential building 492 -797 -660 344 -689 98 -35 232 190 -15 746 -57 95 254 -807 303
Total engineering construction 4552 12884 4374 3131 -15391 -11334 -467 256 -214 455 -584 -295 521 4314 2970 2103
Total construction 3532.0 10891.4 2257.1 4196.2 -14577.6 -8748.5 910.8 1297.0 263.4 119.2 -287.3 268.8 1512.1 5384.5 3134.2 3374.9
Table 3.4 Sector contribution to Queensland engineering construction growth (percentage point)
2009 2010 2011 2012 2013 2014 2015 2016 2017 2018 2019 2020 2021 2022 2023 2024 2025 2026
Roads, highways and sub-divisions 13.3 -2.4 -0.9 6.5 -5.5 -1.3 -3.6 0.9 0.4 -0.9 -2.9 0.4 -0.7 1.4 1.0 4.4 1.2 -3.0
Bridges, railways and harbours 1.7 -0.8 2.1 -0.8 -0.6 -0.5 0.0 -1.8 1.8 4.8 3.1 0.6 -0.1 1.4 1.0 4.4 1.2 -3.0
Water storage and supply, sewerage and drainage -6.8 -2.7 5.1 -2.1 -0.3 -0.9 -1.7 -0.5 1.0 0.1 -0.3 0.5 0.6 0.4 1.3 2.8 1.9 2.0
Electricity generation, transmission and distribution and pipelines 3.3 -2.5 0.3 2.5 2.9 -0.6 -5.0 -2.3 -0.1 0.7 1.3 0.2 0.1 -0.6 0.2 2.4 1.8 2.6
Telecommunications -1.8 -0.6 0.8 0.9 0.2 0.1 -0.1 -0.1 0.1 0.0 0.0 0.2 -0.6 -0.2 0.3 1.4 1.0 1.2
Heavy industry 8.5 4.2 13.0 43.5 15.4 10.9 -23.8 -33.1 -6.0 -3.2 -2.3 0.3 -1.5 -3.8 -0.9 6.8 5.2 7.5
Recreation and other 0.7 -0.3 1.7 0.5 -0.6 -0.4 0.5 -0.7 0.4 -0.1 -0.1 0.2 -0.9 -0.2 0.0 0.9 0.7 0.9
Total engineering construction 19.0 -5.1 22.0 51.0 11.5 7.4 -33.7 -37.5 -2.5 1.4 -1.1 2.5 -3.1 -1.6 2.9 23.2 13.0 8.1

Queensland region construction supply and demand analysis: 1995-2026 and quarterly
indicators to June 2018 – June Annual Report 2016
47 47 47 47
3.7 The regional dimension
3.7.1 Brisbane
Population and employment
For the 2006-2011 period the average annual growth rate in population for Brisbane was 2.3% per annum compared to a Queensland average annual population growth rate of 2.2%. The average annual change in the population for Brisbane was 45,000 or 48.4% of the total change in Queensland's population.
For the 2006-2011 period the average annual employment growth for Brisbane was 3.1% per annum compared to a Queensland total employment growth of 2.8%. The total number of net new employment positions created was 30,500 or 53% of the total net employment positions in Queensland.
During this time the effective underlying unemployment rate of Brisbane would have declined. The decline in the effective unemployment rate would have been moderate.
For the 2011-2016 period the average annual growth rate in population for Brisbane was 1.8% per annum compared to a Queensland average annual population growth rate of 1.6%. The average annual change in the population for Brisbane was 38,300 or 52.6% of the total change in Queensland's population.
For the 2011-2016 period the average annual employment growth for Brisbane was 1.3% per annum compared to a Queensland total employment growth of 1.1%. The total number of net new employment positions created was 14,600 or 57.9% of the total net employment positions in Queensland.
During this time the effective underlying unemployment rate of Brisbane would have declined. The decline in the effective unemployment rate would have been moderate.
For the 2016-2021 period the average annual growth rate in population for Brisbane was 1.6% per annum compared to a Queensland average annual population growth rate of 1.5%. The average annual change in the population for Brisbane was 37,800 or 51.6% of the total change in Queensland's population.
For the 2016-2021 period the average annual employment growth for Brisbane was 1.8% per annum compared to a Queensland total employment growth of 1.7%. The total number of net new employment positions created was 21,700 or 52.2% of the total net employment positions in Queensland
During this time the effective underlying unemployment rate of Brisbane would have declined. The decline in the effective unemployment rate would have been moderate.
For the 2021-2026 period the average annual growth rate in population for Brisbane was 1.5% per annum compared to a Queensland average annual population growth rate of 1.5%. The average annual change in the population for Brisbane was 38,600 or 49.6% of the total change in Queensland's population.
Queensland region construction supply and demand analysis: 1995-2026 and quarterly
indicators to June 2018 – June Annual Report 2016
48 48 48 48
For the 2021-2026 period the average annual employment growth for Brisbane was 1.5% per annum compared to a Queensland total employment growth of 1.5%. The total number of net new employment positions created was 19,300 or 50.4% of the total net employment positions in Queensland
During this time the effective underlying unemployment rate of Brisbane would have declined. The decline in the effective unemployment rate would have been moderate.
Construction activity
Over the 2006-2011 period, the average rate of growth for Brisbane total construction was an increase of 6.2% per annum, which translated to an average annual increase in expenditure of $985 million.
The most significant contribution to this change is private engineering with a positive contribution in terms of average annual change of $652 million which explained 66.2% of the total annual change. The next largest contribution to this change is public non-residential building with a positive contribution in terms of average annual change of $159 million which explained 16.1% of the total annual change. Other sector contributions were private non-residential building with a positive contribution of $95 million which explained 9.7% of the total annual change, public engineering with a positive contribution of $88 million which explained 8.9% of the total annual change and new dwelling construction with a negative contribution of $83 million which explained -8.4% of the total annual change.
The average change in total construction expenditure over this period was an increase of $985 million. This represents a contribution to total Queensland construction growth of 24.8%, this change in total construction expenditure in Brisbane is in the same direction as that of Queensland.
For the 2011-2016 period, the average rate of growth for Brisbane total construction was a decline of 2.4% per annum, which translated to an average annual decrease in expenditure of $488 million.
The most significant contribution to this change is private engineering with a negative contribution in terms of average annual change of $622 million which explained 127.5% of the total annual change. The next largest contribution to this change is new dwelling construction with a positive contribution in terms of average annual change of $452 million which explained -92.6% of the total annual change. Other sector contributions were public non-residential building with a negative contribution of $217 million which explained 44.5% of the total annual change, public engineering with a negative contribution of $162 million which explained 33.3% of the total annual change and private non-residential building with a positive contribution of $116 million which explained -23.9% of the total annual change.
The average change in total construction expenditure over this period was a decrease of $488 million. This represents a contribution to total Queensland construction growth of 57.7%, this change in total construction expenditure in Brisbane is in the same direction as that of Queensland.
Over the 2016-2021 projection period, the average rate of growth for Brisbane total construction is an increase of 1.9% per annum, which translated to an average annual increase in expenditure of $327 million.
Queensland region construction supply and demand analysis: 1995-2026 and quarterly
indicators to June 2018 – June Annual Report 2016
49 49 49 49
The most significant contribution to this change is other dwelling construction with a positive contribution in terms of average annual change of $225 million which explained 68.9% of the total annual change. The next largest contribution to this change is public non-residential building with a positive contribution in terms of average annual change of $108 million which explained 32.9% of the total annual change. Other sector contributions were private engineering with a negative contribution of $107 million which explained -32.7% of the total annual change, public engineering with a positive contribution of $89 million which explained 27.1% of the total annual change and private non-residential building with a positive contribution of $69 million which explained 21% of the total annual change.
The average change in total construction expenditure over this period was an increase of $327 million. This represents a contribution to total Queensland construction growth of 71%, this change in total construction expenditure in Brisbane is in the same direction as that of Queensland.
For the 2021-2026 period, the average rate of growth for Brisbane total construction is an increase of 0.9% per annum, which translated to an average annual increase in expenditure of $176 million.
The most significant contribution to this change is other dwelling construction with a positive contribution in terms of average annual change of $118 million which explained 67% of the total annual change. The next largest contribution to this change is public non-residential building with a positive contribution in terms of average annual change of $82 million which explained 46.9% of the total annual change. Other sector contributions were private engineering with a negative contribution of $63 million which explained -35.6% of the total annual change, private non-residential building with a negative contribution of $60 million which explained -34.3% of the total annual change and new dwelling construction with a positive contribution of $49 million which explained 27.8% of the total annual change.
The average change in total construction expenditure over this period was an increase of $176 million. This represents a contribution to total Queensland construction growth of 7.9%, this change in total construction expenditure in Brisbane is in the same direction as that of Queensland.
For Brisbane total construction activity declined by 0.2% in 2016 the change was a decrease of $40 million.
For Brisbane total construction activity increased by 13.3% in 2017 the change was an increase of $2327 million.
Construction activity remained steady in Brisbane in 2018.
Capacity utilisation
Over the 2006-2011 period Brisbane had an average annual average shortage of 964.7 in construction workers relative to the supply from residents. This means that Brisbane construction worker requirements for a balanced labour market would have had to be met by import of labour from other regions. In contrast the average Queensland shortage of construction workers was 2994.4.
Over the 2011-2016 period Brisbane had an average annual average surplus of -622.8 in construction workers relative to the supply from residents. This means that Brisbane construction worker requirements for a balanced labour market would have had to be met by the export of labour services to other regions. In contrast the average Queensland shortage of construction workers was 1782.2.

Queensland region construction supply and demand analysis: 1995-2026 and quarterly
indicators to June 2018 – June Annual Report 2016
50 50 50 50
Over the 2016-2021 period Brisbane is projected to have an average annual average surplus of -1082.3 in construction workers relative to the supply from residents. This means that Brisbane construction worker requirements for a balanced labour market will have to be met by the export of labour services to other regions. In contrast the average Queensland surplus of construction workers is predicted to be -6110.9.
Over the 2021-2026 period Brisbane is projected to have an average annual average surplus of -2567.4 in construction workers relative to the supply from residents. This means that Brisbane construction worker requirements for a balanced labour market will have to be met by the export of labour services to other regions. In contrast the average Queensland surplus of construction workers is predicted to be -3369.
Figure 3.22: Queensland regional construction value of work done – Brisbane (CVM $m)
3.7.2 Gold Coast
Population and employment
For the 2006-2011 period the average annual growth rate in population for Gold Coast was 2.8% per annum compared to a Queensland average annual population growth rate of 2.2%. The average annual change in the population for Gold Coast was 13,300 or 14.3% of the total change in Queensland's population.
For the 2006-2011 period the average annual employment growth for Gold Coast was 3.3% per annum compared to a Queensland total employment growth of 2.8%. The total number of net new employment positions created was 7,600 or 13.2% of the total net employment positions in Queensland.

Queensland region construction supply and demand analysis: 1995-2026 and quarterly
indicators to June 2018 – June Annual Report 2016
51 51 51 51
During this time the effective underlying unemployment rate of Gold coast would have declined. The decline in the effective unemployment rate would have been moderate.
For the 2011-2016 period the average annual growth rate in population for Gold Coast was 1.9% per annum compared to a Queensland average annual population growth rate of 1.6%. The average annual change in the population for Gold Coast was 9,800 or 13.5% of the total change in Queensland's population.
For the 2011-2016 period the average annual employment growth for Gold Coast was 2.1% per annum compared to a Queensland total employment growth of 1.1%. The total number of net new employment positions created was 5,700 or 22.5% of the total net employment positions in Queensland.
During this time the effective underlying unemployment rate of Gold coast would have declined. The decline in the effective unemployment rate would have been moderate.
For the 2016-2021 period the average annual growth rate in population for Gold Coast was 1.9% per annum compared to a Queensland average annual population growth rate of 1.5%. The average annual change in the population for Gold Coast was 11,200 or 15.3% of the total change in Queensland's population.
For the 2016-2021 period the average annual employment growth for Gold Coast was 2.5% per annum compared to a Queensland total employment growth of 1.7%. The total number of net new employment positions created was 7,400 or 17.7% of the total net employment positions in Queensland.
During this time the effective underlying unemployment rate of Gold coast would have declined. The decline in the effective unemployment rate would have been moderate.
For the 2021-2026 period the average annual growth rate in population for Gold Coast was 2% per annum compared to a Queensland average annual population growth rate of 1.5%. The average annual change in the population for Gold Coast was 12,800 or 16.5% of the total change in Queensland's population.
For the 2021-2026 period the average annual employment growth for Gold Coast was 2.1% per annum compared to a Queensland total employment growth of 1.5%. The total number of net new employment positions created was 7,000 or 18.1% of the total net employment positions in Queensland.
During this time the effective underlying unemployment rate of Gold coast would have declined. The decline in the effective unemployment rate would have been moderate.
Construction activity
Over the 2006-2011 period, the average rate of growth for Gold Coast total construction was a decline of 3.6% per annum, which translated to an average annual decrease in expenditure of $193 million.
The most significant contribution to this change is new dwelling construction with a negative contribution in terms of average annual change of $250 million which explained 129.6% of the total annual change. The next largest contribution to this change is private engineering with a positive contribution in terms of average annual change of $85 million which explained -44.1% of the total annual change. Other sector contributions were public non-residential building with a positive contribution of $66 million which explained -34.3% of the total annual change, private non-residential building with a negative contribution of $64 million which explained 33.3% of the total annual change and other dwelling construction with a negative contribution of $41 million which explained 21% of the total annual change.

Queensland region construction supply and demand analysis: 1995-2026 and quarterly
indicators to June 2018 – June Annual Report 2016
52 52 52 52
The average change in total construction expenditure over this period was a decrease of $193 million. This represents a contribution to total Queensland construction growth of -4.9%, this change in total construction expenditure in Gold Coast is in the opposite direction to that of Queensland.
For the 2011-2016 period, the average rate of growth for Gold Coast total construction was an increase of 1.9% per annum, which translated to an average annual increase in expenditure of $50 million.
The most significant contribution to this change is new dwelling construction with a positive contribution in terms of average annual change of $165 million which explained 330.6% of the total annual change. The next largest contribution to this change is public non-residential building with a negative contribution in terms of average annual change of $162 million which explained -324.5% of the total annual change. Other sector contributions were private non-residential building with a positive contribution of $89 million which explained 177.9% of the total annual change, private engineering with a negative contribution of $47 million which explained -94.3% of the total annual change and other dwelling construction with a positive contribution of $4 million which explained 8.5% of the total annual change.
The average change in total construction expenditure over this period was an increase of $50 million. This represents a contribution to total Queensland construction growth of -5.9%, this change in total construction expenditure in Gold Coast is in the opposite direction to that of Queensland.
Over the 2016-2021 projection period, the average rate of growth for Gold Coast total construction is an increase of 4.4% per annum, which translated to an average annual increase in expenditure of $220 million.
The most significant contribution to this change is public engineering with a positive contribution in terms of average annual change of $81 million which explained 37% of the total annual change. The next largest contribution to this change is other dwelling construction with a positive contribution in terms of average annual change of $64 million which explained 29.2% of the total annual change. Other sector contributions were new dwelling construction with a positive contribution of $62 million which explained 28.2% of the total annual change, private non-residential building with a negative contribution of $49 million which explained -22.4% of the total annual change and
The average change in total construction expenditure over this period was an increase of $220 million. This represents a contribution to total Queensland construction growth of 47.7%, this change in total construction expenditure in Gold Coast is in the same direction as that of Queensland.
For the 2021-2026 period, the average rate of growth for Gold Coast total construction is an increase of 2.7% per annum, which translated to an average annual increase in expenditure of $167 million.
The most significant contribution to this change is new dwelling construction with a positive contribution in terms of average annual change of $103 million which explained 61.6% of the total annual change. The next largest contribution to this change is other dwelling construction with a positive contribution in terms of average annual change of $48 million which explained 28.8% of the total annual change. Other sector contributions were private engineering with a positive contribution of $23 million which explained 13.9% of the total annual change, public non-residential building with a positive contribution of $15 million which explained 8.9% of the total annual change and
The average change in total construction expenditure over this period was an increase of $167 million. This represents a contribution to total Queensland construction growth of 7.5%, this change in total construction expenditure in Gold Coast is in the same direction as that of Queensland.
For Gold Coast total construction activity increased by 10.9% in 2016 the change was an increase of $473 million.
For Gold Coast total construction activity increased by 15.7% in 2017 the change was an increase of $753 million.

Queensland region construction supply and demand analysis: 1995-2026 and quarterly
indicators to June 2018 – June Annual Report 2016
53 53 53 53
For Gold Coast total construction activity increased by 1.2% in 2018 the change was an increase of $66 million.
Capacity utilisation
Over the 2006-2011 period Gold Coast had an average annual average shortage of 382.5 in construction workers relative to the supply from residents. This means that Gold Coast construction worker requirements for a balanced labour market would have had to be met by import of labour from other regions. In contrast the average Queensland shortage of construction workers was 2994.4. The degree to which the construction industry in Gold Coast was operating above normal capacity was $382.5m.
Over the 2011-2016 period Gold Coast had an average annual average surplus of -136.6 in construction workers relative to the supply from residents. This means that Gold Coast construction worker requirements for a balanced labour market would have had to be met by the export of labour services to other regions. In contrast the average Queensland shortage of construction workers was 1782.2. The degree to which the construction industry in Gold Coast was operating below normal capacity was $-136.6m.
Over the 2016-2021 period Gold Coast is projected to have an average annual average shortage of 853.5 in construction workers relative to the supply from residents. This means that Gold Coast construction worker requirements for a balanced labour market will have to be met by import of labour from other regions. In contrast the average Queensland surplus of construction workers is predicted to be -6110.9. The degree to which the construction industry in Gold Coast will be operating above normal capacity is $853.5m.
Over the 2021-2026 period Gold Coast is projected to have an average annual average shortage of 1019.9 in construction workers relative to the supply from residents. This means that Gold Coast construction worker requirements for a balanced labour market will have to be met by import of labour from other regions. In contrast the average Queensland surplus of construction workers is predicted to be -3369. The degree to which the construction industry in Gold Coast will be operating above normal capacity is $1019.9m.

Queensland region construction supply and demand analysis: 1995-2026 and quarterly
indicators to June 2018 – June Annual Report 2016
54 54 54 54
Figure 3.23: Queensland regional construction value of work done – Gold Coast (CVM $m)
3.7.3 Sunshine Coast
Population and employment
For the 2006-2011 period the average annual growth rate in population for Sunshine Coast was 2.3% per annum compared to a Queensland average annual population growth rate of 2.2%. The average annual change in the population for Sunshine Coast was 6,900 or 7.4% of the total change in Queensland's population.
For the 2006-2011 period the average annual employment growth for Sunshine Coast was 2.8% per annum compared to a Queensland total employment growth of 2.8%. The total number of net new employment positions created was 3,700 or 6.4% of the total net employment positions in Queensland.
During this time the effective underlying unemployment rate of Sunshine coast would have declined. The decline in the effective unemployment rate would have been moderate.
For the 2011-2016 period the average annual growth rate in population for Sunshine Coast was 1.7% per annum compared to a Queensland average annual population growth rate of 1.6%. The average annual change in the population for Sunshine Coast was 5,600 or 7.7% of the total change in Queensland's population.
For the 2011-2016 period the average annual employment growth for Sunshine Coast was 2% per annum compared to a Queensland total employment growth of 1.1%. The total number of net new employment positions created was 3,000 or 11.7% of the total net employment positions in Queensland.

Queensland region construction supply and demand analysis: 1995-2026 and quarterly
indicators to June 2018 – June Annual Report 2016
55 55 55 55
During this time the effective underlying unemployment rate of Sunshine coast would have declined. The decline in the effective unemployment rate would have been moderate.
For the 2016-2021 period the average annual growth rate in population for Sunshine Coast was 2% per annum compared to a Queensland average annual population growth rate of 1.5%. The average annual change in the population for Sunshine Coast was 7,000 or 9.6% of the total change in Queensland's population.
For the 2016-2021 period the average annual employment growth for Sunshine Coast was 2.3% per annum compared to a Queensland total employment growth of 1.7%. The total number of net new employment positions created was 3,700 or 9% of the total net employment positions in Queensland.
During this time the effective underlying unemployment rate of Sunshine coast would have declined. The decline in the effective unemployment rate would have been moderate.
For the 2021-2026 period the average annual growth rate in population for Sunshine Coast was 1.8% per annum compared to a Queensland average annual population growth rate of 1.5%. The average annual change in the population for Sunshine Coast was 7,100 or 9.2% of the total change in Queensland's population.
For the 2021-2026 period the average annual employment growth for Sunshine Coast was 1.9% per annum compared to a Queensland total employment growth of 1.5%. The total number of net new employment positions created was 3,400 or 9% of the total net employment positions in Queensland
During this time the effective underlying unemployment rate of Sunshine coast would have declined. The decline in the effective unemployment rate would have been moderate.
Construction activity
Over the 2006-2011 period, the average rate of growth for Sunshine Coast total construction was an increase of 1.2% per annum, which translated to an average annual increase in expenditure of $12 million.
The most significant contribution to this change is private engineering with a positive contribution in terms of average annual change of $141 million which explained 1170.3% of the total annual change. The next largest contribution to this change is new dwelling construction with a negative contribution in terms of average annual change of $88 million which explained -731.5% of the total annual change. Other sector contributions were other dwelling construction with a negative contribution of $33 million which explained -271% of the total annual change, private non-residential building with a negative contribution of $21 million which explained -170.7% of the total annual change and public engineering with a positive contribution of $9 million which explained 74.1% of the total annual change.
The average change in total construction expenditure over this period was an increase of $12 million. This represents a contribution to total Queensland construction growth of 0.3%, this change in total construction expenditure in Sunshine Coast is in the same direction as that of Queensland.
For the 2011-2016 period, the average rate of growth for Sunshine Coast total construction was a decline of 3% per annum, which translated to an average annual decrease in expenditure of $148 million.

Queensland region construction supply and demand analysis: 1995-2026 and quarterly
indicators to June 2018 – June Annual Report 2016
56 56 56 56
The most significant contribution to this change is private engineering with a negative contribution in terms of average annual change of $198 million which explained 134.3% of the total annual change. The next largest contribution to this change is new dwelling construction with a positive contribution in terms of average annual change of $45 million which explained -30.3% of the total annual change. Other sector contributions were private non-residential building with a positive contribution of $12 million which explained -8.3% of the total annual change, public engineering with a negative contribution of $7 million which explained 4.7% of the total annual change and other dwelling construction with a positive contribution of $4 million which explained -2.6% of the total annual change.
The average change in total construction expenditure over this period was a decrease of $148 million. This represents a contribution to total Queensland construction growth of 17.5%, this change in total construction expenditure in Sunshine Coast is in the same direction as that of Queensland.
Over the 2016-2021 projection period, the average rate of growth for Sunshine Coast total construction is an increase of 3.5% per annum, which translated to an average annual increase in expenditure of $106 million.
The most significant contribution to this change is new dwelling construction with a positive contribution in terms of average annual change of $49 million which explained 46% of the total annual change. The next largest contribution to this change is other dwelling construction with a positive contribution in terms of average annual change of $36 million which explained 34.1% of the total annual change. Other sector contributions were private engineering with a positive contribution of $26 million which explained 24.5% of the total annual change, public engineering with a negative contribution of $8 million which explained -7.7% of the total annual change and private non-residential building with a positive contribution of $3 million which explained 2.4% of the total annual change.
The average change in total construction expenditure over this period was an increase of $106 million. This represents a contribution to total Queensland construction growth of 23%, this change in total construction expenditure in Sunshine Coast is in the same direction as that of Queensland.
For the 2021-2026 period, the average rate of growth for Sunshine Coast total construction is an increase of 3.3% per annum, which translated to an average annual increase in expenditure of $119 million.
The most significant contribution to this change is new dwelling construction with a positive contribution in terms of average annual change of $61 million which explained 51.1% of the total annual change. The next largest contribution to this change is other dwelling construction with a positive contribution in terms of average annual change of $29 million which explained 24.8% of the total annual change. Other sector contributions were private engineering with a positive contribution of $9 million which explained 7.8% of the total annual change, public engineering with a positive contribution of $8 million which explained 6.6% of the total annual change and public non-residential building with a positive contribution of $7 million which explained 5.8% of the total annual change.
The average change in total construction expenditure over this period was an increase of $119 million. This represents a contribution to total Queensland construction growth of 5.3%, this change in total construction expenditure in Sunshine Coast is in the same direction as that of Queensland.
For Sunshine Coast total construction activity declined by 10.9% in 2016 the change was a decrease of $352 million.
For Sunshine Coast total construction activity increased by 4.1% in 2017 the change was an increase of $118 million.
For Sunshine Coast total construction activity increased by 0.4% in 2018 the change was an increase of $11 million.

Queensland region construction supply and demand analysis: 1995-2026 and quarterly
indicators to June 2018 – June Annual Report 2016
57 57 57 57
Capacity utilisation
Over the 2006-2011 period Sunshine Coast had an average annual average shortage of 244.3 in construction workers relative to the supply from residents. This means that Sunshine Coast construction worker requirements for a balanced labour market would have had to be met by import of labour from other regions. In contrast the average Queensland shortage of construction workers was 2994.4. The degree to which the construction industry in Sunshine Coast was operating above normal capacity was $244.3m.
Over the 2011-2016 period Sunshine Coast had an average annual average shortage of 160.4 in construction workers relative to the supply from residents. This means that Sunshine Coast construction worker requirements for a balanced labour market would have had to be met by import of labour from other regions. In contrast the average Queensland shortage of construction workers was 1782.2. The degree to which the construction industry in Sunshine Coast was operating above normal capacity was $160.4m.
Over the 2016-2021 period Sunshine Coast is projected to have an average annual average shortage of 48.9 in construction workers relative to the supply from residents. This means that Sunshine Coast construction worker requirements for a balanced labour market will have to be met by import of labour from other regions. In contrast the average Queensland surplus of construction workers is predicted to be -6110.9. The degree to which the construction industry in Sunshine Coast will be operating above normal capacity is $48.9m.
Over the 2021-2026 period Sunshine Coast is projected to have an average annual average shortage of 267.9 in construction workers relative to the supply from residents. This means that Sunshine Coast construction worker requirements for a balanced labour market will have to be met by import of labour from other regions. In contrast the average Queensland surplus of construction workers is predicted to be -3369. The degree to which the construction industry in Sunshine Coast will be operating above normal capacity is $267.9m.
Figure 3.24: Queensland regional construction value of work done – Sunshine Coast (CVM $m)

Queensland region construction supply and demand analysis: 1995-2026 and quarterly
indicators to June 2018 – June Annual Report 2016
58 58 58 58
3.7.4 West Moreton
Population and employment
For the 2006-2011 period the average annual growth rate in population for West Morton was 2.4% per annum compared to a Queensland average annual population growth rate of 2.2%. The average annual change in the population for West Morton was 2,100 or 2.3% of the total change in Queensland's population.
For the 2006-2011 period the average annual employment growth for West Morton was 2.8% per annum compared to a Queensland total employment growth of 2.8%. The total number of net new employment positions created was 1,100 or 1.9% of the total net employment positions in Queensland
During this time the effective underlying unemployment rate of West Morton would have declined. The decline in the effective unemployment rate would have been moderate.
For the 2011-2016 period the average annual growth rate in population for West Morton was 1.7% per annum compared to a Queensland average annual population growth rate of 1.6%. The average annual change in the population for West Morton was 1,700 or 2.3% of the total change in Queensland's population.
For the 2011-2016 period the average annual employment growth for West Morton was 1.5% per annum compared to a Queensland total employment growth of 1.1%. The total number of net new employment positions created was 700 or 2.6% of the total net employment positions in Queensland
During this time the effective underlying unemployment rate of West Morton would have declined. The decline in the effective unemployment rate would have been moderate.
For the 2016-2021 period the average annual growth rate in population for West Morton was 1.7% per annum compared to a Queensland average annual population growth rate of 1.5%. The average annual change in the population for West Morton was 1,800 or 2.5% of the total change in Queensland's population.
For the 2016-2021 period the average annual employment growth for West Morton was 2.3% per annum compared to a Queensland total employment growth of 1.7%. The total number of net new employment positions created was 1,100 or 2.6% of the total net employment positions in Queensland.
During this time the effective underlying unemployment rate of West Morton would have declined. The decline in the effective unemployment rate would have been moderate.
For the 2021-2026 period the average annual growth rate in population for West Morton was 1.8% per annum compared to a Queensland average annual population growth rate of 1.5%. The average annual change in the population for West Morton was 2,100 or 2.7% of the total change in Queensland's population.
For the 2021-2026 period the average annual employment growth for West Morton was 1.9% per annum compared to a Queensland total employment growth of 1.5%. The total number of net new employment positions created was 1,000 or 2.6% of the total net employment positions in Queensland.
During this time the effective underlying unemployment rate of West Morton would have declined. The decline in the effective unemployment rate would have been moderate.

Queensland region construction supply and demand analysis: 1995-2026 and quarterly
indicators to June 2018 – June Annual Report 2016
59 59 59 59
Construction activity
Over the 2006-2011 period, the average rate of growth for West Morton total construction was an increase of 2.7% per annum, which translated to an average annual increase in expenditure of $6 million.
The most significant contribution to this change is private engineering with a positive contribution in terms of average annual change of $7 million which explained 114.3% of the total annual change. The next largest contribution to this change is new dwelling construction with a negative contribution in terms of average annual change of $5 million which explained -91.4% of the total annual change. Other sector contributions were public engineering with a positive contribution of $4 million which explained 68.4% of the total annual change, private non-residential building with a negative contribution of $1 million which explained -14.8% of the total annual change and
The average change in total construction expenditure over this period was an increase of $6 million. This represents a contribution to total Queensland construction growth of 0.1%, this change in total construction expenditure in West Morton is in the same direction as that of Queensland.
For the 2011-2016 period, the average rate of growth for West Morton total construction was a decline of 4.8% per annum, which translated to an average annual decrease in expenditure of $34 million.
The most significant contribution to this change is public non-residential building with a negative contribution in terms of average annual change of $18 million which explained 53.1% of the total annual change. The next largest contribution to this change is new dwelling construction with a negative contribution in terms of average annual change of $8 million which explained 22.6% of the total annual change. Other sector contributions were private engineering with a negative contribution of $7 million which explained 20.8% of the total annual change, public engineering with a negative contribution of $4 million which explained 12.4% of the total annual change and private non-residential building with a positive contribution of $3 million which explained -9.5% of the total annual change.
The average change in total construction expenditure over this period was a decrease of $34 million. This represents a contribution to total Queensland construction growth of 4.1%, this change in total construction expenditure in West Morton is in the same direction as that of Queensland.
Over the 2016-2021 projection period, the average rate of growth for West Morton total construction is an increase of 8.5% per annum, which translated to an average annual increase in expenditure of $47 million.
The most significant contribution to this change is new dwelling construction with a positive contribution in terms of average annual change of $10 million which explained 21.1% of the total annual change. Other sector contributions were public non-residential building with a positive contribution of $9 million which explained 20.2% of the total annual change, public engineering with a positive contribution of $8 million which explained 16.6% of the total annual change and other dwelling construction with a positive contribution of $6 million which explained 12.8% of the total annual change.
The average change in total construction expenditure over this period was an increase of $47 million. This represents a contribution to total Queensland construction growth of 10.2%, this change in total construction expenditure in West Morton is in the same direction as that of Queensland.
For the 2021-2026 period, the average rate of growth for West Morton total construction is an increase of 5.7% per annum, which translated to an average annual increase in expenditure of $44 million.
The most significant contribution to this change is public engineering with a positive contribution in terms of average annual change of $27 million which explained 61.7% of the total annual change. The

Queensland region construction supply and demand analysis: 1995-2026 and quarterly
indicators to June 2018 – June Annual Report 2016
60 60 60 60
next largest contribution to this change is new dwelling construction with a positive contribution in terms of average annual change of $9 million which explained 19.7% of the total annual change. Other sector contributions were other dwelling construction with a positive contribution of $5 million which explained 10.7% of the total annual change, public non-residential building with a positive contribution of $4 million which explained 8.9% of the total annual change and private non-residential building with a negative contribution of $0 million which explained -0.3% of the total annual change.
The average change in total construction expenditure over this period was an increase of $44 million. This represents a contribution to total Queensland construction growth of 2%, this change in total construction expenditure in West Morton is in the same direction as that of Queensland.
For West Morton total construction activity declined by 11.8% in 2016 the change was a decrease of $63 million.
For West Morton total construction activity increased by 13.4% in 2017 the change was an increase of $63 million.
For West Morton total construction activity increased by 5.6% in 2018 the change was an increase of $30 million.
Capacity utilisation
Over the 2006-2011 period West Morton had an average annual average shortage of 50.8 in construction workers relative to the supply from residents. This means that West Morton construction worker requirements for a balanced labour market would have had to be met by import of labour from other regions. In contrast the average Queensland shortage of construction workers was 2994.4. The degree to which the construction industry in West Morton was operating above normal capacity was $50.8m.
Over the 2011-2016 period West Morton had an average annual average surplus of -155.5 in construction workers relative to the supply from residents. This means that West Morton construction worker requirements for a balanced labour market would have had to be met by the export of labour services to other regions. In contrast the average Queensland shortage of construction workers was 1782.2. The degree to which the construction industry in West Morton was operating below normal capacity was $-155.5m.
Over the 2016-2021 period West Morton is projected to have an average annual average surplus of -173.5 in construction workers relative to the supply from residents. This means that West Morton construction worker requirements for a balanced labour market will have to be met by the export of labour services to other regions. In contrast the average Queensland surplus of construction workers is predicted to be -6110.9. The degree to which the construction industry in West Morton will be operating below normal capacity is $-173.5m.
Over the 2021-2026 period West Morton is projected to have an average annual average surplus of -103.7 in construction workers relative to the supply from residents. This means that West Morton construction worker requirements for a balanced labour market will have to be met by the export of labour services to other regions. In contrast the average Queensland surplus of construction workers is predicted to be -3369. The degree to which the construction industry in West Morton will be operating below normal capacity is $-103.7m.

Queensland region construction supply and demand analysis: 1995-2026 and quarterly
indicators to June 2018 – June Annual Report 2016
61 61 61 61
Figure 3.25: Queensland regional construction value of work done – West Moreton (CVM $m)
3.7.5 Wide Bay/Burnett
Population and employment
For the 2006-2011 period the average annual growth rate in population for Wide Bay-Burnett was 2.1% per annum compared to a Queensland average annual population growth rate of 2.2%. The average annual change in the population for Wide Bay-Burnett was 5,500 or 5.9% of the total change in Queensland's population.
For the 2006-2011 period the average annual employment growth for Wide Bay-Burnett was 2% per annum compared to a Queensland total employment growth of 2.8%. The total number of net new employment positions created was 2,100 or 3.6% of the total net employment positions in Queensland.
During this time the effective underlying unemployment rate of Wide Bay-Burnett would have declined. The decline in the effective unemployment rate would have been moderate.
For the 2011-2016 period the average annual growth rate in population for Wide Bay-Burnett was 0.8% per annum compared to a Queensland average annual population growth rate of 1.6%. The average annual change in the population for Wide Bay-Burnett was 2,200 or 3% of the total change in Queensland's population.
For the 2011-2016 period the average annual employment growth for Wide Bay-Burnett was -0.3% per annum compared to a Queensland total employment growth of 1.1%. The total number of net new employment positions created was -400 or -1.6% of the total net employment positions in Queensland.
Queensland region construction supply and demand analysis: 1995-2026 and quarterly
indicators to June 2018 – June Annual Report 2016
62 62 62 62
During this time the effective underlying unemployment rate of Wide Bay-Burnett would have increased. The increase in the effective unemployment rate would have been moderate.
For the 2016-2021 period the average annual growth rate in population for Wide Bay-Burnett was 0.8% per annum compared to a Queensland average annual population growth rate of 1.5%. The average annual change in the population for Wide Bay-Burnett was 2,300 or 3.1% of the total change in Queensland's population.
For the 2016-2021 period the average annual employment growth for Wide Bay-Burnett was 1.2% per annum compared to a Queensland total employment growth of 1.7%. The total number of net new employment positions created was 1,300 or 3.2% of the total net employment positions in Queensland.
During this time the effective underlying unemployment rate of Wide Bay-Burnett would have declined. The decline in the effective unemployment rate would have been moderate.
For the 2021-2026 period the average annual growth rate in population for Wide Bay-Burnett was 0.9% per annum compared to a Queensland average annual population growth rate of 1.5%. The average annual change in the population for Wide Bay-Burnett was 2,700 or 3.5% of the total change in Queensland's population.
For the 2021-2026 period the average annual employment growth for Wide Bay-Burnett was 0.8% per annum compared to a Queensland total employment growth of 1.5%. The total number of net new employment positions created was 900 or 2.3% of the total net employment positions in Queensland.
During this time the effective underlying unemployment rate of Wide Bay-Burnett would have declined. The decline in the effective unemployment rate would have been moderate.
Construction activity
Over the 2006-2011 period, the average rate of growth for Wide Bay/Burnett total construction was a decline of 3.9% per annum, which translated to an average annual decrease in expenditure of $74 million.
The most significant contribution to this change is new dwelling construction with a negative contribution in terms of average annual change of $65 million which explained 87.4% of the total annual change. The next largest contribution to this change is private engineering with a negative contribution in terms of average annual change of $22 million which explained 29.6% of the total annual change. Other sector contributions were public engineering with a positive contribution of $21 million which explained -28.3% of the total annual change, private non-residential building with a negative contribution of $10 million which explained 13.7% of the total annual change and public non-residential building with a positive contribution of $2 million which explained -2.6% of the total annual change.
The average change in total construction expenditure over this period was a decrease of $74 million. This represents a contribution to total Queensland construction growth of -1.9%, this change in total construction expenditure in Wide Bay/Burnett is in the opposite direction to that of Queensland.
For the 2011-2016 period, the average rate of growth for Wide Bay/Burnett total construction was a decline of 4.8% per annum, which translated to an average annual decrease in expenditure of $77 million.
Queensland region construction supply and demand analysis: 1995-2026 and quarterly
indicators to June 2018 – June Annual Report 2016
63 63 63 63
The most significant contribution to this change is public engineering with a negative contribution in terms of average annual change of $30 million which explained 38.8% of the total annual change. The next largest contribution to this change is new dwelling construction with a negative contribution in terms of average annual change of $25 million which explained 32.1% of the total annual change. Other sector contributions were public non-residential building with a negative contribution of $17 million which explained 22.6% of the total annual change, other dwelling construction with a negative contribution of $13 million which explained 17.2% of the total annual change and private non-residential building with a positive contribution of $8 million which explained -10.6% of the total annual change.
The average change in total construction expenditure over this period was a decrease of $77 million. This represents a contribution to total Queensland construction growth of 9.2%, this change in total construction expenditure in Wide Bay/Burnett is in the same direction as that of Queensland.
Over the 2016-2021 projection period, the average rate of growth for Wide Bay/Burnett total construction is an increase of 2.3% per annum, which translated to an average annual increase in expenditure of $30 million.
The most significant contribution to this change is new dwelling construction with a positive contribution in terms of average annual change of $16 million which explained 52.5% of the total annual change. The next largest contribution to this change is other dwelling construction with a positive contribution in terms of average annual change of $13 million which explained 45.3% of the total annual change. Other sector contributions were public non-residential building with a positive contribution of $10 million which explained 33.4% of the total annual change, private engineering with a negative contribution of $7 million which explained -22.2% of the total annual change and public engineering with a negative contribution of $5 million which explained -16.9% of the total annual change.
The average change in total construction expenditure over this period was an increase of $30 million. This represents a contribution to total Queensland construction growth of 6.5%, this change in total construction expenditure in Wide Bay/Burnett is in the same direction as that of Queensland.
For the 2021-2026 period, the average rate of growth for Wide Bay/Burnett total construction is an increase of 3.9% per annum, which translated to an average annual increase in expenditure of $56 million.
The most significant contribution to this change is public engineering with a positive contribution in terms of average annual change of $26 million which explained 45.9% of the total annual change. The next largest contribution to this change is new dwelling construction with a positive contribution in terms of average annual change of $14 million which explained 25% of the total annual change. Other sector contributions were other dwelling construction with a positive contribution of $9 million which explained 15.8% of the total annual change, public non-residential building with a positive contribution of $8 million which explained 13.5% of the total annual change and private non-residential building with a negative contribution of $3 million which explained -4.9% of the total annual change.
The average change in total construction expenditure over this period was an increase of $56 million. This represents a contribution to total Queensland construction growth of 2.5%, this change in total construction expenditure in Wide Bay/Burnett is in the same direction as that of Queensland.
For Wide Bay/Burnett total construction activity declined by 11.8% in 2016 the change was a decrease of $164 million.
For Wide Bay/Burnett total construction activity increased by 4.6% in 2017 the change was an increase of $57 million.
For Wide Bay/Burnett total construction activity declined by 0.7% in 2018 the change was a decrease of $9 million.

Queensland region construction supply and demand analysis: 1995-2026 and quarterly
indicators to June 2018 – June Annual Report 2016
64 64 64 64
Capacity utilisation
Over the 2006-2011 period Wide Bay/Burnett had an average annual average shortage of 278.2 in construction workers relative to the supply from residents. This means that Wide Bay/Burnett construction worker requirements for a balanced labour market would have had to be met by import of labour from other regions. In contrast the average Queensland shortage of construction workers was 2994.4. The degree to which the construction industry in Wide Bay/Burnett was operating above normal capacity was $278.2m.
Over the 2011-2016 period Wide Bay/Burnett had an average annual average surplus of -161 in construction workers relative to the supply from residents. This means that Wide Bay/Burnett construction worker requirements for a balanced labour market would have had to be met by the export of labour services to other regions. In contrast the average Queensland shortage of construction workers was 1782.2. The degree to which the construction industry in Wide Bay/Burnett was operating below normal capacity was $-161m.
Over the 2016-2021 period Wide Bay/Burnett is projected to have an average annual average surplus of -267.2 in construction workers relative to the supply from residents. This means that Wide Bay/Burnett construction worker requirements for a balanced labour market will have to be met by the export of labour services to other regions. In contrast the average Queensland surplus of construction workers is predicted to be -6110.9. The degree to which the construction industry in Wide Bay/Burnett will be operating below normal capacity is $-267.2m.
Over the 2021-2026 period Wide Bay/Burnett is projected to have an average annual average surplus of -170.7 in construction workers relative to the supply from residents. This means that Wide Bay/Burnett construction worker requirements for a balanced labour market will have to be met by the export of labour services to other regions. In contrast the average Queensland surplus of construction workers is predicted to be -3369. The degree to which the construction industry in Wide Bay/Burnett will be operating below normal capacity is $-170.7m.
Figure 3.26: Queensland regional construction value of work done – Wide Bay-Burnett (CVM $m)

Queensland region construction supply and demand analysis: 1995-2026 and quarterly
indicators to June 2018 – June Annual Report 2016
65 65 65 65
3.7.6 Darling Downs
Population and employment
For the 2006-2011 period the average annual growth rate in population for Darling Downs was 1.4% per annum compared to a Queensland average annual population growth rate of 2.2%. The average annual change in the population for Darling Downs was 3,100 or 3.3% of the total change in Queensland's population.
For the 2006-2011 period the average annual employment growth for Darling Downs was 1.7% per annum compared to a Queensland total employment growth of 2.8%. The total number of net new employment positions created was 1,800 or 3.1% of the total net employment positions in Queensland.
During this time the effective underlying unemployment rate of Darling Downs would have declined. The decline in the effective unemployment rate would have been moderate.
For the 2011-2016 period the average annual growth rate in population for Darling Downs was 1% per annum compared to a Queensland average annual population growth rate of 1.6%. The average annual change in the population for Darling Downs was 2,400 or 3.3% of the total change in Queensland's population.
For the 2011-2016 period the average annual employment growth for Darling Downs was 0.5% per annum compared to a Queensland total employment growth of 1.1%. The total number of net new employment positions created was 500 or 2.1% of the total net employment positions in Queensland.
During this time the effective underlying unemployment rate of Darling Downs would have declined. The decline in the effective unemployment rate would have been moderate.
For the 2016-2021 period the average annual growth rate in population for Darling Downs was 0.8% per annum compared to a Queensland average annual population growth rate of 1.5%. The average annual change in the population for Darling Downs was 1,900 or 2.6% of the total change in Queensland's population.
For the 2016-2021 period the average annual employment growth for Darling Downs was 0.9% per annum compared to a Queensland total employment growth of 1.7%. The total number of net new employment positions created was 1,100 or 2.6% of the total net employment positions in Queensland.
During this time the effective underlying unemployment rate of Darling Downs would have declined. The decline in the effective unemployment rate would have been moderate.
For the 2021-2026 period the average annual growth rate in population for Darling Downs was 0.7% per annum compared to a Queensland average annual population growth rate of 1.5%. The average annual change in the population for Darling Downs was 1,900 or 2.4% of the total change in Queensland's population.
For the 2021-2026 period the average annual employment growth for Darling Downs was 0.6% per annum compared to a Queensland total employment growth of 1.5%. The total number of net new employment positions created was 700 or 1.9% of the total net employment positions in Queensland.
During this time the effective underlying unemployment rate of Darling Downs would have declined. The decline in the effective unemployment rate would have been moderate.

Queensland region construction supply and demand analysis: 1995-2026 and quarterly
indicators to June 2018 – June Annual Report 2016
66 66 66 66
Construction activity
Over the 2006-2011 period, the average rate of growth for Darling Downs total construction was an increase of 16.2% per annum, which translated to an average annual increase in expenditure of $381 million.
The most significant contribution to this change is private engineering with a positive contribution in terms of average annual change of $355 million which explained 93.4% of the total annual change. The next largest contribution to this change is other dwelling construction with a positive contribution in terms of average annual change of $16 million which explained 4.1% of the total annual change. Other sector contributions were new dwelling construction with a negative contribution of $12 million which explained -3.2% of the total annual change, public engineering with a positive contribution of $11 million which explained 3% of the total annual change.
The average change in total construction expenditure over this period was an increase of $381 million. This represents a contribution to total Queensland construction growth of 9.6%, this change in total construction expenditure in Darling Downs is in the same direction as that of Queensland.
For the 2011-2016 period, the average rate of growth for Darling Downs total construction was a decline of 3.3% per annum, which translated to an average annual decrease in expenditure of $183 million.

Queensland region construction supply and demand analysis: 1995-2026 and quarterly
indicators to June 2018 – June Annual Report 2016
67 67 67 67
The most significant contribution to this change is private engineering with a negative contribution in terms of average annual change of $228 million which explained 124.3% of the total annual change. The next largest contribution to this change is public engineering with a positive contribution in terms of average annual change of $46 million which explained -25% of the total annual change. Other sector contributions were private non-residential building with a positive contribution of $34 million which explained -18.6% of the total annual change, new dwelling construction with a negative contribution of $18 million which explained 10% of the total annual change and other dwelling construction with a negative contribution of $10 million which explained 5.5% of the total annual change.
The average change in total construction expenditure over this period was a decrease of $183 million. This represents a contribution to total Queensland construction growth of 21.7%, this change in total construction expenditure in Darling Downs is in the same direction as that of Queensland.
Over the 2016-2021 projection period, the average rate of growth for Darling Downs total construction is a decline of 2.2% per annum, which translated to an average annual decrease in expenditure of $53 million.
The most significant contribution to this change is private non-residential building with a negative contribution in terms of average annual change of $38 million which explained 71.8% of the total annual change. The next largest contribution to this change is public engineering with a negative contribution in terms of average annual change of $15 million which explained 28.4% of the total annual change. Other sector contributions were private engineering with a negative contribution of $13 million which explained 24.5% of the total annual change, other dwelling construction with a positive contribution of $12 million which explained -22.1% of the total annual change and public non-residential building with a positive contribution of $6 million which explained -10.8% of the total annual change.
The average change in total construction expenditure over this period was a decrease of $53 million. This represents a contribution to total Queensland construction growth of -11.6%, this change in total construction expenditure in Darling Downs is in the opposite direction to that of Queensland.
For the 2021-2026 period, the average rate of growth for Darling Downs total construction is an increase of 17.1% per annum, which translated to an average annual increase in expenditure of $463 million.
The most significant contribution to this change is private engineering with a positive contribution in terms of average annual change of $437 million which explained 94.6% of the total annual change. The next largest contribution to this change is public engineering with a positive contribution in terms of average annual change of $17 million which explained 3.7% of the total annual change. Other sector contributions were private non-residential building with a negative contribution of $16 million which explained -3.5% of the total annual change, new dwelling construction with a positive contribution of $8 million which explained 1.7% of the total annual change and
The average change in total construction expenditure over this period was an increase of $463 million. This represents a contribution to total Queensland construction growth of 20.7%, this change in total construction expenditure in Darling Downs is in the same direction as that of Queensland.
For Darling Downs total construction activity declined by 15.2% in 2016 the change was a decrease of $433 million.
For Darling Downs total construction activity declined by 4.6% in 2017 the change was a decrease of $112 million.
For Darling Downs total construction activity declined by 4% in 2018 the change was a decrease of $93 million.

Queensland region construction supply and demand analysis: 1995-2026 and quarterly
indicators to June 2018 – June Annual Report 2016
68 68 68 68
Capacity utilisation
Over the 2006-2011 period Darling Downs had an average annual average shortage of 396 in construction workers relative to the supply from residents. This means that Darling Downs construction worker requirements for a balanced labour market would have had to be met by import of labour from other regions. In contrast the average Queensland shortage of construction workers was 2994.4. The degree to which the construction industry in Darling Downs was operating above normal capacity was $396m.
Over the 2011-2016 period Darling Downs had an average annual average shortage of 43.1 in construction workers relative to the supply from residents. This means that Darling Downs construction worker requirements for a balanced labour market would have had to be met by import of labour from other regions. In contrast the average Queensland shortage of construction workers was 1782.2. The degree to which the construction industry in Darling Downs was operating above normal capacity was $43.1m.
Over the 2016-2021 period Darling Downs is projected to have an average annual average surplus of -1050.5 in construction workers relative to the supply from residents. This means that Darling Downs construction worker requirements for a balanced labour market will have to be met by the export of labour services to other regions. In contrast the average Queensland surplus of construction workers is predicted to be -6110.9. The degree to which the construction industry in Darling Downs will be operating below normal capacity is $-1050.5m.
Over the 2021-2026 period Darling Downs is projected to have an average annual average surplus of -652.6 in construction workers relative to the supply from residents. This means that Darling Downs construction worker requirements for a balanced labour market will have to be met by the export of labour services to other regions. In contrast the average Queensland surplus of construction workers is predicted to be -3369. The degree to which the construction industry in Darling Downs will be operating below normal capacity is $-652.6m.
Figure 3.27: Queensland regional construction value of work done – Darling Downs (CVM $m)

Queensland region construction supply and demand analysis: 1995-2026 and quarterly
indicators to June 2018 – June Annual Report 2016
69 69 69 69
3.7.7 South West
Population and employment
For the 2006-2011 period there was no growth in population for South West. The growth rate for Queensland was 2.2%. The average annual change in the population for South West was 100 or 0.1% of the total change in Queensland's population.
For the 2006-2011 period the average annual employment growth for South West was 0.9% per annum compared to a Queensland total employment growth of 2.8%. The total number of net new employment positions created was 100 or 0.2% of the total net employment positions in Queensland.
During this time the effective underlying unemployment rate of South West would have declined. The decline in the effective unemployment rate would have been strong.
For the 2011-2016 period there was no growth in population for South West. The growth rate for Queensland was 1.6%. There was little change in the population of South West.
For the 2011-2016 period the average annual employment growth for South West was -0.3% per annum compared to a Queensland total employment growth of 1.1%. The total number of net new employment positions created was zero or -0.2% of the total net employment positions in Queensland.
During this time the effective underlying unemployment rate of South West would have increased. The increase in the effective unemployment rate would have been moderate.
For the 2016-2021 period there was no growth in population for South West. The growth rate for Queensland was 1.5%. The average annual change in the population for South West was -100 or -0.1% of the total change in Queensland's population.
For the 2016-2021 period the average annual employment growth for South West was -0.3% per annum compared to a Queensland total employment growth of 1.7%. The total number of net new employment positions created was zero or -0.1% of the total net employment positions in Queensland.
During this time the effective underlying unemployment rate of South West would have declined. The decline in the effective unemployment rate would have been strong.
For the 2021-2026 period there was no growth in population for South West. The growth rate for Queensland was 1.5%. There was little change in the population of South West.
For the 2006-2011 period there was no change in employment for South West. The growth rate for Queensland total employment was 1.5%. The total number of net new employment positions created was zero or 0% of the total net employment positions in Queensland.
During this time the effective underlying unemployment rate of South West would have declined. The decline in the effective unemployment rate would have been moderate.
Construction activity
Over the 2006-2011 period, the average rate of growth for South West total construction was an increase of 71.6% per annum, which translated to an average annual increase in expenditure of $326.9 million.
The most significant contribution to this change is private engineering with a positive contribution in terms of average annual change of $300.1 million which explained 91.8% of the total annual change. The next largest contribution to this change is public engineering with a positive contribution in terms

Queensland region construction supply and demand analysis: 1995-2026 and quarterly
indicators to June 2018 – June Annual Report 2016
70 70 70 70
of average annual change of $22.1 million which explained 6.7% of the total annual change. Other sector contributions were private non-residential building with a positive contribution of $2.1 million which explained 0.7% of the total annual change, other dwelling construction with a positive contribution of $1.2 million which explained 0.4% of the total annual change and new dwelling construction with a positive contribution of $1.1 million which explained 0.3% of the total annual change.
The average change in total construction expenditure over this period was an increase of $327 million. This represents a contribution to total Queensland construction growth of 8.2%, this change in total construction expenditure in South West is in the same direction as that of Queensland.
For the 2011-2016 period, the average rate of growth for South West total construction was an increase of 6.9% per annum, which translated to an average annual decrease in expenditure of $74.1 million.
The most significant contribution to this change is private engineering with a negative contribution in terms of average annual change of $74.9 million which explained 101.2% of the total annual change. The next largest contribution to this change is public engineering with a positive contribution in terms of average annual change of $4.4 million which explained -6% of the total annual change. Other sector contributions were public non-residential building with a negative contribution of $2.3 million which explained 3.1% of the total annual change, new dwelling construction with a negative contribution of $1.5 million which explained 2% of the total annual change and private non-residential building with a positive contribution of $0.6 million which explained -0.8% of the total annual change.
The average change in total construction expenditure over this period was a decrease of $74 million. This represents a contribution to total Queensland construction growth of 8.8%, this change in total construction expenditure in South West is in the same direction as that of Queensland.
Over the 2016-2021 projection period, the average rate of growth for South West total construction is a decline of 2.3% per annum, which translated to an average annual decrease in expenditure of $95.1 million.
The most significant contribution to this change is private engineering with a negative contribution in terms of average annual change of $104.6 million which explained 110% of the total annual change. The next largest contribution to this change is public engineering with a positive contribution in terms of average annual change of $7.4 million which explained -7.8% of the total annual change. Other sector contributions were other dwelling construction with a positive contribution of $0.9 million which explained -1% of the total annual change, new dwelling construction with a positive contribution of $0.6 million which explained -0.6% of the total annual change.
The average change in total construction expenditure over this period was a decrease of $95 million. This represents a contribution to total Queensland construction growth of -20.6%, this change in total construction expenditure in South West is in the opposite direction to that of Queensland.
For the 2021-2026 period, the average rate of growth for South West total construction is a decline of 6% per annum, which translated to an average annual decrease in expenditure of $77.7 million.
Queensland region construction supply and demand analysis: 1995-2026 and quarterly
indicators to June 2018 – June Annual Report 2016
71 71 71 71
The most significant contribution to this change is private engineering with a negative contribution in terms of average annual change of $87.3 million which explained 112.4% of the total annual change. The next largest contribution to this change is public engineering with a positive contribution in terms of average annual change of $6.6 million which explained -8.5% of the total annual change. Other sector contributions were new dwelling construction with a positive contribution of $1.1 million which explained -1.4% of the total annual change, other dwelling construction with a positive contribution of $0.9 million which explained -1.1% of the total annual change and public non-residential building with a positive contribution of $0.8 million which explained -1% of the total annual change.
The average change in total construction expenditure over this period was a decrease of $78 million. This represents a contribution to total Queensland construction growth of -3.5%, this change in total construction expenditure in South West is in the opposite direction to that of Queensland.
For South West total construction activity declined by 42% in 2016 the change was a decrease of $721 million.
For South West total construction activity declined by 56.4% in 2017 the change was a decrease of $562 million.
For South West total construction activity increased by 17.7% in 2018 the change was an increase of $77 million.
Capacity utilisation
Over the 2006-2011 period South West had an average annual average shortage of 93.4 in construction workers relative to the supply from residents. This means that South West construction worker requirements for a balanced labour market would have had to be met by import of labour from other regions. In contrast the average Queensland shortage of construction workers was 2994.4. The degree to which the construction industry in South West was operating above normal capacity was $93.4m.
Over the 2011-2016 period South West had an average annual average shortage of 167.2 in construction workers relative to the supply from residents. This means that South West construction worker requirements for a balanced labour market would have had to be met by import of labour from other regions. In contrast the average Queensland shortage of construction workers was 1782.2. The degree to which the construction industry in South West was operating above normal capacity was $167.2m.
Over the 2016-2021 period South West is projected to have an average annual average surplus of -473.8 in construction workers relative to the supply from residents. This means that South West construction worker requirements for a balanced labour market will have to be met by the export of labour services to other regions. In contrast the average Queensland surplus of construction workers is predicted to be -6110.9. The degree to which the construction industry in South West will be operating below normal capacity is $-473.8m.
Over the 2021-2026 period South West is projected to have an average annual average surplus of -450.2 in construction workers relative to the supply from residents. This means that South West construction worker requirements for a balanced labour market will have to be met by the export of labour services to other regions. In contrast the average Queensland surplus of construction workers is predicted to be -3369. The degree to which the construction industry in South West will be operating below normal capacity is $-450.2m.

Queensland region construction supply and demand analysis: 1995-2026 and quarterly
indicators to June 2018 – June Annual Report 2016
72 72 72 72
Figure 3.28: Queensland regional construction value of work done – South West (CVM $m)
3.7.8 Fitzroy
Population and employment
For the 2006-2011 period the average annual growth rate in population for Fitzroy was 1.7% per annum compared to a Queensland average annual population growth rate of 2.2%. The average annual change in the population for Fitzroy was 3,600 or 3.8% of the total change in Queensland's population.
For the 2006-2011 period the average annual employment growth for Fitzroy was 2.7% per annum compared to a Queensland total employment growth of 2.8%. The total number of net new employment positions created was 2,700 or 4.7% of the total net employment positions in Queensland.
During this time the effective underlying unemployment rate of Fitzroy would have declined. The decline in the effective unemployment rate would have been strong.
For the 2011-2016 period the average annual growth rate in population for Fitzroy was 1.7% per annum compared to a Queensland average annual population growth rate of 1.6%. The average annual change in the population for Fitzroy was 3,900 or 5.3% of the total change in Queensland's population.
For the 2011-2016 period the average annual employment growth for Fitzroy was 1.4% per annum compared to a Queensland total employment growth of 1.1%. The total number of net new employment positions created was 1,500 or 6% of the total net employment positions in Queensland.
During this time the effective underlying unemployment rate of Fitzroy would have declined. The decline in the effective unemployment rate would have been moderate.
Queensland region construction supply and demand analysis: 1995-2026 and quarterly
indicators to June 2018 – June Annual Report 2016
73 73 73 73
For the 2016-2021 period the average annual growth rate in population for Fitzroy was 1.2% per annum compared to a Queensland average annual population growth rate of 1.5%. The average annual change in the population for Fitzroy was 3,000 or 4% of the total change in Queensland's population.
For the 2016-2021 period the average annual employment growth for Fitzroy was 1.5% per annum compared to a Queensland total employment growth of 1.7%. The total number of net new employment positions created was 1,800 or 4.3% of the total net employment positions in Queensland.
During this time the effective underlying unemployment rate of Fitzroy would have declined. The decline in the effective unemployment rate would have been moderate.
For the 2021-2026 period the average annual growth rate in population for Fitzroy was 1.3% per annum compared to a Queensland average annual population growth rate of 1.5%. The average annual change in the population for Fitzroy was 3,300 or 4.2% of the total change in Queensland's population.
For the 2021-2026 period the average annual employment growth for Fitzroy was 1.3% per annum compared to a Queensland total employment growth of 1.5%. The total number of net new employment positions created was 1,700 or 4.5% of the total net employment positions in Queensland.
During this time the effective underlying unemployment rate of Fitzroy would have declined. The decline in the effective unemployment rate would have been moderate.
Construction activity
Over the 2006-2011 period, the average rate of growth for Fitzroy total construction was an increase of 40.2% per annum, which translated to an average annual increase in expenditure of $1826.2 million.
The most significant contribution to this change is private engineering with a positive contribution in terms of average annual change of $1826.6 million which explained 100% of the total annual change. The next largest contribution to this change is public engineering with a negative contribution in terms of average annual change of $49.6 million which explained -2.7% of the total annual change. Other sector contributions were private non-residential building with a positive contribution of $17.1 million which explained 0.9% of the total annual change, new dwelling construction with a positive contribution of $15.7 million which explained 0.9% of the total annual change and public non-residential building with a positive contribution of $10.3 million which explained 0.6% of the total annual change.
The average change in total construction expenditure over this period was an increase of $1826 million. This represents a contribution to total Queensland construction growth of 45.9%, this change in total construction expenditure in Fitzroy is in the same direction as that of Queensland.
For the 2011-2016 period, the average rate of growth for Fitzroy total construction was an increase of 11.5% per annum, which translated to an average annual decrease in expenditure of $53.7 million.

Queensland region construction supply and demand analysis: 1995-2026 and quarterly
indicators to June 2018 – June Annual Report 2016
74 74 74 74
The most significant contribution to this change is new dwelling construction with a negative contribution in terms of average annual change of $23.4 million which explained 43.6% of the total annual change. The next largest contribution to this change is public engineering with a negative contribution in terms of average annual change of $17.5 million which explained 32.7% of the total annual change. Other sector contributions were public non-residential building with a negative contribution of $8.8 million which explained 16.3% of the total annual change, private engineering with a positive contribution of $6.7 million which explained -12.5% of the total annual change and other dwelling construction with a negative contribution of $5.3 million which explained 10% of the total annual change.
The average change in total construction expenditure over this period was a decrease of $54 million. This represents a contribution to total Queensland construction growth of 6.4%, this change in total construction expenditure in Fitzroy is in the same direction as that of Queensland.
Over the 2016-2021 projection period, the average rate of growth for Fitzroy total construction is a decline of 4.9% per annum, which translated to an average annual decrease in expenditure of $354 million.
The most significant contribution to this change is private engineering with a negative contribution in terms of average annual change of $446.3 million which explained 126.1% of the total annual change. The next largest contribution to this change is new dwelling construction with a positive contribution in terms of average annual change of $42.5 million which explained -12% of the total annual change. Other sector contributions were private non-residential building with a positive contribution of $17.1 million which explained -4.8% of the total annual change, public engineering with a positive contribution of $16.3 million which explained -4.6% of the total annual change and other dwelling construction with a positive contribution of $10.6 million which explained -3% of the total annual change.
The average change in total construction expenditure over this period was a decrease of $354 million. This represents a contribution to total Queensland construction growth of -76.9%, this change in total construction expenditure in Fitzroy is in the opposite direction to that of Queensland.
For the 2021-2026 period, the average rate of growth for Fitzroy total construction is an increase of 2.7% per annum, which translated to an average annual increase in expenditure of $121.6 million.
The most significant contribution to this change is private engineering with a positive contribution in terms of average annual change of $49.5 million which explained 40.7% of the total annual change. The next largest contribution to this change is public engineering with a positive contribution in terms of average annual change of $25.9 million which explained 21.3% of the total annual change. Other sector contributions were new dwelling construction with a positive contribution of $22.5 million which explained 18.5% of the total annual change, other dwelling construction with a positive contribution of $10 million which explained 8.3% of the total annual change and public non-residential building with a positive contribution of $9.2 million which explained 7.6% of the total annual change.
The average change in total construction expenditure over this period was an increase of $122 million. This represents a contribution to total Queensland construction growth of 5.4%, this change in total construction expenditure in Fitzroy is in the same direction as that of Queensland.
For Fitzroy total construction activity declined by 44.4% in 2016 the change was a decrease of $5550 million.
For Fitzroy total construction activity declined by 22.7% in 2017 the change was a decrease of $1574 million.
For Fitzroy total construction activity declined by 8.7% in 2018 the change was a decrease of $469 million.

Queensland region construction supply and demand analysis: 1995-2026 and quarterly
indicators to June 2018 – June Annual Report 2016
75 75 75 75
Capacity utilisation
Over the 2006-2011 period Fitzroy had an average annual average shortage of 136.9 in construction workers relative to the supply from residents. This means that Fitzroy construction worker requirements for a balanced labour market would have had to be met by import of labour from other regions. In contrast the average Queensland shortage of construction workers was 2994.4. The degree to which the construction industry in Fitzroy was operating above normal capacity was $136.9m.
Over the 2011-2016 period Fitzroy had an average annual average shortage of 2089.8 in construction workers relative to the supply from residents. This means that Fitzroy construction worker requirements for a balanced labour market would have had to be met by import of labour from other regions. In contrast the average Queensland shortage of construction workers was 1782.2. The degree to which the construction industry in Fitzroy was operating above normal capacity was $2089.8m.
Over the 2016-2021 period Fitzroy is projected to have an average annual average surplus of -3147.1 in construction workers relative to the supply from residents. This means that Fitzroy construction worker requirements for a balanced labour market will have to be met by the export of labour services to other regions. In contrast the average Queensland surplus of construction workers is predicted to be -6110.9. The degree to which the construction industry in Fitzroy will be operating below normal capacity is $-3147.1m.
Over the 2021-2026 period Fitzroy is projected to have an average annual average surplus of -3463.5 in construction workers relative to the supply from residents. This means that Fitzroy construction worker requirements for a balanced labour market will have to be met by the export of labour services to other regions. In contrast the average Queensland surplus of construction workers is predicted to be -3369. The degree to which the construction industry in Fitzroy will be operating below normal capacity is $-3463.5m.
Figure 3.29: Queensland regional construction value of work done – Fitzroy (CVM $m)
Queensland region construction supply and demand analysis: 1995-2026 and quarterly
indicators to June 2018 – June Annual Report 2016
76 76 76 76
3.7.9 Central West
Population and employment
For the 2006-2011 period there was no growth in population for Central West. The growth rate for Queensland was 2.2%. There was little change in the population of Central West.
For the 2006-2011 period there was no change in employment for Central West. The growth rate for Queensland total employment was 2.8%. The total number of net new employment positions created was zero or 0% of the total net employment positions in Queensland.
During this time the effective underlying unemployment rate of Central West would have declined. The decline in the effective unemployment rate would have been moderate.
For the 2011-2016 period there was no growth in population for Central West. The growth rate for Queensland was 1.6%. There was little change in the population of Central West.
For the 2011-2016 period the average annual employment growth for Central West was -0.7% per annum compared to a Queensland total employment growth of 1.1%. The total number of net new employment positions created was -100 or -0.2% of the total net employment positions in Queensland.
During this time the effective underlying unemployment rate of Central West would have declined. The decline in the effective unemployment rate would have been strong.
For the 2016-2021 period the average annual growth rate in population for Central West was -0.6% per annum compared to a Queensland average annual population growth rate of 1.5%. The average annual change in the population for Central West was -100 or -0.1% of the total change in Queensland's population.
For the 2016-2021 period the average annual employment growth for Central West was -1.4% per annum compared to a Queensland total employment growth of 1.7%. The total number of net new employment positions created was -100 or -0.2% of the total net employment positions in Queensland.
During this time the effective underlying unemployment rate of Central West would have declined. The decline in the effective unemployment rate would have been strong.
For the 2021-2026 period there was no growth in population for Central West. The growth rate for Queensland was 1.5%. The average annual change in the population for Central West was -100 or -0.1% of the total change in Queensland's population.
For the 2021-2026 period the average annual employment growth for Central West was -0.9% per annum compared to a Queensland total employment growth of 1.5%. The total number of net new employment positions created was -100 or -0.2% of the total net employment positions in Queensland.
During this time the effective underlying unemployment rate of Central West would have declined. The decline in the effective unemployment rate would have been strong.
Construction activity
Over the 2006-2011 period, the average rate of growth for Central West total construction was an increase of 20.4% per annum, which translated to an average annual increase in expenditure of $29 million.
The most significant contribution to this change is private engineering with a positive contribution in terms of average annual change of $25 million which explained 83.9% of the total annual change. The

Queensland region construction supply and demand analysis: 1995-2026 and quarterly
indicators to June 2018 – June Annual Report 2016
77 77 77 77
next largest contribution to this change is public non-residential building with a positive contribution in terms of average annual change of $2 million which explained 7.7% of the total annual change. Other sector contributions were new dwelling construction with a positive contribution of $1 million which explained 2.9% of the total annual change.
The average change in total construction expenditure over this period was an increase of $29 million. This represents a contribution to total Queensland construction growth of 0.7%, this change in total construction expenditure in Central West is in the same direction as that of Queensland.
For the 2011-2016 period, the average rate of growth for Central West total construction was an increase of 31.6% per annum, which translated to an average annual increase in expenditure of $92 million.
The most significant contribution to this change is private engineering with a positive contribution in terms of average annual change of $92 million which explained 100.5% of the total annual change. The next largest contribution to this change is new dwelling construction with a negative contribution in terms of average annual change of $1 million which explained -1.1% of the total annual change. Other dwelling construction with a negative contribution of $0 million which explained -0.5% of the total annual change and.
The average change in total construction expenditure over this period was an increase of $92 million. This represents a contribution to total Queensland construction growth of -10.8%, this change in total construction expenditure in Central West is in the opposite direction to that of Queensland.
Over the 2016-2021 projection period, the average rate of growth for Central West total construction is an increase of 24.6% per annum, which translated to an average annual decrease in expenditure of $97 million.
The most significant contribution to this change is private engineering with a negative contribution in terms of average annual change of $101 million which explained 103.8% of the total annual change. The next largest contribution to this change is private non-residential building with a positive contribution in terms of average annual change of $2 million which explained -2.1% of the total annual change. New dwelling construction with a positive contribution of $0 million which explained -0.1% of the total annual change and.
The average change in total construction expenditure over this period was a decrease of $97 million. This represents a contribution to total Queensland construction growth of -21.1%, this change in total construction expenditure in Central West is in the opposite direction to that of Queensland.
For the 2021-2026 period, the average rate of growth for Central West total construction is an increase of 82.9% per annum, which translated to an average annual increase in expenditure of $173 million.

Queensland region construction supply and demand analysis: 1995-2026 and quarterly
indicators to June 2018 – June Annual Report 2016
78 78 78 78
The most significant contribution to this change is private engineering with a positive contribution in terms of average annual change of $170 million which explained 98.2% of the total annual change. The next largest contribution to this change is public engineering with a positive contribution in terms of average annual change of $3 million which explained 1.8% of the total annual change. Other sector contributions were new dwelling construction with a negative contribution of $0 million which explained 0% of the total annual change.
The average change in total construction expenditure over this period was an increase of $173 million. This represents a contribution to total Queensland construction growth of 7.8%, this change in total construction expenditure in Central West is in the same direction as that of Queensland.
For Central West total construction activity declined by 15.6% in 2016 the change was a decrease of $119 million.
For Central West total construction activity increased by 11% in 2017 the change was an increase of $71 million.
For Central West total construction activity declined by 8.4% in 2018 the change was a decrease of $60 million.
Capacity utilisation
Over the 2006-2011 period Central West had an average annual average surplus of -15.2 in construction workers relative to the supply from residents. This means that Central West construction worker requirements for a balanced labour market would have had to be met by the export of labour services to other regions. In contrast the average Queensland shortage of construction workers was 2994.4. The degree to which the construction industry in Central West was operating below normal capacity was $-15.2m.
Over the 2011-2016 period Central West had an average annual average shortage of 118.9 in construction workers relative to the supply from residents. This means that Central West construction worker requirements for a balanced labour market would have had to be met by import of labour from other regions. In contrast the average Queensland shortage of construction workers was 1782.2. The degree to which the construction industry in Central West was operating above normal capacity was $118.9m.
Over the 2016-2021 period Central West is projected to have an average annual average shortage of 1089.7 in construction workers relative to the supply from residents. This means that Central West construction worker requirements for a balanced labour market will have to be met by import of labour from other regions. In contrast the average Queensland surplus of construction workers is predicted to be -6110.9. The degree to which the construction industry in Central West will be operating above normal capacity is $1089.7m.
Over the 2021-2026 period Central West is projected to have an average annual average shortage of 2455.7 in construction workers relative to the supply from residents. This means that Central West construction worker requirements for a balanced labour market will have to be met by import of labour from other regions. In contrast the average Queensland surplus of construction workers is predicted to be -3369. The degree to which the construction industry in Central West will be operating above normal capacity is $2455.7m.

Queensland region construction supply and demand analysis: 1995-2026 and quarterly
indicators to June 2018 – June Annual Report 2016
79 79 79 79
Figure 3.30: Queensland regional construction value of work done – Central West (CVM $m)
3.7.10 Mackay
Population and employment
For the 2006-2011 period the average annual growth rate in population for Mackay was 2.4% per annum compared to a Queensland average annual population growth rate of 2.2%. The average annual change in the population for Mackay was 3,800 or 4.1% of the total change in Queensland's population.
For the 2006-2011 period the average annual employment growth for Mackay was 3.4% per annum compared to a Queensland total employment growth of 2.8%. The total number of net new employment positions created was 2,900 or 5% of the total net employment positions in Queensland.
During this time the effective underlying unemployment rate of Mackay would have declined. The decline in the effective unemployment rate would have been strong.
For the 2011-2016 period the average annual growth rate in population for Mackay was 1.5% per annum compared to a Queensland average annual population growth rate of 1.6%. The average annual change in the population for Mackay was 2,500 or 3.5% of the total change in Queensland's population.
For the 2011-2016 period the average annual employment growth for Mackay was 0.3% per annum compared to a Queensland total employment growth of 1.1%. The total number of net new employment positions created was 300 or 1.2% of the total net employment positions in Queensland.
During this time the effective underlying unemployment rate of Mackay would have declined. The decline in the effective unemployment rate would have been moderate.

Queensland region construction supply and demand analysis: 1995-2026 and quarterly
indicators to June 2018 – June Annual Report 2016
80 80 80 80
For the 2016-2021 period the average annual growth rate in population for Mackay was 1% per annum compared to a Queensland average annual population growth rate of 1.5%. The average annual change in the population for Mackay was 1,900 or 2.6% of the total change in Queensland's population.
For the 2016-2021 period the average annual employment growth for Mackay was 0.7% per annum compared to a Queensland total employment growth of 1.7%. The total number of net new employment positions created was 700 or 1.6% of the total net employment positions in Queensland.
During this time the effective underlying unemployment rate of Mackay would have declined. The decline in the effective unemployment rate would have been moderate.
For the 2021-2026 period the average annual growth rate in population for Mackay was 1.2% per annum compared to a Queensland average annual population growth rate of 1.5%. The average annual change in the population for Mackay was 2,400 or 3.1% of the total change in Queensland's population.
For the 2021-2026 period the average annual employment growth for Mackay was 1.1% per annum compared to a Queensland total employment growth of 1.5%. The total number of net new employment positions created was 1,200 or 3.1% of the total net employment positions in Queensland.
During this time the effective underlying unemployment rate of Mackay would have declined. The decline in the effective unemployment rate would have been moderate.
Construction activity
Over the 2006-2011 period, the average rate of growth for Mackay total construction was an increase of 26% per annum, which translated to an average annual increase in expenditure of $680 million.
The most significant contribution to this change is private engineering with a positive contribution in terms of average annual change of $670 million which explained 98.6% of the total annual change. The next largest contribution to this change is private non-residential building with a positive contribution in terms of average annual change of $30 million which explained 4.4% of the total annual change. Other sector contributions were public engineering with a negative contribution of $21 million which explained -3.1% of the total annual change, public non-residential building with a positive contribution of $13 million which explained 1.9% of the total annual change and new dwelling construction with a negative contribution of $12 million which explained -1.8% of the total annual change.
The average change in total construction expenditure over this period was an increase of $680 million. This represents a contribution to total Queensland construction growth of 17.1%, this change in total construction expenditure in Mackay is in the same direction as that of Queensland.
For the 2011-2016 period, the average rate of growth for Mackay total construction was a decline of 0.5% per annum, which translated to an average annual decrease in expenditure of $248 million.

Queensland region construction supply and demand analysis: 1995-2026 and quarterly
indicators to June 2018 – June Annual Report 2016
81 81 81 81
The most significant contribution to this change is private engineering with a negative contribution in terms of average annual change of $93 million which explained 37.6% of the total annual change. The next largest contribution to this change is new dwelling construction with a negative contribution in terms of average annual change of $52 million which explained 21% of the total annual change. Other sector contributions were private non-residential building with a negative contribution of $40 million which explained 16% of the total annual change, public non-residential building with a negative contribution of $36 million which explained 14.4% of the total annual change and public engineering with a negative contribution of $31 million which explained 12.4% of the total annual change.
The average change in total construction expenditure over this period was a decrease of $248 million. This represents a contribution to total Queensland construction growth of 29.4%, this change in total construction expenditure in Mackay is in the same direction as that of Queensland.
Over the 2016-2021 projection period, the average rate of growth for Mackay total construction is a decline of 0.3% per annum, which translated to an average annual decrease in expenditure of $79 million.
The most significant contribution to this change is private engineering with a negative contribution in terms of average annual change of $225 million which explained 284.1% of the total annual change. The next largest contribution to this change is public engineering with a positive contribution in terms of average annual change of $96 million which explained -121% of the total annual change. Other sector contributions were new dwelling construction with a positive contribution of $34 million which explained -42.5% of the total annual change, other dwelling construction with a positive contribution of $8 million which explained -9.8% of the total annual change and public non-residential building with a positive contribution of $5 million which explained -6.7% of the total annual change.
The average change in total construction expenditure over this period was a decrease of $79 million. This represents a contribution to total Queensland construction growth of -17.2%, this change in total construction expenditure in Mackay is in the opposite direction to that of Queensland.
For the 2021-2026 period, the average rate of growth for Mackay total construction is an increase of 10.9% per annum, which translated to an average annual increase in expenditure of $366 million.
The most significant contribution to this change is private engineering with a positive contribution in terms of average annual change of $290 million which explained 79.3% of the total annual change. The next largest contribution to this change is public engineering with a positive contribution in terms of average annual change of $34 million which explained 9.4% of the total annual change. Other sector contributions were new dwelling construction with a positive contribution of $26 million which explained 7.1% of the total annual change, other dwelling construction with a positive contribution of $8 million which explained 2.2% of the total annual change and public non-residential building with a positive contribution of $4 million which explained 1.1% of the total annual change.
The average change in total construction expenditure over this period was an increase of $366 million. This represents a contribution to total Queensland construction growth of 16.4%, this change in total construction expenditure in Mackay is in the same direction as that of Queensland.
For Mackay total construction activity declined by 29.6% in 2016 the change was a decrease of $1245 million.
For Mackay total construction activity declined by 35.6% in 2017 the change was a decrease of $1053 million.
For Mackay total construction activity increased by 26.8% in 2018 the change was an increase of $509 million.

Queensland region construction supply and demand analysis: 1995-2026 and quarterly
indicators to June 2018 – June Annual Report 2016
82 82 82 82
Capacity utilisation
Over the 2006-2011 period Mackay had an average annual average shortage of 260.1 in construction workers relative to the supply from residents. This means that Mackay construction worker requirements for a balanced labour market would have had to be met by import of labour from other regions. In contrast the average Queensland shortage of construction workers was 2994.4. The degree to which the construction industry in Mackay was operating above normal capacity was $260.1m.
Over the 2011-2016 period Mackay had an average annual average shortage of 388.8 in construction workers relative to the supply from residents. This means that Mackay construction worker requirements for a balanced labour market would have had to be met by import of labour from other regions. In contrast the average Queensland shortage of construction workers was 1782.2. The degree to which the construction industry in Mackay was operating above normal capacity was $388.8m.
Over the 2016-2021 period Mackay is projected to have an average annual average surplus of -1540.6 in construction workers relative to the supply from residents. This means that Mackay construction worker requirements for a balanced labour market will have to be met by the export of labour services to other regions. In contrast the average Queensland surplus of construction workers is predicted to be -6110.9. The degree to which the construction industry in Mackay will be operating below normal capacity is $-1540.6m.
Over the 2021-2026 period Mackay is projected to have an average annual average surplus of -1690.2 in construction workers relative to the supply from residents. This means that Mackay construction worker requirements for a balanced labour market will have to be met by the export of labour services to other regions. In contrast the average Queensland surplus of construction workers is predicted to be -3369. The degree to which the construction industry in Mackay will be operating below normal capacity is $-1690.2m.
Figure 3.31: Queensland regional construction value of work done – Mackay (CVM $m)

Queensland region construction supply and demand analysis: 1995-2026 and quarterly
indicators to June 2018 – June Annual Report 2016
83 83 83 83
3.7.11 Northern
Population and employment
For the 2006-2011 period the average annual growth rate in population for Northern was 2% per annum compared to a Queensland average annual population growth rate of 2.2%. The average annual change in the population for Northern was 4,300 or 4.6% of the total change in Queensland's population.
For the 2006-2011 period the average annual employment growth for Northern was 2.5% per annum compared to a Queensland total employment growth of 2.8%. The total number of net new employment positions created was 2,700 or 4.6% of the total net employment positions in Queensland.
During this time the effective underlying unemployment rate of Northern would have declined. The decline in the effective unemployment rate would have been moderate.
For the 2011-2016 period the average annual growth rate in population for Northern was 1.4% per annum compared to a Queensland average annual population growth rate of 1.6%. The average annual change in the population for Northern was 3,300 or 4.4% of the total change in Queensland's population.
For the 2011-2016 period the average annual employment growth for Northern was -0.3% per annum compared to a Queensland total employment growth of 1.1%. The total number of net new employment positions created was -400 or -1.4% of the total net employment positions in Queensland.
During this time the effective underlying unemployment rate of Northern would have increased. The increase in the effective unemployment rate would have been moderate.
For the 2016-2021 period the average annual growth rate in population for Northern was 1.3% per annum compared to a Queensland average annual population growth rate of 1.5%. The average annual change in the population for Northern was 3,200 or 4.4% of the total change in Queensland's population.
For the 2016-2021 period the average annual employment growth for Northern was 1.3% per annum compared to a Queensland total employment growth of 1.7%. The total number of net new employment positions created was 1,500 or 3.7% of the total net employment positions in Queensland.
During this time the effective underlying unemployment rate of Northern would have declined. The decline in the effective unemployment rate would have been moderate.
For the 2021-2026 period the average annual growth rate in population for Northern was 1.4% per annum compared to a Queensland average annual population growth rate of 1.5%. The average annual change in the population for Northern was 3,600 or 4.6% of the total change in Queensland's population.
For the 2021-2026 period the average annual employment growth for Northern was 1.4% per annum compared to a Queensland total employment growth of 1.5%. The total number of net new employment positions created was 1,800 or 4.6% of the total net employment positions in Queensland.
During this time the effective underlying unemployment rate of Northern would have declined. The decline in the effective unemployment rate would have been moderate.
Queensland region construction supply and demand analysis: 1995-2026 and quarterly
indicators to June 2018 – June Annual Report 2016
84 84 84 84
Construction activity
Over the 2006-2011 period, the average rate of growth for Northern total construction was an increase of 2.6% per annum, which translated to an average annual increase in expenditure of $57 million.
The most significant contribution to this change is private engineering with a positive contribution in terms of average annual change of $67 million which explained 117.6% of the total annual change. The next largest contribution to this change is new dwelling construction with a negative contribution in terms of average annual change of $29 million which explained -51.3% of the total annual change. Other sector contributions were private non-residential building with a positive contribution of $12 million which explained 22% of the total annual change, public non-residential building with a positive contribution of $8 million which explained 13.5% of the total annual change and other dwelling construction with a negative contribution of $3 million which explained -5.9% of the total annual change.
The average change in total construction expenditure over this period was an increase of $57 million. This represents a contribution to total Queensland construction growth of 1.4%, this change in total construction expenditure in Northern is in the same direction as that of Queensland.
For the 2011-2016 period, the average rate of growth for Northern total construction was a decline of 4.1% per annum, which translated to an average annual decrease in expenditure of $111 million.
The most significant contribution to this change is private engineering with a negative contribution in terms of average annual change of $44 million which explained 39.9% of the total annual change. The next largest contribution to this change is new dwelling construction with a negative contribution in terms of average annual change of $37 million which explained 33.7% of the total annual change. Other sector contributions were public non-residential building with a negative contribution of $30 million which explained 26.7% of the total annual change, private non-residential building with a positive contribution of $8 million which explained -7% of the total annual change and other dwelling construction with a negative contribution of $6 million which explained 5.7% of the total annual change.
The average change in total construction expenditure over this period was a decrease of $111 million. This represents a contribution to total Queensland construction growth of 13.1%, this change in total construction expenditure in Northern is in the same direction as that of Queensland.
Over the 2016-2021 projection period, the average rate of growth for Northern total construction is an increase of 7.9% per annum, which translated to an average annual increase in expenditure of $142 million.
The most significant contribution to this change is private engineering with a positive contribution in terms of average annual change of $54 million which explained 37.9% of the total annual change. The next largest contribution to this change is new dwelling construction with a positive contribution in terms of average annual change of $26 million which explained 18.2% of the total annual change. Other sector contributions were private non-residential building with a positive contribution of $23 million which explained 15.9% of the total annual change, public engineering with a positive contribution of $15 million which explained 10.3% of the total annual change and other dwelling construction with a positive contribution of $13 million which explained 9.2% of the total annual change.
The average change in total construction expenditure over this period was an increase of $142 million. This represents a contribution to total Queensland construction growth of 30.8%, this change in total construction expenditure in Northern is in the same direction as that of Queensland.
For the 2021-2026 period, the average rate of growth for Northern total construction is an increase of 3% per annum, which translated to an average annual increase in expenditure of $64 million.
Queensland region construction supply and demand analysis: 1995-2026 and quarterly
indicators to June 2018 – June Annual Report 2016
85 85 85 85
The most significant contribution to this change is private engineering with a positive contribution in terms of average annual change of $44 million which explained 67.9% of the total annual change. The next largest contribution to this change is public engineering with a negative contribution in terms of average annual change of $27 million which explained -42.7% of the total annual change. Other sector contributions were new dwelling construction with a positive contribution of $25 million which explained 38.5% of the total annual change, public non-residential building with a positive contribution of $14 million which explained 21.6% of the total annual change and other dwelling construction with a positive contribution of $12 million which explained 19% of the total annual change.
The average change in total construction expenditure over this period was an increase of $64 million. This represents a contribution to total Queensland construction growth of 2.9%, this change in total construction expenditure in Northern is in the same direction as that of Queensland.
For Northern total construction activity declined by 17% in 2016 the change was a decrease of $336 million.
For Northern total construction activity increased by 4.8% in 2017 the change was an increase of $79 million.
For Northern total construction activity increased by 19.5% in 2018 the change was an increase of $335 million.
Capacity utilisation
Over the 2006-2011 period Northern had an average annual average shortage of 42.5 in construction workers relative to the supply from residents. This means that Northern construction worker requirements for a balanced labour market would have had to be met by import of labour from other regions. In contrast the average Queensland shortage of construction workers was 2994.4. The degree to which the construction industry in Northern was operating above normal capacity was $42.5m.
Over the 2011-2016 period Northern had an average annual average surplus of -29.2 in construction workers relative to the supply from residents. This means that Northern construction worker requirements for a balanced labour market would have had to be met by the export of labour services to other regions. In contrast the average Queensland shortage of construction workers was 1782.2. The degree to which the construction industry in Northern was operating below normal capacity was $-29.2m.
Over the 2016-2021 period Northern is projected to have an average annual average surplus of -422.7 in construction workers relative to the supply from residents. This means that Northern construction worker requirements for a balanced labour market will have to be met by the export of labour services to other regions. In contrast the average Queensland surplus of construction workers is predicted to be -6110.9. The degree to which the construction industry in Northern will be operating below normal capacity is $-422.7m.
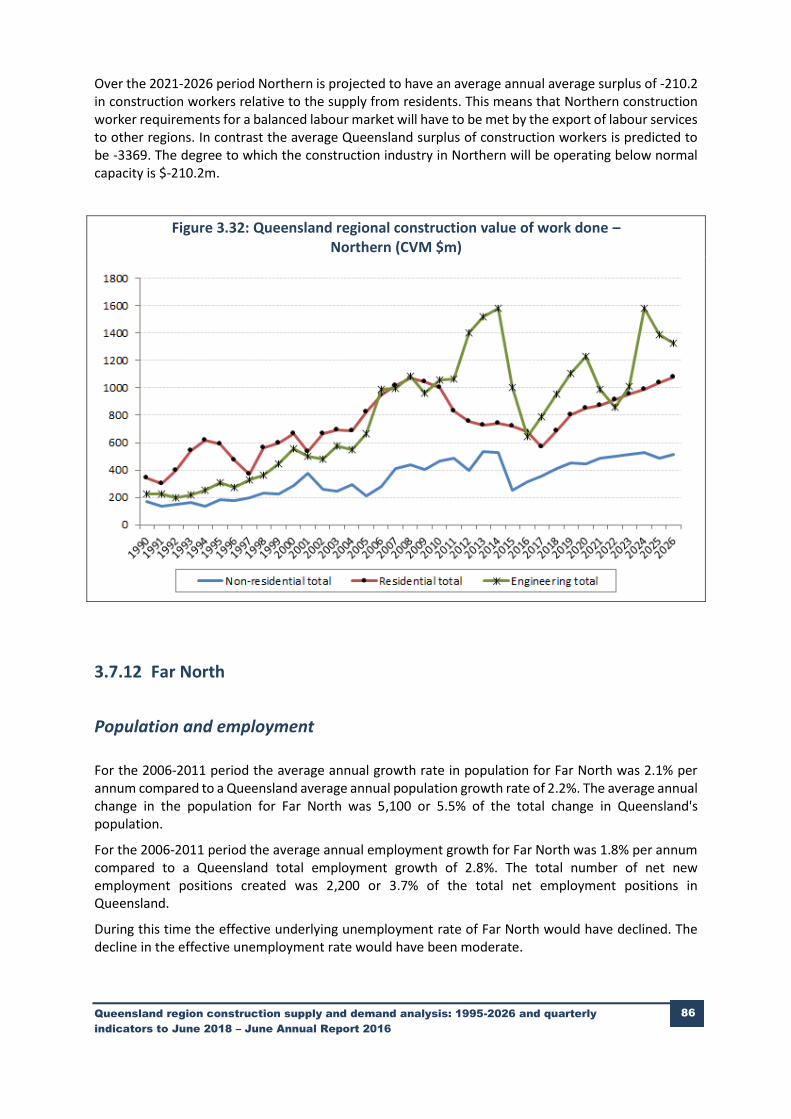
Queensland region construction supply and demand analysis: 1995-2026 and quarterly
indicators to June 2018 – June Annual Report 2016
86 86 86 86
Over the 2021-2026 period Northern is projected to have an average annual average surplus of -210.2 in construction workers relative to the supply from residents. This means that Northern construction worker requirements for a balanced labour market will have to be met by the export of labour services to other regions. In contrast the average Queensland surplus of construction workers is predicted to be -3369. The degree to which the construction industry in Northern will be operating below normal capacity is $-210.2m.
Figure 3.32: Queensland regional construction value of work done – Northern (CVM $m)
3.7.12 Far North
Population and employment
For the 2006-2011 period the average annual growth rate in population for Far North was 2.1% per annum compared to a Queensland average annual population growth rate of 2.2%. The average annual change in the population for Far North was 5,100 or 5.5% of the total change in Queensland's population.
For the 2006-2011 period the average annual employment growth for Far North was 1.8% per annum compared to a Queensland total employment growth of 2.8%. The total number of net new employment positions created was 2,200 or 3.7% of the total net employment positions in Queensland.
During this time the effective underlying unemployment rate of Far North would have declined. The decline in the effective unemployment rate would have been moderate.
Queensland region construction supply and demand analysis: 1995-2026 and quarterly
indicators to June 2018 – June Annual Report 2016
87 87 87 87
For the 2011-2016 period the average annual growth rate in population for Far North was 1.1% per annum compared to a Queensland average annual population growth rate of 1.6%. The average annual change in the population for Far North was 3,100 or 4.2% of the total change in Queensland's population.
For the 2011-2016 period the average annual employment growth for Far North was -0.2% per annum compared to a Queensland total employment growth of 1.1%. The total number of net new employment positions created was -200 or -1% of the total net employment positions in Queensland.
During this time the effective underlying unemployment rate of Far North would have increased. The increase in the effective unemployment rate would have been moderate.
For the 2016-2021 period the average annual growth rate in population for Far North was 1.1% per annum compared to a Queensland average annual population growth rate of 1.5%. The average annual change in the population for Far North was 3,100 or 4.2% of the total change in Queensland's population.
For the 2016-2021 period the average annual employment growth for Far North was 1.1% per annum compared to a Queensland total employment growth of 1.7%. The total number of net new employment positions created was 1,500 or 3.5% of the total net employment positions in Queensland.
During this time the effective underlying unemployment rate of Far North would have declined. The decline in the effective unemployment rate would have been moderate.
For the 2021-2026 period the average annual growth rate in population for Far North was 1.1% per annum compared to a Queensland average annual population growth rate of 1.5%. The average annual change in the population for Far North was 3,200 or 4.1% of the total change in Queensland's population.
For the 2021-2026 period the average annual employment growth for Far North was 1% per annum compared to a Queensland total employment growth of 1.5%. The total number of net new employment positions created was 1,400 or 3.5% of the total net employment positions in Queensland.
During this time the effective underlying unemployment rate of Far North would have declined. The decline in the effective unemployment rate would have been moderate.
Construction activity
Over the 2006-2011 period, the average rate of growth for Far North total construction was a decline of 0.8% per annum, which translated to an average annual decrease in expenditure of $20 million.
The most significant contribution to this change is new dwelling construction with a negative contribution in terms of average annual change of $49 million which explained 248.2% of the total annual change. The next largest contribution to this change is private engineering with a positive contribution in terms of average annual change of $36 million which explained -181.2% of the total annual change. Other sector contributions were public non-residential building with a positive contribution of $31 million which explained -155.2% of the total annual change, private non-residential building with a negative contribution of $17 million which explained 87.7% of the total annual change and other dwelling construction with a negative contribution of $12 million which explained 62.4% of the total annual change.
The average change in total construction expenditure over this period was a decrease of $20 million. This represents a contribution to total Queensland construction growth of -0.5%, this change in total construction expenditure in Far North is in the opposite direction to that of Queensland.

Queensland region construction supply and demand analysis: 1995-2026 and quarterly
indicators to June 2018 – June Annual Report 2016
88 88 88 88
For the 2011-2016 period, the average rate of growth for Far North total construction was a decline of 4% per annum, which translated to an average annual decrease in expenditure of $71 million.
The most significant contribution to this change is private engineering with a negative contribution in terms of average annual change of $40 million which explained 55.8% of the total annual change. The next largest contribution to this change is public non-residential building with a negative contribution in terms of average annual change of $34 million which explained 48.2% of the total annual change. Other sector contributions were public engineering with a positive contribution of $6 million which explained -8.2% of the total annual change, private non-residential building with a negative contribution of $4 million which explained 5.3% of the total annual change and other dwelling construction with a positive contribution of $3 million which explained -4.5% of the total annual change.
The average change in total construction expenditure over this period was a decrease of $71 million. This represents a contribution to total Queensland construction growth of 8.4%, this change in total construction expenditure in Far North is in the same direction as that of Queensland.
Over the 2016-2021 projection period, the average rate of growth for Far North total construction is an increase of 10.2% per annum, which translated to an average annual increase in expenditure of $170 million.
The most significant contribution to this change is new dwelling construction with a positive contribution in terms of average annual change of $80 million which explained 46.8% of the total annual change. The next largest contribution to this change is private non-residential building with a positive contribution in terms of average annual change of $37 million which explained 21.7% of the total annual change. Other sector contributions were other dwelling construction with a positive contribution of $23 million which explained 13.6% of the total annual change, public non-residential building with a positive contribution of $15 million which explained 8.6% of the total annual change and private engineering with a positive contribution of $10 million which explained 6% of the total annual change.
The average change in total construction expenditure over this period was an increase of $170 million. This represents a contribution to total Queensland construction growth of 37%, this change in total construction expenditure in Far North is in the same direction as that of Queensland.
For the 2021-2026 period, the average rate of growth for Far North total construction is an increase of 11.7% per annum, which translated to an average annual increase in expenditure of $285 million.
The most significant contribution to this change is private engineering with a positive contribution in terms of average annual change of $192 million which explained 67.2% of the total annual change. The next largest contribution to this change is new dwelling construction with a positive contribution in terms of average annual change of $49 million which explained 17.2% of the total annual change. Other sector contributions were other dwelling construction with a positive contribution of $22 million which explained 7.6% of the total annual change, public engineering with a positive contribution of $10 million which explained 3.7% of the total annual change and public non-residential building with a positive contribution of $7 million which explained 2.5% of the total annual change.
The average change in total construction expenditure over this period was an increase of $285 million. This represents a contribution to total Queensland construction growth of 12.8%, this change in total construction expenditure in Far North is in the same direction as that of Queensland.
For Far North total construction activity declined by 5.9% in 2016 the change was a decrease of $86 million.

Queensland region construction supply and demand analysis: 1995-2026 and quarterly
indicators to June 2018 – June Annual Report 2016
89 89 89 89
For Far North total construction activity increased by 6.4% in 2017 the change was an increase of $87 million.
For Far North total construction activity increased by 10.5% in 2018 the change was an increase of $153 million.
Capacity utilisation
Over the 2006-2011 period Far North had an average annual average shortage of 154.7 in construction workers relative to the supply from residents. This means that Far North construction worker requirements for a balanced labour market would have had to be met by import of labour from other regions. In contrast the average Queensland shortage of construction workers was 2994.4. The degree to which the construction industry in Far North was operating above normal capacity was $154.7m.
Over the 2011-2016 period Far North had an average annual average surplus of -224.7 in construction workers relative to the supply from residents. This means that Far North construction worker requirements for a balanced labour market would have had to be met by the export of labour services to other regions. In contrast the average Queensland shortage of construction workers was 1782.2. The degree to which the construction industry in Far North was operating below normal capacity was $-224.7m.
Over the 2016-2021 period Far North is projected to have an average annual average surplus of -195.7 in construction workers relative to the supply from residents. This means that Far North construction worker requirements for a balanced labour market will have to be met by the export of labour services to other regions. In contrast the average Queensland surplus of construction workers is predicted to be -6110.9. The degree to which the construction industry in Far North will be operating below normal capacity is $-195.7m.
Over the 2021-2026 period Far North is projected to have an average annual average shortage of 1751 in construction workers relative to the supply from residents. This means that Far North construction worker requirements for a balanced labour market will have to be met by import of labour from other regions. In contrast the average Queensland surplus of construction workers is predicted to be -3369. The degree to which the construction industry in Far North will be operating above normal capacity is $1751m.

Queensland region construction supply and demand analysis: 1995-2026 and quarterly
indicators to June 2018 – June Annual Report 2016
90 90 90 90
Figure 3.33: Queensland regional construction value of work done – Far North (CVM $m)
3.7.13 North West
Population and employment
For the 2006-2011 period the average annual growth rate in population for North West was 1.1% per annum compared to a Queensland average annual population growth rate of 2.2%. The average annual change in the population for North West was 400 or 0.4% of the total change in Queensland's population.
For the 2006-2011 period the average annual employment growth for North West was 1.9% per annum compared to a Queensland total employment growth of 2.8%. The total number of net new employment positions created was 300 or 0.6% of the total net employment positions in Queensland.
During this time the effective underlying unemployment rate of North West would have declined. The decline in the effective unemployment rate would have been strong.
For the 2011-2016 period there was no growth in population for North West. The growth rate for Queensland was 1.6%. The average annual change in the population for North West was 200 or 0.2% of the total change in Queensland's population.
For the 2011-2016 period the average annual employment growth for North West was 0.4% per annum compared to a Queensland total employment growth of 1.1%. The total number of net new employment positions created was zero or 0.2% of the total net employment positions in Queensland.
During this time the effective underlying unemployment rate of North West would have declined. The decline in the effective unemployment rate would have been moderate.
Queensland region construction supply and demand analysis: 1995-2026 and quarterly
indicators to June 2018 – June Annual Report 2016
91 91 91 91
For the 2016-2021 period there was no growth in population for North West. The growth rate for Queensland was 1.5%. The average annual change in the population for North West was 100 or 0.1% of the total change in Queensland's population.
For the 2016-2021 period the average annual employment growth for North West was -0.5% per annum compared to a Queensland total employment growth of 1.7%. The total number of net new employment positions created was -100 or -0.3% of the total net employment positions in Queensland.
During this time the effective underlying unemployment rate of North West would have increased. The increase in the effective unemployment rate would have been moderate.
For the 2021-2026 period there was no growth in population for North West. The growth rate for Queensland was 1.5%. The average annual change in the population for North West was 100 or 0.2% of the total change in Queensland's population.
For the 2021-2026 period the average annual employment growth for North West was 0.1% per annum compared to a Queensland total employment growth of 1.5%. The total number of net new employment positions created was zero or 0.1% of the total net employment positions in Queensland.
During this time the effective underlying unemployment rate of North West would have declined. The decline in the effective unemployment rate would have been moderate.
Construction activity
Over the 2006-2011 period, the average rate of growth for North West total construction was an increase of 29.2% per annum, which translated to an average annual increase in expenditure of $136 million.
The most significant contribution to this change is private engineering with a positive contribution in terms of average annual change of $140 million which explained 102.7% of the total annual change. The next largest contribution to this change is public engineering with a negative contribution in terms of average annual change of $11 million which explained -8.3% of the total annual change. Other sector contributions were private non-residential building with a positive contribution of $3 million which explained 2.1% of the total annual change, new dwelling construction with a positive contribution of $1 million which explained 0.8% of the total annual change.
The average change in total construction expenditure over this period was an increase of $136 million. This represents a contribution to total Queensland construction growth of 3.4%, this change in total construction expenditure in North West is in the same direction as that of Queensland.
For the 2011-2016 period, the average rate of growth for North West total construction was an increase of 18.2% per annum, which translated to an average annual increase in expenditure of $77 million.
The most significant contribution to this change is private engineering with a positive contribution in terms of average annual change of $77 million which explained 100.5% of the total annual change. The next largest contribution to this change is public engineering with a positive contribution in terms of average annual change of $5 million which explained 6.4% of the total annual change. Other sector contributions were new dwelling construction with a negative contribution of $3 million which explained -3.5% of the total annual change and private non-residential building with a negative contribution of $2 million which explained -2.2% of the total annual change.
The average change in total construction expenditure over this period was an increase of $77 million. This represents a contribution to total Queensland construction growth of -9.1%, this change in total construction expenditure in North West is in the opposite direction to that of Queensland.
Queensland region construction supply and demand analysis: 1995-2026 and quarterly
indicators to June 2018 – June Annual Report 2016
92 92 92 92
Over the 2016-2021 projection period, the average rate of growth for North West total construction is an increase of 22.4% per annum, which translated to an average annual increase in expenditure of $24 million.
The most significant contribution to this change is private engineering with a positive contribution in terms of average annual change of $13 million which explained 53.4% of the total annual change. The next largest contribution to this change is new dwelling construction with a positive contribution in terms of average annual change of $4 million which explained 16.2% of the total annual change. Other dwelling construction with a positive contribution of $2 million which explained 7.7% of the total annual change and private non-residential building with a positive contribution of $1 million which explained 2.9% of the total annual change.
The average change in total construction expenditure over this period was an increase of $24 million. This represents a contribution to total Queensland construction growth of 5.3%, this change in total construction expenditure in North West is in the same direction as that of Queensland.
For the 2021-2026 period, the average rate of growth for North West total construction is an increase of 27.7% per annum, which translated to an average annual increase in expenditure of $275 million.
The most significant contribution to this change is private engineering with a positive contribution in terms of average annual change of $267 million which explained 97.3% of the total annual change. The next largest contribution to this change is public engineering with a positive contribution in terms of average annual change of $4 million which explained 1.5% of the total annual change. Other sector contributions were other dwelling construction with a positive contribution of $1 million which explained 0.4% of the total annual change.
The average change in total construction expenditure over this period was an increase of $275 million. This represents a contribution to total Queensland construction growth of 12.3%, this change in total construction expenditure in North West is in the same direction as that of Queensland.
For North West total construction activity declined by 15.7% in 2016 the change was a decrease of $113 million.
For North West total construction activity increased by 108.5% in 2017 the change was an increase of $657 million.
For North West total construction activity increased by 58.6% in 2018 the change was an increase of $739 million.
Capacity utilisation
Over the 2006-2011 period North West had an average annual average shortage of 5.5 in construction workers relative to the supply from residents. This means that North West construction worker requirements for a balanced labour market would have had to be met by import of labour from other regions. In contrast the average Queensland shortage of construction workers was 2994.4. The degree to which the construction industry in North West was operating above normal capacity was $5.5m.

Queensland region construction supply and demand analysis: 1995-2026 and quarterly
indicators to June 2018 – June Annual Report 2016
93 93 93 93
Over the 2011-2016 period North West had an average annual average shortage of 143.8 in construction workers relative to the supply from residents. This means that North West construction worker requirements for a balanced labour market would have had to be met by import of labour from other regions. In contrast the average Queensland shortage of construction workers was 1782.2. The degree to which the construction industry in North West was operating above normal capacity was $143.8m.
Over the 2016-2021 period North West is projected to have an average annual average shortage of 250.4 in construction workers relative to the supply from residents. This means that North West construction worker requirements for a balanced labour market will have to be met by import of labour from other regions. In contrast the average Queensland surplus of construction workers is predicted to be -6110.9. The degree to which the construction industry in North West will be operating above normal capacity is $250.4m.
Over the 2021-2026 period North West is projected to have an average annual average shortage of 444.9 in construction workers relative to the supply from residents. This means that North West construction worker requirements for a balanced labour market will have to be met by import of labour from other regions. In contrast the average Queensland surplus of construction workers is predicted to be -3369. The degree to which the construction industry in North West will be operating above normal capacity is $444.9m.
Figure 3.34: Queensland regional construction value of work done – North West (CVM $m)
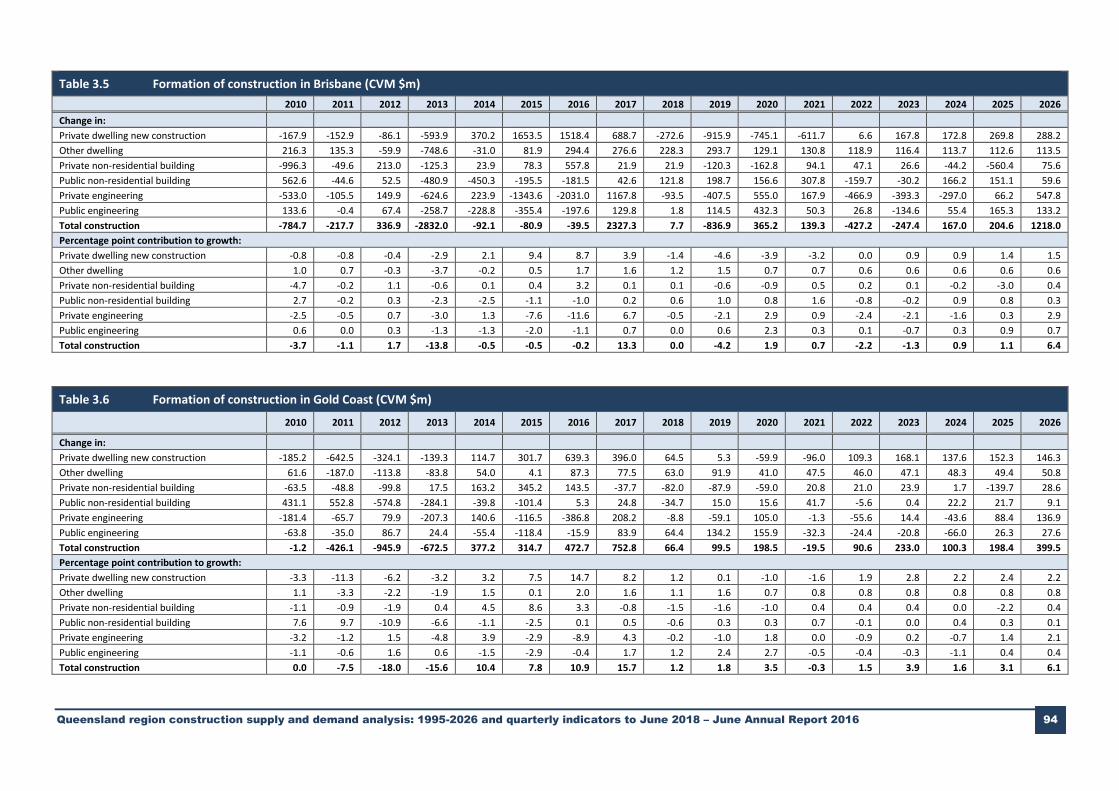
Queensland region construction supply and demand analysis: 1995-2026 and quarterly indicators to June 2018 – June Annual Report 2016 94
Table 3.5 Formation of construction in Brisbane (CVM $m)
2010 2011 2012 2013 2014 2015 2016 2017 2018 2019 2020 2021 2022 2023 2024 2025 2026
Change in:
Private dwelling new construction -167.9 -152.9 -86.1 -593.9 370.2 1653.5 1518.4 688.7 -272.6 -915.9 -745.1 -611.7 6.6 167.8 172.8 269.8 288.2
Other dwelling 216.3 135.3 -59.9 -748.6 -31.0 81.9 294.4 276.6 228.3 293.7 129.1 130.8 118.9 116.4 113.7 112.6 113.5
Private non-residential building -996.3 -49.6 213.0 -125.3 23.9 78.3 557.8 21.9 21.9 -120.3 -162.8 94.1 47.1 26.6 -44.2 -560.4 75.6
Public non-residential building 562.6 -44.6 52.5 -480.9 -450.3 -195.5 -181.5 42.6 121.8 198.7 156.6 307.8 -159.7 -30.2 166.2 151.1 59.6
Private engineering -533.0 -105.5 149.9 -624.6 223.9 -1343.6 -2031.0 1167.8 -93.5 -407.5 555.0 167.9 -466.9 -393.3 -297.0 66.2 547.8
Public engineering 133.6 -0.4 67.4 -258.7 -228.8 -355.4 -197.6 129.8 1.8 114.5 432.3 50.3 26.8 -134.6 55.4 165.3 133.2
Total construction -784.7 -217.7 336.9 -2832.0 -92.1 -80.9 -39.5 2327.3 7.7 -836.9 365.2 139.3 -427.2 -247.4 167.0 204.6 1218.0
Percentage point contribution to growth:
Private dwelling new construction -0.8 -0.8 -0.4 -2.9 2.1 9.4 8.7 3.9 -1.4 -4.6 -3.9 -3.2 0.0 0.9 0.9 1.4 1.5
Other dwelling 1.0 0.7 -0.3 -3.7 -0.2 0.5 1.7 1.6 1.2 1.5 0.7 0.7 0.6 0.6 0.6 0.6 0.6
Private non-residential building -4.7 -0.2 1.1 -0.6 0.1 0.4 3.2 0.1 0.1 -0.6 -0.9 0.5 0.2 0.1 -0.2 -3.0 0.4
Public non-residential building 2.7 -0.2 0.3 -2.3 -2.5 -1.1 -1.0 0.2 0.6 1.0 0.8 1.6 -0.8 -0.2 0.9 0.8 0.3
Private engineering -2.5 -0.5 0.7 -3.0 1.3 -7.6 -11.6 6.7 -0.5 -2.1 2.9 0.9 -2.4 -2.1 -1.6 0.3 2.9
Public engineering 0.6 0.0 0.3 -1.3 -1.3 -2.0 -1.1 0.7 0.0 0.6 2.3 0.3 0.1 -0.7 0.3 0.9 0.7
Total construction -3.7 -1.1 1.7 -13.8 -0.5 -0.5 -0.2 13.3 0.0 -4.2 1.9 0.7 -2.2 -1.3 0.9 1.1 6.4
Table 3.6 Formation of construction in Gold Coast (CVM $m)
2010 2011 2012 2013 2014 2015 2016 2017 2018 2019 2020 2021 2022 2023 2024 2025 2026
Change in:
Private dwelling new construction -185.2 -642.5 -324.1 -139.3 114.7 301.7 639.3 396.0 64.5 5.3 -59.9 -96.0 109.3 168.1 137.6 152.3 146.3
Other dwelling 61.6 -187.0 -113.8 -83.8 54.0 4.1 87.3 77.5 63.0 91.9 41.0 47.5 46.0 47.1 48.3 49.4 50.8
Private non-residential building -63.5 -48.8 -99.8 17.5 163.2 345.2 143.5 -37.7 -82.0 -87.9 -59.0 20.8 21.0 23.9 1.7 -139.7 28.6
Public non-residential building 431.1 552.8 -574.8 -284.1 -39.8 -101.4 5.3 24.8 -34.7 15.0 15.6 41.7 -5.6 0.4 22.2 21.7 9.1
Private engineering -181.4 -65.7 79.9 -207.3 140.6 -116.5 -386.8 208.2 -8.8 -59.1 105.0 -1.3 -55.6 14.4 -43.6 88.4 136.9
Public engineering -63.8 -35.0 86.7 24.4 -55.4 -118.4 -15.9 83.9 64.4 134.2 155.9 -32.3 -24.4 -20.8 -66.0 26.3 27.6
Total construction -1.2 -426.1 -945.9 -672.5 377.2 314.7 472.7 752.8 66.4 99.5 198.5 -19.5 90.6 233.0 100.3 198.4 399.5
Percentage point contribution to growth:
Private dwelling new construction -3.3 -11.3 -6.2 -3.2 3.2 7.5 14.7 8.2 1.2 0.1 -1.0 -1.6 1.9 2.8 2.2 2.4 2.2
Other dwelling 1.1 -3.3 -2.2 -1.9 1.5 0.1 2.0 1.6 1.1 1.6 0.7 0.8 0.8 0.8 0.8 0.8 0.8
Private non-residential building -1.1 -0.9 -1.9 0.4 4.5 8.6 3.3 -0.8 -1.5 -1.6 -1.0 0.4 0.4 0.4 0.0 -2.2 0.4
Public non-residential building 7.6 9.7 -10.9 -6.6 -1.1 -2.5 0.1 0.5 -0.6 0.3 0.3 0.7 -0.1 0.0 0.4 0.3 0.1
Private engineering -3.2 -1.2 1.5 -4.8 3.9 -2.9 -8.9 4.3 -0.2 -1.0 1.8 0.0 -0.9 0.2 -0.7 1.4 2.1
Public engineering -1.1 -0.6 1.6 0.6 -1.5 -2.9 -0.4 1.7 1.2 2.4 2.7 -0.5 -0.4 -0.3 -1.1 0.4 0.4
Total construction 0.0 -7.5 -18.0 -15.6 10.4 7.8 10.9 15.7 1.2 1.8 3.5 -0.3 1.5 3.9 1.6 3.1 6.1

Queensland region construction supply and demand analysis: 1995-2026 and quarterly indicators to June 2018 – June Annual Report 2016 95
Table 3.7 Formation of construction in Sunshine Coast (CVM $m)
2010 2011 2012 2013 2014 2015 2016 2017 2018 2019 2020 2021 2022 2023 2024 2025 2026
Change in:
Private dwelling new construction -159.0 -112.9 -171.9 -97.7 44.4 257.9 165.2 70.1 40.7 118.6 37.5 -22.9 64.0 86.4 71.4 84.4 81.0
Other dwelling 34.1 -121.7 -70.8 -48.3 39.0 3.0 59.6 40.8 34.2 53.4 22.9 29.2 29.4 29.2 29.2 29.6 30.2
Private non-residential building -70.3 -2.7 32.2 79.7 366.3 43.1 -367.5 -80.6 34.1 21.6 8.1 29.7 23.1 19.5 5.2 -64.3 14.5
Public non-residential building 70.6 -26.4 -62.6 -12.7 0.5 -21.5 76.2 0.5 -35.8 23.6 -1.5 16.8 -17.9 -1.6 18.8 13.4 12.0
Private engineering 120.4 1029.3 -476.1 -556.0 97.8 -140.8 -231.3 117.4 -12.4 -40.8 66.8 -1.1 -36.1 8.8 -50.3 24.7 109.7
Public engineering 13.8 5.4 5.1 -11.5 47.9 1.3 -53.9 -30.1 -50.1 8.4 41.9 -10.7 32.6 -2.3 -7.9 18.1 17.1
Total construction 9.5 771.0 -744.2 -646.6 595.8 143.0 -351.6 118.0 10.7 184.7 175.6 41.1 95.1 140.1 66.6 105.9 264.4
Percentage point contribution to growth:
Private dwelling new construction -5.1 -3.6 -4.4 -3.1 1.8 8.4 5.1 2.4 1.4 4.0 1.2 -0.7 1.9 2.5 2.0 2.3 2.1
Other dwelling 1.1 -3.9 -1.8 -1.5 1.6 0.1 1.9 1.4 1.1 1.8 0.7 0.9 0.9 0.8 0.8 0.8 0.8
Private non-residential building -2.3 -0.1 0.8 2.5 14.8 1.4 -11.4 -2.8 1.1 0.7 0.3 0.9 0.7 0.6 0.1 -1.7 0.4
Public non-residential building 2.3 -0.9 -1.6 -0.4 0.0 -0.7 2.4 0.0 -1.2 0.8 0.0 0.5 -0.5 0.0 0.5 0.4 0.3
Private engineering 3.9 33.2 -12.3 -17.8 3.9 -4.6 -7.2 4.1 -0.4 -1.4 2.1 0.0 -1.1 0.3 -1.4 0.7 2.9
Public engineering 0.4 0.2 0.1 -0.4 1.9 0.0 -1.7 -1.1 -1.7 0.3 1.3 -0.3 1.0 -0.1 -0.2 0.5 0.4
Total construction 0.3 24.9 -19.2 -20.7 24.0 4.7 -10.9 4.1 0.4 6.2 5.5 1.2 2.8 4.0 1.8 2.9 7.0
Table 3.8 Formation of construction in West Moreton (CVM $m)
2010 2011 2012 2013 2014 2015 2016 2017 2018 2019 2020 2021 2022 2023 2024 2025 2026
Change in:
Private dwelling new construction 24.0 -27.8 -40.5 27.2 -39.0 -0.3 -1.1 7.2 30.9 15.3 1.7 -5.8 9.3 12.0 10.4 13.1 12.9
Other dwelling 9.5 -4.2 -1.4 -19.5 1.3 1.6 9.9 6.9 5.5 9.2 3.8 4.7 4.7 4.7 4.6 4.7 4.7
Private non-residential building -4.2 -1.8 0.8 -5.0 -2.1 -2.4 8.1 20.2 14.4 6.4 2.0 6.0 3.9 2.7 -0.3 -15.4 2.3
Public non-residential building 133.6 -181.1 -86.1 -7.1 8.8 -13.6 -9.5 -1.9 8.8 12.0 10.9 17.3 -6.3 -1.6 7.6 8.6 -2.1
Private engineering -18.6 30.8 10.0 -27.3 18.1 -16.3 -51.4 24.3 -3.5 -9.5 10.2 -2.1 -8.1 -0.2 -10.2 2.5 16.3
Public engineering 20.3 -37.2 -15.9 12.5 3.1 -12.6 -19.1 6.5 -26.4 -3.0 50.8 11.0 83.0 13.2 -18.6 10.5 63.1
Total construction 164.5 -221.4 -133.0 -19.2 -9.7 -43.6 -63.1 63.1 29.7 30.4 79.5 31.1 86.5 30.8 -6.6 24.0 97.2
Percentage point contribution to growth:
Private dwelling new construction 3.0 -2.9 -5.5 4.5 -6.6 -0.1 -0.2 1.5 5.8 2.7 0.3 -0.9 1.3 1.5 1.3 1.6 1.5
Other dwelling 1.2 -0.4 -0.2 -3.2 0.2 0.3 1.8 1.5 1.0 1.6 0.6 0.7 0.7 0.6 0.6 0.6 0.6
Private non-residential building -0.5 -0.2 0.1 -0.8 -0.4 -0.4 1.5 4.3 2.7 1.1 0.3 0.9 0.6 0.3 0.0 -1.9 0.3
Public non-residential building 16.8 -18.9 -11.6 -1.2 1.5 -2.3 -1.8 -0.4 1.6 2.1 1.8 2.6 -0.9 -0.2 0.9 1.1 -0.3
Private engineering -2.3 3.2 1.4 -4.5 3.1 -2.8 -9.6 5.2 -0.7 -1.7 1.7 -0.3 -1.2 0.0 -1.2 0.3 1.9
Public engineering 2.5 -3.9 -2.2 2.1 0.5 -2.2 -3.6 1.4 -4.9 -0.5 8.6 1.6 11.8 1.7 -2.3 1.3 7.5
Total construction 20.7 -23.0 -18.0 -3.2 -1.7 -7.6 -11.8 13.4 5.6 5.4 13.4 4.6 12.3 3.9 -0.8 2.9 11.6
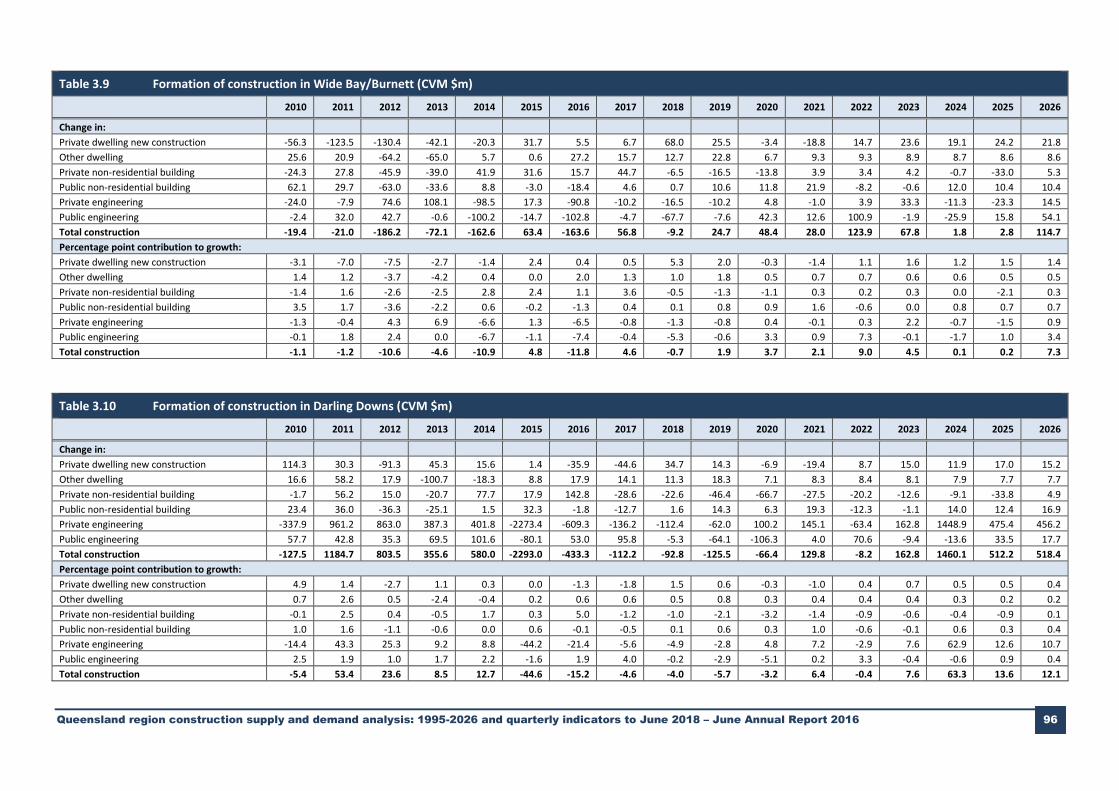
Queensland region construction supply and demand analysis: 1995-2026 and quarterly indicators to June 2018 – June Annual Report 2016 96
Table 3.9 Formation of construction in Wide Bay/Burnett (CVM $m)
2010 2011 2012 2013 2014 2015 2016 2017 2018 2019 2020 2021 2022 2023 2024 2025 2026
Change in:
Private dwelling new construction -56.3 -123.5 -130.4 -42.1 -20.3 31.7 5.5 6.7 68.0 25.5 -3.4 -18.8 14.7 23.6 19.1 24.2 21.8
Other dwelling 25.6 20.9 -64.2 -65.0 5.7 0.6 27.2 15.7 12.7 22.8 6.7 9.3 9.3 8.9 8.7 8.6 8.6
Private non-residential building -24.3 27.8 -45.9 -39.0 41.9 31.6 15.7 44.7 -6.5 -16.5 -13.8 3.9 3.4 4.2 -0.7 -33.0 5.3
Public non-residential building 62.1 29.7 -63.0 -33.6 8.8 -3.0 -18.4 4.6 0.7 10.6 11.8 21.9 -8.2 -0.6 12.0 10.4 10.4
Private engineering -24.0 -7.9 74.6 108.1 -98.5 17.3 -90.8 -10.2 -16.5 -10.2 4.8 -1.0 3.9 33.3 -11.3 -23.3 14.5
Public engineering -2.4 32.0 42.7 -0.6 -100.2 -14.7 -102.8 -4.7 -67.7 -7.6 42.3 12.6 100.9 -1.9 -25.9 15.8 54.1
Total construction -19.4 -21.0 -186.2 -72.1 -162.6 63.4 -163.6 56.8 -9.2 24.7 48.4 28.0 123.9 67.8 1.8 2.8 114.7
Percentage point contribution to growth:
Private dwelling new construction -3.1 -7.0 -7.5 -2.7 -1.4 2.4 0.4 0.5 5.3 2.0 -0.3 -1.4 1.1 1.6 1.2 1.5 1.4
Other dwelling 1.4 1.2 -3.7 -4.2 0.4 0.0 2.0 1.3 1.0 1.8 0.5 0.7 0.7 0.6 0.6 0.5 0.5
Private non-residential building -1.4 1.6 -2.6 -2.5 2.8 2.4 1.1 3.6 -0.5 -1.3 -1.1 0.3 0.2 0.3 0.0 -2.1 0.3
Public non-residential building 3.5 1.7 -3.6 -2.2 0.6 -0.2 -1.3 0.4 0.1 0.8 0.9 1.6 -0.6 0.0 0.8 0.7 0.7
Private engineering -1.3 -0.4 4.3 6.9 -6.6 1.3 -6.5 -0.8 -1.3 -0.8 0.4 -0.1 0.3 2.2 -0.7 -1.5 0.9
Public engineering -0.1 1.8 2.4 0.0 -6.7 -1.1 -7.4 -0.4 -5.3 -0.6 3.3 0.9 7.3 -0.1 -1.7 1.0 3.4
Total construction -1.1 -1.2 -10.6 -4.6 -10.9 4.8 -11.8 4.6 -0.7 1.9 3.7 2.1 9.0 4.5 0.1 0.2 7.3
Table 3.10 Formation of construction in Darling Downs (CVM $m)
2010 2011 2012 2013 2014 2015 2016 2017 2018 2019 2020 2021 2022 2023 2024 2025 2026
Change in:
Private dwelling new construction 114.3 30.3 -91.3 45.3 15.6 1.4 -35.9 -44.6 34.7 14.3 -6.9 -19.4 8.7 15.0 11.9 17.0 15.2
Other dwelling 16.6 58.2 17.9 -100.7 -18.3 8.8 17.9 14.1 11.3 18.3 7.1 8.3 8.4 8.1 7.9 7.7 7.7
Private non-residential building -1.7 56.2 15.0 -20.7 77.7 17.9 142.8 -28.6 -22.6 -46.4 -66.7 -27.5 -20.2 -12.6 -9.1 -33.8 4.9
Public non-residential building 23.4 36.0 -36.3 -25.1 1.5 32.3 -1.8 -12.7 1.6 14.3 6.3 19.3 -12.3 -1.1 14.0 12.4 16.9
Private engineering -337.9 961.2 863.0 387.3 401.8 -2273.4 -609.3 -136.2 -112.4 -62.0 100.2 145.1 -63.4 162.8 1448.9 475.4 456.2
Public engineering 57.7 42.8 35.3 69.5 101.6 -80.1 53.0 95.8 -5.3 -64.1 -106.3 4.0 70.6 -9.4 -13.6 33.5 17.7
Total construction -127.5 1184.7 803.5 355.6 580.0 -2293.0 -433.3 -112.2 -92.8 -125.5 -66.4 129.8 -8.2 162.8 1460.1 512.2 518.4
Percentage point contribution to growth:
Private dwelling new construction 4.9 1.4 -2.7 1.1 0.3 0.0 -1.3 -1.8 1.5 0.6 -0.3 -1.0 0.4 0.7 0.5 0.5 0.4
Other dwelling 0.7 2.6 0.5 -2.4 -0.4 0.2 0.6 0.6 0.5 0.8 0.3 0.4 0.4 0.4 0.3 0.2 0.2
Private non-residential building -0.1 2.5 0.4 -0.5 1.7 0.3 5.0 -1.2 -1.0 -2.1 -3.2 -1.4 -0.9 -0.6 -0.4 -0.9 0.1
Public non-residential building 1.0 1.6 -1.1 -0.6 0.0 0.6 -0.1 -0.5 0.1 0.6 0.3 1.0 -0.6 -0.1 0.6 0.3 0.4
Private engineering -14.4 43.3 25.3 9.2 8.8 -44.2 -21.4 -5.6 -4.9 -2.8 4.8 7.2 -2.9 7.6 62.9 12.6 10.7
Public engineering 2.5 1.9 1.0 1.7 2.2 -1.6 1.9 4.0 -0.2 -2.9 -5.1 0.2 3.3 -0.4 -0.6 0.9 0.4
Total construction -5.4 53.4 23.6 8.5 12.7 -44.6 -15.2 -4.6 -4.0 -5.7 -3.2 6.4 -0.4 7.6 63.3 13.6 12.1

Queensland region construction supply and demand analysis: 1995-2026 and quarterly indicators to June 2018 – June Annual Report 2016 97
Table 3.11 Formation of construction in South West (CVM $m)
2010 2011 2012 2013 2014 2015 2016 2017 2018 2019 2020 2021 2022 2023 2024 2025 2026
Change in:
Private dwelling new construction 2.7 -3.9 6.3 23.2 0.9 -20.7 -8.8 -9.9 6.8 4.2 1.5 0.2 1.4 1.4 1.1 1.3 1.1
Other dwelling 0.3 5.0 1.9 -8.0 -0.4 1.1 2.1 1.0 0.6 1.6 0.6 0.8 0.9 0.9 0.9 0.9 0.9
Private non-residential building 2.3 5.8 7.5 10.6 -0.5 -6.4 -2.9 -4.8 2.9 0.4 -0.9 1.0 1.1 1.1 0.4 -3.3 1.0
Public non-residential building 2.9 7.5 -10.1 -3.2 6.2 -9.0 -2.6 4.8 -3.1 -0.5 1.0 2.2 0.0 0.3 1.4 0.9 0.2
Private engineering -325.1 443.5 1092.7 572.0 528.7 -1350.4 -729.7 -563.0 75.6 271.8 93.4 -400.6 -31.1 333.5 -68.3 -223.1 -134.1
Public engineering 6.6 -7.5 149.0 -33.6 -96.3 -23.1 20.6 9.9 -5.8 6.7 20.5 5.6 23.9 -2.0 -5.1 9.3 8.0
Total construction -310.4 450.6 1247.4 561.1 438.5 -1408.4 -721.3 -561.9 77.1 284.2 116.1 -390.8 -3.8 335.2 -69.6 -214.0 -122.9
Percentage point contribution to growth:
Private dwelling new construction 0.4 -0.9 0.7 1.1 0.0 -0.7 -0.5 -1.0 1.6 0.8 0.2 0.0 0.3 0.3 0.1 0.2 0.2
Other dwelling 0.0 1.2 0.2 -0.4 0.0 0.0 0.1 0.1 0.1 0.3 0.1 0.1 0.2 0.2 0.1 0.1 0.2
Private non-residential building 0.3 1.4 0.9 0.5 0.0 -0.2 -0.2 -0.5 0.7 0.1 -0.1 0.1 0.2 0.2 0.0 -0.4 0.2
Public non-residential building 0.4 1.8 -1.1 -0.1 0.2 -0.3 -0.2 0.5 -0.7 -0.1 0.1 0.2 0.0 0.0 0.2 0.1 0.0
Private engineering -44.0 103.3 124.2 26.9 19.7 -43.2 -42.5 -56.5 17.4 53.1 11.7 -43.9 -6.0 64.4 -8.0 -28.5 -23.6
Public engineering 0.9 -1.7 16.9 -1.6 -3.6 -0.7 1.2 1.0 -1.3 1.3 2.6 0.6 4.6 -0.4 -0.6 1.2 1.4
Total construction -42.0 105.0 141.8 26.4 16.3 -45.0 -42.0 -56.4 17.7 55.5 14.6 -42.8 -0.7 64.7 -8.2 -27.3 -21.6
Table 3.12 Formation of construction in Fitzroy (CVM $m)
2010 2011 2012 2013 2014 2015 2016 2017 2018 2019 2020 2021 2022 2023 2024 2025 2026
Change in:
Private dwelling new construction -113.0 2.3 129.2 272.0 102.4 -424.1 -186.0 -33.9 126.5 84.4 32.2 3.4 26.4 28.1 23.1 28.1 26.1
Other dwelling 29.0 27.1 -25.4 -29.4 29.6 -25.1 6.7 11.4 7.6 17.2 7.3 9.6 9.9 10.1 10.1 10.2 10.4
Private non-residential building -19.7 9.1 50.9 225.3 142.9 -271.4 -160.8 -18.9 41.9 27.0 12.0 23.7 18.0 14.4 3.9 -44.3 10.9
Public non-residential building 28.8 30.5 -7.9 47.3 85.3 -141.0 -48.0 11.7 -8.7 -0.9 6.3 19.9 4.2 5.4 13.6 6.1 5.9
Private engineering 347.3 1732.6 7367.0 2477.4 1770.0 -4895.9 -5140.3 -1538.0 -588.7 -503.4 608.4 -209.7 75.4 -316.3 -682.4 767.6 662.4
Public engineering 85.7 54.7 -11.9 62.9 -103.3 -24.0 -22.0 -6.8 -47.3 -17.6 77.8 75.5 -63.7 17.5 94.0 209.6 -177.6
Total construction 358.1 1856.3 7501.9 3055.5 2026.9 -5781.4 -5550.5 -1574.4 -468.6 -393.2 743.9 -77.7 70.3 -240.8 -537.6 977.2 538.1
Percentage point contribution to growth:
Private dwelling new construction -3.3 0.1 2.3 2.1 0.6 -2.3 -1.5 -0.5 2.4 1.7 0.7 0.1 0.5 0.5 0.5 0.6 0.5
Other dwelling 0.8 0.7 -0.4 -0.2 0.2 -0.1 0.1 0.2 0.1 0.4 0.2 0.2 0.2 0.2 0.2 0.2 0.2
Private non-residential building -0.6 0.2 0.9 1.7 0.9 -1.5 -1.3 -0.3 0.8 0.6 0.3 0.5 0.3 0.3 0.1 -1.0 0.2
Public non-residential building 0.8 0.8 -0.1 0.4 0.5 -0.8 -0.4 0.2 -0.2 0.0 0.1 0.4 0.1 0.1 0.3 0.1 0.1
Private engineering 10.0 45.2 129.5 18.8 10.9 -26.8 -41.2 -22.2 -11.0 -10.3 13.5 -4.0 1.5 -6.0 -13.7 17.2 12.2
Public engineering 2.5 1.4 -0.2 0.5 -0.6 -0.1 -0.2 -0.1 -0.9 -0.4 1.7 1.4 -1.2 0.3 1.9 4.7 -3.3
Total construction 10.3 48.5 131.9 23.2 12.5 -31.6 -44.4 -22.7 -8.7 -8.0 16.5 -1.5 1.4 -4.6 -10.8 21.9 9.9
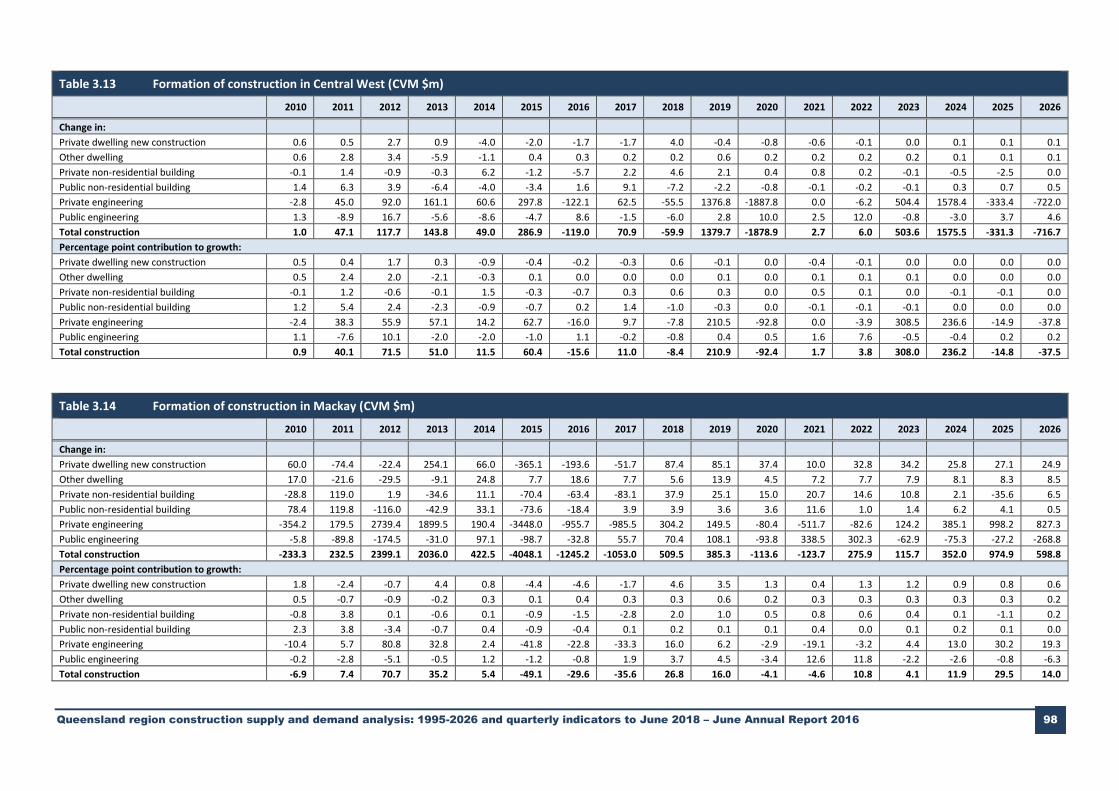
Queensland region construction supply and demand analysis: 1995-2026 and quarterly indicators to June 2018 – June Annual Report 2016 98
Table 3.13 Formation of construction in Central West (CVM $m)
2010 2011 2012 2013 2014 2015 2016 2017 2018 2019 2020 2021 2022 2023 2024 2025 2026
Change in:
Private dwelling new construction 0.6 0.5 2.7 0.9 -4.0 -2.0 -1.7 -1.7 4.0 -0.4 -0.8 -0.6 -0.1 0.0 0.1 0.1 0.1
Other dwelling 0.6 2.8 3.4 -5.9 -1.1 0.4 0.3 0.2 0.2 0.6 0.2 0.2 0.2 0.2 0.1 0.1 0.1
Private non-residential building -0.1 1.4 -0.9 -0.3 6.2 -1.2 -5.7 2.2 4.6 2.1 0.4 0.8 0.2 -0.1 -0.5 -2.5 0.0
Public non-residential building 1.4 6.3 3.9 -6.4 -4.0 -3.4 1.6 9.1 -7.2 -2.2 -0.8 -0.1 -0.2 -0.1 0.3 0.7 0.5
Private engineering -2.8 45.0 92.0 161.1 60.6 297.8 -122.1 62.5 -55.5 1376.8 -1887.8 0.0 -6.2 504.4 1578.4 -333.4 -722.0
Public engineering 1.3 -8.9 16.7 -5.6 -8.6 -4.7 8.6 -1.5 -6.0 2.8 10.0 2.5 12.0 -0.8 -3.0 3.7 4.6
Total construction 1.0 47.1 117.7 143.8 49.0 286.9 -119.0 70.9 -59.9 1379.7 -1878.9 2.7 6.0 503.6 1575.5 -331.3 -716.7
Percentage point contribution to growth:
Private dwelling new construction 0.5 0.4 1.7 0.3 -0.9 -0.4 -0.2 -0.3 0.6 -0.1 0.0 -0.4 -0.1 0.0 0.0 0.0 0.0
Other dwelling 0.5 2.4 2.0 -2.1 -0.3 0.1 0.0 0.0 0.0 0.1 0.0 0.1 0.1 0.1 0.0 0.0 0.0
Private non-residential building -0.1 1.2 -0.6 -0.1 1.5 -0.3 -0.7 0.3 0.6 0.3 0.0 0.5 0.1 0.0 -0.1 -0.1 0.0
Public non-residential building 1.2 5.4 2.4 -2.3 -0.9 -0.7 0.2 1.4 -1.0 -0.3 0.0 -0.1 -0.1 -0.1 0.0 0.0 0.0
Private engineering -2.4 38.3 55.9 57.1 14.2 62.7 -16.0 9.7 -7.8 210.5 -92.8 0.0 -3.9 308.5 236.6 -14.9 -37.8
Public engineering 1.1 -7.6 10.1 -2.0 -2.0 -1.0 1.1 -0.2 -0.8 0.4 0.5 1.6 7.6 -0.5 -0.4 0.2 0.2
Total construction 0.9 40.1 71.5 51.0 11.5 60.4 -15.6 11.0 -8.4 210.9 -92.4 1.7 3.8 308.0 236.2 -14.8 -37.5
Table 3.14 Formation of construction in Mackay (CVM $m)
2010 2011 2012 2013 2014 2015 2016 2017 2018 2019 2020 2021 2022 2023 2024 2025 2026
Change in:
Private dwelling new construction 60.0 -74.4 -22.4 254.1 66.0 -365.1 -193.6 -51.7 87.4 85.1 37.4 10.0 32.8 34.2 25.8 27.1 24.9
Other dwelling 17.0 -21.6 -29.5 -9.1 24.8 7.7 18.6 7.7 5.6 13.9 4.5 7.2 7.7 7.9 8.1 8.3 8.5
Private non-residential building -28.8 119.0 1.9 -34.6 11.1 -70.4 -63.4 -83.1 37.9 25.1 15.0 20.7 14.6 10.8 2.1 -35.6 6.5
Public non-residential building 78.4 119.8 -116.0 -42.9 33.1 -73.6 -18.4 3.9 3.9 3.6 3.6 11.6 1.0 1.4 6.2 4.1 0.5
Private engineering -354.2 179.5 2739.4 1899.5 190.4 -3448.0 -955.7 -985.5 304.2 149.5 -80.4 -511.7 -82.6 124.2 385.1 998.2 827.3
Public engineering -5.8 -89.8 -174.5 -31.0 97.1 -98.7 -32.8 55.7 70.4 108.1 -93.8 338.5 302.3 -62.9 -75.3 -27.2 -268.8
Total construction -233.3 232.5 2399.1 2036.0 422.5 -4048.1 -1245.2 -1053.0 509.5 385.3 -113.6 -123.7 275.9 115.7 352.0 974.9 598.8
Percentage point contribution to growth:
Private dwelling new construction 1.8 -2.4 -0.7 4.4 0.8 -4.4 -4.6 -1.7 4.6 3.5 1.3 0.4 1.3 1.2 0.9 0.8 0.6
Other dwelling 0.5 -0.7 -0.9 -0.2 0.3 0.1 0.4 0.3 0.3 0.6 0.2 0.3 0.3 0.3 0.3 0.3 0.2
Private non-residential building -0.8 3.8 0.1 -0.6 0.1 -0.9 -1.5 -2.8 2.0 1.0 0.5 0.8 0.6 0.4 0.1 -1.1 0.2
Public non-residential building 2.3 3.8 -3.4 -0.7 0.4 -0.9 -0.4 0.1 0.2 0.1 0.1 0.4 0.0 0.1 0.2 0.1 0.0
Private engineering -10.4 5.7 80.8 32.8 2.4 -41.8 -22.8 -33.3 16.0 6.2 -2.9 -19.1 -3.2 4.4 13.0 30.2 19.3
Public engineering -0.2 -2.8 -5.1 -0.5 1.2 -1.2 -0.8 1.9 3.7 4.5 -3.4 12.6 11.8 -2.2 -2.6 -0.8 -6.3
Total construction -6.9 7.4 70.7 35.2 5.4 -49.1 -29.6 -35.6 26.8 16.0 -4.1 -4.6 10.8 4.1 11.9 29.5 14.0
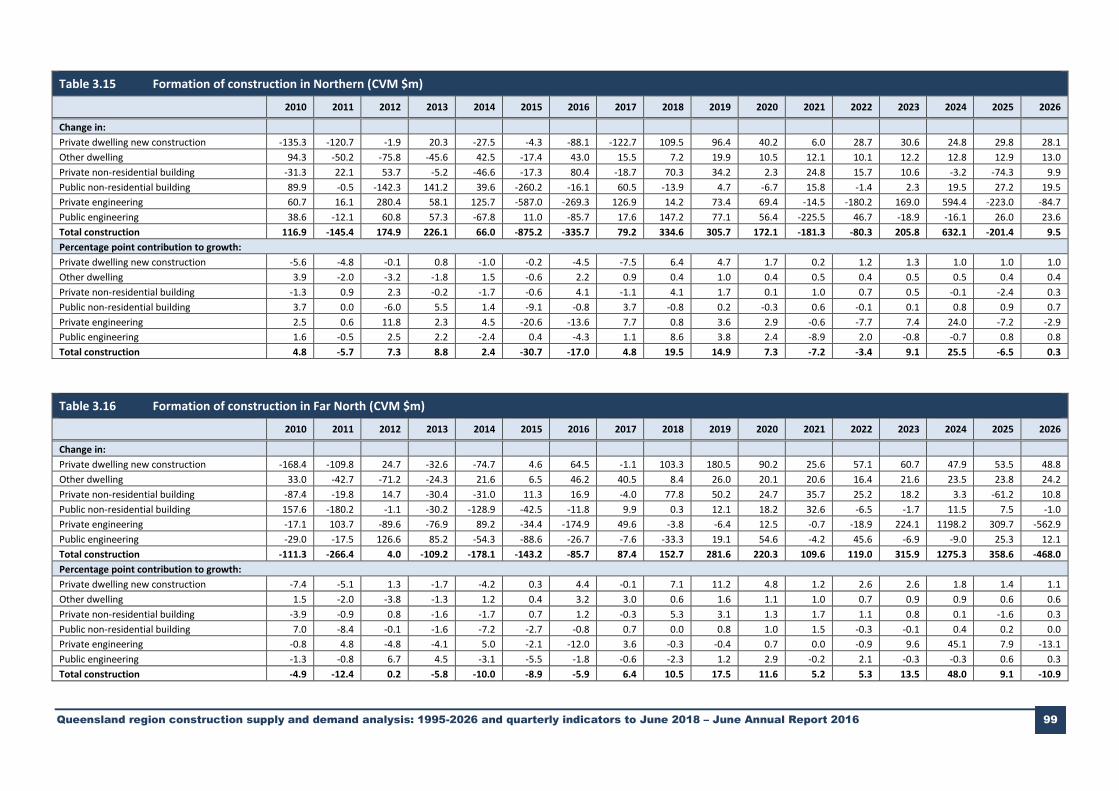
Queensland region construction supply and demand analysis: 1995-2026 and quarterly indicators to June 2018 – June Annual Report 2016 99
Table 3.15 Formation of construction in Northern (CVM $m)
2010 2011 2012 2013 2014 2015 2016 2017 2018 2019 2020 2021 2022 2023 2024 2025 2026
Change in:
Private dwelling new construction -135.3 -120.7 -1.9 20.3 -27.5 -4.3 -88.1 -122.7 109.5 96.4 40.2 6.0 28.7 30.6 24.8 29.8 28.1
Other dwelling 94.3 -50.2 -75.8 -45.6 42.5 -17.4 43.0 15.5 7.2 19.9 10.5 12.1 10.1 12.2 12.8 12.9 13.0
Private non-residential building -31.3 22.1 53.7 -5.2 -46.6 -17.3 80.4 -18.7 70.3 34.2 2.3 24.8 15.7 10.6 -3.2 -74.3 9.9
Public non-residential building 89.9 -0.5 -142.3 141.2 39.6 -260.2 -16.1 60.5 -13.9 4.7 -6.7 15.8 -1.4 2.3 19.5 27.2 19.5
Private engineering 60.7 16.1 280.4 58.1 125.7 -587.0 -269.3 126.9 14.2 73.4 69.4 -14.5 -180.2 169.0 594.4 -223.0 -84.7
Public engineering 38.6 -12.1 60.8 57.3 -67.8 11.0 -85.7 17.6 147.2 77.1 56.4 -225.5 46.7 -18.9 -16.1 26.0 23.6
Total construction 116.9 -145.4 174.9 226.1 66.0 -875.2 -335.7 79.2 334.6 305.7 172.1 -181.3 -80.3 205.8 632.1 -201.4 9.5
Percentage point contribution to growth:
Private dwelling new construction -5.6 -4.8 -0.1 0.8 -1.0 -0.2 -4.5 -7.5 6.4 4.7 1.7 0.2 1.2 1.3 1.0 1.0 1.0
Other dwelling 3.9 -2.0 -3.2 -1.8 1.5 -0.6 2.2 0.9 0.4 1.0 0.4 0.5 0.4 0.5 0.5 0.4 0.4
Private non-residential building -1.3 0.9 2.3 -0.2 -1.7 -0.6 4.1 -1.1 4.1 1.7 0.1 1.0 0.7 0.5 -0.1 -2.4 0.3
Public non-residential building 3.7 0.0 -6.0 5.5 1.4 -9.1 -0.8 3.7 -0.8 0.2 -0.3 0.6 -0.1 0.1 0.8 0.9 0.7
Private engineering 2.5 0.6 11.8 2.3 4.5 -20.6 -13.6 7.7 0.8 3.6 2.9 -0.6 -7.7 7.4 24.0 -7.2 -2.9
Public engineering 1.6 -0.5 2.5 2.2 -2.4 0.4 -4.3 1.1 8.6 3.8 2.4 -8.9 2.0 -0.8 -0.7 0.8 0.8
Total construction 4.8 -5.7 7.3 8.8 2.4 -30.7 -17.0 4.8 19.5 14.9 7.3 -7.2 -3.4 9.1 25.5 -6.5 0.3
Table 3.16 Formation of construction in Far North (CVM $m)
2010 2011 2012 2013 2014 2015 2016 2017 2018 2019 2020 2021 2022 2023 2024 2025 2026
Change in:
Private dwelling new construction -168.4 -109.8 24.7 -32.6 -74.7 4.6 64.5 -1.1 103.3 180.5 90.2 25.6 57.1 60.7 47.9 53.5 48.8
Other dwelling 33.0 -42.7 -71.2 -24.3 21.6 6.5 46.2 40.5 8.4 26.0 20.1 20.6 16.4 21.6 23.5 23.8 24.2
Private non-residential building -87.4 -19.8 14.7 -30.4 -31.0 11.3 16.9 -4.0 77.8 50.2 24.7 35.7 25.2 18.2 3.3 -61.2 10.8
Public non-residential building 157.6 -180.2 -1.1 -30.2 -128.9 -42.5 -11.8 9.9 0.3 12.1 18.2 32.6 -6.5 -1.7 11.5 7.5 -1.0
Private engineering -17.1 103.7 -89.6 -76.9 89.2 -34.4 -174.9 49.6 -3.8 -6.4 12.5 -0.7 -18.9 224.1 1198.2 309.7 -562.9
Public engineering -29.0 -17.5 126.6 85.2 -54.3 -88.6 -26.7 -7.6 -33.3 19.1 54.6 -4.2 45.6 -6.9 -9.0 25.3 12.1
Total construction -111.3 -266.4 4.0 -109.2 -178.1 -143.2 -85.7 87.4 152.7 281.6 220.3 109.6 119.0 315.9 1275.3 358.6 -468.0
Percentage point contribution to growth:
Private dwelling new construction -7.4 -5.1 1.3 -1.7 -4.2 0.3 4.4 -0.1 7.1 11.2 4.8 1.2 2.6 2.6 1.8 1.4 1.1
Other dwelling 1.5 -2.0 -3.8 -1.3 1.2 0.4 3.2 3.0 0.6 1.6 1.1 1.0 0.7 0.9 0.9 0.6 0.6
Private non-residential building -3.9 -0.9 0.8 -1.6 -1.7 0.7 1.2 -0.3 5.3 3.1 1.3 1.7 1.1 0.8 0.1 -1.6 0.3
Public non-residential building 7.0 -8.4 -0.1 -1.6 -7.2 -2.7 -0.8 0.7 0.0 0.8 1.0 1.5 -0.3 -0.1 0.4 0.2 0.0
Private engineering -0.8 4.8 -4.8 -4.1 5.0 -2.1 -12.0 3.6 -0.3 -0.4 0.7 0.0 -0.9 9.6 45.1 7.9 -13.1
Public engineering -1.3 -0.8 6.7 4.5 -3.1 -5.5 -1.8 -0.6 -2.3 1.2 2.9 -0.2 2.1 -0.3 -0.3 0.6 0.3
Total construction -4.9 -12.4 0.2 -5.8 -10.0 -8.9 -5.9 6.4 10.5 17.5 11.6 5.2 5.3 13.5 48.0 9.1 -10.9

Queensland region construction supply and demand analysis: 1995-2026 and quarterly indicators to June 2018 – June Annual Report 2016 100
Table 3.17 Formation of construction in North West (CVM $m)
2010 2011 2012 2013 2014 2015 2016 2017 2018 2019 2020 2021 2022 2023 2024 2025 2026
Change in:
Private dwelling new construction 2.7 -1.3 -3.8 0.3 3.9 -4.2 -9.2 -3.1 21.2 3.7 -0.5 -1.5 0.0 0.4 0.4 0.8 0.7
Other dwelling -2.1 3.4 2.3 -6.3 0.8 -0.3 5.5 5.2 -0.4 1.3 2.0 1.3 0.4 1.2 1.4 1.3 1.3
Private non-residential building -4.8 10.0 5.1 0.5 33.9 4.0 -41.4 -12.3 7.9 3.8 1.2 3.0 2.5 2.1 0.8 -5.0 1.3
Public non-residential building 4.5 13.1 -1.0 4.8 -3.4 -19.2 -0.8 6.6 -4.8 -0.4 1.2 2.9 0.3 0.4 1.7 1.1 0.1
Private engineering -89.5 237.9 320.0 217.4 53.5 -691.9 -96.6 661.0 727.8 -1373.5 36.7 13.3 -98.4 -109.5 365.8 512.0 921.5
Public engineering -8.2 24.8 -7.4 13.8 -5.9 -0.3 29.9 -0.6 -12.7 8.4 18.0 5.4 16.5 -5.1 -2.5 12.0 -1.0
Total construction -97.3 287.9 315.2 230.5 82.8 -711.8 -112.7 656.8 739.0 -1356.6 58.6 24.3 -78.8 -110.5 367.6 522.3 923.9
Percentage point contribution to growth:
Private dwelling new construction 0.4 -0.3 -0.5 0.0 0.3 -0.3 -1.3 -0.5 1.7 0.2 -0.1 -0.2 0.0 0.1 0.1 0.1 0.0
Other dwelling -0.3 0.7 0.3 -0.6 0.1 0.0 0.8 0.9 0.0 0.1 0.3 0.2 0.0 0.2 0.3 0.1 0.1
Private non-residential building -0.8 1.9 0.6 0.0 2.5 0.3 -5.8 -2.0 0.6 0.2 0.2 0.4 0.3 0.3 0.1 -0.5 0.1
Public non-residential building 0.7 2.6 -0.1 0.4 -0.3 -1.3 -0.1 1.1 -0.4 0.0 0.2 0.4 0.0 0.1 0.3 0.1 0.0
Private engineering -14.7 46.4 39.9 19.5 4.0 -48.4 -13.5 109.2 57.7 -68.6 5.7 1.9 -13.5 -16.9 68.0 56.5 64.5
Public engineering -1.3 4.8 -0.9 1.2 -0.4 0.0 4.2 -0.1 -1.0 0.4 2.8 0.8 2.3 -0.8 -0.5 1.3 -0.1
Total construction -15.9 56.1 39.3 20.7 6.1 -49.8 -15.7 108.5 58.6 -67.8 9.1 3.5 -10.8 -17.0 68.3 57.7 64.7
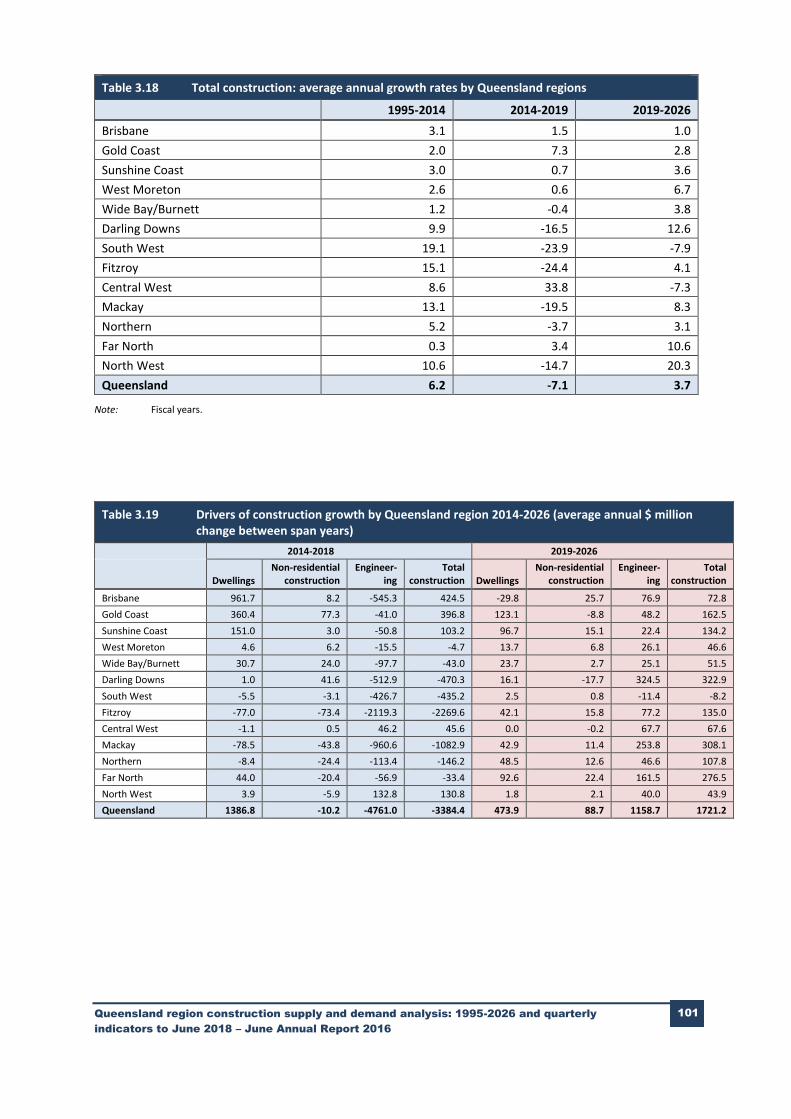
Queensland region construction supply and demand analysis: 1995-2026 and quarterly
indicators to June 2018 – June Annual Report 2016
101 101 101 101
Table 3.18 Total construction: average annual growth rates by Queensland regions
1995-2014 2014-2019 2019-2026
Brisbane 3.1 1.5 1.0
Gold Coast 2.0 7.3 2.8
Sunshine Coast 3.0 0.7 3.6
West Moreton 2.6 0.6 6.7
Wide Bay/Burnett 1.2 -0.4 3.8
Darling Downs 9.9 -16.5 12.6
South West 19.1 -23.9 -7.9
Fitzroy 15.1 -24.4 4.1
Central West 8.6 33.8 -7.3
Mackay 13.1 -19.5 8.3
Northern 5.2 -3.7 3.1
Far North 0.3 3.4 10.6
North West 10.6 -14.7 20.3
Queensland 6.2 -7.1 3.7
Note: Fiscal years.
Table 3.19 Drivers of construction growth by Queensland region 2014-2026 (average annual $ million change between span years)
2014-2018 2019-2026
Dwellings Non-residential
construction Engineer-
ing Total
construction Dwellings Non-residential
construction Engineer-
ing Total
construction
Brisbane 961.7 8.2 -545.3 424.5 -29.8 25.7 76.9 72.8
Gold Coast 360.4 77.3 -41.0 396.8 123.1 -8.8 48.2 162.5
Sunshine Coast 151.0 3.0 -50.8 103.2 96.7 15.1 22.4 134.2
West Moreton 4.6 6.2 -15.5 -4.7 13.7 6.8 26.1 46.6
Wide Bay/Burnett 30.7 24.0 -97.7 -43.0 23.7 2.7 25.1 51.5
Darling Downs 1.0 41.6 -512.9 -470.3 16.1 -17.7 324.5 322.9
South West -5.5 -3.1 -426.7 -435.2 2.5 0.8 -11.4 -8.2
Fitzroy -77.0 -73.4 -2119.3 -2269.6 42.1 15.8 77.2 135.0
Central West -1.1 0.5 46.2 45.6 0.0 -0.2 67.7 67.6
Mackay -78.5 -43.8 -960.6 -1082.9 42.9 11.4 253.8 308.1
Northern -8.4 -24.4 -113.4 -146.2 48.5 12.6 46.6 107.8
Far North 44.0 -20.4 -56.9 -33.4 92.6 22.4 161.5 276.5
North West 3.9 -5.9 132.8 130.8 1.8 2.1 40.0 43.9
Queensland 1386.8 -10.2 -4761.0 -3384.4 473.9 88.7 1158.7 1721.2

Queensland region construction supply and demand analysis: 1995-2026 and quarterly indicators to June 2018 – June Annual Report 2016 102
Table 3.20 Contribution of each region to Queensland construction growth
2010 2011 2012 2013 2014 2015 2016 2017 2018 2019 2020 2021 2022 2023 2024 2025 2026 Average
2002-2008 Average
2009-2015 Average
2016-2026
Percentage point contribution
Brisbane -1.6 -0.5 0.7 -4.6 -0.1 -0.1 -0.1 5.2 0.0 -1.8 0.8 0.3 -0.9 -0.5 0.3 0.4 2.1 4.6 -0.3 0.5
Gold Coast 0.0 -0.9 -1.9 -1.1 0.6 0.5 0.9 1.7 0.1 0.2 0.4 0.0 0.2 0.5 0.2 0.4 0.7 1.5 -0.5 0.5
Sunshine Coast 0.0 1.6 -1.5 -1.1 0.9 0.2 -0.7 0.3 0.0 0.4 0.4 0.1 0.2 0.3 0.1 0.2 0.5 0.7 0.0 0.2
West Moreton 0.3 -0.5 -0.3 0.0 0.0 -0.1 -0.1 0.1 0.1 0.1 0.2 0.1 0.2 0.1 0.0 0.0 0.2 0.2 0.0 0.1
Wide Bay/ Burnett 0.0 0.0 -0.4 -0.1 -0.3 0.1 -0.3 0.1 0.0 0.1 0.1 0.1 0.3 0.1 0.0 0.0 0.2 0.5 -0.2 0.1
Darling Downs -0.3 2.5 1.6 0.6 0.9 -3.4 -0.8 -0.3 -0.2 -0.3 -0.1 0.3 0.0 0.3 3.0 1.0 0.9 0.6 0.2 0.0
South West -0.6 1.0 2.5 0.9 0.7 -2.1 -1.4 -1.3 0.2 0.6 0.2 -0.8 0.0 0.7 -0.1 -0.4 -0.2 0.2 0.3 -0.4
Fitzroy 0.7 4.0 14.9 5.0 3.2 -8.5 -10.4 -3.5 -1.0 -0.8 1.6 -0.2 0.2 -0.5 -1.1 1.8 0.9 0.7 3.0 -1.8
Central West 0.0 0.1 0.2 0.2 0.1 0.4 -0.2 0.2 -0.1 3.0 -4.0 0.0 0.0 1.1 3.2 -0.6 -1.3 0.0 0.2 0.1
Mackay -0.5 0.5 4.8 3.3 0.7 -6.0 -2.3 -2.4 1.1 0.8 -0.2 -0.3 0.6 0.2 0.7 1.8 1.1 0.9 0.5 -0.4
Northern 0.2 -0.3 0.3 0.4 0.1 -1.3 -0.6 0.2 0.7 0.7 0.4 -0.4 -0.2 0.4 1.3 -0.4 0.0 0.5 -0.1 0.1
Far North -0.2 -0.6 0.0 -0.2 -0.3 -0.2 -0.2 0.2 0.3 0.6 0.5 0.2 0.3 0.7 2.6 0.7 -0.8 0.5 -0.2 0.4
North West -0.2 0.6 0.6 0.4 0.1 -1.1 -0.2 1.5 1.6 -2.9 0.1 0.1 -0.2 -0.2 0.8 1.0 1.6 0.1 0.1 0.2
Queensland -2.2 7.5 21.6 3.7 6.6 -21.5 -16.5 2.1 2.9 0.6 0.3 -0.6 0.6 3.2 11.1 5.8 5.9 11.0 3.0 -0.5

Queensland region construction supply and demand analysis: 1995-2026 and quarterly
indicators to June 2018 – June Annual Report 2016
103 103 103 103
4. Queensland construction: Resources, capacity and price pressures
4.1 Utilisation of capacity
Over 2006 and 2009 the Queensland construction sector was operating above normal capacity levels. The excess demand averaged $4 billion for over these years, implying an excess demand rate of 9%.
The impact of the GFC over 2010 and 2011 brought the Queensland construction sector back to demand-supply balance.
However, rising levels of mining investment from 2012 increased excess demand to reach $13 billion, or 4% of the construction activity by 2014.
Over the 2015 to 2018 period total construction expenditure will fall by an average of 9% per annum. These poor prospects mean that the excess capacity will be a feature of the period with excess capacity averaging 21% over these two years. For the 2017 and 2018 period excess capacity will average 11%.
4.2 Labour shortages
The estimate of labour shortages is a different concept to capacity utilisation. Capacity utilisation is measured by the ratio of desired employment to actual employment, given the level of construction activity. Labour shortages are measured by the difference between desired employment and the capacity of the region to supply construction labour.
As at the December quarter 2014, the construction industry at the State level was in surplus. However, there was considerable regional variation with a shortage of 3,000 in the Sunshine Coast and a similar surplus in Far North. The surpluses in Brisbane, Gold Coast and West Moreton summed to 9,000.
By the December 2015 as the non-residential building and engineering construction both go into decline, the Queensland surplus has risen to 35,000 and only the Gold Coast is in shortage, Brisbane has the largest surplus with 9,700.
The Queensland surplus decreases over the next year reaching 24,700 by the December 2016 and rising again to 26,500 by June 2018.
4.3 Queensland construction sector unemployment rates
The latest estimates of construction sector unemployment for Queensland would indicate that as at June 2016 there are 9,000 unemployed construction workers in Queensland, this was down 26% on the figure for same period in 2015. The latest estimate for the number employed in the construction sector for the June quarter 2016 is for just under 228,000 in trend terms which 10% above the levels of June quarter 2015.
The implied unemployment rate for the construction industry for June quarter 2016 is 3.9%, this is lower than for the June quarter 2015 when the unemployment rate was 5.7%.

Queensland region construction supply and demand analysis: 1995-2026 and quarterly
indicators to June 2018 – June Annual Report 2016
104 104 104 104
The unemployment rate for the construction sector is projected range from 3.5% to 4.5% over the next two years.
4.4 Construction cost inflation
Cost pressures should ease over the next two years. The growth in new dwelling construction activity, which is highly skill and labour intensive, has slowed easing pressure on real costs for that segment. Between the June quarter 2016 and the June quarter 2017 real new dwelling construction costs are projected to increase by 1.1% per annum. Engineering costs are projected to increase by 1.2% per annum, while non-residential building real costs are projected to increase by 1.1% per annum. The net impact on overall real construction costs will be a cumulative real cost increase of 1.2% over the year. For June 2018 this cumulative change is an increase of just 0.7% per annum.
Figure 4.1: Unused capacity in Queensland’s construction sector
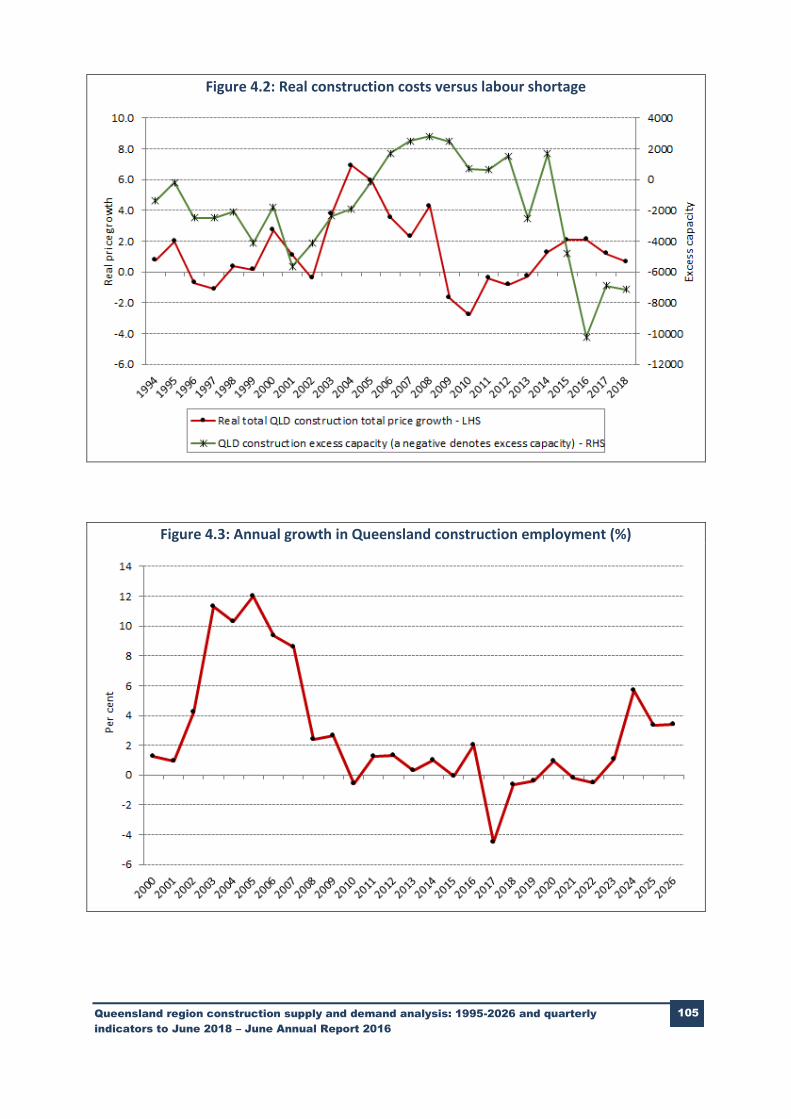
Queensland region construction supply and demand analysis: 1995-2026 and quarterly
indicators to June 2018 – June Annual Report 2016
105 105 105 105
Figure 4.2: Real construction costs versus labour shortage
Figure 4.3: Annual growth in Queensland construction employment (%)
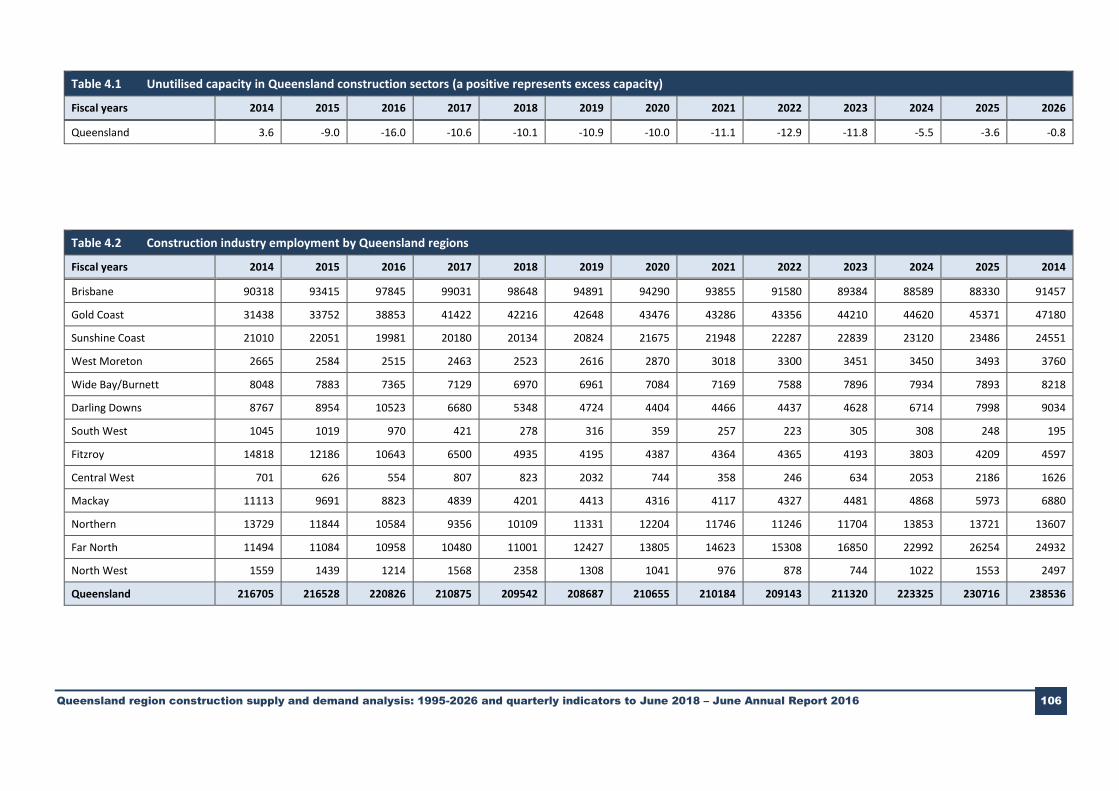
Queensland region construction supply and demand analysis: 1995-2026 and quarterly indicators to June 2018 – June Annual Report 2016 106
Table 4.1 Unutilised capacity in Queensland construction sectors (a positive represents excess capacity)
Fiscal years 2014 2015 2016 2017 2018 2019 2020 2021 2022 2023 2024 2025 2026
Queensland 3.6 -9.0 -16.0 -10.6 -10.1 -10.9 -10.0 -11.1 -12.9 -11.8 -5.5 -3.6 -0.8
Table 4.2 Construction industry employment by Queensland regions
Fiscal years 2014 2015 2016 2017 2018 2019 2020 2021 2022 2023 2024 2025 2014
Brisbane 90318 93415 97845 99031 98648 94891 94290 93855 91580 89384 88589 88330 91457
Gold Coast 31438 33752 38853 41422 42216 42648 43476 43286 43356 44210 44620 45371 47180
Sunshine Coast 21010 22051 19981 20180 20134 20824 21675 21948 22287 22839 23120 23486 24551
West Moreton 2665 2584 2515 2463 2523 2616 2870 3018 3300 3451 3450 3493 3760
Wide Bay/Burnett 8048 7883 7365 7129 6970 6961 7084 7169 7588 7896 7934 7893 8218
Darling Downs 8767 8954 10523 6680 5348 4724 4404 4466 4437 4628 6714 7998 9034
South West 1045 1019 970 421 278 316 359 257 223 305 308 248 195
Fitzroy 14818 12186 10643 6500 4935 4195 4387 4364 4365 4193 3803 4209 4597
Central West 701 626 554 807 823 2032 744 358 246 634 2053 2186 1626
Mackay 11113 9691 8823 4839 4201 4413 4316 4117 4327 4481 4868 5973 6880
Northern 13729 11844 10584 9356 10109 11331 12204 11746 11246 11704 13853 13721 13607
Far North 11494 11084 10958 10480 11001 12427 13805 14623 15308 16850 22992 26254 24932
North West 1559 1439 1214 1568 2358 1308 1041 976 878 744 1022 1553 2497
Queensland 216705 216528 220826 210875 209542 208687 210655 210184 209143 211320 223325 230716 238536
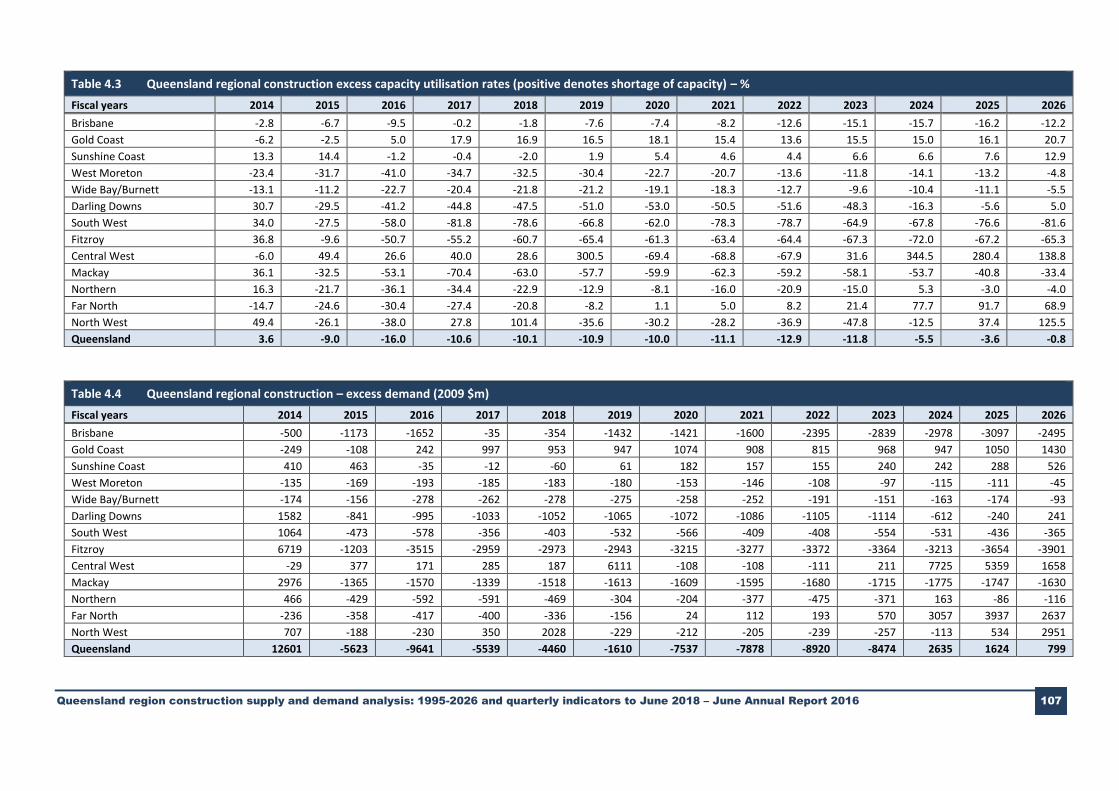
Queensland region construction supply and demand analysis: 1995-2026 and quarterly indicators to June 2018 – June Annual Report 2016 107
Table 4.3 Queensland regional construction excess capacity utilisation rates (positive denotes shortage of capacity) – %
Fiscal years 2014 2015 2016 2017 2018 2019 2020 2021 2022 2023 2024 2025 2026
Brisbane -2.8 -6.7 -9.5 -0.2 -1.8 -7.6 -7.4 -8.2 -12.6 -15.1 -15.7 -16.2 -12.2
Gold Coast -6.2 -2.5 5.0 17.9 16.9 16.5 18.1 15.4 13.6 15.5 15.0 16.1 20.7
Sunshine Coast 13.3 14.4 -1.2 -0.4 -2.0 1.9 5.4 4.6 4.4 6.6 6.6 7.6 12.9
West Moreton -23.4 -31.7 -41.0 -34.7 -32.5 -30.4 -22.7 -20.7 -13.6 -11.8 -14.1 -13.2 -4.8
Wide Bay/Burnett -13.1 -11.2 -22.7 -20.4 -21.8 -21.2 -19.1 -18.3 -12.7 -9.6 -10.4 -11.1 -5.5
Darling Downs 30.7 -29.5 -41.2 -44.8 -47.5 -51.0 -53.0 -50.5 -51.6 -48.3 -16.3 -5.6 5.0
South West 34.0 -27.5 -58.0 -81.8 -78.6 -66.8 -62.0 -78.3 -78.7 -64.9 -67.8 -76.6 -81.6
Fitzroy 36.8 -9.6 -50.7 -55.2 -60.7 -65.4 -61.3 -63.4 -64.4 -67.3 -72.0 -67.2 -65.3
Central West -6.0 49.4 26.6 40.0 28.6 300.5 -69.4 -68.8 -67.9 31.6 344.5 280.4 138.8
Mackay 36.1 -32.5 -53.1 -70.4 -63.0 -57.7 -59.9 -62.3 -59.2 -58.1 -53.7 -40.8 -33.4
Northern 16.3 -21.7 -36.1 -34.4 -22.9 -12.9 -8.1 -16.0 -20.9 -15.0 5.3 -3.0 -4.0
Far North -14.7 -24.6 -30.4 -27.4 -20.8 -8.2 1.1 5.0 8.2 21.4 77.7 91.7 68.9
North West 49.4 -26.1 -38.0 27.8 101.4 -35.6 -30.2 -28.2 -36.9 -47.8 -12.5 37.4 125.5
Queensland 3.6 -9.0 -16.0 -10.6 -10.1 -10.9 -10.0 -11.1 -12.9 -11.8 -5.5 -3.6 -0.8
Table 4.4 Queensland regional construction – excess demand (2009 $m)
Fiscal years 2014 2015 2016 2017 2018 2019 2020 2021 2022 2023 2024 2025 2026
Brisbane -500 -1173 -1652 -35 -354 -1432 -1421 -1600 -2395 -2839 -2978 -3097 -2495
Gold Coast -249 -108 242 997 953 947 1074 908 815 968 947 1050 1430
Sunshine Coast 410 463 -35 -12 -60 61 182 157 155 240 242 288 526
West Moreton -135 -169 -193 -185 -183 -180 -153 -146 -108 -97 -115 -111 -45
Wide Bay/Burnett -174 -156 -278 -262 -278 -275 -258 -252 -191 -151 -163 -174 -93
Darling Downs 1582 -841 -995 -1033 -1052 -1065 -1072 -1086 -1105 -1114 -612 -240 241
South West 1064 -473 -578 -356 -403 -532 -566 -409 -408 -554 -531 -436 -365
Fitzroy 6719 -1203 -3515 -2959 -2973 -2943 -3215 -3277 -3372 -3364 -3213 -3654 -3901
Central West -29 377 171 285 187 6111 -108 -108 -111 211 7725 5359 1658
Mackay 2976 -1365 -1570 -1339 -1518 -1613 -1609 -1595 -1680 -1715 -1775 -1747 -1630
Northern 466 -429 -592 -591 -469 -304 -204 -377 -475 -371 163 -86 -116
Far North -236 -358 -417 -400 -336 -156 24 112 193 570 3057 3937 2637
North West 707 -188 -230 350 2028 -229 -212 -205 -239 -257 -113 534 2951
Queensland 12601 -5623 -9641 -5539 -4460 -1610 -7537 -7878 -8920 -8474 2635 1624 799
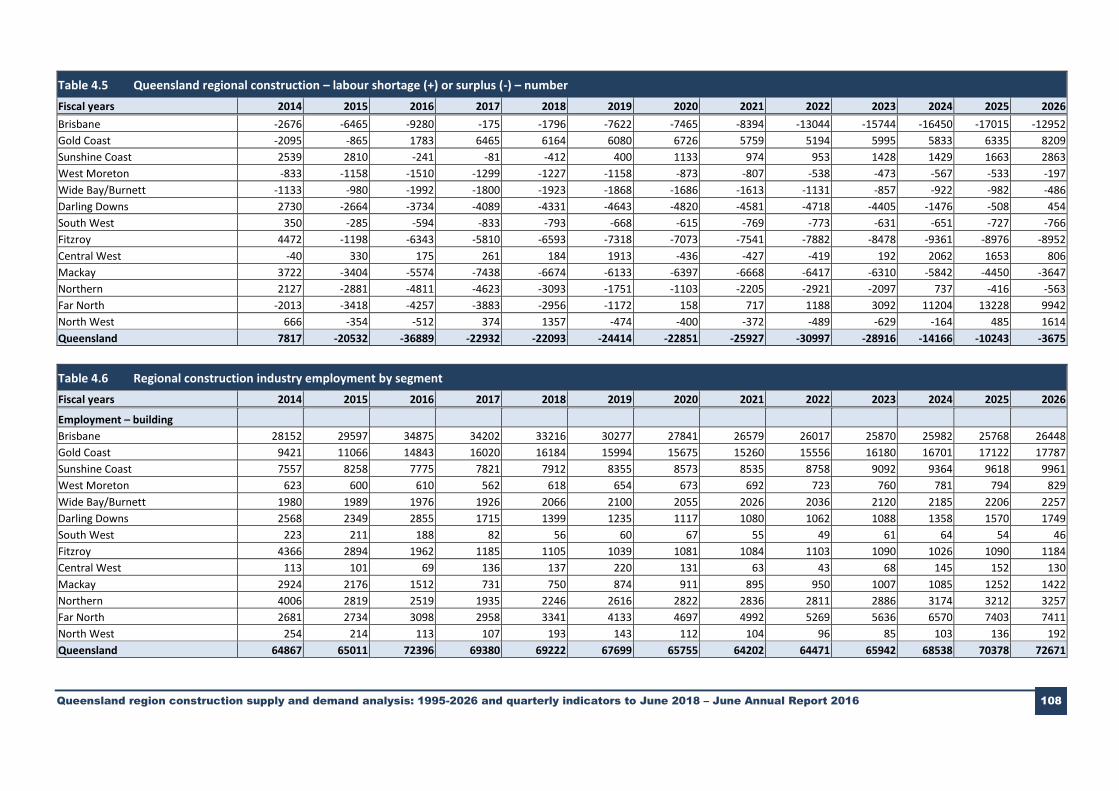
Queensland region construction supply and demand analysis: 1995-2026 and quarterly indicators to June 2018 – June Annual Report 2016 108
Table 4.5 Queensland regional construction – labour shortage (+) or surplus (-) – number
Fiscal years 2014 2015 2016 2017 2018 2019 2020 2021 2022 2023 2024 2025 2026
Brisbane -2676 -6465 -9280 -175 -1796 -7622 -7465 -8394 -13044 -15744 -16450 -17015 -12952
Gold Coast -2095 -865 1783 6465 6164 6080 6726 5759 5194 5995 5833 6335 8209
Sunshine Coast 2539 2810 -241 -81 -412 400 1133 974 953 1428 1429 1663 2863
West Moreton -833 -1158 -1510 -1299 -1227 -1158 -873 -807 -538 -473 -567 -533 -197
Wide Bay/Burnett -1133 -980 -1992 -1800 -1923 -1868 -1686 -1613 -1131 -857 -922 -982 -486
Darling Downs 2730 -2664 -3734 -4089 -4331 -4643 -4820 -4581 -4718 -4405 -1476 -508 454
South West 350 -285 -594 -833 -793 -668 -615 -769 -773 -631 -651 -727 -766
Fitzroy 4472 -1198 -6343 -5810 -6593 -7318 -7073 -7541 -7882 -8478 -9361 -8976 -8952
Central West -40 330 175 261 184 1913 -436 -427 -419 192 2062 1653 806
Mackay 3722 -3404 -5574 -7438 -6674 -6133 -6397 -6668 -6417 -6310 -5842 -4450 -3647
Northern 2127 -2881 -4811 -4623 -3093 -1751 -1103 -2205 -2921 -2097 737 -416 -563
Far North -2013 -3418 -4257 -3883 -2956 -1172 158 717 1188 3092 11204 13228 9942
North West 666 -354 -512 374 1357 -474 -400 -372 -489 -629 -164 485 1614
Queensland 7817 -20532 -36889 -22932 -22093 -24414 -22851 -25927 -30997 -28916 -14166 -10243 -3675
Table 4.6 Regional construction industry employment by segment
Fiscal years 2014 2015 2016 2017 2018 2019 2020 2021 2022 2023 2024 2025 2026
Employment – building
Brisbane 28152 29597 34875 34202 33216 30277 27841 26579 26017 25870 25982 25768 26448
Gold Coast 9421 11066 14843 16020 16184 15994 15675 15260 15556 16180 16701 17122 17787
Sunshine Coast 7557 8258 7775 7821 7912 8355 8573 8535 8758 9092 9364 9618 9961
West Moreton 623 600 610 562 618 654 673 692 723 760 781 794 829
Wide Bay/Burnett 1980 1989 1976 1926 2066 2100 2055 2026 2036 2120 2185 2206 2257
Darling Downs 2568 2349 2855 1715 1399 1235 1117 1080 1062 1088 1358 1570 1749
South West 223 211 188 82 56 60 67 55 49 61 64 54 46
Fitzroy 4366 2894 1962 1185 1105 1039 1081 1084 1103 1090 1026 1090 1184
Central West 113 101 69 136 137 220 131 63 43 68 145 152 130
Mackay 2924 2176 1512 731 750 874 911 895 950 1007 1085 1252 1422
Northern 4006 2819 2519 1935 2246 2616 2822 2836 2811 2886 3174 3212 3257
Far North 2681 2734 3098 2958 3341 4133 4697 4992 5269 5636 6570 7403 7411
North West 254 214 113 107 193 143 112 104 96 85 103 136 192
Queensland 64867 65011 72396 69380 69222 67699 65755 64202 64471 65942 68538 70378 72671

Queensland region construction supply and demand analysis: 1995-2026 and quarterly indicators to June 2018 – June Annual Report 2016 109
Table 4.6 Regional construction industry employment by segment (continued)
Fiscal years 2014 2015 2016 2017 2018 2019 2020 2021 2022 2023 2024 2025 2026
Employment – engineering
Brisbane 11104 11343 8145 9107 8836 8324 9327 9318 8755 7998 7543 7827 8406
Gold Coast 2909 2868 2218 2523 2666 2793 3171 3077 2914 2849 2669 2853 3015
Sunshine Coast 1587 1593 1294 1417 1324 1229 1354 1318 1299 1284 1200 1259 1371
West Moreton 429 431 348 320 255 229 283 284 354 369 339 350 414
Wide Bay/Burnett 1106 1130 817 706 557 521 590 594 736 780 725 721 792
Darling Downs 1149 1106 947 617 464 388 381 419 428 474 933 1211 1400
South West 291 299 252 81 51 67 79 40 34 56 52 36 24
Fitzroy 2436 2366 2137 1187 711 508 550 507 485 431 347 442 491
Central West 260 247 238 263 234 816 86 41 29 128 616 635 384
Mackay 1808 1791 1737 947 729 706 623 532 563 567 639 933 1121
Northern 1797 1760 1194 1177 1222 1337 1484 1233 1068 1168 1660 1561 1460
Far North 1791 1679 1276 1223 1014 969 1048 1021 1048 1293 2584 3209 2586
North West 271 266 277 483 724 215 170 151 123 90 154 290 558
Queensland 26937 26881 20880 20053 18788 18103 19147 18536 17835 17489 19462 21327 22022
Employment – construction services
Brisbane 51062 52475 54824 55722 56596 56290 57123 57958 56808 55516 55064 54736 56603
Gold Coast 19109 19817 21792 22878 23366 23861 24629 24949 24887 25181 25250 25396 26379
Sunshine Coast 11866 12200 10912 10941 10897 11240 11748 12095 12230 12463 12556 12608 13219
West Moreton 1613 1552 1557 1581 1650 1734 1914 2041 2224 2322 2329 2349 2517
Wide Bay/Burnett 4963 4764 4572 4497 4346 4340 4440 4549 4816 4996 5024 4966 5169
Darling Downs 5050 5499 6721 4348 3485 3102 2906 2966 2948 3066 4423 5216 5886
South West 531 509 529 258 170 189 212 161 140 188 192 158 126
Fitzroy 8016 6926 6544 4128 3119 2648 2756 2773 2777 2672 2430 2677 2922
Central West 329 277 246 407 452 996 527 254 175 438 1292 1398 1113
Mackay 6380 5723 5574 3162 2722 2833 2782 2690 2814 2907 3144 3788 4337
Northern 7926 7264 6870 6244 6642 7377 7899 7677 7368 7650 9019 8949 8890
Far North 7022 6671 6583 6298 6646 7326 8060 8611 8992 9920 13837 15642 14936
North West 1033 959 824 978 1441 951 759 721 659 568 765 1127 1747
Queensland 124901 124636 127551 121442 121532 122886 125753 127445 126838 127889 135326 139012 143844

Queensland region construction supply and demand analysis: 1995-2026 and quarterly indicators to June 2018 – June Annual Report 2016 110
Table 4.6 Regional construction industry employment by segment (continued)
Fiscal years 2014 2015 2016 2017 2018 2019 2020 2021 2022 2023 2024 2025 2026
Employment – total
Brisbane 90318 93415 97845 99031 98648 94891 94290 93855 91580 89384 88589 88330 91457
Gold Coast 31438 33752 38853 41422 42216 42648 43476 43286 43356 44210 44620 45371 47180
Sunshine Coast 21010 22051 19981 20180 20134 20824 21675 21948 22287 22839 23120 23486 24551
West Moreton 2665 2584 2515 2463 2523 2616 2870 3018 3300 3451 3450 3493 3760
Wide Bay/Burnett 8048 7883 7365 7129 6970 6961 7084 7169 7588 7896 7934 7893 8218
Darling Downs 8767 8954 10523 6680 5348 4724 4404 4466 4437 4628 6714 7998 9034
South West 1045 1019 970 421 278 316 359 257 223 305 308 248 195
Fitzroy 14818 12186 10643 6500 4935 4195 4387 4364 4365 4193 3803 4209 4597
Central West 701 626 554 807 823 2032 744 358 246 634 2053 2186 1626
Mackay 11113 9691 8823 4839 4201 4413 4316 4117 4327 4481 4868 5973 6880
Northern 13729 11844 10584 9356 10109 11331 12204 11746 11246 11704 13853 13721 13607
Far North 11494 11084 10958 10480 11001 12427 13805 14623 15308 16850 22992 26254 24932
North West 1559 1439 1214 1568 2358 1308 1041 976 878 744 1022 1553 2497
Queensland 216705 216528 220826 210875 209542 208687 210655 210184 209143 211320 223325 230716 238536
Queensland region construction supply and demand analysis: 1995-2026 and quarterly
indicators to June 2018 – June Annual Report 2016
111 111 111 111
5. Quarterly profiles
The attached tables of quarterly profiles are consistent with the annual profiles discussed above to June 2018.
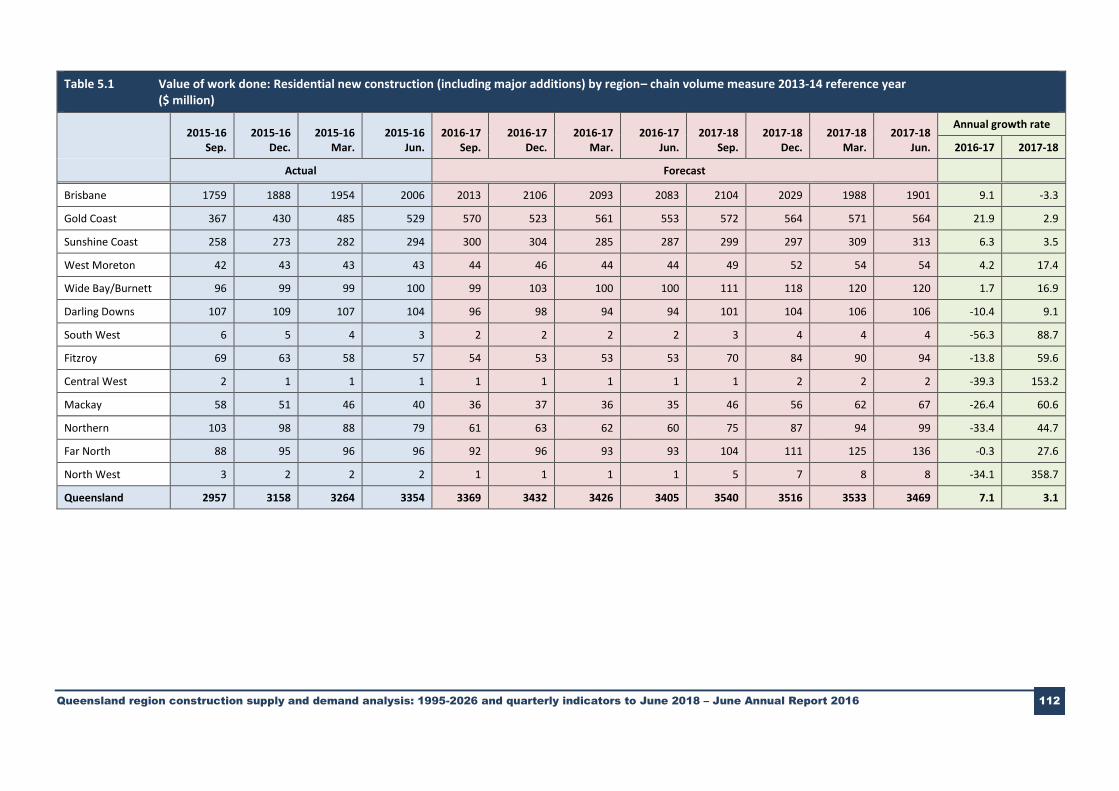
Queensland region construction supply and demand analysis: 1995-2026 and quarterly indicators to June 2018 – June Annual Report 2016 112
Table 5.1 Value of work done: Residential new construction (including major additions) by region– chain volume measure 2013-14 reference year ($ million)
2015-16
Sep. 2015-16
Dec. 2015-16
Mar. 2015-16
Jun. 2016-17
Sep. 2016-17
Dec. 2016-17
Mar. 2016-17
Jun. 2017-18
Sep. 2017-18
Dec. 2017-18
Mar. 2017-18
Jun.
Annual growth rate
2016-17 2017-18
Actual Forecast
Brisbane 1759 1888 1954 2006 2013 2106 2093 2083 2104 2029 1988 1901 9.1 -3.3
Gold Coast 367 430 485 529 570 523 561 553 572 564 571 564 21.9 2.9
Sunshine Coast 258 273 282 294 300 304 285 287 299 297 309 313 6.3 3.5
West Moreton 42 43 43 43 44 46 44 44 49 52 54 54 4.2 17.4
Wide Bay/Burnett 96 99 99 100 99 103 100 100 111 118 120 120 1.7 16.9
Darling Downs 107 109 107 104 96 98 94 94 101 104 106 106 -10.4 9.1
South West 6 5 4 3 2 2 2 2 3 4 4 4 -56.3 88.7
Fitzroy 69 63 58 57 54 53 53 53 70 84 90 94 -13.8 59.6
Central West 2 1 1 1 1 1 1 1 1 2 2 2 -39.3 153.2
Mackay 58 51 46 40 36 37 36 35 46 56 62 67 -26.4 60.6
Northern 103 98 88 79 61 63 62 60 75 87 94 99 -33.4 44.7
Far North 88 95 96 96 92 96 93 93 104 111 125 136 -0.3 27.6
North West 3 2 2 2 1 1 1 1 5 7 8 8 -34.1 358.7
Queensland 2957 3158 3264 3354 3369 3432 3426 3405 3540 3516 3533 3469 7.1 3.1

Queensland region construction supply and demand analysis: 1995-2026 and quarterly indicators to June 2018 – June Annual Report 2016 113
Table 5.2 Value of work done: Residential other renovations by region – chain volume measure 2013-14 reference year ($ million)
2015-16
Sep. 2015-16
Dec. 2015-16
Mar. 2015-16
Jun. 2016-17
Sep. 2016-17
Dec. 2016-17
Mar. 2016-17
Jun. 2017-18
Sep. 2017-18
Dec. 2017-18
Mar. 2017-18
Jun.
Annual growth rate
2016-17 2017-18
Actual Forecast
Brisbane 654 633 676 692 708 722 736 750 760 768 774 846 9.8 7.9
Gold Coast 240 231 245 249 253 258 261 265 267 269 270 295 7.5 6.1
Sunshine Coast 155 149 158 161 164 166 168 170 171 172 172 187 6.8 5.1
West Moreton 27 26 27 28 28 29 29 29 29 29 30 32 6.2 4.8
Wide Bay/Burnett 81 77 82 83 84 85 85 86 86 86 86 94 5.3 3.8
Darling Downs 55 53 56 57 58 59 59 60 60 61 61 66 6.9 4.9
South West 6 5 6 6 6 6 6 6 6 6 6 6 5.0 2.6
Fitzroy 59 56 60 60 61 61 62 62 62 62 62 67 4.6 3.2
Central West 2 2 2 2 2 2 2 2 2 2 2 2 4.4 3.2
Mackay 57 54 57 58 58 59 59 59 59 59 59 64 4.0 2.4
Northern 71 68 72 73 73 74 74 75 75 75 75 81 4.9 2.9
Far North 80 77 81 82 83 84 84 85 85 85 85 93 5.1 3.6
North West 2 2 2 2 2 2 2 2 2 2 3 3 4.1 3.9
Queensland 1488 1434 1524 1554 1581 1605 1629 1651 1665 1676 1683 1836 7.8 6.1

Queensland region construction supply and demand analysis: 1995-2026 and quarterly indicators to June 2018 – June Annual Report 2016 114
Table 5.3 Value of work done: Private residential building by region – chain volume measure 2013-14 reference year ($ million)
2015-16
Sep. 2015-16
Dec. 2015-16
Mar. 2015-16
Jun. 2016-17
Sep. 2016-17
Dec. 2016-17
Mar. 2016-17
Jun. 2017-18
Sep. 2017-18
Dec. 2017-18
Mar. 2017-18
Jun.
Annual growth rate
2016-17 2017-18
Actual Forecast
Brisbane 2413 2521 2630 2698 2721 2828 2830 2833 2864 2797 2761 2747 9.2 -0.4
Gold Coast 607 661 729 778 823 780 822 818 839 833 841 859 16.9 4.0
Sunshine Coast 414 423 440 455 464 470 453 457 470 468 481 501 6.5 4.1
West Moreton 69 69 70 71 72 74 73 73 79 82 83 86 5.0 12.4
Wide Bay/Burnett 177 177 181 183 183 187 185 186 197 204 207 214 3.3 10.9
Darling Downs 162 162 163 161 154 157 154 154 162 165 167 172 -4.5 7.5
South West 11 10 10 9 8 8 8 8 9 10 10 11 -21.8 23.6
Fitzroy 127 119 118 117 114 115 115 115 132 146 153 162 -4.8 29.3
Central West 3 3 3 2 3 3 3 3 3 4 4 4 -11.7 41.2
Mackay 115 106 103 98 95 95 95 94 105 115 121 131 -10.1 24.5
Northern 174 165 159 152 134 137 136 134 150 162 169 180 -16.7 21.8
Far North 168 171 177 178 175 180 177 177 189 197 211 229 2.2 16.3
North West 5 5 4 4 4 4 4 4 7 10 10 10 -14.5 137.2
Queensland 4445 4592 4788 4908 4950 5038 5055 5056 5205 5192 5216 5305 7.3 4.1

Queensland region construction supply and demand analysis: 1995-2026 and quarterly indicators to June 2018 – June Annual Report 2016 115
Table 5.4 Value of work done: Non-residential building by region – chain volume measure 2013-14 reference year ($ million)
2015-16
Sep. 2015-16
Dec. 2015-16
Mar. 2015-16
Jun. 2016-17
Sep. 2016-17
Dec. 2016-17
Mar. 2016-17
Jun. 2017-18
Sep. 2017-18
Dec. 2017-18
Mar. 2017-18
Jun.
Annual growth rate
2016-17 2017-18
Actual Forecast
Brisbane 825 885 895 892 911 896 880 874 879 888 941 997 1.8 4.0
Gold Coast 274 288 266 266 256 278 278 269 248 230 240 247 -1.2 -10.8
Sunshine Coast 125 77 126 116 125 93 81 65 74 89 95 104 -18.1 -0.5
West Moreton 8 8 9 10 12 13 14 15 16 18 20 22 52.2 43.5
Wide Bay/Burnett 48 47 49 50 56 59 62 66 62 55 58 62 25.4 -2.4
Darling Downs 108 116 119 126 125 119 102 82 91 102 105 108 -8.8 -4.9
South West 6 6 5 5 5 5 5 6 6 5 5 6 0.2 -0.9
Fitzroy 49 41 42 42 43 42 42 40 45 48 52 56 -4.1 19.9
Central West 2 1 1 2 3 4 5 6 5 3 3 4 176.7 -14.6
Mackay 50 47 41 32 29 24 20 17 25 33 36 39 -46.6 46.1
Northern 67 77 82 88 94 96 89 77 90 99 107 116 13.3 15.9
Far North 37 37 36 36 39 39 37 38 47 55 61 69 4.0 50.9
North West 9 8 4 5 5 5 5 5 5 5 6 6 -22.5 15.8
Queensland 1607 1639 1674 1671 1703 1673 1620 1560 1592 1631 1730 1835 -0.5 3.5

Queensland region construction supply and demand analysis: 1995-2026 and quarterly indicators to June 2018 – June Annual Report 2016 116
Table 5.5 Value of work done: Total engineering construction activity by region – chain volume measure 2013-14 reference year ($ million)
2015-16
Sep. 2015-16
Dec. 2015-16
Mar. 2015-16
Jun. 2016-17
Sep. 2016-17
Dec. 2016-17
Mar. 2016-17
Jun. 2017-18
Sep. 2017-18
Dec. 2017-18
Mar. 2017-18
Jun.
Annual growth rate
2016-17 2017-18
Actual Forecast
Brisbane 1011 815 775 1047 1123 1350 1268 1204 1182 1251 1200 1221 35.6 -1.9
Gold Coast 246 218 202 264 281 325 304 312 310 324 317 326 31.4 4.5
Sunshine Coast 192 154 154 190 205 200 186 185 180 183 175 176 12.7 -8.0
West Moreton 48 34 33 41 41 53 47 46 43 41 37 36 19.7 -16.0
Wide Bay/Burnett 119 69 58 67 73 77 69 80 60 56 49 49 -4.7 -28.1
Darling Downs 338 307 294 358 365 307 284 301 291 298 277 273 -3.1 -9.4
South West 278 233 204 220 187 65 61 69 64 55 149 182 -59.2 18.3
Fitzroy 1869 1514 1362 1535 1379 1070 1125 1162 1125 1060 945 970 -24.6 -13.4
Central West 177 147 129 172 176 178 167 165 129 21 194 281 9.8 -9.0
Mackay 443 794 700 424 427 359 335 311 302 465 509 531 -39.4 26.2
Northern 202 145 130 170 180 209 196 207 216 234 234 270 22.3 20.4
Far North 138 114 109 128 136 140 127 128 123 125 120 126 8.6 -7.0
North West 146 132 120 157 148 255 297 516 512 511 452 455 119.2 58.9
Queensland 5208 4676 4271 4773 4722 4587 4466 4686 4536 4626 4659 4896 -2.5 1.4

Queensland region construction supply and demand analysis: 1995-2026 and quarterly indicators to June 2018 – June Annual Report 2016 117
Table 5.6 Value of work done: Total construction activity by region – chain volume measure 2013-14 reference year ($ million)
2015-16
Sep. 2015-16
Dec. 2015-16
Mar. 2015-16
Jun. 2016-17
Sep. 2016-17
Dec. 2016-17
Mar. 2016-17
Jun. 2017-18
Sep. 2017-18
Dec. 2017-18
Mar. 2017-18
Jun.
Annual growth rate
2016-17 2017-18
Actual Forecast
Brisbane 4263 4232 4310 4652 4771 5091 4995 4928 4940 4952 4919 4982 13.3 0.0
Gold Coast 1129 1168 1198 1311 1363 1387 1408 1402 1399 1390 1401 1436 15.7 1.2
Sunshine Coast 731 654 721 761 794 762 720 708 724 740 751 781 4.1 0.4
West Moreton 125 111 112 122 125 140 134 135 137 141 141 144 13.4 5.6
Wide Bay/Burnett 345 294 288 301 312 324 316 332 319 316 315 325 4.6 -0.7
Darling Downs 609 585 576 646 645 583 540 538 545 566 549 553 -4.6 -4.0
South West 295 249 219 233 199 79 74 83 79 70 165 198 -56.4 17.7
Fitzroy 2046 1675 1522 1695 1537 1227 1283 1317 1303 1255 1150 1188 -22.7 -8.7
Central West 182 151 133 176 182 185 175 173 137 27 201 288 11.0 -8.4
Mackay 609 948 844 555 551 478 451 423 432 613 666 701 -35.6 26.8
Northern 447 395 381 416 415 449 428 426 462 502 516 573 4.8 19.5
Far North 350 331 334 357 365 375 358 361 374 392 408 439 6.4 10.5
North West 160 146 131 168 159 267 309 528 527 529 470 475 108.5 58.6
Queensland 11292 10941 10771 11395 11420 11346 11191 11353 11378 11494 11651 12083 2.1 2.9

Queensland region construction supply and demand analysis: 1995-2026 and quarterly indicators to June 2018 – June Annual Report 2016 118
Table 5.7 Value of work done: Total construction activity by region – chain volume measure 2013-14 reference year – Qtr. 3 2015-16 = 100
2015-16
Sep. 2015-16
Dec. 2015-16
Mar. 2015-16
Jun. 2016-17
Sep. 2016-17
Dec. 2016-17
Mar. 2016-17
Jun. 2017-18
Sep. 2017-18
Dec. 2017-18
Mar. 2017-18
Jun.
Actual Forecast
Brisbane 99 98 100 108 111 118 116 114 115 115 114 116
Gold Coast 94 98 100 109 114 116 117 117 117 116 117 120
Sunshine Coast 101 91 100 105 110 106 100 98 100 103 104 108
West Moreton 112 99 100 109 112 125 119 120 122 126 126 129
Wide Bay/Burnett 120 102 100 104 109 113 110 115 111 110 109 113
Darling Downs 106 102 100 112 112 101 94 93 95 98 95 96
South West 134 114 100 106 91 36 34 38 36 32 75 90
Fitzroy 134 110 100 111 101 81 84 87 86 82 76 78
Central West 136 114 100 132 137 138 131 129 103 21 151 216
Mackay 72 112 100 66 65 57 53 50 51 73 79 83
Northern 117 104 100 109 109 118 112 112 121 132 135 150
Far North 105 99 100 107 109 112 107 108 112 117 122 131
North West 122 111 100 129 121 204 236 403 402 404 359 362
Queensland 105 102 100 106 106 105 104 105 106 107 108 112

Queensland region construction supply and demand analysis: 1995-2026 and quarterly indicators to June 2018 – June Annual Report 2016 119
Table 5.8 Queensland construction industry – real quarterly price growth at annual rates (%)
2015-16
June 2015-
16September 2015-16
December 2015-16
March 2016-17
June 2016-17
September 2016-17
December 2016-17
March 2017-18
June
Average 2015-16 and
2017-18
Actual Forecast
Non-residential building 7.8 -2.6 -1.6 3.8 3.8 2.5 2.5 1.1 0.1 2.4
Residential building 4.3 -0.2 0.2 3.1 3.5 1.6 1.8 1.5 1.0 2.1
Engineering construction 4.3 3.7 -1.3 4.9 -1.1 6.1 3.1 0.1 0.1 1.5
Total construction 5.0 0.5 -0.6 3.8 2.2 3.1 2.3 1.0 0.5 1.9
Note: Real price/cost growth is the nominal rate of increase less the increase in the Queensland financial demand implicit deflator.
Table 5.9 Shortage of construction labour by Queensland region – number ‘000 (shortage is donated by (+) and surplus (-))
Mar-16 Jun-16 Sep-16 Dec-16 Mar-17 Jun-17 Sep-17 Dec-17 Mar-18 Jun-18
Brisbane -6.9 -4.2 -1.4 1.3 1.0 0.7 0.5 0.2 -1.3 -2.7
Gold Coast 3.5 4.7 5.9 7.0 7.0 6.9 6.8 6.8 6.8 6.7
Sunshine Coast 0.0 0.0 0.0 0.0 -0.1 -0.3 -0.4 -0.5 -0.3 -0.1
West Moreton -1.5 -1.4 -1.4 -1.3 -1.3 -1.3 -1.3 -1.2 -1.2 -1.2
Wide Bay/Burnett -1.9 -1.8 -1.8 -1.7 -1.7 -1.8 -1.8 -1.8 -1.8 -1.8
Darling Downs -3.7 -3.7 -3.8 -3.8 -3.9 -4.0 -4.1 -4.3 -4.3 -4.4
South West -0.6 -0.6 -0.7 -0.8 -0.8 -0.8 -0.8 -0.9 -0.8 -0.8
Fitzroy -7.0 -8.3 -9.5 -10.7 -11.6 -12.4 -13.2 -14.0 -14.0 -14.0
Central West 0.7 0.7 0.7 0.7 0.7 0.7 0.7 0.7 1.2 1.7
Mackay -5.9 -6.4 -6.9 -7.5 -7.4 -7.2 -7.1 -7.0 -6.9 -6.8
Northern -4.7 -4.7 -4.7 -4.6 -4.3 -3.9 -3.6 -3.2 -2.9 -2.6
Far North -4.1 -4.0 -4.0 -3.9 -3.7 -3.5 -3.3 -3.1 -2.6 -2.2
North West -0.3 0.0 0.3 0.7 1.2 1.8 2.3 2.9 2.4 1.9
Queensland -32.4 -29.8 -27.2 -24.7 -24.9 -25.1 -25.3 -25.6 -26.0 -26.5
Trend Queensland construction workers unemployed (‘000) 13.4 12.6 12.0 8.9 9.7 9.3 9.3 9.3 9.2 9.2

Queensland region construction supply and demand analysis: 1995-2026 and quarterly
indicators to June 2018 – June Annual Report 2016
120 120 120
Appendix A
Additional annual tables
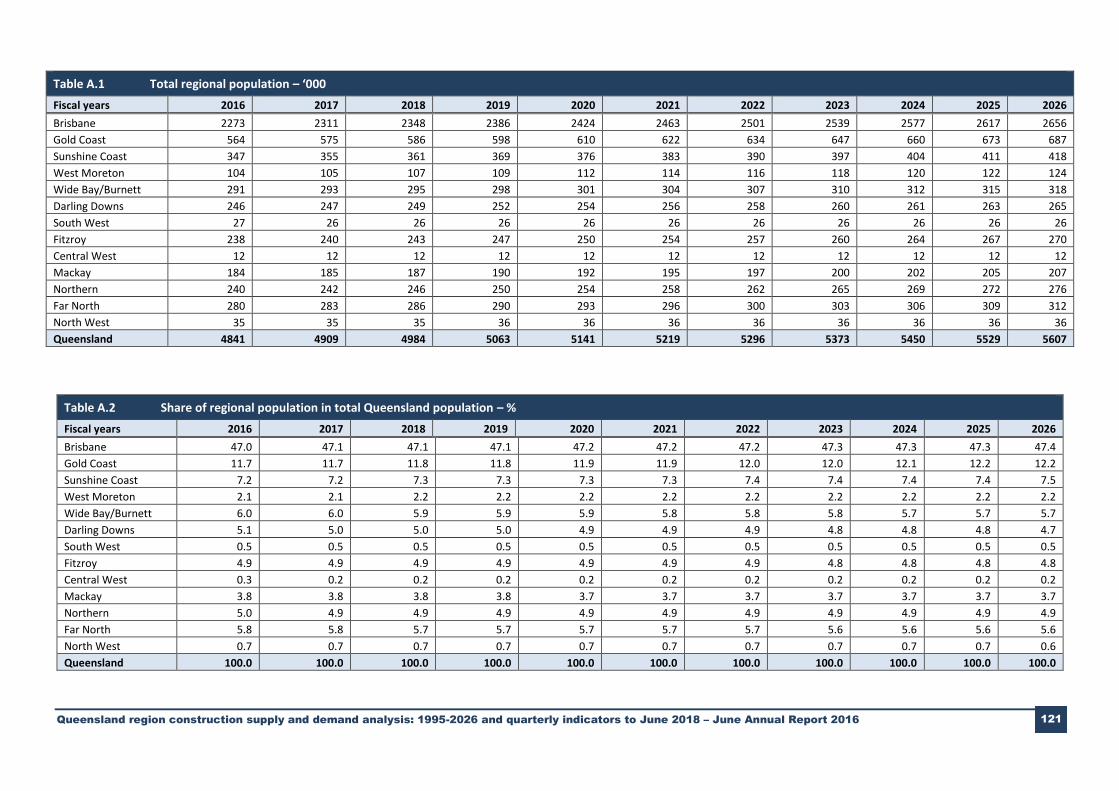
Queensland region construction supply and demand analysis: 1995-2026 and quarterly indicators to June 2018 – June Annual Report 2016 121
Table A.1 Total regional population – ‘000
Fiscal years 2016 2017 2018 2019 2020 2021 2022 2023 2024 2025 2026
Brisbane 2273 2311 2348 2386 2424 2463 2501 2539 2577 2617 2656
Gold Coast 564 575 586 598 610 622 634 647 660 673 687
Sunshine Coast 347 355 361 369 376 383 390 397 404 411 418
West Moreton 104 105 107 109 112 114 116 118 120 122 124
Wide Bay/Burnett 291 293 295 298 301 304 307 310 312 315 318
Darling Downs 246 247 249 252 254 256 258 260 261 263 265
South West 27 26 26 26 26 26 26 26 26 26 26
Fitzroy 238 240 243 247 250 254 257 260 264 267 270
Central West 12 12 12 12 12 12 12 12 12 12 12
Mackay 184 185 187 190 192 195 197 200 202 205 207
Northern 240 242 246 250 254 258 262 265 269 272 276
Far North 280 283 286 290 293 296 300 303 306 309 312
North West 35 35 35 36 36 36 36 36 36 36 36
Queensland 4841 4909 4984 5063 5141 5219 5296 5373 5450 5529 5607
Table A.2 Share of regional population in total Queensland population – %
Fiscal years 2016 2017 2018 2019 2020 2021 2022 2023 2024 2025 2026
Brisbane 47.0 47.1 47.1 47.1 47.2 47.2 47.2 47.3 47.3 47.3 47.4
Gold Coast 11.7 11.7 11.8 11.8 11.9 11.9 12.0 12.0 12.1 12.2 12.2
Sunshine Coast 7.2 7.2 7.3 7.3 7.3 7.3 7.4 7.4 7.4 7.4 7.5
West Moreton 2.1 2.1 2.2 2.2 2.2 2.2 2.2 2.2 2.2 2.2 2.2
Wide Bay/Burnett 6.0 6.0 5.9 5.9 5.9 5.8 5.8 5.8 5.7 5.7 5.7
Darling Downs 5.1 5.0 5.0 5.0 4.9 4.9 4.9 4.8 4.8 4.8 4.7
South West 0.5 0.5 0.5 0.5 0.5 0.5 0.5 0.5 0.5 0.5 0.5
Fitzroy 4.9 4.9 4.9 4.9 4.9 4.9 4.9 4.8 4.8 4.8 4.8
Central West 0.3 0.2 0.2 0.2 0.2 0.2 0.2 0.2 0.2 0.2 0.2
Mackay 3.8 3.8 3.8 3.8 3.7 3.7 3.7 3.7 3.7 3.7 3.7
Northern 5.0 4.9 4.9 4.9 4.9 4.9 4.9 4.9 4.9 4.9 4.9
Far North 5.8 5.8 5.7 5.7 5.7 5.7 5.7 5.6 5.6 5.6 5.6
North West 0.7 0.7 0.7 0.7 0.7 0.7 0.7 0.7 0.7 0.7 0.6
Queensland 100.0 100.0 100.0 100.0 100.0 100.0 100.0 100.0 100.0 100.0 100.0

Queensland region construction supply and demand analysis: 1995-2026 and quarterly indicators to June 2018 – June Annual Report 2016 122
Table A.3(a) Total Queensland construction by region – share of residential activity in total regional activity (%)
Fiscal years 2007 2008 2009 2010 2011 2012 2013 2014 2015 2016 2017 2018 2019 2020 2021 2022 2023 2024 2025 2026
Brisbane 50.0 43.0 37.2 38.9 39.2 37.9 36.4 38.5 48.6 59.1 57.0 56.8 56.0 51.7 48.9 50.6 52.8 53.9 55.3 54.0
Gold Coast 65.3 59.2 56.2 54.0 42.6 41.8 43.4 43.6 47.5 57.9 58.6 60.2 60.8 58.5 57.8 59.5 60.8 62.7 63.9 63.1
Sunshine Coast 67.9 65.7 61.9 57.7 40.1 41.9 47.0 40.6 46.9 60.5 61.8 64.1 65.8 64.1 63.5 64.5 65.2 66.7 67.9 66.2
West Moreton 50.4 48.0 42.6 38.8 46.1 49.3 52.3 46.6 50.7 59.3 54.9 58.5 59.6 53.4 50.9 47.1 47.4 49.6 50.3 46.9
Wide Bay/Burnett 61.6 62.6 61.7 60.7 55.5 49.7 44.9 49.3 49.4 58.6 57.8 64.5 67.0 64.9 62.9 59.3 58.8 60.5 62.5 60.0
Darling Downs 28.0 25.7 24.3 31.6 23.2 17.0 14.5 12.8 23.5 26.9 26.9 30.1 33.5 34.6 32.0 32.9 31.6 19.9 18.1 16.6
South West 15.9 6.2 5.2 9.7 4.9 2.4 2.5 2.1 2.7 4.0 7.2 7.6 5.6 5.1 9.1 9.7 6.1 6.9 9.9 13.1
Fitzroy 27.6 30.6 19.8 15.8 11.1 5.6 6.0 6.1 5.3 7.0 8.6 12.2 15.5 14.0 14.5 15.0 16.5 19.2 16.5 15.6
Central West 11.7 12.7 12.3 13.2 11.4 8.8 4.7 3.1 1.7 1.8 1.4 2.2 0.7 9.0 8.6 8.3 2.1 0.6 0.7 1.2
Mackay 27.3 27.2 20.4 24.3 19.8 10.7 11.1 11.6 14.2 14.3 19.9 19.6 20.4 22.9 24.6 23.7 24.2 22.6 18.3 16.7
Northern 42.0 41.2 43.3 39.7 34.9 29.5 26.2 26.1 36.6 41.3 33.2 33.5 34.1 33.8 37.1 40.2 38.5 31.9 35.6 36.9
Far North 58.6 59.8 46.8 42.9 40.9 38.4 37.5 38.4 42.9 53.6 53.1 55.0 57.7 56.9 56.2 56.5 52.9 37.6 36.2 42.6
North West 4.5 6.0 5.5 6.7 4.6 3.1 2.2 2.4 4.1 4.2 2.2 2.4 8.3 7.8 7.5 8.5 10.5 6.4 4.2 2.7
Queensland 48.6 44.5 38.8 39.1 33.4 25.5 22.3 22.0 30.8 42.5 44.8 45.3 45.6 44.8 44.1 45.2 45.7 42.6 42.0 41.2
Table A.3(b) Total Queensland construction by region – share of non-residential activity in total regional activity (%)
Fiscal years 2007 2008 2009 2010 2011 2012 2013 2014 2015 2016 2017 2018 2019 2020 2021 2022 2023 2024 2025 2026
Brisbane 21.3 21.0 21.4 20.1 19.9 20.8 20.7 18.4 17.8 20.0 18.0 18.7 20.0 19.6 21.5 21.4 21.6 22.1 19.7 19.2
Gold Coast 14.9 13.0 11.4 17.9 28.9 19.6 15.9 17.5 21.8 22.8 19.4 17.1 15.6 14.3 15.4 15.4 15.3 15.4 13.1 12.9
Sunshine Coast 14.2 11.6 11.0 10.9 8.0 8.9 14.0 23.2 22.8 15.5 12.2 12.1 12.8 12.3 13.5 13.3 13.3 13.7 12.0 11.9
West Moreton 15.1 12.6 24.7 33.9 19.3 9.5 7.8 9.1 6.8 7.4 10.0 13.6 16.0 16.0 18.6 16.3 15.8 16.8 15.5 13.9
Wide Bay/Burnett 12.1 10.2 11.4 13.6 17.1 12.2 7.9 12.7 14.1 15.8 18.9 18.6 17.8 17.0 18.6 16.7 16.2 16.9 15.5 15.3
Darling Downs 8.3 8.0 6.5 7.8 7.8 5.8 4.3 5.4 11.5 19.4 18.5 18.4 17.9 15.5 14.2 12.8 11.3 7.0 5.7 5.5
South West 6.7 1.9 1.9 4.5 3.7 1.4 1.4 1.4 1.6 2.2 5.1 4.3 2.8 2.4 4.9 5.1 3.2 3.8 4.8 6.3
Fitzroy 6.4 7.2 5.8 5.5 4.4 2.2 3.5 4.4 3.1 2.5 3.1 4.1 5.0 4.7 5.6 5.9 6.6 7.8 5.7 5.5
Central West 6.3 4.4 6.5 7.5 10.1 6.9 3.0 3.2 1.4 1.0 2.5 2.3 0.7 9.4 9.7 9.4 2.3 0.7 0.7 1.2
Mackay 7.7 8.0 7.5 9.6 16.0 7.4 4.5 4.8 6.0 5.8 4.8 5.5 5.8 6.7 8.3 8.0 8.1 7.5 5.1 4.6
Northern 17.0 16.9 16.9 18.4 20.4 15.6 19.2 18.5 12.6 19.1 20.7 20.1 19.1 17.6 20.7 22.1 20.8 17.1 16.6 17.6
Far North 13.8 13.5 22.6 27.0 20.2 20.9 18.7 10.8 9.8 10.7 10.5 14.4 15.5 15.9 18.2 18.1 16.6 11.6 9.3 10.7
North West 3.4 4.4 3.3 3.9 5.4 4.2 3.9 5.8 9.4 4.2 1.6 1.1 4.1 4.1 4.8 5.8 7.4 4.7 2.7 1.7
Queensland 15.7 15.2 15.6 16.7 16.5 12.2 10.8 10.6 12.2 14.8 14.5 14.6 14.9 14.8 16.5 16.3 16.0 14.9 12.6 12.4
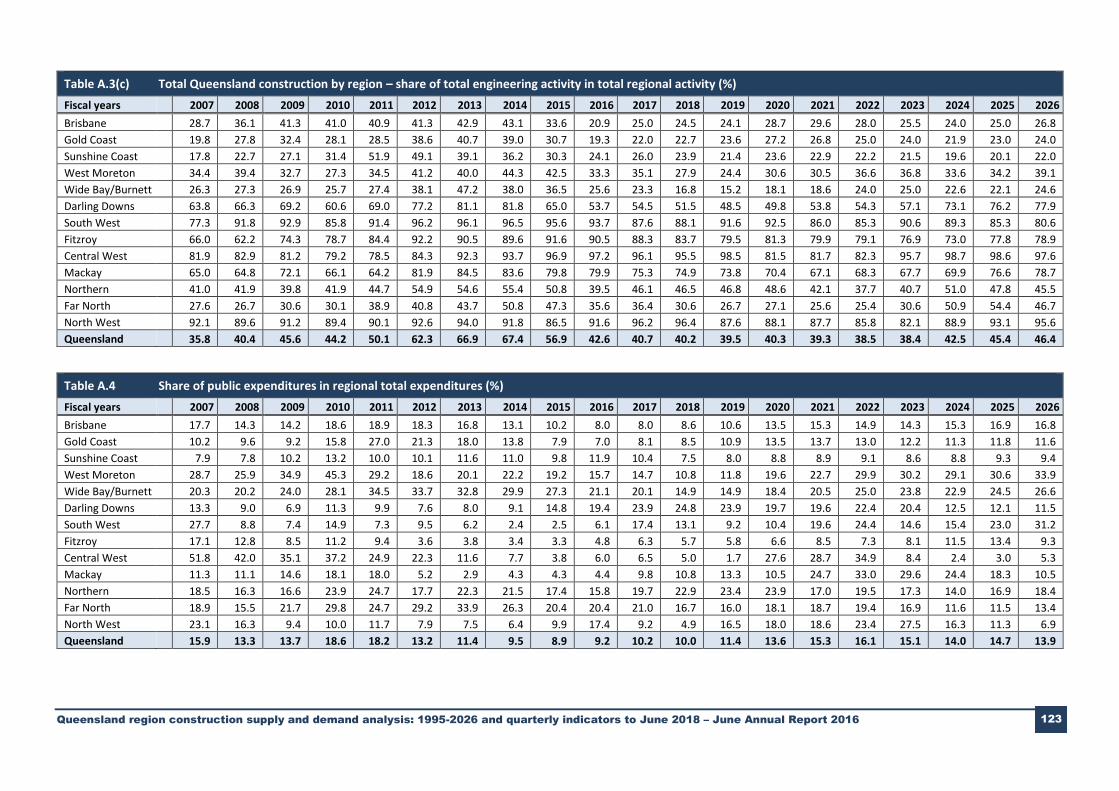
Queensland region construction supply and demand analysis: 1995-2026 and quarterly indicators to June 2018 – June Annual Report 2016 123
Table A.3(c) Total Queensland construction by region – share of total engineering activity in total regional activity (%)
Fiscal years 2007 2008 2009 2010 2011 2012 2013 2014 2015 2016 2017 2018 2019 2020 2021 2022 2023 2024 2025 2026
Brisbane 28.7 36.1 41.3 41.0 40.9 41.3 42.9 43.1 33.6 20.9 25.0 24.5 24.1 28.7 29.6 28.0 25.5 24.0 25.0 26.8
Gold Coast 19.8 27.8 32.4 28.1 28.5 38.6 40.7 39.0 30.7 19.3 22.0 22.7 23.6 27.2 26.8 25.0 24.0 21.9 23.0 24.0
Sunshine Coast 17.8 22.7 27.1 31.4 51.9 49.1 39.1 36.2 30.3 24.1 26.0 23.9 21.4 23.6 22.9 22.2 21.5 19.6 20.1 22.0
West Moreton 34.4 39.4 32.7 27.3 34.5 41.2 40.0 44.3 42.5 33.3 35.1 27.9 24.4 30.6 30.5 36.6 36.8 33.6 34.2 39.1
Wide Bay/Burnett 26.3 27.3 26.9 25.7 27.4 38.1 47.2 38.0 36.5 25.6 23.3 16.8 15.2 18.1 18.6 24.0 25.0 22.6 22.1 24.6
Darling Downs 63.8 66.3 69.2 60.6 69.0 77.2 81.1 81.8 65.0 53.7 54.5 51.5 48.5 49.8 53.8 54.3 57.1 73.1 76.2 77.9
South West 77.3 91.8 92.9 85.8 91.4 96.2 96.1 96.5 95.6 93.7 87.6 88.1 91.6 92.5 86.0 85.3 90.6 89.3 85.3 80.6
Fitzroy 66.0 62.2 74.3 78.7 84.4 92.2 90.5 89.6 91.6 90.5 88.3 83.7 79.5 81.3 79.9 79.1 76.9 73.0 77.8 78.9
Central West 81.9 82.9 81.2 79.2 78.5 84.3 92.3 93.7 96.9 97.2 96.1 95.5 98.5 81.5 81.7 82.3 95.7 98.7 98.6 97.6
Mackay 65.0 64.8 72.1 66.1 64.2 81.9 84.5 83.6 79.8 79.9 75.3 74.9 73.8 70.4 67.1 68.3 67.7 69.9 76.6 78.7
Northern 41.0 41.9 39.8 41.9 44.7 54.9 54.6 55.4 50.8 39.5 46.1 46.5 46.8 48.6 42.1 37.7 40.7 51.0 47.8 45.5
Far North 27.6 26.7 30.6 30.1 38.9 40.8 43.7 50.8 47.3 35.6 36.4 30.6 26.7 27.1 25.6 25.4 30.6 50.9 54.4 46.7
North West 92.1 89.6 91.2 89.4 90.1 92.6 94.0 91.8 86.5 91.6 96.2 96.4 87.6 88.1 87.7 85.8 82.1 88.9 93.1 95.6
Queensland 35.8 40.4 45.6 44.2 50.1 62.3 66.9 67.4 56.9 42.6 40.7 40.2 39.5 40.3 39.3 38.5 38.4 42.5 45.4 46.4
Table A.4 Share of public expenditures in regional total expenditures (%)
Fiscal years 2007 2008 2009 2010 2011 2012 2013 2014 2015 2016 2017 2018 2019 2020 2021 2022 2023 2024 2025 2026
Brisbane 17.7 14.3 14.2 18.6 18.9 18.3 16.8 13.1 10.2 8.0 8.0 8.6 10.6 13.5 15.3 14.9 14.3 15.3 16.9 16.8
Gold Coast 10.2 9.6 9.2 15.8 27.0 21.3 18.0 13.8 7.9 7.0 8.1 8.5 10.9 13.5 13.7 13.0 12.2 11.3 11.8 11.6
Sunshine Coast 7.9 7.8 10.2 13.2 10.0 10.1 11.6 11.0 9.8 11.9 10.4 7.5 8.0 8.8 8.9 9.1 8.6 8.8 9.3 9.4
West Moreton 28.7 25.9 34.9 45.3 29.2 18.6 20.1 22.2 19.2 15.7 14.7 10.8 11.8 19.6 22.7 29.9 30.2 29.1 30.6 33.9
Wide Bay/Burnett 20.3 20.2 24.0 28.1 34.5 33.7 32.8 29.9 27.3 21.1 20.1 14.9 14.9 18.4 20.5 25.0 23.8 22.9 24.5 26.6
Darling Downs 13.3 9.0 6.9 11.3 9.9 7.6 8.0 9.1 14.8 19.4 23.9 24.8 23.9 19.7 19.6 22.4 20.4 12.5 12.1 11.5
South West 27.7 8.8 7.4 14.9 7.3 9.5 6.2 2.4 2.5 6.1 17.4 13.1 9.2 10.4 19.6 24.4 14.6 15.4 23.0 31.2
Fitzroy 17.1 12.8 8.5 11.2 9.4 3.6 3.8 3.4 3.3 4.8 6.3 5.7 5.8 6.6 8.5 7.3 8.1 11.5 13.4 9.3
Central West 51.8 42.0 35.1 37.2 24.9 22.3 11.6 7.7 3.8 6.0 6.5 5.0 1.7 27.6 28.7 34.9 8.4 2.4 3.0 5.3
Mackay 11.3 11.1 14.6 18.1 18.0 5.2 2.9 4.3 4.3 4.4 9.8 10.8 13.3 10.5 24.7 33.0 29.6 24.4 18.3 10.5
Northern 18.5 16.3 16.6 23.9 24.7 17.7 22.3 21.5 17.4 15.8 19.7 22.9 23.4 23.9 17.0 19.5 17.3 14.0 16.9 18.4
Far North 18.9 15.5 21.7 29.8 24.7 29.2 33.9 26.3 20.4 20.4 21.0 16.7 16.0 18.1 18.7 19.4 16.9 11.6 11.5 13.4
North West 23.1 16.3 9.4 10.0 11.7 7.9 7.5 6.4 9.9 17.4 9.2 4.9 16.5 18.0 18.6 23.4 27.5 16.3 11.3 6.9
Queensland 15.9 13.3 13.7 18.6 18.2 13.2 11.4 9.5 8.9 9.2 10.2 10.0 11.4 13.6 15.3 16.1 15.1 14.0 14.7 13.9
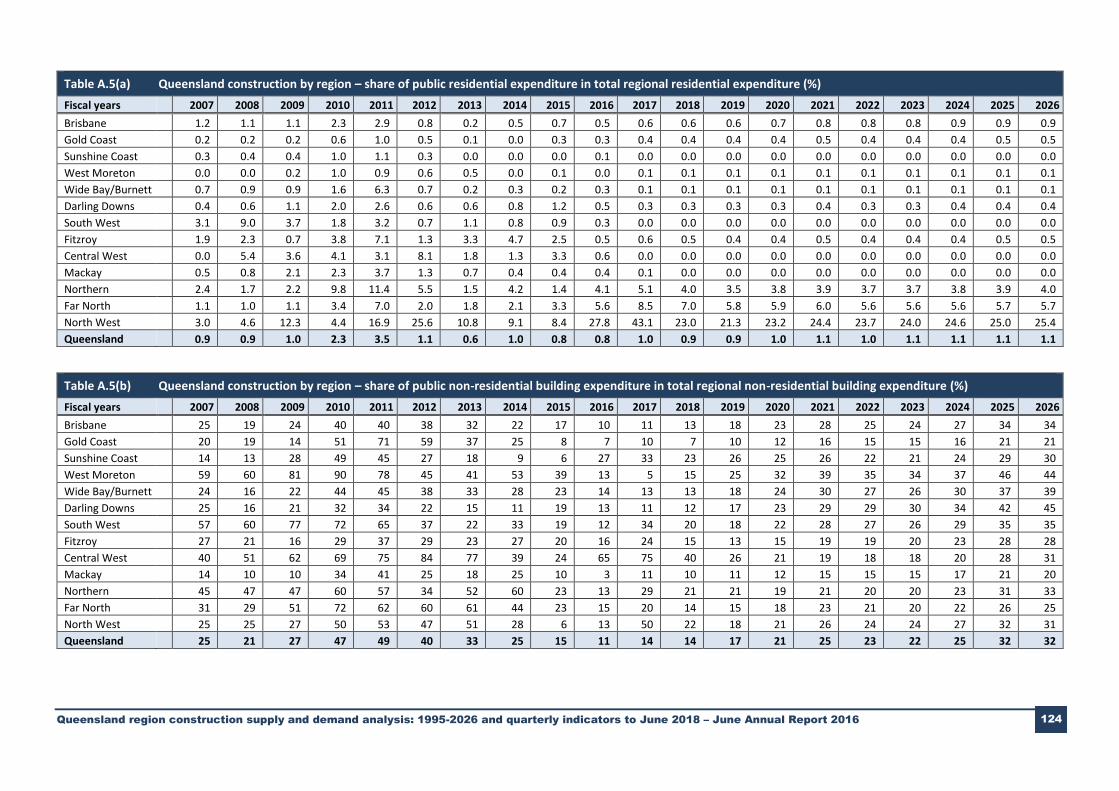
Queensland region construction supply and demand analysis: 1995-2026 and quarterly indicators to June 2018 – June Annual Report 2016 124
Table A.5(a) Queensland construction by region – share of public residential expenditure in total regional residential expenditure (%)
Fiscal years 2007 2008 2009 2010 2011 2012 2013 2014 2015 2016 2017 2018 2019 2020 2021 2022 2023 2024 2025 2026
Brisbane 1.2 1.1 1.1 2.3 2.9 0.8 0.2 0.5 0.7 0.5 0.6 0.6 0.6 0.7 0.8 0.8 0.8 0.9 0.9 0.9
Gold Coast 0.2 0.2 0.2 0.6 1.0 0.5 0.1 0.0 0.3 0.3 0.4 0.4 0.4 0.4 0.5 0.4 0.4 0.4 0.5 0.5
Sunshine Coast 0.3 0.4 0.4 1.0 1.1 0.3 0.0 0.0 0.0 0.1 0.0 0.0 0.0 0.0 0.0 0.0 0.0 0.0 0.0 0.0
West Moreton 0.0 0.0 0.2 1.0 0.9 0.6 0.5 0.0 0.1 0.0 0.1 0.1 0.1 0.1 0.1 0.1 0.1 0.1 0.1 0.1
Wide Bay/Burnett 0.7 0.9 0.9 1.6 6.3 0.7 0.2 0.3 0.2 0.3 0.1 0.1 0.1 0.1 0.1 0.1 0.1 0.1 0.1 0.1
Darling Downs 0.4 0.6 1.1 2.0 2.6 0.6 0.6 0.8 1.2 0.5 0.3 0.3 0.3 0.3 0.4 0.3 0.3 0.4 0.4 0.4
South West 3.1 9.0 3.7 1.8 3.2 0.7 1.1 0.8 0.9 0.3 0.0 0.0 0.0 0.0 0.0 0.0 0.0 0.0 0.0 0.0
Fitzroy 1.9 2.3 0.7 3.8 7.1 1.3 3.3 4.7 2.5 0.5 0.6 0.5 0.4 0.4 0.5 0.4 0.4 0.4 0.5 0.5
Central West 0.0 5.4 3.6 4.1 3.1 8.1 1.8 1.3 3.3 0.6 0.0 0.0 0.0 0.0 0.0 0.0 0.0 0.0 0.0 0.0
Mackay 0.5 0.8 2.1 2.3 3.7 1.3 0.7 0.4 0.4 0.4 0.1 0.0 0.0 0.0 0.0 0.0 0.0 0.0 0.0 0.0
Northern 2.4 1.7 2.2 9.8 11.4 5.5 1.5 4.2 1.4 4.1 5.1 4.0 3.5 3.8 3.9 3.7 3.7 3.8 3.9 4.0
Far North 1.1 1.0 1.1 3.4 7.0 2.0 1.8 2.1 3.3 5.6 8.5 7.0 5.8 5.9 6.0 5.6 5.6 5.6 5.7 5.7
North West 3.0 4.6 12.3 4.4 16.9 25.6 10.8 9.1 8.4 27.8 43.1 23.0 21.3 23.2 24.4 23.7 24.0 24.6 25.0 25.4
Queensland 0.9 0.9 1.0 2.3 3.5 1.1 0.6 1.0 0.8 0.8 1.0 0.9 0.9 1.0 1.1 1.0 1.1 1.1 1.1 1.1
Table A.5(b) Queensland construction by region – share of public non-residential building expenditure in total regional non-residential building expenditure (%)
Fiscal years 2007 2008 2009 2010 2011 2012 2013 2014 2015 2016 2017 2018 2019 2020 2021 2022 2023 2024 2025 2026
Brisbane 25 19 24 40 40 38 32 22 17 10 11 13 18 23 28 25 24 27 34 34
Gold Coast 20 19 14 51 71 59 37 25 8 7 10 7 10 12 16 15 15 16 21 21
Sunshine Coast 14 13 28 49 45 27 18 9 6 27 33 23 26 25 26 22 21 24 29 30
West Moreton 59 60 81 90 78 45 41 53 39 13 5 15 25 32 39 35 34 37 46 44
Wide Bay/Burnett 24 16 22 44 45 38 33 28 23 14 13 13 18 24 30 27 26 30 37 39
Darling Downs 25 16 21 32 34 22 15 11 19 13 11 12 17 23 29 29 30 34 42 45
South West 57 60 77 72 65 37 22 33 19 12 34 20 18 22 28 27 26 29 35 35
Fitzroy 27 21 16 29 37 29 23 27 20 16 24 15 13 15 19 19 20 23 28 28
Central West 40 51 62 69 75 84 77 39 24 65 75 40 26 21 19 18 18 20 28 31
Mackay 14 10 10 34 41 25 18 25 10 3 11 10 11 12 15 15 15 17 21 20
Northern 45 47 47 60 57 34 52 60 23 13 29 21 21 19 21 20 20 23 31 33
Far North 31 29 51 72 62 60 61 44 23 15 20 14 15 18 23 21 20 22 26 25
North West 25 25 27 50 53 47 51 28 6 13 50 22 18 21 26 24 24 27 32 31
Queensland 25 21 27 47 49 40 33 25 15 11 14 14 17 21 25 23 22 25 32 32
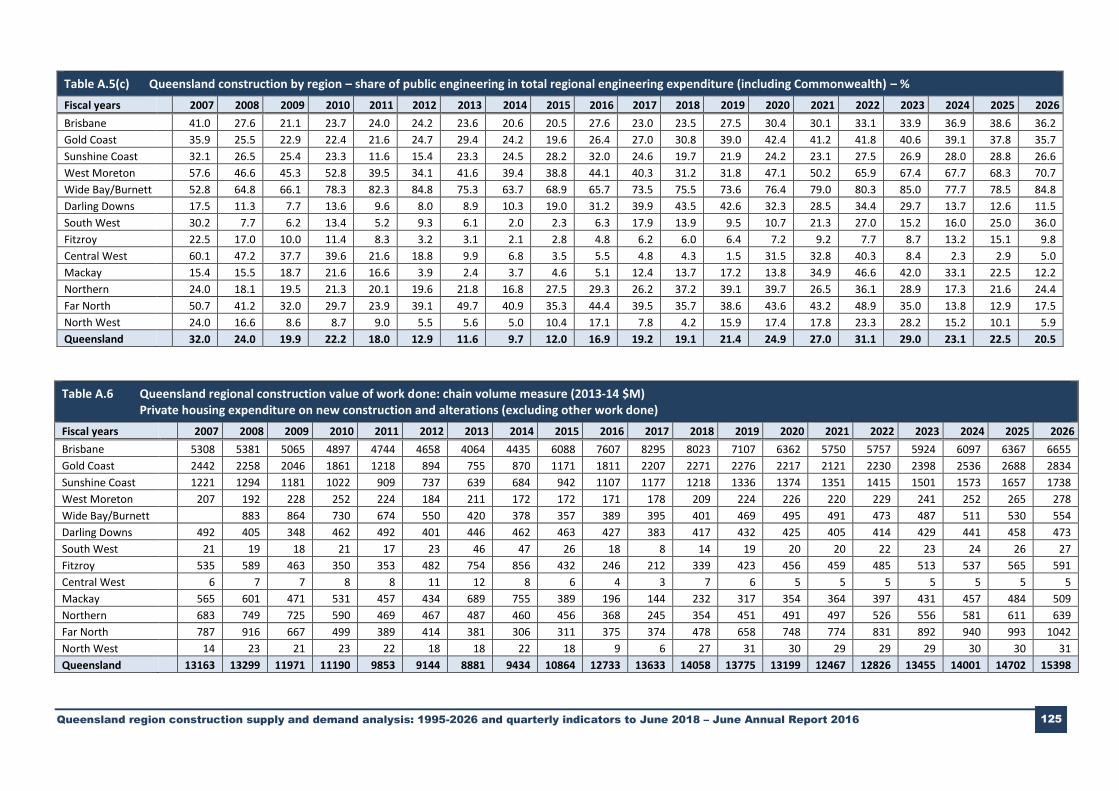
Queensland region construction supply and demand analysis: 1995-2026 and quarterly indicators to June 2018 – June Annual Report 2016 125
Table A.5(c) Queensland construction by region – share of public engineering in total regional engineering expenditure (including Commonwealth) – %
Fiscal years 2007 2008 2009 2010 2011 2012 2013 2014 2015 2016 2017 2018 2019 2020 2021 2022 2023 2024 2025 2026
Brisbane 41.0 27.6 21.1 23.7 24.0 24.2 23.6 20.6 20.5 27.6 23.0 23.5 27.5 30.4 30.1 33.1 33.9 36.9 38.6 36.2
Gold Coast 35.9 25.5 22.9 22.4 21.6 24.7 29.4 24.2 19.6 26.4 27.0 30.8 39.0 42.4 41.2 41.8 40.6 39.1 37.8 35.7
Sunshine Coast 32.1 26.5 25.4 23.3 11.6 15.4 23.3 24.5 28.2 32.0 24.6 19.7 21.9 24.2 23.1 27.5 26.9 28.0 28.8 26.6
West Moreton 57.6 46.6 45.3 52.8 39.5 34.1 41.6 39.4 38.8 44.1 40.3 31.2 31.8 47.1 50.2 65.9 67.4 67.7 68.3 70.7
Wide Bay/Burnett 52.8 64.8 66.1 78.3 82.3 84.8 75.3 63.7 68.9 65.7 73.5 75.5 73.6 76.4 79.0 80.3 85.0 77.7 78.5 84.8
Darling Downs 17.5 11.3 7.7 13.6 9.6 8.0 8.9 10.3 19.0 31.2 39.9 43.5 42.6 32.3 28.5 34.4 29.7 13.7 12.6 11.5
South West 30.2 7.7 6.2 13.4 5.2 9.3 6.1 2.0 2.3 6.3 17.9 13.9 9.5 10.7 21.3 27.0 15.2 16.0 25.0 36.0
Fitzroy 22.5 17.0 10.0 11.4 8.3 3.2 3.1 2.1 2.8 4.8 6.2 6.0 6.4 7.2 9.2 7.7 8.7 13.2 15.1 9.8
Central West 60.1 47.2 37.7 39.6 21.6 18.8 9.9 6.8 3.5 5.5 4.8 4.3 1.5 31.5 32.8 40.3 8.4 2.3 2.9 5.0
Mackay 15.4 15.5 18.7 21.6 16.6 3.9 2.4 3.7 4.6 5.1 12.4 13.7 17.2 13.8 34.9 46.6 42.0 33.1 22.5 12.2
Northern 24.0 18.1 19.5 21.3 20.1 19.6 21.8 16.8 27.5 29.3 26.2 37.2 39.1 39.7 26.5 36.1 28.9 17.3 21.6 24.4
Far North 50.7 41.2 32.0 29.7 23.9 39.1 49.7 40.9 35.3 44.4 39.5 35.7 38.6 43.6 43.2 48.9 35.0 13.8 12.9 17.5
North West 24.0 16.6 8.6 8.7 9.0 5.5 5.6 5.0 10.4 17.1 7.8 4.2 15.9 17.4 17.8 23.3 28.2 15.2 10.1 5.9
Queensland 32.0 24.0 19.9 22.2 18.0 12.9 11.6 9.7 12.0 16.9 19.2 19.1 21.4 24.9 27.0 31.1 29.0 23.1 22.5 20.5
Table A.6 Queensland regional construction value of work done: chain volume measure (2013-14 $M) Private housing expenditure on new construction and alterations (excluding other work done)
Fiscal years 2007 2008 2009 2010 2011 2012 2013 2014 2015 2016 2017 2018 2019 2020 2021 2022 2023 2024 2025 2026
Brisbane 5308 5381 5065 4897 4744 4658 4064 4435 6088 7607 8295 8023 7107 6362 5750 5757 5924 6097 6367 6655
Gold Coast 2442 2258 2046 1861 1218 894 755 870 1171 1811 2207 2271 2276 2217 2121 2230 2398 2536 2688 2834
Sunshine Coast 1221 1294 1181 1022 909 737 639 684 942 1107 1177 1218 1336 1374 1351 1415 1501 1573 1657 1738
West Moreton 207 192 228 252 224 184 211 172 172 171 178 209 224 226 220 229 241 252 265 278
Wide Bay/Burnett 883 864 730 674 550 420 378 357 389 395 401 469 495 491 473 487 511 530 554
Darling Downs 492 405 348 462 492 401 446 462 463 427 383 417 432 425 405 414 429 441 458 473
South West 21 19 18 21 17 23 46 47 26 18 8 14 19 20 20 22 23 24 26 27
Fitzroy 535 589 463 350 353 482 754 856 432 246 212 339 423 456 459 485 513 537 565 591
Central West 6 7 7 8 8 11 12 8 6 4 3 7 6 5 5 5 5 5 5 5
Mackay 565 601 471 531 457 434 689 755 389 196 144 232 317 354 364 397 431 457 484 509
Northern 683 749 725 590 469 467 487 460 456 368 245 354 451 491 497 526 556 581 611 639
Far North 787 916 667 499 389 414 381 306 311 375 374 478 658 748 774 831 892 940 993 1042
North West 14 23 21 23 22 18 18 22 18 9 6 27 31 30 29 29 29 30 30 31
Queensland 13163 13299 11971 11190 9853 9144 8881 9434 10864 12733 13633 14058 13775 13199 12467 12826 13455 14001 14702 15398

Queensland region construction supply and demand analysis: 1995-2026 and quarterly indicators to June 2018 – June Annual Report 2016 126
Table A.7 Queensland regional construction value of work done: chain volume measure (2013-14 $M) – Public housing
Fiscal years 2007 2008 2009 2010 2011 2012 2013 2014 2015 2016 2017 2018 2019 2020 2021 2022 2023 2024 2025 2026
Brisbane 102 90 90 183 233 59 16 32 58 50 67 63 65 74 78 77 82 87 93 99
Gold Coast 8 7 6 18 23 9 2 0 5 8 13 12 13 15 16 15 16 18 19 20
Sunshine Coast 6 9 8 17 17 4 0 0 0 2 0 0 0 0 0 0 0 0 0 0
West Moreton 0 0 1 4 3 2 2 0 0 0 0 0 0 0 0 0 0 0 0 0
Wide Bay/Burnett 9 11 9 17 61 5 1 2 2 2 1 1 1 1 1 1 1 1 1 1
Darling Downs 3 4 6 14 20 4 4 5 8 3 2 2 2 2 2 2 3 3 3 3
South West 1 4 1 1 1 0 1 1 0 0 0 0 0 0 0 0 0 0 0 0
Fitzroy 14 19 5 23 45 10 32 53 16 2 3 3 3 3 3 3 4 4 4 4
Central West 0 1 1 1 1 2 0 0 0 0 0 0 0 0 0 0 0 0 0 0
Mackay 4 7 14 18 25 8 6 4 2 2 0 0 0 0 0 0 0 0 0 0
Northern 24 18 22 98 95 42 11 31 10 28 29 28 28 32 34 34 35 38 40 43
Far North 13 14 12 31 54 15 12 13 21 42 66 62 64 72 76 74 78 83 88 94
North West 1 2 4 2 6 9 3 3 2 7 12 11 11 13 13 13 14 14 15 16
Queensland 185 186 180 426 584 168 90 144 126 146 193 183 188 212 224 221 233 249 265 281
Table A.8 Queensland regional construction value of work done: chain volume measure (2013-14 $M) – Non-residential building private
Fiscal years 2007 2008 2009 2010 2011 2012 2013 2014 2015 2016 2017 2018 2019 2020 2021 2022 2023 2024 2025 2026
Brisbane 2676 3311 3461 2465 2415 2628 2503 2527 2605 3163 3185 3206 3086 2923 3017 3065 3091 3047 2486 2562
Gold Coast 680 617 556 492 444 344 361 525 870 1013 976 894 806 747 768 789 812 814 674 703
Sunshine Coast 366 317 245 175 172 204 284 650 693 326 245 279 301 309 339 362 381 386 322 337
West Moreton 41 32 37 33 31 32 27 25 22 30 51 65 71 73 79 83 86 86 70 73
Wide Bay/Burnett 193 172 160 136 163 117 79 120 152 168 212 206 189 176 179 183 187 186 153 159
Darling Downs 164 166 120 119 175 190 169 247 265 407 379 356 310 243 216 195 183 174 140 145
South West 8 5 3 5 11 19 29 29 23 20 15 18 18 17 18 19 20 21 18 19
Fitzroy 131 154 170 151 160 211 436 579 307 147 128 170 197 209 232 250 265 269 224 235
Central West 4 2 3 3 4 3 3 9 8 2 4 9 11 12 12 13 12 12 10 10
Mackay 189 218 229 200 319 321 287 298 227 164 81 119 144 159 180 194 205 207 172 178
Northern 226 231 217 186 208 261 256 209 192 273 254 324 358 361 385 401 412 409 334 344
Far North 195 213 252 164 144 159 129 98 109 126 122 200 250 275 310 336 354 357 296 307
North West 14 18 15 10 20 25 26 60 64 22 10 18 22 23 26 28 30 31 26 27
Queensland 4888 5458 5468 4138 4266 4514 4588 5375 5537 5860 5661 5863 5763 5526 5762 5918 6039 5999 4926 5098

Queensland region construction supply and demand analysis: 1995-2026 and quarterly indicators to June 2018 – June Annual Report 2016 127
Table A.9 Queensland regional construction value of work done: chain volume measure (2013-14 $M) – Non-residential building public
Fiscal years 2007 2008 2009 2010 2011 2012 2013 2014 2015 2016 2017 2018 2019 2020 2021 2022 2023 2024 2025 2026
Brisbane 903 755 1072 1635 1590 1643 1162 712 516 334 377 499 698 854 1162 1002 972 1138 1289 1349
Gold Coast 166 142 92 523 1076 501 217 177 75 81 106 71 86 101 143 138 138 160 182 191
Sunshine Coast 61 48 94 165 138 76 63 63 42 118 119 83 106 105 122 104 102 121 134 146
West Moreton 58 49 160 293 112 26 19 28 14 5 3 12 24 34 52 45 44 51 60 58
Wide Bay/Burnett 59 32 44 106 136 73 39 48 45 26 31 32 42 54 76 68 67 79 90 100
Darling Downs 53 33 31 55 91 55 29 31 63 61 49 50 65 71 90 78 77 91 103 120
South West 10 8 11 14 21 11 8 14 5 3 8 4 4 5 7 7 7 9 10 10
Fitzroy 48 42 33 61 92 84 131 217 76 28 39 31 30 36 56 60 65 79 85 91
Central West 3 3 5 6 12 16 10 6 3 4 13 6 4 3 3 3 3 3 4 4
Mackay 31 24 25 104 224 108 65 98 24 6 10 14 17 21 33 34 35 41 45 46
Northern 186 209 190 280 279 137 278 318 57 41 102 88 93 86 102 100 102 122 149 169
Far North 88 87 259 416 236 235 205 76 33 21 31 32 44 62 95 88 86 98 105 104
North West 5 6 5 10 23 22 27 23 4 3 10 5 5 6 9 9 10 11 12 13
Queensland 1671 1437 2020 3667 4030 2985 2252 1810 958 732 896 925 1216 1438 1948 1735 1709 2004 2269 2401
Table A.10 Queensland regional construction value of work done: chain volume measure (2013-14 $M) – Private engineering
Fiscal years 2007 2008 2009 2010 2011 2012 2013 2014 2015 2016 2017 2018 2019 2020 2021 2022 2023 2024 2025 2026
Brisbane 2845 5064 6904 6371 6266 6416 5791 6015 4671 2640 3808 3715 3307 3862 4030 3563 3170 2873 2939 3487
Gold Coast 719 1216 1421 1240 1174 1254 1047 1187 1071 684 892 883 824 929 928 872 887 843 932 1069
Sunshine Coast 363 525 626 746 1775 1299 743 841 700 469 586 574 533 600 599 563 571 521 546 656
West Moreton 95 135 142 124 154 165 137 155 139 88 112 108 99 109 107 99 99 88 91 107
Wide Bay/Burnett 192 185 105 81 73 147 255 157 174 83 73 57 47 51 50 54 88 76 53 67
Darling Downs 1384 1465 1499 1162 2123 2986 3373 3775 1501 892 756 643 582 682 827 763 926 2375 2851 3307
South West 146 581 644 319 763 1855 2427 2956 1606 876 313 389 660 754 353 322 656 587 364 230
Fitzroy 1439 1405 2323 2670 4402 11769 14247 16017 11121 5981 4443 3854 3351 3959 3749 3825 3508 2826 3594 4256
Central West 35 50 59 56 101 193 354 415 713 591 653 598 1974 87 87 80 585 2163 1830 1108
Mackay 1565 1646 1990 1636 1815 4555 6454 6645 3197 2241 1255 1560 1709 1629 1117 1034 1159 1544 2542 3369
Northern 755 890 773 834 850 1130 1189 1314 727 458 585 599 673 742 728 547 716 1311 1088 1003
Far North 281 348 472 455 558 469 392 481 447 272 321 318 311 324 323 304 528 1726 2036 1473
North West 384 418 509 419 657 977 1194 1248 556 459 1120 1848 475 511 525 426 317 683 1195 2116
Queensland 10203 13929 17467 16112 20712 33215 37604 41206 26623 15733 14918 15145 14544 14238 13422 12454 13209 17617 20059 22248

Queensland region construction supply and demand analysis: 1995-2026 and quarterly indicators to June 2018 – June Annual Report 2016 128
Table A.11 Queensland regional construction value of work done: chain volume measure (2013-14 $M) – Public engineering
Fiscal years 2007 2008 2009 2010 2011 2012 2013 2014 2015 2016 2017 2018 2019 2020 2021 2022 2023 2024 2025 2026
Brisbane 1978 1929 1847 1981 1980 2048 1789 1560 1205 1007 1137 1139 1253 1685 1736 1763 1628 1683 1849 1982
Gold Coast 402 416 423 359 324 411 435 380 261 245 329 394 528 684 652 627 606 540 567 594
Sunshine Coast 171 189 213 227 232 237 226 274 275 221 191 141 149 191 180 213 211 203 221 238
West Moreton 130 118 118 138 101 85 98 101 88 69 76 49 46 97 108 191 204 186 196 259
Wide Bay/Burnett 353 361 377 374 406 449 448 348 333 231 226 158 151 193 206 306 305 279 294 348
Darling Downs 293 187 125 183 226 261 330 432 352 405 501 496 432 325 329 400 390 377 410 428
South West 63 49 43 49 42 191 157 61 38 58 68 63 69 90 95 119 117 112 122 130
Fitzroy 418 287 258 344 399 387 450 347 322 300 294 246 229 307 382 318 336 430 640 462
Central West 53 45 36 37 28 45 39 30 26 34 33 27 30 40 42 54 53 50 54 59
Mackay 285 303 457 451 361 187 156 253 154 121 177 247 355 262 600 902 839 764 737 468
Northern 238 197 188 226 214 275 332 264 275 190 207 355 432 488 263 309 290 274 300 324
Far North 288 244 222 192 175 302 387 332 244 217 210 176 195 250 246 292 285 276 301 313
North West 121 83 48 40 65 57 71 65 65 95 94 82 90 108 113 130 125 122 134 133
Queensland 4795 4408 4353 4601 4552 4933 4918 4447 3639 3194 3543 3572 3959 4719 4952 5625 5390 5297 5825 5738
Table A.12 Queensland regional construction value of work done: chain volume measure (2013-14 $M) – Non-residential building total
Fiscal years 2007 2008 2009 2010 2011 2012 2013 2014 2015 2016 2017 2018 2019 2020 2021 2022 2023 2024 2025 2026
Brisbane 3579 4067 4533 4099 4005 4271 3664 3238 3121 3497 3562 3705 3784 3777 4179 4067 4063 4185 3776 3911
Gold Coast 846 759 648 1015 1519 845 578 701 945 1094 1081 964 892 848 911 926 950 974 856 894
Sunshine Coast 427 365 339 339 310 280 347 713 735 444 364 362 407 414 460 465 483 507 456 483
West Moreton 99 81 197 326 143 58 46 52 36 35 53 77 95 108 131 129 130 137 130 131
Wide Bay/Burnett 252 204 204 241 299 190 117 168 197 194 243 237 232 230 255 251 254 266 243 259
Darling Downs 217 199 152 173 266 244 198 278 328 469 428 407 374 314 306 273 260 265 243 265
South West 18 13 14 19 33 30 38 43 28 22 22 22 22 22 25 26 28 29 27 28
Fitzroy 179 196 203 212 252 295 567 795 383 174 167 200 226 245 288 310 330 348 310 326
Central West 7 5 8 9 17 20 13 15 10 6 18 15 15 15 15 15 15 15 13 14
Mackay 221 241 255 304 543 429 351 396 252 170 91 133 161 180 212 228 240 248 217 224
Northern 412 440 406 465 487 398 534 527 249 314 356 412 451 446 487 501 514 531 483 513
Far North 283 300 510 581 380 394 333 174 142 147 153 231 294 337 405 424 440 455 401 411
North West 19 25 20 20 43 47 52 83 68 25 20 23 26 29 35 37 40 42 38 40
Queensland 6559 6895 7488 7805 8296 7500 6840 7184 6495 6593 6557 6789 6979 6964 7710 7653 7748 8003 7195 7498

Queensland region construction supply and demand analysis: 1995-2026 and quarterly indicators to June 2018 – June Annual Report 2016 129
Table A.13 Queensland regional construction value of work done: chain volume measure (2013-14 $M) – Engineering total
Fiscal years 2007 2008 2009 2010 2011 2012 2013 2014 2015 2016 2017 2018 2019 2020 2021 2022 2023 2024 2025 2026
Brisbane 4823 6993 8751 8352 8246 8463 7580 7575 5876 3647 4945 4853 4560 5548 5766 5326 4798 4556 4788 5469
Gold Coast 1121 1631 1844 1599 1498 1665 1482 1567 1332 930 1222 1277 1352 1613 1580 1500 1493 1384 1498 1663
Sunshine Coast 535 714 838 973 2007 1536 969 1114 975 690 777 715 682 791 779 776 782 724 767 893
West Moreton 225 253 260 262 255 250 235 256 227 157 187 157 145 206 215 290 303 274 287 366
Wide Bay/Burnett 545 546 481 455 479 596 704 505 508 314 299 215 197 244 256 361 392 355 347 416
Darling Downs 1676 1652 1625 1344 2348 3247 3704 4207 1854 1297 1257 1139 1013 1007 1156 1163 1317 2752 3261 3735
South West 209 629 687 368 804 2046 2585 3017 1643 934 381 451 730 844 449 441 773 700 486 360
Fitzroy 1857 1693 2581 3014 4801 12156 14697 16363 11443 6281 4736 4100 3579 4266 4131 4143 3844 3256 4233 4718
Central West 88 95 95 93 129 238 393 445 738 625 686 625 2004 126 129 135 638 2214 1884 1166
Mackay 1851 1949 2447 2087 2176 4741 6610 6897 3351 2362 1432 1807 2065 1890 1717 1937 1998 2308 3279 3837
Northern 993 1088 961 1060 1064 1405 1521 1579 1003 648 792 954 1104 1230 990 857 1007 1585 1388 1327
Far North 569 592 693 647 733 770 779 813 690 489 531 494 507 574 569 596 813 2002 2337 1786
North West 506 501 557 459 722 1034 1265 1313 621 554 1215 1930 565 619 638 556 442 805 1329 2249
Queensland 14998 18337 21820 20713 25264 38148 42522 45653 30262 18928 18461 18717 18503 18958 18374 18079 18599 22913 25883 27986
Table A.14 Queensland regional construction value of work done: chain volume measure (2013-14 $M) – Total residential (excluding other work done)
Fiscal years 2007 2008 2009 2010 2011 2012 2013 2014 2015 2016 2017 2018 2019 2020 2021 2022 2023 2024 2025 2026
Brisbane 5410 5472 5156 5080 4977 4717 4080 4467 6147 7657 8362 8086 7172 6436 5828 5834 6006 6185 6460 6755
Gold Coast 2450 2265 2052 1879 1241 903 757 870 1177 1819 2220 2284 2289 2231 2136 2245 2414 2553 2707 2854
Sunshine Coast 1227 1303 1189 1039 926 741 640 684 942 1109 1177 1218 1336 1374 1351 1415 1501 1573 1657 1738
West Moreton 207 192 229 256 227 186 213 172 172 171 178 209 225 226 221 230 242 252 265 278
Wide Bay/Burnett 892 875 740 691 612 425 379 359 391 397 402 470 496 492 474 488 512 531 555 577
Darling Downs 495 409 354 476 513 405 450 467 471 430 385 419 434 427 408 416 431 444 461 476
South West 22 23 19 21 18 23 47 48 27 18 8 14 19 20 20 22 23 24 26 27
Fitzroy 549 608 468 374 397 492 786 909 449 249 215 342 426 459 462 489 517 540 569 595
Central West 6 8 8 9 9 13 12 8 6 4 3 7 6 5 5 5 5 5 5 5
Mackay 570 608 486 549 481 442 694 759 392 198 144 232 317 354 364 397 432 457 484 509
Northern 707 768 747 688 564 509 498 491 466 395 274 382 479 523 531 559 592 619 651 682
Far North 800 930 679 530 443 428 393 319 331 417 440 540 722 820 849 905 970 1023 1082 1135
North West 15 24 25 25 28 27 22 25 21 16 18 38 42 43 42 42 43 44 46 47
Queensland 13348 13484 12151 11616 10437 9312 8972 9578 10990 12879 13826 14240 13962 13411 12692 13048 13687 14250 14967 15679

Queensland region construction supply and demand analysis: 1995-2026 and quarterly indicators to June 2018 – June Annual Report 2016 130

Queensland region construction supply and demand analysis: 1995-2026 and quarterly indicators to June 2018 – June Annual Report 2016 131
Table A.15 Queensland regional construction value of work done: chain volume measure (2013-14 $M) – Total public sector engineering (including Commonwealth)
Fiscal years 2007 2008 2009 2010 2011 2012 2013 2014 2015 2016 2017 2018 2019 2020 2021 2022 2023 2024 2025 2026
Brisbane 2982 2775 3010 3798 3803 3749 2967 2304 1779 1392 1581 1701 2016 2613 2976 2842 2682 2909 3231 3430
Gold Coast 576 565 520 900 1422 920 654 557 342 334 448 477 627 800 810 780 761 718 767 805
Sunshine Coast 238 246 315 409 387 316 289 337 317 341 309 224 255 296 302 317 313 324 355 384
West Moreton 188 167 278 435 216 113 118 128 102 74 79 61 70 132 160 237 248 237 256 317
Wide Bay/Burnett 421 405 430 497 603 527 488 397 380 259 258 191 194 248 282 375 373 359 385 450
Darling Downs 349 224 163 252 337 320 364 468 423 470 552 548 498 398 422 480 470 470 516 551
South West 75 60 55 64 64 202 166 76 44 61 76 67 73 95 102 126 125 121 131 139
Fitzroy 481 348 296 429 535 481 613 616 415 330 336 280 261 346 441 382 405 513 729 557
Central West 55 48 41 44 41 63 49 37 29 39 46 33 34 43 45 57 56 54 58 63
Mackay 321 333 496 572 609 302 226 355 181 129 187 261 373 283 633 936 875 806 783 514
Northern 448 424 400 604 589 453 621 613 343 259 338 470 553 606 398 443 428 434 490 535
Far North 389 344 492 640 465 551 604 421 298 280 307 270 303 384 416 454 449 457 495 511
North West 127 91 57 51 94 88 101 92 71 105 116 98 106 127 136 152 148 148 162 162
Queensland 6651 6030 6553 8694 9166 8086 7260 6401 4723 4073 4632 4680 5363 6370 7124 7582 7332 7549 8359 8420
Table A.16 Queensland regional construction value of work done: chain volume measure (2013-14 $M) – Private residential (other work done)
Fiscal years 2007 2008 2009 2010 2011 2012 2013 2014 2015 2016 2017 2018 2019 2020 2021 2022 2023 2024 2025 2026
Brisbane 2996 2863 2727 2851 2937 3050 2345 2297 2353 2656 2916 3147 3439 3560 3686 3806 3918 4026 4133 4240
Gold Coast 1251 1204 1144 1194 1002 902 825 881 880 965 1037 1101 1192 1231 1278 1324 1370 1417 1466 1515
Sunshine Coast 809 765 723 749 627 570 525 564 567 625 667 702 755 778 807 836 866 895 924 955
West Moreton 123 116 111 117 114 114 94 97 98 108 115 121 130 133 138 143 147 152 157 161
Wide Bay/Burnett 387 378 365 383 360 351 291 296 296 323 340 353 376 382 392 401 410 419 427 436
Darling Downs 239 230 218 227 278 312 212 193 198 221 236 248 266 273 281 289 297 305 313 320
South West 21 20 19 20 25 28 19 19 20 23 24 24 26 27 27 28 29 30 31 32
Fitzroy 229 226 220 231 236 246 194 203 214 235 246 254 271 278 287 297 307 317 327 337
Central West 7 7 6 7 10 12 7 6 7 7 8 8 8 9 9 9 9 9 9 9
Mackay 208 209 205 219 190 177 171 197 207 226 235 240 254 259 266 274 282 290 298 306
Northern 310 303 297 315 268 246 231 253 257 283 297 305 324 331 341 352 362 373 383 394
Far North 406 395 380 394 328 296 274 295 294 319 336 348 372 384 401 419 436 455 473 493
North West 10 9 9 10 8 8 7 8 9 9 10 10 11 12 13 13 14 14 15 16
Queensland 6995 6725 6425 6715 6383 6312 5196 5310 5401 6000 6466 6861 7425 7657 7926 8191 8448 8702 8956 9214

Queensland region construction supply and demand analysis: 1995-2026 and quarterly indicators to June 2018 – June Annual Report 2016 132
Table A.17 Queensland regional construction value of work done: chain volume measure (2013-14 $M) – Total construction
Fiscal years 2007 2008 2009 2010 2011 2012 2013 2014 2015 2016 2017 2018 2019 2020 2021 2022 2023 2024 2025 2026
Brisbane 16808 19395 21167 20382 20165 20502 17670 17577 17497 17457 19784 19792 18955 19320 19460 19032 18785 18952 19157 20375
Gold Coast 5668 5859 5688 5687 5261 4315 3642 4019 4334 4807 5560 5626 5725 5924 5904 5995 6228 6328 6527 6926
Sunshine Coast 2997 3147 3090 3100 3870 3126 2480 3076 3219 2867 2985 2996 3180 3356 3397 3492 3632 3699 3805 4069
West Moreton 654 643 796 961 740 607 587 578 534 471 534 564 594 674 705 791 822 815 839 936
Wide Bay/Burnett 2076 2004 1789 1770 1749 1563 1491 1328 1392 1228 1285 1275 1300 1349 1377 1500 1568 1570 1573 1687
Darling Downs 2628 2490 2348 2220 3405 4208 4564 5144 2851 2418 2305 2213 2087 2021 2150 2142 2305 3765 4277 4796
South West 270 685 740 429 880 2127 2688 3127 1718 997 435 512 796 912 522 518 853 783 569 447
Fitzroy 2814 2722 3472 3830 5687 13189 16244 18271 12490 6939 5365 4896 4503 5247 5169 5239 4999 4461 5438 5976
Central West 107 114 116 117 165 282 426 475 762 643 714 654 2034 155 158 164 667 2243 1911 1195
Mackay 2849 3007 3392 3159 3391 5790 7826 8249 4201 2955 1902 2412 2797 2683 2560 2836 2951 3303 4278 4877
Northern 2422 2599 2412 2529 2383 2558 2784 2850 1975 1639 1719 2053 2359 2531 2350 2269 2475 3107 2906 2915
Far North 2058 2216 2263 2151 1885 1889 1780 1602 1458 1373 1460 1613 1894 2115 2224 2343 2659 3934 4293 3825
North West 549 559 611 513 801 1116 1347 1430 718 605 1262 2001 644 703 727 649 538 906 1428 2352
Queensland 41900 45441 47884 46848 50380 61272 63529 67725 53147 44399 45310 46607 46870 46989 46702 46971 48483 53867 57002 60377
Table A.18 Queensland regional construction value of work done: chain volume measure (2013-14 %) – Total construction expenditure share of State total
Fiscal years 2007 2008 2009 2010 2011 2012 2013 2014 2015 2016 2017 2018 2019 2020 2021 2022 2023 2024 2025 2026
Brisbane 40.1 42.7 44.2 43.5 40.0 33.5 27.8 26.0 32.9 39.3 43.7 42.5 40.4 41.1 41.7 40.5 38.7 35.2 33.6 33.7
Gold Coast 13.5 12.9 11.9 12.1 10.4 7.0 5.7 5.9 8.2 10.8 12.3 12.1 12.2 12.6 12.6 12.8 12.8 11.7 11.5 11.5
Sunshine Coast 7.2 6.9 6.5 6.6 7.7 5.1 3.9 4.5 6.1 6.5 6.6 6.4 6.8 7.1 7.3 7.4 7.5 6.9 6.7 6.7
West Moreton 1.6 1.4 1.7 2.1 1.5 1.0 0.9 0.9 1.0 1.1 1.2 1.2 1.3 1.4 1.5 1.7 1.7 1.5 1.5 1.6
Wide Bay/Burnett 5.0 4.4 3.7 3.8 3.5 2.6 2.3 2.0 2.6 2.8 2.8 2.7 2.8 2.9 2.9 3.2 3.2 2.9 2.8 2.8
Darling Downs 6.3 5.5 4.9 4.7 6.8 6.9 7.2 7.6 5.4 5.4 5.1 4.7 4.5 4.3 4.6 4.6 4.8 7.0 7.5 7.9
South West 0.6 1.5 1.5 0.9 1.7 3.5 4.2 4.6 3.2 2.2 1.0 1.1 1.7 1.9 1.1 1.1 1.8 1.5 1.0 0.7
Fitzroy 6.7 6.0 7.3 8.2 11.3 21.5 25.6 27.0 23.5 15.6 11.8 10.5 9.6 11.2 11.1 11.2 10.3 8.3 9.5 9.9
Central West 0.3 0.3 0.2 0.3 0.3 0.5 0.7 0.7 1.4 1.4 1.6 1.4 4.3 0.3 0.3 0.3 1.4 4.2 3.4 2.0
Mackay 6.8 6.6 7.1 6.7 6.7 9.4 12.3 12.2 7.9 6.7 4.2 5.2 6.0 5.7 5.5 6.0 6.1 6.1 7.5 8.1
Northern 5.8 5.7 5.0 5.4 4.7 4.2 4.4 4.2 3.7 3.7 3.8 4.4 5.0 5.4 5.0 4.8 5.1 5.8 5.1 4.8
Far North 4.9 4.9 4.7 4.6 3.7 3.1 2.8 2.4 2.7 3.1 3.2 3.5 4.0 4.5 4.8 5.0 5.5 7.3 7.5 6.3
North West 1.3 1.2 1.3 1.1 1.6 1.8 2.1 2.1 1.4 1.4 2.8 4.3 1.4 1.5 1.6 1.4 1.1 1.7 2.5 3.9
Queensland 100.0 100.0 100.0 100.0 100.0 100.0 100.0 100.0 100.0 100.0 100.0 100.0 100.0 100.0 100.0 100.0 100.0 100.0 100.0 100.0

Queensland region construction supply and demand analysis: 1995-2026 and quarterly indicators to June 2018 – June Annual Report 2016 133
Table A.19 Queensland regional dwelling units commenced (number) – Total residential dwelling units
Fiscal years 2007 2008 2009 2010 2011 2012 2013 2014 2015 2016 2017 2018 2019 2020 2021 2022 2023 2024 2025 2026
Brisbane 17120 19748 13597 16959 15560 14492 13977 19503 27528 31554 27858 26832 25450 26056 24926 24092 23753 23493 23242 22992
Gold Coast 6825 6838 4500 4207 2973 2582 2650 3815 5439 7528 7988 7912 7527 7728 7449 7362 7399 7353 7295 7242
Sunshine Coast
3331 3787 2780 2963 2534 1987 1795 2684 3570 4303 4806 4634 4448 4588 4408 4257 4190 4146 4102 4058
West Moreton 638 862 754 918 620 703 636 543 588 620 771 902 905 955 923 882 857 845 834 823
Wide Bay/Burnett 3260 3119 3464 1971 2579 1656 1426 1252 1391 1518 1479 1944 2216 2213 2326 2246 2157 2106 2075 2044
Darling Downs 1499 1421 971 1916 1214 1314 1436 1838 1738 1460 1605 1709 1668 1730 1657 1576 1528 1501 1476 1450
South West 69 78 52 62 49 113 128 105 86 19 26 32 33 35 34 32 30 30 29 28
Fitzroy 1865 1834 937 1268 1116 1869 2792 1745 978 643 1120 1391 1436 1535 1491 1422 1380 1360 1341 1323
Central West 18 20 26 16 22 31 16 12 17 6 9 11 11 12 11 10 9 9 9 9
Mackay 1639 1570 1027 1482 1145 1617 2585 1650 690 379 660 821 845 903 882 860 851 842 832 822
Northern 2100 2731 1339 2064 1273 1459 1761 1720 1728 995 1427 1729 1762 1872 1808 1718 1663 1638 1615 1591
Far North 2936 2945 1282 1582 883 887 739 969 1372 1349 1832 2013 2019 2125 2045 1972 1935 1909 1884 1859
North West 71 98 46 90 77 56 63 84 60 28 47 59 62 67 64 60 58 56 55 54
Queensland 41231 45396 29283 36105 29122 28534 29830 36060 45313 50364 50094 50261 48379 49931 47945 46400 45758 45255 44757 44265
Queensland region construction supply and demand analysis: 1995-2026 and quarterly
indicators to June 2018 – June Annual Report 2016
134 134 134 134
Appendix B
Additional quarterly tables
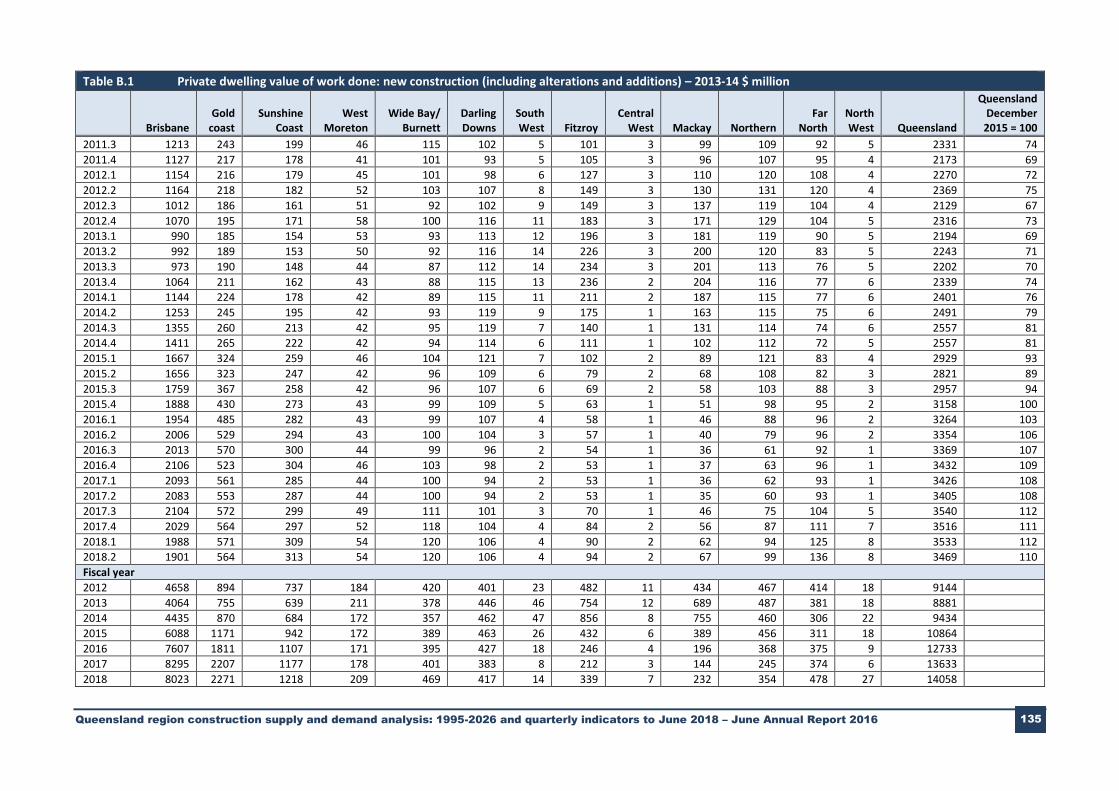
Queensland region construction supply and demand analysis: 1995-2026 and quarterly indicators to June 2018 – June Annual Report 2016 135
Table B.1 Private dwelling value of work done: new construction (including alterations and additions) – 2013-14 $ million
Brisbane Gold
coast Sunshine
Coast West
Moreton Wide Bay/
Burnett Darling Downs
South West Fitzroy
Central West Mackay Northern
Far North
North West Queensland
Queensland December
2015 = 100
2011.3 1213 243 199 46 115 102 5 101 3 99 109 92 5 2331 74
2011.4 1127 217 178 41 101 93 5 105 3 96 107 95 4 2173 69
2012.1 1154 216 179 45 101 98 6 127 3 110 120 108 4 2270 72
2012.2 1164 218 182 52 103 107 8 149 3 130 131 120 4 2369 75
2012.3 1012 186 161 51 92 102 9 149 3 137 119 104 4 2129 67
2012.4 1070 195 171 58 100 116 11 183 3 171 129 104 5 2316 73
2013.1 990 185 154 53 93 113 12 196 3 181 119 90 5 2194 69
2013.2 992 189 153 50 92 116 14 226 3 200 120 83 5 2243 71
2013.3 973 190 148 44 87 112 14 234 3 201 113 76 5 2202 70
2013.4 1064 211 162 43 88 115 13 236 2 204 116 77 6 2339 74
2014.1 1144 224 178 42 89 115 11 211 2 187 115 77 6 2401 76
2014.2 1253 245 195 42 93 119 9 175 1 163 115 75 6 2491 79
2014.3 1355 260 213 42 95 119 7 140 1 131 114 74 6 2557 81
2014.4 1411 265 222 42 94 114 6 111 1 102 112 72 5 2557 81
2015.1 1667 324 259 46 104 121 7 102 2 89 121 83 4 2929 93
2015.2 1656 323 247 42 96 109 6 79 2 68 108 82 3 2821 89
2015.3 1759 367 258 42 96 107 6 69 2 58 103 88 3 2957 94
2015.4 1888 430 273 43 99 109 5 63 1 51 98 95 2 3158 100
2016.1 1954 485 282 43 99 107 4 58 1 46 88 96 2 3264 103
2016.2 2006 529 294 43 100 104 3 57 1 40 79 96 2 3354 106
2016.3 2013 570 300 44 99 96 2 54 1 36 61 92 1 3369 107
2016.4 2106 523 304 46 103 98 2 53 1 37 63 96 1 3432 109
2017.1 2093 561 285 44 100 94 2 53 1 36 62 93 1 3426 108
2017.2 2083 553 287 44 100 94 2 53 1 35 60 93 1 3405 108
2017.3 2104 572 299 49 111 101 3 70 1 46 75 104 5 3540 112
2017.4 2029 564 297 52 118 104 4 84 2 56 87 111 7 3516 111
2018.1 1988 571 309 54 120 106 4 90 2 62 94 125 8 3533 112
2018.2 1901 564 313 54 120 106 4 94 2 67 99 136 8 3469 110
Fiscal year
2012 4658 894 737 184 420 401 23 482 11 434 467 414 18 9144
2013 4064 755 639 211 378 446 46 754 12 689 487 381 18 8881
2014 4435 870 684 172 357 462 47 856 8 755 460 306 22 9434
2015 6088 1171 942 172 389 463 26 432 6 389 456 311 18 10864
2016 7607 1811 1107 171 395 427 18 246 4 196 368 375 9 12733
2017 8295 2207 1177 178 401 383 8 212 3 144 245 374 6 13633
2018 8023 2271 1218 209 469 417 14 339 7 232 354 478 27 14058

Queensland region construction supply and demand analysis: 1995-2026 and quarterly indicators to June 2018 – June Annual Report 2016 136
Table B.2 Private dwelling: other value of work done – 2013-14 $ million
Brisbane Gold
coast Sunshine
Coast West
Moreton Wide Bay/
Burnett Darling Downs
South West Fitzroy
Central West Mackay Northern
Far North
North West Queensland
Queensland December
2015 = 100
2011.3 854 213 134 30 92 96 8 69 4 41 57 70 2 1669 116
2011.4 752 215 135 28 85 79 7 61 3 42 58 70 2 1537 107
2012.1 758 245 155 29 91 73 6 61 3 48 67 81 2 1620 113
2012.2 687 230 145 27 83 65 6 56 2 46 63 76 2 1487 104
2012.3 621 202 128 24 74 59 5 51 2 41 56 67 2 1333 93
2012.4 613 213 135 24 76 56 5 50 2 43 59 71 2 1350 94
2013.1 545 199 127 22 69 48 4 45 2 41 56 66 2 1226 86
2013.2 565 211 135 23 72 49 5 48 2 45 60 71 2 1286 90
2013.3 570 220 141 24 74 48 5 49 2 48 63 74 2 1318 92
2013.4 571 220 141 24 74 48 5 50 2 49 63 74 2 1321 92
2014.1 580 222 142 25 75 49 5 52 2 50 64 74 2 1342 94
2014.2 576 219 140 24 74 48 5 52 2 50 63 73 2 1330 93
2014.3 556 210 135 23 71 47 5 51 2 49 61 70 2 1281 89
2014.4 574 215 139 24 73 48 5 52 2 51 63 72 2 1320 92
2015.1 607 226 146 25 76 51 5 55 2 53 66 76 2 1391 97
2015.2 617 228 147 26 77 52 5 56 2 54 67 76 2 1409 98
2015.3 654 240 155 27 81 55 6 59 2 57 71 80 2 1488 104
2015.4 633 231 149 26 77 53 5 56 2 54 68 77 2 1434 100
2016.1 676 245 158 27 82 56 6 60 2 57 72 81 2 1524 106
2016.2 692 249 161 28 83 57 6 60 2 58 73 82 2 1554 108
2016.3 708 253 164 28 84 58 6 61 2 58 73 83 2 1581 110
2016.4 722 258 166 29 85 59 6 61 2 59 74 84 2 1605 112
2017.1 736 261 168 29 85 59 6 62 2 59 74 84 2 1629 114
2017.2 750 265 170 29 86 60 6 62 2 59 75 85 2 1651 115
2017.3 760 267 171 29 86 60 6 62 2 59 75 85 2 1665 116
2017.4 768 269 172 29 86 61 6 62 2 59 75 85 2 1676 117
2018.1 774 270 172 30 86 61 6 62 2 59 75 85 3 1683 117
2018.2 846 295 187 32 94 66 6 67 2 64 81 93 3 1836 128
Fiscal year
2012 3050 902 570 114 351 312 28 246 12 177 246 296 8 6312
2013 2345 825 525 94 291 212 19 194 7 171 231 274 7 5196
2014 2297 881 564 97 296 193 19 203 6 197 253 295 8 5310
2015 2353 880 567 98 296 198 20 214 7 207 257 294 9 5401
2016 2656 965 625 108 323 221 23 235 7 226 283 319 9 6000
2017 2916 1037 667 115 340 236 24 246 8 235 297 336 10 6466
2018 3147 1101 702 121 353 248 24 254 8 240 305 348 10 6861
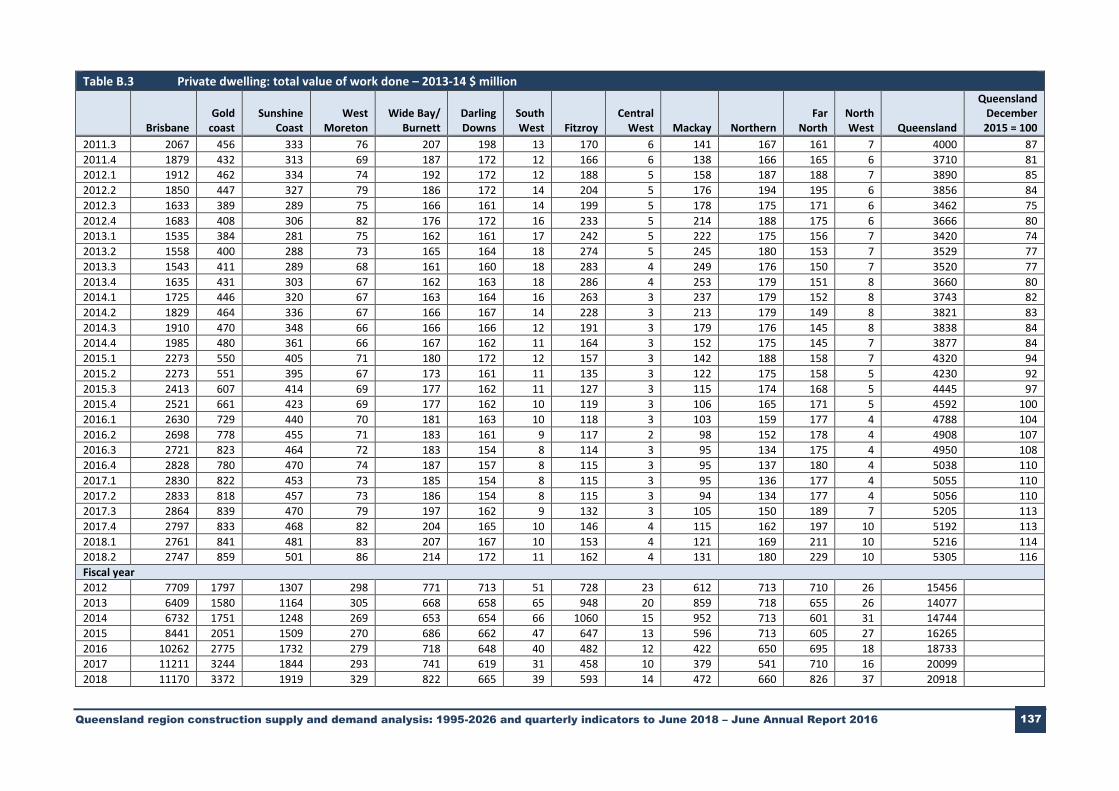
Queensland region construction supply and demand analysis: 1995-2026 and quarterly indicators to June 2018 – June Annual Report 2016 137
Table B.3 Private dwelling: total value of work done – 2013-14 $ million
Brisbane Gold
coast Sunshine
Coast West
Moreton Wide Bay/
Burnett Darling Downs
South West Fitzroy
Central West Mackay Northern
Far North
North West Queensland
Queensland December
2015 = 100
2011.3 2067 456 333 76 207 198 13 170 6 141 167 161 7 4000 87
2011.4 1879 432 313 69 187 172 12 166 6 138 166 165 6 3710 81
2012.1 1912 462 334 74 192 172 12 188 5 158 187 188 7 3890 85
2012.2 1850 447 327 79 186 172 14 204 5 176 194 195 6 3856 84
2012.3 1633 389 289 75 166 161 14 199 5 178 175 171 6 3462 75
2012.4 1683 408 306 82 176 172 16 233 5 214 188 175 6 3666 80
2013.1 1535 384 281 75 162 161 17 242 5 222 175 156 7 3420 74
2013.2 1558 400 288 73 165 164 18 274 5 245 180 153 7 3529 77
2013.3 1543 411 289 68 161 160 18 283 4 249 176 150 7 3520 77
2013.4 1635 431 303 67 162 163 18 286 4 253 179 151 8 3660 80
2014.1 1725 446 320 67 163 164 16 263 3 237 179 152 8 3743 82
2014.2 1829 464 336 67 166 167 14 228 3 213 179 149 8 3821 83
2014.3 1910 470 348 66 166 166 12 191 3 179 176 145 8 3838 84
2014.4 1985 480 361 66 167 162 11 164 3 152 175 145 7 3877 84
2015.1 2273 550 405 71 180 172 12 157 3 142 188 158 7 4320 94
2015.2 2273 551 395 67 173 161 11 135 3 122 175 158 5 4230 92
2015.3 2413 607 414 69 177 162 11 127 3 115 174 168 5 4445 97
2015.4 2521 661 423 69 177 162 10 119 3 106 165 171 5 4592 100
2016.1 2630 729 440 70 181 163 10 118 3 103 159 177 4 4788 104
2016.2 2698 778 455 71 183 161 9 117 2 98 152 178 4 4908 107
2016.3 2721 823 464 72 183 154 8 114 3 95 134 175 4 4950 108
2016.4 2828 780 470 74 187 157 8 115 3 95 137 180 4 5038 110
2017.1 2830 822 453 73 185 154 8 115 3 95 136 177 4 5055 110
2017.2 2833 818 457 73 186 154 8 115 3 94 134 177 4 5056 110
2017.3 2864 839 470 79 197 162 9 132 3 105 150 189 7 5205 113
2017.4 2797 833 468 82 204 165 10 146 4 115 162 197 10 5192 113
2018.1 2761 841 481 83 207 167 10 153 4 121 169 211 10 5216 114
2018.2 2747 859 501 86 214 172 11 162 4 131 180 229 10 5305 116
Fiscal year
2012 7709 1797 1307 298 771 713 51 728 23 612 713 710 26 15456
2013 6409 1580 1164 305 668 658 65 948 20 859 718 655 26 14077
2014 6732 1751 1248 269 653 654 66 1060 15 952 713 601 31 14744
2015 8441 2051 1509 270 686 662 47 647 13 596 713 605 27 16265
2016 10262 2775 1732 279 718 648 40 482 12 422 650 695 18 18733
2017 11211 3244 1844 293 741 619 31 458 10 379 541 710 16 20099
2018 11170 3372 1919 329 822 665 39 593 14 472 660 826 37 20918
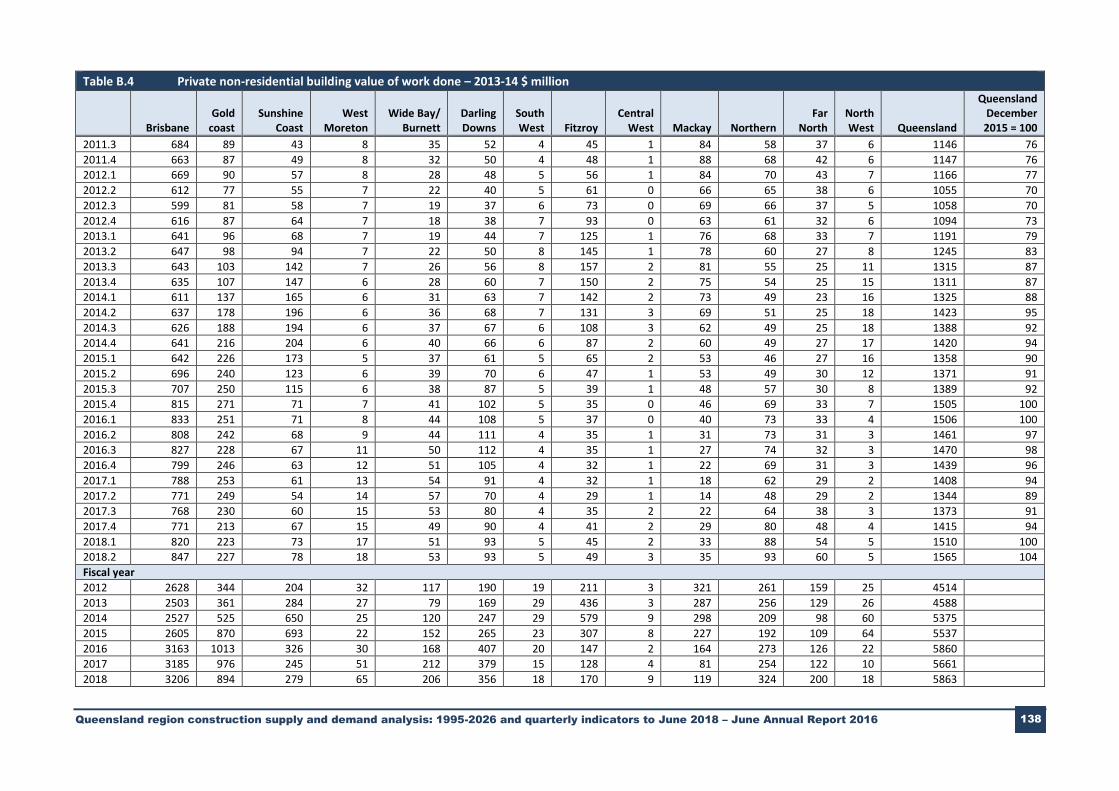
Queensland region construction supply and demand analysis: 1995-2026 and quarterly indicators to June 2018 – June Annual Report 2016 138
Table B.4 Private non-residential building value of work done – 2013-14 $ million
Brisbane Gold
coast Sunshine
Coast West
Moreton Wide Bay/
Burnett Darling Downs
South West Fitzroy
Central West Mackay Northern
Far North
North West Queensland
Queensland December
2015 = 100
2011.3 684 89 43 8 35 52 4 45 1 84 58 37 6 1146 76
2011.4 663 87 49 8 32 50 4 48 1 88 68 42 6 1147 76
2012.1 669 90 57 8 28 48 5 56 1 84 70 43 7 1166 77
2012.2 612 77 55 7 22 40 5 61 0 66 65 38 6 1055 70
2012.3 599 81 58 7 19 37 6 73 0 69 66 37 5 1058 70
2012.4 616 87 64 7 18 38 7 93 0 63 61 32 6 1094 73
2013.1 641 96 68 7 19 44 7 125 1 76 68 33 7 1191 79
2013.2 647 98 94 7 22 50 8 145 1 78 60 27 8 1245 83
2013.3 643 103 142 7 26 56 8 157 2 81 55 25 11 1315 87
2013.4 635 107 147 6 28 60 7 150 2 75 54 25 15 1311 87
2014.1 611 137 165 6 31 63 7 142 2 73 49 23 16 1325 88
2014.2 637 178 196 6 36 68 7 131 3 69 51 25 18 1423 95
2014.3 626 188 194 6 37 67 6 108 3 62 49 25 18 1388 92
2014.4 641 216 204 6 40 66 6 87 2 60 49 27 17 1420 94
2015.1 642 226 173 5 37 61 5 65 2 53 46 27 16 1358 90
2015.2 696 240 123 6 39 70 6 47 1 53 49 30 12 1371 91
2015.3 707 250 115 6 38 87 5 39 1 48 57 30 8 1389 92
2015.4 815 271 71 7 41 102 5 35 0 46 69 33 7 1505 100
2016.1 833 251 71 8 44 108 5 37 0 40 73 33 4 1506 100
2016.2 808 242 68 9 44 111 4 35 1 31 73 31 3 1461 97
2016.3 827 228 67 11 50 112 4 35 1 27 74 32 3 1470 98
2016.4 799 246 63 12 51 105 4 32 1 22 69 31 3 1439 96
2017.1 788 253 61 13 54 91 4 32 1 18 62 29 2 1408 94
2017.2 771 249 54 14 57 70 4 29 1 14 48 29 2 1344 89
2017.3 768 230 60 15 53 80 4 35 2 22 64 38 3 1373 91
2017.4 771 213 67 15 49 90 4 41 2 29 80 48 4 1415 94
2018.1 820 223 73 17 51 93 5 45 2 33 88 54 5 1510 100
2018.2 847 227 78 18 53 93 5 49 3 35 93 60 5 1565 104
Fiscal year
2012 2628 344 204 32 117 190 19 211 3 321 261 159 25 4514
2013 2503 361 284 27 79 169 29 436 3 287 256 129 26 4588
2014 2527 525 650 25 120 247 29 579 9 298 209 98 60 5375
2015 2605 870 693 22 152 265 23 307 8 227 192 109 64 5537
2016 3163 1013 326 30 168 407 20 147 2 164 273 126 22 5860
2017 3185 976 245 51 212 379 15 128 4 81 254 122 10 5661
2018 3206 894 279 65 206 356 18 170 9 119 324 200 18 5863

Queensland region construction supply and demand analysis: 1995-2026 and quarterly indicators to June 2018 – June Annual Report 2016 139
Table B.5 Public non-residential building value of work done – 2013-14 $ million
Brisbane Gold
coast Sunshine
Coast West
Moreton Wide Bay/
Burnett Darling Downs
South West Fitzroy
Central West Mackay Northern
Far North
North West Queensland
Queensland December
2015 = 100
2011.3 356 197 19 8 22 16 4 20 4 41 36 47 5 775 575
2011.4 421 134 20 7 20 16 3 22 4 30 32 57 6 774 574
2012.1 412 115 17 5 16 12 2 19 4 25 31 60 5 723 536
2012.2 454 55 18 5 15 11 2 23 4 11 38 71 6 714 529
2012.3 311 41 13 4 9 7 1 18 3 9 37 54 5 512 379
2012.4 326 54 16 5 10 7 2 28 3 15 65 59 6 595 441
2013.1 276 64 17 5 10 8 2 41 3 19 86 49 8 589 437
2013.2 249 58 16 5 10 7 3 44 2 22 91 42 8 556 413
2013.3 200 67 18 8 12 7 4 64 2 31 117 27 9 565 419
2013.4 184 48 16 7 11 7 4 60 2 28 89 21 7 484 359
2014.1 159 33 14 6 11 7 3 50 1 22 67 14 4 392 291
2014.2 170 29 15 6 13 11 3 43 1 17 44 13 3 368 273
2014.3 179 25 14 5 15 16 2 34 1 12 27 12 2 345 256
2014.4 132 17 11 4 11 16 1 20 1 7 17 8 1 246 183
2015.1 128 19 11 3 11 19 1 14 1 4 8 8 1 228 169
2015.2 77 14 6 2 7 13 1 7 0 2 6 5 0 139 103
2015.3 118 25 10 2 10 21 1 10 1 2 10 7 1 218 162
2015.4 70 16 6 1 6 14 1 6 1 1 8 5 1 135 100
2016.1 62 15 55 1 5 11 0 5 1 1 8 4 1 169 125
2016.2 84 25 47 1 6 15 1 7 2 1 15 6 1 211 156
2016.3 85 28 58 1 6 13 1 8 2 2 20 7 2 233 173
2016.4 97 32 30 1 7 13 2 10 3 2 26 8 3 235 174
2017.1 92 26 20 1 8 11 2 10 4 3 27 8 3 213 158
2017.2 103 20 11 1 9 12 2 11 4 3 29 9 3 216 160
2017.3 111 17 14 1 9 11 2 10 3 3 27 9 2 219 163
2017.4 117 17 22 3 7 12 1 7 1 3 19 7 1 216 160
2018.1 121 17 22 3 7 12 1 6 1 3 19 7 1 220 163
2018.2 150 20 26 4 9 15 1 7 1 4 23 9 1 270 200
Fiscal year
2012 1643 501 76 26 73 55 11 84 16 108 137 235 22 2985
2013 1162 217 63 19 39 29 8 131 10 65 278 205 27 2252
2014 712 177 63 28 48 31 14 217 6 98 318 76 23 1810
2015 516 75 42 14 45 63 5 76 3 24 57 33 4 958
2016 334 81 118 5 26 61 3 28 4 6 41 21 3 732
2017 377 106 119 3 31 49 8 39 13 10 102 31 10 896
2018 499 71 83 12 32 50 4 31 6 14 88 32 5 925

Queensland region construction supply and demand analysis: 1995-2026 and quarterly indicators to June 2018 – June Annual Report 2016 140
Table B.6 Total non-residential building value of work done – 2013-14 $ million
Brisbane Gold
coast Sunshine
Coast West
Moreton Wide Bay/
Burnett Darling Downs
South West Fitzroy
Central West Mackay Northern
Far North
North West Queensland
Queensland December
2015 = 100
2011.3 1040 286 62 16 57 68 8 65 5 125 94 83 11 1921 117
2011.4 1084 221 70 16 52 66 7 70 5 118 100 99 12 1921 117
2012.1 1080 206 75 14 43 59 8 76 5 109 102 103 11 1889 115
2012.2 1065 132 73 13 37 51 7 84 5 77 103 110 12 1769 108
2012.3 910 122 72 10 28 44 8 92 3 79 103 90 10 1570 96
2012.4 942 141 80 11 28 46 9 121 3 78 126 91 12 1689 103
2013.1 916 159 85 12 29 52 10 165 3 95 154 83 15 1780 109
2013.2 896 156 110 12 32 56 11 189 3 100 151 69 16 1801 110
2013.3 843 170 160 15 38 63 12 220 4 111 172 52 20 1880 115
2013.4 818 155 163 14 39 67 11 210 4 104 143 46 22 1795 110
2014.1 770 170 179 12 43 69 10 191 4 94 116 38 20 1717 105
2014.2 807 207 211 12 49 79 9 174 3 86 96 38 21 1791 109
2014.3 804 213 208 11 52 83 8 142 3 74 75 37 21 1733 106
2014.4 774 233 214 10 51 81 7 108 3 66 66 35 18 1666 102
2015.1 770 245 183 9 48 80 6 79 2 57 54 35 16 1586 97
2015.2 773 254 129 7 45 83 6 54 2 55 54 35 13 1510 92
2015.3 825 274 125 8 48 108 6 49 2 50 67 37 9 1607 98
2015.4 885 288 77 8 47 116 6 41 1 47 77 37 8 1639 100
2016.1 895 266 126 9 49 119 5 42 1 41 82 36 4 1674 102
2016.2 892 266 116 10 50 126 5 42 2 32 88 36 5 1671 102
2016.3 911 256 125 12 56 125 5 43 3 29 94 39 5 1703 104
2016.4 896 278 93 13 59 119 5 42 4 24 96 39 5 1673 102
2017.1 880 278 81 14 62 102 5 42 5 20 89 37 5 1620 99
2017.2 874 269 65 15 66 82 6 40 6 17 77 38 5 1560 95
2017.3 879 248 74 16 62 91 6 45 5 25 90 47 5 1592 97
2017.4 888 230 89 18 55 102 5 48 3 33 99 55 5 1631 100
2018.1 941 240 95 20 58 105 5 52 3 36 107 61 6 1730 106
2018.2 997 247 104 22 62 108 6 56 4 39 116 69 6 1835 112
Fiscal year
2012 4271 845 280 58 190 244 30 295 20 429 398 394 47 7500
2013 3664 578 347 46 117 198 38 567 13 351 534 333 52 6840
2014 3238 701 713 52 168 278 43 795 15 396 527 174 83 7184
2015 3121 945 735 36 197 328 28 383 10 252 249 142 68 6495
2016 3497 1094 444 35 194 469 22 174 6 170 314 147 25 6593
2017 3562 1081 364 53 243 428 22 167 18 91 356 153 20 6557
2018 3705 964 362 77 237 407 22 200 15 133 412 231 23 6789

Queensland region construction supply and demand analysis: 1995-2026 and quarterly indicators to June 2018 – June Annual Report 2016 141
Table B.7 Public sector engineering value of work done – 2013-14 $ million
Brisbane Gold
coast Sunshine
Coast West
Moreton Wide Bay/
Burnett Darling Downs
South West Fitzroy
Central West Mackay Northern
Far North
North West Queensland
Queensland December
2015 = 100
2011.3 432 77 49 19 89 51 19 82 7 50 51 49 13 987 133
2011.4 536 101 61 22 114 66 35 100 10 52 68 70 15 1250 169
2012.1 508 104 59 21 112 65 50 95 11 42 70 78 14 1230 166
2012.2 571 129 69 23 134 79 87 110 15 42 87 105 16 1466 198
2012.3 428 111 56 18 111 66 104 88 14 28 75 98 12 1209 163
2012.4 461 102 57 28 111 86 11 123 7 51 81 83 21 1221 165
2013.1 430 102 53 25 106 83 16 114 8 40 81 90 19 1166 157
2013.2 470 120 59 27 121 95 26 125 10 37 96 115 20 1321 178
2013.3 384 108 51 22 105 84 33 105 9 26 87 113 16 1142 154
2013.4 417 102 78 31 86 123 9 92 6 44 63 77 17 1146 155
2014.1 387 89 73 26 80 115 10 79 7 78 59 72 16 1091 147
2014.2 372 80 72 23 78 111 9 71 7 104 57 70 16 1069 144
2014.3 276 57 55 21 63 83 8 58 6 55 42 52 12 787 106
2014.4 313 70 69 17 81 86 9 74 6 48 69 59 17 917 124
2015.1 300 65 70 21 86 85 10 84 6 24 75 61 17 903 122
2015.2 316 69 81 29 104 97 12 107 8 28 89 72 20 1032 139
2015.3 242 52 62 24 81 75 9 73 6 21 71 58 15 789 106
2015.4 237 60 48 14 45 93 15 82 9 28 39 48 25 741 100
2016.1 258 65 53 16 49 110 17 77 10 33 39 54 27 807 109
2016.2 270 69 59 16 56 126 18 69 10 39 41 57 28 857 116
2016.3 287 72 66 15 61 143 18 72 11 47 42 60 30 924 125
2016.4 287 88 45 23 60 117 18 81 8 43 53 54 22 899 121
2017.1 264 78 39 19 52 110 15 69 7 41 48 46 20 810 109
2017.2 300 91 41 19 52 130 17 72 7 47 63 49 22 910 123
2017.3 284 89 37 16 44 125 16 63 7 43 73 44 20 860 116
2017.4 297 99 36 14 41 135 16 64 7 54 89 45 21 918 124
2018.1 275 98 34 11 37 119 15 59 6 66 94 43 20 877 118
2018.2 283 107 34 9 37 116 16 60 7 84 98 44 21 917 124
Fiscal year
2012 2048 411 237 85 449 261 191 387 45 187 275 302 57 4933
2013 1789 435 226 98 448 330 157 450 39 156 332 387 71 4918
2014 1560 380 274 101 348 432 61 347 30 253 264 332 65 4447
2015 1205 261 275 88 333 352 38 322 26 154 275 244 65 3639
2016 1007 245 221 69 231 405 58 300 34 121 190 217 95 3194
2017 1137 329 191 76 226 501 68 294 33 177 207 210 94 3543
2018 1139 394 141 49 158 496 63 246 27 247 355 176 82 3572

Queensland region construction supply and demand analysis: 1995-2026 and quarterly indicators to June 2018 – June Annual Report 2016 142
Table B.8 Private sector engineering value of work done – 2013-14 $ million
Brisbane Gold
coast Sunshine
Coast West
Moreton Wide Bay/
Burnett Darling Downs
South West Fitzroy
Central West Mackay Northern
Far North
North West Queensland
Queensland December
2015 = 100
2011.3 1577 319 482 42 34 658 368 2256 34 846 231 119 225 7191 183
2011.4 1561 312 401 41 38 695 336 3478 33 869 225 117 220 8325 212
2012.1 1733 341 221 45 41 827 518 2639 55 1466 354 127 240 8608 219
2012.2 1545 282 195 37 34 806 634 3396 71 1374 320 105 292 9091 231
2012.3 1669 264 187 35 32 809 520 3497 78 1524 300 99 301 9314 237
2012.4 1356 251 178 33 59 807 587 3745 86 1559 285 94 286 9325 237
2013.1 1436 281 199 37 102 934 687 3643 100 1792 319 105 320 9954 253
2013.2 1330 251 179 33 63 823 633 3362 91 1579 285 94 287 9010 229
2013.3 1596 306 218 40 42 1002 777 4126 112 1812 347 114 378 10872 276
2013.4 1534 299 213 39 40 970 863 4076 110 1754 339 122 360 10719 272
2014.1 1451 290 206 38 39 940 743 3971 107 1625 328 122 280 10139 258
2014.2 1434 293 204 38 36 862 574 3843 86 1454 300 123 229 9476 241
2014.3 1420 306 200 40 23 461 541 3637 82 1208 209 128 147 8404 214
2014.4 1382 309 202 40 54 421 431 2984 227 811 210 129 149 7348 187
2015.1 1044 254 166 33 55 347 354 2524 225 670 173 106 123 6074 154
2015.2 825 201 132 26 42 273 279 1976 178 507 136 84 138 4797 122
2015.3 769 194 130 25 39 263 268 1796 171 422 131 80 131 4419 112
2015.4 578 158 106 20 25 213 218 1433 139 766 106 65 107 3935 100
2016.1 517 137 101 17 8 184 188 1286 120 667 91 55 93 3464 88
2016.2 777 195 131 25 12 232 202 1466 161 385 130 71 128 3916 100
2016.3 837 209 140 26 12 222 168 1307 166 381 138 76 117 3798 97
2016.4 1064 237 155 30 17 190 48 989 170 316 156 86 232 3688 94
2017.1 1004 225 147 28 16 173 45 1056 160 295 147 81 277 3656 93
2017.2 904 221 144 27 27 171 52 1090 157 264 144 79 494 3776 96
2017.3 898 220 143 27 16 166 49 1062 123 260 142 78 492 3676 93
2017.4 954 225 147 28 16 163 39 996 14 411 145 80 491 3708 94
2018.1 925 219 142 27 13 157 134 886 188 443 140 77 432 3782 96
2018.2 938 219 142 27 13 157 166 910 274 446 172 82 434 3979 101
Fiscal year
2012 6416 1254 1299 165 147 2986 1855 11769 193 4555 1130 469 977 33215
2013 5791 1047 743 137 255 3373 2427 14247 354 6454 1189 392 1194 37604
2014 6015 1187 841 155 157 3775 2956 16017 415 6645 1314 481 1248 41206
2015 4671 1071 700 139 174 1501 1606 11121 713 3197 727 447 556 26623
2016 2640 684 469 88 83 892 876 5981 591 2241 458 272 459 15733
2017 3808 892 586 112 73 756 313 4443 653 1255 585 321 1120 14918
2018 3715 883 574 108 57 643 389 3854 598 1560 599 318 1848 15145

Queensland region construction supply and demand analysis: 1995-2026 and quarterly indicators to June 2018 – June Annual Report 2016 143
Table B.9 Total engineering value of work done – 2013-14 $ million
Brisbane Gold
coast Sunshine
Coast West
Moreton Wide Bay/
Burnett Darling Downs
South West Fitzroy
Central West Mackay Northern
Far North
North West Queensland
Queensland December
2015 = 100
2011.3 2009 396 531 61 124 709 387 2338 41 896 282 168 238 8179 175
2011.4 2097 413 462 63 151 760 371 3578 44 921 293 186 235 9575 205
2012.1 2241 445 280 65 153 892 568 2734 66 1509 424 205 254 9837 210
2012.2 2116 411 264 60 168 885 721 3506 86 1416 407 210 307 10557 226
2012.3 2097 375 243 53 143 875 624 3585 92 1553 375 197 313 10524 225
2012.4 1817 353 235 61 170 893 598 3868 93 1610 366 177 307 10547 226
2013.1 1867 382 253 62 208 1017 703 3757 107 1831 400 195 339 11121 238
2013.2 1800 371 238 60 183 919 659 3487 101 1616 381 209 306 10331 221
2013.3 1981 415 268 62 146 1086 810 4231 121 1839 434 227 394 12013 257
2013.4 1951 401 290 70 126 1093 872 4168 116 1798 401 200 378 11864 254
2014.1 1838 379 280 63 119 1055 752 4051 114 1703 387 194 296 11230 240
2014.2 1805 373 276 61 113 973 583 3914 93 1557 357 193 245 10545 226
2014.3 1697 363 255 61 86 544 549 3695 88 1263 251 180 159 9191 197
2014.4 1695 379 270 57 135 507 440 3057 233 858 279 188 165 8264 177
2015.1 1344 320 236 54 140 432 364 2608 232 694 248 166 140 6977 149
2015.2 1141 270 213 55 146 370 291 2083 185 535 225 156 157 5829 125
2015.3 1011 246 192 48 119 338 278 1869 177 443 202 138 146 5208 111
2015.4 815 218 154 34 69 307 233 1514 147 794 145 114 132 4676 100
2016.1 775 202 154 33 58 294 204 1362 129 700 130 109 120 4271 91
2016.2 1047 264 190 41 67 358 220 1535 172 424 170 128 157 4773 102
2016.3 1123 281 205 41 73 365 187 1379 176 427 180 136 148 4722 101
2016.4 1350 325 200 53 77 307 65 1070 178 359 209 140 255 4587 98
2017.1 1268 304 186 47 69 284 61 1125 167 335 196 127 297 4466 96
2017.2 1204 312 185 46 80 301 69 1162 165 311 207 128 516 4686 100
2017.3 1182 310 180 43 60 291 64 1125 129 302 216 123 512 4536 97
2017.4 1251 324 183 41 56 298 55 1060 21 465 234 125 511 4626 99
2018.1 1200 317 175 37 49 277 149 945 194 509 234 120 452 4659 100
2018.2 1221 326 176 36 49 273 182 970 281 531 270 126 455 4896 105
Fiscal year
2012 8463 1665 1536 250 596 3247 2046 12156 238 4741 1405 770 1034 38148
2013 7580 1482 969 235 704 3704 2585 14697 393 6610 1521 779 1265 42522
2014 7575 1567 1114 256 505 4207 3017 16363 445 6897 1579 813 1313 45653
2015 5876 1332 975 227 508 1854 1643 11443 738 3351 1003 690 621 30262
2016 3647 930 690 157 314 1297 934 6281 625 2362 648 489 554 18928
2017 4945 1222 777 187 299 1257 381 4736 686 1432 792 531 1215 18461
2018 4853 1277 715 157 215 1139 451 4100 625 1807 954 494 1930 18717

Queensland region construction supply and demand analysis: 1995-2026 and quarterly indicators to June 2018 – June Annual Report 2016 144
Table B.10 Public dwelling value of work done – 2013-14 $ million
Brisbane Gold
coast Sunshine
Coast West
Moreton Wide Bay/
Burnett Darling Downs
South West Fitzroy
Central West Mackay Northern
Far North
North West Queensland
Queensland December
2015 = 100
2011.3 18 2 2 1 3 1 0 1 0 5 15 7 3 58 174
2011.4 16 3 1 0 2 1 0 1 0 1 14 5 3 48 142
2012.1 15 2 1 0 0 1 0 3 1 1 7 2 1 34 101
2012.2 10 1 0 0 0 1 0 5 0 1 5 1 1 28 83
2012.3 7 1 0 0 0 1 0 7 0 1 2 2 0 22 66
2012.4 4 0 0 1 0 0 0 6 0 1 1 3 1 16 48
2013.1 4 1 0 0 0 1 0 9 0 2 3 3 1 24 71
2013.2 2 0 0 0 0 2 0 10 0 2 6 4 1 28 82
2013.3 3 0 0 0 0 3 1 15 0 2 10 3 0 37 109
2013.4 3 0 0 0 1 2 0 19 0 1 11 6 0 43 127
2014.1 14 0 0 0 1 0 0 10 0 1 6 2 2 37 109
2014.2 12 0 0 0 0 0 0 8 0 1 4 2 1 28 84
2014.3 12 0 0 0 0 1 0 6 0 1 3 3 1 27 80
2014.4 8 1 0 0 0 3 0 8 0 1 2 5 0 29 85
2015.1 19 2 0 0 0 2 0 2 0 0 1 6 0 32 95
2015.2 19 3 0 0 1 2 0 1 0 1 4 7 1 39 116
2015.3 14 2 0 0 1 1 0 0 0 1 5 7 1 32 95
2015.4 11 2 1 0 1 1 0 0 0 1 7 8 2 34 100
2016.1 10 1 1 0 0 0 0 1 0 0 10 12 2 38 112
2016.2 15 3 0 0 0 0 0 1 0 0 6 15 3 43 127
2016.3 16 3 0 0 0 1 0 1 0 0 7 15 3 45 134
2016.4 16 3 0 0 0 1 0 1 0 0 7 16 3 47 141
2017.1 17 3 0 0 0 1 0 1 0 0 8 17 3 50 148
2017.2 18 3 0 0 0 1 0 1 0 0 8 17 3 51 152
2017.3 15 3 0 0 0 0 0 1 0 0 7 15 3 44 130
2017.4 16 3 0 0 0 1 0 1 0 0 7 15 3 45 135
2018.1 16 3 0 0 0 1 0 1 0 0 7 16 3 46 138
2018.2 16 3 0 0 0 1 0 1 0 0 7 16 3 47 140
Fiscal year
2012 59 9 4 2 5 4 0 10 2 8 42 15 9 168
2013 16 2 0 2 1 4 1 32 0 6 11 12 3 90
2014 32 0 0 0 2 5 1 53 0 4 31 13 3 144
2015 58 5 0 0 2 8 0 16 0 2 10 21 2 126
2016 50 8 2 0 2 3 0 2 0 2 28 42 7 146
2017 67 13 0 0 1 2 0 3 0 0 29 66 12 193
2018 63 12 0 0 1 2 0 3 0 0 28 62 11 183

Queensland region construction supply and demand analysis: 1995-2026 and quarterly indicators to June 2018 – June Annual Report 2016 145
Table B.11 Total construction: value of work done – 2013-14 $ million
Brisbane Gold
coast Sunshine
Coast West
Moreton Wide Bay/
Burnett Darling Downs
South West Fitzroy
Central West Mackay Northern
Far North
North West Queensland
Queensland December
2015 = 100
2011.3 5135 1140 927 153 391 977 408 2574 53 1167 557 419 259 14159 129
2011.4 5077 1069 845 148 393 999 390 3815 55 1177 573 455 257 15253 139
2012.1 5248 1114 688 153 388 1125 588 3001 77 1777 719 498 274 15650 143
2012.2 5041 992 665 152 392 1108 741 3799 97 1669 709 517 327 16210 148
2012.3 4647 887 604 138 337 1080 646 3883 100 1810 655 461 329 15578 142
2012.4 4446 902 621 155 374 1111 624 4229 101 1903 681 446 326 15918 145
2013.1 4322 926 618 149 399 1232 730 4173 115 2150 731 437 361 16344 149
2013.2 4256 927 636 145 380 1141 689 3959 109 1963 717 436 331 15689 143
2013.3 4370 995 718 145 345 1311 841 4749 130 2201 792 433 421 17450 159
2013.4 4407 987 756 151 328 1324 901 4683 124 2156 735 402 407 17362 159
2014.1 4347 994 779 142 326 1289 778 4515 121 2035 689 385 326 16727 153
2014.2 4453 1044 823 139 329 1219 606 4324 100 1858 635 381 275 16186 148
2014.3 4423 1046 812 138 304 794 569 4033 95 1517 505 364 188 14789 135
2014.4 4461 1093 846 132 353 754 458 3336 239 1077 521 373 191 13836 126
2015.1 4407 1116 824 134 369 686 382 2847 238 893 491 365 163 12915 118
2015.2 4206 1079 737 130 365 617 308 2273 191 713 458 355 176 11608 106
2015.3 4263 1129 731 125 345 609 295 2046 182 609 447 350 160 11292 103
2015.4 4232 1168 654 111 294 585 249 1675 151 948 395 331 146 10941 100
2016.1 4310 1198 721 112 288 576 219 1522 133 844 381 334 131 10771 98
2016.2 4652 1311 761 122 301 646 233 1695 176 555 416 357 168 11395 104
2016.3 4771 1363 794 125 312 645 199 1537 182 551 415 365 159 11420 104
2016.4 5091 1387 762 140 324 583 79 1227 185 478 449 375 267 11346 104
2017.1 4995 1408 720 134 316 540 74 1283 175 451 428 358 309 11191 102
2017.2 4928 1402 708 135 332 538 83 1317 173 423 426 361 528 11353 104
2017.3 4940 1399 724 137 319 545 79 1303 137 432 462 374 527 11378 104
2017.4 4952 1390 740 141 316 566 70 1255 27 613 502 392 529 11494 105
2018.1 4919 1401 751 141 315 549 165 1150 201 666 516 408 470 11651 106
2018.2 4982 1436 781 144 325 553 198 1188 288 701 573 439 475 12083 110
Fiscal year
2012 20502 4315 3126 607 1563 4208 2127 13189 282 5790 2558 1889 1116 61272
2013 17670 3642 2480 587 1491 4564 2688 16244 426 7826 2784 1780 1347 63529
2014 17577 4019 3076 578 1328 5144 3127 18271 475 8249 2850 1602 1430 67725
2015 17497 4334 3219 534 1392 2851 1718 12490 762 4201 1975 1458 718 53147
2016 17457 4807 2867 471 1228 2418 997 6939 643 2955 1639 1373 605 44399
2017 19784 5560 2985 534 1285 2305 435 5365 714 1902 1719 1460 1262 45310
2018 19792 5626 2996 564 1275 2213 512 4896 654 2412 2053 1613 2001 46607
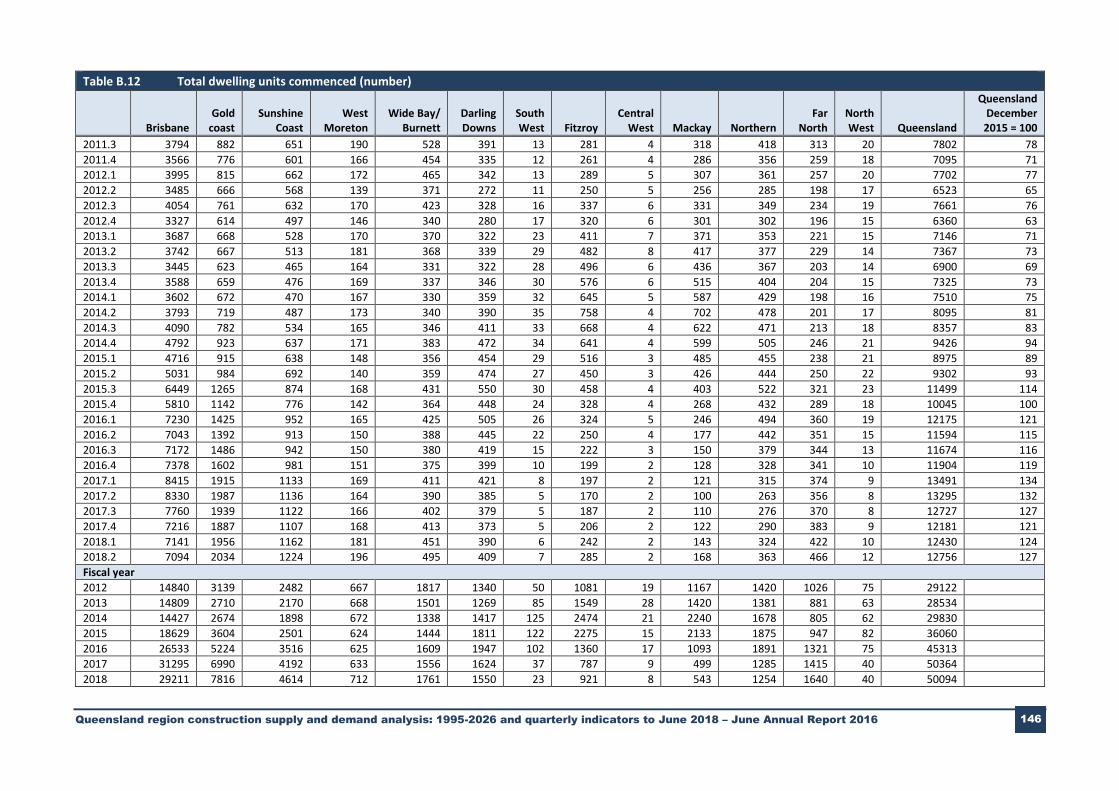
Queensland region construction supply and demand analysis: 1995-2026 and quarterly indicators to June 2018 – June Annual Report 2016 146
Table B.12 Total dwelling units commenced (number)
Brisbane Gold
coast Sunshine
Coast West
Moreton Wide Bay/
Burnett Darling Downs
South West Fitzroy
Central West Mackay Northern
Far North
North West Queensland
Queensland December
2015 = 100
2011.3 3794 882 651 190 528 391 13 281 4 318 418 313 20 7802 78
2011.4 3566 776 601 166 454 335 12 261 4 286 356 259 18 7095 71
2012.1 3995 815 662 172 465 342 13 289 5 307 361 257 20 7702 77
2012.2 3485 666 568 139 371 272 11 250 5 256 285 198 17 6523 65
2012.3 4054 761 632 170 423 328 16 337 6 331 349 234 19 7661 76
2012.4 3327 614 497 146 340 280 17 320 6 301 302 196 15 6360 63
2013.1 3687 668 528 170 370 322 23 411 7 371 353 221 15 7146 71
2013.2 3742 667 513 181 368 339 29 482 8 417 377 229 14 7367 73
2013.3 3445 623 465 164 331 322 28 496 6 436 367 203 14 6900 69
2013.4 3588 659 476 169 337 346 30 576 6 515 404 204 15 7325 73
2014.1 3602 672 470 167 330 359 32 645 5 587 429 198 16 7510 75
2014.2 3793 719 487 173 340 390 35 758 4 702 478 201 17 8095 81
2014.3 4090 782 534 165 346 411 33 668 4 622 471 213 18 8357 83
2014.4 4792 923 637 171 383 472 34 641 4 599 505 246 21 9426 94
2015.1 4716 915 638 148 356 454 29 516 3 485 455 238 21 8975 89
2015.2 5031 984 692 140 359 474 27 450 3 426 444 250 22 9302 93
2015.3 6449 1265 874 168 431 550 30 458 4 403 522 321 23 11499 114
2015.4 5810 1142 776 142 364 448 24 328 4 268 432 289 18 10045 100
2016.1 7230 1425 952 165 425 505 26 324 5 246 494 360 19 12175 121
2016.2 7043 1392 913 150 388 445 22 250 4 177 442 351 15 11594 115
2016.3 7172 1486 942 150 380 419 15 222 3 150 379 344 13 11674 116
2016.4 7378 1602 981 151 375 399 10 199 2 128 328 341 10 11904 119
2017.1 8415 1915 1133 169 411 421 8 197 2 121 315 374 9 13491 134
2017.2 8330 1987 1136 164 390 385 5 170 2 100 263 356 8 13295 132
2017.3 7760 1939 1122 166 402 379 5 187 2 110 276 370 8 12727 127
2017.4 7216 1887 1107 168 413 373 5 206 2 122 290 383 9 12181 121
2018.1 7141 1956 1162 181 451 390 6 242 2 143 324 422 10 12430 124
2018.2 7094 2034 1224 196 495 409 7 285 2 168 363 466 12 12756 127
Fiscal year
2012 14840 3139 2482 667 1817 1340 50 1081 19 1167 1420 1026 75 29122
2013 14809 2710 2170 668 1501 1269 85 1549 28 1420 1381 881 63 28534
2014 14427 2674 1898 672 1338 1417 125 2474 21 2240 1678 805 62 29830
2015 18629 3604 2501 624 1444 1811 122 2275 15 2133 1875 947 82 36060
2016 26533 5224 3516 625 1609 1947 102 1360 17 1093 1891 1321 75 45313
2017 31295 6990 4192 633 1556 1624 37 787 9 499 1285 1415 40 50364
2018 29211 7816 4614 712 1761 1550 23 921 8 543 1254 1640 40 50094

Queensland region construction supply and demand analysis: 1995-2026 and quarterly
indicators to June 2018 – June Annual Report 2016
147 147 147 147
Data definitions – Housing affordability
In terms of the design of housing affordability indicators, the issue is what are the factors that lead to a rapidly expanding local housing stock and, conversely, what are the values of the indicators that lead to stagnant conditions in local dwelling construction markets?
For sustainably expanding local resident markets two conditions must hold:
(i) the established dwelling price for a given housing type must be near or above the cost of the new construction cost for a comparable dwelling; and
(ii) the average mortgage on a newly constructed dwelling must be affordable in terms of the average labour market catchment income.
If (i) does not hold the developers will have no interest in initiating new projects since they will be forced on completion to sell the newly completed dwellings at below cost. If the average mortgage on new construction is too high, relative to labour market catchment income, then the newly completed dwellings will not, in the main, be sold and if they are, are likely to soon fall vacant.
The data is taken from the following sources. The dwelling price data is taken from RP data. The land cost is calculated by deducting the replacement cost estimate of dwellings from the established dwelling price with detached and attached dwellings considered separately. The replacement cost is estimated from the average approval values for new construction over the past 20 years.
The cost of new dwelling construction is the land value plus the average approval value over the past two years.
Catchment income from work is the average $ per hour and average hours of work per capita of the working age population available within a 60 minute travel time from the LGA. After 30 minutes travel time declining weights are used until after 60 minutes the weights are zero.
The mortgage cost is based on the current standard variable mortgage rate with a 20 year loan assumed.
The two conditions for local sustainable dwelling stock extension can be stated in terms of the data:
(i) the average mortgage cost on new dwelling construction is no more than 30% to 35% of catchment average income from work; and
(ii) the average mortgage on new construction dwellings is less than established dwellings.
Of course there will be exceptions in regions, such as the Gold Coast, where the immigration of cashed-up interstate households drive the local construction market. The same is true currently in relation to foreign buyers of new construction, especially apartments.
The assumption of the forecasts is this effect will fade over the next two to three years to more “normal” levels. There is, of course, considerable uncertainty as to what the “normal” may be.