Embed Size (px)
Citation preview
QUARTERLY REPORT31 March 2017

CONTENTS
1 Page 4 BMW GROUP IN FIGURES
2INTERIM GROUP MANAGEMENT REPORT
Page 9 Report on Economic Position Page 9 General Economic Environment Page 11 Automotive Segment Page 15 Motorcycles Segment Page 16 Financial Services Segment Page 18 Results of Operations, Financial Position and Net Assets
Page 26 Report on Outlook, Risks and Opportunities Page 26 Outlook Page 32 Risks and Opportunities
Page 33 BMW AG Stock and Capital Markets
3INTERIM GROUP FINANCIAL STATEMENTS
Page 36 Income Statement
Page 36 Statement of Comprehensive Income
Page 38 Balance Sheet
Page 40 Cash Flow Statement
Page 42 Statement of Changes in Equity
Page 44 Notes to the Group Financial Statements Page 44 Accounting Principles and Policies Page 47 Notes to the Income Statement Page 50 Notes to the Statement of Comprehensive Income Page 51 Notes to the Balance Sheet Page 55 Other Disclosures Page 58 Segment Information
4OTHER INFORMATION
Page 62 Financial Calendar
Page 63 Contacts
BMW GROUP IN FIGURES
1

BMW GROUP IN FIGURES
Key performance indicators reported during the year• 01
1st quarter 2017 1st quarter 2016 Change in %
Group
Profit before tax € million 3,005 2,368 26.9
Workforce 1 (at 31 March 2017 / 31 December 2016) 126,317 124,729 1.3
Automotive seGment
Sales volume 2 units 587,237 557,605 5.3
Revenues € million 20,692 18,814 10.0
EBIT margin 3 % (change in %pts) 9.0 9.4 – 0.4
motorcycles seGment
Sales volume units 35,636 33,788 5.5
EBIT margin 3 % (change in %pts) 20.1 16.2 3.9
1 Figures exclude suspended contracts of employment, employees in the non-work phases of pre-retirement part-time arrangements and low income earners.2 Including the joint venture BMW Brilliance Automotive Ltd., Shenyang (2017: 90,172 units, 2016: 81,900 units).3 Profit before financial result as percentage of segment revenues.
4
BMW Group in Figures

Further performance figures• 02
1st quarter 2017 1st quarter 2016 Change in %
Automotive seGment
Sales volume
BMW 1 units 503,445 478,743 5.2
MINI units 83,059 78,311 6.1
Rolls-Royce units 733 551 33.0
Total 1 587,237 557,605 5.3
Production volume
BMW 2 units 549,175 490,549 12.0
MINI units 97,899 89,057 9.9
Rolls-Royce units 855 701 22.0
Total 2 647,929 580,307 11.7
motorcycles seGment
Production volume units 54,466 40,280 35.2
FinAnciAl services seGment
New contracts with retail customers 465,634 413,372 12.6
Operating cash flow Automotive segment € million 2,626 1,219 –
Revenues € million 23,448 20,853 12.4
Automotive € million 20,692 18,814 10.0
Motorcycles € million 623 582 7.0
Financial Services € million 7,046 6,032 16.8
Other Entities € million 2 1 –
Eliminations € million – 4,915 – 4,576 – 7.4
Profit before financial result (EBIT) € million 2,646 2,457 7.7
Automotive € million 1,871 1,763 6.1
Motorcycles € million 125 94 33.0
Financial Services € million 604 591 2.2
Other Entities € million 4 11 – 63.6
Eliminations € million 42 – 2 –
Profit before tax € million 3,005 2,368 26.9
Automotive € million 2,279 1,734 31.4
Motorcycles € million 125 94 33.0
Financial Services € million 595 570 4.4
Other Entities € million – 4 – 2 –
Eliminations € million 10 – 28 –
Income taxes € million – 856 – 727 – 17.7
Net profit € million 2,149 1,641 31.0
Earnings per share 3 € 3.26 / 3.26 2.48 / 2.48 31.5 / 31.5
1 Including the joint venture BMW Brilliance Automotive Ltd., Shenyang (2017: 90,172 units, 2016: 81,900 units).2 Including the joint venture BMW Brilliance Automotive Ltd., Shenyang (2017: 98,715 units, 2016: 57,111 units).3 Common / preferred stock. In computing earnings per share of preferred stock, earnings to cover the additional dividend of € 0.02 per share of preferred stock are spread over the quarters of the corresponding
financial year.
5

Positive start to year for sales volumesThe BMW Group recorded a new first-quarter all-time high for automobile sales in the first three months of 2017, with 587,237* BMW, MINI and Rolls-Royce brand vehicles sold worldwide (2016: 557,605* units; + 5.3 %).
BmW Group sales volume of automobiles*• 03
in 1,000 units
557.6 587.2 605.5 583.5621.0 700
350
0
Q1 2017 2016
Q2 2016
Q3 2016
Q4 2016
* Including the joint venture BMW Brilliance Automotive Ltd., Shenyang (2017: 90,172 units, 2016: 81,900 units).
The Motorcycles segment also achieved its best-ever first-quarter sales figure, despite difficult market conditions. Worldwide, motorcycles sales rose by a solid 5.5 % to 35,636 units (2016: 33,788 units).
During the first quarter of 2017, the Financial Services segment continued its successful performance of the past year, concluding a total of 465,634 new lease and credit financing contracts with retail customers (2016: 413,372 contracts; + 12.6 %).
Revenues and earnings both up on previous yearFirst-quarter Group revenues grew significantly by 12.4 % to € 23,448 million (2016: € 20,853 million), mainly driven by the sales volume increase.
BmW Group revenues• 04
in € billion
20.9 23.4
25.0 23.4
24.9 30
15
0
Q1 2017 2016
Q2 2016
Q3 2016
Q4 2016
At € 2,646 million, Group EBIT was 7.7 % up on the previous year (2016: € 2,457 million).
BMW Group profit before financial result (EBIT)• 05
in € billion
2.5 2.6 2.7 2.4
1.8
3.0
1.5
0
Q1 2017 2016
Q2 2016
Q3 2016
Q4 2016
6
BMW Group in Figures

Higher expenses and investment for research and development, personnel and IT had an adverse effect on the development. However, pre-tax profit increased by more than a quarter to € 3,005 million (2016: € 2,368 million; + 26.9 %).
BMW Group profit before tax• 06
in € billion
2.4
3.0 2.8
2.6
1.9
3.5
1.75
0
Q1 2017 2016
Q2 2016
Q3 2016
Q4 2016
The improvement was mainly driven by valuation effects in the result from equity accounted investments and in other financial result. Further information is provided in the “Automotive segment” section.
Slight increase in workforce sizeThe BMW Group employed a workforce of 126,317 worldwide at the end of the first quarter 2017 (31 December 2016: 124,729; + 1.3 %). The company’s need for skilled workers and IT specialists in future-ori-ented areas, such as digitalisation and autonomous driving, remains high.
7

INTERIM GROUP MANAGEMENT REPORT
Page 9 Report on Economic Position Page 9 General Economic Environment
Page 11 Automotive Segment
Page 15 Motorcycles Segment
Page 16 Financial Services Segment
Page 18 Results of Operations, Financial Position and Net Assets
Page 26 Report on Outlook, Risks and Opportunities Page 26 Outlook
Page 32 Risks and Opportunities
Page 33 BMW AG Stock and Capital Markets
2

GENERAL ECONOMIC ENVIRONMENT
Automobile markets in the first quarter 2017The pace of growth on international automobile mar-kets slowed down somewhat at the beginning of the year, with registrations rising by only 1.7 % overall. The slight increase recorded in the first quarter was largely due to positive developments in Europe and Japan. By contrast, new registrations in the USA, China and a number of emerging economies were down.
The positive trend in Europe continued with a further 8.1 % increase in registrations during the first three months of 2017. Almost all of the region’s automobile markets recorded growth. Germany (+ 6.7 %), France (+ 5.1 %) and the UK (+ 6.2 %) reported a robust increase in demand. Particularly significant was the increase in Italy (+ 11.6 %) and Spain (+ 7.9 %) during the first quarter.
After six years of strong expansion, the US market has seen a phase of consolidation since 2016, which continued at the beginning of 2017 and is reflected in a 1.5 % drop in registrations.
The automobile market in China saw a slow start to the year, with new registrations broadly in line with the previous year (– 0.3 %).
Despite sluggish economic growth, new registrations in Japan grew at a robust pace (+ 7.3 %) during the first three months of 2017.
New registrations in Brazil and Russia continued to fall, albeit at a slightly slower rate than in previous years. The Brazilian automobile market contracted year-on-year (– 2.8 %). The downward trend in Russia slowed significantly (– 0.9 %).
REPORT ON ECONOMIC POSITIONBest first quarter to date for automobile and motorcycles sales volumes
For the first time, over 500,000 BMW brand vehicles delivered in a first quarter
€ 3,005 million+ 26.9 %
Profit before tax driven by positive valuation effects in financial result
9

Motorcycle markets in the first quarter 2017Motorcycle markets in the 250 cc plus class were gen-erally slower at the beginning of the year, reflected in a 3.3 % drop in motorcycle registrations worldwide. The European market was on a par with the previous year (+ 0.3 %). The German market, however, decreased by 1.2 %. Other major motorcycle markets in Europe also fell short of the previous year’s mark. Italy saw only a slight decrease (– 0.5 %), while the Spanish market contracted by 3.9 %. The only major market in Europe with an increase was France, where registrations rose by 5.4 % in the first quarter. Following a weak previous year, the US market saw a further decrease in motor-cycle sales (– 5.2 %).
Financial services markets in the first quarter 2017The European Central Bank (ECB) continued its expansionary policies, despite improving growth rates, positive signals from the job market and a sharp rise in inflation during the first quarter.
The picture for the UK economy was somewhat mixed during this period. While growth figures remained stable and unemployment low, the rate of inflation rose strongly due to the ongoing weakness of the British pound. The Bank of England adopted a cau-tious approach and continued to pursue a policy of monetary expansion.
In the USA, the Federal Reserve decided to raise its benchmark interest rate by 25 basis points on the back of strong job market data, stable economic growth and an inflation rate close to the target level of 2 % in March.
China’s economy benefited from substantial invest-ment in infrastructure during the first quarter and therefore started the year on a more dynamic footing. However, high debt ratios and the risk of greater trade barriers with the USA dampened market sentiment. The Chinese central bank undertook measures to counteract capital flight and further currency deval-uation by raising short-term money market rates and implementing currency measures.
Boosted by a strong export performance, the Japanese economy remained on course for recovery at the beginning of the year. The Japanese central bank nevertheless continued its expansionary monetary policy.
Selling prices of premium segment pre-owned vehi-cles on international markets developed in line with expectations during the first quarter of 2017. Prices of pre-owned vehicles fell slightly in Europe due to seasonal factors, but remained stable in Asia. In North America, the slight downward trend recorded during the previous year continued into the first quarter of 2017.
Interim Group Management Report
10
Report on Economic Position
General Economic Environment
Automotive Segment

Automotive Segment
New record for automobile sales in first quarterThe BMW Group sold 587,237 1 BMW, MINI and Rolls-Royce brand vehicles during the first quarter (2016: 557,605 1 units; + 5.3 %), registering a new first-quarter sales volume record for the seventh year in succession. The performance was driven by all brands. BMW exceeded the 500,000-unit threshold for the first time in a first quarter (503,445 1 units; 2016: 478,743 1 units; + 5.2 %). MINI delivered 83,059 vehicles
to customers worldwide (2016: 78,311 units; + 6.1 %). Rolls-Royce Motor Cars increased sales by approxi-mately one third to 733 units (2016: 551 units; + 33.0 %).
Double-digit sales volume growth in ChinaFirst-quarter sales of BMW, MINI and Rolls-Royce brand vehicles in Asia grew by a solid 9.2 % to 200,140 1 units (2016: 183,204 1 units). Sales volume growth in China was particularly dynamic, with deliveries up by 12.4 % year-on-year (142,958 1 units; 2016: 127,167 1 units).
Automotive segment sales volume of vehicles by region and market• 07
in units 1st quarter 2017 1st quarter 2016 Change in %
Europe 267,996 257,120 4.2
thereof Germany 67,432 66,649 1.2
thereof UK 63,004 59,169 6.5
Americas 102,238 100,245 2.0
thereof USA 82,169 81,601 0.7
Asia 1 200,140 183,204 9.2
thereof China 1 142,958 127,167 12.4
Other markets 16,863 17,036 – 1.0
Total 1 587,237 557,605 5.3
The BMW Group sold a total of 267,996 automobiles (2016: 257,120 units; + 4.2 %) in Europe during the first three months of 2017. The number of vehicles sold in Germany was slightly higher than one year earlier at 67,432 units (2016: 66,649 units; + 1.2 %). Despite the uncertainty caused by Brexit, sales of the Group’s three brands in the UK rose by a solid 6.5 % to 63,004 units (2016: 59,169 units).
On the American continent, the BMW Group sold 102,238 BMW, MINI and Rolls-Royce brand vehicles during the first three months (2016: 100,245 units; + 2.0 %). In the USA, sales volumes were at the level of the previous year with 82,169 units sold (2016: 81,601 units; + 0.7 %).
Automotive segment at a glance• 08
1st quarter 2017 1st quarter 2016 Change in %
Sales volume 1, 2 units 587,237 557,605 5.3
Production 3 units 647,929 580,307 11.7
Revenues 2 € million 20,692 18,814 10.0
Profit before financial result (EBIT) € million 1,871 1,763 6.1
Profit before tax € million 2,279 1,734 31.4
EBIT margin 2 % (change in %pts) 9.0 9.4 – 0.4
Workforce (at 31 March 2017 / 31 December 2016) 114,265 112,869 1.2
1 Including the joint venture BMW Brilliance Automotive Ltd., Shenyang (2017: 90,172 units, 2016: 81,900 units).2 Key performance indicators reported on during the year.3 Including the joint venture BMW Brilliance Automotive Ltd., Shenyang (2017: 98,715 units, 2016: 57,111 units).
11

For the first time, over 500,000 BMW brand vehicles delivered in a first quarter*With 503,445 vehicles sold, BMW exceeded the 500,000-delivery mark for the first time in a first quarter (2016: 478,743 units; + 5.2 %). This was mainly driven by sales of BMW X family models as well as the new BMW 5 and 7 Series Sedans. Diesel vehicles also saw favourable demand.
At 42,036 units, sales volumes for the BMW 1 Series from January to March 2017 were on a par with the previous year (2016: 41,859 units; + 0.4 %). Sales of the 2 Series fell slightly to 42,817 units (2016: 43,657 units; – 1.9 %). Customers took delivery of a total of 100,265 units of the BMW 3 Series (2016: 103,225 units; – 2.9 %). The new BMW 5 Series Sedan has been available since mid-February 2017 and had already recorded sales volume of 16,745 units by the
end of the reporting period. Overall, first-quarter sales of the 5 Series were 1.6 % up on the previous year at 83,459 units (2016: 82,171 units). The follow-up model to the highly successful 5 Series extended-wheelbase version will become available in China in June 2017. The BMW 7 Series proved extremely popular, exceed-ing the previous year’s first-quarter figures by around one half (15,898 units; 2016: 10,588 units; + 50.2 %).
Demand for BMW X vehicles grew significantly, with deliveries up 14.3 % in the first three months of 2017 to 176,836 units (2016: 154,746 units). Sales of the BMW X1 increased by more than a quarter to 66,063 units (2016: 51,002 units; + 29.5 %) during the same period. The BMW X3 recorded solid growth (41,742 units; 2016: 38,719 units; + 7.8 %), while the X5 saw a significant rise in sales volume to 45,892 units, exceeding the previous year’s high figure (2016: 39,007 units; + 17.7 %).
Automotive segment sales volume of BmW vehicles by model series*• 09
in units 1st quarter 2017 1st quarter 2016 Change in %
BMW 1 Series 42,036 41,859 0.4
BMW 2 Series 42,817 43,657 – 1.9
BMW 3 Series 100,265 103,225 – 2.9
BMW 4 Series 30,745 32,729 – 6.1
BMW 5 Series 83,459 82,171 1.6
BMW 6 Series 2,522 3,292 – 23.4
BMW 7 Series 15,898 10,588 50.2
BMW X1 66,063 51,002 29.5
BMW X3 41,742 38,719 7.8
BMW X4 12,960 14,975 – 13.5
BMW X5 45,892 39,007 17.7
BMW X6 10,179 11,043 – 7.8
BMW Z4 769 1,348 – 43.0
BMW i 8,098 5,128 57.9
BMW total 503,445 478,743 5.2
* Including the joint venture BMW Brilliance Automotive Ltd., Shenyang (2017: 90,172 units, 2016: 81,900 units).
Interim Group Management Report
12
Report on Economic Position
General Economic Environment
Automotive Segment

MINI achieves new sales volume recordSales of 83,059 vehicles during the period from January to March 2017 also represented a new first-quarter sales volume record for the MINI brand (2016: 78,311 units; + 6.1 %). With 47,530 units sold, the MINI 3- and 5-door models matched their previous year’s performance
(2016: 47,396 units; + 0.3 %). The new MINI Clubman saw significant sales volume growth to 14,830 units (2016: 12,173 units; + 21.8 %). First-quarter sales of the new MINI Convertible tripled to 7,705 units (2016: 2,553 units).
Automotive segment sales volume of mini vehicles by model variant• 10
in units 1st quarter 2017 1st quarter 2016 Change in %
MINI Hatch (3- and 5-door) 47,530 47,396 0.3
MINI Convertible 7,705 2,553 –
MINI Clubman 14,830 12,173 21.8
MINI Countryman / Paceman 12,994 16,189 – 19.7
MINI total 83,059 78,311 6.1
Strong first quarter for Rolls-RoyceRolls-Royce Motor Cars delivered 733 vehicles to cus-tomers during the period under report (2016: 551 units; + 33.0 %). First-quarter sales of the Rolls-Royce Ghost
rose to 243 units (2016: 206 units; + 18.0 %). Sales of the Rolls-Royce Wraith and Dawn models in the three-month period grew by more than one half (434 units; 2016: 286 units; + 51.7 %).
Automotive Segment sales volume of RollsRoyce vehicles by model variant• 11
in units 1st quarter 2017 1st quarter 2016 Change in %
Phantom 56 59 – 5.1
Ghost 243 206 18.0
Wraith / Dawn 434 286 51.7
Rolls-Royce total 733 551 33.0
Electrified vehicles see successful start to the year BMW i and iPerformance models are making a clear contribution to brand success. Sales of electrified vehicles doubled in the first three months of 2017 (19,400 units; 2016: 9,648 units; + 101.1 %). The BMW i3
was also in high demand in the first quarter, with deliveries increasing by over two-thirds to 7,431 units (2016: 4,441 units; + 67.3 %). A significant proportion of electrified vehicle sales (11,302 units) related to BMW plug-in hybrid models sold under the “ iPerformance” brand name (2016: 4,520 units).
Automotive Segment sales volume of electrified models• 12
in units 1st quarter 2017 1st quarter 2016 Change in %
BMW i 8,098 5,128 57.9
BMW iPerformance 11,302 4,520 –
Total 19,400 9,648 101.1
13

Significant increase in automobile productionStrong demand and the introduction of new mod-els resulted in a significant increase in production volume in the first quarter of 2017. In total, 647,929* BMW, MINI and Rolls-Royce brand vehicles rolled off assembly lines of the BMW Group production network during the reporting period (2016: 580,307* units; + 11.7 %), comprising 549,175* BMW (2016: 490,549* units; + 12.0 %), 97,899 MINI (2016: 89,057 units; + 9.9 %) and 855 Rolls-Royce vehicles (2016: 701 units; + 22.0 %).
Revenues and earnings increase – profitability within target rangeAutomotive segment revenues for the period from January to March 2017 increased significantly, sur-passing the € 20 billion mark for the first time in an initial three-month period (€ 20,692 million; 2016: € 18,814 million; + 10.0 %). The positive development was mainly driven by the increase in sales volume.
Despite a challenging competitive environment and higher costs and investment in research and devel-opment, personnel and IT, EBIT rose by € 108 million to € 1,871 million (2016: € 1,763 million; + 6.1 %). At 9.0 %, the EBIT margin was within the target range of between 8 and 10 % (2016: 9.4 %; – 0.4 percentage points).
First-quarter segment profit before tax increased by 31.4 % to € 2,279 million (2016: € 1,734 million). This was mainly due to the significantly improved result from equity accounted investments. This includes a positive valuation effect of € 183 million in conjunction with the participation of new investors in the HERE mapping service. Further disclosures relating to the transaction are provided in note 2. In addition, the earnings contribution for the period from the joint venture BMW Brilliance Automotive Ltd., Shenyang, was higher than in the previous year. Moreover, other financial result reported by the segment improved by € 100 million.
Automotive segment workforce increasesAt 31 March 2017, the BMW Group employed a work-force of 114,265 in the Automotive segment (31 Decem-ber 2016: 112,869 employees), an increase of 1.2 %.
see note 2
* Including the joint venture BMW Brilliance Automotive Ltd., Shenyang (2017: 98,715 units, 2016: 57,111 units).
Interim Group Management Report
14
Report on Economic Position
General Economic Environment
Automotive Segment
Motorcycles Segment

Motorcycles Segment
Solid rise in Motorcycles segment sales volumeBMW Motorrad also had a successful start to the year. The segment sold 35,636 motorcycles worldwide dur-ing the three-month period under report, achieving a record first-quarter sales volume performance for the sixth year in succession (2016: 33,788 units; + 5.5 %). In Europe, sales rose significantly by 10.3 % to 22,991 units (2016: 20,849 units), despite difficult market conditions. Sales in Germany grew by 2.8 % to 5,824 units (2016: 5,668 units). Business also developed positively in Italy, where BMW Motorrad recorded first-quarter sales of 3,463 units (2016: 3,125 units; + 10.8 %). First-quarter sales in France improved significantly by 14.4 % to 3,696 units (2016: 3,230 units). By contrast, sales vol-ume in the USA dropped moderately to 2,866 units (2016: 3,022 unit; – 5.2 %).
Significant increase in motorcycle productionA total of 54,466 motorcycles rolled off the production lines during the first three months of 2017, 35.2 % more than one year earlier (2016: 40,280 units). This significant year-on-year increase was mainly due to initial supply of the latest models to the dealership organisation.
Earnings up by one thirdIn the first quarter, the Motorcycles segment benefit-ed from sales volume growth and the trend towards higher-value models. The sale of optional equipment also made a significant contribution to earnings. Segment revenues rose by 7.0 % to € 623 million (2016: € 582 million). Both EBIT and profit before tax improved by approximately one third to € 125 million (2016: both € 94 million; + 33.0 %). The EBIT margin for the Motorcycles segment came in at 20.1 % (2016: 16.2 %; + 3.9 percentage points).
Workforce up slightly on previous yearThe BMW Group employed 3,424 people in the Motor-cycles segment at 31 March 2017 (31 December 2016: 3,351 employees; + 2.2 %).
motorcycles segment at a glance• 13
1st quarter 2017 1st quarter 2016 Change in %
Sales volume * units 35,636 33,788 5.5
Production units 54,466 40,280 35.2
Revenues € million 623 582 7.0
Profit before financial result (EBIT) € million 125 94 33.0
Profit before tax € million 125 94 33.0
EBIT margin * % (change in %pts) 20.1 16.2 3.9
Workforce (at 31 March 2017 / 31 December 2016) 3,424 3,351 2.2
* Key performance indicators reported on during the year.
15
Financial Services Segment
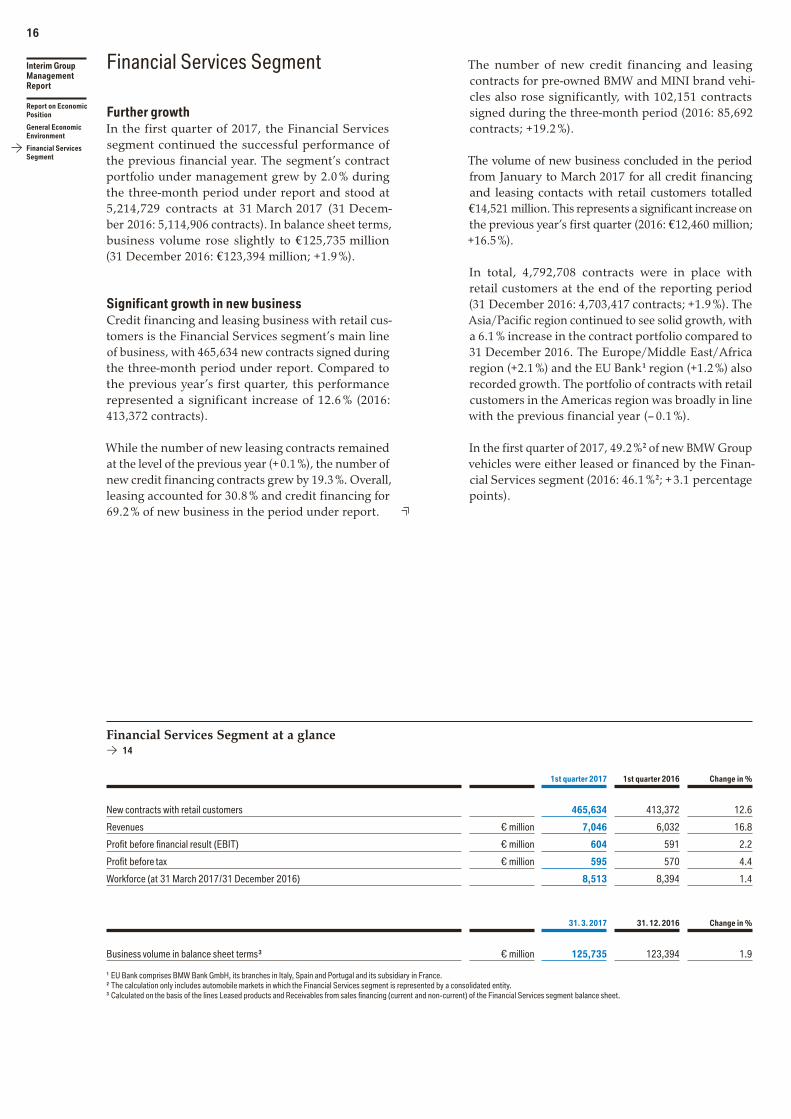
Further growthIn the first quarter of 2017, the Financial Services segment continued the successful performance of the previous financial year. The segment’s contract portfolio under management grew by 2.0 % during the three-month period under report and stood at 5,214,729 contracts at 31 March 2017 (31 Decem-ber 2016: 5,114,906 contracts). In balance sheet terms, business volume rose slightly to € 125,735 million (31 December 2016: € 123,394 million; + 1.9 %).
Significant growth in new businessCredit financing and leasing business with retail cus-tomers is the Financial Services segment’s main line of business, with 465,634 new contracts signed during the three-month period under report. Compared to the previous year’s first quarter, this performance represented a significant increase of 12.6 % (2016: 413,372 contracts).
While the number of new leasing contracts remained at the level of the previous year (+ 0.1 %), the number of new credit financing contracts grew by 19.3 %. Overall, leasing accounted for 30.8 % and credit financing for 69.2 % of new business in the period under report.
The number of new credit financing and leasing contracts for pre-owned BMW and MINI brand vehi-cles also rose significantly, with 102,151 contracts signed during the three-month period (2016: 85,692 contracts; + 19.2 %).
The volume of new business concluded in the period from January to March 2017 for all credit financing and leasing contacts with retail customers totalled € 14,521 million. This represents a significant increase on the previous year’s first quarter (2016: € 12,460 million; + 16.5 %).
In total, 4,792,708 contracts were in place with retail customers at the end of the reporting period (31 December 2016: 4,703,417 contracts; + 1.9 %). The Asia / Pacific region continued to see solid growth, with a 6.1 % increase in the contract portfolio compared to 31 December 2016. The Europe / Middle East / Africa region (+ 2.1 %) and the EU Bank 1 region (+ 1.2 %) also recorded growth. The portfolio of contracts with retail customers in the Americas region was broadly in line with the previous financial year (– 0.1 %).
In the first quarter of 2017, 49.2 % 2 of new BMW Group vehicles were either leased or financed by the Finan-cial Services segment (2016: 46.1 % 2; + 3.1 percentage points).
Financial services segment at a glance• 14
1st quarter 2017 1st quarter 2016 Change in %
New contracts with retail customers 465,634 413,372 12.6
Revenues € million 7,046 6,032 16.8
Profit before financial result (EBIT) € million 604 591 2.2
Profit before tax € million 595 570 4.4
Workforce (at 31 March 2017 / 31 December 2016) 8,513 8,394 1.4
31. 3. 2017 31. 12. 2016 Change in %
Business volume in balance sheet terms 3 € million 125,735 123,394 1.9
1 EU Bank comprises BMW Bank GmbH, its branches in Italy, Spain and Portugal and its subsidiary in France.2 The calculation only includes automobile markets in which the Financial Services segment is represented by a consolidated entity.3 Calculated on the basis of the lines Leased products and Receivables from sales financing (current and non-current) of the Financial Services segment balance sheet.
Interim Group Management Report
16
Report on Economic Position
General Economic Environment
Financial Services Segment

Fleet business at previous year’s level Operating under the brand name “Alphabet”, the BMW Group is one of the leading leasing and full-ser-vice providers of fleet management services in Europe. Alphabet provides leasing and financing arrangements and other specific services to commercial customers. In total, 649,191 contracts were in place at the end of the reporting period (31 December 2016: 644,420 con-tracts; + 0.7 %).
Solid increase in new multi-brand financing businessThe multi-brand financing line of business operated by the Financial Services segment recorded a solid increase in the number of new contracts signed in the reporting period, with an increase of 7.9 % to 42,143 contracts (2016: 39,052 contracts). At 31 March 2017, the total portfolio comprised 483,114 contracts, slight-ly above the year-end 2016 level (31 December 2016: 466,436 contracts; + 3.6 %).
Dealership financing slightly up on previous yearThe total volume of dealership financing also increased in the first quarter, rising by 1.9 % to € 18,648 million at the end of the reporting period (31 December 2016: € 18,307 million).
Slight increase in deposit businessDeposit taking provides an important source of refinancing for the Financial Services segment. The volume of bank deposits increased slightly to € 13,743 million during the first three months of 2017 (31 December 2016: € 13,512 million; + 1.7 %).
Solid growth in new insurance businessThe number of insurance contracts signed during the first quarter rose by 7.7 % to 318,318 (2016: 295,439 contracts). A total of 3,453,091 brokered insurance contracts was in place at the end of the reporting peri-od (31 December 2016: 3,411,872 contracts; + 1.2 %).
Higher revenues and earningsReflecting the segment’s positive business develop-ment during the first quarter of 2017, segment revenues grew significantly by 16.8 % to € 7,046 million (2016: € 6,032 million). Profit before taxes for the three-month period amounted to € 595 million, slightly higher than one year earlier (2016: € 570 million; + 4.4 %).
Workforce increaseThe Financial Services segment’s growth is also reflected in the size of its workforce, which comprised 8,513 employees worldwide at the end of the reporting period (31 December 2016: 8,394 employees), a 1.4 % increase over the three-month period.
17

RESULTS OF OPERATIONS, FINANCIAL POSITION AND NET ASSETS
Results of operationsIn the first quarter of 2017, the BMW Group once again recorded year-on-year growth in revenues,
sales volume and profit before tax. The number of BMW, MINI and Rolls-Royce brand vehicles delivered to customers rose by a solid 5.3 % to 587,237 units. The figure includes 90,172 units (2016: 81,900 units) manufactured by the joint venture BMW Brilliance Automotive Ltd., Shenyang.
At the end of the reporting period, the BMW Group’s workforce comprised 126,317 employees worldwide (31 December 2016: 124,729).
BmW Group condensed income statement • 15
in € million 1st quarter 2017 1st quarter 2016 Change in %
Revenues 23,448 20,853 12.4
Cost of sales – 18,637 – 16,373 13.8
Gross profit 4,811 4,480 7.4
Selling and administrative expenses – 2,178 – 1,988 9.6
Other operating income and expenses 13 – 35 –
Profit before financial result 2,646 2,457 7.7
Financial result 359 – 89 –
Profit before tax 3,005 2,368 26.9
Income taxes – 856 – 727 17.7
Net profit 2,149 1,641 31.0
Profit before tax for the first quarter of 2017 was significantly higher than one year earlier. The pre-tax return on sales – Group profit before tax as a percentage of Group revenues – was 12.8 % (2016: 11.4 %) and therefore slightly up on the previous year’s first quarter. Earnings per share amounted to € 3.26 for both common and preferred stock (2016: € 2.48 common and preferred stock).
BMW Group revenues increased significantly com-pared to the previous year by € 2,595 million to reach € 23,448 million for the three-month period. The main drivers of this performance were the higher volume of automobiles and motorcycles sold and the growth of the Financial Services segment’s contract portfolio and sales of returned leasing vehicles in the terminations business. Positive currency factors also contributed to the increase in revenues, with most of the impact attributable to changes in the average exchange rates of the Russian rouble, the South African rand and the US dollar against the euro.
The Group’s first-quarter cost of sales was significantly higher year-on-year, due to sales volume and portfolio
factors. Cost of sales relating to Financial Services business also rose significantly by € 999 million to € 5,911 million, reflecting the increased portfolio size. At € 1,185 million (2016: € 985 million), research and development expenses were also significantly higher year-on-year. As a percentage of revenues, research and development expenses increased from 4.7 % to 5.1 %. Total research and development expenditure – comprising research and development expenses (excluding the associated amortisation), and new expenditure for capitalised development cost, including development prepayments – amounted to € 1,317 million in the first quarter 2017 (2016: € 974 mil-lion). The increase was due primarily to the higher level of development costs capitalised in conjunction with new model launches as compared to the same quarter of the previous year. This resulted in a research and development ratio – calculated as research and non-capitalised development costs divided by Group revenues – of 5.6 % (2016: 4.7 %). The capitalisation rate for this period – calculated as capitalised develop-ment costs divided by total research and development expenditure – was 33.1 % (2016: 30.1 %).
Interim Group Management Report
18
Report on Economic Position
Results of Operations, Financial Position and Net Assets

Gross profit amounted to € 4,811 million, with the solid rise of € 331 million reflecting increased vehicles sales and business volumes in the Financial Services segment. The gross profit margin – calculated as gross profit divided by Group revenues – came in at 20.5 % (2016: 21.5 %).
Selling and administrative expenses compared to the previous year’s first quarter were € 190 million higher at € 2,178 million. As a percentage of revenues, the expense ratio was 9.3 % (2016: 9.5 %). The increase in selling and administrative expenses mainly reflects the larger workforce and higher IT expenses.
Depreciation and amortisation on property, plant and equipment and intangible assets recorded in cost of sales and in selling and administrative expenses at € 1,190 million (2016: € 1,187 million) was in line with the previous year due to stable levels of investment and capitalised development costs in recent years.
Other operating income and expenses improved significantly to a net positive amount of € 13 million (2016: € – 35 million). The improvement was due amongst others to lower expenses, as the previous year’s figures included a donation to a BMW foun-dation.
Profit before financial result (EBIT) for the first quarter amounted to € 2,646 million (2016: € 2,457 million). The improvement was largely due to the higher gross profit, which was mitigated by a solid increase in sales and administrative expenses.
Compared to the first quarter of 2016, the financial result improved by € 448 million to € 359 million. The improvement was mainly due to the result from equity-accounted investments, which includes the Group’s share of the results of the joint ventures BMW Brilliance Automotive Ltd., Shenyang, the DriveNow companies (DriveNow GmbH & Co. KG, Munich, and DriveNow Verwaltungs GmbH, Munich) and the asso-ciated company THERE Holding B. V., Amsterdam. Thanks to a € 183 million positive effect following the sale of 15 % of the shares in HERE International B. V., Amsterdam, by THERE Holding B. V., Amsterdam, and a higher earnings contribution from BMW Brilliance Automotive Ltd., Shenyang, due to higher sales vol-umes, the first-quarter result from equity-accounted investments improved by € 280 million to € 351 mil-lion. In addition, other financial result improved by € 122 million to € 45 million. This is due to the result on investments which included no impairment losses on other investments (2016: € – 66 million) and positive valuation effects on interest rate derivates. Further-more, the net interest result improved by € 46 million to € – 37 million, due to higher interest income and lower refinancing costs compared to the previous year.
In addition to higher business volumes, the significant-ly improved financial result in particular contributed to the increase in profit before tax to € 3,005 million (2016: € 2,368 million).
Income tax expense amounted to € 856 million (2016: € 727 million), resulting in an effective tax rate – based on income tax expense as a percentage of Group profit before tax – of 28.5 % (2016: 30.7 %).
The after-tax return on sales – calculated as Group net profit divided by Group revenues – was 9.2 % (2016: 7.9 %).
19

Results of operations by segment
BmW Group revenues by segment• 16
in € million 1st quarter 2017 1st quarter 2016 Change in %Currency adjusted
change* in %
Automotive 20,692 18,814 10.0 8.9
Motorcycles 623 582 7.0 5.1
Financial Services 7,046 6,032 16.8 15.4
Other Entities 2 1 – –
Eliminations – 4,915 – 4,576 7.4 –
Group 23,448 20,853 12.4 11.4
* The adjustment for exchange rate factors is calculated by applying the relevant current exchange rates to the prior year’s figures.
BMW Group profit / loss before tax by segment • 17
in € million 1st quarter 2017 1st quarter 2016 Change in %
Automotive 2,279 1,734 31.4
Motorcycles 125 94 33.0
Financial Services 595 570 4.4
Other Entities – 4 – 2 –
Eliminations 10 – 28 –
Group 3,005 2,368 26.9
Automotive segmentAutomotive segment revenues grew significantly due to higher sales volumes. The volume increase at the joint venture BMW Brilliance Automotive Ltd., Shenyang, also contributed to revenue growth. The gross profit margin came in at 17.9 %, broadly in line with the previous year’s first quarter (18.4 %).
Selling and administrative expenses compared to the previous year’s first quarter were € 169 million higher at € 1,820 million. The increase in administra-tive expenses was due amongst others to the larger workforce and higher expenses for new IT projects. As a percentage of revenues, the expense ratio remained at 8.8 %.
The net amount of other operating income and expenses improved by € 30 million compared to the first quarter of 2016 (2016: € – 48 million). The improvement was mainly due to lower expenses, as the previous year’s figures included a donation to a BMW foundation.
As a result, the segment profit before financial result increased to € 1,871 million (2016: € 1,763 million). The EBIT margin – profit before financial result as a percentage of revenues – came in at 9.0 % (2016: 9.4 %), reflecting increased sales volumes counterbalanced amongst others by higher research and development costs.
Overall, the Automotive segment reported a significant increase in pre-tax profit. This was largely due to the improved financial result for the three-month period, mainly due to positive effects in the result from equi-ty accounted investments – primarily related to the sale of 15 % of the shares in HERE International B. V., Amsterdam, by THERE Holding B. V., Amsterdam – and the other financial result.
Interim Group Management Report
20
Report on Economic Position
Results of Operations, Financial Position and Net Assets

motorcycles segmentThe Motorcycles segment recorded solid revenue growth in the first quarter, mainly reflecting a 5.5 % rise in deliveries. Higher sales of optional equipment and improved pricing also contributed. As a result, the segment gross profit margin improved from 26.6 % to 28.7 %.
Cost of sales increased slightly due to the development of new models and higher production costs. Thanks to the improvement in other operating result, first-quar-ter profit before tax, which reflects seasonal factors, increased significantly. The EBIT margin for the three-month period came in at 20.1 % (2016: 16.2 %).
Financial services segmentFinancial Services segment revenues grew significant-ly due to a positive business development and the sale of vehicles previously leased to customers. The risk profile also remained favourable during the first quarter 2017.
Selling and administrative expenses within the seg-ment increased by a solid € 17 million to € 300 million, mainly due to the increased workforce and higher project costs.
Larger credit financing volumes as well as higher other operating income contributed to a slight improvement in the Financial Services segment’s first-quarter profit before taxes.
21

Financial positionThe consolidated cash flow statements for the Group and the Automotive and Financial Services segments show the sources and applications of cash flows for the first three months of 2017 and 2016, classified into cash flows from operating, investing and financing activities. Cash and cash equivalents in the cash flow
statements correspond to the amounts disclosed in the balance sheet.
Cash flows from operating activities are determined indirectly, starting with Group and segment net profit. By contrast, cash flows from investing and financing activities are based on actual payments and receipts.
BMW Group cash flows• 18
in € million 1st quarter 2017 1st quarter 2016 Change
Cash inflow / outflow from operating activities 328 – 86 414
Cash inflow / outflow from investing activities – 1,111 – 449 – 662
Cash inflow / outflow from financing activities – 42 578 – 620
Effect of exchange rate and changes in composition of Group 88 – 10 98
Change in cash and cash equivalents – 737 33 – 770
Cash flows from operating activities were influenced in the first quarter of 2017 by the higher net profit, lower increase in working capital, higher liabilities for bonuses and services contracts, liabilities for other tax-es and the increase in receivables for sales financing.
Higher cash outflows for investing activities at Group level mainly reflected increased levels of investment in intangible assets and property, plant and equip-ment and the change in the net amount invested in
marketable securities and investment funds (cash outflow of € 308 million).
The change in cash flows from financing activities was mainly due to the net outflow of funds used to settle commercial paper.
Free cash flow for the Automotive segment was as follows:
in € million 1st quarter 2017 1st quarter 2016 Change
Cash inflow / outflow from operating activities 2,626 1,219 1,407
Cash inflow / outflow from investing activities – 1,069 – 373 – 696
Net investment in marketable securities and investment funds 42 – 314 356
Free cash flow Automotive segment 1,599 532 1,067
The higher cash inflow from operating activities was mainly due to the higher net profit, a lower increase in working capital and higher liabilities related to bonuses, services contracts and other taxes.
The higher cash outflow for investing activities mainly reflects increased investments for new vehicle projects and the change in the net investment in marketable securities and investment funds.
Interim Group Management Report
22
Report on Economic Position
Results of Operations, Financial Position and Net Assets

Net financial assets of the Automotive segment com-prise the following:
in € million 31. 3. 2017 31. 12. 2016 Change
Cash and cash equivalents 4,468 4,794 – 326
Marketable securities and investment funds 4,226 4,147 79
Intragroup net financial assets 14,047 12,077 1,970
Financial assets 22,741 21,018 1,723
Less: external financial liabilities* – 1,498 – 1,498 –
Net financial assets Automotive segment 21,243 19,520 1,723
* Excluding derivative financial instruments.
Cash flows from operating and investing activities in the Financial Services segment developed as follows:
in € million 1st quarter 2017 1st quarter 2016 Change
Cash inflow / outflow from operating activities – 1,181 – 1,615 434
Cash inflow / outflow from investing activities – 43 8 – 51
Net – 1,224 – 1,607 383
Cash outflows from operating activities in the Financial Services segment were driven mainly by the increase in leased products and receivables from sales financing.
RefinancingThe BMW Group uses a diversified range of funding sources to finance its operating activities. Funds raised are used almost exclusively to finance the BMW Group’s Financial Services business. Further details regarding the principles and objectives of financial management are contained in the Group Financial Statements of BMW AG at 31 December 2016.
During the period from January to March 2017, BMW Group entities issued a euro benchmark bond with a volume of € 2.0 billion as well as EMTN private placements in various currencies with a total volume of € 0.7 billion. Bonds denominated in Indian rupees and Korean won were issued with a total volume of € 0.2 billion. In addition, three ABS transactions with a total volume of € 1.5 billion were issued in Japan, Canada and the USA. The regular issue of commercial paper and deposit-taking by the Group’s banking sub-sidiaries are also used to refinance the BMW Group.
23

Net assets
BmW Group condensed balance sheet• 19
Group
in € million 31. 3. 2017 31. 12. 2016 Change in %Currency adjusted
change in %
Proportion of balance sheet
total in %
Assets
Intangible assets 8,295 8,157 1.7 0.9 4.3
Property, plant and equipment 17,704 17,960 – 1.4 – 1.4 9.2
Leased products 37,487 37,789 – 0.8 – 0.9 19.6
Investments accounted for using the equity method 2,913 2,546 14.4 14.4 1.5
Other investments 462 560 – 17.5 – 17.5 0.2
Receivables from sales financing 80,891 78,260 3.4 2.9 42.2
Financial assets 9,150 9,770 – 6.3 – 6.4 4.8
Deferred and current tax 4,339 4,265 1.7 4.5 2.3
Inventories 13,656 11,841 15.3 16.0 7.1
Trade receivables 2,901 2,825 2.7 4.5 1.5
Other assets 6,659 6,682 – 0.3 – 0.8 3.5
Cash and cash equivalents 7,143 7,880 – 9.4 – 9.2 3.8
Total assets 191,600 188,535 1.6 1.5 100.0
equity And liABilities
Equity 49,581 47,363 4.7 3.5 25.9
Pension provisions 3,954 4,587 – 13.8 – 13.7 2.1
Other provisions 11,035 10,918 1.1 1.5 5.7
Deferred and current tax 4,193 3,869 8.4 10.2 2.2
Financial liabilities 97,412 97,731 – 0.3 – 0.3 50.8
Trade payables 8,971 8,512 5.4 5.9 4.7
Other liabilities 16,454 15,555 5.8 6.2 8.6
Total equity and liabilities 191,600 188,535 1.6 1.5 100.0
Interim Group Management Report
24
Report on Economic Position
Results of Operations, Financial Position and Net Assets

The balance sheet total of the BMW Group increased slightly compared to 31 December 2016. Currency adjusted changes show the development of balance sheet items after excluding the effect of changes in individual exchange rates.
Investments accounted for using the equity method increased significantly compared to the year end 2016.The increase was mainly due to the sale of 15 % of the shares of HERE International B. V., Amsterdam, by the THERE Holding B. V., Amsterdam, and a positive contribution from the joint venture BMW Brilliance Automotive Ltd., Shenyang.
Business volume growth in the Financial Services segment is mainly reflected in the slightly higher level of receivables from sales financing. A total of 322,086 new credit financing contracts were signed during the quarter, 19.3 % more than one year earlier. As a result, the total credit financing portfolio grew to 3,108,880 contracts, a 2.8 % increase from 31 Decem-ber 2016. A total of 143,548 new leasing contracts were signed during the first quarter of 2017, in line with the previous year’s first-quarter performance (2016: 143,434 contracts). The portfolio of leasing contracts increased by 0.2 % compared to the end of 2016 to 1,683,828 contracts at 31 March 2017. The increase in business volume was held down by the sale of vehicles coming off lease.
Financial assets decreased moderately compared to 31 December 2016, mainly due to changes in currency derivatives.
Inventories were significantly higher than at the end of the financial year 2016. The increase is mainly due to finished goods, reflecting business growth and stocking up in the markets.
Cash and cash equivalents decreased moderately compared to 31 December 2016. Group liquidity nevertheless remained at a solid level.
Group equity rose by € 2,218 million to € 49,581 million. Equity increased mainly as a result of the net profit attributable to shareholders of BMW AG amounting to € 2,139 million and the positive impact of remeasure-ments of the net defined benefit liability for pension plans amounting to € 459 million, mainly due to higher interest rates and lower inflation in Germany and positive investment income on UK plan assets. By con-trast, changes in the fair value of derivative financial instruments decreased equity by € 527 million.
The equity ratio of the BMW Group – calculated by dividing equity by the balance sheet total – was 25.9 % at the end of the reporting period (31 December 2016: 25.1 %). The equity ratio for the Automotive segment was 41.9 % (31 December 2016: 41.3 %) and for the Financial Services segment 8.4 % (31 December 2016: 8.0 %).
Pension provisions decreased significantly compared to the end of the financial year 2016, mainly due to higher interest rates and lower inflation in Germany and positive investment income on UK plan assets.
The solid increase in other liabilities reflected higher personnel-related liabilities and liabilities for other taxes due to timing factors at the period end.
The increase in trade payables mainly reflects higher production volumes.
Overall, the earnings performance, financial position and net assets position of the BMW Group continued to develop positively during the first quarter.
Related party relationshipsFurther information on transactions with related par-ties can be found in note 32 to the Interim Group Financial Statements.
see note 32
25

REPORT ON OUTLOOK, RISKS AND OPPORTUNITIESFurther growth to continue
Profitability within target range expected
Global economy offers favourable conditions
OUTLOOK
The report on outlook, risks and opportuni-ties describes the expected development of the BMW Group, including the associated material risks and opportunities, from the perspective of the Group’s management. It contains forward-looking assertions and is based on expectations and assessments which are, by their nature, subject to uncertainty. As a result, actual outcomes, including those attributable to political and economic developments, could differ substantially – either positively or negatively – from the expectations described below. Further related information is provided in the Annual Report 2016 (Outlook, pp 82, Risks and Opportunities, pp 88).
Economic outlookAccording to the forecast of the International Monetary Fund, the global economy is set to grow by approxi-mately 3.5 % in 2017.
Within the eurozone, elections in France and Germany in 2017 and the official start of exit negotiations between the EU and the UK expose economic devel-opments in the region to significant uncertainty. Nevertheless, estimations point to a continued upturn, with a 1.6 % increase in gross domestic product (GDP). Falling unemployment combined with rising consumption by private households, solid industrial production figures and robust investment activities should provide a broad basis for economic growth in the eurozone.
The ECB is likely to continue its expansive monetary policies, given that the inflation rate in 2017 is only expected to rise to around 1.6 % and therefore below the medium-term target of no more than 2 %. The euro is not expected to depreciate further against the US dollar in the current year.
The economic climate in Germany is expected to remain favourable. Strong domestic consumption, solid levels of investment and a robust export sector are all contributing to the positive development. As a result, GDP is forecast to grow by approximately 1.6 % in 2017.
Interim Group Management Report
26
Report on Outlook, Risks and Opportunities
Outlook

The French economy is forecast to grow by 1.3 %. Here too, the export sector is performing well. The positive trend in investment activities from the pre-vious year is likely to continue and could also gain momentum. By contrast, the unemployment rate is only falling slowly.
In Italy, the job market is recovering only gradually and is therefore unlikely to generate a significant increase in consumer spending. Overall, the Italian economy is forecast to grow by 0.9 % in 2017.
Spain is expected to contribute to Europe’s overall economic growth with an above-average GDP rise of around 2.5 %. The main factors driving this positive development are high investment levels, solid indus-trial production and a dynamic export sector.
In March 2017, the UK government submitted a formal request to exit the EU, marking the beginning of a two-year phase of negotiations on the future relationship between the EU and the UK. In April, the government announced its intention to hold elections in the UK in June 2017. This could bring additional uncertain-ty. With some signs of economic slowdown already emerging for the current year, the UK economy is now expected to grow only by around 1.6 %.
GDP in the USA is expected to grow by 2.3 % in 2017. Despite a strong US dollar, exports could increase significantly more than in the previous year. Invest-ments and industrial production could also rise and contribute to improved economic growth. With wages rising, consumer spending is likely to remain the bedrock of the US economy.
The government in China is continuing the transition from an investment-driven to a consumer-driven econ-omy. For this reason, growth rates in the coming years are likely to be lower than in the past. State-driven eco-nomic stimulus measures should prevent any abrupt downturn in the economy. In line with the Chinese government’s own target, the pace of growth is now forecast to decelerate slightly to 6.5 % in 2017. However, the risk of a possible financial and liquidity crisis in China remains, in view of steep and continuing rises in debt levels, particularly in the corporate sector.
The Japanese economy could pick up slightly and grow by around 1.1 % in 2017. Strong growth in exports and industrial production should provide the domestic economy with fresh momentum. However, consumer spending is likely to grow only moderately year-on-year.
India is improving investment and planning security for investors by creating a favourable, competitive environment. These measures should encourage growth and enable GDP to rise by around 7.3 % in the current year.
The situation in Brazil and Russia is heavily dependent on the price of oil. With the recent increase in oil price, the value of the Russian rouble and the Brazilian real has tended upward, thus making imports cheaper and reducing inflationary pressures. These developments have enabled the central banks in both countries to move away partially from their restrictive monetary policies and stimulate the economy by means of lower interest rates. GDP growth rates over the full year are forecast at around 1.3 % for Russia and 0.6 % for Brazil.
The average price of Brent crude oil during the current year’s reporting period has been around 55 US dollars per barrel, mainly due to production cutbacks by OPEC countries and other major oil-producing nations. With inventories of crude oil at historically high levels, however, significant price increases should be limited for the foreseeable future.
27

Automobile markets in 2017Automobile markets worldwide are currently forecast to grow by 2.0 % in 2017 compared to the previous year. Key sources of growth are expected from China, indi-vidual markets in Europe, and Russia. By contrast, new registrations in the USA are likely to decline slightly.
Continued economic recovery in Europe should provide the basis for stable automobile markets. At present, new registrations in the region in 2017 are expected to be slightly up on the previous year (15.3 million units; + 1.2 %). Germany is again expected to make a positive contribution to the development in Europe with forecast growth of 1.4 % to 3.4 million units. With around 2.0 million registrations, France is likely to be slightly up on the previous year (+ 1.3 %). Markets in Italy (1.95 million units; + 5.5 %) and Spain (1.19 million units; + 3.7 %) are also expected to see rising registration figures. Uncertainty related to Brexit is likely to have a negative impact on the UK automobile market. The number of new registrations could receive a setback, with 2.56 million (– 4.9 %) currently predicted for the full year 2017.
Registrations in the USA, while remaining at a high level, are set to decrease slightly in 2017. Currently, they are forecast to fall by 0.9 % to 17.4 million units.
Slower economic growth in China is likely to be reflected in the country’s automobile market. None-theless, the number of new registrations is forecast to grow by 5.7 % to 25.5 million units in the course of the current year.
The automobile market in Japan is expected to recov-er in 2017, with new registrations forecast to rise by around 1.6 % to 4.85 million units.
Russian and Brazilian automobile markets could also benefit from higher GDP growth rates. New regis-trations in Russia are forecast to increase to around 1.3 million units (+ 4.0 %), with a more modest rise expected for Brazil (1.7 million units; + 2.1 %).
Motorcycle markets in 2017The world’s motorcycle markets in the 250 cc plus class are forecast to grow slightly in 2017. In Europe, the positive trend is likely to continue in the major markets of Germany, France, Italy and Spain. In the USA, the motorcycles market is forecast to remain flat or slightly below the previous year’s level.
Financial services markets in 2017In the eurozone, the ECB is expected to continue its expansive monetary policies over the coming months. In an attempt to address the conflicting issues of rising inflation and weaker growth prospects following the Brexit decision, the Bank of England is expected to continue its cautious approach and leave its monetary policies unchanged. Assuming the US economy con-tinues its positive development, the Federal Reserve is likely to raise its reference interest rate further during the course of the year. The government in China is likely to continue measures aimed at driving the transformation towards a more consumer-orientated economy. The government and central bank are likely to support this process with a combination of econom-ic and monetary measures. The Japanese central bank is likely to retain its expansionary monetary approach.
The BMW Group expects the used car market on con-tinental Europe to stabilise at the previous year’s level. In the UK, the situation remains unclear in the wake of the Brexit decision and will depend on the course of the exit negotiations. In North America, a declining trend is expected, while used car prices in the premium segment in Asia are likely to remain stable.
Interim Group Management Report
28
Report on Outlook, Risks and Opportunities
Outlook

Outlook for the BMW GroupGroupProfit before tax: slight increase expectedCompetition on international automobile markets is likely to remain intense throughout the current year. The formal start of exit negotiations between the EU and the UK as well as elections in France, the UK and Germany are also creating uncertainty with respect to future political and economic developments. In the USA, the impact of the new administration’s economic policies also remains to be seen. Further information is provided in the Report on Risks and Opportunities in the Annual Report 2016.
Nevertheless, the BMW Group intends to pursue its growth course in 2017. New vehicles such as the BMW 5 Series and MINI Countryman intro-duced in February and motorcycles such as the new R NineT Pure and R NineT Racer models, as well as a range of attractive services, should contribute to earnings growth. Investments in future-oriented projects, including vehicle electrification, digitalisation and the expansion of the production network, will offset the general positive trend. Overall, Group profit before tax is expected to increase slightly year-on-year (2016: € 9,665 million).
Workforce at yearend: slight increase expectedBased on current forecasts, the BMW Group’s work-force is again expected to grow slightly in 2017 (2016: 124,729 employees). This is mainly due to projects aimed at securing the Group’s future, the growth of automobile and motorcycles business and the expan-sion of financial and mobility services.
Automotive segmentDeliveries to customers: slight increase expectedThe BMW Group expects positive sales volume growth to continue in 2017 and again aims to occupy a lead-ing position with its brands in the global premium segment. Balanced growth in the major sales regions of Europe, Asia and the Americas will help to compen-sate for volatilities in individual markets. Assuming economic conditions do not deteriorate, deliveries to customers are forecast to rise slightly to a new high (2016: 2,367,603 1 units).
Important contributions to continued sales volume growth are likely to come primarily from the introduc-tion of new models. The all-new BMW 5 Series Sedan was launched in mid-February 2017, followed by the BMW 5 Series iPerformance and M Performance mod-els in March. The new extended-wheelbase version of the BMW 5 Series Sedan will be available to customers in China starting in June. The new BMW 5 Series Touring will be launched during the same month. The model revisions of the BMW 4 Series and the BMW M4 Coupé and Convertible were launched in March. The second generation of the highly success-ful MINI Countryman became available in February. Towards mid-year, a John Cooper Works and a plug-in hybrid model will be added to the MINI Countryman range. Further new models are planned for the second half of 2017.
Fleet carbon dioxide emissions 2: slight decrease expectedThe BMW Group is continuing its efforts to reduce vehicle-fuel consumption and carbon dioxide emis-sions. According to forecasts, fleet emissions will drop slightly during the outlook period, thus continuing the downward trend seen in previous years (2016: 124 grams CO2 / km).
1 Including the joint venture
BMW Brilliance Automotive,
Ltd., Shenyang (2016:
316,200 units).
2 EU-28
29

Revenues: slight increase expectedAutomotive segment revenues are expected to rise slightly in line with sales volume. The BMW Group expects segment revenues to increase slightly in 2017 (2016: € 86,424 million).
EBIT margin expected within target rangeAn EBIT margin within a range of 8 to 10 % (2016: 8.9 %) remains the target for the Automotive segment.
Return on capital employed: slight decrease expectedSegment RoCE is forecast to decrease slightly (2016: 74.3 %). However, the long-term target RoCE of at least 26 % for the Automotive segment will be significantly exceeded.
Motorcycles segmentDeliveries to customers: significant increase expectedThe BMW Group expects the positive trend in the Motor-cycles segment to continue. The new R NineT Pure and R NineT Racer models unveiled at international trade fairs held in autumn 2016 have been available to cus-tomers since March 2017. Likewise, the new G 310 R and the updated version of the R 1200 GS have been available since March. The revised S 1000 RR has been in showrooms since January and was joined by the updated versions of the S 1000 R and the K 1600 GT in February. The new K 1600 B, the updated version of the luxury K 1600 GTL and the R NineT Urban G / S will follow in the summer and the G 310 GS in September. The broader product range is designed to appeal to new customer groups and provide further momentum for sales volume growth. Overall, deliveries of BMW motor-cycles to customers are forecast to increase significantly year-on-year (2016: 145,032 units).
EBIT margin expected in target range between 8 and 10 % With effect from the financial year 2017, EBIT margin will serve as an additional key performance indicator for the Motorcycles segment. Accordingly, segment performance will also be managed based on the oper-ating return on sales (EBIT margin) in future. Further information can be found in the description of the Group management system in the section “ General Information on the BMW Group” in the Annual Report 2016. In this context, a target range of 8 to 10 % has also been set for the Motorcycles segment. The EBIT margin for the Motorcycles segment is expected to lie within this range in 2017 (2016: 9.0 %).
return on capital employed expected at previous year’s levelSegment RoCE in 2017 is forecast to be in line with the previous year (2016: 33.0 %). The long-term target RoCE of 26 % for the Motorcycles segment should therefore be exceeded.
Interim Group Management Report
30
Report on Outlook, Risks and Opportunities
Outlook

Financial Services segmentReturn on equity: slight decrease expectedAccording to forecasts, the Financial Services segment should continue its successful performance in 2017. However, it is expected that regulatory requirements for equity capital will be tightened and that the favour-able risk situation of the previous year will return to a normal level. The segment RoE is therefore expected to decrease slightly year-on-year (2016: 21.2 %). The target of at least 18 % is nevertheless expected to be exceeded again.
Overall assessment by Group management Business is expected to develop positively in the financial year 2017. The introduction of numerous new automobile and motorcycle models as well as the expansion of individual mobility-related services give reason to expect further profitable growth during the current year. Despite the challenges previously described, Group profit before tax is forecast to grow slightly. Based on the forecast of a slight increase in deliveries to customers, Automotive segment revenues are expected to grow slightly. At the same time, a slight decrease in fleet carbon dioxide emissions is expected. The Group’s targets are to be supported by a slight increase in the workforce. The Automotive segment’s EBIT margin in 2017 is expected to remain within the target range of between 8 and 10 %, while its RoCE is forecast to decrease slightly. A slight decline is also forecast for the RoE in the Financial Services segment. Both performance indicators should, however, be above their long-term targets of 26 % (RoCE) and 18 % (RoE) respectively. Motorcycles segment deliveries to customers are expected to rise significantly in the forecast period, with an EBIT margin within the target range of between 8 and 10 % and RoCE at the previous year’s level.
Depending on the political and economic situation and the outcomes of the risks and opportunities described in the Annual Report 2016, actual busi-ness performance could, however, differ from current expectations.
BmW Group key performance indicators• 20
2016 2017 Outlook
Group
Profit before tax € million 9,665 slight increase
Workforce at year-end 124,729 slight increase
Automotive seGment
Sales volume 1 units 2,367,603 slight increase
Fleet emissions 2 g CO2 / km 124 slight decrease
Revenues € million 86,424 slight increase
EBIT margin % 8.9 between 8 and 10
Return on capital employed % 74.3 slight decrease
motorcycles seGment
Sales volume units 145,032 significant increase
EBIT margin % 9.0 between 8 and 10
Return on capital employed % 33.0 in line with last year’s level
FinAnciAl services seGment
Return on equity % 21.2 slight decrease
1 Including the joint venture BMW Brilliance Automotive Ltd., Shenyang (2016: 316,200 units).2 EU-28.
31

RISKS AND OPPORTUNITIES
As a globally operating enterprise, the BMW Group is confronted with numerous risks and opportuni-ties. Making full use of opportunities is the basis for the Group’s corporate success. The Group also consciously takes risks in order to achieve growth, profitability, efficiency and sustainable business for the future. There have been no material changes to the overall risk profile compared to that described in the Group Management Report 2016. Further information on risks and opportunities, and on the methods employed to manage them, can be found in the "Report on Risks and Opportunities" section of the Annual Report 2016 (pp 88).
Interim Group Management Report
32
Report on Outlook, Risks and Opportunities
Risks and Opportunities
BMW AG Stock and Capital Markets

BMW AG STOCK AND CAPITAL MARKETSDAX finishes positively in first quarter 2017
BmW stock negatively impacted by external factors
Earnings per share up to € 3.26 (+ 31.5 %) per common / preferred share
BMW AG STOCK AND CAPITAL MARKETS IN THE FIRST QUARTER
Compared to the previous year’s first quarter, which was overshadowed by negative signals from the Chinese economy, the world’s stock markets performed well during the first quarter of 2017. The results of the parliamentary elections in the Netherlands, signifying that the country will remain in the European Union, were positively received by investors. Moreover, the 0.25 percentage point increase in the interest rate announced by the US Federal Reserve in March 2017 was interpreted as a sign that the US economy is in good health.
The German stock index, DAX, closed at 12,312 points at the end of the first quarter. Compared to the end of the previous year (2016: 11,481 points), the index rose by 7.2 %, only 0.6 % below its record level from April 2015 (12,390 points).
The Prime Automobile Index also showed a positive development, finishing the first quarter at 1,554 points (+ 3.2 %). Nevertheless, the sector index lagged slightly behind the overall stock market and remained below the development of the DAX, reflecting the negative impact on automobile stocks caused by uncertainties in the sector.
Under the influence of unfavourable sector-related fac-tors, BMW common stock lost ground during the first quarter of 2017, closing at € 85.51 at 31 March 2017 (– 3.7 %). By contrast, BMW preferred stock increased slightly in value during the three-month period and finished the first quarter at € 73.82 (+ 1.5 %).
The value of the US dollar fell slightly against the euro during the first quarter. At 1.07 US dollars to the euro at the end of reporting period, it was down 0.9 % (31 December 2016: 1.06 US dollars to the euro).
33

BmW AG development of stock• 21
(Index: 30. 12. 2016 = 100)
110
100
90
80
Prime Automobile
BMW common stock
DAX
BMW preferred stock
110
100
90
80
January February March April
Source: Reuters.
Interim Group Management Report
34
BMW AG Stock and Capital Markets

INTERIM GROUP FINANCIAL STATEMENTS
Page 36 Income Statement
Page 36 Statement of Comprehensive Income
Page 38 Balance Sheet
Page 40 Cash Flow Statement
Page 42 Statement of Changes in Equity
Page 44 Notes to the Group Financial Statements Page 44 Accounting Principles and Policies
Page 47 Notes to the Income Statement
Page 50 Notes to the Statement of Comprehensive Income
Page 51 Notes to the Balance Sheet
Page 55 Other Disclosures
Page 58 Segment Information
3

Income Statements for Group and Segments for the period from 1 January to 31 March• 22
Group Automotive Motorcycles Financial Services Other Entities Eliminations
in € million Note1st quarter
20171st quarter
20161st quarter
20171st quarter
20161st quarter
20171st quarter
20161st quarter
20171st quarter
20161st quarter
20171st quarter
20161st quarter
20171st quarter
2016
Revenues 5 23,448 20,853 20,692 18,814 623 582 7,046 6,032 2 1 – 4,915 – 4,576 Revenues
Cost of sales 6 – 18,637 – 16,373 – 16,983 – 15,352 – 444 – 427 – 6,154 – 5,158 – – 4,944 4,564 Cost of sales
Gross profit 4,811 4,480 3,709 3,462 179 155 892 874 2 1 29 – 12 Gross profit
Selling and administrative expenses 7 – 2,178 – 1,988 – 1,820 – 1,651 – 53 – 55 – 300 – 283 – 12 – 5 7 6 Selling and administrative expenses
Other operating income 8 173 213 140 181 – – 31 5 45 43 – 43 – 16 Other operating income
Other operating expenses 8 – 160 – 248 – 158 – 229 – 1 – 6 – 19 – 5 – 31 – 28 49 20 Other operating expenses
Profit / loss before financial result 2,646 2,457 1,871 1,763 125 94 604 591 4 11 42 – 2 Profit / loss before financial result
Result from equity accounted investments 9 351 71 351 71 – – – – – – – – Result from equity accounted investments
Interest and similar income 10 61 35 94 92 – – 1 1 275 301 – 309 – 359 Interest and similar income
Interest and similar expenses 10 – 98 – 118 – 122 – 177 – – – 2 – 1 – 251 – 273 277 333 Interest and similar expenses
Other financial result 11 45 – 77 85 – 15 – – – 8 – 21 – 32 – 41 – – Other financial result
Financial result 359 – 89 408 – 29 – – – 9 – 21 – 8 – 13 – 32 – 26 Financial result
Profit / loss before tax 3,005 2,368 2,279 1,734 125 94 595 570 – 4 – 2 10 – 28 Profit / loss before tax
Income taxes 12 – 856 – 727 – 664 – 554 – 37 – 30 – 153 – 154 2 1 – 4 10 Income taxes
Net profit / loss 2,149 1,641 1,615 1,180 88 64 442 416 – 2 – 1 6 – 18 Net profit / loss
Attributable to minority interest 10 10 – – 1 – – 10 11 – – – – Attributable to minority interest
Attributable to shareholders of BMW AG 2,139 1,631 1,615 1,181 88 64 432 405 – 2 – 1 6 – 18 Attributable to shareholders of BMW AG
Basic earnings per share of common stock in € 13 3.26 2.48 Basic earnings per share of common stock in €
Basic earnings per share of preferred stock in € 13 3.26 2.48 Basic earnings per share of preferred stock in €
Dilutive effects 13 – – Dilutive effects
Diluted earnings per share of common stock in € 13 3.26 2.48 Diluted earnings per share of common stock in €
Diluted earnings per share of preferred stock in € 13 3.26 2.48 Diluted earnings per share of preferred stock in €
Statement of Comprehensive Income for Group for the period from 1 January to 31 March• 23
in € million Note1st quarter
20171st quarter
2016
Net profit 2,149 1,641
Remeasurement of the net liability for defined benefit pension plans 459 – 1,053
Deferred taxes – 123 331
Items not expected to be reclassified to the income statement in the future 336 – 722
Available-for-sale securities 2 48
Financial instruments used for hedging purposes – 527 2,165
Other comprehensive income from equity accounted investments 2 54
Deferred taxes 150 – 753
Currency translation foreign operations 51 – 445
Items expected to be reclassified to the income statement in the future – 322 1,069
Other comprehensive income for the period after tax 14 14 347
Total comprehensive income 2,163 1,988
Total comprehensive income attributable to minority interest 10 10
Total comprehensive income attributable to shareholders of BMW AG 2,153 1,978
BMW GROUP INCOME STATEMENT STATEMENT OF COMPREHENSIVE INCOME
36
Interim Group Financial Statements
BMW Group Income Statement
Statement of Comprehensive Income

Income Statements for Group and Segments for the period from 1 January to 31 March• 22
Group Automotive Motorcycles Financial Services Other Entities Eliminations
in € million Note1st quarter
20171st quarter
20161st quarter
20171st quarter
20161st quarter
20171st quarter
20161st quarter
20171st quarter
20161st quarter
20171st quarter
20161st quarter
20171st quarter
2016
Revenues 5 23,448 20,853 20,692 18,814 623 582 7,046 6,032 2 1 – 4,915 – 4,576 Revenues
Cost of sales 6 – 18,637 – 16,373 – 16,983 – 15,352 – 444 – 427 – 6,154 – 5,158 – – 4,944 4,564 Cost of sales
Gross profit 4,811 4,480 3,709 3,462 179 155 892 874 2 1 29 – 12 Gross profit
Selling and administrative expenses 7 – 2,178 – 1,988 – 1,820 – 1,651 – 53 – 55 – 300 – 283 – 12 – 5 7 6 Selling and administrative expenses
Other operating income 8 173 213 140 181 – – 31 5 45 43 – 43 – 16 Other operating income
Other operating expenses 8 – 160 – 248 – 158 – 229 – 1 – 6 – 19 – 5 – 31 – 28 49 20 Other operating expenses
Profit / loss before financial result 2,646 2,457 1,871 1,763 125 94 604 591 4 11 42 – 2 Profit / loss before financial result
Result from equity accounted investments 9 351 71 351 71 – – – – – – – – Result from equity accounted investments
Interest and similar income 10 61 35 94 92 – – 1 1 275 301 – 309 – 359 Interest and similar income
Interest and similar expenses 10 – 98 – 118 – 122 – 177 – – – 2 – 1 – 251 – 273 277 333 Interest and similar expenses
Other financial result 11 45 – 77 85 – 15 – – – 8 – 21 – 32 – 41 – – Other financial result
Financial result 359 – 89 408 – 29 – – – 9 – 21 – 8 – 13 – 32 – 26 Financial result
Profit / loss before tax 3,005 2,368 2,279 1,734 125 94 595 570 – 4 – 2 10 – 28 Profit / loss before tax
Income taxes 12 – 856 – 727 – 664 – 554 – 37 – 30 – 153 – 154 2 1 – 4 10 Income taxes
Net profit / loss 2,149 1,641 1,615 1,180 88 64 442 416 – 2 – 1 6 – 18 Net profit / loss
Attributable to minority interest 10 10 – – 1 – – 10 11 – – – – Attributable to minority interest
Attributable to shareholders of BMW AG 2,139 1,631 1,615 1,181 88 64 432 405 – 2 – 1 6 – 18 Attributable to shareholders of BMW AG
Basic earnings per share of common stock in € 13 3.26 2.48 Basic earnings per share of common stock in €
Basic earnings per share of preferred stock in € 13 3.26 2.48 Basic earnings per share of preferred stock in €
Dilutive effects 13 – – Dilutive effects
Diluted earnings per share of common stock in € 13 3.26 2.48 Diluted earnings per share of common stock in €
Diluted earnings per share of preferred stock in € 13 3.26 2.48 Diluted earnings per share of preferred stock in €
Statement of Comprehensive Income for Group for the period from 1 January to 31 March• 23
in € million Note1st quarter
20171st quarter
2016
Net profit 2,149 1,641
Remeasurement of the net liability for defined benefit pension plans 459 – 1,053
Deferred taxes – 123 331
Items not expected to be reclassified to the income statement in the future 336 – 722
Available-for-sale securities 2 48
Financial instruments used for hedging purposes – 527 2,165
Other comprehensive income from equity accounted investments 2 54
Deferred taxes 150 – 753
Currency translation foreign operations 51 – 445
Items expected to be reclassified to the income statement in the future – 322 1,069
Other comprehensive income for the period after tax 14 14 347
Total comprehensive income 2,163 1,988
Total comprehensive income attributable to minority interest 10 10
Total comprehensive income attributable to shareholders of BMW AG 2,153 1,978
37

Group Automotive Motorcycles Financial Services Other Entities Eliminations
in € million Note 31. 3. 2017 31. 12. 2016 31. 3. 2017 31. 12. 2016 31. 3. 2017 31. 12. 2016 31. 3. 2017 31. 12. 2016 31. 3. 2017 31. 12. 2016 31. 3. 2017 31. 12. 2016
Assets AssetsIntangible assets 15 8,295 8,157 7,803 7,705 45 46 446 405 1 1 – – Intangible assets
Property, plant and equipment 16 17,704 17,960 17,320 17,566 355 365 29 29 – – – – Property, plant and equipment
Leased products 17 37,487 37,789 – – – – 44,844 45,134 – – – 7,357 – 7,345 Leased products
Investments accounted for using the equity method 18 2,913 2,546 2,913 2,546 – – – – – – – – Investments accounted for using the equity method
Other investments 18 462 560 5,223 5,195 – – 4 3 6,825 6,585 – 11,590 – 11,223 Other investments
Receivables from sales financing 19 49,982 48,032 – – – – 49,982 48,032 – – – – Receivables from sales financing
Financial assets 20 2,082 2,705 947 1,287 – – 179 221 1,415 1,780 – 459 – 583 Financial assets
Deferred tax 21 2,496 2,327 4,376 4,310 – – 454 389 224 263 – 2,558 – 2,635 Deferred tax
Other assets 22 1,648 1,595 4,214 4,043 27 28 3,166 3,093 27,617 27,120 – 33,376 – 32,689 Other assets
Non-current assets 123,069 121,671 42,796 42,652 427 439 99,104 97,306 36,082 35,749 – 55,340 – 54,475 Non-current assets
Inventories 23 13,656 11,841 13,106 11,344 545 492 5 5 – – – – Inventories
Trade receivables 2,901 2,825 2,486 2,502 200 144 213 178 2 1 – – Trade receivables
Receivables from sales financing 19 30,909 30,228 – – – – 30,909 30,228 – – – – Receivables from sales financing
Financial assets 20 7,068 7,065 4,912 4,862 – – 1,538 1,504 1,206 1,329 – 588 – 630 Financial assets
Current tax 21 1,843 1,938 939 1,000 – – 119 44 785 894 – – Current tax
Other assets 22 5,011 5,087 23,086 21,561 6 2 5,498 5,417 44,572 44,782 – 68,151 – 66,675 Other assets
Cash and cash equivalents 7,143 7,880 4,468 4,794 9 – 2,594 3,046 72 40 – – Cash and cash equivalents
Current assets 68,531 66,864 48,997 46,063 760 638 40,876 40,422 46,637 47,046 – 68,739 – 67,305 Current assets
Total assets 191,600 188,535 91,793 88,715 1,187 1,077 139,980 137,728 82,719 82,795 – 124,079 – 121,780 Total assets
equity And liABilities equity And liABilitiesSubscribed capital 24 657 657 Subscribed capital
Capital reserves 24 2,047 2,047 Capital reserves
Revenue reserves 24 46,975 44,445 Revenue reserves
Accumulated other equity 24 – 363 – 41 Accumulated other equity
Equity attributable to shareholders of BMW AG 24 49,316 47,108 Equity attributable to shareholders of BMW AG
Minority interest 24 265 255 Minority interest
Equity 49,581 47,363 38,436 36,624 – – 11,738 11,049 16,803 16,744 – 17,396 – 17,054 Equity
Pension provisions 25 3,954 4,587 2,514 2,911 68 83 81 77 1,291 1,516 – – Pension provisions
Other provisions 26 5,431 5,039 4,978 4,570 106 103 347 353 – 13 – – Other provisions
Deferred tax 27 3,307 2,795 1,120 740 – – 6,803 6,755 50 48 – 4,666 – 4,748 Deferred tax
Financial liabilities 28 53,936 55,405 1,925 1,942 – – 15,823 17,718 36,647 36,328 – 459 – 583 Financial liabilities
Other liabilities 29 5,510 5,357 6,676 6,530 487 442 30,000 29,413 815 601 – 32,468 – 31,629 Other liabilities
Non-current provisions and liabilities 72,138 73,183 17,213 16,693 661 628 53,054 54,316 38,803 38,506 – 37,593 – 36,960 Non-current provisions and liabilities
Other provisions 26 5,604 5,879 4,883 5,187 96 90 610 599 15 3 – – Other provisions
Current tax 27 886 1,074 616 770 – – 220 255 50 49 – – Current tax
Financial liabilities 28 43,476 42,326 1,578 1,481 – – 29,619 27,368 12,867 14,107 – 588 – 630 Financial liabilities
Trade payables 8,971 8,512 7,792 7,483 336 303 819 702 24 24 – – Trade payables
Other liabilities 29 10,944 10,198 21,275 20,477 94 56 43,920 43,439 14,157 13,362 – 68,502 – 67,136 Other liabilities
Current provisions and liabilities 69,881 67,989 36,144 35,398 526 449 75,188 72,363 27,113 27,545 – 69,090 – 67,766 Current provisions and liabilities
Total equity and liabilities 191,600 188,535 91,793 88,715 1,187 1,077 139,980 137,728 82,719 82,795 – 124,079 – 121,780 Total equity and liabilities
BMW GROUP BALANCE SHEET
38
Interim Group Financial Statements
BMW Group Balance Sheet

Group Automotive Motorcycles Financial Services Other Entities Eliminations
in € million Note 31. 3. 2017 31. 12. 2016 31. 3. 2017 31. 12. 2016 31. 3. 2017 31. 12. 2016 31. 3. 2017 31. 12. 2016 31. 3. 2017 31. 12. 2016 31. 3. 2017 31. 12. 2016
Assets AssetsIntangible assets 15 8,295 8,157 7,803 7,705 45 46 446 405 1 1 – – Intangible assets
Property, plant and equipment 16 17,704 17,960 17,320 17,566 355 365 29 29 – – – – Property, plant and equipment
Leased products 17 37,487 37,789 – – – – 44,844 45,134 – – – 7,357 – 7,345 Leased products
Investments accounted for using the equity method 18 2,913 2,546 2,913 2,546 – – – – – – – – Investments accounted for using the equity method
Other investments 18 462 560 5,223 5,195 – – 4 3 6,825 6,585 – 11,590 – 11,223 Other investments
Receivables from sales financing 19 49,982 48,032 – – – – 49,982 48,032 – – – – Receivables from sales financing
Financial assets 20 2,082 2,705 947 1,287 – – 179 221 1,415 1,780 – 459 – 583 Financial assets
Deferred tax 21 2,496 2,327 4,376 4,310 – – 454 389 224 263 – 2,558 – 2,635 Deferred tax
Other assets 22 1,648 1,595 4,214 4,043 27 28 3,166 3,093 27,617 27,120 – 33,376 – 32,689 Other assets
Non-current assets 123,069 121,671 42,796 42,652 427 439 99,104 97,306 36,082 35,749 – 55,340 – 54,475 Non-current assets
Inventories 23 13,656 11,841 13,106 11,344 545 492 5 5 – – – – Inventories
Trade receivables 2,901 2,825 2,486 2,502 200 144 213 178 2 1 – – Trade receivables
Receivables from sales financing 19 30,909 30,228 – – – – 30,909 30,228 – – – – Receivables from sales financing
Financial assets 20 7,068 7,065 4,912 4,862 – – 1,538 1,504 1,206 1,329 – 588 – 630 Financial assets
Current tax 21 1,843 1,938 939 1,000 – – 119 44 785 894 – – Current tax
Other assets 22 5,011 5,087 23,086 21,561 6 2 5,498 5,417 44,572 44,782 – 68,151 – 66,675 Other assets
Cash and cash equivalents 7,143 7,880 4,468 4,794 9 – 2,594 3,046 72 40 – – Cash and cash equivalents
Current assets 68,531 66,864 48,997 46,063 760 638 40,876 40,422 46,637 47,046 – 68,739 – 67,305 Current assets
Total assets 191,600 188,535 91,793 88,715 1,187 1,077 139,980 137,728 82,719 82,795 – 124,079 – 121,780 Total assets
equity And liABilities equity And liABilitiesSubscribed capital 24 657 657 Subscribed capital
Capital reserves 24 2,047 2,047 Capital reserves
Revenue reserves 24 46,975 44,445 Revenue reserves
Accumulated other equity 24 – 363 – 41 Accumulated other equity
Equity attributable to shareholders of BMW AG 24 49,316 47,108 Equity attributable to shareholders of BMW AG
Minority interest 24 265 255 Minority interest
Equity 49,581 47,363 38,436 36,624 – – 11,738 11,049 16,803 16,744 – 17,396 – 17,054 Equity
Pension provisions 25 3,954 4,587 2,514 2,911 68 83 81 77 1,291 1,516 – – Pension provisions
Other provisions 26 5,431 5,039 4,978 4,570 106 103 347 353 – 13 – – Other provisions
Deferred tax 27 3,307 2,795 1,120 740 – – 6,803 6,755 50 48 – 4,666 – 4,748 Deferred tax
Financial liabilities 28 53,936 55,405 1,925 1,942 – – 15,823 17,718 36,647 36,328 – 459 – 583 Financial liabilities
Other liabilities 29 5,510 5,357 6,676 6,530 487 442 30,000 29,413 815 601 – 32,468 – 31,629 Other liabilities
Non-current provisions and liabilities 72,138 73,183 17,213 16,693 661 628 53,054 54,316 38,803 38,506 – 37,593 – 36,960 Non-current provisions and liabilities
Other provisions 26 5,604 5,879 4,883 5,187 96 90 610 599 15 3 – – Other provisions
Current tax 27 886 1,074 616 770 – – 220 255 50 49 – – Current tax
Financial liabilities 28 43,476 42,326 1,578 1,481 – – 29,619 27,368 12,867 14,107 – 588 – 630 Financial liabilities
Trade payables 8,971 8,512 7,792 7,483 336 303 819 702 24 24 – – Trade payables
Other liabilities 29 10,944 10,198 21,275 20,477 94 56 43,920 43,439 14,157 13,362 – 68,502 – 67,136 Other liabilities
Current provisions and liabilities 69,881 67,989 36,144 35,398 526 449 75,188 72,363 27,113 27,545 – 69,090 – 67,766 Current provisions and liabilities
Total equity and liabilities 191,600 188,535 91,793 88,715 1,187 1,077 139,980 137,728 82,719 82,795 – 124,079 – 121,780 Total equity and liabilities
39

Group Automotive Financial Services
in € million1st quarter
20171st quarter
20161st quarter
20171st quarter
20161st quarter
20171st quarter
2016
Net profit 2,149 1,641 1,615 1,180 442 416 Net profit
Depreciation and amortisation of tangible, intangible and investment assets 1,190 1,256 1,161 1,231 9 7 Depreciation and amortisation of tangible, intangible and investment assets
Change in provisions – 127 – 123 – 8 – 4 37 92 Change in provisions
Change in leased products and receivables from sales financing – 1,882 – 1,029 – – – 1,912 – 996 Change in leased products and receivables from sales financing
Change in deferred taxes 413 358 356 263 54 – 9 Change in deferred taxes
Changes in working capital – 1,366 – 1,903 – 1,540 – 1,885 78 10 Changes in working capital
Other – 49 – 286 1,042 434 111 – 1,135 Other
Cash inflow / outflow from operating activities 328 – 86 2,626 1,219 – 1,181 – 1,615 Cash inflow / outflow from operating activities
Investment in intangible assets and property, plant and equipment – 1,041 – 698 – 1,030 – 692 – 2 – 1 Investment in intangible assets and property, plant and equipment
Net investment in marketable securities and investment funds – 72 236 – 42 314 – 41 9 Net investment in marketable securities and investment funds
Other 2 13 3 5 – – Other
Cash inflow / outflow from investing activities – 1,111 – 449 – 1,069 – 373 – 43 8 Cash inflow / outflow from investing activities
Cash inflow / outflow from financing activities – 42 578 – 1,884 – 179 700 1,639 Cash inflow / outflow from financing activities
Effect of exchange rate on cash and cash equivalents 22 – 52 1 – 18 6 – 22 Effect of exchange rate on cash and cash equivalents
Effect of changes in composition of Group on cash and cash equivalents 66 42 – 30 66 12 Effect of changes in composition of Group on cash and cash equivalents
Change in cash and cash equivalents – 737 33 – 326 679 – 452 22 Change in cash and cash equivalents
Cash and cash equivalents as at 1 January 7,880 6,122 4,794 3,952 3,046 1,359 Cash and cash equivalents as at 1 January
Cash and cash equivalents as at 31 March 7,143 6,155 4,468 4,631 2,594 1,381 Cash and cash equivalents as at 31 March
BMW GROUP CASH FLOW STATEMENT
40
Interim Group Financial Statements
BMW Group Cash Flow Statement

Group Automotive Financial Services
in € million1st quarter
20171st quarter
20161st quarter
20171st quarter
20161st quarter
20171st quarter
2016
Net profit 2,149 1,641 1,615 1,180 442 416 Net profit
Depreciation and amortisation of tangible, intangible and investment assets 1,190 1,256 1,161 1,231 9 7 Depreciation and amortisation of tangible, intangible and investment assets
Change in provisions – 127 – 123 – 8 – 4 37 92 Change in provisions
Change in leased products and receivables from sales financing – 1,882 – 1,029 – – – 1,912 – 996 Change in leased products and receivables from sales financing
Change in deferred taxes 413 358 356 263 54 – 9 Change in deferred taxes
Changes in working capital – 1,366 – 1,903 – 1,540 – 1,885 78 10 Changes in working capital
Other – 49 – 286 1,042 434 111 – 1,135 Other
Cash inflow / outflow from operating activities 328 – 86 2,626 1,219 – 1,181 – 1,615 Cash inflow / outflow from operating activities
Investment in intangible assets and property, plant and equipment – 1,041 – 698 – 1,030 – 692 – 2 – 1 Investment in intangible assets and property, plant and equipment
Net investment in marketable securities and investment funds – 72 236 – 42 314 – 41 9 Net investment in marketable securities and investment funds
Other 2 13 3 5 – – Other
Cash inflow / outflow from investing activities – 1,111 – 449 – 1,069 – 373 – 43 8 Cash inflow / outflow from investing activities
Cash inflow / outflow from financing activities – 42 578 – 1,884 – 179 700 1,639 Cash inflow / outflow from financing activities
Effect of exchange rate on cash and cash equivalents 22 – 52 1 – 18 6 – 22 Effect of exchange rate on cash and cash equivalents
Effect of changes in composition of Group on cash and cash equivalents 66 42 – 30 66 12 Effect of changes in composition of Group on cash and cash equivalents
Change in cash and cash equivalents – 737 33 – 326 679 – 452 22 Change in cash and cash equivalents
Cash and cash equivalents as at 1 January 7,880 6,122 4,794 3,952 3,046 1,359 Cash and cash equivalents as at 1 January
Cash and cash equivalents as at 31 March 7,143 6,155 4,468 4,631 2,594 1,381 Cash and cash equivalents as at 31 March
41

Accumulated other equity
in € million NoteSubscribed
capitalCapital
reservesRevenue reserves
Translation differences Securities
Derivative financial
instruments
Equity attributable to
shareholders of BMW AG
Minority interest Total
1 January 2017 24 657 2,047 44,445 – 171 52 78 47,108 255 47,363 1 January 2017
Net profit – – 2,139 – – – 2,139 10 2,149 Net profit
Other comprehensive income for the period after tax – – 336 46 – – 368 14 – 14 Other comprehensive income for the period after tax
Comprehensive income to 31 March 2017 – – 2,475 46 – – 368 2,153 10 2,163 Comprehensive income to 31 March 2017
Other changes – – 55 – – – 55 – 55 Other changes
31 March 2017 24 657 2,047 46,975 – 125 52 – 290 49,316 265 49,581 31 March 2017
Accumulated other equity
in € million NoteSubscribed
capitalCapital
reservesRevenue reserves
Translation differences Securities
Derivative financial
instruments
Equity attributable to
shareholders of BMW AG
Minority interest Total
1 January 2016 24 657 2,027 41,027 132 24 – 1,337 42,530 234 42,764 1 January 2016
Net profit – – 1,631 – – – 1,631 10 1,641 Net profit
Other comprehensive income for the period after tax – – – 722 – 520 34 1,555 347 – 347 Other comprehensive income for the period after tax
Comprehensive income to 31 March 2016 – – 909 – 520 34 1,555 1,978 10 1,988 Comprehensive income to 31 March 2016
Other changes – – – – – – – – 4 – 4 Other changes
31 March 2016 24 657 2,027 41,936 – 388 58 218 44,508 240 44,748 31 March 2016
BMW GROUP STATEMENT OF CHANGES IN EQUITY
42
Interim Group Financial Statements
BMW Group Statement of Changes in Equity

Accumulated other equity
in € million NoteSubscribed
capitalCapital
reservesRevenue reserves
Translation differences Securities
Derivative financial
instruments
Equity attributable to
shareholders of BMW AG
Minority interest Total
1 January 2017 24 657 2,047 44,445 – 171 52 78 47,108 255 47,363 1 January 2017
Net profit – – 2,139 – – – 2,139 10 2,149 Net profit
Other comprehensive income for the period after tax – – 336 46 – – 368 14 – 14 Other comprehensive income for the period after tax
Comprehensive income to 31 March 2017 – – 2,475 46 – – 368 2,153 10 2,163 Comprehensive income to 31 March 2017
Other changes – – 55 – – – 55 – 55 Other changes
31 March 2017 24 657 2,047 46,975 – 125 52 – 290 49,316 265 49,581 31 March 2017
Accumulated other equity
in € million NoteSubscribed
capitalCapital
reservesRevenue reserves
Translation differences Securities
Derivative financial
instruments
Equity attributable to
shareholders of BMW AG
Minority interest Total
1 January 2016 24 657 2,027 41,027 132 24 – 1,337 42,530 234 42,764 1 January 2016
Net profit – – 1,631 – – – 1,631 10 1,641 Net profit
Other comprehensive income for the period after tax – – – 722 – 520 34 1,555 347 – 347 Other comprehensive income for the period after tax
Comprehensive income to 31 March 2016 – – 909 – 520 34 1,555 1,978 10 1,988 Comprehensive income to 31 March 2016
Other changes – – – – – – – – 4 – 4 Other changes
31 March 2016 24 657 2,027 41,936 – 388 58 218 44,508 240 44,748 31 March 2016
43

ACCOUNTING PRINCIPLES AND POLICIES
01 Basis of preparationThe consolidated financial statements of Bayerische Motoren Werke Aktiengesellschaft (BMW AG Group Financial Statements or Group Financial Statements) at 31 December 2016 were drawn up in accordance with International Financial Reporting Standards (IFRS), as endorsed by the European Union (EU), and the supplementary requirements of § 315 a (1) of the German Commercial Code (HGB). The Inter-im Group Financial Statements (Interim Report) at 31 March 2017, which have been prepared in accord-ance with International Accounting Standard (IAS) 34 (Interim Financial Reporting), have been drawn up using, in all material respects, the same accounting methods as those utilised in the 2016 Group Finan-cial Statements. The BMW Group applies the option of publishing condensed interim Group financial statements. All Interpretations issued by the Interna-tional Financial Reporting Interpretations Committee (IFRIC) which were mandatory at 31 March 2017 have been applied. The Interim Report also complies with German Accounting Standard No. 16 (GAS 16) – Inter-im Financial Reporting – issued by the Accounting Standards Committee of Germany (DRSC e. V.).
Further information regarding the Group’s account-ing principles and policies is contained in the Group Financial Statements of BMW AG at 31 December 2016.
The Group currency is the euro. All amounts are dis-closed in millions of euros (€ million) unless stated otherwise.
The BMW Group and segment income statements are presented using the cost of sales method.
In order to provide a better insight into the net assets, financial position and performance of the BMW Group beyond the requirements of IFRS 8 (Operating Seg-ments), the Group Financial Statements also include balance sheets and income statements for the Auto-motive, Motorcycles, Financial Services and Other Entities segments. The Group Cash Flow Statement is supplemented by statements of cash flows for the Automotive and Financial Services segments. Inter-segment transactions relate mainly to internal sales of products, the provision of funding for Group companies and the related interest. These items are eliminated in the relevant “Eliminations” column. More detailed information regarding the allocation of activities of the BMW Group to segments and a
NOTES TO THE GROUP FINANCIAL STATEMENT
44
Interim Group Financial Statements
Notes to the Group Financial Statements
Accounting Principles and Policies

description of the segments is provided in the explan-atory notes to segment information in the Group Financial Statements of BMW AG for the year ended 31 December 2016.
The Interim Group Financial Statements to 31 March 2017 have been neither audited nor reviewed by the Group auditor.
02 Group reporting entityThe Interim Group Financial Statements to 31 March 2017 consolidate BMW AG and all material subsidiaries over which BMW AG exercises control, either directly or indi-rectly, including one special purpose securities fund and 41 structured entities. The structured entities are used exclusively in conjunction with the BMW Group’s asset-backed financing arrangements. In addition, three joint operations are consolidated proportionately.
The following changes took place in the Group report-ing entity during the first three months of 2017:
Germany Foreign Total
Included at 31 December 2016 21 178 199
Included for the first time in 2017 – 4 4
No longer included in 2017 – 2 2
Included at 31 March 2017 21 180 201
Herald International Financial Leasing Co., Ltd., Tianjin, was consolidated for the first time in the first quarter of 2017.
The other changes in the Group reporting entity have no material impact on the results of operations, finan-cial position and net assets of the Group.
In December 2016, THERE Holding B. V., Amsterdam, signed contracts relating to the sale of shares in HERE International B. V., Amsterdam. A 15 % stake was sold to Intel Holdings B. V., Schiphol-Rijk, and 10 % to a consortium comprising NavInfo Co. Ltd., Peking, Tencent Holdings Ltd., Shenzhen, and GIC Private Ltd., Singapore. The transaction with Intel Holdings B. V., Schiphol-Rijk, was completed on 31 January 2017. The transaction with the consortium is expected to be closed during the second quarter of 2017, after receipt of the approval of the relevant regulatory authorities.
The sale resulted in a loss of control, as defined by IFRS 10, at the level of THERE Holding B. V., Amster-dam. Since THERE Holding B. V., Amsterdam, still exerts a significant influence over HERE Interna-tional B. V., Amsterdam, the latter is now included in the financial statements of THERE Holding B. V., Amsterdam, as an associated company, accounted for using the equity method. The loss of control and the subsequent deconsolidation of HERE International B. V., Amsterdam, and its subsidiaries led to a positive earnings effect at the level of THERE Holding B. V., Amsterdam. The BMW Group portion amounted to € 183 million, which was recognised in the result from equity accounted investments.
The sale of shares had no effect on the BMW Group’s shareholding in THERE Holding B. V., Amsterdam.
45

03 Foreign currency translationThe exchange rates applied for currency translation
purposes in accordance with the modified closing rate method, and which have a material impact on the Group Financial Statements, were as follows:
Closing rate Average rate
31. 3. 2017 31. 12. 2016 1st quarter 2017 1st quarter 2016
US-Dollar 1.07 1.06 1.07 1.10
British Pound 0.86 0.85 0.86 0.77
Chinese Renminbi 7.35 7.34 7.34 7.21
Japanese Yen 119.16 123.34 121.03 126.98
Korean Won 1,194.29 1,274.34 1,227.53 1,325.04
For further information regarding foreign currency translation, please refer to note 3 of the BMW Group Financial Statements for the year ended 31 Decem-ber 2016.
04 Financial reporting rules
(a) No significant new Standards or revised Standards significant for the BMW Group were applied for the first time in the first three months of 2017.
(b) Financial reporting rules issued by the iAsB that are significant for the BMW Group, but have not yet been applied:
During the first quarter of 2017, there have been no significant changes in the assessments of the impact of financial reporting rules that have not yet been applied. For further details, please see the comments in the Group Financial Statements for the year ended 31 December 2016.
46
Interim Group Financial Statements
Notes to the Group Financial Statements
Accounting Principles and Policies
Notes to the Income Statement

NOTES TO THE INCOME STATEMENT
05 Revenues Revenues by activity comprise the following:
in € million 1st quarter 2017 1st quarter 2016
Sales of products and related goods 16,481 14,871
Income from lease instalments 2,492 2,335
Sales of products previously leased to customers 2,713 2,041
Interest income on loan financing 937 835
Other income 825 771
Revenues 23,448 20,853
An analysis of revenues by business segment is shown in the segment information in note 34.
06 Cost of salesCost of sales relate to the following items:
in € million 1st quarter 2017 1st quarter 2016
Manufacturing costs 9,953 8,778
Cost of sales relating to financial services business 5,911 4,912
Research and development expenses 1,185 985
thereof amortisation of capitalised development costs 304 304
Other cost of sales 1,588 1,698
Cost of sales 18,637 16,373
Other cost of sales comprise mainly warranty expenses, service contracts, telemetrics and roadside assistance.
see note 34
47

07 Selling and administrative expenses
in € million 1st quarter 2017 1st quarter 2016
Selling expenses 1,404 1,327
Administrative expenses 774 661
Selling and administrative expenses 2,178 1,988
Selling expenses comprise mainly marketing, advertis-ing and sales personnel costs. Administrative expenses relate mainly to personnel and IT costs.
08 Other operating income and expensesThese items principally comprise exchange gains and losses, gains and losses on the disposal of assets, impairment losses and reversals and income / expense from the reversal of, and allocation to, provisions. Income from the reversal of provisions includes amounts arising on the termination of legal disputes.
09 Result from equity accounted investmentsResult from equity accounted investments includes the results of the joint ventures BMW Brilliance Auto-motive Ltd., Shenyang, DriveNow GmbH & Co. KG, Munich, and DriveNow Verwaltungs GmbH, Munich, and the associated company THERE Holding B. V., Amsterdam. Information regarding the earnings impact arising from the sale of 15 % of the shares of HERE International B. V., Amsterdam, by THERE Holding B. V., Amsterdam, during the first quarter 2017 is provided in note 2.
10 Net interest result
in € million 1st quarter 2017 1st quarter 2016
Interest and similar income 61 35
Interest and similar expenses – 98 – 118
Net interest result – 37 – 83
11 Other financial result
in € million 1st quarter 2017 1st quarter 2016
Result on investments – – 66
Sundry other financial result 45 – 11
Other financial result 45 – 77
Result on investments in the first quarter of the pre-vious year included an impairment loss of € 66 million on the investment in SGL Carbon SE, Wiesbaden.
see note 2
48
Interim Group Financial Statements
Notes to the Group Financial Statements
Notes to the Income Statement

12 Income taxesTaxes on income comprise the following:
in € million 1st quarter 2017 1st quarter 2016
Current tax expense 444 369
Deferred tax expense 412 358
Income taxes 856 727
The effective tax rate for the three-month-period ended 31 March 2017 was 28.5 % (2016: 30.7 %) and corre-sponds to the best estimate of the weighted average
annual income tax rate for the full year. This tax rate has been applied to the pre-tax profit for the interim reporting period.
13 Earnings per shareThe computation of earnings per share is based on the following figures:
1st quarter 2017 1st quarter 2016
Profit attributable to shareholders of BMW AG € million 2,138.9 1,631.3
Profit attributable to common stock € million 1,959.5 1,495.2
Profit attributable to preferred stock € million 179.4 136.1
Average number of common stock shares in circulation number 601,995,196 601,995,196
Average number of preferred stock shares in circulation number 55,114,404 54,809,404
Basic earnings per share of common stock € 3.26 2.48
Basic earnings per share of preferred stock € 3.26 2.48
In computing earnings per share of preferred stock, the additional dividend of € 0.02 per share of preferred stock is spread proportionately over the four quarters of the corresponding financial year. Earnings per share of preferred stock are computed on the basis of the number of preferred stock shares entitled to receive a dividend in each of the relevant financial years. As in the previous year, diluted earnings per share correspond to basic earnings per share.
49

NOTES TO THE STATEMENT OF COMPREHENSIVE INCOME
14 Disclosures relating to the statement of total comprehensive incomeOther comprehensive income for the period after tax comprises the following:
in € million 1st quarter 2017 1st quarter 2016
Remeasurement of the net defined benefit liability for pension plans 459 – 1,053
Deferred taxes – 123 331
Items not expected to be reclassified to the income statement in the future 336 – 722
Available-for-sale securities 2 48
thereof gains / losses arising in the period under report 6 55
thereof reclassifications to the income statement – 4 – 7
Financial instruments used for hedging purposes – 527 2,165
thereof gains / losses arising in the period under report – 683 1,959
thereof reclassifications to the income statement 156 206
Other comprehensive income from equity accounted investments 2 54
Deferred taxes 150 – 753
Currency translation foreign operations 51 – 445
Items expected to be reclassified to the income statement in the future – 322 1,069
Other comprehensive income for the period after tax 14 347
Deferred taxes on components of other comprehen-sive income for the first quarter were as follows:
1st quarter 2017 1st quarter 2016
in € millionBefore
tax Deferred
taxesAfter
taxBefore
tax Deferred
taxesAfter
tax
Remeasurement of the net defined benefit liability for pension plans 459 – 123 336 – 1,053 331 – 722
Available-for-sale securities 2 – 2 – 48 – 14 34
Financial instruments used for hedging purposes – 527 149 – 378 2,165 – 707 1,458
Other comprehensive income from equity accounted investments 2 3 5 54 – 32 22
Currency translation foreign operations 51 – 51 – 445 – – 445
Other comprehensive income – 13 27 14 769 – 422 347
Other comprehensive income arising from equity accounted investments is reported in the Statement of Changes in Equity within currency translation with an amount of € – 5 million (2016: € – 75 million)
and within financial instruments used for hedging purposes with an amount of € 10 million (2016: € 97 million).
50
Interim Group Financial Statements
Notes to the Group Financial Statements
Notes to the Statement of Comprehensive Income
Notes to the Balance Sheet

NOTES TO THE BALANCE SHEET
15 Intangible assetsIntangible assets mainly comprise capitalised develop-ment costs on vehicle and engine projects as well as subsidies for tool costs, licences, purchased develop-ment projects, software and purchased customer lists.
in € million 31. 3. 2017 31. 12. 2016
Capitalised development costs 7,353 7,221
Other intangible assets 561 572
Goodwill 381 364
thereof allocated to the Automotive cash-generating unit 33 33
thereof allocated to the Financial Services cash-generating unit 348 331
Intangible assets 8,295 8,157
Other intangible assets include a brand-name right amounting to € 42 million (31 December 2016: € 42 mil-lion), which is allocated to the Automotive segment and is not subject to amortisation since its useful life is deemed to be indefinite.
Intangible assets amounting to € 42 million (31 Decem-ber 2016: € 42 million) are subject to restrictions on title.
Intangible assets developed during the first three months of the year as follows:
in € million1st quarter
20171st quarter
2016
Capitalised development costs
Investments 436 293
Amortisation 304 304
Other intangible assets
Investments 10 5
Amortisation 49 44
As in the previous year, there was no requirement to recognise or reverse impairment losses on intangible assets during the period under report.
16 Property, plant and equipmentProperty, plant and equipment developed during the first three months of the year as follows:
in € million1st quarter
20171st quarter
2016
Investments 595 400
Depreciation 837 839
Disposals 3 5
No impairment losses were recognised during the first quarter of 2017.
Purchase commitments for property, plant and equipment totalled € 4,320 million (31 December 2016: € 3,141 million).
51

17 Leased productsLeased products developed during the first quarter as follows:
in € million1st quarter
20171st quarter
2016
Additions 4,524 3,540
Depreciation 774 1,075
Disposals 3,944 2,311
18 Investments accounted for using the equity method and other investmentsInvestments accounted for using the equity method comprise the joint ventures BMW Brilliance Auto-motive Ltd., Shenyang, DriveNow GmbH & Co. KG, Munich, and DriveNow Verwaltungs GmbH, Munich and the BMW Group’s interests in the associated company THERE Holding B. V., Amsterdam.
Other investments relate to investments in non-con-solidated subsidiaries, joint ventures, joint operations and associated companies, participations and non-cur-rent marketable securities.
19 Receivables from sales financingReceivables from sales financing totalling € 80,891 mil-lion (31 December 2016: € 78,260 million) include credit financing for retail customers and dealerships, and finance leases.
20 Financial assets Financial assets comprise:
in € million 31. 3. 2017 31. 12. 2016
Marketable securities and investment funds 5,404 5,287
Derivative instruments 3,161 3,922
Credit card receivables 269 287
Loans to third parties 157 129
Other 159 145
Financial assets 9,150 9,770
21 Income tax assetsIncome tax assets totalling € 1,843 million (31 Decem-ber 2016: € 1,938 million) include € 349 million (31 Decem-ber 2016: € 351 million), which is expected to be settled after more than twelve months. Depending on the timing of proceedings, such claims may also be settled at an earlier time.
22 Other assetsOther assets comprise:
in € million 31. 3. 2017 31. 12. 2016
Prepayments 2,014 1,914
Receivables from companies in which an investment is held 1,040 1,217
Other taxes 1,256 1,135
Expected reimbursement claims 802 779
Receivables from subsidiaries 314 422
Collateral receivables 371 387
Sundry other assets 862 828
Other assets 6,659 6,682
23 InventoriesInventories comprise the following:
in € million 31. 3. 2017 31. 12. 2016
Finished goods and goods for resale 11,357 9,684
Work in progress, unbilled contracts 1,199 1,157
Raw materials and supplies 1,100 1,000
Inventories 13,656 11,841
52
Interim Group Financial Statements
Notes to the Group Financial Statements
Notes to the Balance Sheet
24 Shareholder’s equityThe Group Statement of Changes in Equity is shown on pages 42 and 43.
number of shares issuedAt 31 March 2017 common stock issued by BMW AG, as at 31 December 2016, amounted 601,995,196 shares with a par value of € 1. The number of shares of pre-ferred stock at that date was 55,114,404 shares, as at 31 December 2016, each with a par-value of € 1. Unlike the common stock, no voting rights are attached to the preferred stock. All of the Company’s stock is issued to bearer. Preferred stock bears an additional dividend of € 0.02 per share.
To date, 854,617 shares of preferred stock have been issued to employees. The number of authorised shares and the Authorised Capital of BMW AG amounted to 4.2 million shares and € 4.2 million respectively at the end of the reporting period. The Company is authorised until 14 May 2019 to issue 5 million shares of non-voting preferred stock amounting to nominal € 5.0 million. The BMW Group did not hold any treas-ury shares at 31 March 2017.
capital reservesCapital reserves include premiums arising from the issue of shares and were unchanged from 31 Decem-ber 2016 at € 2,047 million.
revenue reservesRevenue reserves comprise the post-acquisition and non-distributed earnings of consolidated companies. In addition, remeasurements of the net defined ben-efit liability for pension plans are also presented in revenue reserves.
Accumulated other equityAccumulated other equity comprises all amounts rec-ognised directly in equity resulting from the transla-tion of the financial statements of foreign subsidiaries, the effects of recognising changes in the fair value of derivative financial instruments and marketable securities directly in equity and the related deferred taxes recognised directly in equity.
25 Pension provisionsPension provisions stood at € 3,954 million (31 Decem-ber 2016: € 4,587 million). Remeasurements of the net defined benefit liability for pension plans reduced provisions by € 459 million in the first three months of 2017, mainly due to lower inflation and higher interest rates in Germany and positive investment income on UK plan assets.
26 Other provisionsOther provisions consist of the following:
in € million 31. 3. 2017 31. 12. 2016
Obligations for personnel and social expenses 2,538 2,191
Obligations for ongoing operational expenses 6,255 6,527
Other obligations 2,242 2,200
Other provisions 11,035 10,918
Provisions for obligations for ongoing operational expenses include mainly warranty obligations. Also included are expected payments for bonuses, rebates and other price deductions.
27 Income tax liabilitiesIncome tax liabilities totalling € 886 million (31 Decem-ber 2016: € 1,074 million) include € 32 million (31 Decem-ber 2016: € 33 million), which is expected to be settled after more than twelve months. Some of the liabilities may be settled earlier than this depending on the timing of proceedings.
Current income tax liabilities comprise € 158 million (31 December 2016: € 269 million) for taxes payable and € 728 million (31 December 2016: € 805 million) for tax provisions.
see pages 42 and 43
53

28 Financial liabilitiesFinancial liabilities include all obligations of the BMW Group relating to financing activities. Financial liabilities comprise the following:
in € million 31. 3. 2017 31. 12. 2016
Bonds 44,817 44,421
Asset backed financing transactions 16,339 16,474
Liabilities to banks 15,277 14,892
Liabilities from customer deposits (banking) 13,743 13,512
Commercial paper 2,668 3,852
Derivative instruments 3,420 3,331
Other 1,148 1,249
Financial liabilities 97,412 97,731
29 Other liabilitiesOther liabilities comprise the following items:
in € million 31. 3. 2017 31. 12. 2016
Deferred income 7,368 7,256
Advance payments from customers 907 977
Deposits received 989 893
Other taxes 1,093 807
Payables to other companies in which an investment is held 785 615
Payables to subsidiaries 78 99
Social security 90 92
Sundry 5,144 4,816
Other liabilities 16,454 15,555
Sundry other liabilities include mainly bonuses for services already performed as well as sales promotions, commission payable and credit balances on customers’ accounts.
54
Interim Group Financial Statements
Notes to the Group Financial Statements
Notes to the Balance Sheet
Other Disclosures

OTHER DISCLOSURES
30 Contingent liabilitiesFor disclosures relating to contingent liabilities, please see note 36 to the BMW Group Financial Statements for the year ended 31 December 2016, since there have been no significant changes during the first three months of 2017.
31 Financial instruments A description of the accounting treatment and meas-urement of derivative financial instruments and allocation of financial instruments to the various measurement levels is provided in notes 4 and 37 of the BMW Group Financial Statements for the year ended 31 December 2016.
Amounts are discounted to 31 March 2017 on the basis of the following interest rates:
ISO Code
in % EUR USD GBP JPY CNY
Interest rate for six months – 0.23 1.38 0.58 – 0.06 3.04
Interest rate for one year – 0.22 1.37 0.53 0.04 4.38
Interest rate for five years 0.19 2.05 0.85 0.11 4.51
Interest rate for ten years 0.79 2.41 1.19 0.27 4.86
Interest rates taken from interest rate curves were adjusted, where necessary, to take account of the credit quality and risk of the underlying financial instrument.
55

The following table shows the amounts allocated to each measurement level at the end of the reporting period:
31. 3. 2017
Level hierarchy in accordance with IFRS 13
in € million Level 1 Level 2 Level 3
Marketable securities, investment funds and collateral assets – available-for-sale 5,491 – –
Other investments – available-for-sale / fair value option 241 – –
Derivative instruments (assets)
Interest rate risks – 1,604 –
Currency risks – 1,277 –
Raw materials price risks – 280 –
Derivative instruments (liabilities)
Interest rate risks – 1,389 –
Currency risks – 1,797 –
Raw materials price risks – 234 –
31. 12. 2016
Level hierarchy in accordance with IFRS 13
in € million Level 1 Level 2 Level 3
Marketable securities, investment funds and collateral assets – available-for-sale 5,387 – –
Other investments – available-for-sale / fair value option 213 – –
Derivative instruments (assets)
Interest rate risks – 1,933 –
Currency risks – 1,842 –
Raw materials price risks – 147 –
Derivative instruments (liabilities)
Interest rate risks – 1,402 –
Currency risks – 1,479 –
Raw materials price risks – 450 –
As in the 2016 financial year, there were no reclassi-fications within the level hierarchy during the first three months of 2017.
Where a financial instrument’s fair value was required only for disclosure purposes, this was determined using the discounted cash flow method and taking account of the BMW Group’s own default risk. For this reason, the fair values calculated can be allocated to Level 2.
For financial instruments held by the BMW Group which are not measured at fair value, the carrying amounts generally correspond to fair values.
The following items are the main exceptions to this general rule:
31. 3. 2017 31. 12. 2016
in € million Fair value Carrying amount Fair value Carrying amount
Receivables from sales financing 84,251 80,891 81,621 78,260
Bonds 45,557 44,817 45,140 44,421
56
Interim Group Financial Statements
Notes to the Group Financial Statements
Other Disclosures

32 Related partiesTransactions of Group entities with related parties arise exclusively in the normal course of the business of each of the parties concerned and are conducted at normal market conditions.
The major part of the BMW Group’s transactions with related parties relates to the joint venture BMW Brilliance Automotive Ltd., Shenyang.
Supplies and services performed
Supplies and services received Receivables Payables
in € million1st quarter
20171st quarter
20161st quarter
20171st quarter
2016 31. 3. 2017 31. 12. 2016 31. 3. 2017 31. 12. 2016
BMW Brilliance Automotive Ltd. 1,315 1,087 14 8 1,038 1,215 785 615
Business relationships of the BMW Group with other associated companies and joint ventures as well as with non-consolidated subsidiaries are of limited scale.
Stefan Quandt, Germany, is a shareholder and Deputy Chairman of the Supervisory Board of BMW AG. He is also the sole shareholder and Chairman of the Super-visory Board of DELTON AG, Bad Homburg v. d. H., which, via its subsidiaries, performed logistic-related services for the BMW Group during the first quarter. In addition, companies of the DELTON Group acquired vehicles from the BMW Group through leasing.
Stefan Quandt, Germany, is also the indirect major-ity shareholder of SOLARWATT GmbH, Dresden. A cooperation arrangement exists between BMW AG and SOLARWATT GmbH, Dresden, within the field of electric mobility. The focus of this collaboration is on providing complete photovoltaic solutions for rooftop systems and carports to BMW i customers. SOLARWATT GmbH, Dresden, leased vehicles from the BMW Group during the first three months of 2017.
Susanne Klatten, Germany, is a shareholder and member of the Supervisory Board of BMW AG and a shareholder and Deputy Chairman of the Super-visory Board of ALTANA AG, Wesel. ALTANA AG, Wesel, acquired vehicles from the BMW Group in the first quarter of 2017, mainly through leasing.
Susanne Klatten, Germany, is also the sole share-holder and Chairwoman of the Supervisory Board of UnternehmerTUM GmbH, Garching. During the first three months of 2017, the BMW Group bought in services from UnternehmerTUM GmbH, Garching, primarily in the form of consultancy and workshop services.
Apart from vehicle leasing and credit financing con-tracts concluded at normal conditions, companies of the BMW Group have not entered into any contracts with members of the Board of Management or Super-visory Board of BMW AG. The same applies to close members of the families of those persons.
BMW Trust e. V., Munich, manages assets on a trustee basis for performance of obligations relating to pensions and pre-retirement part-time working arrangements in Germany and is therefore a related party of the BMW Group in accordance with IAS 24. This entity has no assets of its own. It did not have any income or expenses during the period under report. BMW AG bears expenses on an immaterial scale and performs services for BMW Trust e. V., Munich.
33 Events after the end of the reporting periodNo events have occurred after the balance sheet date which could have a major impact on the earnings performance, financial position and net assets of the BMW Group.
57

SEGMENT INFORMATION
34 Explanatory notes to segment informationFor information on the definition of reportable segments and the management system, please see
the BMW Group Financial Statements for the year ended 31 December 2016. No changes have been made either in the accounting policies applied or in the definition of reportable segments as compared to 31 December 2016.
Segment information by operating segment for the first quarter is as follows:
Automotive Motorcycles Financial Services Other Entities Reconciliation to Group figures Group
in € million1st quarter
20171st quarter
20161st quarter
20171st quarter
20161st quarter
20171st quarter
20161st quarter
20171st quarter
20161st quarter
20171st quarter
20161st quarter
20171st quarter
2016
seGment inFormAtion By operAtinG seGment
seGment inFormAtion By operAtinG seGment
External revenues 16,179 14,607 621 580 6,648 5,666 – – – – 23,448 20,853 External revenues
Inter-segment revenues 4,513 4,207 2 2 398 366 2 1 – 4,915 – 4,576 – – Inter-segment revenues
Total revenues 20,692 18,814 623 582 7,046 6,032 2 1 – 4,915 – 4,576 23,448 20,853 Total revenues
Segment result 1,871 1,763 125 94 595 570 – 4 – 2 418 – 57 3,005 2,368 Segment result
Result from equity accounted investments 351 71 – – – – – – – – 351 71 Result from equity accounted investments
Capital expenditure on non-current assets 1,030 692 9 5 6,034 4,759 – – – 1,508 – 1,218 5,565 4,238 Capital expenditure on non-current assets
Depreciation and amortisation on non-current assets 1,161 1,162 20 18 2,322 2,349 – – – 1,539 – 1,267 1,964 2,262 Depreciation and amortisation on non-current assets
Automotive Motorcycles Financial Services Other Entities Reconciliation to Group figures Group
in € million 31. 3. 2017 31. 12. 2016 31. 3. 2017 31. 12. 2016 31. 3. 2017 31. 12. 2016 31. 3. 2017 31. 12. 2016 31. 3. 2017 31. 12. 2016 31. 3. 2017 31. 12. 2016
Segment assets 9,245 9,411 634 600 11,738 11,049 75,070 75,363 94,913 92,112 191,600 188,535 Segment assets
Investments accounted for using the equity method 2,913 2,546 – – – – – – – – 2,913 2,546 Investments accounted for using the equity method
58
Interim Group Financial Statements
Notes to the Group Financial Statements
Segment Information

Automotive Motorcycles Financial Services Other Entities Reconciliation to Group figures Group
in € million1st quarter
20171st quarter
20161st quarter
20171st quarter
20161st quarter
20171st quarter
20161st quarter
20171st quarter
20161st quarter
20171st quarter
20161st quarter
20171st quarter
2016
seGment inFormAtion By operAtinG seGment
seGment inFormAtion By operAtinG seGment
External revenues 16,179 14,607 621 580 6,648 5,666 – – – – 23,448 20,853 External revenues
Inter-segment revenues 4,513 4,207 2 2 398 366 2 1 – 4,915 – 4,576 – – Inter-segment revenues
Total revenues 20,692 18,814 623 582 7,046 6,032 2 1 – 4,915 – 4,576 23,448 20,853 Total revenues
Segment result 1,871 1,763 125 94 595 570 – 4 – 2 418 – 57 3,005 2,368 Segment result
Result from equity accounted investments 351 71 – – – – – – – – 351 71 Result from equity accounted investments
Capital expenditure on non-current assets 1,030 692 9 5 6,034 4,759 – – – 1,508 – 1,218 5,565 4,238 Capital expenditure on non-current assets
Depreciation and amortisation on non-current assets 1,161 1,162 20 18 2,322 2,349 – – – 1,539 – 1,267 1,964 2,262 Depreciation and amortisation on non-current assets
Automotive Motorcycles Financial Services Other Entities Reconciliation to Group figures Group
in € million 31. 3. 2017 31. 12. 2016 31. 3. 2017 31. 12. 2016 31. 3. 2017 31. 12. 2016 31. 3. 2017 31. 12. 2016 31. 3. 2017 31. 12. 2016 31. 3. 2017 31. 12. 2016
Segment assets 9,245 9,411 634 600 11,738 11,049 75,070 75,363 94,913 92,112 191,600 188,535 Segment assets
Investments accounted for using the equity method 2,913 2,546 – – – – – – – – 2,913 2,546 Investments accounted for using the equity method
59

Segment figures for the first quarter can be reconciled to the corresponding Group figures as follows:
in € million 1st quarter 2017 1st quarter 2016
Reconciliation of segment result
Total for reportable segments 2,587 2,425
Financial result of Automotive segment and Motorcycles segment 408 – 29
Elimination of inter-segment items 10 – 28
Group profit before tax 3,005 2,368
Reconciliation of capital expenditure on non-current assets
Total for reportable segments 7,073 5,456
Elimination of inter-segment items – 1,508 – 1,218
Total Group capital expenditure on non-current assets 5,565 4,238
Reconciliation of depreciation and amortisation on non-current assets
Total for reportable segments 3,503 3,529
Elimination of inter-segment items – 1,539 – 1,267
Total Group depreciation and amortisation on non-current assets 1,964 2,262
in € million 31. 3. 2017 31. 12. 2016
Reconciliation of segment assets
Total for reportable segments 96,687 96,423
Non-operating assets – Other Entities segment 7,649 7,432
Total liabilities – Financial Services segment 128,242 126,679
Non-operating assets – Automotive and Motorcycles segments 47,139 45,923
Liabilities of Automotive and Motorcycles segments not subject to interest 35,962 33,858
Elimination of inter-segment items – 124,079 – 121,780
Total Group assets 191,600 188,535
60
Interim Group Financial Statements
Notes to the Group Financial Statements
Segment Information

OTHER INFORMATION
Page 62 Financial Calendar
Page 63 Contacts
4

FINANCIAL CALENDAR 201711 May 2017Annual General Meeting
3 August 2017Quarterly Report to 30 June 2017
7 November 2017Quarterly Report to 30 September 2017
201821 March 2018Annual Report 2017
21 March 2018Annual Accounts Press Conference
22 March 2018Analyst and Investor Conference
4 May 2018Quarterly Report to 31 March 2018
17 May 2018Annual General Meeting
2 August 2018Quarterly Report to 30 June 2018
7 November 2018Quarterly Report to 30 September 2018
Other Information
62
Financial Calendar
Contacts

CONTACTS Business and Finance PressTelephone + 49 89 382-2 45 44 + 49 89 382-2 41 18Fax + 49 89 382-2 44 18E-mail [email protected]
Investor RelationsTelephone + 49 89 382-3 16 84 + 49 89 382-2 53 87Fax + 49 89 382-1 46 61E-mail [email protected]
The BMW Group on the InternetFurther information about the BMW Group is available online at www.bmwgroup.com.Investor Relations information is available directly at www.bmwgroup.com/ir. Information about the various BMW Group brands is available at www.bmw.com, www.mini.com
and www.rolls-roycemotorcars.com.
63

P U B L I S H E D B Y
Bayerische Motoren WerkeAktiengesellschaft80788 MunichGermanyTelephone +49 89 382-0


![BMW Group BMW Diesel. DEER 2007 Page 1 13th DEER ... · SC 03 N NOx [g/h] 400 100 200 1000 1500 2000 2500 3000 3500 4000 4500 Engine speed [min-1] BMW Group BMW Diesel. Wolfgang Mattes](https://img.dokumen.tips/doc/110x75/5f63a1a10d4ce1791d440493/bmw-group-bmw-diesel-deer-2007-page-1-13th-deer-sc-03-n-nox-gh-400-100-200.jpg)


