Embed Size (px)
Citation preview

INVESTMENT ADVISORY COMMITTEE MEETING
December 15, 2016 State of Michigan Retirement Systems
Quarterly Investment Review
Nick A. Khouri, State Treasurer
Prepared by Bureau of Investments Michigan Department of Treasury


INVESTMENT ADVISORY COMMITTEE MEETING
DECEMBER 15, 2016
Agenda
9:30 a.m. Call to Order and Opening Remarks
9:40 a.m. Approval of the 9/1/16 IAC Meeting Minutes
9:45 a.m. Executive Summary & Performance for Periods Ending 9/30/16
10:00 a.m. Current Asset Allocation Review
Markets Review and Outlook
10:15 a.m. KKR ~ Henry McVey, Head of Global Macro and Asset Allocation, CIO of Balance Sheet
Review of Investment Reports – Receive and File
• Absolute and Real Return/Opportunistic • Domestic Equity • Fixed Income • International Equity • Private Equity • Real Estate & Infrastructure
Basket Clause
11:00 a.m. Closing Remarks ~ Adjournment
2017 Meeting Schedule
Thursday, March 9, 2017 Thursday, June 8, 2017
Thursday, September 7, 2017 Tuesday, December 12, 2017
All meetings start at 9:30 a.m.
www.michigan.gov/treasury


State of Michigan Retirement Systems
MINUTES Investment Advisory Committee Meeting
December 15, 2016
Jon M. Braeutigam
Chief Investment Officer Bureau of Investments


1
INVESTMENT ADVISORY COMMITTEE
The Investment Advisory Committee (IAC) held its quarterly meeting on Thursday, September 1, 2016, at the Bureau of Investments, Great Lakes Conference Room, 2501 Coolidge Road, Suite 400, East Lansing, Michigan. Members Present: James B. Nicholson, Chair
L. Erik Lundberg Reginald G. Sanders Allan R. Pohl, LARA In attendance from the Department of Treasury: Treasurer Nick A. Khouri Jon M. Braeutigam Gregory J. Parker Robert L. Brackenbury Jim Elkins Peter Woodford Jack Behar Brian Liikala Richard Holcomb Dan Quigley Karen Stout Woody Tyler Karl Borgquist Marge McPhee Janet Sudac Others in attendance: Max Kotary Steve Cummings Tim McEnery June Morse Molly Jason Mark Guastella Paul Lerg Joe Curtin Call to Order Mr. James B. Nicholson called the September 1, 2016, IAC meeting to order at 9:30 a.m. Approval of Minutes of June 16, 2016 • Mr. Nicholson asked for a motion to approve the minutes of the June 16, 2016, IAC
meeting. Mr. Erik Lundberg so moved, seconded by Mr. Reginald Sanders, there were no objections – motion carried.
Executive Summary Tab – Performance Review • Mr. Braeutigam discussed performance highlighting relative returns versus peers;
beating peers over all time periods. • Mr. Braeutigam noted that ten-year performance figures include the Great Recession. • Mr. Braeutigam noted that the one-year return is 1.5%, but the fiscal year-to-date it is
over 6%. • Mr. Greg Parker added that over the past ten years, the returns have been higher than
peers adding about $4 billion in value versus median and $8 billion more than the bottom quartile. He credited staff for their good work.

2
Asset Allocation & Performance Tabs
• Mr. Parker provided an overview of the asset allocation and how assets are allocated. • Mr. Parker noted, and referred to a graph from the Wall Street Journal, how much
more difficult it is today to earn the actuarial rate of return than just ten or twenty years ago. He noted that there is a lot more risk needed, along with more complexity.
• Mr. Parker discussed the Brexit and how hard this hit the markets; however, the markets have fully recovered.
• Mr. Parker also noted that volatility in the S&P 500 is at 20-years lows. • Mr. Peter Woodford and Mr. Jim Elkins provided an overview of some new
commitments that were made during the past quarter. Absolute and Real Return / Opportunistic Review • Mr. Jim Elkins noted that hedge funds portfolios have struggled this past year,
specifically fundamental long/short equity. • Mr. Elkins pointed out that this is a repeat from three years ago, and then they went
on to return high teen rates of return over the next few years. • Mr. Elkins also noted that quant hedge funds are doing very well; and that longer-term
returns are in line with expectations. • Mr. Elkins noted that performance for credit was positive and plans to continue in
credit strategies. Domestic Equity Review • Mr. Jack Behar discussed active equity and low fees, providing a brief highlight of how
the division’s lower fee structure began. • Mr. Behar noted that growth stocks have outperformed value stocks over the past ten
years. This has provided a headwind to performance. He also noted that historically value stocks have outperformed growth stocks over extended periods of time.
• Mr. Behar provided information on the PE ratio of several of the holdings noting that they are high quality companies with significant competitive advantages.
• Mr. Behar expects the total active equity portfolio PE ratio to at least partially converge with that of the S&P 500 over the next five years, which will drive annualized outperformance.
Long-Term Fixed Income Review • Mr. Dan Quigley explained the fixed income performance over the past quarter and
discussed the outlook for the near future. • Mr. Quigley noted that the returns over the past year came from lower rates and lower
spreads, noting that this is an unusual combination. • Mr. Quigley discussed the high-yield spreads, noting that the fund is paring back on
exposure in this area. • Mr. Quigley explained that new money market regulations are providing opportunities
at the short end of the yield curve.

3
• Mr. Quigley noted that an overweight to high quality structured debt is maintained which results in better than benchmark yield to maturity, but with lower interest rate sensitivity.
International Equity Review • Mr. Richard Holcomb discussed the international equity strategies, which are indexed
funds, stock plus funds, and external managers. • Mr. Holcomb noted that external managers were disadvantaged in the shorter term by
the commodity and energy sector rebounds in the second quarter macro events that benefitted emerging market investments.
• Mr. Holcomb discussed the geo political uncertainties that continue to negatively impact global trade.
• Mr. Holcomb also discussed how Brexit concerns caused a sharp decline in the British pound and populist political movements are a concern for the overall European trade outlook.
• Mr. Holcomb commented on the slower growth environment in China which impacts the global outlook and Pacific region suppliers. China continues to slowly reform and open its financial markets.
Private Equity Review • Mr. Peter Woodford discussed the credit strategy and investment opportunities in the
private equity environment. • Mr. Woodford commented on how the accommodative monetary policy and low
interest rates continue to be major issues impacting private equity. He stated that in an attempt to stimulate economic growth, central banks around the world have been flooding markets with liquidity which drive interest rates down and valuations up.
• Mr. Woodford talked about private equity returns and how they lag the public market benchmark return in a strong market.
• Mr. Woodford noted that the best managers are able to easily raise capital and the lower tier managers find this more difficult.
• Mr. Woodford commented that the strategy for the next three to six months will be to continue to focus on credit and opportunistic investing.
Real Estate and Infrastructure Review • Mr. Brian Liikala discussed the real estate and infrastructure returns noting that credit
strategies and unique opportunities have contributed to the overall performance. • Mr. Liikala noted that being very selective and defensive with new commitments,
seeking opportunities that are shorter in duration, deliver more liquidity, and produce consistent cash flow can add value to the fund.
• Mr. Liikala discussed the best times to sell non-strategic properties in secondary markets at attractive values.
• Mr. Liikala talked about the focus on strategy that pursues attractive risk-adjusted returns.

4
Basket Clause In the spirit of time, this report was received and filed. Closing Remarks Chairman Nicholson thanked everyone for attending. Next Meeting Date and Adjournment The next Investment Advisory Committee Meeting is scheduled for Thursday, December 15, 2016. The meeting was adjourned by Chairman Nicholson at 11:15 a.m.
Approved:
____________________________ James B. Nicholson, Chairman

State of Michigan Retirement Systems
EXECUTIVE SUMMARY Investment Advisory Committee Meeting
December 15, 2016
Gregory J. Parker, CFA
Director of Investments – Public Markets Director of Asset Allocation
Bureau of Investments


EXECUTIVE SUMMARY
September 2016 Performance An overview.
MPSERS Plan (9/30/16) 1-Year 3-Years 5-Years 7-Years 10-Years Annualized Returns 7.6% 8.5% 10.2% 9.5% 6.2% Policy Return 9.8% 8.2% 10.8% 9.8% 6.4% Peer Median Return 9.6% 6.5% 9.7% 8.8% 5.8%
• The ten-year return includes the impact of the global financial crisis. Over the past three, five, and seven years the annualized returns were higher than the 8% actuarial assumed rate. Over a very long horizon, since 1979, the annualized rate of return on the plan assets have been approximately 9.3%.
• Over the intermediate term, the returns are much higher than peer median returns. Over the past year, however, the median return was 2% higher than the plan return. Favorable asset allocation was offset by overall selectivity. It appears that peer plans have a high exposure to equity beta within their alternatives portfolios, an expensive source for beta. SMRS looks for low equity market risk within the STARR portfolio.
• Compounding even slightly higher than peer returns on $61.6 billion of SMRS assets, significantly adds up over time. For example, an annualized return of 6.2% compared to the 5.8% peer median return adds roughly $4.2 billion of value to SMRS over ten years.
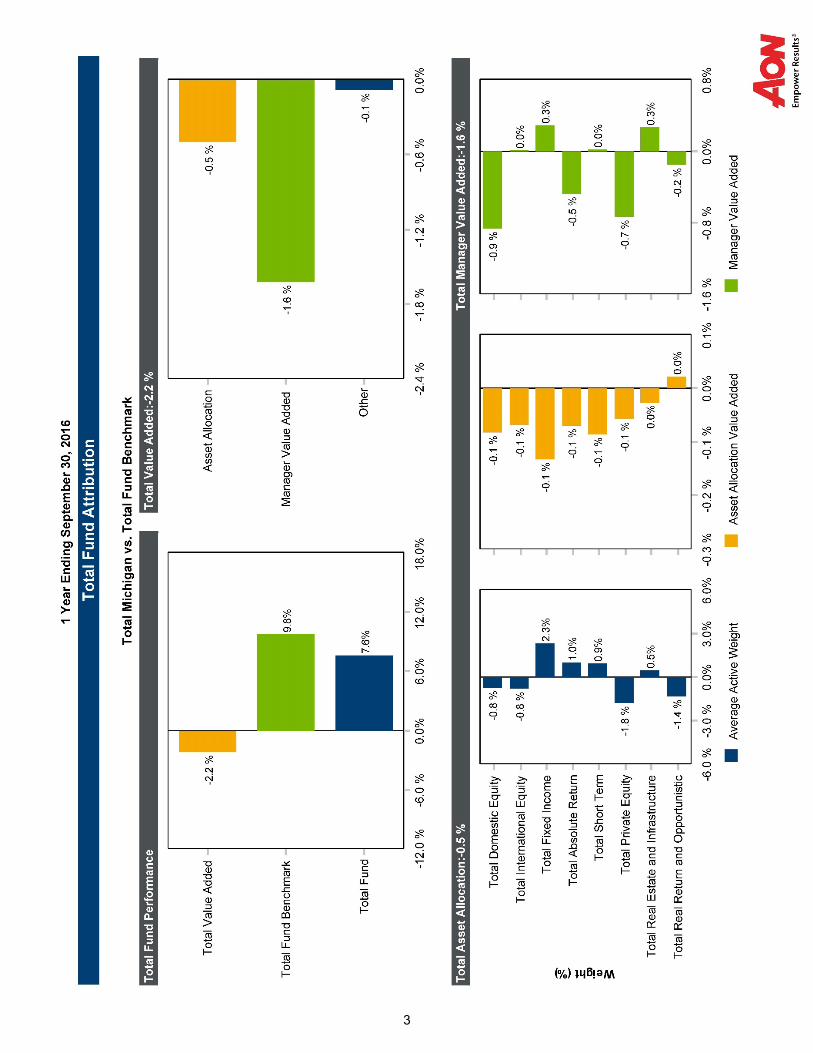
• The returns fell below the policy benchmark over the past year by -2.2%. In general, it was a tough market for alpha strategies in the active domestic equity portfolio, private equity, and absolute return portfolios.
Asset Allocation A low return environment.
• Given the historically low rates of return available in the capital markets for safe, short-term bonds, and in order for the assets to earn the long-term actuarial rate of return of 8%, additional risks (primarily equity risk) must be assumed.
• Liquidity is another fundamental risk assumed and it is managed through asset allocation. The plans have outstanding capital commitments to fund approximately $10.7 billion in illiquid assets, primarily private equity. In the September 2016 quarter over $1.1 billion of new commitments were made.
• The combined systems paid out approximately $2.1 billion net of contributions over the past twelve months ending in September 2016.
• Over the past year, the allocation to short-term cash decreased by approximately $100 million. The plans put to work approximately $850 million in real return/opportunistic strategies, and $300 million in long-term fixed income, and the plans reduced the allocation to domestic equity by $1.9 billion, private equity by $900 million and absolute return by $400 million.
1

Capital Markets Risk assets in focus. • Capital market assumptions used for determining strategic asset allocations are being reduced
across the board. This is the general opinion for most consultants, investment banks, and other market participants. The reason for this is the low interest rate environment caused by the policies of the Federal Reserve and other central banks, as well as the run-up in prices for most risk assets since the depths of the global financial crisis.
• Over the last twelve months the broad U.S. stock market return was 15.5%, entirely due to multiple expansion. Safe, low volatility, bond-like equities are near extreme valuations and their returns are very highly correlated (and have become even more so) to changes in interest rates.
• The publicly traded FTSE Nareit REITs Index was up 21% over the past year ending September 2016, out returning the broad domestic equity market by over 5.5%. On an annualized basis, over the past three and five years, the index is up 13.9% and 16.0% respectively.
• The 10-year U.S. Treasury ended September 2016 at 1.6%, about 60 basis points (bps) lower than one year prior. Spreads in both high yield and investment grade fixed income securities continue to narrow and ended the September quarter at slightly higher than average levels.
Economic Backdrop U.S. economy continues to slowly grow. • After months of anticipation, at its December 2015 meeting, the Federal Reserve Board voted to
increase short-term interest rates by 25 bps. This marks the first time in roughly seven years that the Fed Funds rate is higher than effectively zero percent. By October 2016 the market is pricing an ever increasing probability of a second 25 bps rate hike by December 2016, however much less certain of additional rate increases into 2017.
• The most recent reading of the annualized U.S. GDP growth was 2.9%, above the consensus estimate of 2.6%. Current estimates for 2017 GDP growth for the U.S. is 2.1%. Coincidental economic indicators such as the Institute for Supply Management’s Manufacturing and Non-Manufacturing PMI Indexes are above 50, indicating that there currently is still a modest expansion in the U.S. economy.
2

Investment Update Highlighting the quarter.
($ Millions)
NEW COMMITMENTS
July 1 – September 30, 2016
Asset Class Fund Name / (Managed By) Commitment
Private Equity Michigan Growth Capital Partners III, L.P. (Beringea/GCM Grosvenor) $100.0 GCM Grosvenor Fund Investment Program VIII, L.P. 100.0
HPS Mezzanine Partners III, L.P. (HarbourVest) 50.0 Real Estate & Infrastructure Lone Star Fund X, L.P. 200.0
M301W CoInvest, L.L.C. (CIM Investment Advisors) 17.0
Penmain Office, L.L.C. (Domain Advisors) 15.0
Real Return & Opportunistic Apollo Financial Credit Investments Fund III 300.0
Redding Ridge Holdings, L.P. (Apollo) 100.0
Sprott Private Resource Lending Fund (U.S.), L.P. 100.0
Kayne Anderson Energy Fund VII, L.P. 75.0
RPEP Energy Opp Inst Partner (Ridgewood Energy) 35.0
Centerbridge SCP III, L.P. 30.0
Sprott PRL (M), L.P. 25.0
TOTAL $1,147.0
3


State of Michigan Retirement Systems
PERFORMANCE Investment Advisory Committee Meeting
December 15, 2016
Jon M. Braeutigam
Chief Investment Officer Bureau of Investments


Bureau of Investments
Mission Statement The Bureau of Investments continually strives to provide quality
investment management services, broad professional expertise, and
independent advice to the State Treasurer as fiduciary of the State of
Michigan Retirement Systems, and various Michigan trust funds and the
State’s common cash.
SMRS Goals Maintain sufficient liquidity to pay benefits.
Meet or exceed the actuarial assumption
over the long term.
Perform in the top half of the public plan universe over the long term.
Diversify assets to reduce risk.
Exceed individual asset class benchmarks
over the long term.
1

MPS
ERS
PEN
SIO
NTi
me-
Wei
ghte
d R
ates
of R
etur
nPe
riods
End
ing
Sept
embe
r 30,
201
6
% o
f Te
nSe
ven
Five
Thre
eO
neC
urre
ntPo
rtfo
lio9/
30/1
6R
ate
Ran
kR
ate
Ran
kR
ate
Ran
kR
ate
Ran
kR
ate
Ran
kR
ate
Ran
k
TOTA
L PL
AN10
0.0
6.2
149.
513
10.2
338.
55
7.6
963.
475
Med
ian
- Gre
ater
than
$10
Billi
on 2
5.8
8.8
9.7
6.5
9.6
3.6
M
PSER
S To
tal P
lan
Polic
y
6.4
9.8
10.8
8.2
9.8
3.2
DO
MES
TIC
EQ
UIT
IES
25.7
7.2
4712
.751
16.2
3410
.337
12.2
703.
692
Med
ian
27.
112
.715
.59.
213
.54.
5
S&
P 1
500
Inde
x
7.4
13.3
16.4
10.9
15.5
4.0
INTE
RN
ATIO
NAL
EQ
UIT
IES
15.9
2.0
854.
958
7.7
602.
128
9.9
497.
526
Med
ian
23.
05.
27.
91.
59.
96.
8
Inte
rnat
iona
l Ble
nded
Ben
chm
ark
3
1.0
3.5
6.3
0.3
9.3
6.9
PRIV
ATE
EQU
ITIE
S15
.311
.26
15.2
511
.619
13.2
143.
677
2.6
56
M
edia
n 2
8.9
11.0
9.7
9.2
4.7
2.8
A
ltern
ativ
e B
lend
ed B
ench
mar
k 4
11
.217
.315
.214
.87.
13.
2
BO
ND
S13
.25.
719
5.1
584.
253
5.0
257.
344
1.8
26
M
edia
n 2
5.2
5.3
4.2
4.4
6.6
1.0
B
arcl
ays
Agg
rega
te
4.8
4.1
3.1
4.0
5.2
0.5
REA
L ES
TATE
& IN
FRAS
TRU
CTU
RE
10.6
5.2
267.
869
11.7
3613
.917
10.4
572.
441
Med
ian
24.
19.
611
.411
.110
.81.
9
NC
RE
IF -
Pro
perty
Ble
nded
Inde
x 5
5.
99.
79.
89.
97.
81.
4
NC
RE
IF O
pen
Fund
Inde
x N
et
5.1
11.4
11.3
11.4
9.1
1.8
REA
L R
ETU
RN
AN
D O
PPO
RTU
NIS
TIC
8.8
9.8
12.1
5.4
3.4
5
0% (C
PI +
500
bps)
+ 5
0% (8
% a
ctua
rial r
ate)
7.
27.
07.
31.
7
ABSO
LUTE
RET
UR
N6.
55.
04.
93.
2-1
.70.
8
HFR
I FO
F C
ons
1 m
onth
lagg
ed
2.7
2.6
2.3
-1.3
1.0
CAS
H E
QU
IVAL
ENTS
4.0
0.9
0.5
0.4
0.5
0.7
0.2
1
Mon
th T
-Bill
0.
80.
10.
10.
10.
20.
11
Ann
ualiz
ed R
etur
ns a
nd P
erce
ntile
Ran
k.2
Com
paris
on u
nive
rse
is th
e S
tate
Stre
et U
nive
rse
com
pris
ed o
f Pub
lic F
unds
gre
ater
than
$10
Billi
on o
n th
e to
tal p
lan
leve
l and
gre
ater
than
$1
Billi
on fo
r ass
et c
lass
es.
3 In
tern
atio
nal b
lend
ed b
ench
mar
k is
S&
P D
evel
oped
BM
I-EP
AC
50/
50 p
rior t
o 1/
1/20
10.
S&
P D
evel
oped
BM
I-EP
AC
75
US
D /
25 L
ocal
, 1/1
/201
0 to
9/3
0/10
. M
SC
I AC
WI E
x U
SA
Gro
ss 1
0/1/
2010
to p
rese
nt.
4 S
P 5
00 +
300
bps
thru
12/
31/0
6. E
ndin
g m
arke
t val
ue (E
MV
) wei
ghte
d bl
end
of 1
0 yr
yie
ld +
300
bps
and
SP
500
+ 3
00 b
ps 1
2/31
/06
to 9
/30/
09.
EM
V w
eigh
ted
blen
d of
10
yr y
ield
+ 3
00 b
ps a
nd S
P 5
00 +
300
bps
3-m
onth
lagg
ed 9
/30/
09 to
pre
sent
.5
NC
RE
IF -
Pro
perty
Ble
nded
Inde
x is
NP
I min
us 7
5 bp
s pr
ior t
o O
ctob
er 2
005,
NP
I min
us 1
30 b
ps c
urre
nt.
Sour
ce: S
tate
Stre
et A
naly
tics;
the
NC
REI
F - N
PI (P
rope
rty In
dex)
sou
rce
is N
CR
EIF;
the
S&P
BMI-E
PAC
Inde
x so
urce
is S
&P.
Year
s 1
Year
s 1
Year
Qua
rter
Year
s 1
Year
s 1
2
3

1 Y
ear
2 Y
ear
3 Y
ear
4 Y
ear
5 Y
ear
6 Y
ear
7 Y
ear
8 Y
ear
9 Y
ear
10 Y
ear
MPS
ERS
7.6
5.1
8.5
9.5
10.2
9.6
9.5
7.4
5.0
6.2
Publ
ic P
lan
- Med
ian
(> $
10 b
illio
n)*
9.6
4.6
6.5
8.2
9.7
8.6
8.8
7.1
4.6
5.8
Ran
k96
355
833
1113
3428
14bp
Diff
eren
ce -
Med
ian
-201
4819
112
153
9974
2945
39
9/16
9/15
9/14
9/13
9/12
9/11
9/10
9/09
9/08
9/07
MPS
ERS
7.6
2.6
15.6
12.5
13.4
6.6
8.8
-6.1
-12.
317
.2Pu
blic
Pla
n - M
edia
n (>
$10
bill
ion)
*9.
6-0
.211
.012
.615
.52.
510
.2-0
.1-1
4.6
16.7
Ran
k96
43
5182
484
8122
41bp
Diff
eren
ce -
Med
ian
-201
277
457
-5-2
0841
8-1
40-6
0423
948
1 Y
ear
2 Y
ear
3 Y
ear
4 Y
ear
5 Y
ear
6 Y
ear
7 Y
ear
8 Y
ear
9 Y
ear
10 Y
ear
MSE
RS
7.6
5.1
8.4
9.4
10.2
9.6
9.4
7.3
4.9
6.1
Publ
ic P
lan
- Med
ian
(> $
1 bi
llion
)*9.
84.
46.
58.
29.
68.
48.
77.
24.
75.
8R
ank
8932
48
3713
1543
3226
bp D
iffer
ence
- M
edia
n-2
2165
192
125
6111
669
1826
32
9/16
9/15
9/14
9/13
9/12
9/11
9/10
9/09
9/08
9/07
MSE
RS
7.6
2.6
15.5
12.5
13.4
6.5
8.5
-6.3
-12.
417
.2Pu
blic
Pla
n - M
edia
n (>
$1
billi
on)*
9.8
-0.3
10.7
12.5
16.0
1.9
10.3
0.2
-14.
316
.3R
ank
893
352
805
8586
2837
bp D
iffer
ence
- M
edia
n-2
2128
648
3-5
-259
452
-181
-643
187
91
Cum
ulat
ive
For Y
ears
End
ing
9/30
/16
Con
secu
tive
For Y
ears
End
ing
MSE
RS
Cum
ulat
ive
For Y
ears
End
ing
9/30
/16
Con
secu
tive
For Y
ears
End
ing
*Sta
te S
treet
Pub
lic F
unds
Uni
vers
e
Cum
ulat
ive
and
Con
secu
tive
Tota
l Fun
d R
etur
ns
MPS
ERS
4

1 Y
ear
2 Y
ear
3 Y
ear
4 Y
ear
5 Y
ear
6 Y
ear
7 Y
ear
8 Y
ear
9 Y
ear
10 Y
ear
MSP
RS
7.6
5.0
8.4
9.4
10.2
9.6
9.4
7.3
4.9
6.1
Publ
ic P
lan
- Med
ian
(> $
1 bi
llion
)*9.
84.
46.
58.
29.
68.
48.
77.
24.
75.
8R
ank
8934
49
3813
1643
3222
bp D
iffer
ence
- M
edia
n-2
2263
188
121
5511
669
1527
34
9/16
9/15
9/14
9/13
9/12
9/11
9/10
9/09
9/08
9/07
MSP
RS
7.6
2.5
15.5
12.4
13.3
6.7
8.5
-6.5
-12.
217
.4Pu
blic
Pla
n - M
edia
n (>
$1
billi
on)*
9.8
-0.3
10.7
12.5
16.0
1.9
10.3
0.2
-14.
316
.3R
ank
893
352
854
8587
2132
bp D
iffer
ence
- M
edia
n-2
2228
547
5-1
0-2
7247
8-1
82-6
6521
110
7
1 Y
ear
2 Y
ear
3 Y
ear
4 Y
ear
5 Y
ear
6 Y
ear
7 Y
ear
8 Y
ear
9 Y
ear
10 Y
ear
MJR
S7.
65.
08.
29.
210
.19.
49.
17.
04.
85.
9Pu
blic
Pla
n - M
edia
n (>
$1
billi
on)*
9.8
4.4
6.5
8.2
9.6
8.4
8.7
7.2
4.7
5.8
Ran
k89
344
1838
1933
6742
40bp
Diff
eren
ce -
Med
ian
-221
6317
099
5010
134
-13
914
9/16
9/15
9/14
9/13
9/12
9/11
9/10
9/09
9/08
9/07
MJR
S7.
62.
514
.912
.113
.96.
17.
0-6
.4-1
1.7
17.0
Publ
ic P
lan
- Med
ian
(> $
1 bi
llion
)*9.
8-0
.310
.712
.516
.01.
910
.30.
2-1
4.3
16.3
Ran
k89
33
6370
710
086
1339
bp D
iffer
ence
- M
edia
n-2
2128
341
8-4
4-2
0641
3-3
30-6
5126
168
MJR
SC
umul
ativ
e Fo
r Yea
rs E
ndin
g 9/
30/1
6
Con
secu
tive
For Y
ears
End
ing
*Sta
te S
treet
Pub
lic F
unds
Uni
vers
e
Cum
ulat
ive
and
Con
secu
tive
Tota
l Fun
d R
etur
ns
MSP
RS
Cum
ulat
ive
For Y
ears
End
ing
9/30
/16
Con
secu
tive
For Y
ears
End
ing
5


State of Michigan Retirement Systems
ASSET ALLOCATION REVIEW Investment Advisory Committee Meeting
December 15, 2016
Jon M. Braeutigam Chief Investment Officer Bureau of Investments


STA
TE O
F M
ICH
IGA
N R
ETIR
EMEN
T SY
STEM
SPR
OFI
LE -
SEPT
EMB
ER 2
016
Ass
et A
lloca
tion
By
Mar
ket V
alue
(In M
illio
ns)
In
vest
men
t Str
ateg
ies
9/30
/16
6/30
/16
Mar
ket V
alue
By
Plan
~ 9
/30/
16
Dom
estic
Equ
ity$1
5,84
225
.7%
$16,
059
26.6
%
Inte
rnat
iona
l Equ
ity9,
802
15.9
%9,
127
15.1
%Pe
nsio
n Pl
anO
PEB
**C
ombi
ned
Pr
ivat
e Eq
uity
9,45
715
.3%
9,50
615
.8%
Mkt
. Val
ueM
kt. V
alue
Mkt
. Val
ue%
Fi
xed
Inco
me
8,11
213
.2%
7,97
313
.2%
R
eal E
stat
e &
Infr
a.6,
564
10.6
%6,
443
10.7
%
MPS
ERS
$43,
228
$4,3
09$4
7,53
777
.2%
R
eal R
etur
n &
Opp
ort.
5,39
78.
8%5,
220
8.7%
M
SER
S - (
clos
ed)
10,9
211,
512
12,4
3320
.2%
Ab
solu
te R
etur
n3,
978
6.5%
4,19
17.
0%
MSP
RS
1,27
411
11,
385
2.2%
Sh
ort T
erm
***
2,45
94.
0%1,
743
2.9%
M
JRS
- (cl
osed
)25
51
256
0.4%
TO
TAL
$61,
611
100.
0%$6
0,26
210
0.0%
TO
TAL
$55,
678
$5,9
33$6
1,61
110
0.0%
Shor
t Ter
m E
quiv
alen
ts (i
n B
illio
ns)
S
hort
Ter
m S
trat
egy*
**$2
.5
Sho
rt T
erm
in O
ther
Inv.
Str
ateg
ies
0.5
T
OTA
L SH
OR
T TE
RM
$3.0
4.9%
of T
otal
Fun
ds
*The
com
bine
d ne
t pay
out f
or th
e pl
ans
for F
Y 20
15 w
as $
2.2
billio
n w
ith $
19.9
billi
on p
aid
out s
ince
200
8 (S
OM
CAF
R).
Thi
s re
pres
ents
the
amou
nt p
aid
to b
enef
icia
ries
in e
xces
s of
em
ploy
er a
nd e
mpl
oyee
con
tribu
tions
.
**O
PEB
- Oth
er P
ost E
mpl
oym
ent B
enef
its
(in M
illio
ns)
Pens
ions
& In
vest
men
ts S
urve
y - F
ebru
ary
8, 2
016
Issu
e
19th
Lar
gest
DB
Pen
sion
Fun
d in
the
U.S
.18
th L
arge
st D
B P
ublic
Pen
sion
Fun
d in
the
U.S
.
Dom
estic
Equ
ity25
.7%
Abso
lute
Ret
urn
6.5%
Priv
ate
Equi
ty15
.3%
Rea
l Est
ate
&
Infr
astr
uctu
re10
.6%
Fixe
d In
com
e 13
.2%Sh
ort T
erm
4.0%
Rea
l Ret
urn
&
Opp
ortu
nist
ic
8.8%
Inte
rnat
iona
l Equ
ity15
.9%
Ass
et A
lloca
tion
9/30
/16
$61.8
$44.5
$47.1
$49.7
$48.1
$51.0
$56.6
$60.7
$60.1
$61.6
$0$10
$20
$30
$40
$50
$60
$70
Mar
ket V
alue
*(B
illio
ns o
f Dol
lars
)
1

A
nega
tive
num
ber i
n an
ass
et c
ateg
ory
indi
cate
s a
use
of c
ash,
a p
ositi
ve n
umbe
r ind
icat
es a
sou
rce
of c
ash.
Dol
lars
in m
illio
ns
$380
$910
$1,8
89
-$10
-$30
6
-$35
-$85
2
-$2,
076
Sour
ces
and
Use
s of
Cas
hO
ctob
er 2
015
~ S
epte
mbe
r 201
6
Abso
lute
Ret
urn
Fixe
d In
com
e
Priv
ate
Equi
ty
Dom
estic
Equi
ty
Inte
rnat
iona
lEq
uity
Rea
l Est
ate
&In
fras
truc
ture
Rea
l Ret
urn
&O
ppor
tuni
stic
Net
Ben
efit
Paym
ents
10/0
1/15
Bal
ance
of S
hort
-Ter
m C
ash:
$ 2
,559
9/30
/16
Bal
ance
of S
hort
-Ter
m C
ash:
2,
459
Net
Sho
rt-T
erm
Cas
h D
ecre
ase:
$
-10
0
2

SMR
S
Act
ual
Targ
etTa
rget
*A
ctua
lTa
rget
Targ
et*
Act
ual
Targ
etTa
rget
*A
ctua
lTa
rget
Targ
et*
9/30
/16
9/30
/16
9/30
/17
9/30
/16
9/30
/16
9/30
/17
9/30
/16
9/30
/16
9/30
/17
9/30
/16
9/30
/16
9/30
/17
Broa
d U.
S. E
quity
25.7
%28
.0%
28.0
%25
.7%
28.0
%28
.0%
25.7
%28
.0%
28.0
%25
.7%
28.0
%28
.0%
20%
- 50
%
Priv
ate
Equi
ty15
.3%
17.0
%18
.0%
15.3
%17
.0%
18.0
%15
.3%
17.0
%18
.0%
15.3
%17
.0%
18.0
%10
% -
25%
Broa
d In
t’l E
quity
15.9
%15
.5%
16.0
%15
.9%
15.5
%16
.0%
15.9
%15
.5%
16.0
%15
.9%
15.5
%16
.0%
10%
- 20
%
U.S.
Fix
ed In
com
e
Core
13.2
%11
.5%
10.5
%13
.2%
11.5
%10
.5%
13.2
%11
.5%
10.5
%13
.2%
11.5
%10
.5%
8% -
25%
Abso
lute
Ret
urn
6.5%
7.0%
6.0%
6.5%
7.0%
6.0%
6.5%
7.0%
6.0%
6.5%
7.0%
6.0%
0% -
12%
Cash
4.0%
2.5%
2.0%
4.0%
2.5%
2.0%
4.0%
2.5%
2.0%
4.0%
2.5%
2.0%
1% -
9%
TOTA
L10
0.0%
100.
0%10
0.0%
100.
0%10
0.0%
100.
0%10
0.0%
100.
0%10
0.0%
100.
0%10
0.0%
100.
0%
*Com
plie
s w
ith b
aske
t cla
use
and
inte
rnat
iona
l res
tric
tions
.
10.6
%0%
- 15
%10
.0%
10.0
%10
.6%
10.0
%10
.0%
9.5%
MSP
RS
Real
Ret
urn
/ O
ppor
tuni
stic
MPS
ERS
MSE
RS
Ass
et C
lass
Real
Est
ate
/ In
frast
ruct
ure
10.6
%10
.0%
10.0
%10
.6%
10.0
%10
.0%
As o
f 9/3
0/16
MJR
S
Ran
ges
0% -
15%
Asse
t Allo
catio
n Ta
rget
s
8.8%
8.5%
9.5%
8.8%
8.5%
9.5%
8.8%
8.5%
9.5%
8.8%
8.5%
3


State of Michigan Retirement Systems
MARKETS REVIEW AND OUTLOOK Investment Advisory Committee Meeting
December 15, 2016
Gregory J. Parker, CFA
Director of Investments – Public Markets Director of Asset Allocation
Bureau of Investments


CAPITAL MARKETS
Return and Risk Assumptions, Benchmark and Outlook A starting point.
MPSERS Plan
Assumed Return*
(Arithmetic)
Standard Deviation*
Trailing 10-Year
(Benchmark**)
Tactical (Short Term)
Expectations*** Private Equity 10.7% 24.0% 11.2% Hold International Equity 9.3% 20.9% 1.0% Hold Domestic Equity 7.6% 17.4% 7.4% Trim Real Estate (Core) 6.1% 11.5% 5.9% Trim Absolute Return
5.2% 9.0% 4.8% Hold Real Ret/Opportunistic 8.3% 12.1% 7.4% Add Long-Term Fixed
2.2% 3.5% 4.8% Hold
Short-Term 1.7% 1.0% 0.8% Hold
* Aon Hewitt Investment Consultants 2016 Long-Term Return/Risk Assumptions ** Investment Policy Statement; Annualized Returns *** Actual investments may differ due to changing conditions and the availability of new information Overview Softening the outlook for risk assets.
• Capital market assumptions used for determining strategic asset allocations are being reduced
across the board, and especially for safer, publicly traded fixed income securities. This is the general opinion for most consultants, investment banks, and other market participants. The reason for this phenomenon is the low interest rate environment caused by the policies of the Federal Reserve and other central banks, as well as the run-up in prices for most risk assets over the past five years after the depths of the Great Recession.
• Over the last twelve months the broad U.S. stock market return was 15.5%, entirely due to multiple expansion. Year over year earnings growth of U.S. equities has averaged 0% over the past few years. Safe, low volatility, bond-like equities are near extreme valuations and their returns are very highly correlated (and have become even more so) to changes in interest rates.
• International equities continue to underperform domestic. Over the past one, three, five, seven, and ten years ending September 2016, the international market index, MSCI ACWI ex USA, underperformed the S&P 1500 index by -4.9%, -9.3%, -8.5%, -8.1%, and -4.5% annualized respectively.
• The 10-year U.S. Treasury ended September 2016 at 1.6%, about 60 basis points (bps) lower than
one year prior. Spreads in both high yield and investment grade fixed income securities continue to narrow and ended the September quarter at slightly higher than average levels.
• The publicly traded FTSE Nareit REITs Index was up 21% over the past year ending September
2016. The index hit an all-time high in August 2016, though by the end of October 2016 the index has corrected by roughly 11%.
• The U.S. dollar has been range bound over the past year ending September 2016. As measured by
the DXY Index, the U.S. dollar has fluctuated around +/- 3.5% and it ended September just slightly below its twelve-month price range.
1

Domestic Equity Bond-like equities behaving as bonds.
• Over the last twelve months the broad U.S. stock market return was 15.5%, entirely due to multiple
expansion. Year over year earnings growth of U.S. equities has averaged 0% over the past few years. However, perhaps in anticipation of future growth in profits, from a technical perspective the market is attempting to break out of its recent weakening trend. In August, the S&P 500 market index reached a new closing high.
• Valuation metrics are above average and the absolute returns over the next cycle will not likely be
as strong as the historical average of 11 – 12% year over year total returns.
• Over the past year, ending September 2016, large cap and small-cap stocks delivered nearly the same rate of return. Over the past three, five, seven, and ten years large has outperformed small-cap returns by 4.2%, 0.5%, 0.6%, and 0.2% on an annualized basis. In spite of the performance differences, small-cap stocks continue to look slightly expensive relative to large caps.
• Over the past year, value beat growth by 2.4%; however, over the past three, five, seven, and ten
years growth has out earned value by roughly 0.5 - 2.5% annually. The relative returns of value stocks have a long ways to go to get back to historical averages.
• Safe, low volatility, bond-like equities are near extreme valuations and their returns are very highly
correlated (and have become even more so) to changes in interest rates. They are also moving more as a pack, rather than a collection of securities.
International Equity Brexit vote shocks the market. • International equities continue to underperform domestic. Over the past one, three, five, seven, and
ten years ending September 2016, the international market index, MSCI ACWI ex USA, underperformed the S&P 1500 index by -4.9%, -9.3%, -8.5%, -8.1%, and -4.5% annualized respectively.
• Within international equities, in a slight reversal of trend, emerging markets outperformed developed markets over the past year by 8.2%. Over the past three, five, and seven years developed has outperformed emerging by 0.9%, 3.7%, and 1.7% on an annualized basis, though underperforming emerging the past ten years by 2.0%.
• International equity small cap stocks have outperformed the broader MSCI ACWI ex USA index. Last
year ending September 2016, the returns for international small caps were 3.8% higher and over the past three, five, seven, and ten years, small caps have outperformed by 2.5% - 3% annually.
• The plan is underweight international equity against a global benchmark (approximately 38% versus
48%) though close to the weight of peers; 15.9% versus 16.2%. • Based on a price-to-earnings valuation multiple, excluding non-earning companies, developed
international equity markets trade at a 10% discount to the U.S. counterparts, while emerging markets trade at a 30% discount.
2

Interest Rates A flattening curve. • The 10-year U.S. Treasury ended September 2016 at 1.6%, about 60 bps lower than one year prior.
The curve is near average in terms of steepness, but it is has not been this flat since October 2007. Since the beginning of the year, the shape of the yield curve has flattened nearly 40 bps.
• Spreads in both high yield and investment grade fixed income securities continue to narrow and ended the September quarter at slightly higher than average levels. Investment grade securities were about 15 bps above and high-yield spreads were about 5 bps above their long-term averages.
• Inflation expectations are being priced lower in the bond markets. The ten-year breakeven rates at
the end of September 2016 were priced at 1.6%, 40 bps below the average of the past five years though they have been range bound over the past year. This level is lower than the Feds target rate of long-term 2% inflation; the market is betting against the Fed.
• The Barclays Aggregate Index’s sensitivity to changes in interest rates has slightly decreased since
last year as measured by the modified adjusted duration. At the end of September 2016, the Index had a duration of 5.5 compared to 5.8 a year ago.
Real Estate Rich valuations. • The publicly traded FTSE Nareit REITs Index was up 21% over the past year ending September
2016, out returning the broad domestic equity market by over 5.5%. On an annualized basis, over the past three and five years, the index is up 13.9% and 16.0% respectively.
• The index hit an all-time high in August 2016, though by the end of October 2016 the index has corrected by roughly 11%.
• The REIT Index is priced modestly cheap relative to bonds, while other valuation metrics indicate that the index is very expensively priced. In other words, real estate is not expected to deliver high absolute returns over the longer term. However stretched the valuations have become, timing of the softer than normal returns is tricky.
Commodities Rebounding some. • At the end of September 2016, commodity prices, as measured by the Thomson Reuters CRB Index,
were about the same as one year prior, however they are almost 20% higher than the February 2016 lows. Since its peak in 2008, prices are down by about -60%, and prices are now around the March 2009 levels.
• The U.S. dollar has been range bound over the past year ending September 2016. As measured by the DXY Index, the U.S. dollar has fluctuated around +/- 3.5% and it ended September just slightly below its twelve-month price range.
3

ECONOMIC OUTLOOK
Select Historic Economic Growth with Forecasts An eye to 2017. Real GDP Growth Actual/Forecasts 2014 2015 2016 2017 2018 World 3.4 3.2 2.9 3.2 3.3 U.S. 2.4 2.6 1.5 2.1 2.1 Developed (G8) 1.9 2.2 1.6 1.8 1.9 Asia 4.8 4.9 4.4 4.7 4.6 EMEA 2.2 0.9 1.4 2.4 2.8 Europe 1.2 2.0 1.6 1.3 1.5 Latin America 0.6 -0.4 -1.8 1.8 2.7 China 7.3 6.9 6.7 6.4 6.0
*Source: Bloomberg
Economic Overview U. S. economy remains the bright spot. • The most recent reading of the annualized U.S. GDP growth was 2.9%, above the consensus
estimate of 2.6%. Current estimates for 2017 GDP growth for the U.S. is 2.1%. Coincidental economic indicators such as the Institute for Supply Management’s Manufacturing and Non-Manufacturing PMI Indexes are above 50, indicating that there currently is still a modest expansion in the U.S. economy.
• Interest rates in the U.S. continued to trade at higher levels than those in many developed markets. This is due primarily to the differences in monetary policies.
• The jobs market is fairly healthy. The national unemployment rate is 4.9% and the three-month
average figures for both initial jobless and continuing claims continue to stay near the lowest levels in over 40 years. Anecdotally, wages are increasing across the U.S. However, wage growth has been depressed for a number of years prior, so it is difficult to become too concerned about wage-cost inflation right now.
• U.S. housing is a bright spot. At nearly 5.5 million, total existing home sales is near its highest level
in nine years, although the level has plateaued over the past year or so. Demand is more robust than supply; housing inventory-to-sales ratios are at the low end of a 25-year range. Existing home sales median price hit $235 thousand by September 2016.
4

1996
1997
1998
1999
2000
2001
2002
2003
2004
2005
2006
2007
2008
2009
2010
2011
2012
2013
2014
2015
U.S
.U
.S.
U.S
.In
t'lG
ov't
Cor
p.G
ov't
Int'l
Int'l
Rea
lIn
t'lIn
t'lG
ov't
Int'l
U.S
.R
eal
Int'l
U.S
.U
.S.
Rea
lBe
stBe
stEq
uity
Equi
tyEq
uity
Equi
tyB
onds
Bon
dsB
onds
Equi
tyEq
uity
Esta
teEq
uity
Equi
tyB
onds
Equi
tyEq
uity
Esta
teEq
uity
Equi
tyEq
uity
Esta
te
22.4
2%32
.94%
26.3
3%26
.97%
13.2
3%10
.40%
11.5
0%40
.82%
20.9
0%20
.06%
26.6
5%16
.65%
12.3
8%41
.44%
16.3
8%14
.26%
16.8
3%32
.80%
13.0
8%13
.32%
Hed
geH
edge
Int'l
U.S
.R
eal
Rea
lC
orp.
U.S
.R
eal
Int'l
Rea
lR
eal
Cas
hU
.S.
Rea
lG
ov't
U.S
.In
t'lR
eal
U.S
.
Fund
sFu
nds
Equi
tyEq
uity
Esta
teEs
tate
Bon
dsEq
uity
Esta
teEq
uity
Esta
teEs
tate
Equi
tyEs
tate
Bon
dsEq
uity
Equi
tyEs
tate
Equi
ty
13.7
3%14
.95%
19.9
7%20
.27%
12.2
4%7.
28%
10.5
2%29
.58%
14.4
8%16
.62%
16.5
9%15
.84%
2.05
%27
.24%
13.1
1%9.
02%
16.1
7%15
.29%
11.8
1%1.
01%
Rea
lR
eal
Rea
lH
edge
Cor
p.G
ov't
Rea
lH
edge
U.S
.U
.S.
U.S
.G
ov't
Infla
-C
orp.
Int'l
Cor
p.R
eal
Rea
lC
orp.
Gov
't
Esta
teEs
tate
Esta
teFu
nds
Bon
dsB
onds
Esta
teFu
nds
Equi
tyEq
uity
Equi
tyB
onds
tion
Bon
dsEq
uity
Bon
dsEs
tate
Esta
teB
onds
Bon
ds
10.3
1%13
.91%
16.2
4%18
.93%
9.40
%7.
24%
6.74
%9.
01%
11.7
8%5.
65%
15.3
4%8.
67%
0.10
%16
.05%
11.1
5%8.
35%
10.5
4%10
.99%
7.53
%0.
86%
Int'l
Cor
p.G
ov't
Rea
lC
ash
Cas
hH
edge
Rea
lH
edge
Hed
geH
edge
Hed
geC
orp.
Hed
geC
orp.
Infla
-C
orp.
Hed
geG
ov't
Infla
-Eq
uity
Bon
dsB
onds
Esta
teFu
nds
Esta
teFu
nds
Fund
sFu
nds
Fund
sB
onds
Fund
sB
onds
tion
Bon
dsFu
nds
Bon
dstio
n
6.05
%10
.23%
9.85
%11
.36%
6.16
%4.
43%
3.57
%8.
99%
5.83
%5.
13%
9.21
%7.
68%
-3.0
7%9.
65%
8.46
%2.
96%
9.37
%7.
69%
4.92
%0.
66%
Cas
hG
ov't
Cor
p.C
ash
Hed
geH
edge
Infla
-C
orp.
Cor
p.In
fla-
Cas
hU
.S.
Rea
lIn
fla-
Gov
'tU
.S.
Hed
geIn
fla-
Hed
geH
edge
Bon
dsB
onds
Fund
sFu
nds
tion
Bon
dsB
onds
tion
Equi
tyEs
tate
tion
Bon
dsEq
uity
Fund
stio
nFu
nds
Fund
s
5.30
%9.
58%
8.59
%4.
83%
5.77
%3.
11%
2.39
%7.
69%
5.25
%3.
42%
4.81
%5.
47%
-6.4
6%2.
72%
5.52
%1.
75%
4.06
%1.
49%
3.41
%0.
51%
Infla
-C
ash
Cas
hIn
fla-
Infla
-In
fla-
Cas
hG
ov't
Gov
'tC
ash
Cor
p.C
orp.
Hed
geC
ash
Hed
geC
ash
Gov
'tC
ash
Infla
-C
ash
tion
tion
tion
tion
Bon
dsB
onds
Bon
dsB
onds
Fund
sFu
nds
Bon
dstio
n
3.33
%5.
35%
5.24
%2.
68%
3.39
%1.
55%
1.79
%2.
36%
3.48
%3.
06%
4.27
%5.
10%
-19.
86%
0.19
%5.
07%
0.10
%2.
02%
0.07
%0.
68%
0.01
%C
orp.
Int'l
Infla
-C
orp.
U.S
.U
.S.
Int'l
Infla
-In
fla-
Gov
'tG
ov't
Cas
hU
.S.
Gov
'tIn
fla-
Hed
geIn
fla-
Cor
p.C
ash
Cor
p.B
onds
Equi
tytio
nB
onds
Equi
tyEq
uity
Equi
tytio
ntio
nB
onds
Bon
dsEq
uity
Bon
dstio
nFu
nds
tion
Bon
dsB
onds
3.28
%1.
77%
1.60
%-1
.94%
-6.9
8%-1
0.64
%-1
4.95
%1.
88%
3.25
%2.
65%
3.46
%5.
03%
-36.
72%
-2.1
9%1.
50%
-3.5
5%1.
70%
-2.0
1%0.
04%
-0.7
7%G
ov't
Infla
-H
edge
Gov
'tIn
t'lIn
t'lU
.S.
Cas
hC
ash
Cor
p.In
fla-
Infla
-In
t'lR
eal
Cas
hIn
t'lC
ash
Gov
'tIn
t'lIn
t'lB
onds
tion
Fund
sB
onds
Equi
tyEq
uity
Equi
tyB
onds
tion
tion
Equi
tyEs
tate
Equi
tyB
onds
Equi
tyEq
uity
Wor
st2.
77%
1.70
%-1
.61%
-2.2
5%-1
5.31
%-1
9.74
%-2
1.30
%1.
16%
1.33
%1.
95%
2.55
%4.
06%
-45.
52%
-16.
86%
0.13
%-1
3.71
%0.
11%
-2.6
0%-3
.87%
-5.6
7%W
orst
Ann
ualiz
ed R
etur
ns 1
996
- 201
5In
fl.C
ash
Int'l
.H
edge
Gov
't.C
orp.
US
Eq.
R.E
.R
etur
n2.
20%
2.28
%4.
79%
4.80
%5.
02%
5.82
%8.
44%
9.90
%R
etur
nR
isk
1.24
%0.
60%
17.1
4%7.
96%
4.08
%5.
10%
15.4
1%8.
43%
Ris
k
- H
edge
Fun
ds a
re re
pres
ente
d by
the
HFRI
FO
F Co
nser
vativ
e In
dex
- U.S
. Equ
ity is
repr
esen
ted
by th
e S&
P 15
00- I
nfla
tion
is re
pres
ente
d by
the
U.S.
Con
sum
er P
rice
Inde
x- R
eal E
stat
e is
repr
esen
ted
by th
e NP
I- I
nter
natio
nal E
quity
is re
pres
ente
d by
the
MSC
I EAF
E In
dex
- Cor
pora
te B
onds
are
repr
esen
ted
by th
e Ba
rcla
ys C
apita
l - C
redi
t Ind
ex 2
000
Forw
ard
- Int
'l Equ
ity is
repr
esen
ted
MSC
I - A
C W
orld
EX-
USA
Inde
x- G
over
nmen
t Bon
ds a
re re
pres
ente
d by
the
Barc
lays
Cap
ital U
.S. G
over
nmen
t- C
ash
is re
pres
ente
d by
30-
day
T-Bi
lls


State of Michigan Retirement Systems
ABSOLUTE AND REAL RETURN REVIEW
Investment Advisory Committee Meeting
December 15, 2016
James L. Elkins
Senior Investment Manager Short-Term, Absolute and Real Return Division

EXECUTIVE SUMMARY
Absolute Return
Performance
*One month lag on the index
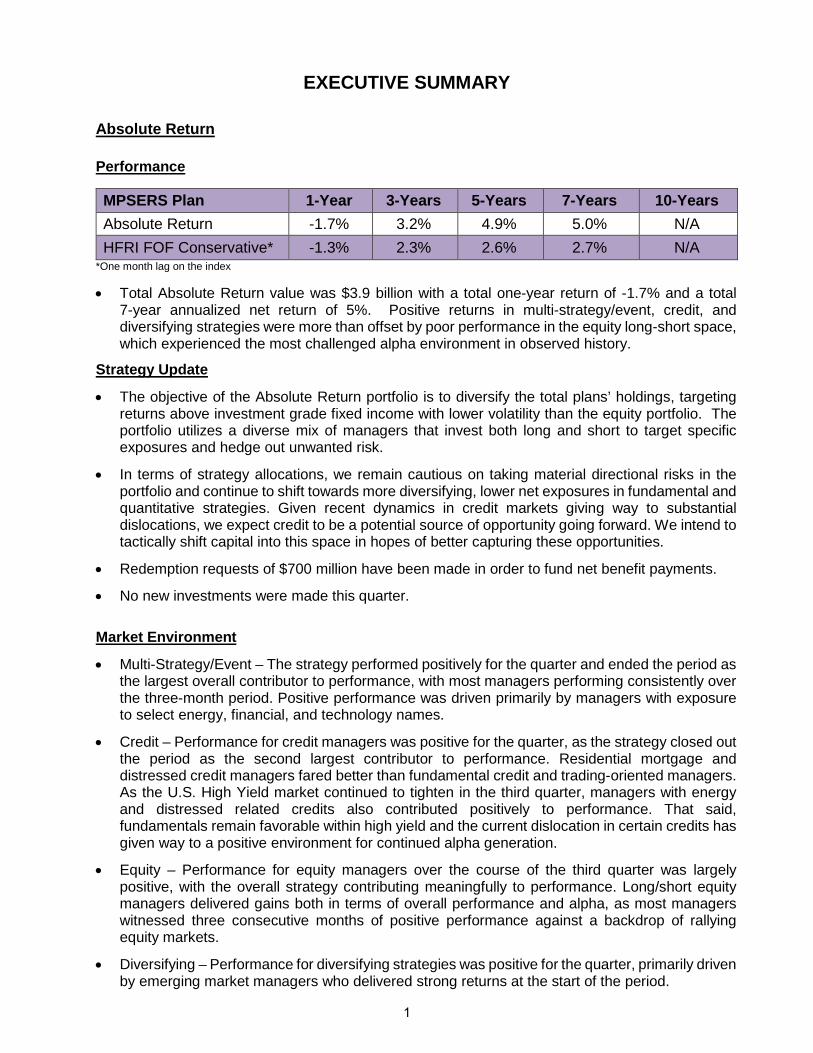
• Total Absolute Return value was $3.9 billion with a total one-year return of -1.7% and a total 7-year annualized net return of 5%. Positive returns in multi-strategy/event, credit, and diversifying strategies were more than offset by poor performance in the equity long-short space, which experienced the most challenged alpha environment in observed history.
Strategy Update
• The objective of the Absolute Return portfolio is to diversify the total plans’ holdings, targeting returns above investment grade fixed income with lower volatility than the equity portfolio. The portfolio utilizes a diverse mix of managers that invest both long and short to target specific exposures and hedge out unwanted risk.
• In terms of strategy allocations, we remain cautious on taking material directional risks in the portfolio and continue to shift towards more diversifying, lower net exposures in fundamental and quantitative strategies. Given recent dynamics in credit markets giving way to substantial dislocations, we expect credit to be a potential source of opportunity going forward. We intend to tactically shift capital into this space in hopes of better capturing these opportunities.
• Redemption requests of $700 million have been made in order to fund net benefit payments.
• No new investments were made this quarter.
Market Environment
• Multi-Strategy/Event – The strategy performed positively for the quarter and ended the period as the largest overall contributor to performance, with most managers performing consistently over the three-month period. Positive performance was driven primarily by managers with exposure to select energy, financial, and technology names.
• Credit – Performance for credit managers was positive for the quarter, as the strategy closed out the period as the second largest contributor to performance. Residential mortgage and distressed credit managers fared better than fundamental credit and trading-oriented managers. As the U.S. High Yield market continued to tighten in the third quarter, managers with energy and distressed related credits also contributed positively to performance. That said, fundamentals remain favorable within high yield and the current dislocation in certain credits has given way to a positive environment for continued alpha generation.
• Equity – Performance for equity managers over the course of the third quarter was largely positive, with the overall strategy contributing meaningfully to performance. Long/short equity managers delivered gains both in terms of overall performance and alpha, as most managers witnessed three consecutive months of positive performance against a backdrop of rallying equity markets.
• Diversifying – Performance for diversifying strategies was positive for the quarter, primarily driven by emerging market managers who delivered strong returns at the start of the period.
MPSERS Plan 1-Year 3-Years 5-Years 7-Years 10-Years Absolute Return -1.7% 3.2% 4.9% 5.0% N/A HFRI FOF Conservative* -1.3% 2.3% 2.6% 2.7% N/A
1

Real Return and Opportunistic
Performance
• Total Real Return and Opportunistic value was $5.3 billion with a total one-year return of 5.4%.
The portfolio held up in a weak performance period for energy and other commodity exposures. Strategy Update • The objective of the Real Return & Opportunistic portfolio is to provide an inflation hedge or to
gain exposure to attractive opportunities that may not fit in another plan portfolio.
• In terms of strategy allocations, we continue to favor private credit opportunities over equity in most situations due to the expected return for the level of risk.
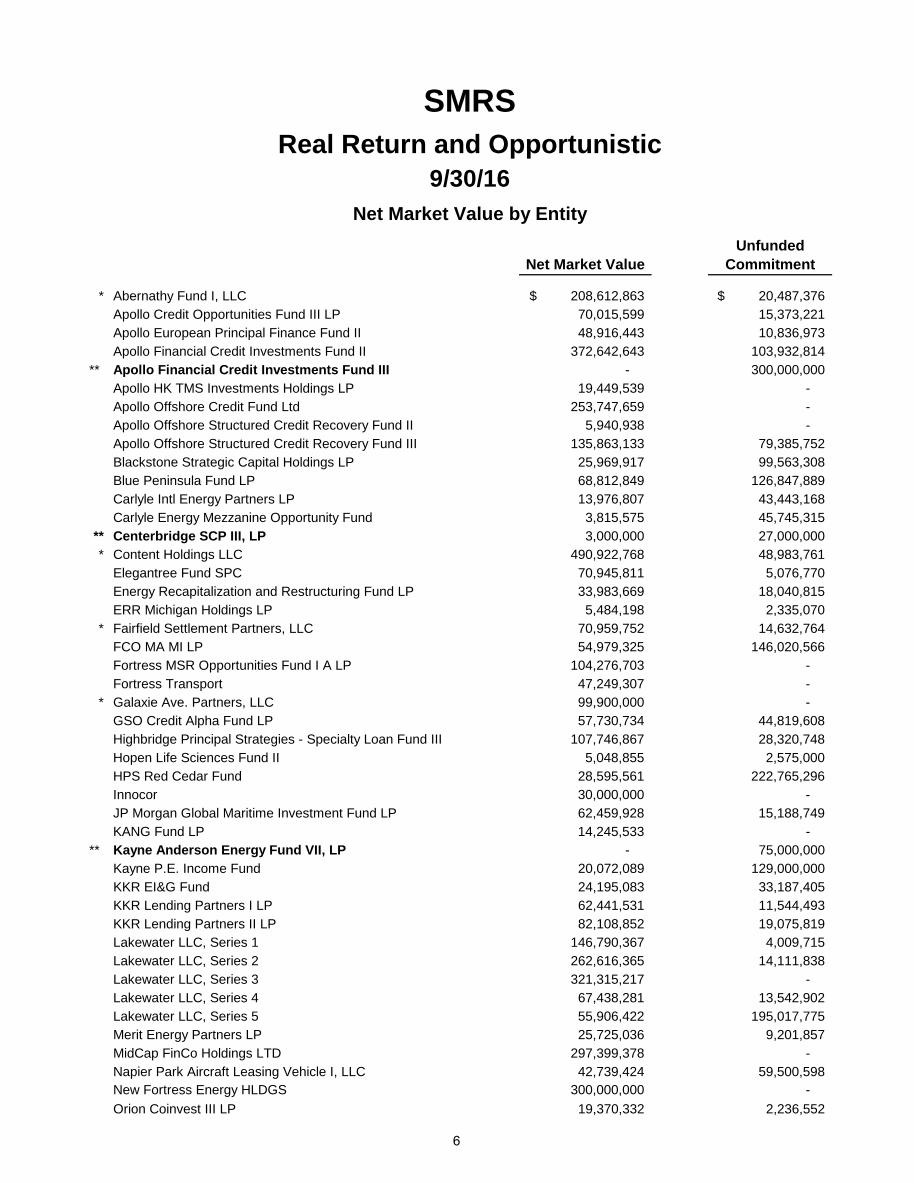
• The Real Return & Opportunistic portfolio has approximately $2.9 billion of unfunded commitments. New commitments closed during the quarter include:
- $300 million to Apollo Financial Credit Investments Fund III, a fund focused on life settlements. - $100 million to Redding Ridge Holdings LP, a CLO risk retention vehicle. Managed by Apollo. - $100 million to Sprott Private Resource Lending Fund (US) LP, a fund focused on providing
secured lending to mining companies. - $75 million to Kayne Anderson Energy Fund VII LP, a fund focused on energy opportunities.
- $35 million to RPEP Energy Opp Inst Partner, a fund focused on small companies across the energy value chain. Managed by Ridgewood Energy.
- $30 million to Centerbridge SCP III LP, a fund focused on non-control distressed investments.
- $25 million to Sprott PRL (M) LP, a co-investment vehicle focused on capital solutions to mining companies.
Market Environment
• Senior Secured Credit – The spread on the S&P Leveraged Loan Index was L+480, 143 basis points (bps) tighter than at the start of 2015. Similarly, the yield on the Merrill Lynch High Yield Master II Index was 6.3%, 251 bps tighter than at the beginning of the year. For the second consecutive month, there were no new defaults among S&P/LSTA issuers, which caused the trailing twelve-month default rate by principal amount to fall to 2.0%.
• Direct Lending – Earlier in the year, volatility within the financial markets created uncertainty and forced firms who could typically access the public debt markets to seek out private solutions. As capital markets slowed towards a halt, it pushed private loan issuance even higher in the most robust quarter of the year. Direct lending funds have been able to target and lend to much larger companies and improve credit quality while maintaining their returns from the spreads on loans.
• Energy Funds – For the quarter, spot WTI crude prices were down 0.2% with long-dated contracts relatively unchanged for the quarter as well. Spot natural gas prices were down 2.1% for the quarter, while long-dated contracts were down 4-7% for the quarter. STARR was able to invest additional capital in the space during the quarter at attractive levels and on very advantageous terms. With only approximately 34% of our energy commitments presently invested, a substantial amount of uncalled capital remains ready to capitalize on the opportunities presented by lower energy prices should they persist.
MPSERS Plan 1-Year 3-Years 5-Years 7-Years 10-Years Real Return and Opport. 5.4% 12.1% 9.8% N/A N/A Custom Benchmark 7.3% 7.0% 7.2% N/A N/A
2

SMRSAbsolute, Real Return and Opportunistic
9/30/16
Market Value in Millions
9/30/16 6/30/16
Absolute Return $3,967 42.3% $4,181 44.4%Real Return 5,320 56.7% 5,139 54.6%Cash Equivalents 88 1.0% 91 1.0%
Total Investments $9,375 100.0% $9,411 100.0%
Absolute Return42.3%
Real Return56.7%
Cash Equivalents1.0%
3

Apollo Offshore Credit Strategies Fund Ltd.
Net Market Value
$ 151,647,330
Drawbridge Opportunities Fund (Fortress) 199,315,863
* EnTrust White Pine Partners L.P. 179,987,503
JM IV, LP (Jana) 46,831,458
MP Securitized Credit Master Fund, L.P. (Matlin Patterson) 66,342,628
Spartan Partner LP (PSAM) 170,254
* Tahquamenon Fund L.P. (BAAM) 3,317,755,069
Visium Balanced Fund LP
Total Market Value
* Fund of Funds
4,405,099
$ 3,966,455,203
SMRSAbsolute Return
9/30/16
Net Market Values by Entity
4

Strategy Breakdown
Underlying Funds: 90 Median Position Size: 0.3%
Strategies: 4 Average Position Size: 1.1%
Relationships: 8 Largest Position Size: 11.7%
SMRSAbsolute Return
9/30/16
Investments By Strategy
Equity32.6%
Credit24.6%
Multi-Strategy /
Event33.2%
Diversifying9.6%
5
Net Market ValueUnfunded
Commitment
* Abernathy Fund I, LLC 208,612,863$ 20,487,376$ Apollo Credit Opportunities Fund III LP 70,015,599 15,373,221 Apollo European Principal Finance Fund II 48,916,443 10,836,973 Apollo Financial Credit Investments Fund II 372,642,643 103,932,814
** Apollo Financial Credit Investments Fund III - 300,000,000 Apollo HK TMS Investments Holdings LP 19,449,539 - Apollo Offshore Credit Fund Ltd 253,747,659 - Apollo Offshore Structured Credit Recovery Fund II 5,940,938 - Apollo Offshore Structured Credit Recovery Fund III 135,863,133 79,385,752 Blackstone Strategic Capital Holdings LP 25,969,917 99,563,308 Blue Peninsula Fund LP 68,812,849 126,847,889 Carlyle Intl Energy Partners LP 13,976,807 43,443,168 Carlyle Energy Mezzanine Opportunity Fund 3,815,575 45,745,315
** Centerbridge SCP III, LP 3,000,000 27,000,000 * Content Holdings LLC 490,922,768 48,983,761
Elegantree Fund SPC 70,945,811 5,076,770 Energy Recapitalization and Restructuring Fund LP 33,983,669 18,040,815 ERR Michigan Holdings LP 5,484,198 2,335,070
* Fairfield Settlement Partners, LLC 70,959,752 14,632,764 FCO MA MI LP 54,979,325 146,020,566 Fortress MSR Opportunities Fund I A LP 104,276,703 - Fortress Transport 47,249,307 -
* Galaxie Ave. Partners, LLC 99,900,000 - GSO Credit Alpha Fund LP 57,730,734 44,819,608 Highbridge Principal Strategies - Specialty Loan Fund III 107,746,867 28,320,748 Hopen Life Sciences Fund II 5,048,855 2,575,000 HPS Red Cedar Fund 28,595,561 222,765,296 Innocor 30,000,000 - JP Morgan Global Maritime Investment Fund LP 62,459,928 15,188,749 KANG Fund LP 14,245,533 -
** Kayne Anderson Energy Fund VII, LP - 75,000,000 Kayne P.E. Income Fund 20,072,089 129,000,000 KKR EI&G Fund 24,195,083 33,187,405 KKR Lending Partners I LP 62,441,531 11,544,493 KKR Lending Partners II LP 82,108,852 19,075,819 Lakewater LLC, Series 1 146,790,367 4,009,715 Lakewater LLC, Series 2 262,616,365 14,111,838 Lakewater LLC, Series 3 321,315,217 - Lakewater LLC, Series 4 67,438,281 13,542,902 Lakewater LLC, Series 5 55,906,422 195,017,775 Merit Energy Partners LP 25,725,036 9,201,857 MidCap FinCo Holdings LTD 297,399,378 - Napier Park Aircraft Leasing Vehicle I, LLC 42,739,424 59,500,598 New Fortress Energy HLDGS 300,000,000 - Orion Coinvest III LP 19,370,332 2,236,552
SMRSReal Return and Opportunistic
9/30/16Net Market Value by Entity
6

Net Market ValueUnfunded
Commitment
Orion Mine Finance Fund 1A LP 48,246,174 4,310,238 Orion Mine Finance Fund I LP 106,418,746 9,884,524 Orion Mine Finance II LP 19,710,709 30,185,740
** Redding Ridge Holdings, LP - 100,000,000 Renaissance Venture Cap Fund II LP 9,107,059 15,500,000 REOG Fund II Coinvest LP 17,169,316 11,924,817 Ridgewood Energy Oil & Gas II 82,461,975 38,608,297 Ridgewood Energy Oil & Gas III 7,256,964 214,978,864
** RPEP Energy Opp Inst Partner - 34,174,716 RPEP SMRS Holdings, LLC 66,107,625 1,876,850 SJC Direct Lending Fund I, LP 44,191,625 15,867,189 SJC Direct Lending Fund II, LP 247,756,445 38,261,315 SJC Direct Lending Fund III, LP 57,756,115 192,702,051 Square Inc. 105,572,695 -
* Social Network Holdings, LLC 161,040,215 25,226,043 Specialty Equity Strategy LP 1,752,205 18,387,384
** Sprott PRL (M), LP 6,037 24,516,254 ** Sprott Private Resource Lending Fund (US), LP - 100,000,000
Terra Co-Investment LLC 25,399,994 14,000,000 Twitter Inc. 19,902,914 - Varo Coinvestment LP 13,393,479 929,066 Warwick Energy Partners III 27,784,888 22,774,349 Warwick (SMRS) Co-Invest, L.P. 12,905,919 12,089,081 Income Accruals 2,663,015
Total Market Value 5,320,015,468$ 2,913,000,693$
* Fund of Funds** New Commitment
7

Investment Strategy
Real Assets $2,406,369,971
Direct Lending/Credit $1,539,273,763
Opportunistic Credit $767,641,352
Multi-Strategy $277,425,712
Opportunistic Equity $326,641,656
SMRSReal Return and Opportunistic
9/30/16
Investments By Strategy
Real Assets45.4%
Direct Lending/Credit
28.9%
Opportunistic Credit14.4%
Multi-Strategy5.2%
Opportunistic Equity6.1%
8

State of Michigan Retirement Systems
DOMESTIC EQUITY REVIEW Investment Advisory Committee Meeting
December 15, 2016
Jack A. Behar, CFA Senior Investment Manager
Stock Analysis Division

EXECUTIVE SUMMARY
Performance
Total Domestic Equity, Gross 1-Year 3-Years 5-Years 7-Years 10-Years Annualized Returns 12.2% 10.3% 16.1% 12.7% 7.2% S&P 1500 15.5% 10.9% 16.4% 13.3% 7.4% Peer Median Return 13.5% 9.2% 15.5% 12.7% 7.1% Rank vs. Peers 70 37 34 51 47
Total Domestic Equity, Net 1-Year 3-Years 5-Years 7-Years Annualized Returns 12.1% 10.2% 16.0% 12.5% S&P 1500 15.5% 10.9% 16.4% 13.3% Lipper Multi Core 11.2% 8.1% 14.7% 11.6% Rank vs. Lipper Multi Core 45 25 29 34
Total Active Equity, Net 1-Year 3-Years 5-Years 7-Years Annualized Returns 9.3% 9.4% 15.5% 11.9% S&P 1500 15.5% 10.9% 16.4% 13.3% Lipper Multi Core 11.2% 8.1% 14.7% 11.6% Rank vs. Lipper Multi Core 74 33 41 47
• In a difficult stretch for active management, Total Domestic Equity (active & passive management combined) trailed the S&P 1500 in all time periods. o Gross of fees, Total Domestic Equity’s performance was in the top third of its peer
group over three and five years, at the median over seven and ten years and below the median over the past year.
o Net of fees, Total Domestic Equity’s performance versus peers was significantly better than described above, because SMRS pays roughly 6 basis points (bps) per year in domestic equity management fees versus its peer group at 30 bps.
• Total active equity underperformed its benchmark in all time periods. Such performance,
while not satisfactory, was in the top half of its peer group over three, five, and seven years.
o Patience is required in order to have a successful active manager program. Research
has shown that most managers that ultimately outperform go through significant periods of underperformance along the way. • Managers that are successful over the long term have five year performance
numbers below the benchmark approximately 40% of the time.
1

• Two-thirds of successful managers experience three consecutive years of underperformance along the way to long-term outperformance.
o Growth stocks have outperformed value stocks by a cumulative 60% over the past ten
years, which has been a headwind to performance.
• Total active equity remains significantly overweighted to value stocks, which will provide the portfolio with a substantial tailwind if and when this trend reverses.
Strategy Update • The division is moving towards allocating funds to managers with lower turnover as a
means by which to further reduce costs at the division level. o Research has shown that, while reducing fees considerably improves the probability
of active manager outperformance, turnover costs and cash drag also hinder the results of active managers.
• The domestic equity division pays only 12 bps per year in fees across the division, or less than that of the retail Vanguard S&P 500 Index Fund.
• The division also typically equitizes excess manager cash, negating the impact of such
low returning assets on division performance.
• By reducing portfolio turnover costs, minimizing fees paid and negating the impact of cash drag, the division aims to leverage the strengths of passive management.
o This, combined with a value-oriented investment approach, which has also been
demonstrated to outperform over the long run, gives the division the opportunity to beat the benchmark with a significantly higher probability of success than is the case with most active managers.
• Total Active Equity’s portfolio continues to trade at roughly a 20% discount to the
S&P 1500 on the basis of normalized earnings, with similar volatility and rates of growth going forward.
o Eight of the division’s top ten holdings trade at forward PE ratios of 14X or less. All
are high quality companies with significant competitive advantages.
o The division remains overweight to both the financial sector and to defensive stocks.
o We expect Total Active Equity’s PE ratio to at least partially converge with that of the S&P 1500 over the next five years, driving annualized outperformance.
o If PE ratios do not converge, we nonetheless expect long term outperformance on the
basis of a higher net dividend yield (dividends + buybacks) than the benchmark alongside similar or faster rates of earnings reinvestment.
2

Market Environment and Outlook
• At ~18x normalized earnings, equity markets are on the rich side relative to history, but still attractively priced for an environment where bond yields stay abnormally low.
• Assuming a 2.0% normalized dividend yield, expected share count reductions of 1.7% via share buybacks and 4.5% long-term expected earnings growth, the S&P 1500 is poised to return approximately 8.2% over the long term. o This compares to the 30-year U.S. Treasury at 2.3%, and a historical average return
for the S&P 500 of 9.5% from 1928 - 2015.
3

SMRSDomestic Equities
9/30/16
Markets
Internal
Indexed Portfolios $7,439
Total Indexed $7,439 47.0%
Internal
Active Portfolios $4,850
Total Active $4,850 31.2%
Active
Los Angeles Capital $1,115 Fisher Investments 633 Seizert Capital Partners 501 Clarkston Capital Partners 501 ARK Investments 251 Attucks Asset Management 203 Bivium Capital 184 Munder Capital Management 83 Northpointe Capital 82
Total Active $3,553 22.4%
TOTAL $15,842 100.0%
Amount % of TotalTotal
(in millions)
4

Combined Active Equity Portfolio, Return Expectations
9/30/16
Return Assumption Estimates Expected
Return **** Normal Dividend
Yield ** LT Growth Rate ***
SAD Combined Active Equity 9.6% 5.1% 4.5% S&P 1500 All-Cap 8.2% 3.7% 4.5% S&P 500 Large-Cap 8.2% 3.9% 4.3% S&P 500 Historical Average 9.5% S&P 400 Mid-Cap 8.2% 2.2% 6.0% S&P 600 Small-Cap 7.8% 0.8% 7.0% US 30-Year Treasury 2.3% 2.3% 0.0%
Normal Dividend Yield Decomposition
Normal Price/Earnings
Normal Earnings
Yield*
Normal
Payout Ratio
Normal Dividend Yield**
SAD Combined Active Equity 14.0 7.2% 71% 5.1% S&P 1500 All-Cap 18.5 5.4% 68% 3.7% S&P 500 Large-Cap 18.2 5.5% 71% 3.9% S&P 400 Mid-Cap 19.8 5.0% 44% 2.2% S&P 600 Small-Cap 21.4 4.7% 18% 0.8%
Portfolio and Benchmark Risk Estimates Expected
Return **** Standard Deviation
Expected Return/Volatility
SAD Combined Active Equity 9.6% 13.8% 0.7 S&P 1500 All-Cap 8.2% 14.1% 0.6 S&P 500 Large-Cap 8.2% 14.0% 0.6 S&P 400 Mid-Cap 8.2% 16.0% 0.5 S&P 600 Small-Cap 7.8% 17.4% 0.5 US 30-Year Treasury 2.3% 26.6% 0.1 *Earnings Yield = Earnings/Price **Includes Share Buybacks ***LT Growth Rate Calculation: Return on Equity * (1-Dividend Payout Ratio) ****Expected Return Formula: Dividend Yield + LT Growth Rate
5

SMRSDomestic Equity Exposure By Market Cap
9/30/16
Market Value in Millions
Assets Percent S&P 1500
Large-Cap (>$10B) $13,561 85.6% 84.4% Mid-Cap (>$4 <$10B) 1,346 8.5% 8.2% Small-Cap (<$4B) 935 5.9% 7.4%
Total Domestic Equity $15,842 100.0% 100.0%
9/30/16
Large-Cap85.6%
Mid-Cap8.5%
Small-Cap5.9%
6

SMRS Domestic Equities Composite
9/30/16
Date: 9/30/16 6/30/16 3/31/16 12/31/15 Assets ($million): $16,059 $16,059 $16,294 $16,724 Number of Securities: 1,316 1,329 1,305 1,258 Active Share: 34% 33% 34% 34% Benchmark: S&P 1500 Description: The Domestic Equities Composite combines both the SMRS’ Actively Managed
Composite and its index funds. Characteristics: SMRS S&P 1500 Weighted Average Capitalization ($billion): $148.0 $131.2 Trailing 12-month P/E: 17.5x 19.8x Forecast P/E: 16.1x 18.0x Price/Book: 2.4x 2.7x Beta: 0.99 1.00 Tracking Error: 1.2% 0 Dividend Yield: 2.1% 2.0% 3-5 Year EPS Growth Estimate: 9.9% 10.5% Return on Equity: 13.7% 13.6%
TOP TEN HOLDINGS – Domestic Equities 9/30/16
Portfolio Weight
Market
Capitalization ($B)
FY1 P/E
YTD Total
Return
Market Value
Verizon Communications, Inc. 4.7% $211.9 13.3 16.2% $739,310,604 Berkshire Hathaway, Inc. Class B 4.4% $355.9 19.9 9.4% 689,439,012 Apple, Inc. 3.6% $603.3 12.7 9.2% 575,525,228 U.S. Bancorp 2.4% $73.4 13.2 2.5% 378,964,803 JPMorgan Chase & Co. 2.2% $240.5 11.8 3.1% 351,012,138 Wells Fargo & Co. 2.0% $223.4 11.0 -16.6% 314,179,707 Microsoft Corp. 1.7% $448.4 19.9 6.0% 273,341,318 Gilead Sciences, Inc. 1.7% $104.6 6.7 -20.5% 270,980,936 Facebook, Inc. Class A 1.5% $298.0 32.7 22.6% 238,298,723 CVS Health Corp. 1.5% $94.9 15.2 -7.8% 237,873,118 TOTAL 25.7% $4,068,925,587 7

SMRSDomestic Equity By Sector
9/30/16
Market Value in Millions9/30/16
Assets Percent Benchmark Difference
Financials $3,579 22.6% 13.1% 9.5%Information Technology 3,291 20.8% 20.8% 0.0%Health Care 2,100 13.3% 14.1% -0.8%Consumer Discretionary 1,648 10.4% 12.3% -1.9%Industrials 1,402 8.8% 10.6% -1.8%Consumer Staples 1,286 8.1% 9.3% -1.2%Telecom Services 898 5.7% 2.4% 3.3%Energy 653 4.1% 6.9% -2.8%Real Estate 355 2.2% 3.8% -1.6%Utilities 334 2.1% 3.5% -1.4%Materials 296 1.9% 3.2% -1.3%
Total $15,842 100.0% 100.0%
Benchmark: S&P 1500
Financials22.6%
Information Technology
20.8%
Health Care13.3%
Consumer Discretionary10.4%
Industrials8.8%
Consumer Staples8.1%
Telecom Services5.7%
Energy4.1%
Real Estate2.2%
Utilities2.1%Materials
1.9%
8

SMRS Actively Managed Composite
9/30/16
Date: 9/30/16 6/30/16 3/31/16 12/31/15 Assets ($million): $8,403 $8,625 $9,018 $9,517 Numbers of Securities: 1,015 1,023 969 922 Active Share: 63% 62% 63% 59% Benchmark: S&P 1500 Description: The Actively Managed Composite is designed to add consistent alpha by investing in
managers with value-added, but diverse strategies. While the expectation is that most will outperform over time, the composite is designed such that they do so during differing parts of the business cycle.
Characteristics: SMRS S&P 1500 Weighted Average Capitalization ($billion): $159.4 $131.2 Trailing 12-month P/E: 16.1 x 19.8x Forecast P/E: 15.0x 18.0x Price/Book: 2.2x 2.7x Beta: 0.99 1.00 Tracking Error: 2.3% 0 Dividend Yield: 2.2% 2.0% 3-5 Year EPS Growth Estimate: 9.5% 10.5% Return on Equity: 13.7% 13.6%
TOP TEN HOLDINGS – Actively Managed
9/30/16
Portfolio Weight
Market
Capitalization ($B)
FY1 P/E
YTD Total
Return
Market Value
Verizon Communications, Inc. 7.9% $211.9 13.3 16.2% $665,360,166 Berkshire Hathaway, Inc. Class B 7.4% $355.9 19.9 9.4% 618,855,882 Apple, Inc. 4.3% $603.3 12.7 9.2% 362,931,198 U.S. Bancorp 4.2% $73.4 13.2 2.5% 354,884,727 JPMorgan Chase & Co. 3.2% $240.5 11.8 3.1% 267,073,778 Wells Fargo & Co. 2.9% $223.4 11.0 -16.6% 244,003,257 Gilead Sciences, Inc. 2.8% $104.6 6.7 -20.5% 234,454,227 Aflac, Inc. 2.5% $29.3 10.5 22.3% 209,749,936 CVS Health Corp. 2.4% $94.9 15.2 -7.8% 204,759,939 Validus Holdings, Ltd. 2.1% $4.0 12.3 10.0% 175,513,020 TOTAL 39.7% $3,337,667,130
9

SMRSActive Equity By Sector
9/30/16
Market Value in Millions9/30/16
Assets Percent Benchmark Difference
Financials $2,368 28.2% 13.1% 15.1%Information Technology 1,790 21.3% 20.8% 0.5%Health Care 1,089 13.0% 14.1% -1.1%Consumer Discretionary 771 9.2% 12.3% -3.1%Telecom Services 722 8.6% 2.4% 6.2%Industrials 663 7.9% 10.6% -2.7%Consumer Staples 613 7.3% 9.3% -2.0%Energy 156 1.9% 6.9% -5.0%Utilities 86 1.0% 3.5% -2.5%Real Estate 83 0.9% 3.8% -2.9%Materials 62 0.7% 3.2% -2.5%
Total $8,403 100.0% 100.0%
Benchmark: S&P 1500
Financials28.2%
Information Technology
21.3%
Health Care13.0%
Consumer Discretionary9.2%
Telecom Services8.6%
Industrials7.9%
Consumer Staples7.3%
Energy1.9%
Utilities1.0%Real Estate
0.9%Materials0.7%
10

InceptionFund Name Market Value 3-Years 5-Years 7-Years Date
SMRS Large-Cap Core $2,066,905,897 1.7% 8.7% 16.0% 11.9% 6.3% 8/31/07S&P 500 15.4% 11.2% 16.4% 13.2% 6.7%Style & Risk Adjusted Benchmark 10.3% 7.6% 14.1% 11.9% 5.8%Lipper Large-Cap Core 12.9% 9.2% 14.9% 11.8% 6.0%Excess Return -13.7% -2.5% -0.3% -1.3% -0.5%Alpha -8.5% 1.1% 2.0% 0.0% 0.5%Pct Rank vs Lipper Large-Cap Core 99 66 26 49 40
SMRS Large-Cap Growth 1,457,892,421 7.1% 11.3% 15.7% 12.9% 8.4% 5/31/05S&P 500 Growth Index 14.7% 12.8% 16.8% 14.3% 8.9%Style & Risk Adjusted Benchmark 16.3% 12.7% 17.3% 14.5% 9.0%Lipper Large Growth 10.9% 10.3% 15.6% 12.7% 8.3%Excess Return -7.6% -1.5% -1.1% -1.4% -0.4%Alpha -9.2% -1.5% -1.7% -1.6% -0.5%Pct Rank vs Lipper Large-Cap Growth 88 32 47 50 43
SMRS All-Cap Garp 954,678,266 8.6% 9.9% 16.7% -- 12.9% 4/30/11S&P 1500 Super Composite 15.5% 10.9% 16.4% -- 11.6%Style & Risk Adjusted Benchmark 12.6% 10.3% 15.7% -- 11.2%Lipper Multi Core 11.2% 8.1% 14.7% -- 9.5%Excess Return -6.9% -1.1% 0.3% -- 1.3%Alpha -4.0% -0.5% 1.0% -- 1.7%Pct. Rank vs. Lipper Multi Core 80 28 12 -- 3
LA Capital Deep Value 657,415,786 13.7% -- -- -- 2.6% 4/1/15S&P 1500 Value 16.3% -- -- -- 4.3%Style & Risk Adjusted Benchmark 16.2% -- -- -- 4.1%Lipper Multi-Cap Value 12.8% -- -- -- 1.2%Excess Return -2.6% -- -- -- -1.7%Alpha -2.5% -- -- -- -1.5%Pct. Rank vs. Lipper Multi-Cap Value 40 -- -- -- 37
Fisher All-Cap 632,989,708 14.2% 11.8% 16.4% 12.4% 9.8% 10/31/04S&P 1500/S&P 600 Value Blend 15.5% 10.9% 17.4% 13.5% 8.6%Style & Risk Adjusted Benchmark 16.3% 12.0% 18.2% 14.7% 9.4%Lipper Multi Core 11.2% 8.1% 14.7% 11.6% 7.3%Excess Return -1.3% 0.9% -1.0% -1.0% 1.2%Alpha -2.1% -0.2% -1.8% -2.3% 0.4%Pct. Rank vs. Lipper Multi Core 23 5 17 36 3
Seizert Capital Partners 501,475,126 15.9% 7.1% 16.1% -- 14.0% 11/30/09S&P 1500/S&P 400 Value Blend 15.5% 10.9% 16.4% -- 15.9%Style & Risk Adjusted Benchmark 15.7% 9.5% 17.0% -- 13.3%Lipper Multi Core 11.2% 8.1% 14.7% -- 12.2%Excess Return 0.4% -3.9% -0.3% -- -2.0%Alpha 0.3% -2.4% -0.9% -- 0.7%Pct. Rank vs. Lipper Multi Core 9 73 26 -- 15
LA Capital All-Cap Growth 457,336,175 16.0% 14.0% 19.2% 15.3% 11.3% 5/31/05S&P 1500 Growth 14.6% 12.4% 16.8% 14.4% 9.0%Style & Risk Adjusted Benchmark 11.3% 8.8% 14.2% 13.0% 9.3%Lipper Multi-Cap Growth 8.9% 8.1% 14.5% 12.2% 8.3%Excess Return 1.4% 1.6% 2.4% 0.9% 2.3%Alpha 4.8% 5.2% 4.9% 2.3% 2.1%Pct. Rank vs. Lipper Multi-Cap Growth 4 1 2 6 4
Manager Performance - Net of Fees9/30/16
1-Year Inception
11

InceptionFund Name Market Value 3-Years 5-Years 7-Years Date1-Year Inception
Clarkston Capital Large-Cap 281,211,565 16.9% -- -- -- 8.4% 4/1/15S&P 500 15.4% -- -- -- 5.5%Style & Risk Adjusted Benchmark 11.5% -- -- -- 3.4%Lipper Large-Cap Core 12.9% -- -- -- 3.4%Excess Return 1.4% -- -- -- 3.0%Alpha 5.4% -- -- -- 5.1%Pct. Rank vs. Lipper Large-Cap Core 10 -- -- -- 2
Ark Investments 251,073,928 -- -- -- -- 25.5% 3/1/16S&P 1500 Growth -- -- -- -- 13.3%Style & Risk Adjusted Benchmark -- -- -- -- 13.9%Lipper All-Cap Growth -- -- -- -- 12.7%Excess Return -- -- -- -- 12.2%Alpha -- -- -- -- 11.6%Pct. Rank vs. Lipper All-Cap Growth -- -- -- -- 1
Clarkston Capital Small-Cap 220,520,692 17.0% -- -- -- 12.5% 1/1/14S&P 600 18.1% -- -- -- 6.2%Style & Risk Adjusted Benchmark 14.0% -- -- -- 5.8%Lipper Small-Cap Core 13.0% -- -- -- 3.1%Excess Return -1.1% -- -- -- 6.3%Alpha 3.0% -- -- -- 6.8%Pct. Rank vs. Lipper Small-Cap Core 15 -- -- -- 1
Attucks Asset Management 202,617,273 11.8% 7.1% 13.9% 11.5% 5.4% 11/30/07S&P 1500 Super Composite 15.5% 10.9% 16.4% 13.3% 6.3%Style & Risk Adjusted Benchmark 16.4% 9.9% 15.9% 12.9% 7.0%Lipper Multi Core 11.2% 8.1% 14.7% 11.6% 5.1%Excess Return -3.7% -3.8% -2.5% -1.8% -1.0%Alpha -4.6% -2.8% -1.9% -1.4% -1.6%Pct. Rank vs. Lipper Multi Core 46 72 69 59 48
Bivium Capital Partners 183,928,537 8.1% 6.2% 13.5% 11.5% 4.9% 11/30/07S&P 1500 Value 16.3% 9.3% 16.1% 12.2% 4.7%Style & Risk Adjusted Benchmark 18.6% 9.7% 16.2% 13.3% 6.6%Lipper Multi Cap Value 12.8% 7.1% 14.2% 11.0% 4.8%Excess Return -8.1% -3.1% -2.6% -0.6% 0.2%Alpha -10.5% -3.5% -2.7% -1.8% -1.7%Pct. Rank vs. Lipper Multi-Cap Value 88 76 67 44 43
SMRS Large-Cap Value 111,639,487 14.8% 6.7% 12.7% 10.0% 2.8% 7/31/07S&P 500 Value Index 16.0% 9.3% 15.9% 12.0% 4.3%Style & Risk Adjusted Benchmark 13.8% 8.4% 14.3% 11.1% 4.6%Lipper Large Value 13.3% 8.1% 14.6% 10.9% 4.1%Excess Return -1.1% -2.7% -3.2% -2.0% -1.5%Alpha 1.1% -1.8% -1.6% -1.1% -1.7%Pct. Rank vs. Lipper Large-Cap Value 35 86 86 69 82
Concentrated Equity 97,269,916 -1.8% -6.4% -- -- -1.6% 4/30/09S&P 1500 Super Composite 15.5% 10.9% -- -- 11.6%Style & Risk Adjusted Benchmark 18.8% 12.1% -- -- 14.2%Lipper Multi Core 11.2% 8.1% -- -- 9.6%Excess Return -17.3% -17.3% -- -- -13.2%Alpha -20.6% -18.5% -- -- -15.8%Pct. Rank vs. Lipper Multi Core 99 100 -- -- 100
12

InceptionFund Name Market Value 3-Years 5-Years 7-Years Date1-Year Inception
Munder Concentrated SMID Cap 83,159,023 2.9% 4.8% 12.7% 11.7% 15.4% 4/30/09S&P 400 Mid-Cap Growth 12.8% 9.3% 15.6% 14.4% 18.6%Style & Risk Adjusted Benchmark 19.7% 9.8% 17.0% 13.3% 17.1%Lipper Mid-Cap Growth 8.4% 6.4% 14.0% 12.0% 15.9%Excess Return -9.9% -4.4% -2.9% -2.6% -3.2%Alpha -16.8% -4.9% -4.3% -1.6% -1.7%Pct. Rank vs. Lipper Mid-Cap Core 88 79 72 59 65
NorthPointe All-Cap Core 81,896,718 12.7% 6.8% 15.4% 10.2% 6.9% 10/31/04NorthPointe Blended Benchmark 18.1% 9.0% 17.9% 13.8% 8.8%Style & Risk Adjusted Benchmark 19.7% 8.3% 17.0% 14.5% 9.3%Lipper Multi Core 11.2% 8.1% 14.7% 11.6% 7.3%Excess Return -5.4% -2.2% -2.5% -3.6% -1.9%Alpha -7.0% -1.5% -1.6% -4.3% -2.5%Pct. Rank vs. Lipper Multi Core 38 76 43 79 68
Large-Cap Consistent Growth 34,572,810 8.9% -- -- -- 4.3% 3/1/15S&P 500 15.4% -- -- -- 4.1%Style & Risk Adjusted Benchmark 15.0% -- -- -- 4.0%Lipper Large-Cap Core 12.9% -- -- -- 2.2%Excess Return -6.6% -- -- -- 0.2%Alpha -6.1% -- -- -- 0.3%Pct. Rank vs. Lipper Large-Cap Core 90 -- -- -- 17
Concentrated All-Cap Growth 26,828,982 3.8% -5.8% -- -- -3.6% 5/31/13S&P 600 18.1% 9.0% -- -- 12.5%Style & Risk Adjusted Benchmark 13.5% 8.0% -- -- 9.1%Lipper Small-Cap Core 13.0% 5.9% -- -- 9.1%Excess Return -14.3% -14.8% -- -- -16.1%Alpha -9.7% -13.8% -- -- -12.7%Pct. Rank vs. Lipper Small-Cap Core 98 100 -- -- 100
13

State of Michigan Retirement Systems
FIXED INCOME REVIEW Investment Advisory Committee Meeting
December 15, 2016
Daniel J. Quigley
Senior Investment Manager Long-Term Fixed Income Division


EXECUTIVE SUMMARY
Performance MPSERS Plan 1-Year 3-Years 5-Years 7-Years 10-Years Long-Term Fixed Income 7.3% 5.0% 4.2% 5.1% 5.7% Barclays Aggregate 5.2% 4.0% 3.1% 4.1% 4.8% Peer Median Return 6.6% 4.4% 4.2% 5.3% 5.2% Rank vs. Peers 44 25 53 58 19
• Long-Term Fixed Income Division (LTFID) outperformed both the Barclay’s Aggregate Index and its peer group over recent time periods. The portfolio’s allocation to high yield credit and overweight to investment grade corporate bonds helped to generate this outperformance on a one-year basis. An overweight to structured securities also helped to generate outperformance over longer time periods.
Strategy Update • Allocation to LTFID has increased by $306 million over the past twelve months. This
increase has been invested primarily in high yield strategies.
• The Division continues to look to increase the overall rate of return by allocating to securities with attractive risk-adjusted yields when the market allows. The portfolio currently maintains an out-of-benchmark exposure to high yield credit managers (10.1% of portfolio assets) as well as securitized credit mandates (12.9% of portfolio assets). The portfolio also has a modest allocation to a global bond strategy (2.7% of portfolio assets). These strategies increase the credit risk of the portfolio, however, this risk is offset by relatively lower interest rate risk due to the portfolio’s lower duration.
• The portfolio addresses liquidity concerns by maintaining an allocation to U.S. Treasuries and U.S. TIPS (17.4% of portfolio assets). The portfolio also had a 2.7% allocation to cash at the end of the quarter.
• The Division has recently established an out-of-benchmark position in AAA rated CLO securities (2% of portfolio assets). This is due to the attractive spreads of these securities as well as the potential for LIBOR to increase if the Federal Reserve tightens monetary policy.
• As opportunities present themselves, the Division will look to diversify from Barclay’s Aggregate and Barclay’s Investment Grade Credit focused investment strategies. This is due to the relatively lower yield levels and longer durations of these benchmarks when compared with historical levels. These changes will occur at the margin as the overall characteristics of the fund will continue to meet the diversification requirements of a core bond portfolio.
1

Market Environment and Outlook • The U.S. Treasury yield curve has flattened on a year-over-year (YOY) basis as long-
term interest rates have declined while short-term interest rates have increased. The spread between 2-year and 10-year U.S. Treasuries declined by 58 basis points (bps) during the year. Lower inflation, reduced global growth expectations, and central bank intervention have contained long-term interest rates. The Federal Reserve increased short-term interest rates as they tightened monetary policy during their December 2015 FOMC meeting. The market places approximately a 60% chance of an additional 25 bps rate increase during the December 2016 FOMC meeting.
• Investment grade credit spreads in the U.S. continued to narrow during the third quarter. Spreads ended the quarter at 138 bps. These levels have tightened by 27 bps YTD.
• High-yield spreads have decreased by 180 bps YTD despite weakness in the first six weeks of the year. Spreads ended the quarter at 480 bps after reaching a level of 830 bps in February. Energy spreads continued to drive the market, narrowing by 687 bps YTD to 609 bps.
• BBB CMBS spreads remain elevated despite recent strong performance. Spreads ended the quarter 20 bps tighter at 484 bps. These spreads are 122 bps higher on a YOY basis.
• Inflation expectations remained contained in global developed markets but have increased from lower levels earlier in the year. The breakeven inflation expectation implied by the yield of the 10-year U.S. TIPS ended the quarter at 1.61%, lower than the stated 2% inflation target of the Federal Reserve. These inflation expectations bottomed at 1.2% earlier in the year. This increase in expectations has led to relative outperformance for TIPS over recent quarters.
• Interest rates in the U.S. continued to trade at higher levels than those in many developed markets. This has been driven by the relative strength of the U.S. economy as well as the possibility of tightening of monetary policy by the Federal Reserve. This tightening has been contrasted by quantitative easing and lower interest rates by many of the major global central banks. This relative yield pickup is highlighted by ten-year yields of -0.09% in Japan and -0.12% in Germany.
• The portfolio remains defensively positioned for interest rate increases. The duration remains short of the benchmark as we focus on intermediate securities. We have offset this short position by holding a larger allocation to securitized and corporate debt securities in order to increase the interest income of the portfolio.
Conclusion
• Given the current level and shape of the yield curve, it seems appropriate to focus on intermediate duration securities. This area of the yield curve offers the best risk-adjusted return in this environment. We will continue to target investments that offer attractive yield pick-up for the portfolio as we believe that price appreciation opportunities are limited in a low yield environment. We will also look to maintain our overweight to securitized assets and high yield bonds within the portfolio.
2

SMRSLong-Term Fixed Income
9/30/16
Markets Amount Total % of Total
Core (in millions)
LTFID Internal $5,068 Dodge & Cox 236
Total Core $5,304 65.3%
Credit
Prudential $225
Total Credit $225 2.8%
Securitized Debt
Met West Securitized Ops $411 Principal Global 498 Napier Park ABS Income 134
Total Securitized Debt $1,043 12.9%
High Yield Columbia Management $451 Prudential High Yield 365
Total High Yield $816 10.1%
Tactical
Pyramis $286 Loomis Core Plus 220
Total Tactical $506 6.2%
Global
T. Rowe Global Multi-Sector $218
Total Global $218 2.7%
TOTAL $8,112 100.0%
3

Characteristic Portfolio Benchmark
Average Life 6.7 8.7
Average Life w/Cash Equiv. 6.5 8.7
Duration (Yrs) 4.9 5.5
Duration (Yrs) w/Cash Equiv. 4.8 5.5
Coupon (%) 3.4 3.2
Yield to Maturity (%) 3.1 2.0
Credit Rating A3/BBB Aa2/AA-
Volatility (%) 2.5 2.7
Tracking Error 130 bp 0
Beta (vs S&P 500) 0.04 -0.02
SMRS Fixed Income HoldingsPortfolio Characteristics
Benchmark: Barclays Aggregate
9/30/16
4

SMRSFixed Income By Rating
Total U.S. Long-Term Fixed Income9/30/16
Market Value in Millions
Assets Percent Benchmark Difference
AAA $2,890 35.6% 70.4% -34.8%AA 495 6.1% 5.6% 0.5%A 1,242 15.3% 11.1% 4.2%BBB 1,887 23.3% 11.8% 11.5%Not Rated 283 3.5% 0.9% 2.6%
* Below Investment Grade 1,315 16.2% 0.2% 16.0%
Total Investments $8,112 100.0% 100.0%
* Comprised of approximately 12.0% High Yield Credit and 4.3% High Yield RMBS/ABS
Benchmark: Barclays US Aggregate
9/30/16
AAA35.6%
AA6.1%
A15.3%
BBB23.3%
Below Investment Grade16.2%
Not Rated3.5%
5

SMRSFixed Income By Asset Type
Total U.S. Long-Term Fixed Income9/30/16
Market Value in Millions
Assets Percent Benchmark Difference
Corporate $3,905 48.1% 25.8% 22.3%Securitized 1,943 23.9% 29.9% -6.0%U.S. Treasuries 1,167 14.4% 36.2% -21.8%Government Related 315 3.9% 8.1% -4.2%U.S. TIPS 248 3.1% 0.0% 3.1%Unassigned 313 3.9% 0.0% 3.9%Cash 221 2.7% 0.0% 2.7%
Total Investments $8,112 100.0% 100.0%
Benchmark: Barclays US Aggregate
9/30/16
Corporate48.1%
Securitized23.9%
U.S. Treasuries14.4%
Government Related3.9%
U.S. TIPS3.1%
Unassigned3.9%
Cash2.7%
6

SMRSDuration Distribution
Fixed Income Composite Versus Benchmark9/30/16
Source: Factset
Market Value in MillionsPortfolio Benchmark Portfolio Benchmark
Duration Assets Weight Weight Duration* Duration*
<1 $1,149 14.2% 4.4% 0.2 0.71 to 3 1,228 15.1% 36.9% 2.1 2.13 to 5 1,572 19.4% 25.1% 4.1 3.85 to 7 2,225 27.4% 10.8% 6.0 6.07 to 10 1,447 17.8% 8.5% 7.8 8.1>10 248 3.1% 14.3% 15.1 16.3NA 243 3.0% 0.0% 0.0 0.0
Total $8,112 100.0% 100.0% 4.8 5.5
* Effective Duration
14.2% 15.1%
19.4%
27.4%
17.8%
3.1% 3.0%4.4%
36.9%
25.1%
10.8%8.5%
14.3%
0.0%0%
10%
20%
30%
40%
<1 1 to 3 3 to 5 5 to 7 7 to 10 >10 NA
Composite Portfolio Benchmark
# of Years
7

SMRS Internal/External Manager Performance – Net of Fees
9/30/16
Total Fixed Income Performance, Net of Fees (MPSERS)
Market Value 1-Year 3-Years 5-Years 7-Years 10-Years Total Fixed Income $8,111,698,173 7.2% 4.8% 4.1% 5.0% 5.6%
Barclays Aggregate Bond Index N/A 5.2% 4.0% 3.1% 4.1% 4.8%
Internal Fixed Income $5,068,231,321 6.7% 4.8% 3.7% 4.6% 5.6% External Fixed Income $3,043,466,852 7.7% 5.0% 4.6% 5.5% 5.4%
MetWest Securitized Opportunities 410,982,780 3.8% -- -- -- -- Principal CMBS 498,209,333 4.1% 6.3% 10.1% 14.3% -- Pyramis Tactical Bond Fund 285,644,995 9.4% -- -- -- -- Prudential Investment Grade 225,140,492 9.4% 6.0% 5.7% 6.4% 6.8% Dodge & Cox Core 235,515,458 7.2% 4.6% 4.4% 5.0% 5.6% Loomis Sayles CorePlus 219,632,743 8.8% 4.6% -- -- -- Napier Park ABS Income 133,842,232 8.8% -- -- -- -- T. Rowe Global Multi-Sector 218,338,602 N/A -- -- -- -- Barclays Aggregate Bond Index N/A 5.2% 4.0% 3.1% 4.1% 4.8% Columbia Management High Yield 451,211,028 11.5% 5.9% -- -- -- Prudential High Yield 364,949,187 11.0% -- -- -- -- Barclays US HY BA/B 2% Cap N/A 11.7% 5.5% -- -- --
8
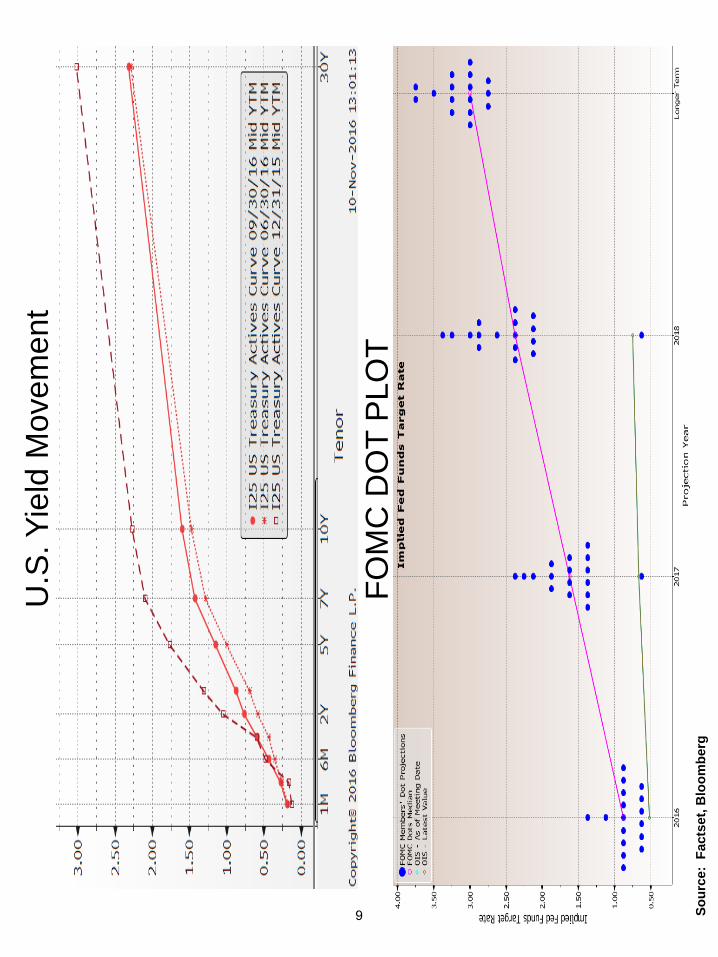
Sour
ce:
Fact
set,
Blo
ombe
rg
FOM
C D
OT
PLO
T
U.S
. Yie
ld M
ovem
ent
9

Sour
ce:
Blo
ombe
rg
U.S
. 10
Yr, 1
.60
Ger
man
10
Yr, -
0.12
Japa
n 10
Yr,
-0.0
9U
K 10
Yr,
0.75
Spai
n 10
Yr,
0.88
-1.00.0
1.0
2.0
3.0
4.0
5.0
6.0
7.0
8.0
6/1/
1212
/1/1
26/
1/13
12/1
/13
6/1/
1412
/1/1
46/
1/15
12/1
/15
6/1/
16
YTM
Sove
reig
n 10
-Yea
r YTM
2 Ye
ar T
sy, 0
.76
10 Y
ear T
sy, 1
.60
0.0
1.0
2.0
3.0
4.0
5.0
6.0 10
/2/0
610
/2/0
710
/2/0
810
/2/0
910
/2/1
010
/2/1
110
/2/1
210
/2/1
310
/2/1
410
/2/1
5
YieldYi
eld
Cur
ve S
lope
10

Sou
rces
: Fed
eral
Res
erve
Ban
k of
Atla
nta,
Blo
ombe
rg
Flex
ible
CPI
, -0.
9
Stic
ky C
PI ,
2.6
-8.0
-6.0
-4.0
-2.00.0
2.0
4.0
6.0
8.0
10.0 12
/1/2
008
12/1
/200
912
/1/2
010
12/1
/201
112
/1/2
012
12/1
/201
312
/1/2
014
12/1
/201
5
CPI
Flex
ible
and
Stic
ky P
rice
CPI
(12-
Mon
th A
nnua
lized
)
BEI,
1.61
1.0
1.1
1.2
1.3
1.4
1.5
1.6
1.7
1.8
1.9
2.0
12/3
1/20
151/
31/2
016
2/29
/201
63/
31/2
016
4/30
/201
65/
31/2
016
6/30
/201
67/
31/2
016
8/31
/201
69/
30/2
016
YieldBr
eake
ven
Infla
tion
11

Sou
rce:
Bar
clay
’s
U.S
. IG
, 138
.3U
.S. H
Y, 4
80.2
HY E
nerg
y, 6
09.3
U.S
. BBB
CM
BS, 4
84.4
0
200
400
600
800
1,00
0
1,20
0
1,40
0
1,60
0
1,80
0
2,00
0 9/30
/14
12/3
1/14
3/31
/15
6/30
/15
9/30
/15
12/3
1/15
3/31
/16
6/30
/16
9/30
/16
OAS
Opt
ion-
Adju
sted
Spr
ead
Mov
emen
tNet
Issu
ance
, 615
.8
0.0
100.
0
200.
0
300.
0
400.
0
500.
0
600.
0
700.
0
800.
0
1993
1994
1995
1996
1997
1998
1999
2000
2001
2002
2003
2004
2005
2006
2007
2008
2009
2010
2011
2012
2013
2014
2015
2016
Net Issuance ($ in billions)U.
S. C
orpo
rate
Bon
d N
et Is
suan
ce
12

Sou
rce:
Blo
ombe
rg, C
redi
tSig
hts
13

State of Michigan Retirement Systems
INTERNATIONAL EQUITY REVIEW Investment Advisory Committee Meeting
December 15, 2016
Richard J. Holcomb, CFA
Senior Investment Manager Quantitative Analysis Division

EXECUTIVE SUMMARY Performance MPSERS Plan 1-Year 3-Years 5-Years 7-Years 10-Years Annualized Returns 9.9% 2.1% 7.7% 4.9% 2.0% Benchmark Return 9.3% 0.3% 6.3% 3.5% 1.0% Peer Return (> $1 B) 9.9% 1.5% 7.9% 5.2% 3.0% Rank vs. Peers 49 28 60 58 85 Third quarter international equity returns in developed markets reflected continuing
slow economic growth and the political uncertainties of the British choice to leave the European Union (Brexit). Emerging market returns benefited from some stability in energy and commodity prices, and continued growth in China and India. Japan benefited from Yen strength. The U.S. dollar showed strength against the British Pound. Chinese GDP growth deceleration stabilized, and China “A” share stocks posted low positive returns although trailing the MSCI Emerging Markets Index. Significant geopolitical risks remain unresolved throughout the world, and global trade impacts are uncertain. Our international portfolio returns have exceeded their internal benchmark over all time periods.
Performance comparisons with peer group returns are stable, and reflect positive
contributions from all three strategic investment approaches. Indexed investments have benefited from an overweight to smaller capitalization stocks. Stock Plus strategy returns have benefited from internal fund rebalancing of collateral assets to improve their absolute return. Active managers have taken advantage of a more favorable investment environment for their individual disciplines, but had been negatively affected by underweights to the energy and commodities sectors.
Internally-managed stock plus funds experienced volatility in dividend stocks and Libor note spreads in the third quarter, but have outperformed their benchmarks in longer periods. Stock plus funds represent 32.5% of international equity exposure, and had a return of 7.1% in the third quarter, and 11.6% for the year. Currency hedging of the internal swap overlay has been reduced to more closely match the 25% hedge level of its internal benchmark. All counterparties used for swap agreements, and all fixed income securities held as collateral continue to be rated investment grade.
Indexed investments represent 30.8% of international equity exposure, and had a
return of 7.3% in the third quarter, and 10.6% for the year. The positive relative performance can be attributed to an overweight of small capitalization stocks in the selection of index fund exposure components.
1

Active international managers represent 36.8% of international equity exposure, and had a return of 7.9% for the challenging third quarter and 8.0% for the year. The manager strategies are diversified with a combination of fundamental analysis driven and quantitative factor approaches. The Wellington Emerging Markets Local Equity fund continued to contribute to excess returns for the year through its focus on EM local demand beneficiaries. The cumulative active exposure is designed to produce a positive ensemble alpha through multiple expert processes.
Outlook
The outlook for international equities is positive based on expected slow
improvement in the European economies, continued European Central Bank support and stimulus through QE actions, and attractive valuation with the U.S. market. Emerging markets, which have now discounted lower energy and commodity prices and slower demand will benefit from growing local consumer demand. Political uncertainty and threats to global trade are critical issues that will play out in 2017.
External managers, diversified by style, are benefiting and will benefit from a good
environment for active stock selection with wider universe return dispersion and many opportunities. Small and mid-cap international stocks will continue to experience greater volatility, but will continue to have more of a positive shareholder focus than the larger State owned or influenced group that dominate capitalization-weighted benchmark indices. Stock Plus absolute return strategies have been impacted by interest rate and risk uncertainties, but will continue to achieve returns in excess of overlay costs.
Emerging markets performance will continue to benefit from growing local
consumer demand trends and access to technology. Positive governance, regulation, and financial system changes will gradually improve investment opportunities in many countries. Political instability, systemic corruption, rule of law, and unfavorable tax regimes will remain concerns, and progress uneven. Infrastructure projects should stimulate emerging market economies. Commodity rates will continue to improve as capacity is reduced.
Investment Plan
Move toward longer term asset allocation objectives as political uncertainties are
better defined, a slow global recovery develops and relative valuations of international markets remain positive.
Take advantage of opportunities to enhance returns in internal stock plus strategies
to achieve absolute returns in excess of equity overlay costs. Collaborate with internal fixed income and equities staff for an effective hybrid approach to security research and selection.
Prepare for derivative market regulatory and structural changes, and focus on
further development of counterparty relationships as a strategic advantage.
2

SMRSInternational Equities
9/30/16
Markets
Indexed
SSgA $1,837 Vanguard 1,166
Total Indexed $3,003 30.6%
Stock Plus
Internal Swaps $1,776 PIMCO 1,414
Total Stock Plus $3,190 32.6%
Active
Los Angeles Capital $1,155 Wellington 812 Marathon London 613 SSgA 584 Effissimo 231 Lazard 214
Total Active $3,609 36.8%
TOTAL $9,802 100.0%
Amount % of TotalTotal
(in millions)
3

SMRSInternational Equity Exposure By Category
9/30/16
Market Value in Millions9/30/16 6/30/16
Indexed Developed Large $1,575 16.1% $1,479 16.2% Developed Small 826 8.4% 761 8.3% Emerging Market Total Indexed Equity
602 6.1%$3,003 30.6%
558 6.1%$2,798 30.6%
Stock Plus Developed Large $2,591 26.5% $2,437 26.7% Emerging Market Total Stock Plus Equity
599 6.1%$3,190 32.6%
545 6.0%$2,982 32.7%
Active Developed Large $2,484 25.3% $2,316 25.4% Developed Small 584 6.0% 532 5.8% Emerging Market Total Active Equity
541 5.5%$3,609 36.8%
499 5.5%$3,347 36.7%
Total International Equity $9,802 100.0% $9,127 100.0%Michigan Department of Treasury, Bureau of Investments
Indexed Developed Large
16.1%
Indexed Developed Small
8.4%
Indexed Emerging Market6.1%
Stock Plus Developed Large
26.5%
Stock Plus Emerging Market
6.1%
Active Developed Large…
Active Developed Small…
Active Emerging Market…
4

SMRS Active International Equities
9/30/16
Date: 9/30/16 6/30/16 3/31/16 12/31/15 Assets ($million): $3,609 $3,348 $3,242 $2,410 Number of Securities: 1,506 1,522 1,558 1,707 Active Share: 63% 62% 63% 57% Benchmark: MSCI ACWI ex USA Description: The Active International Equities Composite represents the profile of cumulative investments
by active international managers with developed market large and small cap, and emerging market mandates. The manager returns are well diversified and reflect a combination of fundamental analysis driven and quantitative management approaches. The cumulative exposure, supported by multiple expert processes, is constructed to produce a positive, long-term ensemble alpha with control of assumed risk.
Characteristics: SMRS MSCI ACWI ex USA Weighted Average Capitalization ($billion): $3.5 $13.5 Trailing 12-month P/E: 17.2x 10.6x Forecast P/E: 15.2x 14.0x Price/Book: 1.4x 1.6x Beta: 0.93 1.00 Dividend Yield: 2.7% 3.1% Tracking Error: 3.4% NA
TOP TEN HOLDINGS – Active International Equities 9/30/16
Portfolio Weight
Market Value
Dai-ichi Life Insurance Co Ltd/The 2.4% $85.9 Kawasaki Kisen Kaisha Ltd Ordinary JPY 1.4% $51.3 Ricoh Co Ltd 1.3% $45.4 Yamada Denki Co Ltd 1.1% $38.5 Lonza Group AG 0.8% $27.4 Novartis AG 0.7% $24.7 Atos SE 0.6% $22.8 Adecco Group AG 0.6% $21.9 Tencent Holdings Ltd 0.6% $21.2 Anheuser-Busch InBev SA/NV 0.6% $20.6 TOTAL 10.1% $359.7
5

SMRSActive International Equity By Sector
9/30/16
Market Value in Millions9/30/16
Assets Percent Benchmark Difference
Financials $684 19.0% 21.6% -2.6%Industrials 593 16.4% 11.8% 4.6%Consumer Discretionary 503 13.9% 11.7% 2.2%Consumer Staples 375 10.4% 10.8% -0.4%Information Technology 329 9.1% 9.6% -0.5%Materials 265 7.4% 7.5% -0.1%Health Care 264 7.3% 8.6% -1.3%Real Estate 195 5.4% 3.5% 1.9%Energy 127 3.5% 6.6% -3.1%Utilities 113 3.1% 3.4% -0.3%Telecom Services 107 3.0% 4.9% -1.9%Total Investments $3,555 98.5% 100.0%Cash EquivalentsTotal
54 1.5% 0.0%$3,609 100.0% 100.0%
1.5%
Benchmark: MSCI ACWI ex USA
Financials19.0%
Industrials16.4%
Consumer Discretionary
13.9%
Consumer Staples10.4%
Information Technology9.1% Materials
7.4%
Health Care7.3%
Real Estate5.4%
Energy3.5%
Utilities3.1%
Telecom Services3.0%
Cash Equivalents1.5%
6

InceptionFund Name Market Value 3-Years 5-Years 7-Years Date
PIMCO Intl StocksPlus TR Strategy $971,990,964 9.0% 0.0% 9.3% -- 10/1/10MSCI EAFE Net Div Index (unhedged) 6.5% 0.5% 7.4% --
LA Capital World 845,351,215 -- -- -- -- 10/30/15MSCI ACWI Ex-US
Marathon-London Intl Fund 612,922,789 8.4% 3.8% -- -- 2/1/12MSCI EAFE Index 6.5% 0.5% -- --
SSGA Small Cap Intl Alpha Strategy 583,508,683 9.5% 5.0% 12.1% 9.2% 5/1/07S&P Developed Ex-US Small Cap 12.3% 4.6% 10.2% 7.6%
Wellington Intl Research Equity 580,917,456 5.5% 1.5% 7.8% 5.2% 12/1/05S&P BMI World Ex-US Index 8.5% 1.1% 7.4% 4.7%
Pimco EM Stock Plus 441,953,854 18.6% -- -- -- 3/31/15MSCI Emerging Market Index 16.8%
LA Capital Emerging Market 309,770,987 14.6% -0.3% 3.5% -- 12/8/09MSCI Emerging Market Index 16.8% -0.6% 3.0% --
Wellington Emerging Local Equity 231,479,133 15.9% 3.5% -- -- 12/1/11MSCI Emerging Market Index 16.8% -0.6% -- --
Effissimo Capital Management Japan 230,600,332 -- -- -- -- 10/30/15MSCI EAFE Net Div Index (unhedged)
Lazard Wilmington Intl Equity Portfolio 213,750,000 4.2% -- -- -- 5/1/14MSCI EAFE Net Div Index (unhedged) 6.5% -- -- --
InceptionFund Name Market Value 3-Years 5-Years 7-Years Date
SSgA PMI Fund $1,010,633,464 8.3% 0.8% 7.1% -- 4/1/10S&P Developed Ex-US Large/Midcap 7.8% 0.4% 6.9% --
SSgA EMI Fund - Europe/Pacific 825,606,164 11.3% 5.5% 11.3% -- 4/1/10S&P EPAC Small Cap 11.0% 5.2% 1.1% --
Vanguard Emerging Market 602,014,383 15.9% 0.2% 3.5% -- 7/1/09Spliced Emerging Market Index ** 15.7% 0.1% 3.1% --
Vanguard Developed Mkts Fund 564,101,072 8.1% 1.2% 8.4% -- 4/1/10Spliced Developed Ex-US Index * 8.2% 1.1% 7.8% --
*
**
1-Year
International Active Manager Performance - Net of Fees9/30/16
International Indexed Manager Performance, Net of Fees9/30/16
1-Year
Spliced Developed Ex-US Index: MSCI EAFE Index through May 29, 2013; FTSE Developed Ex North America Index through December 20, 2015; FTSE Developed All-Cap
Ex-US Transition Index therafter. Benchmark returns are adjusted for withholding taxes.
Spliced Emerging Market Index: Select Emerging Markets Index through August 23, 2006; MSCI Emerging Markets Index through January 9, 2013; FTSE Emerging
Transition Index through June 27, 2013; FTSE Emerging Index through November 1, 2015; and FTSE Emerging Markets All-Cap China A Transition Index thereafter.
Benchmark returns are adjusted for withholding taxes.
7

State of Michigan Retirement Systems
PRIVATE EQUITY REVIEW Investment Advisory Committee Meeting
December 15, 2016
Peter A. Woodford
Senior Investment Manager Private Equity Division


EXECUTIVE SUMMARY
Performance
MPSERS Plan 1-Year 3-Years 5-Years 7-Years 10-Years Annualized Returns 03.6% 13.2% 11.6% 15.2% 11.2% Benchmark Return 07.1% 14.8% 15.2% 17.3% 11.2% Peer Median Return 04.7% 9.2% 09.7% 11.0% 08.9% Rank vs. Peers 77 14 19 5 6
• The Private Equity Division annualized return was 3.6% for the year, underperforming its benchmark by 350 basis points.
• It is not unusual for private equity returns to lag the public market benchmark return in up markets and lead the public market benchmark in down markets. The past several years have been no exception due to market volatility and the fourth longest expansion in U.S. history. However, over the past ten years, a full market cycle, the Private Equity Division has delivered 4.0% annualized excess returns over the S&P 500 (10 year S&P 500 return 7.2%).
• Private Equity returns have been strong relative to peer median returns, ranking in the top 5% and 6% of peers over the past seven and ten years respectively.
Strategy Update For the twelve months ending 9/30/16, the Private Equity Division returned approximately $910 million, net of contributions, to the pension fund (9.6% cash yield on $9.5 billion AUM). The pace of distributions is expected to slow for the remainder of 2016, as dividend recaps have largely played out. • Commitments closed during the third quarter include:
- $100 million to Michigan Growth Capital Partners III, L.P., a Midwest focused small buyout fund
- $100 million to GCM Grosvenor Fund Investment Program VIII, L.P., a fund-of-funds focused on small buyout, venture and co-investment
- $50 million to HPS Mezzanine Partners III, L.P., a mezzanine debt fund Market Environment • Private equity investment activity remained muted in the third quarter as a result of
heightened global macroeconomic uncertainty, high valuations, and concerns over market volatility. Fallout from the Brexit referendum in June, pending Fed rate hike and the contentious U.S. election cycle had an adverse impact on private market valuations. The Federal Reserve’s near zero interest rate policies have made it exceedingly difficult to invest money into new deals at attractive entry prices. As a result, private equity sponsors have sat largely on the sidelines or have been forced
1

to evaluate non-traditional opportunities to put money to work. “There simply isn’t a lot of value in large leveraged buyouts of publicly traded companies” (Joe Baratta, the Blackstone Group).
• Private equity firms have been much more active on the sell side, particularly in an environment of lofty valuations and low interest rates. But the sell side has largely played-out and distributions appear to have peaked. In addition, increased regulation aimed at limiting risky lending by Wall Street Banks has reduced the amount of debt available, forcing private equity firms to contribute more equity. These headwinds will likely impact private equity returns.
• Private Equity’s strategy for the next 3-6 months will focus on opportunistic investing. This may include direct co-investments, direct secondaries, co-mingled funds and other market driven opportunities.
2

SMRSPrivate Equity
9/30/16
Market Value in Millions9/30/16 6/30/16
Buyout Funds $4,356 46.1% $4,404 46.3%Special Situation Funds 1,593 16.8% 1,590 16.7%Liquidation Portfolio 1,466 15.5% 1,488 15.7%Venture Capital Funds 1,061 11.2% 1,056 11.1%Fund of Funds 654 6.9% 610 6.4%Mezzanine Funds 168 1.8% 157 1.7%Other 159 1.7% 201 2.1%
Total $9,457 100.0% $9,506 100.0%
Buyout Funds46.1%
Special Situation Funds16.8%
Liquidation Portfolio15.5%
Venture Capital Funds11.2%
Fund of Funds6.9%
Mezzanine Funds1.8%
Other1.7%
3

9/30/16Outstanding
Commitments
OtherRecallableReturnedCapital
FXChange
CapitalCalls
New Deals
6/30/16Outstanding
Commitments
$6,185$25
$93$3
($463)
$250
$6,277($ Millions)
Outstanding Commitments
9/30/16Reported
Value
CashBalanceChange
ReportedValue
Change
StockDist.
Received
Cash Dist.
Received
Capital Calls
6/30/16Reported
Value
$9,457
($41)
$210
($32) ($649)
$463$9,506
($ Millions)
Invested Commitments
SMRSPrivate Equity
9/30/16
4

SMRS Private Equity
9/30/16
These numbers are based on the most recent available General Partner Data; primarily 9/30/16 and are subject to change.
Investments by Industry
Other1%
5

yit S qu
SMR
6e
E 130
/riv
at /9P
G
eogr
aphi
c R
epor
t: N
orth
Am
eric
a 72
%, E
urop
e 18
%, A
sia
8%, O
ther
2%
Asia
/Afr
ica
Uni
ted
Kin
gdom
6.24
%
Wes
tern
Euro
pe11
.36%
East
ern
Euro
pe
Latin
Amer
ica
U.S
. Nor
thw
est
15.9
5%
U.S
. Sou
thw
est
12.9
5%
U.S
. Nor
thC
entr
al
11.1
2%
U.S
. Sou
thea
st8.
27%
U.S
. Mid
-At
lant
ic4.
08%
U.S
. New
Engl
and
18.1
%
7.75
%
Can
ada
1.88
%
Inve
stm
ents
by
Reg
ion
0.65
%
6

SMRS Private Equity
9/30/16
($ Millions)
Asset Vintage1986-98 13$ 12$ 25$ 1999 25 10 35 2000 66 28 94 2001 200 38 238 2002 53 9 62 2003 18 18 36 2004 124 46 170 2005 392 25 417 2006* 1,071 273 1,344 2007 895 154 1,049 2008 1,011 187 1,198 2009 66 1 67 2010 325 26 351 2011 755 167 922 2012 1,122 368 1,490 2013 430 288 718 2014 766 657 1,423 2015 1,882 1,903 3,785 2016 84 1,975 2,059 Income Accruals 1 1 Cash 154 - 154 Act. Small Cap - Stock Dist 4 - 4 Total 9,457$ 6,185$ 15,642$
*Liquidation portfolio is 2006 vintage
($ Millions)
Reported Value
Euro ($1.12/ €) € 379Pound ($1.29/ £) £2
$692$4
€ 616£3
€ 237£1
Outstanding Commitment
Total Exposure
Total (USD)
Reported Value
Outstanding Commitment
Total Exposure
Portfolio by Vintage Year
FX Exposure
7

($ Millions)
Asset TypeHarbourVest Partners 1,509$ 401$ 1,910$ Grosvenor Capital Management 648 295 943 Blackstone Capital Partners 420 459 879 KKR 568 186 754 Warburg Pincus Capital 453 287 740 Advent International 345 316 661 Leonard Green & Partners 339 244 583 The Carlyle Group 281 254 535 TPG 330 170 500 Berkshire Partners 226 229 455
Top 10 Total Value 5,119$ 2,841$ 7,960$
Value Commitment Total
SMRSPrivate Equity
9/30/16
Reported Outstanding
Top 10 Sponsors
Cash Weighted Rates of Return*
(Net IRR)
Buyout 0.9% 7.6% 13.0% 14.9% 12.0%Fund of Funds -0.1% 5.2% 12.2% 9.9% 9.3%Mezzanine -0.5% -2.5% 3.7% 11.2% 8.5%Special Situations 0.4% 4.0% 7.4% 10.9% 8.2%Venture Capital 0.2% 1.0% 13.9% 13.2% 16.8%
*These numbers are based on most recent available General Partner reported data; primarily 9/30/16 and are subject to change.
Current Qtr. 1-Year 3-Years 5-Years 10-Years
8

Accel Europe I, L.P. 16,252,867$ 1$ Accel Europe II 16,418,351 3,300,000 Accel Growth Fund II, L.P. 12,244,007 1,260,000 Accel Growth Fund III, L.P. 10,634,378 3,360,000 Accel Growth Fund IV L.P. - 22,000,000 Accel IX, L.P. 4,607,802 3,000,000 Accel Leaders Fund L.P. - 5,500,000 Accel London V L.P. 900,000 12,100,000 Accel VI, L.P. 1,386,074 - Accel VII, L.P. 1,181,843 5,000,000 Accel VIII, L.P. 3,506,727 4,782,499 Accel VI-S 2,567,219 652,611 Accel X, L.P. 19,250,697 400,000 Accel XI, L.P. 6,910,092 1,680,000 Accel XII, L.P. 4,678,226 2,275,000 Accel XIII, L.P. - 10,000,000 Advent Global Private Equity III 991,889 20 Advent Global Private Equity IV 15,302 - Advent Global Private Equity V 9,204,062 8,700,000 Advent International GPE VI-A LP 123,392,176 3,999,980 Advent International GPE VII-B, L.P. 199,557,576 29,300,000 Advent International GPE VIII-B, L.P. 4,725,000 245,275,000 Advent Latin American Private Equity Fund VI, L.P. 7,431,990 28,472,500 Affinity Asia Pacific Fund II, L.P. - 5,288,237 Affinity Asia Pacific Fund III, L.P. 56,387,541 12,860,591 Affinity Asia Pacific Fund IV, L.P. 57,536,759 73,837,623 Apax Europe Fund VI 23,251,686 2,376,610 Apax Europe V, L.P. 208,193 - Apax Europe VII, L.P. 58,928,613 2,179,852 Apax Excelsior VI 85,022 1,614,434 Apax IX, L.P. - 150,000,000 Apax US VII 20,555,674 417,509 Apax VIII - B, L.P. 93,534,658 23,445,788 Apollo Investment Fund VIII L.P. 55,929,953 47,358,486 Arboretum Ventures II 2,634,716 - Arboretum Ventures III, L.P. 11,919,305 1,170,000 Arboretum Ventures IV, L.P. 3,463,935 24,780,000 Ares Corporate Opportunities Fund II 8,590,076 11,423,773 Ares Corporate Opportunities Fund III, LP 84,504,083 9,590,370 Ares Corporate Opportunities Fund IV, L.P. 79,808,615 26,625,983
SMRSPrivate Equity
9/30/16Net Market Values by Ownership Entity
Reported ValueUnfunded
CommitmentAdjusted
9

Reported ValueUnfunded
CommitmentAdjusted
AXA ASF Miller Co-Investment 39,559,904 22,721,187 Axiom Asia IV, L.P. 1,892,748 47,795,082 Axiom Asia Private Capital Fund III, L.P. 28,088,548 13,001,764 BC European Capital IX 65,197,704 15,184,962 BC European Capital VII, L.P. 551,145 - BC European Capital VIII, L.P. 31,784,668 8,788,116 Berkshire Fund IX, L.P. - 200,000,000 Berkshire Fund V, L.P. 256,268 3,281,560 Berkshire Fund VI, L.P. 48,656,418 6,922,675 Berkshire Fund VII, L.P. 72,486,269 2,453,549 Berkshire Fund VIII, L.P. 104,383,706 16,728,468 Blackstone Capital Partners IV 39,922,166 5,009,715 Blackstone Capital Partners V 68,659,122 16,142,412 Blackstone Capital Partners VI, LP 279,799,686 53,368,484 Blackstone Capital Partners VII, L.P. - 270,000,000 Blackstone Capital Partners V-S 9,063,021 712,476 Bridgepoint Europe IV 38,072,752 6,328,741 Carlyle Europe Partners II 1,885,797 4,163,986 Carlyle Europe Partners III 40,702,479 12,347,397 Carlyle Europe Partners IV, L.P. 36,029,831 71,296,175 Carlyle Partners IV, L.P. 6,771,346 16,009,296 Carlyle Partners V L.P. 114,270,650 57,309,519 Carlyle Partners VI, L.P. 81,550,713 92,417,786 Castle Harlan Partners IV 7,110,353 5,286,319 Castle Harlan Partners V 38,084,494 38,442,690 CCMP Capital Investors II 61,938,609 10,346,490 CCMP Capital Investors III, L.P. 32,141,451 22,310,139 Centerbridge Capital Partners III, LP 21,039,435 55,819,789 Cerberus SMRS Partners, L.P. 89,548,241 27,804,657 CM Liquidity Fund, L.P. - 25,000,000 Coller International Partners IV 3,425,842 1,000,000 Coller International Partners V, L.P. 46,552,769 43,600,000 Coller International Partners VI, L.P. 66,149,716 29,723,267 Coller International Partners VII, L.P. 5,782,515 144,720,189 Crescent Mezzanine Partners VI, L.P. 55,593,208 13,886,480 Crescent Mezzanine Partners VII 11,353,297 138,770,871 DLJ Investment Partners II 161,097 - DLJ Investment Partners III 12,088,488 57,712,985 Dover Street IX, L.P. - 100,000,000 EDF Ventures III 1,392,549 - EnCap Energy Capital Fund X, L.P. 11,064,281 33,055,842 Entertainment IP Fund, L.P. 1,930,234 47,086,216 FIMI Opportunity 6, L.P. 1,022,727 48,977,273 FirstMark Capital I, L.P. 77,030,983 196,596 FirstMark Capital IV, L.P. - 35,000,000 FirstMark Capital OF I, L.P. 10,012,266 9,500,000 FirstMark Capital OF II, L.P. - 35,000,000 FirstMark Capital P2, L.P. 168,159,757 -
10

Reported ValueUnfunded
CommitmentAdjusted
Flagship Ventures Fund 2004 10,256,550 - Flagship Ventures Fund 2007, L.P. 32,943,447 - Flagship Ventures Fund IV, L.P. 79,364,805 - Flagship Ventures Fund V 25,402,442 18,725,000 Flagship Ventures Opportunities Fund I, L.P. - 50,000,000 Fox Paine Capital Fund II, LP 22,167,780 15,539,184 FS Equity Partners VII, L.P. 45,643,011 51,690,300 GCM Grosvenor Fund Investment Program I, L.P. 15,280,768 1,422,440 GCM Grosvenor Fund Investment Program II, L.P. 58,901,509 15,958,840 GCM Grosvenor Fund Investment Program III - 2004 65,401,333 5,002,008 GCM Grosvenor Fund Investment Program III - 2006 103,911,015 10,562,946 GCM Grosvenor Fund Investment Program V, L.P. 90,557,353 13,597,826 GCM Grosvenor Fund Investment Program VI, L.P. 16,155,384 18,362,725
** GCM Grosvenor Fund Investment Program VIII, L.P. - 100,000,000 GCM Grosvenor SeasPriFIP LP (PIS06-10) 83,071,428 26,391,470 GCM Grosvenor SeasPriFIP LP (PIS14) 158,013,667 87,408,234 GCM Grosvenor SeasPriFIP LP (Seed) 56,698,366 15,824,218 G-II Acquisition Holdings Note 6,932,579 - G-IV Acquisition Holdings, LLC 20,936,296 - Green Equity Investors IV 7,865,238 1,136,036 Green Equity Investors V 202,835,170 25,966,435 Green Equity Investors VI, L.P. 128,114,931 16,779,471 Green Equity Investors VII, L.P. - 200,000,000 GSO Capital Opportunities Fund II, L.P. 20,971,109 15,889,384 GSO Capital Opportunities Fund III, L.P. 1,642,846 98,357,154 HarbourVest Dover Street VIII, L.P. 48,145,524 11,812,500 HarbourVest Int'l III Direct 1,192,407 1,000,000 HarbourVest Int'l III Partnership 673,922 1,200,000 Harbourvest Partners Co-Investment Fund IV L.P - 100,000,000 HarbourVest Partners Mezzanine Income Fund 24,682,059 25,875,000 HarbourVest V Partnership 207,266 300,000 HarbourVest VI - Direct Fund LP 4,030,213 750,000 HarbourVest VI Partnership 11,105,901 2,000,000 Harvest Partners VII, L.P. 1,971,027 73,028,973
** HPS Mezzanine Partners III, L.P. - 50,000,000 HVST - TOPE LLC 251,447,920 4,892,650 Insight Venture Partners Growth-Buyout Coinvestment Fund, L.P 20,507,044 29,625,000 Insight Venture Partners IX, L.P. 45,440,578 52,000,000 Kelso Investment Associates IX, L.P. 32,507,566 74,774,162 Kelso Investment Associates VII 3,055,740 4,970,176 Kelso Investment Associates VIII 107,703,588 23,901,677 Khosla Ventures III, L.P. 50,843,846 1,250,000 Khosla Ventures IV, L.P. 67,265,237 3,000,000 Khosla Ventures V, L.P. 20,341,000 30,450,000 KKR 2006 Fund, L.P. 155,081,906 7,231,738 KKR Americas Fund XII, L.P. - 200,000,000 KKR Asian 37,988,774 2,360,055 KKR Asian Fund II, L.P. 35,438,302 26,281,661
11

Reported ValueUnfunded
CommitmentAdjusted
KKR China Growth Fund 34,630,292 11,862,295 KKR E2 Investors (Annex) Fund 832,904 - KKR European Fund II 22,442,066 - KKR European Fund III 99,326,328 22,854,187 KKR European Fund IV L.P. 40,441,304 81,062,814 KKR European Fund LP 1 - - KKR Millennium Fund 35,820,483 - KKR North America Fund XI, L.P. 105,597,977 34,729,508 Lightspeed Venture Partners VI 2,832,700 - Lightspeed Venture Partners VII, L.P. 48,872,353 510,436 Lion Capital Fund I (HME II) 107,638 11,397,982 Lion Capital Fund II 4,490,534 4,678,387 Lion Capital Fund III, L.P. 92,032,216 12,714,252 MatlinPatterson Global Opportunities Partners II 3,048,606 - MatlinPatterson Global Opportunities Partners III 67,430,400 4,336,976 Menlo Ventures IX, L.P. 3,865,721 - Menlo Ventures X, L.P. 45,324,806 - Menlo Ventures XI, L.P. 75,785,451 1,000,000 MeriTech Capital Partners II, L.P. 2,576,937 1,850,000 Meritech Capital Partners III, L.P. 10,835,142 600,000 Meritech Capital Partners IV, L.P. 16,454,110 25,000 Meritech Capital Partners V, L.P. 7,035,281 12,350,000 Michigan Growth Capital Partners II, L.P. 151,623,415 33,046,585
** Michigan Growth Capital Partners III, L.P. - 99,877,853 Michigan Growth Capital Partners, LP 101,445,599 16,986,886 Midtown Fund III, L.P. 970,960 - Midtown II Liquidating Trust 2,340,346 - New Leaf Growth Fund I, L.P. 132,492,309 - New Leaf Ventures II, L.P. 19,357,686 - New Leaf Ventures III, L.P. 13,946,443 21,750,000 Nordic Capital VI, L.P. 27,935,895 - Nordic Capital VII 63,486,210 5,610,520 Nordic Capital VIII, L.P. (Alpha) 25,160,747 21,321,859 Oak Investment Partners X, L.P. 6,922,621 - Oak Investments Partners IX, L.P. 907,021 - Oaktree Opportunities Fund X, L.P. 5,000,286 25,500,000 Oaktree Opportunities Fund Xb, L.P. - 70,000,000 OCM Opportunities Fund IX, L.P. 71,803,644 - OCM Opportunities Fund VII (B), L.P. 4,718,539 - OCM Opportunities Fund VII, L.P. 5,691,586 - OCM Opportunities Fund VIII B, L.P. 26,905,150 - OCM Opportunities Fund VIII, L.P. 14,355,590 - OCM Principal Opportunities Fund IV 19,084,711 - Ocqueoc Holdings, LLC 15,201,164 - One Liberty Fund III 1,138,406 - One Liberty Fund IV 1,813,264 - One Liberty Ventures 2000 5,950,484 - Parthenon Investors II 1,104,681 3,186,779
12

Reported ValueUnfunded
CommitmentAdjusted
Parthenon Investors III 43,901,502 2,779,682 Parthenon Investors IV, L.P. 40,956,616 12,799,878 Peninsula Capital Fund IV 6,727,358 2,201,026 Peninsula Fund VI, L.P. 11,919,154 28,670,000 Phoenix Equity Partners IV 3,042,552 776,432 Public Pension Capital, LLC 5,384,435 44,960,306 Questor Partners Fund II 520,547 5,744,192 Rhone Partners V, L.P. 8,035,191 101,059,598 Riverside Capital Appreciation Fund VI, LP 58,828,091 22,808,926 Riverside Micro Cap Fund I, LP 27,451,196 6,363,307 Riverside Micro-Cap Fund II, L.P. 50,470,107 2,735,834 Riverside Micro-Cap Fund III, L.P. 42,777,547 4,483,406 Riverside Micro-Cap Fund IV 7,852,799 42,147,201 Shamrock Growth Capital Fund IV, L.P. 257,195 48,949,052 Silver Lake Partners II 5,811,471 3,531,586 Silver Lake Partners III 74,898,232 13,153,225 Silver Lake Partners IV, L.P. 35,925,204 20,982,651 SM/TCP L.P. 32,289,392 14,918,007 SMRS-NCRP LLC 1,167,830,768 152,837,842 TCW Shared Op Fund III 1,127,290 - TCW/Crescent Mezzanine Partners III, L.P. 2,407,490 4,552,763 TCW/Crescent Mezzanine Partners IV, L.P. 3,750,798 6,030,737 TCW/Crescent Mezzanine Partners V, LLC 28,149,716 13,232,460 The Huron Fund III, L.P. 15,786,655 4,992,756 The Huron Fund IV, L.P. 21,167,857 13,150,346 The Shansby Group 4 610,132 520,829 The Shansby Group 5 (TSG5) 15,600,790 7,443,077 Thoma Bravo Fund XII, L.P. 24,124,514 124,940,207 TPG IV (Texas Pacific Group IV) 7,472,411 211,725 TPG Partners III, LP 5,550,857 2,087,002 TPG Partners VI, L.P. 170,992,221 23,016,824 TPG Partners, VII, L.P. 31,173,248 118,051,217 TPG V (Texas Pacific Group V) 114,744,274 26,611,195 Trilantic Capital Partners V (North America) Fund A, L.P. 26,489,114 21,590,268 TSG6, L.P. 128,102,012 39,545,079 TSG7 A L.P. 18,212,920 106,036,148 Turnbridge Capital Partners I , LP 30,528,413 62,565,261 Veritas Capital Fund V, L.P. 50,847,812 24,086,040 Veritas V Co-Investors, L.P. 9,947,963 15,000,000 Vista Equity Partners Fund V, L.P. 43,816,177 10,164,258 Vista Equity Partners Fund VI, L.P. 16,082,319 59,005,059 Vista Foundation Fund III, L.P. 1,660,976 17,157,142 Warburg Pincus Energy MCIP, L.P. 14,065,422 11,030,096 Warburg Pincus Energy, L.P. 24,617,942 72,800,000 Warburg Pincus Equity Partners, L.P. 4,074,643 - Warburg Pincus International Partners 8,135,234 - Warburg Pincus Private Equity IX 24,009,287 - Warburg Pincus Private Equity VIII, L.P 13,062,124 -
13

Reported ValueUnfunded
CommitmentAdjusted
Warburg Pincus Private Equity X, L.P. 149,752,397 - Warburg Pincus Private Equity XI, L.P. 194,528,010 25,000,000 Warburg Pincus Private Equity XII Secondary, L.P. 2,644,417 22,355,583 Warburg Pincus Private Equity XII, L.P. 17,693,177 155,487,500 WestAm COREplus Private Equity QP 1,805,620 2,086,719 WestAm Special Private Equity Partners 3,759,542 2,317,427
Total Private Equity 9,297,572,344$ 6,184,789,471$ Cash 132,734,700 - Active Small Cap Cash 21,125,092 - Active Small Cap 4,024,414 - Income Accruals 1,125,207 -
Grand Total 9,456,581,757$ 6,184,789,471$
*** New Commitments made during quarter reported
Total Private Equity amounts do not include Cash and Active Small Cap
14

State of Michigan Retirement Systems
REAL ESTATE AND INFRASTRUCTURE REVIEW Investment Advisory Committee Meeting
December 15, 2016
Brian C. Liikala
Senior Investment Manager Real Estate and Infrastructure Division


EXECUTIVE SUMMARY Performance
MPSERS Plan 1-Year 3-Years 5-Years 7-Years 10-Years Annualized Return 10.4% 13.9% 11.7% 7.8% 5.2% NCREIF NPI 7.8% 9.9% 9.8% 9.7% 59% Peer Median Return 10.8% 11.1% 11.4% 9.6% 4.1% Rank vs. Peers 57 17 36 69 26
• Total Real Estate and Infrastructure Division (REID) value was $6.6 billion with a total
one-year return of 10.4%. Strong performance was the result of increased rental income in for-rent housing, and the lease-up of apartment developments. Hospitality assets, revenue per available room (RevPAR) continued to increase. Credit strategies and unique opportunities sourced by staff have also contributed to overall performance.
Strategy Update
• The REID has a focused strategy that pursues attractive risk-adjusted returns. This includes development of urban apartments and warehouses, acquisition of office buildings where REID can add value through management and leasing, and investing in various levels of the capital stack through its credit strategies. Also, REID has selectively added exposure in Europe where value-add opportunities are sourced through managers that have an established history and presence in the market.
• The REID has been actively managing the portfolio by selling stabilized assets at attractive capitalization rates where growth in rental income is expected to be limited. The REID has disposed of suburban properties in favor of developing/redeveloping properties in dense urban areas where rent growth and appreciation are strong. The REID is also working with its advisors in executing the disposition of non-strategic properties in secondary markets at attractive values.
• The REID has approximately $1.6 billion in unfunded commitments. New commitments
closed during the quarter include:
• $200 million in Lone Star Fund X LP, a commingled fund specializing in global opportunistic credit strategies, managed by Lone Star.
• $17 million in M301W CoInvest LLC, a co-investment in a condo development in Austin, TX, managed by CIM Investment Advisors.
• $15 million in Penmain Office LLC, a separate account for a value-add office acquisition
in Washington, DC area, managed by Domain Capital Advisors.
• The division is being very selective and defensive with new commitments, seeking opportunities that are shorter in duration, deliver more liquidity, produce consistent cash flow, and capitalizing on unique opportunities sourced through REID’s extensive network.
1

Market Environment
• Although still in demand by both domestic and international investors, high quality core asset pricing is beginning to level off. Lenders have become more selective in quality and location of the collateral and are disciplined in keeping loan-to-value ratios generally below 65%. Development of condominiums in major urban markets has begun to ease, as supply becomes a concern in a few markets. Industrial warehouse construction fueled by fulfillment centers continues to meet growing demand. The U.S. has eased FIRPTA Rules to reduce federal taxes on foreign investors for real estate investments. This will likely encourage more offshore pension funds to invest in the U.S. although foreign currency exchange rates may limit the amount.
• Fund flows to the infrastructure sector continue to remain strong, as investor interest in the asset class continues to grow. Opportunities include North American energy where distressed pricing is appearing, power generation, European transportation, and emerging market fundamental infrastructure projects. Investors are prudently managing capital and only pursuing select opportunities.
• In the commercial mortgage-backed securities (CMBS) market, spreads over the swap rate
for 10-year AAA-rated securities decreased 10 basis points (bps) from the prior quarter and now stand at 109 bps. The reduced supply of securities caused spreads on high-rated securities to tighten, the lower-rated securities spreads remain appropriate for the risk. This demonstrates a flight to quality for investors. Commercial Mortgage Alert reported that CMBS issuance is projected to be only $70 billion for 2016 compared to $106 billion in 2015. A wave of refinancing for 2007 ten-year vintage loans is on the horizon. New banking rules by the federal government will negatively impact traditional bank lenders in 2017 and beyond. This could make it difficult for borrowers to refinance properties, with borrowing costs expected to rise due to the new rules. However, this provides opportunities for non-bank lenders, where the REID’s credit strategy has focused its attention.
2

SMRSReal Estate and Infrastructure
9/30/16
Market Value in Millions
Apartment9/30/16
$2,273 34.6%6/30/16
$2,195 34.1%Office 1,040 15.8% 985 15.3%Hotel 916 14.0% 900 14.0%Infrastructure 625 9.5% 616 9.6%Industrial 445 6.8% 437 6.8%For Rent Homes 423 6.5% 422 6.5%Retail 357 5.4% 362 5.6%For Sale Homes 335 5.1% 296 4.6%Land 116 1.8% 97 1.5%
$6,530 99.5% $6,310 98.0%Cash Equivalents
Total Investments
34 0.5%
$6,564 100.0%
133 2.0%
$6,443 100.0%
Apartment34.6%
Office15.8%
Hotel14.0%
Industrial6.8%
For Rent Homes6.5%
Retail5.4%
For Sale Homes5.1%
Land1.8%
Cash Equivalents0.5%
Infrastructure9.5%
3

Paci
fic
18.0
%
Sout
hwes
t
14.0
%
Sout
heas
t
13.0
%
Mid
east
11.0
%Nor
thea
st
12.8
%Ea
st N
. Cen
tral
13.0
%
Wes
t N. C
entra
l
2.0%
Mou
ntai
n
8.2%
Inte
rnat
iona
lcom
pris
es 8
.0%
Geo
grap
hic
regi
ons d
efin
ed b
y N
CR
EIF,
who
se p
rope
rty in
dex
com
posi
tion
is: P
acifi
c 32
.0%
, Mou
ntai
n 5.
8%,
Wes
t N. C
entra
l 1.4
%, S
outh
wes
t 10.
5%, E
ast N
. Cen
tral 7
.6%
, Sou
thea
st 9
.4%
, Nor
thea
st 2
1.3%
, Mid
east
12.
0%
SMR
SR
eal E
stat
e by
Reg
ion
Bas
ed o
n M
arke
t Val
ue(e
xclu
des
cash
& c
ash
equi
vale
nts)
9/30
/16
4

Top TenAdvisors or Entity
Advisor or Entity Market Value
MWT Holdings, LLC (SHLP)Clarion Partners Blackstone Group Kensington Realty Advisors, Inc.CIM Investment Advisors LLCDomain Capital Advisors IncKBS Realty AdvisorsBentall Kennedy LPPrincipal Real Estate InvestorsFive Star Realty Partners, LLC
Occupancyby Property Type
Apartment Office Industrial Retail Hotel
SMRS Portfolio 94.2% 86.1% 92.2% 93.6% 79.7%
National Average 93.2% 87.0% 91.9% 94.6% 69.4%
206,528,206
4,405,702,160$
236,626,597 244,795,818
677,495,448
SMRSReal Estate and Infrastructure
9/30/16
1,373,506,347$
579,917,512 318,004,118 263,598,172 255,441,882 249,788,060
5

Unfunded Market Value Commitment
801 Grand Avenue Capital, LLC 78,486,596$ 0$ Apollo Asia Real Estate Fund, L.P. 0 75,000,000 Avanath Affordable Housing I, LLC 23,567,840 2,492,748Avanath Affordable Housing II, LLC 25,095,429 0Avanath II SMRS Co-Investment Fund LLC 20,463,113 0Beacon Capital Strategic Partners IV, LP 1,163,557 0Beacon Capital Strategic Partners V, LP 3,416,003 2,500,000Blackstone R/E IH3 Co-Inv Partners 422,541,884 0Blackstone Real Estate Partners V, LP 26,203,455 2,087,026Blackstone Real Estate Partners VI, LP 40,443,940 3,680,000Blackstone Real Estate Partners VIII, LP 30,215,889 46,400,000Capri Select Income II 67,002 0Capri Urban Investors, LLC 19,150,870 0CIM Fund III, LP 72,335,388 0CIM Fund VIII, LP 65,089,306 43,854,172CIM Urban REIT, LLC 80,011,867 0CIM VI (Urban REIT), LLC 30,999,470 0Clarion Gables Multifamily Trust 28,778,554 0CPI Capital Partners N.A., LP 179,019 0CPI Capital Partners N.A. Secondary, LP 1,554,104 0Crown Small Cap Real Estate 9,240,157 15,750,000Domain GVA-1, LLC 190,557,501 165,396,752Domain Hotel Properties, LLC 471,586,092 0Dynamic Retail Trust 77,986,953 0Eastport Properties, LLC 20,111,596 0Gateway Capital R/E Fund II, LP 48,592,614 1,275,000Great Lakes Property Group Trust 306,495,207 0IMRF II CoInvest Spiga LP 12,486,230 1,500,000Invesco Mortgage Recovery Feeder Fund 18,969,023 0Invesco Mortgage Recovery Fund II, LP 51,127,565 17,543,582IPF II Co-Invest LP 19,302,397 12,514,730JBC North LaSalle, LLC 23,832,936 3,965,000JBC Opportunity Fund III, LP 1,317,817 0JP Morgan India Property Fund II, LLC 28,745,132 10,034,310KBS/SM Fund III, LP 70,543,588 0KBS/SM Fund IV, LP 122,760,000 0L-A Saturn Acquisition, LP 42,169,517 0Landmark Real Estate Partners V, LP 15,575,663 3,900,000LaSalle Asia Opportunity Fund II, LP 262,623 0LaSalle Asia Opportunity Fund III, LP 10,473,061 1,250,000Lion Industrial Trust 165,786,263 0Lion Mexico Fund, LP 11,344,539 0Lombard GVA0016 232,534,671 0
* Lone Star Fund X, LP 0 200,000,000Lowe Hospitality Investment Partners 65,889 0Lubert-Adler Real Estate Fund VII, LP 52,716,252 11,250,000M1 Westgate CoInvest LLC 9,056,761 2,403,623
* M301W CoInvest LLC 6,105,380 10,515,644MERS Acquisitions, Ltd. 143,676,117 0MG Alliance, LLC 18,578,936 0
SMRS Market Values by Ownership Entity
9/30/16 REAL ESTATE
6

Unfunded Market Value Commitment
MIP Holdco, LLC 71,150,743 28,600,000Morgan Stanley R/E Fund V - International 3,069,717 0Morgan Stanley R/E Fund VI - International 21,493,450 0Morgan Stanley R/E Fund V - U.S. 2,945,505 0Morgan Stanley R/E Special Situations Fund III 43,919,612 0MWT Holdings, LLC 1,373,506,347 0Northpark-Land Associates, LLLP 30,010,224 64,350,030Orange Investors LLC 94,773,884 0Paladin Realty Brazil Investors III (USA), LP 32,033,641 0Paladin Realty Latin America Investors IV-CI, LP 31,911,697 17,500,000
* Penmain Office LLC 34,874,157 0Principal Separate Account 158,140,001 0Proprium RE Spec Situations Fund LP 22,950,171 21,214,477Rialto Credit Partnership LP 46,500,000 167,772,727Rialto Real Estate Fund, LP 29,253,140 0Rialto Real Estate Fund II, LP 44,808,330 0Rialto Real Estate Fund III-Debt, LP 2,398,874 47,600,000Rialto Mezzanine Partners Fund 59,257,084 0SM Brell II, LP 56,484,472 0Stockbridge Real Estate Fund II-C, LP 20,562,735 0Strategic LP 244,795,818 43,600,000TPG RE Finance Trust 96,145,362 4,333,381TPG RE Fund II 16,279,169 35,521,168TSP Spartan C-I LLC 7,900,351 0TSP Value and Income Fund LP 41,226,826 6,400,000Trophy Property Development LP 50,932,164 7,408,100True North High Yield Investment Fund II 22,125,169 5,000,000True North Real Estate Fund III 25,603,563 29,867,783Venture Center, LLC 41,276,544 0Western National Realty Fund II, LP 26,486,836 0
5,904,579,352$ 1,112,480,253$ Short-Term Investments and Other 16,204,763 0Total Real Estate Investments 5,920,784,115$ 1,112,480,253$
ArcLight Energy Partners Fund VI, LP 20,697,829$ 28,333,181$ ASF VI Infrastructure B LP 18,041,102 18,030,022ASF Como Co-Investment LP 36,250,149 15,565,404 Basalt Infrastructure Partners, LP 30,475,874 19,314,545 Blackstone Energy Partners, LP 51,580,676 5,047,629 Blackstone Energy Partners II, LP 4,017,464 80,001,372 Brookfield Infrastructure Fund II-B, LP 47,898,533 5,983,982Customized Infrastructure Strategies, LP 75,390,687 9,157,654 Dalmore Capital Fund 61,011,000 0First Reserve Energy Infrastructure Fund II, LP 15,753,075 62,642,234 GCM Grosvenor Infrastructure Investment Program, LP 45,437,024 0GCM Grosvenor Customized Infrastructure Strategies II, LP 5,864,883 45,438,714 GSO Energy Select Opportunities Fund LP 4,914,204 46,093,622 JP Morgan AIRRO India Sidecar Fund US, LLC 65,280,208 5,033,815 JP Morgan AIRRO Fund II US, LLC 10,836,429 83,384,246 KKR Eagle CoInvest L.P. 24,035,338 10,504,631 KKR Global Infrastructure Investors, LP 51,887,418 7,181,281StonePeak Infrastructure Fund LP 56,124,202 12,227,536
625,496,095$ 453,939,868$ Short-Term Investments and Other 17,539,489 0Total Infrastructure Investments 643,035,584$ 453,939,868$
TOTAL INVESTMENTS 6,563,819,700$ 1,566,420,121$ * New or additional commitment made during the quarter reported
INFRASTRUCTURE
7

State of Michigan Retirement Systems
BASKET CLAUSE REVIEW Investment Advisory Committee Meeting
December 15, 2016
Karen M. Stout, CPA, CGFM Administrator
Trust Accounting Division


SMRS Basket Clause Investments
9/30/16
Asset Class Value Total Absolute Return 3,966,455,203 Total Real Return and Opportunistic 943,430,827 Total International Equity 540,371,320 Total Long-Term Fixed Income 54,381,725 Total Basket Clause Investments 5,504,639,075
The basket clause investments at September 30, 2016, were $5.5 billion or 8.9% of the total portfolio value of $61.6 billion. The Public Employee Retirement System Investment Act, 1965 PA 314, MCL 38.1132 et seq, authorizes the State Treasurer to invest up to 30% of the system’s assets in investments “not otherwise qualified under the act.” MCL 38.1140d(1). Commonly referred to as Section 20d (after the authorizing section of PA 314) or Basket Clause investments, this provision gives the State Treasurer the flexibility to take advantage of market opportunities not specifically authorized in PA 314 while conserving protections against imprudent investment.


This presentation was given solely for the purpose of explaining the structure, investment process, and returns for the State of Michigan Retirement Systems. It should not be interpreted in any way as
financial advice.
Disclaimer