Embed Size (px)
Citation preview

Quarterly Investment Review
for the quarter ending
March 31, 2013
Copyright 2013 United Financial, a division of CI Private Counsel LP
2Source: United Financial

3Source: United Financial
4Source: United Financial
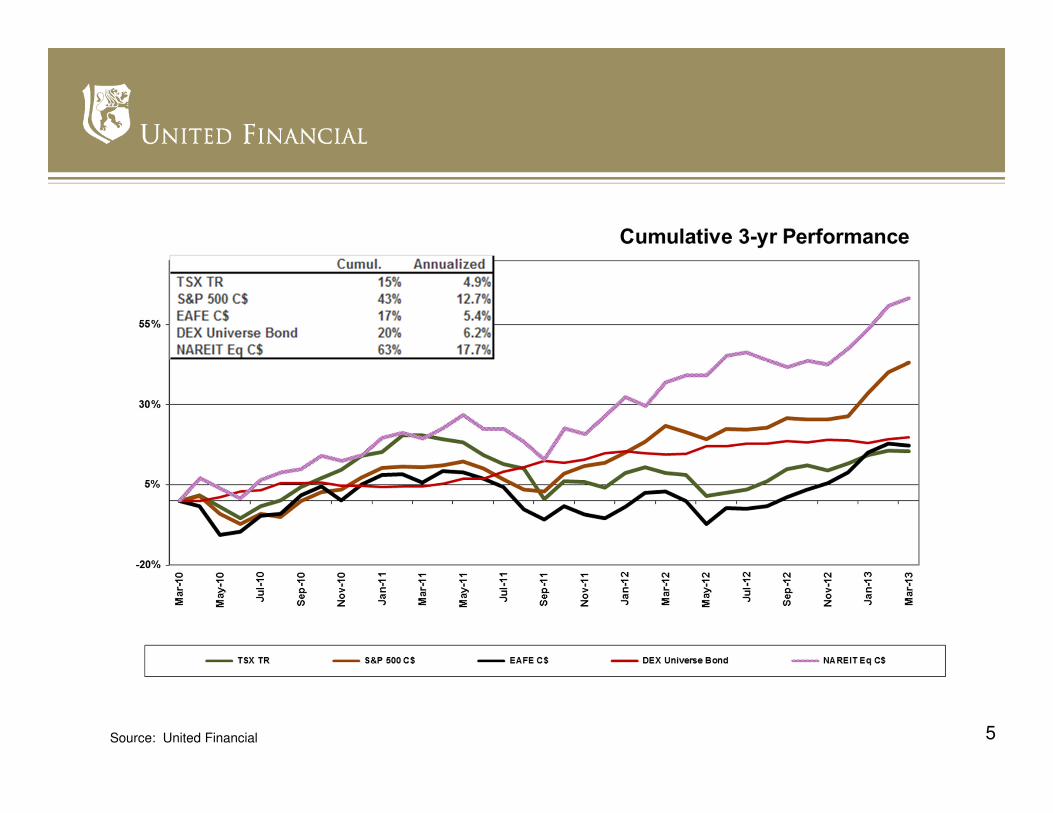
5Source: United Financial

6Source: United Financial
7
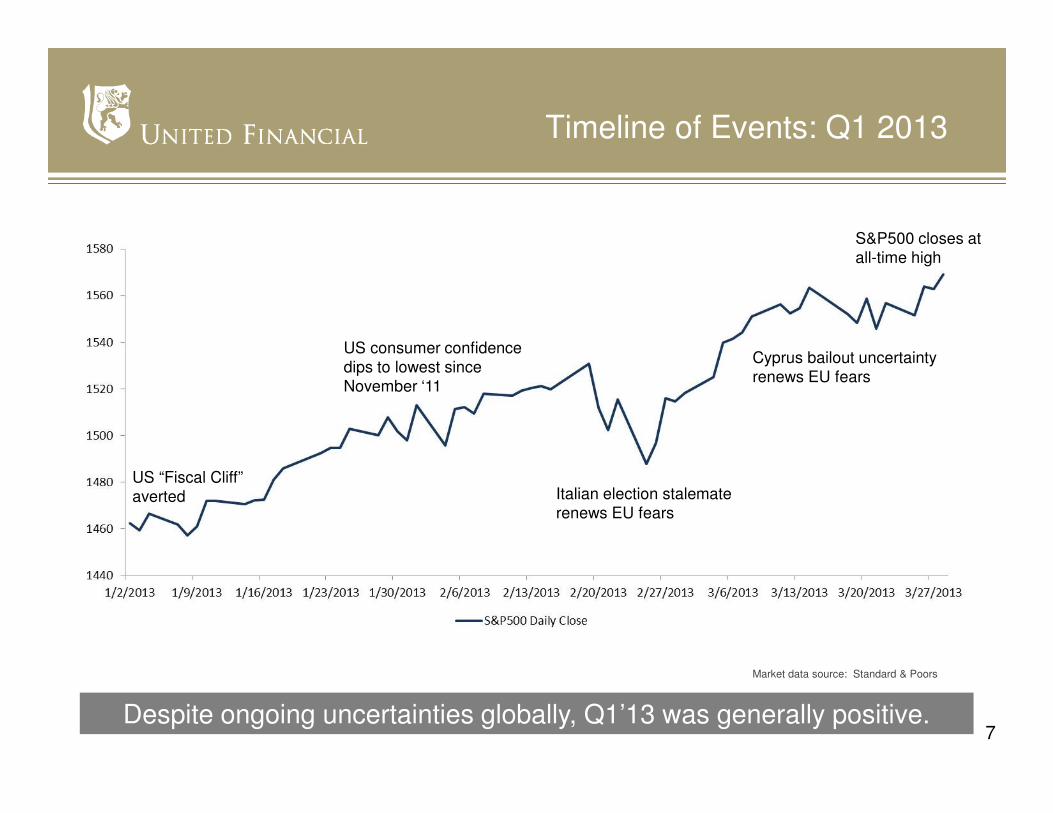
Timeline of Events: Q1 2013
Despite ongoing uncertainties globally, Q1’13 was generally positive.
Market data source: Standard & Poors
S&P500 closes at all-time high
Italian election stalemate renews EU fears
Cyprus bailout uncertainty renews EU fears
US consumer confidence dips to lowest since November ‘11
US “Fiscal Cliff” averted
8
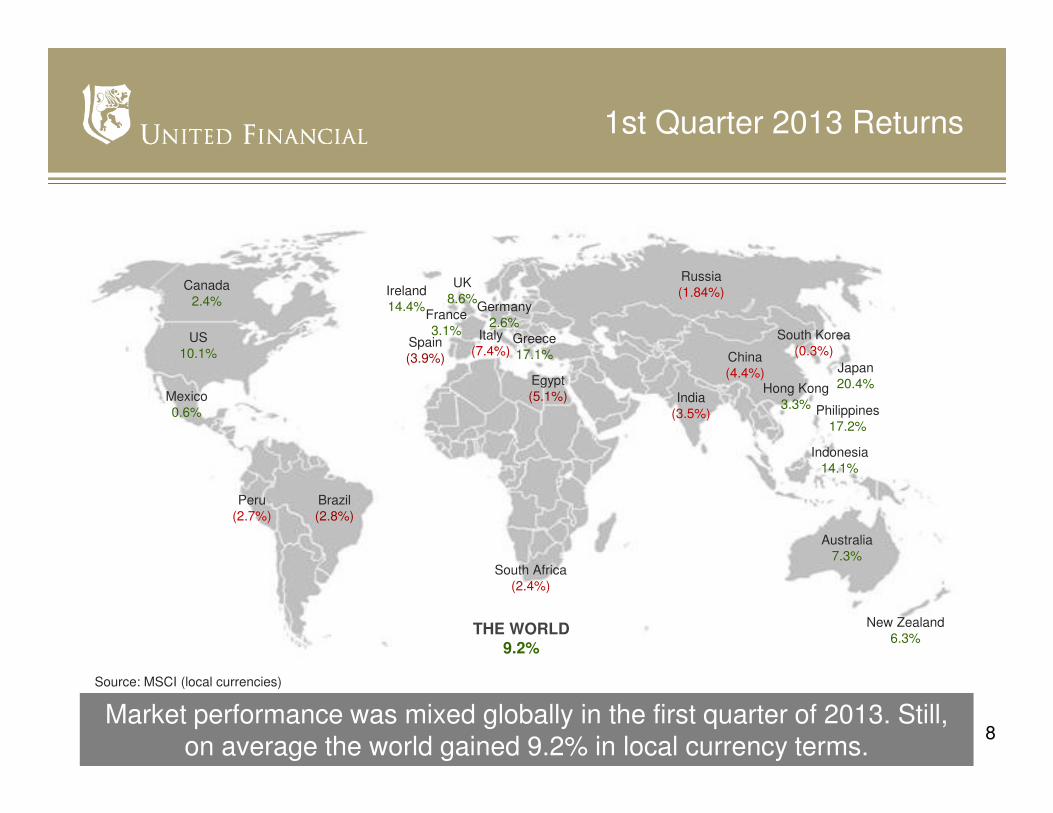
1st Quarter 2013 Returns
Market performance was mixed globally in the first quarter of 2013. Still, on average the world gained 9.2% in local currency terms.
Canada2.4%
Source: MSCI (local currencies)
US10.1%
Italy(7.4%)
India(3.5%)
Greece17.1%
Egypt(5.1%)Mexico
0.6%
Brazil(2.8%)
Russia(1.84%)
New Zealand6.3%
Australia7.3%
China(4.4%)
UK8.6%
Germany2.6%
Japan20.4%Hong Kong
3.3%
Spain(3.9%)
South Africa(2.4%)
South Korea(0.3%)
THE WORLD9.2%
France3.1%
Peru(2.7%)
Ireland14.4%
Philippines17.2%
Indonesia14.1%
9
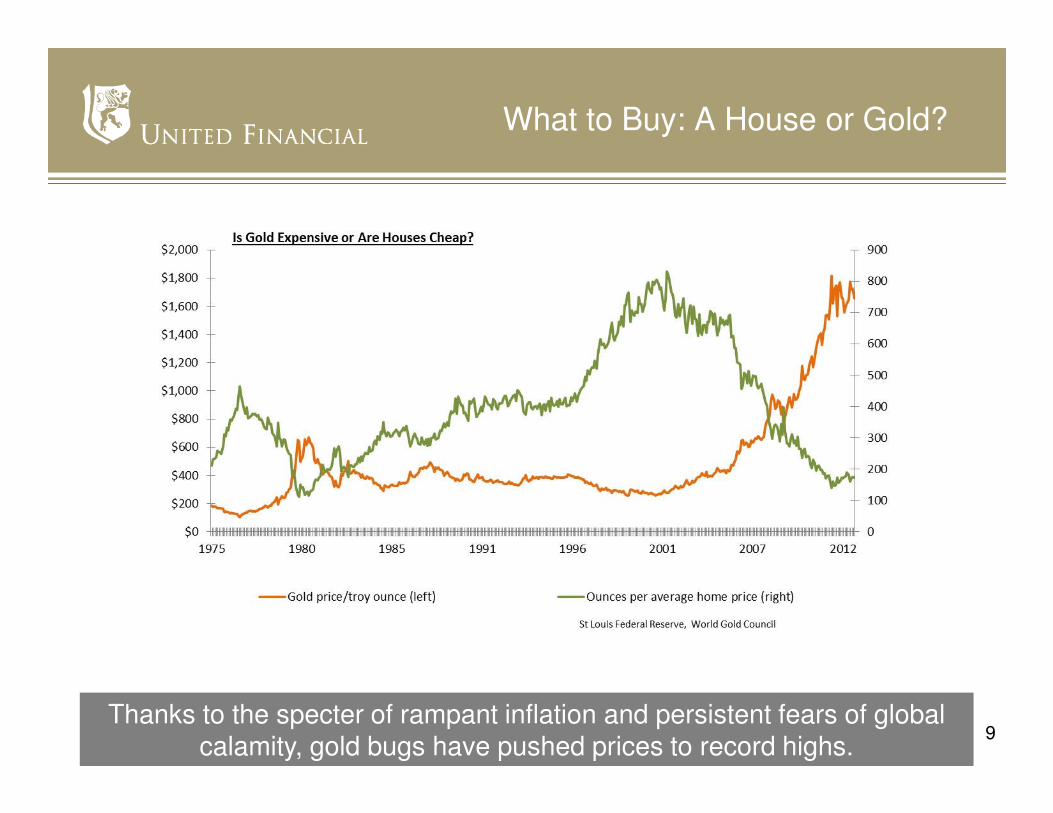
What to Buy: A House or Gold?
Thanks to the specter of rampant inflation and persistent fears of global calamity, gold bugs have pushed prices to record highs.

10
US Dividends Hit New Highs
US companies have continued their trend of either offering dividends for the first time or raising dividends to attract and retain investors.
11
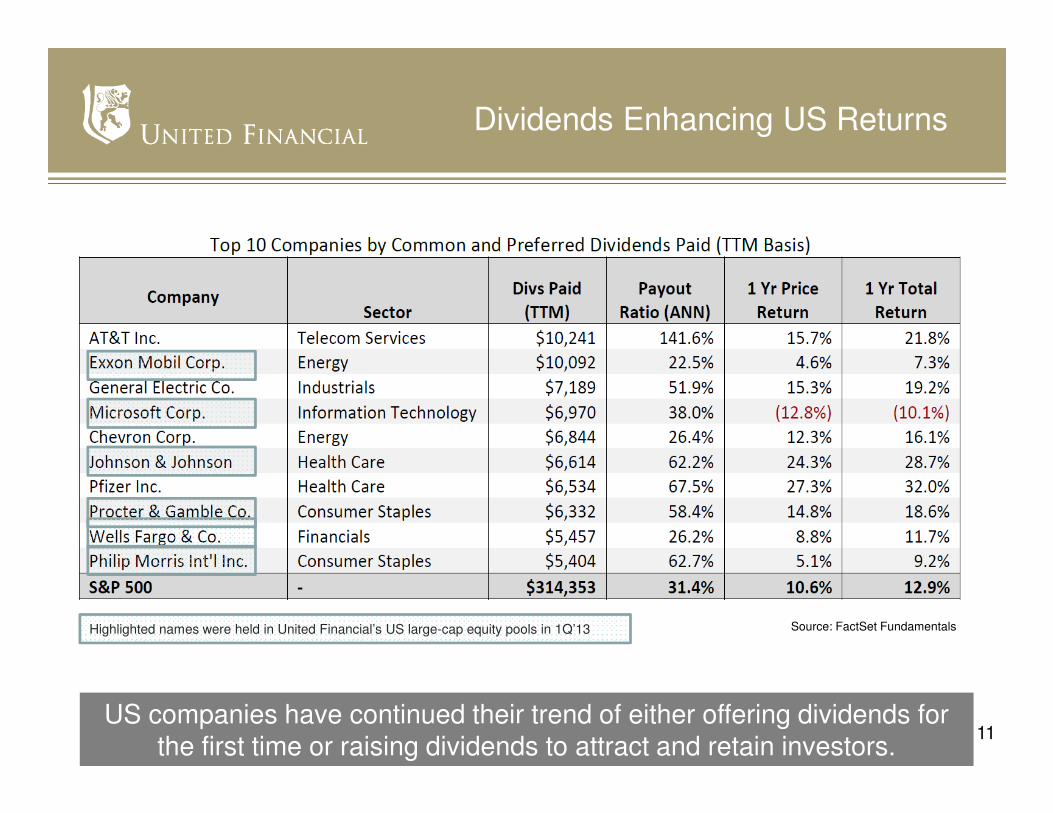
Dividends Enhancing US Returns
US companies have continued their trend of either offering dividends for the first time or raising dividends to attract and retain investors.
Highlighted names were held in United Financial’s US large-cap equity pools in 1Q’13 Source: FactSet Fundamentals

12
US Inflation: Not Happening
Despite the massive pumping of liquidity in the US since the Credit Crisis, fears of rampant inflation remain unsubstantiated.
St. Louis Federal Reserve
30-Yr Fixed Mortgage Rate (October 1981): 18.45%*
30-Yr Fixed Mortgage Rate (March 2013): 3.57%*
*Freddie Mac

13
Canada’s Confusing Economy
Those watching Canada’s economy in 1Q’13 had reasons to celebrate (income, employment) and cause for concern (housing, manufacturing).
Statistics Canada

14
Canada’s Ongoing Debt Problem
Canadian household debt to disposable income has hit a record high of 167%, while debt to GDP is approaching 95%.
Statistics Canada
15
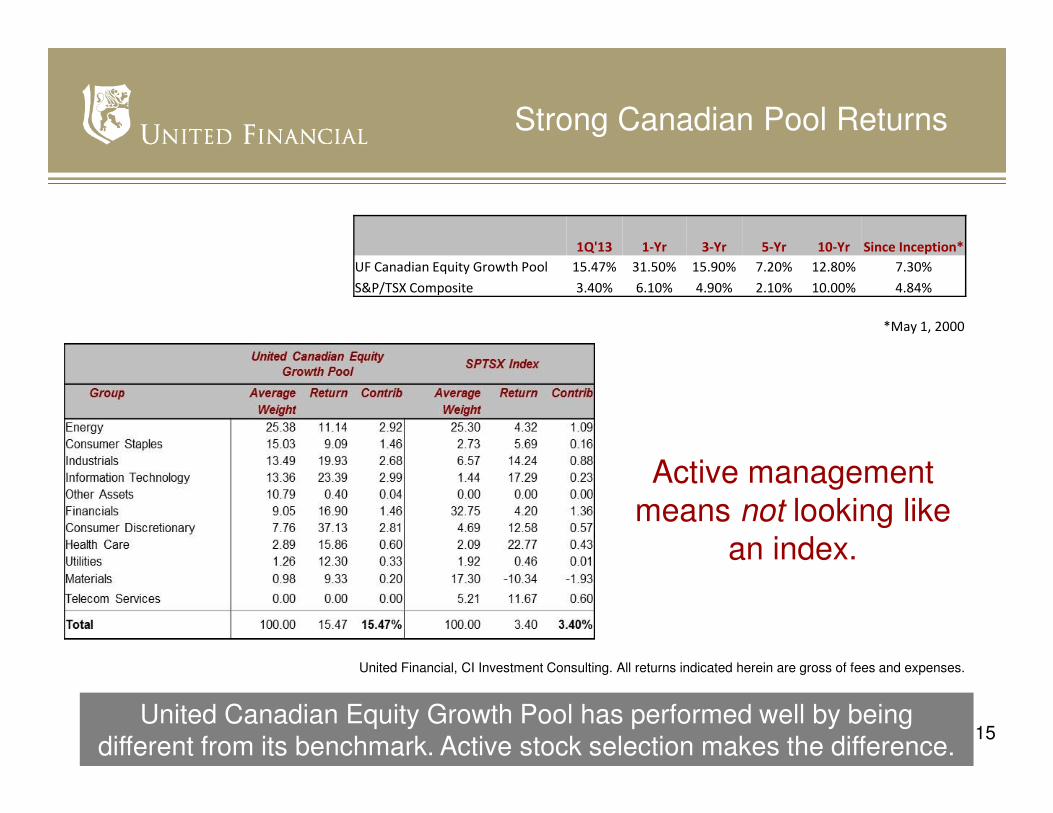
Strong Canadian Pool Returns
United Canadian Equity Growth Pool has performed well by being different from its benchmark. Active stock selection makes the difference.
United Financial, CI Investment Consulting. All returns indicated herein are gross of fees and expenses.
Active management means not looking like
an index.
1Q'13 1-Yr 3-Yr 5-Yr 10-Yr Since Inception*
UF Canadian Equity Growth Pool 15.47% 31.50% 15.90% 7.20% 12.80% 7.30%
S&P/TSX Composite 3.40% 6.10% 4.90% 2.10% 10.00% 4.84%
*May 1, 2000
16
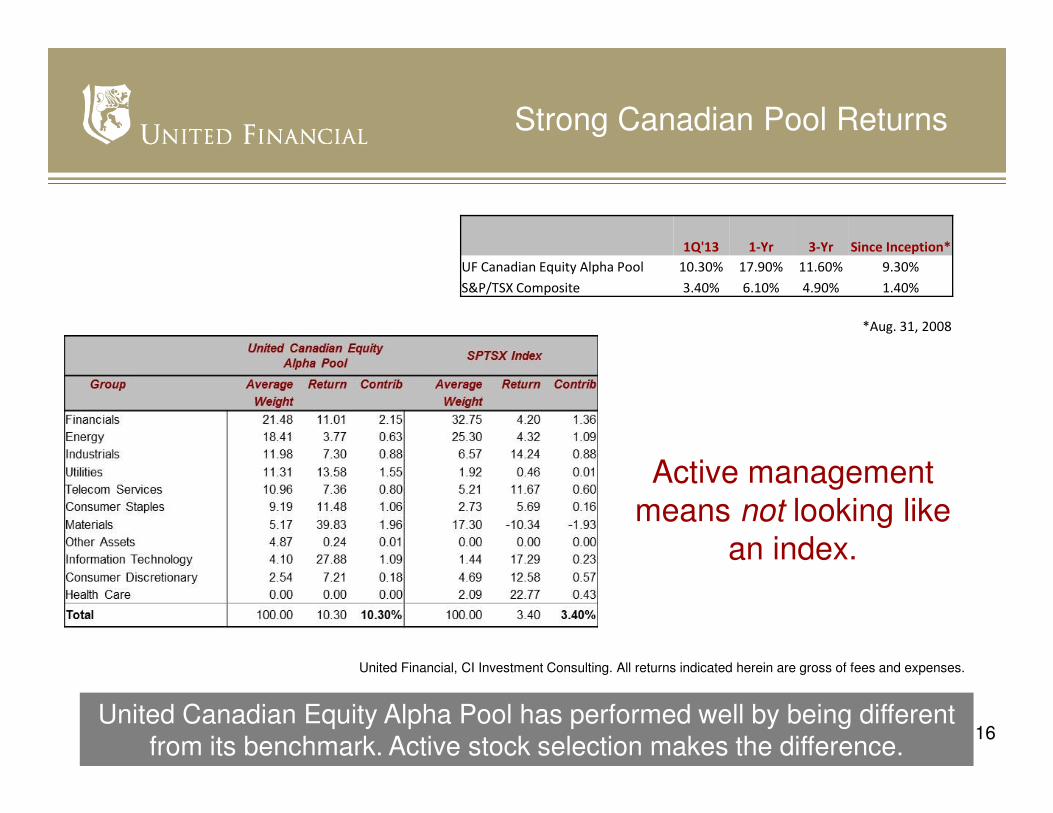
Strong Canadian Pool Returns
United Canadian Equity Alpha Pool has performed well by being different from its benchmark. Active stock selection makes the difference.
Active management means not looking like
an index.
1Q'13 1-Yr 3-Yr Since Inception*
UF Canadian Equity Alpha Pool 10.30% 17.90% 11.60% 9.30%
S&P/TSX Composite 3.40% 6.10% 4.90% 1.40%
*Aug. 31, 2008
United Financial, CI Investment Consulting. All returns indicated herein are gross of fees and expenses.
17
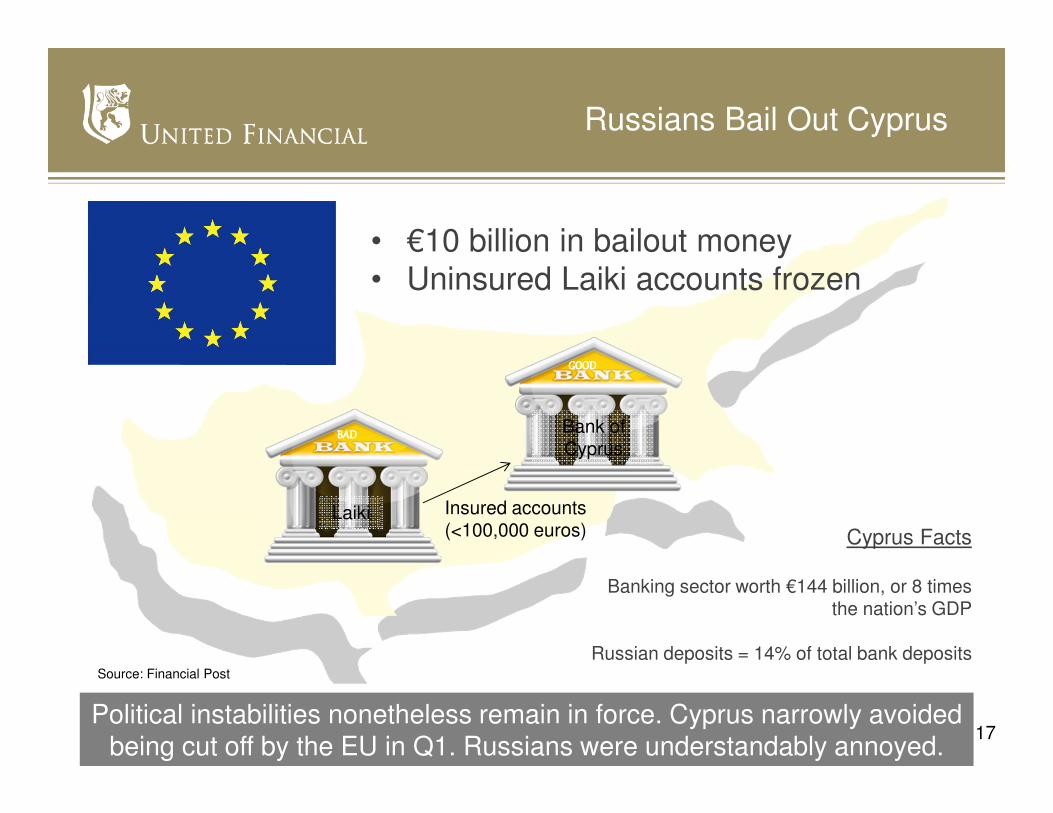
Russians Bail Out Cyprus
Political instabilities nonetheless remain in force. Cyprus narrowly avoided being cut off by the EU in Q1. Russians were understandably annoyed.
Source: Financial Post
BADBADBADBAD
GOODGOODGOODGOOD
Insured accounts (<100,000 euros)
Laiki
Bank of Cyprus
• €10 billion in bailout money• Uninsured Laiki accounts frozen
Cyprus Facts
Banking sector worth €144 billion, or 8 times the nation’s GDP
Russian deposits = 14% of total bank deposits
18
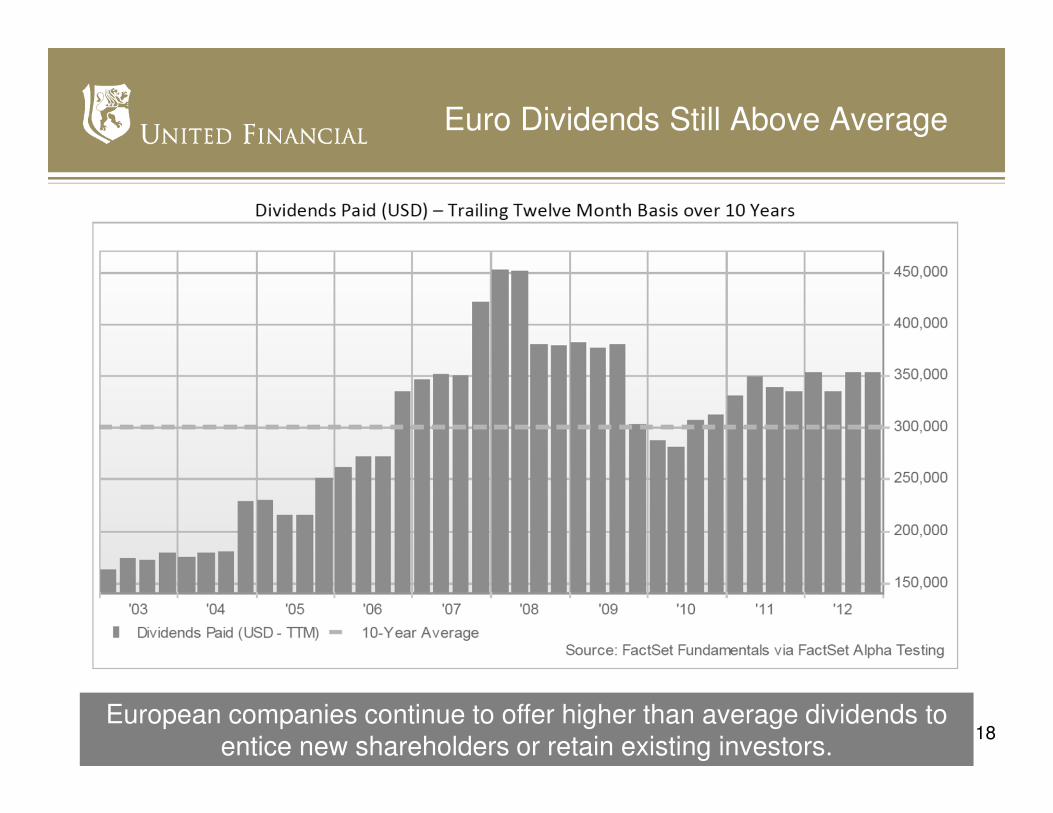
Euro Dividends Still Above Average
European companies continue to offer higher than average dividends to entice new shareholders or retain existing investors.

19
Euro Dividends Enhancing Returns
European companies continue to offer attractive dividends to investors scared by ongoing economic instability in the region.
Highlighted names were held in United Financial’s International Equity pools in 1Q’13

20
The World’s Changed
Thanks to the heightened market volatility since the new century began, attempts to time one’s way in and out of the markets have become riskier.
Standard & Poors, United Financial
21
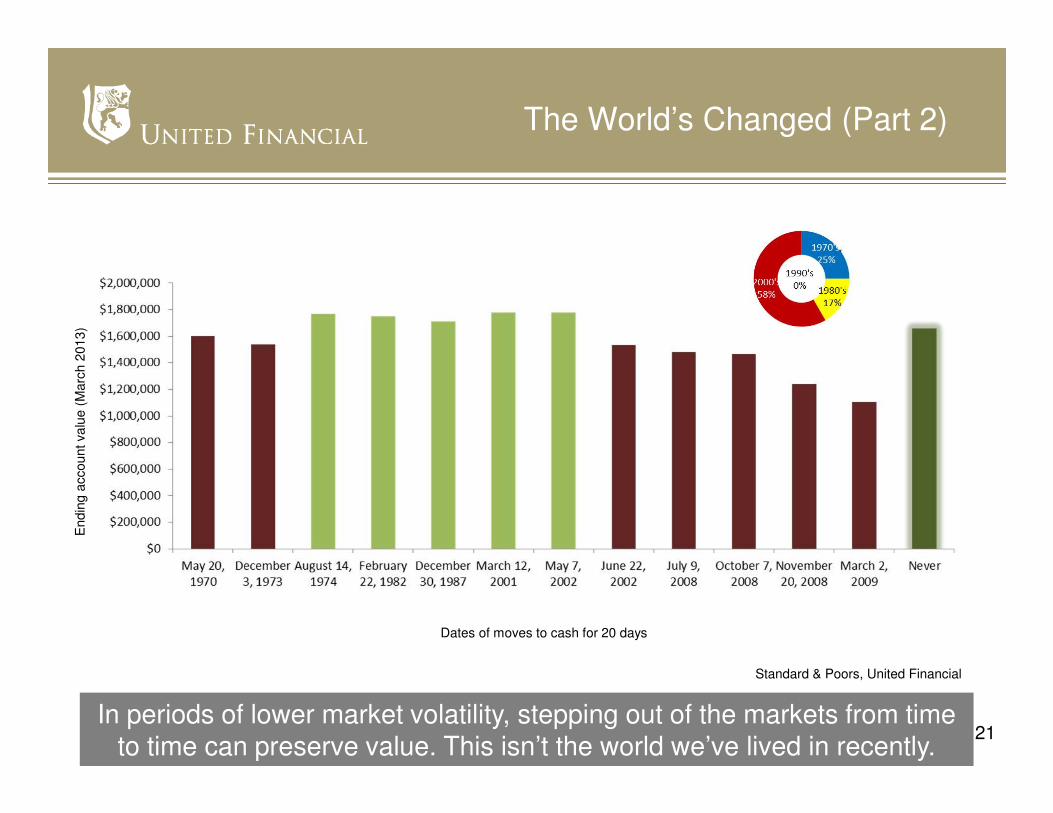
The World’s Changed (Part 2)
In periods of lower market volatility, stepping out of the markets from time to time can preserve value. This isn’t the world we’ve lived in recently.
Standard & Poors, United Financial
Dates of moves to cash for 20 days
Endin
g a
ccount va
lue (
Marc
h 2
013)

22
Volatility’s On the Wane, For Now
Market volatility is down from its highs of just a few years ago, but for how long no one knows.
Source: Standard & Poors, United Financial

23
The Near-Certain Way to Losses
Index funds and ETFs alone offer the return of the underlying asset, minus costs, and none of the other services required for financial security.
LAST
Basic Service Provided Annual Cost BenefitOpportunity to Outperform The
Market
Index-tracking 0.46% Client gets index performance minus costs NONE
Additional Services Available
"Do It Yourself" Advisor-serviced Portfolio For Private Client
Quarterly meetings none subject to advisor availability/expertise INCLUDED
Rebalancing to target none subject to advisor availability/expertise INCLUDED
Asset mix suitability review none subject to advisor availability/expertise INCLUDED
Tactical shifts none subject to advisor availability/expertise INCLUDED
Fund addition/replacement none subject to advisor availability/expertise INCLUDED
Currency management none subject to advisor availability/expertise INCLUDED
Strategic tax planning none subject to advisor availability/expertise INCLUDED
Other tax services none subject to advisor availability/expertise INCLUDED
Insurance services none subject to advisor availability/expertise INCLUDED
Estate planning none subject to advisor availability/expertise INCLUDED
Asset Class
Weight
(1) Product Used (2)
Tracking
Error (3)
Tracking
Error By
Weight
Management
Fee (3)
Management
Fee by Weight
Non-managed
Cost
Cost to
Manage (4)
Total
Cost
Total Cost For
Private Client (5)
Canadian Short Term Income 0% DEX Short Term Bond Index Fund 0.31% 0.00% 0.25% 0.00% 0.00%
Canadian Fixed Income 21% DEX Universe Bond Index Fund 0.39% 0.08% 0.30% 0.06% 0.14%
Global Fixed Income 6% U.S. IG Corporate Bond Index Fund 0.11% 0.01% 0.30% 0.02% 0.02%
Enhanced Income 6% DEX HYBrid Bond Index Fund 0.05% 0.00% 0.45% 0.03% 0.03%
Canadian Large Cap 18% S&P/TSX 60 Index Fund 0.19% 0.03% 0.17% 0.03% 0.06%
Canadian Small Cap 4% S&P/TSX SmallCap Index Fund 0.29% 0.01% 0.55% 0.02% 0.03%
US Large Cap 17% Core S&P Total U.S. Stock Market ETF 0.18% 0.03% 0.07% 0.01% 0.04%
US Small Cap 3% Morningstar Small-Cap ETF 0.20% 0.01% 0.25% 0.01% 0.01%
International Large Cap 15% Core MSCI Total International Stock ETF 0.03% 0.00% 0.16% 0.02% 0.03%
Emerging Markets 3% MSCI Emerging Markets ETF 0.41% 0.01% 0.69% 0.02% 0.03%
Global Real Estate Investments 7% International Property ETF 0.13% 0.01% 0.48% 0.03% 0.04%
Total 100% 0.20% 0.26% 0.46% 1.00% 1.46% 1.96%
Managed ETF Portfolio Fee (negotiable): 1%
3. Source: www.iShares.ca
1. Typical weighting for a moderately aggressive balanced portfolio 4. For illustration purposes only; advisor could charge more or less, depending upon the level of service provided
2. All products selected are offered by iShares 5. Assumes $1,000,000 investment with 30% discretion applied

24
Fixed Income: Risk-adjusted Returns
United Fixed Income pools have performed strongly over the past 3 years, offering higher returns (vertical axis) and less volatility (horizontal axis)
Source: United Financial3-Year Standard Deviation
3-Y
ea
r A
nn
ua
lize
d R
etu
rn
United Financial Enhanced Income Pool
Canadian Bond Benchmark**
United Financial Canadian Fixed Income Pool
United Financial Global Fixed Income Pool
Global Fixed Income Benchmark***
Enhanced Income Benchmark*
1-Yr % 3-Yr % 5-Yr % 10-Yr %3-Year
Sharpe Ratio
United Canadian Fixed Income 5.8 6.8 6.0 6.0 2.39
Canadian Bond Benchmark 4.5 6.4 5.9 6.1 1.73
United Global Fixed Income 4.1 5.2 4.9 2.8 0.75
Global Bond Benchmark 1.2 4.1 2.7 1.7 0.32
United Enhanced Income 13.1 12.3 8.8 n/a 2.24
Enhanced Income Benchmark 10.2 12.0 10.2 n/a 1.76
*60% DEX ST Bond Index, 40% DEX 91 Day T-Bills Index**DEX Universe Bond Index***JP Morgan Global Gov’t Bond Index

25
Alpha Pools Outperform
Alpha Pools offer equity investors the opportunity to not only match the performance of benchmark but beat it without taking on undue risk.
26
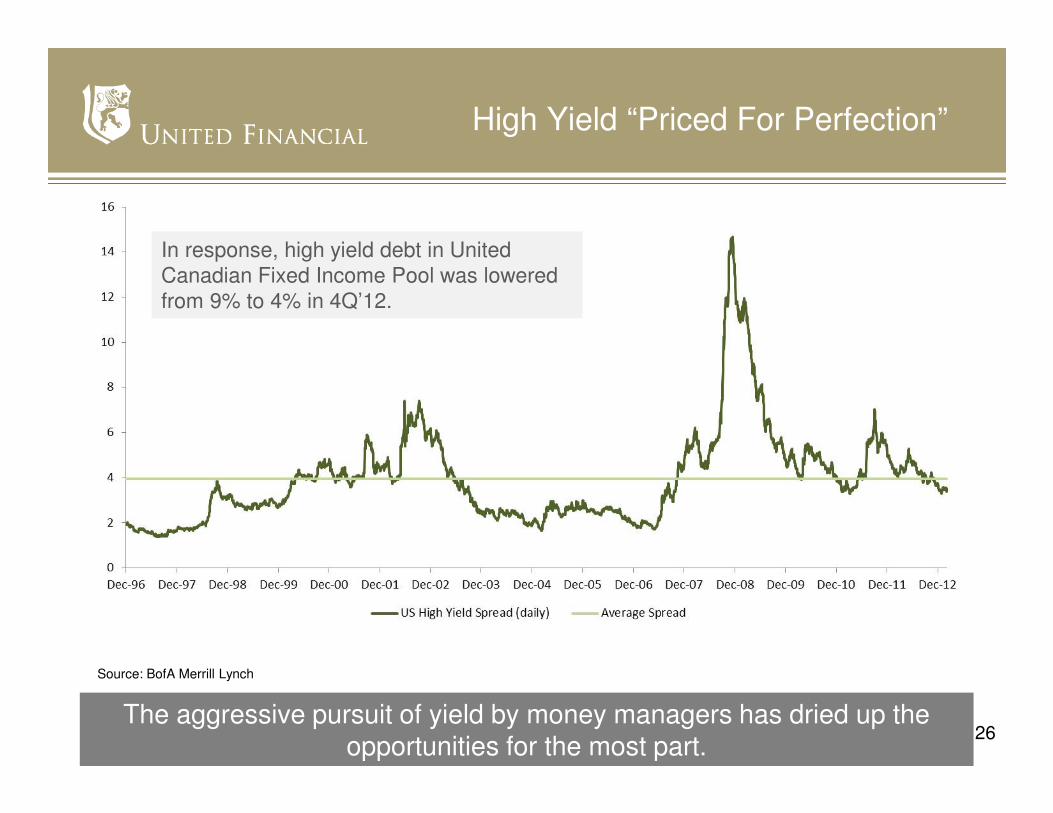
High Yield “Priced For Perfection”
The aggressive pursuit of yield by money managers has dried up the opportunities for the most part.
Source: BofA Merrill Lynch
In response, high yield debt in United Canadian Fixed Income Pool was lowered from 9% to 4% in 4Q’12.

27
High Yield Exposure
Our exposure to high yield fixed income products has fallen, in advance of a mass exodus, as opportunities appear to be drying up.
Source: CI Investment Consulting
High yield (BB, B) represents approximately 6% of our total exposure in United Canadian Fixed Income Pool
Investment-grade remains our top priority
Note also our small exposure (2%) to AAA-rated government debt, which remains expensive
High Yield
United Canadian Fixed Income Pool
28
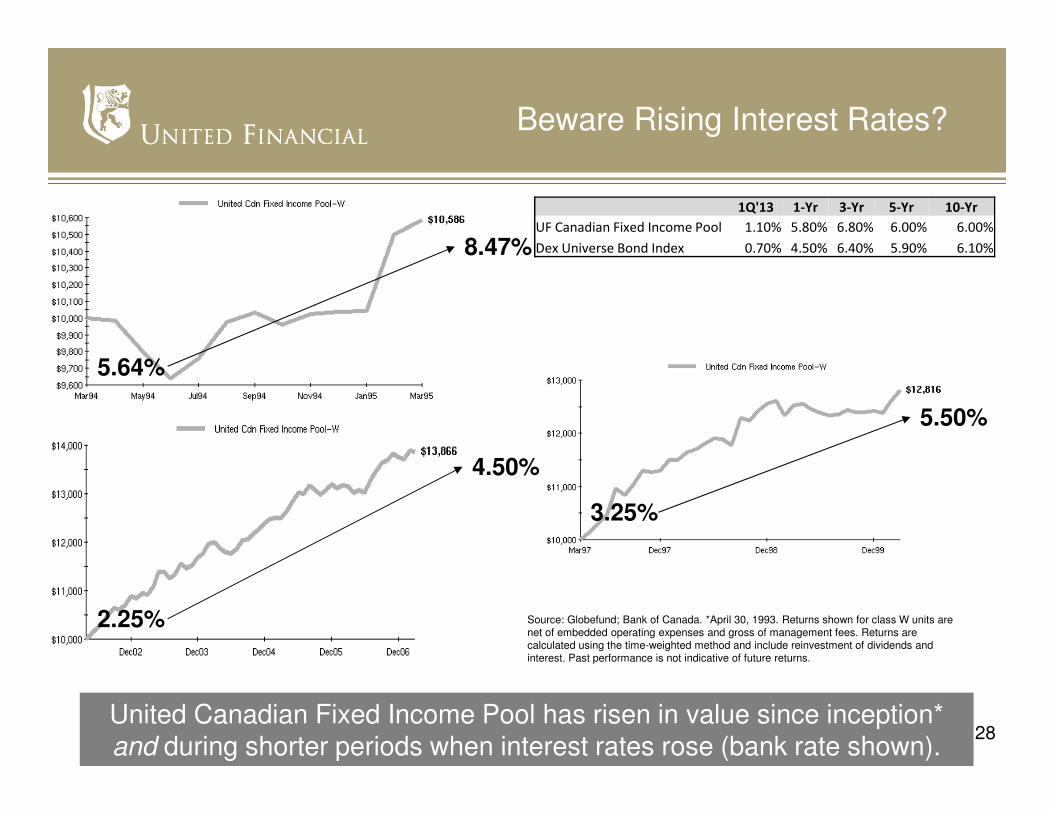
Beware Rising Interest Rates?
United Canadian Fixed Income Pool has risen in value since inception* and during shorter periods when interest rates rose (bank rate shown).
5.64%
8.47%
3.25%
5.50%
2.25%
4.50%
Source: Globefund; Bank of Canada. *April 30, 1993. Returns shown for class W units are net of embedded operating expenses and gross of management fees. Returns are calculated using the time-weighted method and include reinvestment of dividends and interest. Past performance is not indicative of future returns.
1Q'13 1-Yr 3-Yr 5-Yr 10-Yr
UF Canadian Fixed Income Pool 1.10% 5.80% 6.80% 6.00% 6.00%
Dex Universe Bond Index 0.70% 4.50% 6.40% 5.90% 6.10%

29
What’s Working For You
Our disciplined process has added considerable value to investors.
Features of Private Client Benefits to Clients
Currency hedgeSince inception: $124 million or an estimated $11,041 per average Private Client*; Euro & Yen also hedged tactically for further volatility reduction
Asset mix monitoringQuarterly reviews with State Street Global Advisors confirm portfolio optimization
Tactical weighting & security selectionBeing overweight US, underweight Canada benefited Private Clients versus no tilt; 14 of 18 United Pools outperformed their benches by an average of 4.8% in 2012
Tactical adjustments4Q’12 addition of high yield bonds and Lawrence Park Capital Partners alternative investment product to Canadian Fixed Income Pool keeps risk within acceptable levels
Corporate class poolsIn 2012, 75% of corporate class pools in Private Client distributed eligible Canadian dividend income of less than 1% of asset value; the remainder distributed less than 1.6%
*Average Private Client = $1,000,000 invested with 20% US equity exposure. Estimate based on current market value of Private Client-held assets

30
Yield & Duration
Many of the United Financial pools continue to offer a dividend yield that is greater than that of a Gov’t Benchmark 10-year bond (1.87%).
Fund Name Yield (%) Effective Duration
United-Cash Management Pool Class W 1.4 0.1
United-Short Term Income Pool Class W 1.6 2.6
United-Canadian Fixed Income Pool Class W 2.8 5.7
United-Global Fixed Income Pool Class W 2.1 5.1
United-Canadian Equity Value Pool Class W 2.6
United-Canadian Equity Growth Pool Class W 1.1
United-Canadian Equity Small Cap Pool Class W 2.5
United-US Equity Value Pool Class W 2.0
United-US Equity Growth Pool Class W 1.3
United-US Equity Small Cap Pool Class W 1.3
United-International Equity Value Pool Class W 2.8
United-International Equity Growth Pool Class W 2.1
United-Real Estate Investment Pool Class W 3.2
United-Enhanced Income Pool Class W 5.4 3.4
United-Emerging Markets Equity Pool Class W 2.0
United - Canadian Equity Alpha Pool 2.6
United - US Equity Alpha Pool 1.9
United - International Equity Alpha Pool 2.2
Source: Wilshire Atlas, Axiom
* Dividend Yields provided for Equity Pools
* Effective Duration measured for Income Only portion of Pools
Data
here
in is for
the q
uart
er
ended M
arc
h 3
1,
2013
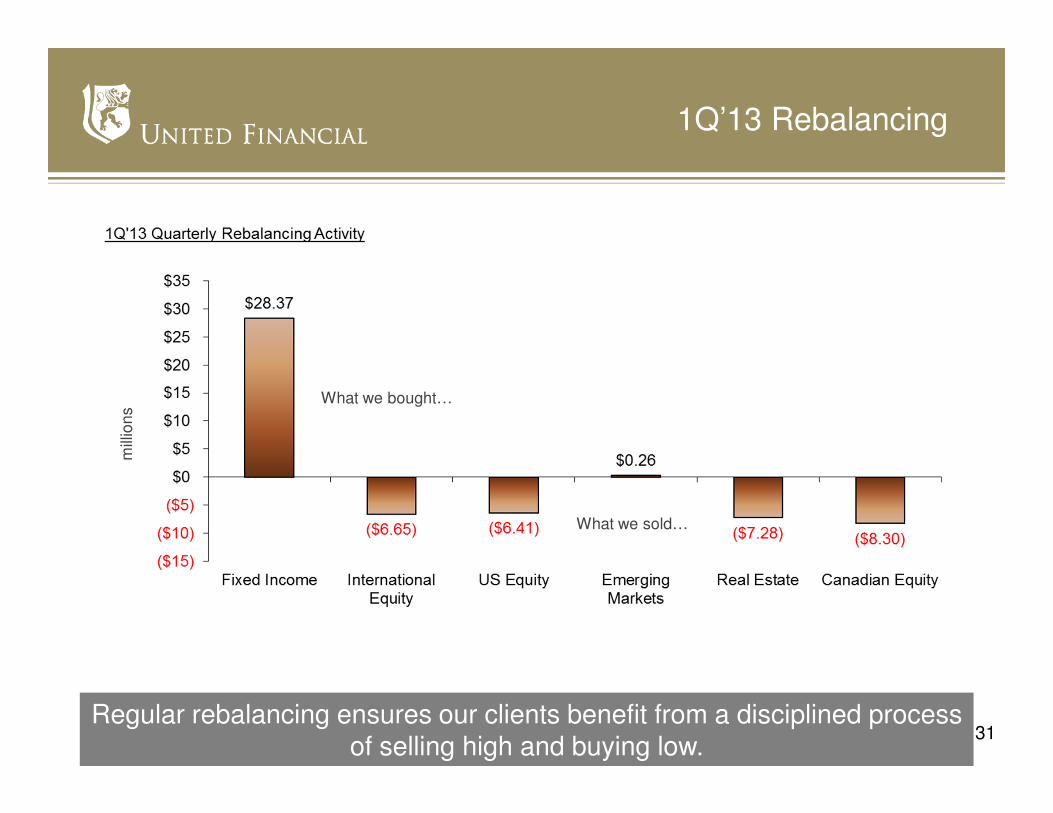
31
1Q’13 Rebalancing
Regular rebalancing ensures our clients benefit from a disciplined process of selling high and buying low.
mill
ion
s
What we bought…
What we sold…
32
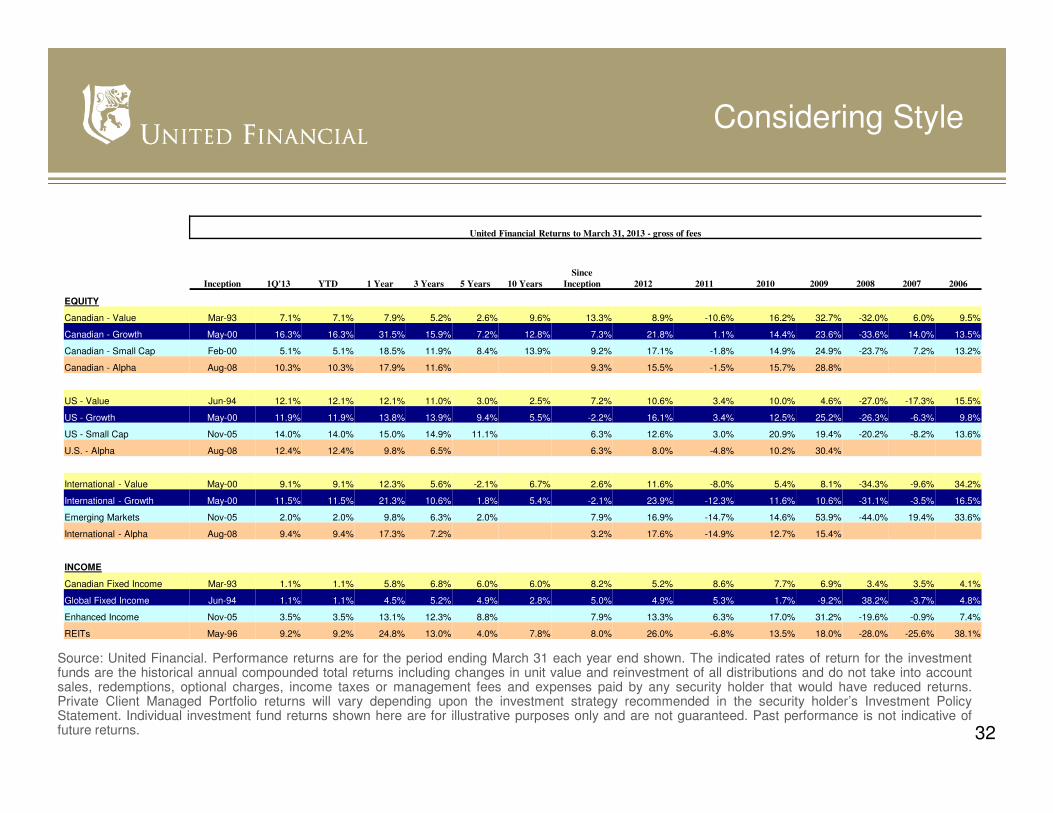
Considering Style
Source: United Financial. Performance returns are for the period ending March 31 each year end shown. The indicated rates of return for the investmentfunds are the historical annual compounded total returns including changes in unit value and reinvestment of all distributions and do not take into accountsales, redemptions, optional charges, income taxes or management fees and expenses paid by any security holder that would have reduced returns.Private Client Managed Portfolio returns will vary depending upon the investment strategy recommended in the security holder’s Investment PolicyStatement. Individual investment fund returns shown here are for illustrative purposes only and are not guaranteed. Past performance is not indicative offuture returns.
United Financial Returns to March 31, 2013 - gross of fees
Inception 1Q'13 YTD 1 Year 3 Years 5 Years 10 Years
Since
Inception 2012 2011 2010 2009 2008 2007 2006
EQUITY
Canadian - Value Mar-93 7.1% 7.1% 7.9% 5.2% 2.6% 9.6% 13.3% 8.9% -10.6% 16.2% 32.7% -32.0% 6.0% 9.5%
Canadian - Growth May-00 16.3% 16.3% 31.5% 15.9% 7.2% 12.8% 7.3% 21.8% 1.1% 14.4% 23.6% -33.6% 14.0% 13.5%
Canadian - Small Cap Feb-00 5.1% 5.1% 18.5% 11.9% 8.4% 13.9% 9.2% 17.1% -1.8% 14.9% 24.9% -23.7% 7.2% 13.2%
Canadian - Alpha Aug-08 10.3% 10.3% 17.9% 11.6% 9.3% 15.5% -1.5% 15.7% 28.8%
US - Value Jun-94 12.1% 12.1% 12.1% 11.0% 3.0% 2.5% 7.2% 10.6% 3.4% 10.0% 4.6% -27.0% -17.3% 15.5%
US - Growth May-00 11.9% 11.9% 13.8% 13.9% 9.4% 5.5% -2.2% 16.1% 3.4% 12.5% 25.2% -26.3% -6.3% 9.8%
US - Small Cap Nov-05 14.0% 14.0% 15.0% 14.9% 11.1% 6.3% 12.6% 3.0% 20.9% 19.4% -20.2% -8.2% 13.6%
U.S. - Alpha Aug-08 12.4% 12.4% 9.8% 6.5% 6.3% 8.0% -4.8% 10.2% 30.4%
International - Value May-00 9.1% 9.1% 12.3% 5.6% -2.1% 6.7% 2.6% 11.6% -8.0% 5.4% 8.1% -34.3% -9.6% 34.2%
International - Growth May-00 11.5% 11.5% 21.3% 10.6% 1.8% 5.4% -2.1% 23.9% -12.3% 11.6% 10.6% -31.1% -3.5% 16.5%
Emerging Markets Nov-05 2.0% 2.0% 9.8% 6.3% 2.0% 7.9% 16.9% -14.7% 14.6% 53.9% -44.0% 19.4% 33.6%
International - Alpha Aug-08 9.4% 9.4% 17.3% 7.2% 3.2% 17.6% -14.9% 12.7% 15.4%
INCOME
Canadian Fixed Income Mar-93 1.1% 1.1% 5.8% 6.8% 6.0% 6.0% 8.2% 5.2% 8.6% 7.7% 6.9% 3.4% 3.5% 4.1%
Global Fixed Income Jun-94 1.1% 1.1% 4.5% 5.2% 4.9% 2.8% 5.0% 4.9% 5.3% 1.7% -9.2% 38.2% -3.7% 4.8%
Enhanced Income Nov-05 3.5% 3.5% 13.1% 12.3% 8.8% 7.9% 13.3% 6.3% 17.0% 31.2% -19.6% -0.9% 7.4%
REITs May-96 9.2% 9.2% 24.8% 13.0% 4.0% 7.8% 8.0% 26.0% -6.8% 13.5% 18.0% -28.0% -25.6% 38.1%

33
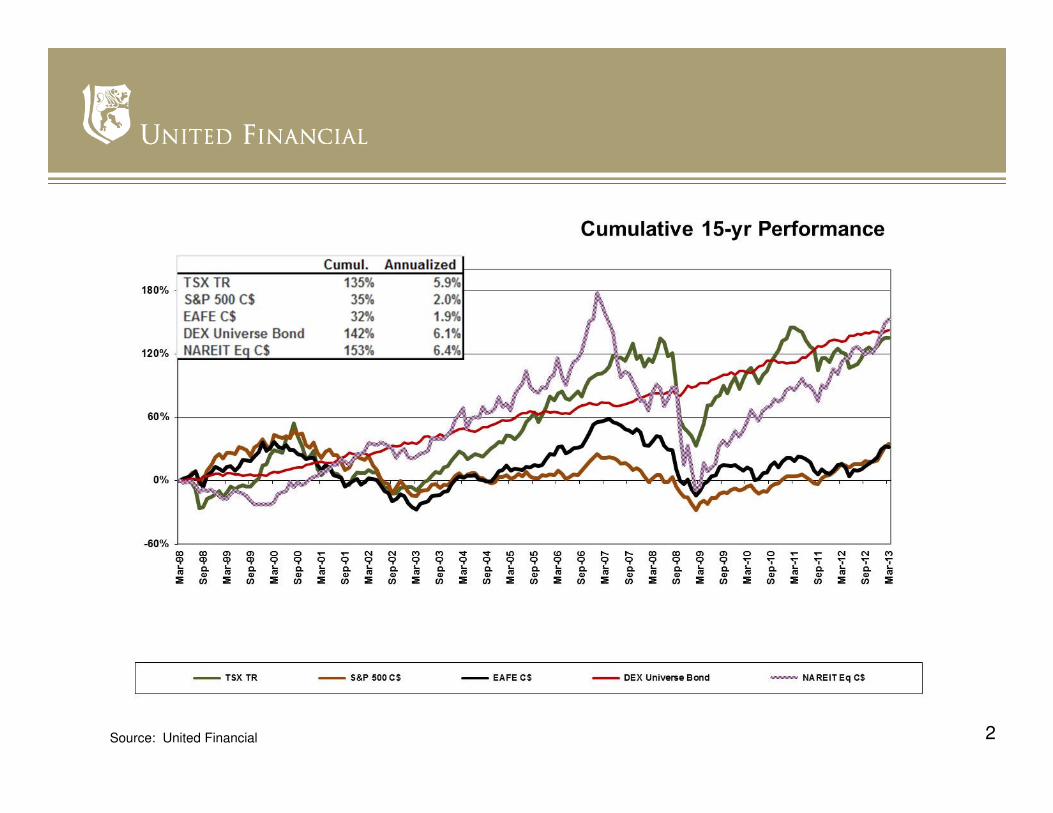
The Long-Term View
Source: United Financial
All asset classes create wealth over time.
Annualized (1972-12/2012)
Return Std Dev
SC ST Bond 8.4% 3.7%
SC Univ Bond 8.8% 6.4%
Citigroup Wld Gvt Bd $C 8.0% 8.6%
S&P/TSX TR 9.7% 16.3%
S&P 500 TR $C 10.0% 14.4%
EAFE $C 9.7% 16.0%
NAREIT Eq $C 11.7% 16.1%
Inflation 4.4%
34
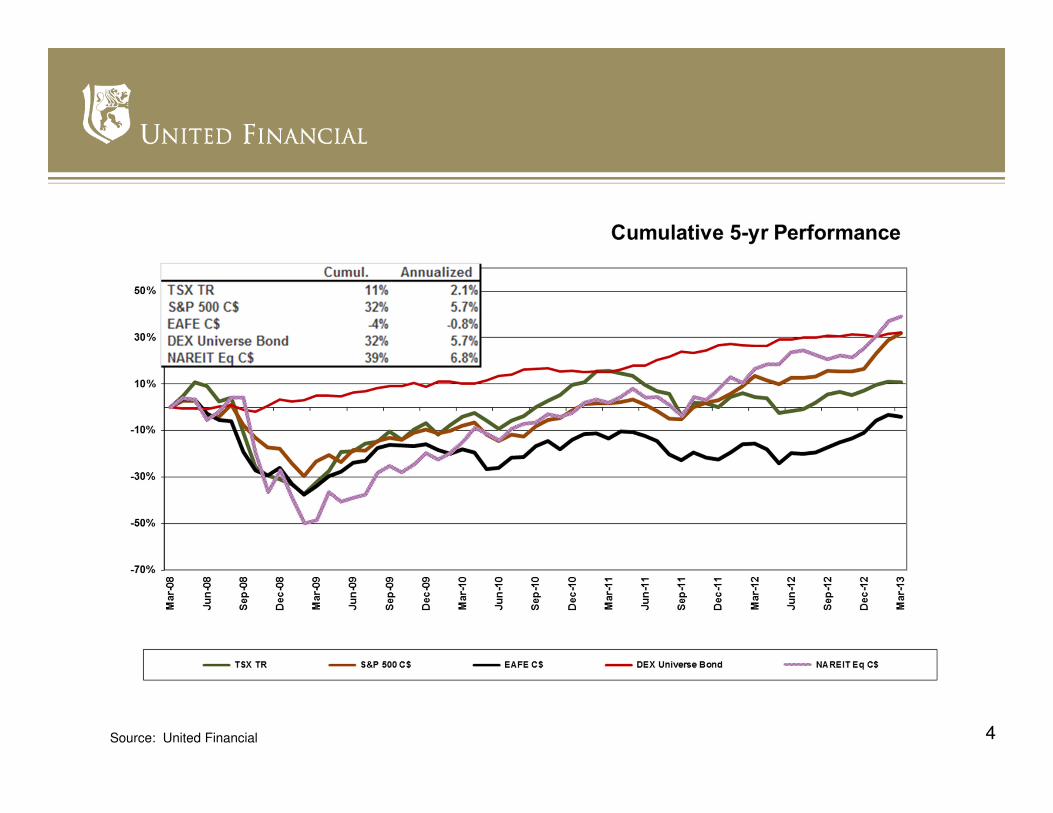
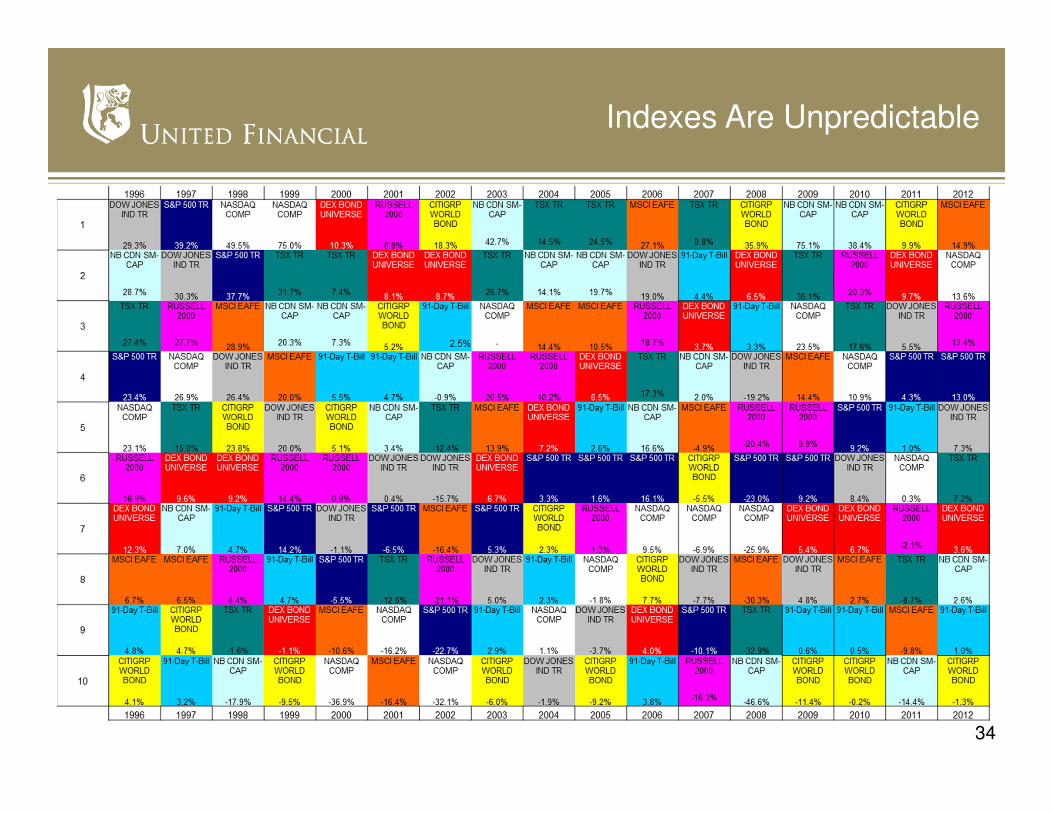
Indexes Are Unpredictable
35
Information contained is this presentation is compiled from sources believed to be reliable as at the date indicated, we cannot guarantee its accuracy or completeness. The information is provided solely for informational and educational purposes and is not to be construed as advice in respect of securities or as to the investing in or buying or selling of securities, whether express or implied. All data provided is subject to change without notice. Neither United Financial or any of its affiliates or their respective officers, directors, employees or advisors are responsible in any way for damages or losses of any kind whatsoever in respect of the use of this information. The rates of return for model portfolios contained in this presentation are provided for illustrative purposes only and will vary from actual client portfolio returns depending on a number of factors including each investor’s personal investment profile, investment time horizon and fees and expenses charged.
This presentation may contain forward-looking statements about the markets, model portfolios, pool funds, future performance, strategies or prospects, and possible future pool action. The words “may,” “could,” “should,” “would,” “suspect,” “outlook,” “believe,” “plan,” “anticipate,” “estimate,” “expect,” “intend,” “forecast,” “objective,” and similar expressions are intended to identify forward-looking statements. Forward-looking statements are not guarantees of future performance. Forward-looking statements involve inherent risks and uncertainties, both about the portfolios, pools and general economic factors, so it is possible that predictions, forecasts, projections and other forward-looking statements will not be achieved. We caution you not to place undue reliance on these statements as a number of important factors could cause actual events or results to differ materially from those expressed or implied in any forward-looking statement made by the pool or investment manager. These factors include, but are not limited to, general economic, political and market factors in Canada, the United States and internationally, interest and foreign exchanges rates, global equity and capital markets, business competition, technological changes, changes in laws and regulations, judicial or regulatory judgments, legal proceedings and catastrophic events. The above list of important factors that may affect future results is not exhaustive. Before making any investment decisions, we encourage you to consider these and other factors carefully. All opinions contained in forward-looking statements are subject to change without notice and are provided in good faith but without legal responsibility.
Management fees and expenses, may all be associated with pool fund investments and the managed portfolios. Pool funds are not guaranteed, their values change frequently and past performance may not be repeated. Please read the prospectus and consult your Advisor before investing. United Financial solutions are managed by CI Investments Inc. Assante Wealth Management and CI Private Counsel LP are wholly owned subsidiaries of CI Financial Corp. (TSX:CIX).
Copyright 2013 United Financial, a division of CI Private Counsel LP.