Embed Size (px)
Citation preview


QUARTERLY ECONOMIC QUARTERLY ECONOMIC QUARTERLY ECONOMIC QUARTERLY ECONOMIC
REVIEWREVIEWREVIEWREVIEW
JUNEJUNEJUNEJUNE 2013201320132013
Reserve Bank of Vanuatu
VOL: 2 2013

Issued by the Research & Statistics Department
Reserve Bank of Vanuatu
Private Mail Bag 9062
Emile Mercet Street
Port Vila
Vanuatu
South West Pacific
Tel: (678) 23333 / 23110
Swift: RBVA VUVU
Fax: (678) 24231
E-mail: [email protected]/[email protected]
E-mail: Website: http://www.rbv.gov.vu

QUARTERLY ECONOMIC REVIEW JUNE 2013
1
TABLE OF CONTENTS PAGE NO REFERENCE 2 STATISTICAL ANNEX 5 TECHNICAL NOTES 7 1.0 EXECUTIVE SUMMARY 8-9 2.0 THE INTERNATIONAL ECONOMY 10 3.0 DOMESTIC ECONOMIC DEVELOPMENTS 13 3.1 REAL ECONOMY 13 3.2 FISCAL OPERATIONS 20 3.3 MONETARY DEVELOPMENTS 23 3.4 MONEY MARKET DEVELOPMENTS 26 3.5 BANKING SECTOR DEVELOPMENTS 27 3.6 INSURANCE SECTOR DEVELOPMENTS 31 3.7 BALANCE OF PAYMENTS 34 3.8 EXCHANGE RATE DEVELOPMENTS 36 CHRONOLOGY OF MAJOR EVENTS 38 ANNEX TABLES 41-96

QUARTERLY ECONOMIC REVIEW JUNE 2013
2
REFERENCE The following articles have appeared in previous Quarterly Reports since 1987. Issue Title Q4 December 1986 The System of National Accounts of the Republic of
Vanuatu: Data Sources, Methodology, and Assumptions
Q1 March 1987 Press Announcement from Minister of Finance concerning The Cyclone UMA – Economic Recovery Program
(A) Duty Exemptions on Replacement Materials & Equipment (B) Duty Exemptions on New Projects Insurance settlements / Loss Adjustment Disputes Future Cyclone Insurance Cover in Vanuatu Banking Loans for Reconstruction Business License Fees 1988
Q3 September 1988 Budget of the Government of Vanuatu for 1989 Q3 September 1988 Vanuatu National Provident Fund: First year of operations Q1 March 2000 The Reserve Bank’s Exchange Rate Policy Q2 June 2000 Money Laundering Q3 September 2000 Governor’s Speech on the Exhibition of the “Mani Blong Yumi” Money in Vanuatu
Society Q3 September 2000 Notice to Commercial Banks concerning Money Laundering Q4 December 2000 Money is Lubricant of the Economy Q4 December 2000 Capital Adequacy Q1 March 2001 Update on Basel Capital Adequacy Reform Proposals Q2 June 2001 Capital Adequacy Q3 September 2003 International Banks – Overview of Developments Q4 December 2003 Monetary Policy Statement by the Governor Q1 March 2004 International Banking Act No. 4 Q1 March 2004 The Association of Financial Supervisors of Pacific Countries in collaboration with
PFTAC Q2 June 2004 Governor’s Speech for Education Economics Workshop Q2 June 2004 Governor’s Speech for Media Freedom Day Q2 June 2004 Press Release on Biri Group Q3 September 2004 Bank Supervision Policy Guideline 3, Supervision of the Adequacy of Liquidity of
Banks

QUARTERLY ECONOMIC REVIEW JUNE 2013
3
Q3 September 2004 Reserve Bank Undertakes Major Review Q4 December 2004 Governor’s speech on Overcoming Vanuatu’s Economic Challenges, 2004 Business
Forum Q4 December 2004 Governor’s speech for the Association of Financial Supervisors of the Pacific
Countries Meeting Q4 December 2004 The Formulation of Monetary Policy in Vanuatu Q4 December 2004 What are Reserve Bank Notes Q4 December 2004 Excess Reserves Q1 March 2005 Challenges to the Monetary Policy: The case of Vanuatu presented
to the Regional Seminar on Monetary Policy Implementation Q1 March 2005 Summary of Business Survey March 2005 Q1 March 2005 Monetary Policy Instruments – The case for Vanuatu Q1 March 2005 What is the Balance of Payments? How it is Compiled in Vanuatu? Q1 March 2006 Factors Determining Vanuatu Imports – A Brief Analysis Q1 March 2006 International Banking Act No. 4 of 2002 Q2 June 2006 Bekoz Bank Limited Q1 March 2007 Reserve Bank Issues Domestic Banking License to Bred Bank Q3 September 2007 Reserve Bank Issues Domestic Business License to operate as a Credit Institution to
Credit Corporation (Vanuatu) Ltd Q4 December 2007 International Banking Act No.4 of 2002 Q4 December 2007 Reserve Bank Issues International Banking Business License to Financial Partners
Bank Q3 September 2008 Reserve Bank raises Rediscount Rate Q4 December 2008 Insurance Amendment Act No. 29 of 2009 Turbulance in Global Financial Markets Relaxation of Reserve Bank’s Monetary Policy and Prudential Instruments Q1 June 2009 Monetary Policy Statement by Governor
Mani Blong Yumi – Money in Vanuatu Society Q3 September 2009 Monetary Policy Statement by Governor Q1 March 2010 Task & Functions of the Reserve Bank Q2 June 2010 Monetary Policy Statement by the Governor Q3 September 2010 Monetary Policy Statement by the Governor Q1 March 2011 Monetary Policy Statement by the Governor

QUARTERLY ECONOMIC REVIEW JUNE 2013
4
Q2 June 2011 Reserve Bank holds Economic Symposium Q2 June 2011 30 Years of Central Banking in Vanuatu Q3 September 2011 Monetary Policy Statement by the Governor Q1 March 2012 Monetary Policy Statement by the Governor Q3 September 2012 Monetary Policy Statement by the Governor Q1 March 2013 Monetary Policy Statement by the Governor

QUARTERLY ECONOMIC REVIEW JUNE 2013
5
STATISTICAL ANNEX
TABLE NO. PAGE NO.
I Monetary and Banking Sector (Tables 1-21)
1 Assets of the Reserve Bank of Vanuatu 41
2 Liabilities of the Reserve Bank of Vanuatu 42
3 Assets of Commercial Banks 43
4 Liabilities of Commercial Banks 44
5 Monetary Survey: A Consolidated Statement of Accounts of the Monetary Institutions 45
6 Domestic Money Supply and Components 46
7 Distribution of Vatu and Foreign Currency Deposits of Residents by Categories 47
8 Time Deposits in Vatu of Residents with Commercial Banks by Maturity Period 48
9 Commercial Banks' Sectoral Distribution of Loans and 49 Advances in Vatu and Foreign Currency
10 Distribution of Vatu Advances by Interest Rates as at end September 2012 50
11 Selected Interest Rates for Local Commercial Banks 52
12 Denominations of Currency on Issue 53
13 Net Official Reserves 54
14 Reserve Bank Notes Issued in Primary Market 55
15 Commercial Banks Liquidity 56
16 Commercial Domestic Banks Consolidated Capital 58
17 International Banks Balance Sheet (a) 59
18 International Banks Balance Sheet (b) 61
19 Domestic Banking Industry Foreign Exchange Turnover 63
20 Domestic Banking Industry Core set of Financial Soundness Indicators 65
21 Domestic Banking Industry – Profit (Vatu ‘000) 67
II Government Finance (Tables 22 - 25)
22 Total Government Fiscal Operations 69
23 Government Operations Excluding Donors 70
24 Government Operations Funded By Donors through the Central Treasury 71

QUARTERLY ECONOMIC REVIEW JUNE 2013
6
25 Vanuatu Government Bonds Outstanding 72
III External Sector (Tables 26-32)
26 Exchange Rates: Vatu per Unit of Foreign Currencies 73
27 Summary of Balance of Payments 74
28 International Investment Position 77
29 Exports 78
30 Imports 79
31 Exports by Country of Consignment 80
32 Imports by Country of Consignment 81
IV Finance Centre (Tables 33 - 34)
33 Company Registration in Vanuatu 82
34 Finance Center Institutions: Local Expenditure, Value-Added, Employment and Total Assets 83
V Real Sector (Tables 35 - 45)
35 Visitor Arrivals 84
36 Visitor Arrivals by Country of Origin 85
37 Consumer Price Indices (Relative to the previous quarter) 86
38 Consumer Price Indices (Relative to the same quarter in the previous year) 87
39 Consumer Price Indices by Region (Relative to the previous quarter) 88
40 Consumer Price Indices by Region (Relative to the same quarter in the previous year) 90
41 Cattle Slaughter by Abattoirs 92
42 Energy Consumption 93
43 Postal Services 94
44 Motor Vehicle Registration – Port Vila and Luganville 95
45 Number of Provident Fund Contributing Members/Full Employment 96

QUARTERLY ECONOMIC REVIEW JUNE 2013
7
TECHNICAL NOTES
Statistical data in the Quarterly Economic Review are based on the latest available information, and several statistical tables are substantially up-dated and amended from time to time to reflect figures revised by respective sources.
Abbreviations used are:
e = Estimated n.a. = Not yet available E = Estimated by Source n.e.i. = Not elsewhere included p = Provisional - = Nil r = Revised .. = Negligible/Almost R = Revised by Source

QUARTERLY ECONOMIC REVIEW JUNE 2013
8
1. EXECUTIVE SUMMARY The world’s major economies are starting a bumpy transition towards a more stable recovery amidst slower growth in the second quarter. With still a lot of spare capacity, central banks are continuing to maintain very accommodative monetary policy stances. In the United States, there is but modest acceleration in growth led by an upswing in employment, industry production and consumer demand. The Euro Zone has similarly eased away from recession after six quarters of economic contraction. Despite this, the IMF believes that certain key risks still remain including fragile domestic demand, slow credit and tight financial conditions. It is expected that these will generate risks of a longer than expected growth slowdown in the emerging market economies. Domestic economic performance indicators showed a slight improvement over the second quarter with strong tourism activities followed by a few ongoing construction activities in the private and public sector. However, the main sector benefiting the majority of the population performs weakly as a result of, persistent depressed international commodity prices exerting a downward pressure on agricultural output. Annual inflation increased marginally by 0.1 percentage point to 1.5 percent and 0.2 percent quarter-on-quarters. These developments reflect the persistent weak global price developments consistent with major trading partners’ inflation. Despite the increase, inflation continued to remain within the RBV annualized inflation range of 0-4 percent. The Macroeconomic Committee (MEC) kept the April 2013 approved GDP growth forecast unchanged as projected for the period 2012-2015. According to the MEC, the estimates for 2012 stood at 3.3 percent while 2013 is at 4.6 percent. These estimates are highly likely to be revised downwards in the next MEC meeting since these estimates are based largely on public projects that have at this stage not been materialized. Commercial banks’ liquidity continued to remain high above its target level during the first and second quarter of 2013. The high level of excess reserves prompts interest rates spread to ease from 8.4 percent during the previous quarter to 7.9 percent in the reviewed quarter. The banking system continued to witness outflows of foreign exchange over the last three consecutive quarters. Private sector credit slowed for the third consecutive quarter reflecting the subdued economic conditions. The asset quality intensified as doubtful loans were reclassified
to loss category largely due to prolonged foreclosure progress. Consequently, doubtful and standard loans significantly declined. The capital adequacy ratio (CAR) of the banking industry improved from 19.1 percent to 19.6 percent at the end of June 2013. The reported CAR level continued to indicate sufficient level of capital across the industry albeit continued threat of increasing non performing loans and unmanaged growth strategies. The domestic banking industry’s financial position continued to decline mainly from declines in foreign currency cash and balances due from overseas financial institution. Similarly the liability side of the balance sheet also witnessed negative growths in total liabilities. Government recurrent revenue collection in the second quarter of 2013 exceeded the same quarter of last year. Value added tax charged on the use of goods and services (VAT) continue to make significant contributions with additional revenue earned from the sale of passports. Government expenditure is slightly down compared to last year and outstanding government bonds remained the same over the quarter, having increased by over a fifth over the year. Vanuatu’s current account deficit narrowed over the quarter, reflecting improvement in the trade deficit owing to combined increases in the services, transfers and secondary income. This outweighed increases in imports over the decline in exports. Overall, Vanuatu’s official reserves continue to remain healthy with months of import cover increasing to 6.7 months at the end of June quarter. This remains well above the RBV’s minimum threshold of 4 months of import cover. The exchange rate developments of the Vatu vis-à-vis its major trading currencies for June showed the vatu appreciating against the Euro and USD, whilst depreciating against the NZD and AUD.
SYNTHÈSE
Les grandes économies mondiales commencent une transition chaotique vers une reprise plus stable au milieu du ralentissement de la croissance au deuxième trimestre. Avec encore beaucoup de capacité excédentaire, les banques centrales continuent de maintenir des politiques monétaires très accommandantes. Aux États Unis, il ya accélération inattendue de la croissance mais modeste tirée par une reprise de l’emploi, la production de l'industrie et de la
QUARTERLY ECONOMIC REVIEW JUNE 2013
9
demande des consommateurs. La zone euro s’est également assouplie loin de récession après six trimestres de contraction économique. Malgré cela, le FMI estime que certains risques importants demeurent, notamment la demande intérieure faible, crédit au ralentissement et des conditions financières difficiles. On s'attend à ce que ceux-ci génèrent des risques d'un ralentissement de la croissance plus que prévu dans les économies émergentes. Les Indicateurs de performance économique nationale ont indiqué une légère amélioration par rapport au premier trimestre en raison des activités touristiques fortes suivies par quelques activités de construction en cours dans le secteur privé et public. Toutefois, le principal secteur au profit de la majorité de la population indique une faible performance en raison de la persistance, des bas niveaux des prix internationaux des matières premières exerçant une pression à la baisse sur la production agricole. L'inflation annuelle a légèrement augmenté de 0,1 point de pourcentage, à 1.5 % et 0.2 % en glissement trimestriel. Ces évolutions reflètent l'évolution des niveaux faibles des prix internationaux faibles persistants et compatibles avec l'inflation des principaux partenaires commerciaux. Malgré cette hausse, l'inflation a demeuré dans la fourchette d'inflation annualisé de la BRV, soit de 0-4 %. Le Comité Macroéconomique a maintenu la croissance du PIB approuvée en Avril et inchangée comme prévu pour la période 2012-2015. Ces estimations sont très susceptibles d'être révisées à la baisse à la prochaine réunion du Comité, puisque ces estimations sont fondées en grande partie sur des projets publics qui ont, à ce stade pas été concrétisé. Selon ce dernier, les estimations pour 2012 s'élève à 3.3 % alors qu’en 2013 sont de 4.6 %. La liquidité des banques commerciales a continué à rester au-dessus de son niveau cible au cours du premier et du deuxième trimestre de 2013. Le système bancaire a continué à indiquer des sorties de devises au cours des trois derniers trimestres consécutifs. Le crédit au secteur privé a
ralenti pour le troisième trimestre consécutif, reflétant les conditions économiques sobres. La qualité des actifs s'est intensifiée en créances douteuses ont été reclassés à la catégorie de la perte due en grande partie aux progrès prolongé de forclusion. En conséquence, les créances douteuses et la et celles de qualité ont significativement diminué. Le ratio d’adéquation des fonds propres (CAR) du secteur bancaire s'est amélioré, passant de 19.1 % à 19.6 % à la fin de Juin 2013. La situation financière du secteur bancaire domestique a continué à diminuer principalement en raison de la baisse des liquidités en devises et les soldes dus par les institutions financières à l'étranger. De même, le passif du bilan a également connu des croissances négatives dans le total du passif. La collecte des revenus en cours du gouvernement au premier trimestre de 2013 a dépassé le même trimestre de l'année dernière. La taxe sur la Valeur Ajoutée perçue sur l'utilisation de biens et services (TVA) continue de faire des contributions significatives avec des revenus supplémentaires provenant de la vente des passeports. Les dépenses publiques sont légèrement en baisse par rapport à l'année dernière et les obligations d'État en circulation sont demeurées le même au cours du trimestre, après avoir augmenté de plus d'un cinquième de l’année. Le Déficit du compte courant de s’est rétrécît au cours du trimestre, reflétant l'amélioration du déficit commercial en raison de l'augmentation combinée dans les services, les transferts et les revenus secondaires. Cette augmentation des importations sur la baisse des exportations l’emporte. Dans l’ensemble, les réserves officielles du pays continuent à rester en bonne santé avec des mois de couverture des importations augmentant à 6,7 mois à la fin du trimestre précédent. Cela reste bien au dessus du seuil minimum de la BRV de 4 mois de couverture des importations. Les évolutions des taux de change vis-à- vis de ses principales monnaies d'échange pour Juin a montré que le Vatu s'est apprécié par rapport à l’Euro et le dollar américain, tandis qu’il s’est déprécié contre le dollar australien et Néo-zélandais.

QUARTERLY ECONOMIC REVIEW JUNE 2013
10
-2
-1
0
1
2
3
4
5
6
-2
-1
0
1
2
3
4
5
6
2004 2006 2008 2010 2012 2014fSource: IMF
%%
-6
-4
-2
0
2
4
6
-6
-4
-2
0
2
4
6
2007 2008 2009 2010 2011 2012 2013
CPI GDP
%%
Source: Bureau of Economic Analysis, Bureau of Labor Statistics
2. THE INTERNATIONAL ECONOMY The second quarter of 2013 saw slight recovery in major economies globally. There was an unexpected growth in the US economy and the surfacing of the Euro Zone from the past six months washed-out in the doldrums, so far global economies look set to be moving away from stagnation and recession. However the IMF still believe that some key risks still remain, including weaker domestic demand, slower credit and tighter financial conditions in the US which is expected to generate the new risks of a longer than expected growth slowdown in emerging market economies. Over the quarter most central banks continued to maintain very accommodative monetary policy stances. The IMF’s latest update on World Economic Outlook projects a further trending down in global economic growth although gradual recovery was unexpectedly recorded in major economies which if continue will improve future outlook. Currently growth in 2013 is now projected at 3.1 percent, down from 3.3 percent in the previous forecast. This downward revision prompts the forecast for 2014 to be reduced from 4.0 percent to 3.8 percent. In 2013 the GDP of advanced economies is expected to remain unchanged at 1.2 percent, while the forecast for 2014 was reduced to 2.1 percent (down from 2.2 percent forecast before). Emerging and developing economies are forecasted to grow by 5.3 percent in 2013) before increasing to 5.4 percent in 2014, down from 5.7 percent. Figure 1: World GDP Growth (Percentage Change; Annual Data)
The US Despite the IMF’s downward revision in its forecast for the US economy to 1.7 percent and 2.7 percent for 2013 and 2014 respectively, the US economy has expanded to 1.4 percent year-on year during the second quarter of 2013. The acceleration in economic growth during the second quarter was driven by an upturn in business investment and exports of goods which outweighed acceleration in imports, inventory investment and consumer spending. The increase in economic activities led to some inflationary pressures causing the annual rate of inflation to increase to 1.8 percent in June from 1.5 percent recorded in March 2013. Over the year to June, index for energy prices rose to 3.2 percent and food prices ticked up by 1.4 percent. The US core inflation rate likewise rose by 1.6 percent over the year to June 2013. Figure 2: US GDP and CPI (Percentage Change; Annual Data)
Europe The European economy has progressively gained momentum however economic activity still remains slow. The IMF forecasted that the euro area will remain in

QUARTERLY ECONOMIC REVIEW JUNE 2013
11
-6
-4
-2
0
2
4
6
-6
-4
-2
0
2
4
6
2007 2008 2010 2011 2013
GDP CPI
%%
Source: Eurostat
%
0
1
2
3
4
5
6
7
0
1
2
3
4
5
6
7
2007 2008 2010 2011 2013
GDP CPI*
%%
*Adjusted for interest changes prior to the September quarter 1998 and tax changes of 1999-00Source: Reserve Bank of Australia, Australian Bureau of Statistics
recession in 2013 having revised down their economic growth forecasts for 2013 and 2014 to -0.6 and 0.9 percent respectively. The Euro zone has emerged from recession during the second quarter of 2013 recording 1.3 percent growth from the first quarter after a recorded six quarters of contractions. The growth was driven mainly by stronger than expected growth in Germany and France. This quarterly growth led to the year-on-year growth slightly contracting by 0.7 percent in comparison to a 1.0 percent contraction recorded in the previous quarter. Over the year to the second quarter, German economy expanded by 0.5 percent compared to a contraction of 0.3 percent recorded in March. Over the same period, the French economy rose by 0.3 percent on the back of a 0.5 percent contraction in the year to the first quarter 2013.
Unemployment over the second quarter remained stable at 12.1 percent compared to the first quarter of 2013; this reflects the slow growth experienced in the real economy. Annual headline inflation during the June quarter eased to 1.6 percent from 1.7 percent in the March quarter. The largest contributors to the annual inflation increases came from vegetables, fruit and electricity, while telecommunications, fuels, medical and paramedical services had the biggest downward contribution to annual inflation.
Figure 3: Euro area GDP and CPI (Percentage Change; Annual Data)
Australia Growth in the Australian economy during the reviewed quarter remained stable almost similar to the previous quarter. During the June quarter of 2013, GDP growth was 0.6 percent, a similar growth portrayed in the first quarter of 2013. The main contributors to growth in the reviewed quarter were financial and insurance services increasing 2.1 percent while construction edged up by 1.9 percent. Unemployment over the quarter increased slightly to 5.7 percent from 5.6 percent in the March quarter. Inflation over the year to the June quarter plunge slightly to 2.4 percent from an increase of 2.5 percent recorded over the year to the March quarter. The most significant price rises during the reviewed quarter were for medical and hospital services, tobacco, new dwelling purchase by owner–occupiers, furniture and rents. While the most significant offsetting price falls were for domestic holiday travel, accommodation and automotive fuel. Figure 4: Australia GDP and CPI (Percentage Change; Annual Data)
QUARTERLY ECONOMIC REVIEW JUNE 2013
12
New Zealand
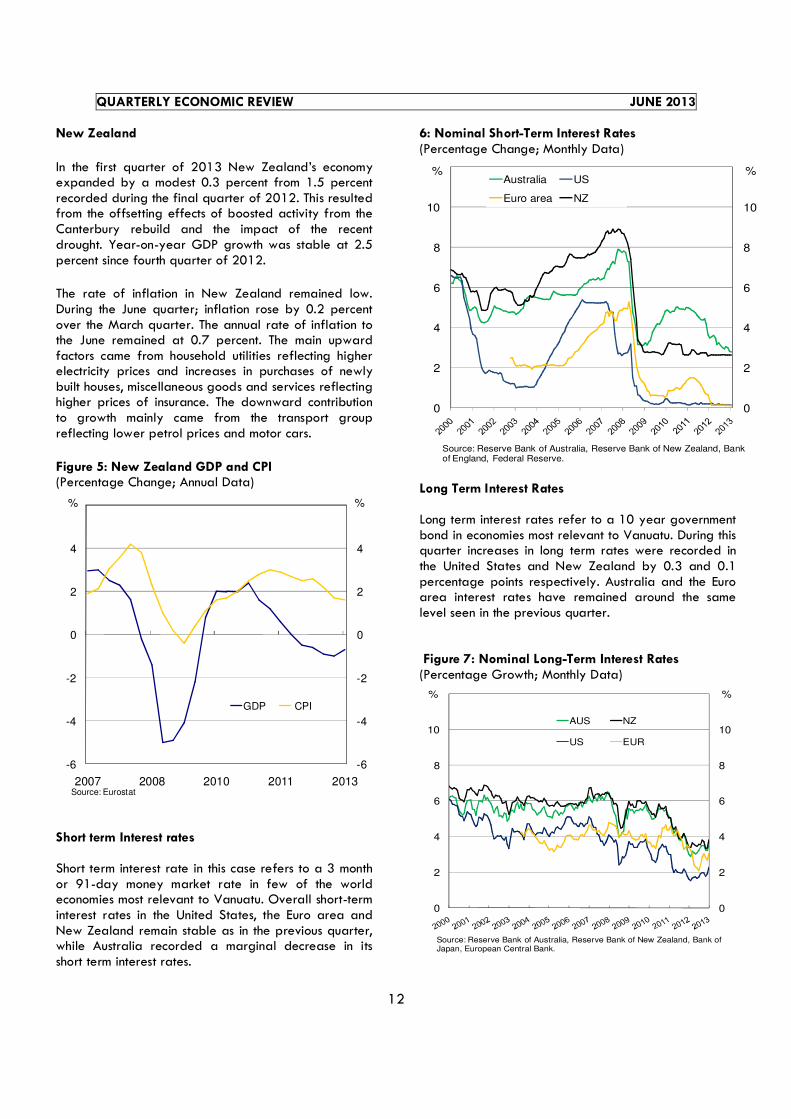
In the first quarter of 2013 New Zealand’s economy expanded by a modest 0.3 percent from 1.5 percent recorded during the final quarter of 2012. This resulted from the offsetting effects of boosted activity from the Canterbury rebuild and the impact of the recent drought. Year-on-year GDP growth was stable at 2.5 percent since fourth quarter of 2012.
The rate of inflation in New Zealand remained low. During the June quarter; inflation rose by 0.2 percent over the March quarter. The annual rate of inflation to the June remained at 0.7 percent. The main upward factors came from household utilities reflecting higher electricity prices and increases in purchases of newly built houses, miscellaneous goods and services reflecting higher prices of insurance. The downward contribution to growth mainly came from the transport group reflecting lower petrol prices and motor cars.
Figure 5: New Zealand GDP and CPI (Percentage Change; Annual Data)
Short term Interest rates Short term interest rate in this case refers to a 3 month or 91-day money market rate in few of the world economies most relevant to Vanuatu. Overall short-term interest rates in the United States, the Euro area and New Zealand remain stable as in the previous quarter, while Australia recorded a marginal decrease in its short term interest rates.
6: Nominal Short-Term Interest Rates (Percentage Change; Monthly Data)
Long Term Interest Rates Long term interest rates refer to a 10 year government bond in economies most relevant to Vanuatu. During this quarter increases in long term rates were recorded in the United States and New Zealand by 0.3 and 0.1 percentage points respectively. Australia and the Euro area interest rates have remained around the same level seen in the previous quarter. Figure 7: Nominal Long-Term Interest Rates (Percentage Growth; Monthly Data)
-6
-4
-2
0
2
4
6
-6
-4
-2
0
2
4
6
2007 2008 2010 2011 2013
GDP CPI
%%
Source: Eurostat
%
0
2
4
6
8
10
12
0
2
4
6
8
10
12Australia US
Euro area NZ
%%
Source: Reserve Bank of Australia, Reserve Bank of New Zealand, Bank of England, Federal Reserve.
0
2
4
6
8
10
12
0
2
4
6
8
10
12
AUS NZ
US EUR
%%
Source: Reserve Bank of Australia, Reserve Bank of New Zealand, Bank of Japan, European Central Bank.

QUARTERLY ECONOMIC REVIEW JUNE 2013
13
Oil Markets The global average oil price during the quarter was US$99.31 per barrel. This was lower than US$ 105.10 per barrel recorded in the March quarter of 2013. The average price in March 2013 was US$99.74 per barrel. The fall in oil prices during the quarter reflects weaker demand from major economies. Figure 8: Average Spot Price for Crude Oil (US$/Barrel)
Key Interest Rates Figure 9: Key Interest Rates (Percent; End of Period)
The European Central Bank (ECB) further reduced their policy interest from 0.75 in the previous quarter to a record low of 0.5 percent during the June quarter to continue to foster economic activity. The ECB expects its policy rate to remain low for some time yet. During the quarter, Federal Reserve expects a highly accommodative stance that will remain appropriate for a considerable time after the asset purchase program ends and until economic recovery gathers momentum. Reflecting this Federal Reserve continue to maintain its target range for the federal funds rate at 0-0.25 percent as long as the unemployment rate remains above 6.50 percent and longer-term inflation expectations continue to be well anchored The Reserve Bank of Australia (RBA) further reduced its cash rate from 3.00 percent during the first quarter to 2.75 percent during the second quarter of 2013. The RBA feels that a further easing in the cash rate was appropriate at this stage to encourage sustainable growth in the economy, and is consistent with achieving the inflation target.
The Reserve Bank of New Zealand (RBNZ) continues to
maintain its official cash rate (OCR) at 2.50 percent
during the quarter as in the previous quarter. Despite
the current pickup in economic growth, factors such as
housing price inflation, the overvaluation of the New
Zealand currency and fiscal consolidation will continue
to constraint growth. To counter balance these factors it
is considered appropriate to continue maintaining the
OCR.
3. DOMESTIC ECONOMIC DEVELOPMENTS
3.1 REAL ECONOMY Domestic economic indicators continue minimal improvement in performance this period. The weak international commodity prices continued to play a major role in exerting downward pressures on agricultural output from the agriculture sector. Nevertheless domestic economic activity was boosted by the tourism activity (mainly sourced from increased air visitors), on-going construction in the private sector and donor-funded building projects.
0
20
40
60
80
100
120
140
0
20
40
60
80
100
120
140
2001 2003 2005 2007 2009 2011 2013
Oil Prices
Quarter Average
US$US$
Source: IMF
0.00
1.00
2.00
3.00
4.00
5.00
6.00
7.00
8.00
9.00
0.00
1.00
2.00
3.00
4.00
5.00
6.00
7.00
8.00
9.00
Mar-
07
Jun
-07
Se
p-0
7
De
c-0
7
Mar-
08
Jun
-08
Se
p-0
8
De
c-0
8
Mar-
09
Jun
-09
Se
p-0
9
De
c-0
9
Mar-
10
Jun
-10
Se
p-1
0
De
c-1
0
Mar-
11
Jun
-11
Se
p-1
1
De
c-1
1
Mar-
12
Jun
-12
Se
p-1
2
De
c-1
2
Mar-
13
Jun
-13
Fed (US) RBA (AUSTRALIA)
RBNZ (NEW ZEALAND) ECB (EUROPE)
RBV (Vanuatu)
% %
Sources: US Federal Reserve, European Central Bank, Reserve Bank of Australia, Reserve Bank of New Zealand and Reserve Bank of Vanuatu
QUARTERLY ECONOMIC REVIEW JUNE 2013
14
4.3 4.0
5.3
8.5
5.2
6.5
3.3
1.6 1.4
3.3
4.5 4.6 4.9 4.9
-4
-2
0
2
4
6
8
10
-4
-2
0
2
4
6
8
10
03 04 05 06 07 08 09 10 11 12e 13f 14f 15f 16f
Add T-S-BSC*ServicesIndustryAgriculture, Fishing & ForestryGDP Growth(%)
Source: VNSO; * Add Tax less Subsidies on Products less Bank Service Charge; Forecast for 2012 onwards are MEC projections (July 2013)
% %
Forecast
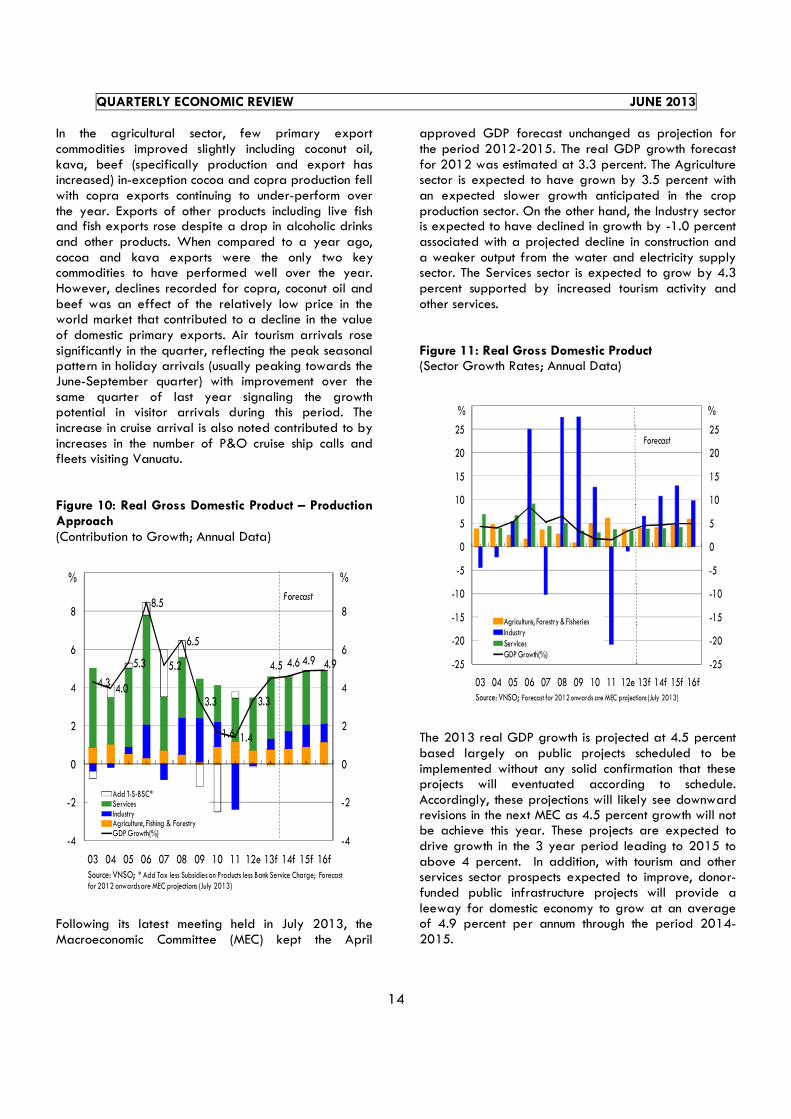
In the agricultural sector, few primary export commodities improved slightly including coconut oil, kava, beef (specifically production and export has increased) in-exception cocoa and copra production fell with copra exports continuing to under-perform over the year. Exports of other products including live fish and fish exports rose despite a drop in alcoholic drinks and other products. When compared to a year ago, cocoa and kava exports were the only two key commodities to have performed well over the year. However, declines recorded for copra, coconut oil and beef was an effect of the relatively low price in the world market that contributed to a decline in the value of domestic primary exports. Air tourism arrivals rose significantly in the quarter, reflecting the peak seasonal pattern in holiday arrivals (usually peaking towards the June-September quarter) with improvement over the same quarter of last year signaling the growth potential in visitor arrivals during this period. The increase in cruise arrival is also noted contributed to by increases in the number of P&O cruise ship calls and fleets visiting Vanuatu. Figure 10: Real Gross Domestic Product – Production Approach (Contribution to Growth; Annual Data)
Following its latest meeting held in July 2013, the Macroeconomic Committee (MEC) kept the April
approved GDP forecast unchanged as projection for the period 2012-2015. The real GDP growth forecast for 2012 was estimated at 3.3 percent. The Agriculture sector is expected to have grown by 3.5 percent with an expected slower growth anticipated in the crop production sector. On the other hand, the Industry sector is expected to have declined in growth by -1.0 percent associated with a projected decline in construction and a weaker output from the water and electricity supply sector. The Services sector is expected to grow by 4.3 percent supported by increased tourism activity and other services. Figure 11: Real Gross Domestic Product (Sector Growth Rates; Annual Data)
The 2013 real GDP growth is projected at 4.5 percent based largely on public projects scheduled to be implemented without any solid confirmation that these projects will eventuated according to schedule. Accordingly, these projections will likely see downward revisions in the next MEC as 4.5 percent growth will not be achieve this year. These projects are expected to drive growth in the 3 year period leading to 2015 to above 4 percent. In addition, with tourism and other services sector prospects expected to improve, donor-funded public infrastructure projects will provide a leeway for domestic economy to grow at an average of 4.9 percent per annum through the period 2014-2015.
-25
-20
-15
-10
-5
0
5
10
15
20
25
30
-25
-20
-15
-10
-5
0
5
10
15
20
25
30
03 04 05 06 07 08 09 10 11 12e 13f 14f 15f 16f
Agriculture, Forestry & FisheriesIndustryServicesGDP Growth(%)
Source: VNSO; Forecast for 2012 onwards are MEC projections (July 2013)
% %
Forecast

QUARTERLY ECONOMIC REVIEW JUNE 2013
15
Box. An Overview of Major Contributing Sectors to Vanuatu GDP Growth
Vanuatu’s economy grew at an average of 6 percent per year for the three year period leading to 2008 before falling to below 2 percent in 2010 and 2011. Vanuatu’s strong growth in the period leading to 2009 was associated with increased construction activity in the industry sector and a robust services sector on the backdrop of a then slowing global and regional economy as a result of the Global Financial Crisis (GFC). The slowdown in economic activity was due to a slowdown in the Services sector followed by the Agricultural sector and the draw-down following the completion of all construction activity associated with major aid-donor funded infrastructure project namely, the US-MCA Efate Ring Road and Santo East Road. During the 5 year period leading to 2011, the Services sector (the largest sector accounting for approximately 64 percent of Vanuatu’s Gross Domestic product) was supported by increased output from information and communication sector, accommodation and food services, retail trade, finance and insurance administrative services, real estate and public administration. This was supported by various reforms including the increased competition amongst the telecommunication industry and financial sector allowing more entrants, increased code-sharing agreements between Vanuatu’s airline industry and other regional counter-parties incorporating the open sky policy. This sector is forecasted1 to maintain growth from 2012 to 2016 with all sub-sectors expected to contribute around 2.9 percent as average-contribution-to-total real GDP growth per year2 during the period compared to the 2.4 percent in the preceding 5 years. The Agriculture sector is accounting for approximately 20 percent of total GDP supported by increased output from the crop production sector (specifically prime commodities of copra and its by-products, cocoa and kava) and animal production (specifically beef) with minimal contribution from the forestry and fisheries sector. The trend in this sector’s growth is volatile, reflecting the impact of fluctuating global commodity prices on production and sectoral policies.
Major (10 highly Valued) Sub-Sector Yearly Growth to Real GDP Growth; Annual Levels
Major Sub-Sector contribution to Industry Sector Growth; Annual Levels
This sector is forecasted to maintain growth in the period 2012 to 2016 contributing a 0.7 percent average-contribution-to-total real GDP growth per year for the period, higher than the 0.5 percent in the preceding 5 years. The Industry sector accounting for approximately 16 percent of total GDP is supported by increased output mainly influenced from construction activity and manufacturing. The trend in this sector’s growth is also volatile reflecting the variation in implementation schedules of donor-funded projects. This sector is forecasted to maintain growth in 2012 to 2016 and is expected to contribute a 0.9 percent average-contribution-to-total GDP growth per year for the period, higher than the 0.6 percent in the preceding 5 years supported by the increased number of planned development projects to be implemented. Overall, these sector activities will bring overall real GDP growth close to 3-4 percent per year for the next 3 years. While prospects for economic activity remains positive, continuous support to minimize hurtles and bottle-necks to growth are essential to ensure a sustainable economic growth into the future.
1 The forecast is likely to change 2 5 years average sector contribution to real GDP growth
5.2
6.5
3.3
1.61.4
3.34.5 4.6 4.9
4.9
-6
-4
-2
0
2
4
6
8
10
12
-60
-40
-20
0
20
40
60
80
100
120
07 08 09 10 11 12e 13f 14f 15f 16f
Crop ProductionManufacturingConstructionRetail TradeTransportAccomodation and Food ServicesInformation and CommunicationFinance and InsuranceReal EstatePublic AdministrationReal GDP Growth (%) - RHS
%%
-3.0
-2.0
-1.0
0.0
1.0
2.0
3.0
-3.0
-2.0
-1.0
0.0
1.0
2.0
3.0
2007 2008 2009 2010 2011 2012f 2013f 2014f 2015f 2016f
ConstructionElectricity and Water SupplyManufacturingMining and QuarryingIndustry Sector
% %
Source: Vanuatu National Statistics Office
QUARTERLY ECONOMIC REVIEW JUNE 2013
16
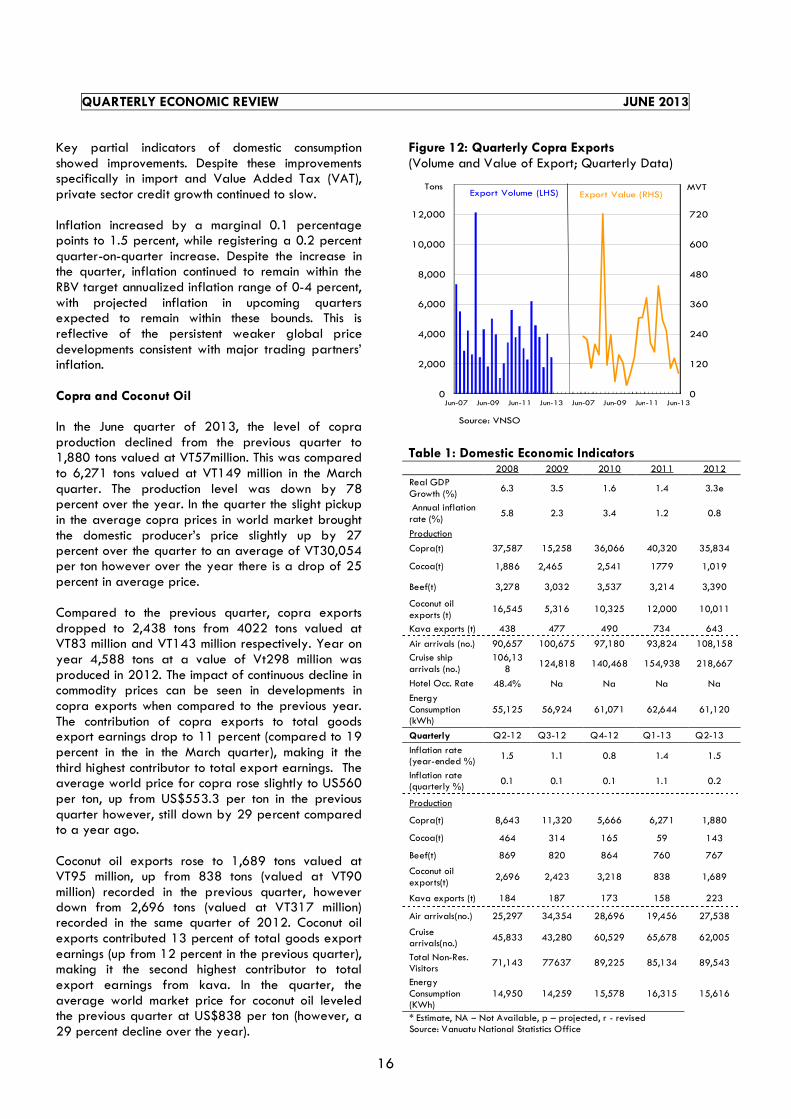
Key partial indicators of domestic consumption showed improvements. Despite these improvements specifically in import and Value Added Tax (VAT), private sector credit growth continued to slow. Inflation increased by a marginal 0.1 percentage points to 1.5 percent, while registering a 0.2 percent quarter-on-quarter increase. Despite the increase in the quarter, inflation continued to remain within the RBV target annualized inflation range of 0-4 percent, with projected inflation in upcoming quarters expected to remain within these bounds. This is reflective of the persistent weaker global price developments consistent with major trading partners’ inflation. Copra and Coconut Oil In the June quarter of 2013, the level of copra production declined from the previous quarter to 1,880 tons valued at VT57million. This was compared to 6,271 tons valued at VT149 million in the March quarter. The production level was down by 78 percent over the year. In the quarter the slight pickup in the average copra prices in world market brought the domestic producer’s price slightly up by 27 percent over the quarter to an average of VT30,054 per ton however over the year there is a drop of 25 percent in average price. Compared to the previous quarter, copra exports dropped to 2,438 tons from 4022 tons valued at VT83 million and VT143 million respectively. Year on year 4,588 tons at a value of Vt298 million was produced in 2012. The impact of continuous decline in commodity prices can be seen in developments in copra exports when compared to the previous year. The contribution of copra exports to total goods export earnings drop to 11 percent (compared to 19 percent in the in the March quarter), making it the third highest contributor to total export earnings. The average world price for copra rose slightly to US560 per ton, up from US$553.3 per ton in the previous quarter however, still down by 29 percent compared to a year ago. Coconut oil exports rose to 1,689 tons valued at VT95 million, up from 838 tons (valued at VT90 million) recorded in the previous quarter, however down from 2,696 tons (valued at VT317 million) recorded in the same quarter of 2012. Coconut oil exports contributed 13 percent of total goods export earnings (up from 12 percent in the previous quarter), making it the second highest contributor to total export earnings from kava. In the quarter, the average world market price for coconut oil leveled the previous quarter at US$838 per ton (however, a 29 percent decline over the year).
Figure 12: Quarterly Copra Exports (Volume and Value of Export; Quarterly Data)
Table 1: Domestic Economic Indicators 2008 2009 2010 2011 2012
Real GDP Growth (%)
6.3 3.5 1.6 1.4 3.3e
Annual inflation rate (%)
5.8 2.3 3.4 1.2 0.8
Production
Copra(t) 37,587 15,258 36,066 40,320 35,834
Cocoa(t) 1,886 2,465 2,541 1779 1,019
Beef(t) 3,278 3,032 3,537 3,214 3,390
Coconut oil exports (t)
16,545 5,316 10,325 12,000 10,011
Kava exports (t) 438 477 490 734 643
Air arrivals (no.) 90,657 100,675 97,180 93,824 108,158
Cruise ship arrivals (no.)
106,138
124,818 140,468 154,938 218,667
Hotel Occ. Rate 48.4% Na Na Na Na
Energy Consumption (kWh)
55,125 56,924 61,071 62,644 61,120
Quarterly Q2-12 Q3-12 Q4-12 Q1-13 Q2-13
Inflation rate (year-ended %)
1.5 1.1 0.8 1.4 1.5
Inflation rate (quarterly %)
0.1 0.1 0.1 1.1 0.2
Production
Copra(t) 8,643 11,320 5,666 6,271 1,880
Cocoa(t) 464 314 165 59 143
Beef(t) 869 820 864 760 767
Coconut oil exports(t)
2,696 2,423 3,218 838 1,689
Kava exports (t) 184 187 173 158 223
Air arrivals(no.) 25,297 34,354 28,696 19,456 27,538
Cruise arrivals(no.)
45,833 43,280 60,529 65,678 62,005
Total Non-Res. Visitors
71,143 77637 89,225 85,134 89,543
Energy Consumption (KWh)
14,950 14,259 15,578 16,315 15,616
* Estimate, NA – Not Available, p – projected, r - revised Source: Vanuatu National Statistics Office
0
120
240
360
480
600
720
840
0
2,000
4,000
6,000
8,000
10,000
12,000
14,000
Jun-07 Jun-09 Jun-11 Jun-13 Jun-07 Jun-09 Jun-11 Jun-13
Tons MVTExport Value (RHS)Export Volume (LHS)
Source: VNSO

QUARTERLY ECONOMIC REVIEW JUNE 2013
17
Figure 13: Quarterly Coconut Oil Exports (Volume and Value of Export; Quarterly Data)
Cocoa Cocoa production increased to an estimated 143 tons valued at VT20 million compared to 59 tons produced in the previous quarter valued at VT10 million. The second-third quarter is usually a peak season for cocoa harvesting, thus explains the relatively high production during the period. The estimated level of production is down by 69 percent over the year. The average producers’ price is down 12 percent in the quarter and 11 percent over the year to an average VT142,912 per ton. Cocoa exports contributed 13 percent of total goods export earnings compared to 3 percent in the previous quarter, making it the second highest contributor (shared with coconut oil) to total export earnings from kava. The average price for cocoa in the world market rose to 230.7 US cents per Kg (US$2,307 per ton), an increase of 220.9 US cents per Kg (US$2,209 per ton) in the previous quarter (the same level in the same period of last year). Figure 14: Quarterly Cocoa Exports (Volume and Value of Export; Quarterly Data)
Figure 15: Quarterly International Prices of major Export Commodities (Average Price Level; Quarterly Data)
Kava Kava exports rose to 223 tons valued at VT223 million from 158 tons (valued VT168 million) in the previous quarter. This is higher from the 184 tons (valued at VT189 million) recorded in the same period of 2012. Export markets, in particular regional countries of New Caledonia and Fiji continued to remain strong, while production for domestic market continues to remain buoyed. Kava exports contributed 30 percent of total goods export earnings in the quarter, compared to 22 percent in the previous quarter, making it the highest contributor to total export earnings in the quarter. Figure 16: Quarterly Kava Exports (Volume and Value of Export; Quarterly Data)
-
80
160
240
320
400
480
560
640
0
1,000
2,000
3,000
4,000
5,000
6,000
7,000
8,000
Jun-07 Jun-09 Jun-11 Jun-13 Jun-07 Jun-09 Jun-11 Jun-13
Tons MVTExport Volume (LHS) Export Value (RHS)
Source: VNSO
-
30
60
90
120
150
180
210
240
0
100
200
300
400
500
600
700
800
Jun-07 Jun-09 Jun-11 Jun-13 Jun-07 Jun-09 Jun-11 Jun-13
Tons MVTExport Volume (LHS) Export Value (RHS)
Source: VNSO
0
100
200
300
400
500
600
0
400
800
1,200
1,600
2,000
2,400
07 08 10 11 13 08 09 11 12
US$ /Ton
USCent/Kg
Source: World Bank, IMF
Copra (LHS)
Coconut Oil (LHS)
Cocoa (RHS)
Beef (RHS)
0
50
100
150
200
250
0
50
100
150
200
250
Jun-07 Jun-09 Jun-11 Jun-13 Jun-07 Jun-09 Jun-11 Jun-13
Tons MVTExport Value (RHS)Export Volume (LHS)
Source: VNSO

QUARTERLY ECONOMIC REVIEW JUNE 2013
18
Beef Total beef production declined slightly to 767 tons compared to 760 tons in the previous quarter with approximately 4,078 cattle heads slaughtered in the quarter, a 1 percent increase in the quarter and 12 percent drop over the year. The increase in production was mainly due to increased productivity in both abattoirs, Port Vila (VAL Pacific Ltd) and Luganville (Santo Meat Packers Ltd) despite declines over the year. Beef exports declined to 142 tons valued at VT73 million compared to 205 tons valued at VT89 million in the previous quarter. Beef exports were down by 50 percent over the same quarter of 2012. During the quarter, beef exports contributed 10 percent of total goods exports earnings (compared to 12 percent in the previous quarter). The average price for beef in the world market declined to 410.8 US cents per Kg (US$4,108per ton) from 427.1 US cents per Kg (US$4,271 per ton) in the previous quarter (around the same level as in the previous year). Figure 17: Quarterly Beef Exports (Volume and Value of Export; Quarterly Data)
Other Export Products Live fish exports rose to 21 tons valued at VT25 million, with shipments contributing 3 percent of total value of exported goods. There were VT21 million worth of alcoholic drink exports (accounting for 3 percent of total exports) recorded in the quarter, a decline in the quarter. Fish exports (contributed 4 percent of total exports) picked up to 84 tons valued at VT33 million. The share of Other Products in total goods exports recorded 8 percent in the three months ending June 2013 valued at VT57 million, down from the previous month and a year ago.
Tourism Total non-resident visitor arrivals (cruise-ship plus air visitors) rose 5 percent to 89,543 visitors and a further 26 percent increase year on year (from 71,143 visitors in June quarter 2012). Year on year had seen an increase in both air and cruise visitors. The bulk of non-resident visitor arrivals into the country continue to be dominated by cruise visitors (accounts for over 70 percent of total arrivals). Figure 18: Non-Resident Visitor Arrivals (Thousands of Visitors; Quarterly Data)
Air visitors rose a significant 41 percent to 27,538 visitors, with 26,315 visitors to Port Vila and 1,223 visitors to Luganville. Both towns showed growth in arrivals (with Luganville showing an exceptionally strong growth) reflecting peak month for holiday visitor arrivals, with both locations showing growth over the year. The composition of holiday visitors to total air visitor arrivals into the country rose to 80 percent (compared to 78 percent in March 2013) with holiday visitors up by 44 percent, visitors arriving to visit friends/relatives up by 14 percent and visitors arriving for meeting/conferences up by 17 percent. This is mainly visitors from Australia, New Zealand, Europe, N. America, Other Pacific Countries, New Caledonia, and Japan. Compared to the same quarter of the previous year, air visitor arrivals rose 9 percent due to growth in holiday visitor arrivals (8 percent) and visitors arriving to visit friends (11 percent). The increase was led by Australia (8 percent), Other Pacific Counties (23 percent), New Caledonia (5 percent), New Zealand (4 percent), N. America (20 percent) and Europe (5 percent).
0
30
60
90
120
150
180
210
240
0
50
100
150
200
250
300
350
400
Jun-07 Jun-09 Jun-11 Jun-13 Jun-07 Jun-09 Jun-11 Jun-13
Tons MVTExport Value (RHS)Export Volume (LHS)
Source: VNSO
0
10
20
30
40
50
60
70
80
90
0
10
20
30
40
50
60
70
80
90
Jun-07 Jun-08 Jun-09 Jun-10 Jun-11 Jun-12 Jun-13
Cruise Ship VisitorsAir VisitorsTotal
No' 000
Source: Vanuatu National Statistics Office
000sNo' 000

QUARTERLY ECONOMIC REVIEW JUNE 2013
19
Figure 19: Non-Resident Visitor Arrivals (Thousands of Visitors; Cumulative Jan-Jun data)
There were an estimated 32 cruise-ship visits to Port Vila compared to estimated 33 visits in the previous quarter and 23 in the same quarter of 2012. This included various en-route calls to the outer ports of Champagne Bay, Wala Is, Mystery Island and Luganville (Santo) shared amongst the P&O cruise fleets: Pacific Jewel, Pacific Pearl and Pacific Dawn, including Rhapsody of the Seas, Carnival Spirit and Bremen. These brought an estimated 62,005 cruise visitors, a 6 percent drop in the quarter, despite a continuous growth over the year with a recorded 35 percent increase over the same quarter of 2012. This is supported by increased cruise-ship capacity per ship and more frequent visits (April, May and June recorded 14, 8, 10 cruise ship visits per month, respectively). Inflation The inflation rate, as measured by the Consumer Price Index (CPI) increased 0.2 percent compared to an increase of 1.1 percent in the previous quarter. This resulted from an increase in prices for Port Vila by 0.1 percent and increased prices in Luganville by 0.8 percent. The main categories contributing to the increase in prices in the quarter includes: clothing and footwear (2.6 percent) and miscellaneous (2.1 percent) while slight increases were noted for food (0.3 percent), housing and utilities (0.6 percent), drinks and tobacco (0.3 percent), education (0.4 percent) and health (0.1 percent). In annual terms, the CPI increased 1.5 percent over the year to June 2013, up from a 1.4 percent increase recorded in the previous quarter. Port Vila recorded an increase of 1.4 percent and Luganville at 1.9 percent. The expenditure groups contributing to the increases over the year included: housing and utilities (2.5 percent), food (1.3 percent), education
(2.7 percent), clothing and footwear (5.4 percent), miscellaneous (4.0 percent) and recreation (1.8 percent). The increases in these expenditure groups were due to increases in footwear, secondary education, utilities, sport and other recreation, dairy and related products. Slight increase was shown for recreation, drinks and tobacco, household supplies and health. The transport category is the only category to have shown decline (-0.3 percent). Average annual inflation for the year (to date) continues to remain subdued, well within the target annualized range of 0-4 percent targeted by the RBV. Figure 20: Consumer Price Index (Percentage Change; Quarterly Data)
Figure 21: Contribution to the year-ended growth in Consumer Price Index (Percentage Change; Quarterly Data)
0
20
40
60
80
100
120
140
2009 2010 2011 2012 2013
Air Visitor Arrivals Jan-JunCruise-ship Arrivals Jan-Jun
No.'000
-2
-1
0
1
2
3
4
5
6
-2
-1
0
1
2
3
4
5
6
Jun-03 Jun-05 Jun-07 Jun-09 Jun-11 Jun-13
Quarterly Year-ended
Source: VNSO
%%
-2
-1
0
1
2
3
4
5
6
7
8
9
-2
-1
0
1
2
3
4
5
6
7
8
9
2008 2009 2010 2011 2012 2013
Miscellaneous*Education*Recreation*Communication*Transport*Health*Recreation, Health, Education etcTransport and CommunicationHousehold SuppliesHousing and UtilitiesClothing and FootwearDrinks and TobaccoFoodAll Group
%%
Source: VNSO; *sub-divided categories with new weights; June Qtr

QUARTERLY ECONOMIC REVIEW JUNE 2013
20
3.2 FISCAL OPERATIONS
TOTAL GOVERNMENT OPERATION (TGO)3 Total government revenue recorded VT4160.9million, of which 93.4 percent were recurrent revenue while 6.6 percent were grants received from abroad. Total revenue compared to same quarter of last year recorded an increase of 7.9 percent and 2.1percent more compared to preceding quarter. Total government expenditure totaled around VT3774.5million. This is a decline of 2.7 percent compare to the previous quarter but 3.7 percent year on year. Figure 22: Fiscal Operation (Quarterly Levels)
During the quarter, fiscal budget ends with a net-operating balance of VT386.4million. However, a total of VT156.7million was recorded for net-acquisition of non-financial assets leaving final fiscal balance at a surplus of VT229.7million. TGO-EXCLUDING DONORS Revenue Total recurrent revenue was at VT3308.2 million, lower by 13.1 percent than collection in the previous quarter but 16.0 percent higher year on year. Out from total recurrent revenue, collection from taxes on use of goods and services made up 67.6 percent at VT2235.5 million. This is a decrease of 19.6 percent and increase of 19.7 percent quarter on quarter and year on year respectively.
3 Government Finance Statistics (GFS) have migrated from GFS86 format to GFS01 format. This is in line with GFS manual 1986 migration to GFS manual 2001 as recommended by the International Monetary Fund.
Value added tax, a component of taxes on the use of goods and services made up 41.0 percent of all recurrent revenue at VT1356.5 million. This is an increase of 13.5 percent compared to previous quarter and 21.9 percent compared to same period last year. Figure 23: Taxes on use of Goods and Services (Quarterly Levels)
Revenue from taxes on International Trade reached VT674.6million, equivalent to 20.4 percent of all recurrent revenue. This is an increase of 23.9 percent and 20.9 percent over the quarter and same period of 2012 respectively. Collection of revenue from taxes on property amounts to VT79.1 million, a drop of 18.8percent and 33.3 percent over the quarter and same period last year respectively. Figure 24: Recurrent Revenue (Quarterly Levels)
Other domestic revenue contributed 9.6 percent of all recurrent revenue at VT319.0 million, representing a drop of 16.6 percent over the quarter but an increase of 3.1 percent year on year.
QUARTERLY ECONOMIC REVIEW JUNE 2013
21
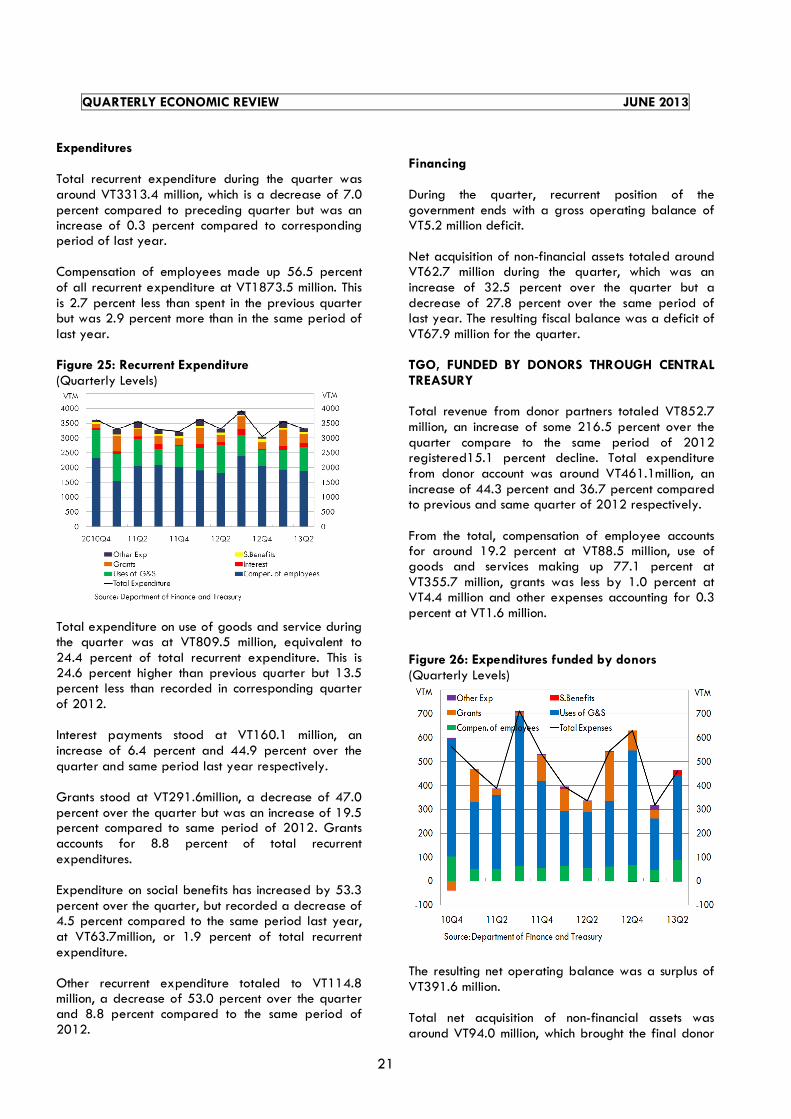
Expenditures Total recurrent expenditure during the quarter was around VT3313.4 million, which is a decrease of 7.0 percent compared to preceding quarter but was an increase of 0.3 percent compared to corresponding period of last year. Compensation of employees made up 56.5 percent of all recurrent expenditure at VT1873.5 million. This is 2.7 percent less than spent in the previous quarter but was 2.9 percent more than in the same period of last year. Figure 25: Recurrent Expenditure (Quarterly Levels)
Total expenditure on use of goods and service during the quarter was at VT809.5 million, equivalent to 24.4 percent of total recurrent expenditure. This is 24.6 percent higher than previous quarter but 13.5 percent less than recorded in corresponding quarter of 2012. Interest payments stood at VT160.1 million, an increase of 6.4 percent and 44.9 percent over the quarter and same period last year respectively. Grants stood at VT291.6million, a decrease of 47.0 percent over the quarter but was an increase of 19.5 percent compared to same period of 2012. Grants accounts for 8.8 percent of total recurrent expenditures. Expenditure on social benefits has increased by 53.3 percent over the quarter, but recorded a decrease of 4.5 percent compared to the same period last year, at VT63.7million, or 1.9 percent of total recurrent expenditure. Other recurrent expenditure totaled to VT114.8 million, a decrease of 53.0 percent over the quarter and 8.8 percent compared to the same period of 2012.
Financing During the quarter, recurrent position of the government ends with a gross operating balance of VT5.2 million deficit. Net acquisition of non-financial assets totaled around VT62.7 million during the quarter, which was an increase of 32.5 percent over the quarter but a decrease of 27.8 percent over the same period of last year. The resulting fiscal balance was a deficit of VT67.9 million for the quarter. TGO, FUNDED BY DONORS THROUGH CENTRAL TREASURY Total revenue from donor partners totaled VT852.7 million, an increase of some 216.5 percent over the quarter compare to the same period of 2012 registered15.1 percent decline. Total expenditure from donor account was around VT461.1million, an increase of 44.3 percent and 36.7 percent compared to previous and same quarter of 2012 respectively. From the total, compensation of employee accounts for around 19.2 percent at VT88.5 million, use of goods and services making up 77.1 percent at VT355.7 million, grants was less by 1.0 percent at VT4.4 million and other expenses accounting for 0.3 percent at VT1.6 million. Figure 26: Expenditures funded by donors (Quarterly Levels)
The resulting net operating balance was a surplus of VT391.6 million. Total net acquisition of non-financial assets was around VT94.0 million, which brought the final donor

QUARTERLY ECONOMIC REVIEW JUNE 2013
22
funded budget balance to a surplus of VT297.6 million during the quarter. OUSTANDING GOVERNMENT BONDS Total outstanding government bond was at VT5.5 billion, a decrease of 1.8 percent compared to previous quarter and 4.4 percent compared to same period of last year. Figure 27: Outstanding Government Bonds (Quarterly Level)
Finance Centre Contribution4 This report highlights the contribution of Vanuatu offshore finance center. However, it is worth mentioning that even though some companies comply by providing data, most did not. During this quarter less than 50 percent of companies surveyed responded. Total expenditure made by Finance Center Institutions during the quarter totaled around VT1.8 billion, a decrease of 4.8 percent over the quarter and 0.1 percent more compared to the same period of 2012.
4 Data in this report includes the four major commercial banks in Vanuatu together with offshore banks and the Vanuatu National Provident Fund together with offshore trust & insurance firms.
Figure 28: Total Expenditure (Quarterly levels)
Total assets owned by finance center institutions totaled around VT35 billion, of which Banks holds 53 percent, trusts and insurance holds 44 percent, legal firms 1 percent and accounting entities holding 2 percent. Total workforce employed by Vanuatu’s financial centers totaled 869 workers. This is 11 workers less than the preceding quarter and 11 workers more than hired in the same period of 2012. Figure 29: Local Employment Number of workers, Annual trend

QUARTERLY ECONOMIC REVIEW JUNE 2013
23
Shipping Registration Total shipping fees collected during the quarter amounts to VT54.88 million, of which VT7.5 million was placed under Marine Participation and Investigation Fund. Company Registration Total number of companies on the company registry recorded by the Vanuatu Financial services Commission stood at 5781. This is 562 companies more than in the preceding quarter and 1634 more than registered in the same period of 2012. Figure 30: Company registry (Number companies; Quarterly Data)
3.3 MONETARY DEVELOPMENTS Summary Broad Money supply (M2) decreased by 1.7 percent following an increase of 1.8 percent recorded during the first quarter of 2013. The decrease was attributed to decreases of 6.5 percent and 0.1 percent in net foreign assets and domestic credit, respectively. Moreover, the decline in growth was reflected in M1 and quasi-money which recorded decreases of 2.6 percent and 1.1 percent, respectively. Hence the annual growth of M2 contracted to 3.4 percent.
Figure 31 shows that the year-ended growth of money supply (M2) closely followed the trend in NFA, which decreased during the quarter but remained negative over the year. Domestic credit continued to slow over the year. Figure 31: Determinants of Money Supply (Percentage Change; Year-on-Year Growth)
Commercial banks’ liquidity5continued to remain high above its target level during the first and second quarter of 2013. The Reserve Bank indicator rate rose to 1.35 percent from 1.00 percent in the previous quarter, implying that there is less competition in the market for RBV notes during the reviewed quarter.. The interest rates spread of commercial banks nevertheless narrowed at the end of June quarter. Determinants of Money Supply Net Foreign Assets (NFA) The total NFA of the banking system decreased by 6.5 percent after a small increase of 0.1 percent during the previous quarter. The trend was attributed to declines in the NFA holdings of both commercial Banks and Monetary authorities’ by 25.0 percent and 0.6 percent, respectively. The decrease in commercial banks NFA came from a continued downtrend in their foreign assets and an increase in their foreign liabilities. Over the year, commercial banks NFA fell further to 50.5 percent, while the monetary authorities NFA decreased by 2.2 percent. The banking system continued to witness net outflows of foreign exchange over the last three consecutive quarters through to this quarter, as the annual growth of NFA further contracted by 17.9 percent.
5 Commercial banks’ liquidity consists of commercial banks’ excess reserves plus holdings of RBV Notes.
-40
-30
-20
-10
0
10
20
30
40
50
-40
-30
-20
-10
0
10
20
30
40
50
Jun-09 Jun-10 Jun-11 Jun-12 Jun-13
NFA M2 Domestic Credit% %
Source: Commercial Banks; Reserve Bank

QUARTERLY ECONOMIC REVIEW JUNE 2013
24
Figure 32: Net Foreign Assets (Percentage Change; Year-on-Year Growth)
Domestic Credit Domestic credit recorded a slight decrease of 0.1 percent, but rose by 4.9 percent over the year to the June quarter. The slight decrease was attributed to decreases in net claims on the government and claim on municipalities. Loans to private sector in contrast increased slightly by 0.2 percent during the quarter. Private sector credit 6 continues to record slow growth for the third consecutive quarter since the final quarter of 2012. Over the year to June 2013 the annual growth rate of private sector credit slowed further to 3.6 percent as compared to 4.7 percent over the year to the March quarter of 2013. The slowdown in the annual growth rate of private sector credit continues to reflect subdued economic conditions. The growth in private sector was mirrored by increases in lending to individual & households by 2.5 percent while loans to businesses decreased by 1.5 percent over the quarter. However, loans to individual & households year on year fell by 0.1 percent, while loans to business grew by 7.7 percent. This is an indication that certain business activities have shown growth over the year.
6 Includes data from the commercial banks and RBV.
Figure 33: Private Sector Credit (Year-On-Year Growth; By Categories)
Economic sectors that made the largest contributions to the year-on-year growth in private sector credit are distribution, professional & other services, and personal loans. Sectors that made minor contributions to the annual growth include agriculture, mining & quarrying, public utilities and government & public corporation. Construction, housing & land purchase; tourism, transport, entertainment & catering, manufacturing, fisheries, financial institutions and miscellaneous sector made negative contributions to the annual growth rate.
Figure 34: Contributions to Growth in Private Sector
(Contribution to Year Ended Growth; By Sectors)
Commercial banks’ lending to non-financial public enterprises and municipalities contracted by 8.6 percent and 9.5 percent, respectively over the
-80
-60
-40
-20
0
20
40
60
-80
-60
-40
-20
0
20
40
60
Jun-09 Jun-10 Jun-11 Jun-12 Jun-13
Total Commercial Banks Reserve Bank% %
Source: Commercial Banks; RBV
-40
-20
0
20
40
60
80
-40
-20
0
20
40
60
80
Jun-09 Jun-10 Jun-11 Jun-12 Jun-13
Loans & advances to Business
Total
Loans & advances to Individual / Households
% %
Source: Commercial Banks; RBV
-15
-10
-5
0
5
10
15
20
25
-15
-10
-5
0
5
10
15
20
25
Jun-12 Sep-12 Dec-12 Mar-13 Jun-13
Distribution Profesional & Other services Housing & Land Loans
Personal Loans Other Sectors Tourism
Construction Total
% %
Other Sectors include: Fisheries, Mining & Quarryng, Entertainment & Catering, Public Utilities, Government, Public Corporation, Financial
institutions , agriculture, manufacturing, transport, miscellaneous
QUARTERLY ECONOMIC REVIEW JUNE 2013
25
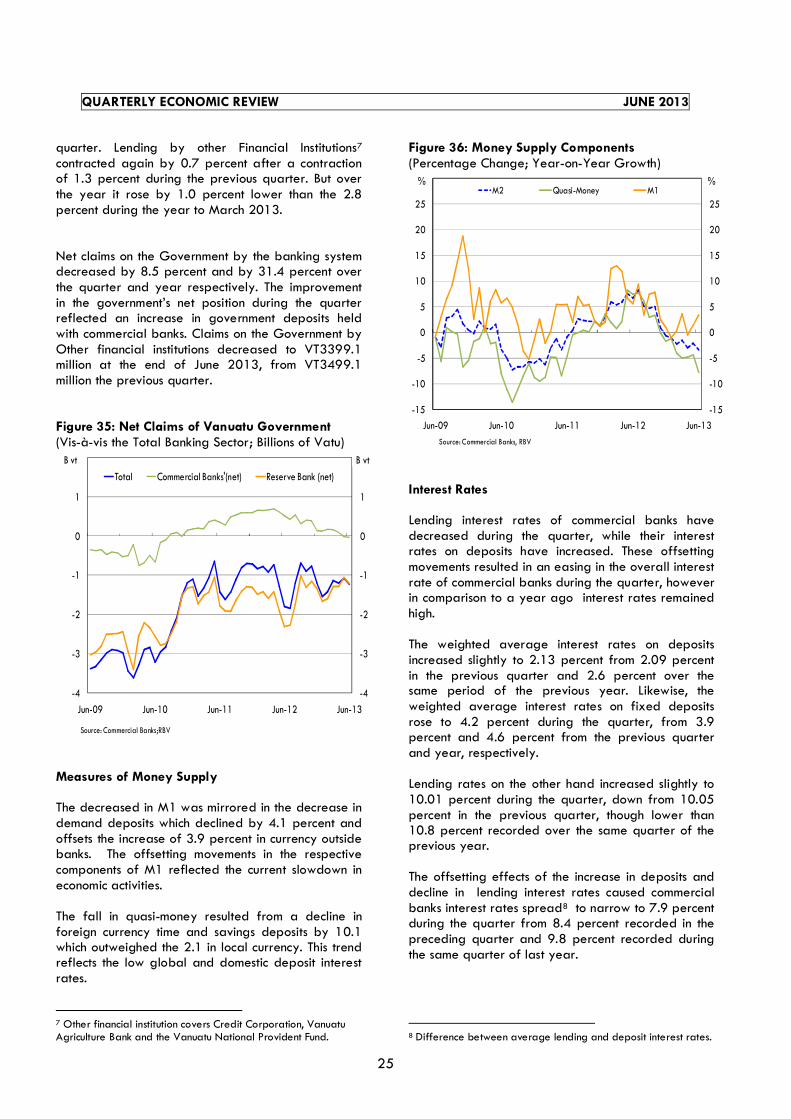
quarter. Lending by other Financial Institutions7 contracted again by 0.7 percent after a contraction of 1.3 percent during the previous quarter. But over the year it rose by 1.0 percent lower than the 2.8 percent during the year to March 2013. Net claims on the Government by the banking system decreased by 8.5 percent and by 31.4 percent over the quarter and year respectively. The improvement in the government’s net position during the quarter reflected an increase in government deposits held with commercial banks. Claims on the Government by Other financial institutions decreased to VT3399.1 million at the end of June 2013, from VT3499.1 million the previous quarter. Figure 35: Net Claims of Vanuatu Government (Vis-à-vis the Total Banking Sector; Billions of Vatu)
Measures of Money Supply The decreased in M1 was mirrored in the decrease in demand deposits which declined by 4.1 percent and offsets the increase of 3.9 percent in currency outside banks. The offsetting movements in the respective components of M1 reflected the current slowdown in economic activities. The fall in quasi-money resulted from a decline in foreign currency time and savings deposits by 10.1 which outweighed the 2.1 in local currency. This trend reflects the low global and domestic deposit interest rates.
7 Other financial institution covers Credit Corporation, Vanuatu Agriculture Bank and the Vanuatu National Provident Fund.
Figure 36: Money Supply Components (Percentage Change; Year-on-Year Growth)
Interest Rates Lending interest rates of commercial banks have decreased during the quarter, while their interest rates on deposits have increased. These offsetting movements resulted in an easing in the overall interest rate of commercial banks during the quarter, however in comparison to a year ago interest rates remained high. The weighted average interest rates on deposits increased slightly to 2.13 percent from 2.09 percent in the previous quarter and 2.6 percent over the same period of the previous year. Likewise, the weighted average interest rates on fixed deposits rose to 4.2 percent during the quarter, from 3.9 percent and 4.6 percent from the previous quarter and year, respectively. Lending rates on the other hand increased slightly to 10.01 percent during the quarter, down from 10.05 percent in the previous quarter, though lower than 10.8 percent recorded over the same quarter of the previous year. The offsetting effects of the increase in deposits and decline in lending interest rates caused commercial banks interest rates spread8 to narrow to 7.9 percent during the quarter from 8.4 percent recorded in the preceding quarter and 9.8 percent recorded during the same quarter of last year.
8 Difference between average lending and deposit interest rates.
-4
-3
-2
-1
0
1
2
-4
-3
-2
-1
0
1
2
Jun-09 Jun-10 Jun-11 Jun-12 Jun-13
Total Commercial Banks'(net) Reserve Bank (net)
Source: Commercial Banks;RBV
B vtB vt
-15
-10
-5
0
5
10
15
20
25
30
-15
-10
-5
0
5
10
15
20
25
30
Jun-09 Jun-10 Jun-11 Jun-12 Jun-13
M2 Quasi-Money M1% %
Source: Commercial Banks, RBV

QUARTERLY ECONOMIC REVIEW JUNE 2013
26
Figure 37: Interest Rate
Reserve Money Reserve money9 rose to 3.7 percent during the reviewed quarter. The increase was attributed to increases in SRD and excess by 3.1 percent and 14.5 percent, respectively, which outweighs the decrease in currency in circulation. Moreover, reserve money rose by 8.1 percent over the year to the June quarter.
Figure 38: Components of Reserve Money (Levels; Billions of Vatu)
3.4 MONEY MARKET DEVELOPMENT Commercial banks’ excess reserves stood at VT4,096 million at end of June 2013 this is an increase from VT3,577 million at the end of the March quarter . The increase over the June quarter reflected a decline in RBV Notes issue and currency in circulation during the beginning of April until the end of June 2013. 9 Reserve Money or ‘Base Money’ is comprised of currency in circulation, Statutory Reserve Deposits (SRD), and Excess Reserves.
Total outstanding RBV Notes declined from VT1, 360 million during the previous quarter to VT1, 281million at the end of the review quarter. During the quarter , the Bank floated VT2,729 million in RBV Notes and received VT5,004million in bids from commercial banks, of which VT2,653 million was accepted. Furthermore VT2,399 million of RBV Notes were redeemed. RBV Notes allotments during the review quarter were as follows: VT 536 million was allotted to the 7 days, VT528 million was allotted to the 14 days, VT566 million was allotted to the 28 days, VT521 million was allotted to the 63 days and VT502 million was allotted to the 91 days maturity. Figure 39a: Bank Excess Reserves (Levels, Millions of Vatu, Month-End Data)
Figure 39b: RBV Notes Yields (Level, Percentage, Month-End Data)
0
2
4
6
8
10
12
0
2
4
6
8
10
12
Jun-09 Dec-09 Jun-10 Dec-10 Jun-11 Dec-11 Jun-12 Dec-12 Jun-13
Interest rate spread Weighted average deposit interest rate
Source: Commercial Banks
% %
Interest rates spread
0
1
2
3
4
5
6
7
8
0
1
2
3
4
5
6
7
8
Jun-11 Dec-11 Jun-12 Dec-12 Jun-13
Currency in circulation Excess Reserves SRD
Bvt Bvt
Source: Commercial Banks; RBV

QUARTERLY ECONOMIC REVIEW JUNE 2013
27
The yields on the various maturities of RBV Notes slowly trended upward during the review quarter, with all interest rate levels above 1 percent reflecting the high level of competition for RBV Notes. The 91 days rate soared to 1.35 percent from 1.00 percent in the first quarter of 2013.
3.5 BANKING SECTOR DEVELOPMENTS
Domestic Banks Financial Position Figure 40: Asset Position – Domestic Banks (Levels; billions of Vatu)
The domestic banking industry’s financial position continued to decline albeit remaining strong. On the asset side, total balance sheet assets marginally declined by 0.2 percent to VT79.4 billion (VT79.6 billion: Mar-13), compared to the previous quarter. There is a 1.6 percent drop in total foreign assets to VT12.3 billion (VT12.5 billion: Mar-13) offsetting the 0.1 percent growth in total domestic assets to VT67.1 billion (VT67.0 billion: Mar-13). Over the year, total balance sheet assets dropped by 3.3 percent owing mainly to 27.7 percent drop in total foreign assets outweighing 3.1 percent growth in total domestic assets.
The quarterly drop in total foreign assets is mainly attributable to declines in foreign currency cash and balances due from overseas financial institutions by 3.1 percent to VT141.7 million (VT146.2 million: Mar-13) and 2.1 percent to VT11.4 billion (VT11.7 billion: Mar-13) respectively. On the other hand, the increase in total domestic assets was largely due to claims on RBV and claims on private sector by 6.8 percent to VT8.2 billion (VT7.7 billion: Mar-13) and 0.3 percent to VT51.8 billion (VT51.7 billion: Mar-13). The liability side of the balance sheet also witnessed negative growths in total liabilities (less capital) by 0.8 percent to VT66.9 billion (VT67.4 billion: Mar-13) quarter on quarter owing mainly to 2.4 percent drop in total domestic liabilities to VT57.7 billion. The later outweighed 10.6 percent increases in the total foreign liabilities to Vt9.2 billion. Capital10 Figure 41: Capital Adequacy & Tier 1 Ratio (Quarterly Data) (Levels, billions of Vatu)
The capital adequacy ratio (CAR) of the industry improved from 19.1 present during the previous period to 19.6 percent at the end of June 2013 as improvement in asset quality outweighed gradual
10
Excluding foreign bank branches
0
10
20
30
40
50
60
70
80
90
0
10
20
30
40
50
60
70
80
90
Jun-12 Sep-12 Dec-12 Mar-13 Jun-13
Foreign Assets Domestic Assets
Total Assets
VT
B
VT
B
0
5
10
15
20
25
0
10
20
30
40
50
60
Jun-12 Sep-12 Dec-12 Mar-13 Jun-13
Total Tier 2 Capital
Total Tier 1 Capital
Capital Base
TOTAL RISK WEIGHTED ASSETS
Tier 1 capital to total RWA (RHS)
VT
B
%

QUARTERLY ECONOMIC REVIEW JUNE 2013
28
capital growth. The reported CAR level continued to indicate sufficient level of capital across the industry albeit continued threat of increasing non performing loans and unmanaged growth strategies. While the improvement in asset quality reduced the total risk weighted assets by 1.7 percent to VT54.3 billion (VT55.2 billion) over the quarter, it registered a yearly growth of 8.9 percent. In contrast, the industry’s capital base increased by 0.9 percent quarter-on-quarter to VT10.6 billion (VT10.5 billion) and 5.9 percent annually. The increase in capital base is mainly attributed to 20.5 percent increase in total tier 2 capital to VT1.3 billion (VT1.1 billion: Mar-13) largely due to improvements in earnings and general provisions for doubtful debts over the quarter. Total tier 1 capital, however, reduced by 1.3 percent to VT9.4 billion (VT9.5 billion: Mar-13) owing mainly to 2.8 percent decline in disclosed and retained earnings to VT5.4 billion. Financial Performance Figure 42: Earnings – Domestic Banks (Quarterly Data) (Levels, billions of Vatu)
The financial performance of the domestic banking industry further weakens, indicating sluggish private sector growth and deterioration in asset quality. June 2013 registered a quarterly decline in operating
profit (before tax, write-offs, and provisions) of 27.2 percent to VT274.9 million (VT377.8 million: Mar-13) and 30.6 percent drop over the year. The decline largely reflected 10.1 percent increase in total operating expenses to VT1.4 billion (VT1.3 billion: Mar-13) outweighing 1.8 percent increase in total operating income to VT1.7 billion (VT1.69 billion: Mar-13). The increase in total operating expenses is attributable to quarter on quarter increases in both the interest expense and non-interest expense by 1.0 percent to VT346.1 million and 13.3 percent to VT1.1 billion respectively. In contrasts, gradual increase in total operating income reflected increases in interest income by 1.1 percent to VT1.2 billion and non-interest income by 3.1 percent to VT563.1 million. The earnings were further eroded due to deductions for provisioning, general reserves and net write-off of VT13.0 million (VT3.6 million: Mar-13), VT31.5 million (Vt17.0 million: Mar-13) and Vt35.2 million (VT98.9 million: Mar-13) respectively leading to net operating income of VT195.2 million compared to VT258.3 million during the previous quarter. Given this performance, domestic banks annualized Return on Asset (ROA) and Return on Equity (ROE) reduced from 1.9 percent and 12.5 percent to 1.4 percent and 9.0 percent respectively over the quarter. Asset Quality The deterioration in the lending book intensified during the reviewed quarter as doubtful loans were reclassified to loss category largely due to prolonged foreclosure processes. Consequently, doubtful loans significantly declined by 66.9 percent to Vt1.0 billion (VT3.1 billion: Mar-13) increasing loss loans by 162.5 percent to VT3.8 billion (VT1.5 billion: Mar-13). The level of impaired assets also increased by 6.5 percent to VT4.9 billion (VT4.6 billion: Mar-13) increasing representation of the total loans to 9.5 percent compared to 9.0 percent at the end of March 2013. Net non performing loans to capital11 & reserves also increased from 18.5 percent (Mar-13) to 20.4 percent confirming the deterioration. The standard loans also declined by 0.7 percent over the quarter to VT44.1 billion (VT44.4 billion: Mar-13) owing to downward migration to substandard category increasing the same by 11.7 percent to VT2.3 billion (VT2.1 billion: Mar-13). This reduced standard loans share of the total to 86.0 percent (87.0 percent: Mar-13) while increasing substandard share to 4.5 percent (4.0 percent: Mar-13).
11 Includes branches of foreign banks
-1.0
-0.5
0.0
0.5
1.0
1.5
2.0
-1.0
-0.5
0.0
0.5
1.0
1.5
2.0
Jun-12 Sep-12 Dec-12 Mar-13 Jun-13
Net Interest Income
Net operating income (loss)
Operating profit before tax, write-offs & provisions
Total operating expenses
Non-interest income
Total operating income
VT B
VT B

QUARTERLY ECONOMIC REVIEW JUNE 2013
29
Despite the deterioration, specific and general provisions both depicted quarter-on-quarter increase of 1.3 percent to VT2.2 billion and 5.1 percent to VT881.9 million respectively providing additional cushion. Total loan securities also increased by 2.1 percent to VT35.4 billion. Reserve Bank is closely monitoring the level of non-performing loans of individual banks within the industry. Figure 43: Asset Quality – Domestic Banks
(Share of Total Loans, By Loan Category)
Private Sector Lending The industry’s private sector credit registered marginal increase of 0.2 percent to VT52.4 billion (VT52.3 billion: Mar-13), however slower than 1.4 percent growth experience during previous quarter. Over the year this represents an increase of 3.2 percent. The dawdling growth continued to reflect the generally subdued economic condition over the quarter as well as banks’ book management strategy. The increase is attributed to increases in lending to agriculture, fisheries, mining & quarrying, distribution, entertainment & catering, public utilities, construction and miscellaneous sector by 1.7 percent to VT945.9 million, 3.5 percent to VT34.0 million, 3.3 percent to VT207.7 million, 1.1 percent to VT7.2 billion, 6.5 percent to VT273.2 million, 234.3 percent to VT271.8 million, 4.3 percent to VT5.7 billion and 19.2 percent to VT903.0 million respectively.
On the other hand, lending to manufacturing, tourism, transportation, government, financial institutions, professional & others and personal sector registered quarter-on-quarter decline of 4.4 percent to VT1.5 billion, 1.2 percent to VT4.4 billion, 4.9 percent to VT1.2 billion, 18.1 percent to VT244.5 million, 17.5 percent to VT158.8 million, 2.1 percent to VT6.2 billion and 0.9 percent to VT23.1 billion respectively. Figure 44 Private Sector Credit Domestic Banks (Quarterly Data, Levels, billions of Vatu)
In terms of the top five lending sectors, loans to personal sector continued to dominate (44.2 percent) the industry’s private sector credit at the end of the reviewed period. This is followed by distribution, professional & others, construction and tourism sector representing 13.8 percent, 11.9 percent, 11.0 percent and 8.4 percent of the total respectively. Liquidity position The domestic banking industry maintained adequate stock of highly liquid Vatu assets albeit unequal distribution among banks. At the end of June 2013, total vatu liquid assets increased to VT7.7 billion compared to VT7.3 billion during the previous quarter, equivalent to 14.6 percent of the total domestic deposit. The high level of VUV liquidity is reflected in the industry’s liquid asset ratio (LAR) of 21.4 percent, up from 20.2 percent recorded at the end of March 2013. This is comfortably well above the regulatory threshold of 7.0 percent. The industry also reported adequate foreign currency liquidity.
0
4
8
12
16
20
70
75
80
85
90
95
Jun-
10
Jun-
11
Jun-
12
Jun-
13
Jun-
10
Jun-
11
Jun-
12
Jun-
13
Standard Substandard
Doubtful Loss
%%
0 5 10 15 20 25
Agriculture
Fisheries
Mining
Manufacturing
Distribution
Tourism
Entertainment
Transport
Public Utilities
Construction
Government
Financial
Professional
Personal
Misc
Jun-13
Mar-13
Dec-12
Sep-12
Jun-12
VT B

QUARTERLY ECONOMIC REVIEW JUNE 2013
30
Figure 45: Liquid asset ratio –Domestic Banks (Quarterly Data)
Foreign Exchange Turnover The industry’s combined foreign exchange turnover continued to fluctuate over the reviewed period ending at VT7.0 billion (Vt6.1 billion: Mar-13); up 16.2 percent compared to March 2013. This is largely attributed to increases in turnover against Vatu, USD and cross currencies by 15.6 percent to Vt5.2 billion, 17.3 percent to VT1.7 billion and 32.3 percent to VT95.2 million respectively. Conversions against Vatu continued to be mainly from USD currency, while conversions against USD are mostly from AUD currency. Figure 46: Foreign Exchange Turnover Position of Domestic Banks (Quarterly Data) (Billions of Vatu)
International Banks Statement of Financial Position Figure 47: Offshore Banking Industry – Total Assets (Millions of USD, Quarterly Data)
The International Banking industry’s financial position dropped significantly by 27.5 percent to USD44.9 million (USD62.0 million: Mar-13). The fall was attributed to decline in loans and advances by 74.0 percent to USD6.0 million. Investments on the other hand depicted 22.0 percent increase to USD5.5 million. Cash items, marketable securities and other assets reported marginal declines during the period. Of the industry’s combined asset position, Cash items of USD27.2 million represented 60.7 percent of total assets, followed by loans and advances which accounted for 13.3 percent. Marketable securities and Investments accounted for 12.8 percent (USD5.7 million) and 12.3 percent respectively, whilst other assets which represent fixed assets and receivables accounted for less than 1.0 percent (or USD400 thousand) of total assets. (Refer to Figure 45). The industry’s total liabilities (excluding capital) declined over the quarter by 30.3 percent to USD38.9 million (USD55.9 million: Mar-13). The quarterly decline is mainly attributable to decline in deposits from corporations by 30.3 percent to USD38.7 million. Statement of Financial Performance The offshore banking industry’s financial performance worsened during the reviewed period. A net loss of
0
5
10
15
20
25
30
0
5
10
15
20
25
30
Jun-12 Sep-12 Dec-12 Mar-13 Jun-13
Average Total Banks
Minimum Regulatory Requirement
%%
0
2
4
6
8
10
12
0
2
4
6
8
10
12
Jun-12 Sep-12 Dec-12 Mar-13 Jun-13
Cross Currency Against USD
VT BVT B

QUARTERLY ECONOMIC REVIEW JUNE 2013
31
USD178 thousand was reported at the end of the period compared to net loss of USD78 thousand in the previous quarter. The loss reflected significant decline in total operating income by 19.9 percent to USD498 thousand. Total operating expense fell by 2.0 percent to USD721 thousand over the quarter. During the quarter, net interest income fell by 35.0 percent to USD41 thousand reflecting change in balance sheet position. Non-interest income (service charges, commissions and fees) fell by 5.7 percent to USD215 thousand. However, net gains on foreign exchange and securities increased by 25.0 percent to USD45 thousand. Non-interest expense increased by 18.3 percent to USD479 thousand reflecting mainly increase in other operating expenses. The movements contributed to negative ROA and ROE ratios during the period. ROA deteriorated further to -0.5 percent from -0.1 percent and ROE further declined to -4.2 percent from -1.3 percent. Figure 48: Offshore Banking Industry Earnings (Thousands of USD & Percent; Quarterly Data)
Capital The International Banking Industry’s total capital recorded a 1.5 percent decline to USD6.0 million (USD6.1 million: Mar-13). This was mainly attributed to the un-audited loss of USD178 thousand incurred during the quarter. Minimal increase was noted in paid up capital which increased by 0.5 percent to USD 4.8 million whilst retained earnings declined marginally by 1.3 percent to USD1.4 million. On the risk side, the total risk weighted assets recorded significant decline of 62.3 percent to USD10.3 million (USD27.4 million: Mar-13), following
the decline in loans and advances. Operational risk weighted assets remained stable at USD3.1 million. As a result, Tier 1 Capital to Total Risk Weighted Assets increased to 58.1 percent from 22.2 percent in March and Capital Base to total risk weighted assets increased to 58.2 percent from 22.3 percent reported in March. Figure 49: Offshore Banking Industry – Capital (Millions of USD & Percent; Quarterly Data)
3.6 INSURANCE SECTOR DEVELOPMENTS Domestic Insurers
Figure 50: Financial Position (Billions of Vatu; Quarterly Data)
0
200
400
600
800
1,000
1,200
1,400
1,600
1,800
2,000
-
200
400
600
800
1,000
1,200
1,400
1,600
1,800
2,000
Jun-12 Sep-12 Dec-12 Mar-13 Jun-13
VTBVTB
Assets Liabilities Net Assets

QUARTERLY ECONOMIC REVIEW JUNE 2013
32
The admissible asset position for the domestic insurance industry in June 2013 had increased by 5 percent to VT1.7 billion from VT1.63 billion in March. The increase was recorded by all assets with the highest increase recorded by the amount due from reinsures of 120 percent followed by Premium receivables by 24 percent and cash deposits by 1.1 percent. Insurance liabilities had shown a slight declined of 0.9 percent from VT998 million in March to VT989 million in June. The decline was caused mainly by a decline in Gross Outstanding Claims by 11 percent from VT249.5 million in March to VT221.1 million in June. Similarly, Catastrophe reserves had also recorded a decline of 25 percent from VT102 million in March to VT76 million in June. On the other hand, Unexpired risks, IBNR and Contingencies had each recorded increase of 8 percent, 0.63 percent and 36.7 percent respectively. Unexpired risks had increased from VT524 million in March to VT567 million in June and contingencies had increase from VT4.1 million to VT5.6 million in June. Figure 51: Margin of Solvency (Millions of Vatu; Quarterly Data)
MRSM – Minimum Required Solvency Margin. SS – Solvency Surplus The total domestic surplus of admissible assets above minimum solvency level had increase by 18.6 percent to VT569.5 million from VT480 million in March 2013. The increase was attributed mainly to the overall increase in admissible assets, slight declined in technical reserves and catastrophe reserves and also increase in net admissible assets of 14 percent to
VT731 million from VT640 million in March. Net earned premiums had shown a marginal increase of 1.1 percent from VT802 million to VT812 million in June which also contributed to the increase in the surplus admissible assets. The minimum required solvency level in June was VT162 million, a slight increase of 1.1 percent from VT160 million in March. Domestic Industry Performance
Gross Premium (GP) The total gross premium grew by 36.5 percent to VT373.7 million from VT273.6 million in March. Net written premium also grew by 21.9 percent to VT249 million compared to VT204.6 million in March. Reinsurance expenses had declined by 19.8 percent to VT55.3 million from VT69million in March. Net Earned Premium (NEP) Figure 52: Business Performance (Millions of Vatu; Quarterly Data)
Total net earned premium had increase slightly by 1.16 percent to VT812 million from VT802.7 million in March. Claims The gross claims incurred had declined by 35.6 percent from VT107 million in March to VT68.8 million in June and similarly Net Claims incurred had
0
100
200
300
400
500
600
700
800
-
100
200
300
400
500
600
700
800
Jun-12 Sep-12 Dec-12 Mar-13 Jun-13
VTMVTM
MRSM
SS
-100
-50
0
50
100
150
200
250
(100)
(50)
-
50
100
150
200
250
Jun-12 Sep-12 Dec-12 Mar-13 Jun-13
VTMVTM
NWP NCI

QUARTERLY ECONOMIC REVIEW JUNE 2013
33
also declined by 35.2 percent to VT68.3 million from VT105.4 million in March 2013. International Insurers
Figure 53: Financial Position (USD; Quarterly Data)
An increase in the admissible asset position of the international market for the quarter ended 30 June 2013 by 62 percent to USD1.7 million from USD659 thousand in the previous quarter. This is due to a refund in cash deposit by a dominant insurer and recorded as well in liabilities, thus increase in both assets and liabilities. Cash and Deposit are the major components comprising of 89 percent of the total admissible assets. Total Cash and Deposits increased dramatically by 72 percent from USD426 thousand in the previous quarter to USD1.5 million this reporting quarter. Premium receivable net of provision of doubtful debts, which is the second largest component declined by 20 percent to USD186 thousand from USD224 thousand in the previous quarter. Other assets decline by 50 percent to USD5 thousand from USD8 thousand in the last quarter. Insurance liabilities for the international market increased by 77 percent to USD1.4 million from USD342 thousand in the previous quarter. The very large increase in liabilities is being triggered by a one-off provision for a refund by one of the insurers to be made to its owner for a payment made on behalf of the insurer. That particular provision comprise of 83 percentage of total liabilities. Gross Outstanding Claims (GOC) decline by 39 percent to USD245 thousand from USD341 thousand in the previous quarter.
Figure 54: Margin of Solvency
(USD; Quarterly data)
MRSM – minimum required solvency margin SS – Solvency surplus
Solvency surplus declined by 82 percent to USD232 thousand from USD422 thousand. The contributing factor here is the decline in surplus assets (net assets) due to the increase in liabilities. Quarterly Business Performance Figure 55 International Business (USD; Quarterly data)
NWP – Net Written Premium NCI – Net Claims Incurred
0
200
400
600
800
1,000
1,200
1,400
1,600
1,800
2,000
-
200
400
600
800
1,000
1,200
1,400
1,600
1,800
2,000
Jun-12 Sep-12 Dec-12 Mar-13 Jun-13
USD '000USD '000
Admissable Assets Liabilities
Net Admissable Assets
-100
0
100
200
300
400
500
600
700
(100)
-
100
200
300
400
500
600
700
Jun-12 Sep-12 Dec-12 Mar-13 Jun-13
USD '000USD '000
Net Admissable Asssets MRSM SS
0
100
200
300
400
500
600
700
800
900
-
100
200
300
400
500
600
700
800
900
Jun-12 Sep-12 Dec-12 Mar-13 Jun-13
USD '000USD '000
NWP NCI

QUARTERLY ECONOMIC REVIEW JUNE 2013
34
NWP declined by 15 percent to USD601 thousand from USD689 thousand from the previous quarter. NCI increased by 42 percent to USD622 thousand from USD360 thousand in the last quarter. This is due to increased claims experienced by one dominant insurer.
1. Domestic Broker Business
Figure 56: Domestic Broker Business (Millions of Vatu; Quarterly data)
A total of five (5) brokers are licensed in the domestic market with only two locally based whilst the remaining three (3) are based offshore. Figures in this report were obtained from the two locally based brokers as the three offshore brokers have not recorded any business for this reporting quarter. The total premiums transacted through the two local brokers in the domestic market as at end of June is VT176.5 million compared to VT184.3 million recorded in March quarter, representing a decrease of 4.4 percent. The total brokerage fee recorded for the June quarter is VT25.8 million, a decline of 3 percent from VT26.8 million recorded at the end of March quarter. It is anticipated that premium volume will increase next reporting quarter as policies fall due for renewal and new policies are acquired.
Figure 57: Offshore Broker business
(Millions of Vatu; Quarterly data)
The total premium remitted offshore through the local (leading) broker was recorded at VT22.7 million compared to VT14 million recorded at the end of March quarter, representing an increase of 38 percent. The brokerage fee recorded for offshore business for the June quarter is VT4.3 million, an increase of 32 percent from VT2.9 million recorded at the end of March quarter.
3.7 BALANCE OF PAYMENTS Vanuatu’s current account deficit has narrowed by 66 percent reflecting improvements in the Services, Income and Transfers account. The capital account balance continued to remain a surplus, up by 48 percent whilst the financial account contracted significantly. The adverse developments has resulted in an increase in the overall balance of payments with a residual of VT385 million for un-captured in the statement.
0
50
100
150
200
250
300
0
50
100
150
200
250
300
Jun-12 Sep-12 Dec-12 Mar-13 Jun-13
VTMVTM
Premiums Brokerage
0
5
10
15
20
25
30
35
0
5
10
15
20
25
30
35
Jun-12 Sep-12 Dec-12 Mar-13 Jun-13
VTMVTM
Premiums Brokerage
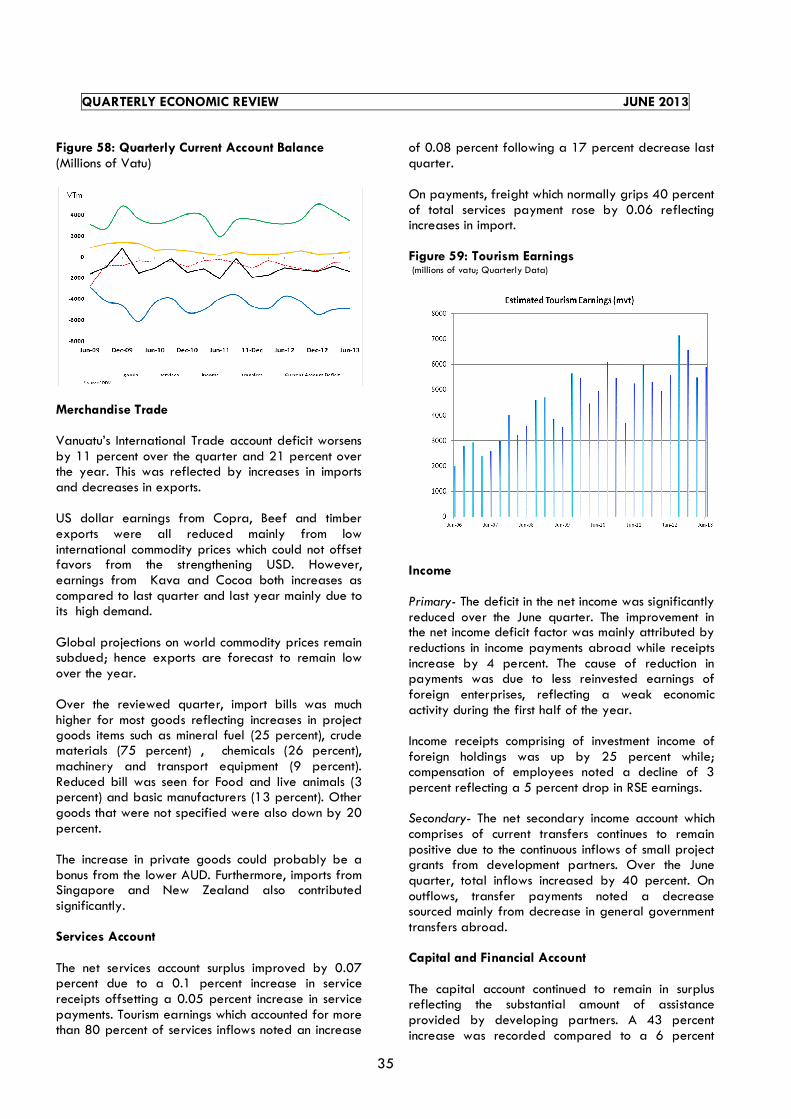
QUARTERLY ECONOMIC REVIEW JUNE 2013
35
Figure 58: Quarterly Current Account Balance (Millions of Vatu)
Merchandise Trade Vanuatu’s International Trade account deficit worsens by 11 percent over the quarter and 21 percent over the year. This was reflected by increases in imports and decreases in exports. US dollar earnings from Copra, Beef and timber exports were all reduced mainly from low international commodity prices which could not offset favors from the strengthening USD. However, earnings from Kava and Cocoa both increases as compared to last quarter and last year mainly due to its high demand. Global projections on world commodity prices remain subdued; hence exports are forecast to remain low over the year. Over the reviewed quarter, import bills was much higher for most goods reflecting increases in project goods items such as mineral fuel (25 percent), crude materials (75 percent) , chemicals (26 percent), machinery and transport equipment (9 percent). Reduced bill was seen for Food and live animals (3 percent) and basic manufacturers (13 percent). Other goods that were not specified were also down by 20 percent. The increase in private goods could probably be a bonus from the lower AUD. Furthermore, imports from Singapore and New Zealand also contributed significantly. Services Account The net services account surplus improved by 0.07 percent due to a 0.1 percent increase in service receipts offsetting a 0.05 percent increase in service payments. Tourism earnings which accounted for more than 80 percent of services inflows noted an increase
of 0.08 percent following a 17 percent decrease last quarter. On payments, freight which normally grips 40 percent of total services payment rose by 0.06 reflecting increases in import. Figure 59: Tourism Earnings (millions of vatu; Quarterly Data)
Income Primary- The deficit in the net income was significantly reduced over the June quarter. The improvement in the net income deficit factor was mainly attributed by reductions in income payments abroad while receipts increase by 4 percent. The cause of reduction in payments was due to less reinvested earnings of foreign enterprises, reflecting a weak economic activity during the first half of the year. Income receipts comprising of investment income of foreign holdings was up by 25 percent while; compensation of employees noted a decline of 3 percent reflecting a 5 percent drop in RSE earnings. Secondary- The net secondary income account which comprises of current transfers continues to remain positive due to the continuous inflows of small project grants from development partners. Over the June quarter, total inflows increased by 40 percent. On outflows, transfer payments noted a decrease sourced mainly from decrease in general government transfers abroad. Capital and Financial Account The capital account continued to remain in surplus reflecting the substantial amount of assistance provided by developing partners. A 43 percent increase was recorded compared to a 6 percent

QUARTERLY ECONOMIC REVIEW JUNE 2013
36
decrease in March. In the medium term, the capital account is expected to remain positive in line with the expected increase in investment grants on government projects. In the financial account, financial assets declined by 4 percent reflecting a 44 percent drop in portfolio securities. Accompanied this decline was a reduction in currency and deposits held abroad. These could not offset increases in both Foreign Direct Investment of enterprises and foreign holding of the Monetary Authority. Financial liabilities were also down by 2 percent with most non residents withdrawing their deposits from resident banks. At end June 2013, official reserves stood at VT16, 723 million from VT16, 630 million in the March quarter. This is sufficient to finance 6.7 months of imports of goods. Over the reviewed period, reserves were mainly sourced from donor inflows and utilized mainly by commercial banks for import financing and government’s debt servicing. With the expected increase of imports in 2013, reserves are forecasted to remain within target at a conservative 6.6 months by end December 2013. Reserves less development funds should bring the import cover down to a conservative forecast of 5.6 International Investment Position By end June 2013, Vanuatu’s international investment position (IIP) further increased its net borrowing position by 2 percent to VT26 680. The new position reflected the decline in the stock of Assets by 4 percent; this more than offset the 2 percent decline in the stock of liabilities. Figure 60: Reserves and Months of Import Cover (Billions of Vatu and Months; Quarterly data)
3.8 EXCHANGE RATE DEVELOPMENTS
The exchange rate developments of the Vatu vis-à-vis its major trading currencies are shown in the following table and charts. During June quarter the vatu appreciated against Euro and USD, and depreciated against the NZD and AUD.
Figure 61: Exchange Rate against USD and AUD (Indices; March 2009=100)
The above chart presented developments in the Vatu/AUD and Vatu/USD exchange rates over recent years. Over the June quarter Vatu was slightly up against the USD, while depreciating slightly against the AUD. The commodity prices continued to decline, they were little changed in Australian dollar terms over the past two months because of the exchange rate depreciation. As of yet, the relatively rapid policy interest rate cuts by the Reserve Bank of Australia does not appear to have fed into the weakening of the Australia Dollar.
Exchange Rate of Vatu/Foreign Currency - end periods
USD AUD NZD Euro
Jun-13 97.02 90.00 75.64 126.50
1 month ago 95.00 91.78 76.70 123.96
% change 2.1 -1.9 -1.4 2.0
3 months ago 91.74 95.79 76.78 117.25
% change 5.8 -6.0 -1.5 7.9
12 months ago 94.23 94.59 74.22 117.24
% change 3.0 -4.9 1.9 7.9
Note : (-) Appreciation of vatu
(+) Depreciation of Vatu

QUARTERLY ECONOMIC REVIEW JUNE 2013
37
Figure 62: Exchange Rate against NZD and EUR
(Indices; March 2009=100)
The above chart shows how the Vatu has moved against the Euro and NZD since March 2009. Over the second quarter of 2013 the Vatu appreciated significantly against the Euro but depreciated against the New Zealand Dollar.
Despite having fallen on a trade-weighted basis since May 2013, the New Zealand dollar remains high and continues to be a headwind for the tradable sector, restricting export earnings and encouraging demand for imports.

QUARTERLY ECONOMIC REVIEW JUNE 2013
38
CHRONOLOGY OF MAJOR EVENTS
NO. BRIEF DESCRIPTION OF MAJOR EVENTS EFFECTIVE DATE
1. Prime Minister Moana Carcasses revealed Portfolio changes, Aid funded Priorities, Legislative changes, and Budgets listing measures to be achieved and completed within the 100 days List in office (Source: Vanuatu Daily Post, Issue No.3828)
11th April 2013
2. The recent bilateral meeting of the EU (including Vanuatu) was held in Apia, Samoa from 4th – 5th April dominated by high level dialogue between the Commissioner, Andris Piebalgs and each of the Pacific Islands Forum represented by their respective National Authorizing Officer (NAO). The Vanuatu NAO and the Director General of the Prime Minister Office Simeon Athy highlighted the discussions surround the ongoing 10th EDF projects. Discussions also surround the experience faced with each of the projects such as 1) TA to NAO, 2) rehabilitation of LAB/AREP schools and contracts for construction works to be signed soon, 3) Productive Sector Growth Support Program (PSGSP) developed during political dialogue developed in 2010, 5) Energy Facilities I and II, and 6) Non State Acts. The Vanuatu NAO further explained that PSGSP sets the stage for the 11th EDF with the three key sector policies that have been developed during the last 2 years, being Overarching Productive Sectors Policy, National Industrial Policy, and Trade Policy Framework and therefore requires support towards Rural Development, linked with agriculture and trade, as the focal sector for the next EDF. On aid modality, Mr. Athy pointed out that the preferred modality is for the next EDF to be a blend of Sector Budget Support and Program Support, allowing for tracking of improvements in the sector in an easier way. (Source: Vanuatu Daily Post, Issue No. 3831)
15th April 2013
3. A workshop on Protecting Domestic Industries Against Unfair International Trade Behavior was held at the Melanesian Hotel in Port Vila which considered a set of draft legislations and polices that will facilitate trade remedy measures, which will comply with the basic rules of the World Trade Organization (WTO). The Director General of the Ministry of Tourism Development and Commerce, Marokon Alilee explained that by introducing legislation on trade remedies, this project financed by the EU, will allow Vanuatu to be protected against unfair trade practices, by increasing duty rates above their maximum value. He cited trade remedies as activities including anti-dumping, countervailing and safeguard measures. (Source: Vanuatu Daily Post, Issue No. 3832)
16th April 2013
4. ANZ Bank Ltd for the first time introduced to its corporate and commercial customers in Vanuatu with the ability to trade directly in Renminbi (RMB) or Chinese Yuan (CNY) when doing business with China. ANZ’s RMB offering further enhances its reputation as a super regional bank and further provides its customers with a number of benefits, including an opportunity to obtain better pricing and contract terms from suppliers in mainland China by settling in CNY and shorter transaction times and cost savings, if both sender and beneficiary settle CNY trade through ANZ. (Source: Vanuatu Daily Post, Issue No. 3845)
1st May 2013
5. The Australian Government announced on Tuesday (14th May) that it will increase Australia’s official development assistance to a record AUD 5.7 billion or VT521 billion in 2013-2014. The new budget earmarks an estimated AUD65.4 million or VT5.9 billion for Vanuatu. This amount includes bilateral, regional and global programs “Australia remains committed to Vanuatu’s development, as demonstrated by the increase in funding of AUD4 million or VT366 million in the new budget”, said Australian High Commissioner, Jeremy Bruer. This increase will enable the commencement of the major new Port Vila Urban Development Project, launched earlier this year during Senator Carr’s visit to Vanuatu. The commitment of funding for the next twelve months will enable ongoing programs in the sectors under the Vanuatu Australia Partnership for Development: education, health, infrastructure, economic governance and law, and justice which include support for primary school grants, scholarships and rural roads. (Source: Vanuatu Daily Post, Issue No. 3858)
16th May 2013
6. Digicel has launched Isi Mani, a unique Mobile Money service which turns a customer’s mobile phone into an electronic wallet. In addition, Isi Mani is further launched in association with National Bank of Vanuatu to provide customers with an NBV account
6th June 2013

QUARTERLY ECONOMIC REVIEW JUNE 2013
39
the added convenience of being able to transfer money between their NBV account and their mobile wallet. (Source: Vanuatu Daily Post, Issue No. 3876)
7. Participants from the different Government Ministries, electricity utility companies, private sectors, solar retailers and Non-government Organizations have benefited from a national capacity building workshop on the Clean Development Mechanism (CDM0 programme of activities) as part of climate change mitigation at the Melanesian Hotel this week. The capacity building workshop was carried out under the ADB Regional Technical Assistance 7394 on Strengthening the Capacity of Pacific Developing member Countries to respond to Climate Change. (Source: Vanuatu Daily Post, Issue No. 3877)
7th June 2013
8. Vanuatu’s certified organic beef export strategy was successfully launched by the Prime Minister Moana Carcasses following a forum organized by the Vanuatu Department of Livestock, supported by the Department of Industry. The Vanuatu Livestock Vision is to increase the national cattle herd to 500,000 head by 2025 with minimum 50% managed by smallholders and an aim of 200,000 head to be certified organic. In conjunction with the current Vision of the Department of Livestock, an industry Action Plan has been outlined that will highlight key restraints, necessary measures for improvements in both quality and quantity of output as well as key agenda to assist small holders in this Vision. (Source: Vanuatu Daily Post, Issue No. 3891)
24th June 2013
9. A delegation was led by Minister of Tourism, Trade, Commerce and Ni-Vanuatu Business Development Marcellino Pipite to the second Australia-Vanuatu Business Forum stage in Brisbane, Australia. The delegation includes Government Officials, Private Sector Community representatives of both countries to dialogue and invent opportunities to partner in doing business between the two countries. This was also an opportunity for the government to showcase investment opportunities to Australian investors. Minister Pipite highlighted that Vanuatu’s economic vision remains focused on value addition and export promotion as key engines for growth and economic development. A number of other issues includes: the economic policy, government initiatives to strengthen Vanuatu’s attractiveness for private sector investors, vision for Pacer Plus agreement and the need to strengthen the Australian’s bilateral cooperation on trade and private sector development. (Source: Vanuatu Daily Post, Issue No.3892)
25th June 2013
10. Vanuatu’s largest energy provider, Unelco SDF Suez is keeping up to its objective to reduce energy dependency with the success of its renewable energy projects. The company has revealed that 30% of powers supplied are from renewable sources, namely windmill (10%), Japanese funded Sarakata hydro (7%) and cocofuel in Tagabe and Malekula (13%). Frederic Petit, General Manager of Cofely Vanuatu, a company associated with Unelco that runs the Tagabe copra mill said the company is currently supplying 200,000 to 300,000 liters of coconut oil to the power station per month. He further highlighted that the mill has the capacity to press 600 kg per hour which would total to 4000 tons of copra per year. Copra is a fitting renewable energy sources because it includes its availability in the country, it provides a stable local market, improve rural economy, provide employment and help the environment. (Source: Vanuatu Daily Post, Issue No. 3893)
26th June 2013
11. The Vanuatu Tourism Organization (VTO) has taken the first steps in creating a professional On-Line Photo Library to promote Vanuatu as a premier holiday destination. Professional photographer David Kirkland, who has a long association with Vanuatu and is regards as one of the regions’ top travel and tourism photographers, has been commissioned by the VTO to photograph Vanuatu’s tourism highlights and build a library of promotional images. (Source: Vanuatu Daily Post, Issue No.3393)
26th June 2013
12. The Vanuatu government’s budgetary allocation of around VT108 million for the 2013 Copra Subsidy program has been exhausted. As a result, the government has suspended the Copra Subsidy program, effective 26th June. This follows the immediate effect, transferring of the responsibility for the Vanuatu commodities Marketing Bard (VCMB) from the Ministry of Tourism and Commerce (MTC) and assigning it to the Prime Minister’s Office (PMO). This advice also further instructed all buyers to re-adjust their purchasing price of copra in line with the world market price
29th June 2013

QUARTERLY ECONOMIC REVIEW JUNE 2013
40
of copra oil effective from June 26, 2013. (Source: Vanuatu Daily Post, Issue No.3896)
13. Chairman of the Board of Directors, Simeon Athy and Chief Executive Officers Joseph Laloyer announced Air Vanuatu has posted a profit of 314 million vatu for the year ending 2012 at a Shareholders’ meeting held in May. The announcement shows the national carrier has continued its trajectory of good governance, customer service improvements and financial stability by announcing. “The financial improvement at the airline is significant – up by 286 million vatu in just 12 months, “CEO Joseph Laloyer said. Air Vanuatu intends to reinvest the profit in the company and is working towards buying additional aircraft in the next financial year. The company is currently negotiating to purchase a second Twin Otter aircraft and additional ATR72-500 necessary to keep up with the demand of increased passenger and freight loads within Vanuatu. (Source: Vanuatu Daily Post, Issue No. 3896)
29th June 2013

QUARTERLY ECONOMIC REVIEW JUNE 2013
41
TABLE 1: ASSETS OF THE RESERVE BANK OF VANUATU(Millions of Vatu)
End of Foreign Sector Commercial Public Sector Other Total
Period Banks Assets Assets
Foreign SDR RTP Total Claims on Claims on Claims on Total
Exchange Holdings with IMF Com/Banks Government NFPE2008 12,319.3 225.6 434.2 12,979.0 650.0 620.8 - 1,270.8 1,531.1 15,780.9 2009 13,928.0 244.1 382.2 14,554.3 - 618.5 - 618.5 1,929.1 17,101.9 2010 14,452.5 224.0 358.6 15,035.1 - 1,419.4 1,419.4 2,109.7 18,564.2 2011 15,686.9 212.4 359.3 16,258.7 - 1,518.5 1,518.5 2,029.4 19,806.6 2012 16,148.8 214.3 350.5 16,713.6 - 1,518.3 - 1,518.3 1,890.1 20,122.0
2008 Q1 11,162.2 193.1 389.7 11,745.0 - 802.9 - 802.9 918.2 13,466.1 Q2 11,241.4 196.2 389.7 11,827.3 - 733.3 - 733.3 998.5 13,559.1 Q3 11,710.9 199.5 389.7 12,300.1 - 731.4 - 731.4 1,271.2 14,302.8 Q4 12,319.3 225.6 434.2 12,979.0 650.0 620.8 - 1,270.8 1,531.1 15,780.9
2009 Q1 11,577.6 226.9 434.2 12,238.7 500.0 620.1 - 1,120.1 1,823.4 15,182.2 Q2 12,162.7 227.5 434.2 12,824.4 - 619.7 - 619.7 1,859.8 15,303.9 Q3 11,784.8 3,057.6 434.2 15,276.6 - 619.9 - 619.9 2,094.6 17,991.1 Q4 13,928.0 244.1 382.2 14,554.3 - 618.5 - 618.5 1,929.1 17,101.9
2010 Q1 14,362.2 241.8 382.2 14,986.2 - 621.0 - 621.0 1,961.1 17,568.3 Q2 14,882.5 243.1 382.2 15,507.9 - 620.7 - 620.7 1,914.6 18,043.2 Q3 14,686.1 243.6 382.2 15,312.0 - 1,417.9 - 1,417.9 2,037.1 18,766.9 Q4 14,452.5 224.0 358.6 15,035.1 - 1,419.4 - 1,419.4 2,109.7 18,564.2
2011 Q1 14,586.1 223.0 362.0 15,171.1 - 1,369.2 - 1,369.2 2,051.7 18,591.9 Q2 14,795.7 217.4 356.2 15,369.3 - 1,517.9 - 1,517.9 2,029.4 18,916.7 Q3 15,027.4 222.8 369.6 15,619.8 - 1,517.6 - 1,517.6 1,946.1 19,083.6 Q4 15,686.9 212.4 359.3 16,258.7 - 1,518.5 - 1,518.5 2,029.4 19,806.6
2012 Q1 15,884.7 211.2 353.2 16,449.1 - 1,518.5 - 1,518.5 1,963.4 19,931.0 Q2 16,388.0 212.2 356.0 16,956.2 - 1,518.5 - 1,518.5 1,915.2 20,389.9 Q3 16,421.5 209.2 353.1 16,983.8 - 1,518.3 - 1,518.3 1,942.8 20,444.9 Q4 16,148.8 214.3 350.5 16,713.6 - 1,518.3 - 1,518.3 1,890.1 20,122.0
2013 Q1 16,077.8 209.2 342.7 16,629.7 - 1,518.3 - 1,518.3 2,054.2 20,202.2 Q2 16,136.6 221.9 364.1 16,722.6 - 1,518.3 - 1,518.3 1,971.2 20,212.1

QUARTERLY ECONOMIC REVIEW JUNE 2013
42
TABLE 2: LIABILITIES OF THE RESERVE BANK OF VANUATU(Millions of Vatu)
End of Foreign Government Contribution Deposits RBV Other Total
Period Currency Com/Bank's Com/Bank's Total Liabilities Deposits, to RTP of NFPE Notes Liabilities Liabilities
outside Bank's Vault Cash Deposits with RBV of which with IMF2008 3,756.4 1,247.7 4,273.3 9,277.4 164.8 3,441.3 434.2 - 1,275.2 1,622.1 15,780.9 2009 3,916.5 1,365.2 4,139.1 9,420.8 2,954.7 3,057.7 382.2 - 946.4 722.3 17,101.9 2010 4,553.3 1,320.0 5,283.5 11,156.7 2,714.1 2,756.4 358.6 - 1,196.5 740.5 18,564.2 2011 4,885.7 1,686.4 5,308.7 11,880.8 2,477.4 2,823.9 359.3 - 1,619.1 1,005.3 19,806.6 2012 4,889.1 2,073.4 6,029.6 12,992.1 2,421.1 2,854.5 350.5 - 802.3 1,052.0 20,122.0
2008 Q1 3,277.8 972.5 3,884.5 8,134.8 275.9 2,646.1 389.7 - 1,321.1 1,083.1 13,466.1 Q2 3,674.2 954.9 3,791.5 8,420.6 362.7 2,749.6 389.7 - 1,147.4 878.8 13,559.1 Q3 3,687.8 879.2 4,232.4 8,799.3 611.8 3,244.8 389.7 - 238.6 1,408.4 14,302.8 Q4 3,756.4 1,247.7 4,273.3 9,277.4 164.8 3,441.3 434.2 - 1,275.2 1,622.1 15,780.9
2009 Q1 3,249.5 1,008.9 3,283.2 7,541.6 163.4 3,869.9 434.2 - 2,012.7 1,594.6 15,182.2 Q2 3,563.3 974.4 4,165.4 8,703.1 627.5 3,647.8 434.2 - 1,126.7 1,198.8 15,303.9 Q3 3,663.6 851.8 4,151.2 8,666.6 3,409.3 3,128.6 434.2 - 1,641.9 1,144.6 17,991.1 Q4 3,916.5 1,365.2 4,139.1 9,420.8 2,954.7 3,057.7 382.2 - 946.4 722.3 17,101.9
2010 Q1 3,545.2 994.5 5,367.2 9,906.8 2,706.2 3,156.9 382.2 - 1,082.5 715.9 17,568.3 Q2 3,924.1 969.4 4,593.7 9,487.2 2,813.2 3,169.7 382.2 - 1,946.4 626.2 18,043.2 Q3 4,178.1 1,038.3 5,263.1 10,479.5 2,715.0 3,890.0 382.2 - 647.8 1,034.6 18,766.9 Q4 4,553.3 1,320.0 5,283.5 11,156.7 2,714.1 2,756.4 358.6 - 1,196.5 740.5 18,564.2
2011 Q1 4,162.3 1,193.4 4,874.8 10,230.5 2,508.6 2,890.5 362.0 - 2,195.6 766.8 18,591.9 Q2 4,557.5 1,238.2 4,724.3 10,520.0 2,471.1 3,305.4 356.2 - 1,816.8 803.4 18,916.7 Q3 4,693.8 1,230.6 5,560.9 11,485.2 2,547.7 3,164.1 369.6 - 1,036.1 850.5 19,083.6 Q4 4,885.7 1,686.4 5,308.7 11,880.8 2,477.4 2,823.9 359.3 - 1,619.1 1,005.3 19,806.6
2012 Q1 4,505.4 1,338.2 6,477.8 12,321.3 2,436.8 3,104.1 353.2 - 1,120.9 947.9 19,931.0 Q2 4,669.6 1,428.1 6,012.9 12,110.6 2,457.7 3,822.0 356.0 - 1,084.1 915.6 20,389.9 Q3 4,900.0 1,528.6 6,953.4 13,381.9 2,438.8 2,526.8 353.1 - 1,068.1 1,029.3 20,444.9 Q4 4,889.1 2,073.4 6,029.6 12,992.1 2,421.1 2,854.5 350.5 - 802.3 1,052.0 20,122.0
2013 Q1 4,595.9 1,681.3 6,029.6 12,306.9 2,368.7 2,807.3 342.7 1,357.5 1,361.8 20,202.2 Q2 4,775.8 1,384.8 6,929.7 13,090.3 2,542.7 2,725.5 364.1 1,277.6 575.9 20,212.1

QUARTERLY ECONOMIC REVIEW JUNE 2013
43
TABLE 3: ASSETS OF COMMERCIAL BANKS
(Millions of Vatu)
Reserves RBV Foreign Domestic Credit Other Total
End of Vault Deposits Total Notes Assets Claims on Claims on Claims on Claims on Inter-bank Total Assets Assets
Period Cash with RBV 1/ Government Municipalities NFPE Private Claims ClaimsSector
2008 1,247.7 4,273.3 5,521.0 1,275.2 36,695.3 482.4 12.9 71.8 32,768.3 - 33,335.3 2,446.3 79,273.1 2009 1,365.2 4,138.9 5,504.1 946.4 30,350.3 434.5 16.5 107.3 39,282.6 - 39,840.8 3,885.0 80,526.6 2010 1,320.0 5,283.5 6,603.5 1,196.5 21,780.6 786.3 15.8 95.3 43,857.3 61.4 44,754.7 3,342.7 77,677.9 2011 1,686.4 5,308.7 6,995.1 1,619.1 16,198.7 1,186.7 33.6 410.2 47,856.3 - 49,486.8 3,155.5 77,455.3 2012 2,073.4 6,029.6 8,103.0 802.3 12,957.9 787.0 36.3 370.9 51,170.4 350.0 52,364.6 3,577.7 77,805.5
2008 Q1 972.5 3,810.5 4,783.0 1,321.1 34,695.1 567.9 13.1 70.5 25,553.4 - 26,204.9 2,175.5 69,253.6
Q2 954.9 3,441.3 4,396.2 1,147.4 36,446.2 473.6 15.5 71.4 28,201.2 350.0 29,111.8 2,738.0 73,839.7
Q3 898.2 4,187.1 5,085.3 239.2 34,679.0 483.1 17.6 71.9 30,968.6 - 31,541.2 2,570.5 74,115.1
Q4 1,247.7 4,273.3 5,521.0 1,275.2 36,695.3 482.4 12.9 71.8 32,768.3 - 33,335.3 2,446.3 79,273.1
2009 Q1 1,008.9 3,283.2 4,292.1 2,012.7 31,631.8 434.5 17.7 73.5 35,841.6 150.0 36,367.2 3,051.9 77,355.6 Q2 974.4 4,109.9 5,084.3 1,126.7 28,990.2 434.5 13.3 111.2 36,715.8 300.0 37,274.7 3,051.9 75,527.8 Q3 851.8 4,143.7 4,995.5 1,641.9 30,377.5 434.5 12.1 109.1 38,152.0 300.0 38,707.6 3,526.7 79,249.2 Q4 1,365.2 4,138.9 5,504.1 946.4 30,350.3 434.5 16.5 107.3 39,282.6 - 39,840.8 3,885.0 80,526.6
2010 Q1 994.5 5,367.2 6,361.7 1,082.5 28,100.2 587.0 11.6 103.1 40,257.3 - 40,959.1 3,111.5 79,614.9 Q2 969.4 4,593.7 5,563.1 1,946.4 25,751.9 686.7 15.3 99.1 41,571.2 - 42,372.3 3,742.2 79,375.9 Q3 1,038.3 5,263.1 6,301.4 647.8 22,778.2 686.7 17.3 95.9 42,473.3 - 43,273.2 3,715.0 76,715.6 Q4 1,320.0 5,283.5 6,603.5 1,196.5 21,780.6 786.3 15.8 95.3 43,857.3 61.4 44,754.7 3,342.7 77,677.9
2011 Q1 1,193.4 4,874.8 6,068.2 2,195.6 19,297.0 786.3 8.1 93.2 44,722.9 152.0 45,610.4 4,736.9 77,908.1 Q2 1,238.2 4,724.3 5,962.5 1,816.8 18,185.1 986.3 6.6 89.3 45,639.7 - 46,722.0 3,516.2 76,202.7 Q3 1,230.6 5,560.9 6,791.5 1,036.1 18,024.3 1,086.3 9.9 88.3 46,809.3 100.4 47,993.9 5,318.1 79,163.9 Q4 1,686.4 5,308.7 6,995.1 1,619.1 16,198.7 1,186.7 33.6 410.2 47,856.3 - 49,486.8 3,155.5 77,455.3
2012 Q1 1,338.2 6,477.8 7,816.0 1,120.9 16,772.9 1,184.6 29.4 550.0 49,362.8 - 51,126.8 3,085.4 79,921.9 Q2 1,428.1 6,012.9 7,441.0 1,084.1 15,709.2 1,085.0 30.1 479.7 49,997.5 - 51,592.2 3,091.5 78,917.9 Q3 1,528.6 6,953.4 8,482.0 1,068.1 15,327.8 985.0 33.5 33.5 49,906.7 - 50,958.6 3,688.3 79,524.7 Q4 2,073.4 6,029.6 8,103.0 802.3 12,957.9 787.0 36.3 370.9 51,170.4 350.0 52,364.6 3,577.7 77,805.5
2013 Q1 1,681.3 3,577.8 5,259.1 1,357.5 12,957.9 787.0 36.0 550.4 51,704.7 94.5 53,078.1 4,306.5 76,959.1 Q2 1,384.8 6,929.7 8,314.5 1,277.6 10,445.4 787.0 32.5 503.0 51,835.9 - 53,158.4 3,605.9 76,801.7
1/ Includes small amounts of claims on foreign monetary authorities in the form of foreign currency notes and coins.

QUARTERLY ECONOMIC REVIEW JUNE 2013
44
TABLE 4: LIABILITIES OF COMMERCIAL BANKS
(Millions of Vatu)
Demand Deposits Savings Deposits Time Deposits Foreign Government Other Total
Liabilities Deposits Liabilities Liabilities
End of Local Foreign Total Local Foreign Total Local Foreign TotalPeriod Currency Currency Currency Currency Currency Currency
2008 7,690.7 8,564.9 16,255.6 4,315.6 261.7 4,577.4 15,301.3 19,981.9 35,283.2 8,631.9 671.7 13,853.3 79,273.1 2009 7,625.2 10,906.6 18,531.8 4,047.1 280.8 4,327.9 17,332.2 16,037.3 33,369.5 8,540.9 966.2 14,790.4 80,526.6 2010 9,494.3 8,097.5 17,591.8 5,146.1 390.4 5,536.5 18,016.3 10,854.1 28,870.4 12,226.1 632.2 12,820.8 77,677.9 2011 9,700.7 7,827.0 17,527.7 5,360.6 376.8 5,737.4 19,956.5 9,180.4 29,136.9 9,867.0 593.9 14,592.5 77,455.3 2012 9,714.4 8,030.8 17,745.3 6,094.8 410.4 6,505.3 18,781.2 9,009.5 27,790.7 8,403.8 651.2 16,709.2 77,805.5
2008 Q1 7,230.9 7,847.4 15,078.3 3,324.2 269.6 3,593.8 12,532.8 19,372.2 31,905.0 8,174.7 295.8 10,205.9 69,253.6
Q2 8,151.2 7,930.6 16,081.8 3,624.6 261.8 3,886.5 13,965.5 20,613.3 34,578.8 7,874.8 372.2 11,045.7 73,839.7
Q3 8,201.9 7,266.1 15,468.1 3,698.8 370.1 4,068.9 14,822.4 19,668.2 34,490.6 8,298.8 339.4 11,449.3 74,115.1
Q4 7,690.7 8,564.9 16,255.6 4,315.6 261.7 4,577.4 15,301.3 19,981.9 35,283.2 8,631.9 671.7 13,853.3 79,273.1
2009 Q1 8,210.0 9,351.4 17,561.4 3,704.6 260.9 3,965.6 15,991.8 16,334.7 32,326.5 8,675.5 791.2 14,035.4 77,355.6
Q2 7,987.0 8,042.4 16,029.3 3,981.9 228.6 4,210.5 16,206.2 17,640.1 33,846.3 6,591.4 784.7 14,065.5 75,527.8
Q3 8,087.1 9,415.4 17,502.5 4,104.7 208.8 4,313.5 16,966.6 17,187.2 34,153.8 7,366.9 908.1 15,004.5 79,249.2
Q4 7,625.2 10,906.6 18,531.8 4,047.1 280.8 4,327.9 17,332.2 16,037.3 33,369.5 8,540.9 966.2 14,790.4 80,526.6
2010 Q1 8,009.7 9,297.3 17,307.0 4,144.4 406.7 4,551.1 18,064.2 14,097.8 32,162.0 10,438.2 1,332.1 13,824.5 79,614.9
Q2 8,544.5 8,249.7 16,794.2 4,255.2 996.2 5,251.4 17,796.1 11,978.5 29,774.5 11,071.4 1,349.0 15,135.3 79,375.9
Q3 9,445.5 7,584.8 17,030.2 4,820.0 406.6 5,226.6 18,072.2 10,889.8 28,962.0 12,210.7 622.5 12,663.6 76,715.6
Q4 9,494.3 8,097.5 17,591.8 5,146.1 390.4 5,536.5 18,016.3 10,854.1 28,870.4 12,226.1 632.2 12,820.8 77,677.9
2011 Q1 8,911.9 7,816.3 16,728.2 5,327.6 366.6 5,694.3 18,998.8 10,269.7 29,268.4 11,357.5 599.0 14,260.7 77,908.1
Q2 8,777.5 8,506.6 17,284.1 5,558.6 369.5 5,928.1 18,989.8 8,509.5 27,499.3 10,933.8 634.9 13,922.5 76,202.7
Q3 9,071.4 8,552.0 17,623.4 5,378.0 438.1 5,816.1 20,019.7 8,516.0 28,535.7 10,550.6 547.4 13,090.6 79,163.9
Q4 9,700.7 7,827.0 17,527.7 5,360.6 376.8 5,737.4 19,956.5 9,180.4 29,136.9 9,867.0 593.9 14,592.5 77,455.3
2012 Q1 9,880.6 9,217.6 19,098.2 5,261.4 371.5 5,632.9 19,661.3 9,948.4 29,609.7 9,850.9 519.6 15,210.6 79,921.9
Q2 9,358.8 9,030.8 18,389.6 5,857.3 408.2 6,265.5 19,704.5 9,924.1 29,628.6 8,736.9 575.4 15,321.9 78,917.9
Q3 10,234.9 8,832.9 19,067.8 6,168.8 589.1 6,757.9 19,514.8 9,108.6 28,623.4 8,757.1 665.0 15,653.4 79,524.7
Q4 9,714.4 8,030.8 17,745.3 6,094.8 410.4 6,505.3 18,781.2 9,009.5 27,790.7 8,403.8 651.2 16,709.2 77,805.5
2013 Q1 10,645.9 9,231.5 19,877.4 6,082.7 410.4 6,493.1 18,731.3 8,443.1 27,174.4 6,076.3 631.9 16,706.0 76,959.2
Q2 10,451.5 8,609.1 19,060.6 6,082.7 410.4 6,493.1 19,063.5 7,504.4 26,567.9 6,996.6 810.5 16,873.1 76,801.7
2/ Government deposits in Vatu and Foreign currency.

QUARTERLY ECONOMIC REVIEW JUNE 2013
45
TABLE 5 : MONETARY SURVEY: A CONSOLIDATED STATEMENTS OF ACCOUNTS OF THE MONETARY INSTITUTIONS(Millions of Vatu)
NET FOREIGN ASSETS(NFA) DOMESTIC CREDIT
End of 'Monetary Authorities 'Commercial Banks 'Claims Claims 'Claims on Claims on Total Period Foreign Foreign Net Foreign Foreign Net Total on on Private Municip- Domestic
Assets Liabilities Assets Liabilities NFA Govt.(Net) NFPE 1/ Sector 2/ alities Credit
2008 12,979.0 164.8 12,814.2 36,695.3 8,631.9 28,063.4 40,877.6 -3,009.9 71.8 33,215.5 15.5 30,292.9 2009 14,554.3 2,954.7 11,599.7 30,350.3 8,540.9 21,809.4 33,409.0 -2,970.9 107.3 39,981.7 16.5 37,134.5 2010 15,035.1 2,714.1 12,321.1 21,780.6 12,226.1 9,554.4 21,875.5 -1,183.0 95.3 43,957.1 15.8 42,885.2 2011 16,258.7 2,477.4 13,781.2 16,198.7 9,867.0 6,331.7 20,112.9 -712.6 410.2 49,150.1 33.6 48,881.3 2012 16,713.6 2,421.1 14,292.5 12,957.9 8,403.8 4,554.0 18,846.6 -1,200.4 370.9 51,261.7 36.3 50,468.5
2008 Q1 11,745.0 275.9 11,469.1 34,695.1 8,174.7 26,520.4 37,989.5 -1,571.1 70.5 25,712.2 13.1 24,224.7 Q2 11,827.3 362.7 11,464.6 36,446.2 7,874.8 28,571.4 40,036.0 -1,914.9 71.4 28,425.1 15.5 26,597.2 Q3 12,300.1 611.8 11,688.3 34,679.0 8,298.8 26,380.2 38,068.5 -2,369.6 71.9 31,296.1 17.6 29,015.9 Q4 12,979.0 164.8 12,814.2 36,695.3 8,631.9 28,063.4 40,877.6 -3,009.9 71.8 33,215.5 12.9 30,290.3
2009 Q1 12,238.7 163.4 12,075.2 31,631.8 8,675.5 22,956.3 35,031.5 -3,606.6 73.5 35,841.6 17.7 32,326.1 Q2 12,824.4 627.5 12,196.9 28,990.2 6,591.4 22,398.8 34,595.7 -3,378.3 111.2 37,345.3 13.3 34,091.5 Q3 15,879.5 3,409.3 12,470.1 30,377.5 7,366.9 23,010.6 35,480.8 -2,982.3 109.1 39,358.7 12.1 36,497.6 Q4 14,554.3 2,954.7 11,599.7 30,350.3 8,540.9 21,809.4 33,409.0 -2,970.9 107.3 39,981.7 16.5 37,134.5
2010 Q1 14,986.2 2,706.2 12,280.0 28,100.2 10,438.2 17,662.0 29,942.0 -3,280.9 103.1 41,001.3 11.6 37,835.1 Q2 15,507.9 2,813.2 12,694.7 25,751.9 11,071.4 14,680.4 27,375.1 -3,211.3 99.1 42,338.0 15.3 39,241.1 Q3 15,312.0 2,715.0 12,596.9 22,778.2 12,210.7 10,567.5 23,164.5 -2,407.9 95.9 42,559.7 17.3 40,265.0 Q4 15,035.1 2,714.1 12,321.1 21,780.6 12,226.1 9,554.4 21,875.5 -1,183.0 95.3 43,957.1 15.8 42,885.2
2011 Q1 15,171.1 2,508.6 12,662.5 19,297.0 11,357.5 7,939.5 20,602.0 -1,334.0 93.2 44,826.0 8.1 43,593.3 Q2 15,369.3 2,467.4 12,901.9 18,185.1 10,933.8 7,251.3 20,153.2 -1,436.1 89.3 44,293.2 6.6 42,953.1 Q3 15,619.8 2,547.7 13,072.1 18,024.3 10,550.6 7,473.7 20,545.8 -1,107.5 88.3 46,912.1 9.9 45,902.8 Q4 16,258.7 2,477.4 13,781.2 16,198.7 9,867.0 6,331.7 20,112.9 -712.6 410.2 49,150.1 33.6 48,881.3
2012 Q1 16,449.1 2,436.8 14,012.3 16,772.9 9,850.9 6,921.9 20,934.2 -920.5 550.0 50,656.6 29.4 50,315.5 Q2 16,956.2 2,457.7 14,498.5 15,709.2 8,736.9 6,972.2 21,470.7 -1,793.8 479.7 49,997.5 30.1 48,713.4 Q3 16,983.8 2,438.8 14,545.0 15,327.8 8,757.1 6,570.6 21,115.6 -688.5 33.5 49,999.8 33.5 49,378.2 Q4 16,713.6 2,421.1 14,292.5 12,957.9 8,403.8 4,554.0 18,846.6 -1,200.4 370.9 51,261.7 36.3 50,468.5
2013 Q1 16,629.7 2,368.7 14,260.9 10,677.0 6,076.3 4,600.8 18,861.7 -1,133.9 550.4 51,788.4 36.0 51,240.9 Q2 16,722.6 2,542.7 14,179.9 10,445.4 6,996.6 3,448.8 17,628.8 -1,230.7 503.0 51,907.5 32.5 51,212.3
1/ Including claims on Vanuatu Commodities Marketing Board (VCMB).2/ Including claims on RBV staff and excluding credit corp

QUARTERLY ECONOMIC REVIEW JUNE 2013
46
TABLE 5 : MONETARY SURVEY: A CONSOLIDATED STATEMENTS OF ACCOUNTS OF THE MONETARY INSTITUTIONS …Continue(Millions of Vatu)
Liquidity
End of Money Quasi-money Total OtherPeriod Currency Demand deposits Total Time & Sav. Time & Sav. Total Liquidity Items (Net)
outside Banks L currency F currency deposit(VT) deposit( F C)2008 3,756.4 7,690.7 8,564.9 20,012.0 19,617.0 20,243.6 39,860.6 59,872.6 11,297.9 2009 3,916.5 7,625.2 10,906.6 22,448.3 21,379.3 16,318.1 37,697.4 60,145.6 10397.9
2010 4,553.3 9,494.3 8,097.5 22,145.1 23,162.4 11,244.5 34,406.9 56,551.9 8208.82011 4,885.7 9,700.7 7,827.0 22,413.3 25,317.1 9,557.2 34,874.3 57,287.6 11706.62012 4,889.1 9,714.4 8,030.8 22,634.4 24,876.0 9,419.9 34,295.9 56,930.3 12384.8
2008 Q1 3,281.0 7,230.9 7,847.4 18,359.4 15,857.0 19,641.8 35,498.8 53,858.1 8356.1
Q2 3,674.2 8,151.2 7,930.6 19,756.0 17,590.1 20,038.2 37,628.4 57,384.4 9248.9Q3 3,690.9 8,201.9 7,266.1 19,159.0 18,521.3 20,038.2 38,559.5 57,718.5 9366.0Q4 3,756.4 7,690.7 8,564.9 20,012.0 19,616.9 20,243.6 39,860.6 59,872.6 11295.2
2009 Q1 3,249.5 8,210.0 9,351.4 20,810.9 19,696.4 16,595.7 36,292.1 57,103.0 10254.7
Q2 3,563.3 7,987.0 8,042.4 19,592.6 20,188.1 17,868.7 38,056.8 57,649.4 11037.7Q3 3,663.6 8,087.1 9,415.4 21,166.1 21,071.3 17,395.9 38,467.3 59,633.4 12344.9Q4 3,916.5 7,625.2 10,906.6 22,448.3 21,379.3 16,318.1 37,697.4 60,145.6 10397.9
2010 Q1 3,545.2 8,009.7 9,297.3 20,852.2 22,208.6 14,504.5 36,713.1 57,565.3 10211.8
Q2 3,924.1 8,544.5 8,249.7 20,718.3 22,051.3 12,974.7 35,026.0 55,744.3 10871.9Q3 4,178.1 9,445.5 7,584.8 21,208.3 22,892.2 11,296.4 34,188.6 55,396.9 8032.5Q4 4,553.3 9,494.3 8,097.5 22,145.1 23,162.4 11,244.5 34,406.9 56,551.9 8208.8
2011 Q1 4,162.3 8,911.9 7,816.3 20,890.5 24,326.4 10,636.3 34,962.7 55,853.2 8342.1
Q2 4,557.5 8,777.5 8,506.6 21,841.5 24,548.5 8,878.9 33,427.4 55,269.0 7837.3Q3 4,693.8 9,071.4 8,552.0 22,317.2 25,397.7 8,954.1 34,351.9 56,669.0 9779.5Q4 4,885.7 9,700.7 7,827.0 22,413.3 25,317.1 9,557.2 34,874.3 57,287.6 11706.6
2012 Q1 4,505.4 9,880.6 9,217.6 23,603.6 24,922.6 10,320.0 35,242.6 58,846.1 12403.5
Q2 4,669.6 9,358.8 9,030.8 23,059.2 25,561.8 10,332.3 35,894.1 58,953.3 11230.8Q3 4,900.0 10,234.9 8,832.9 23,967.8 25,683.6 9,697.7 35,381.3 59,349.1 11144.8Q4 4,889.1 9,714.4 8,030.8 22,634.4 24,876.0 9,419.9 34,295.9 56,930.3 12384.8
2013 Q1 4,595.9 10,645.9 9,231.5 24,473.3 24,670.0 8,816.7 33,486.7 57,960.0 12142.6
Q2 4,775.8 10,451.5 8,609.1 23,836.4 25,184.2 7,930.2 33,114.4 56,950.8 11890.2
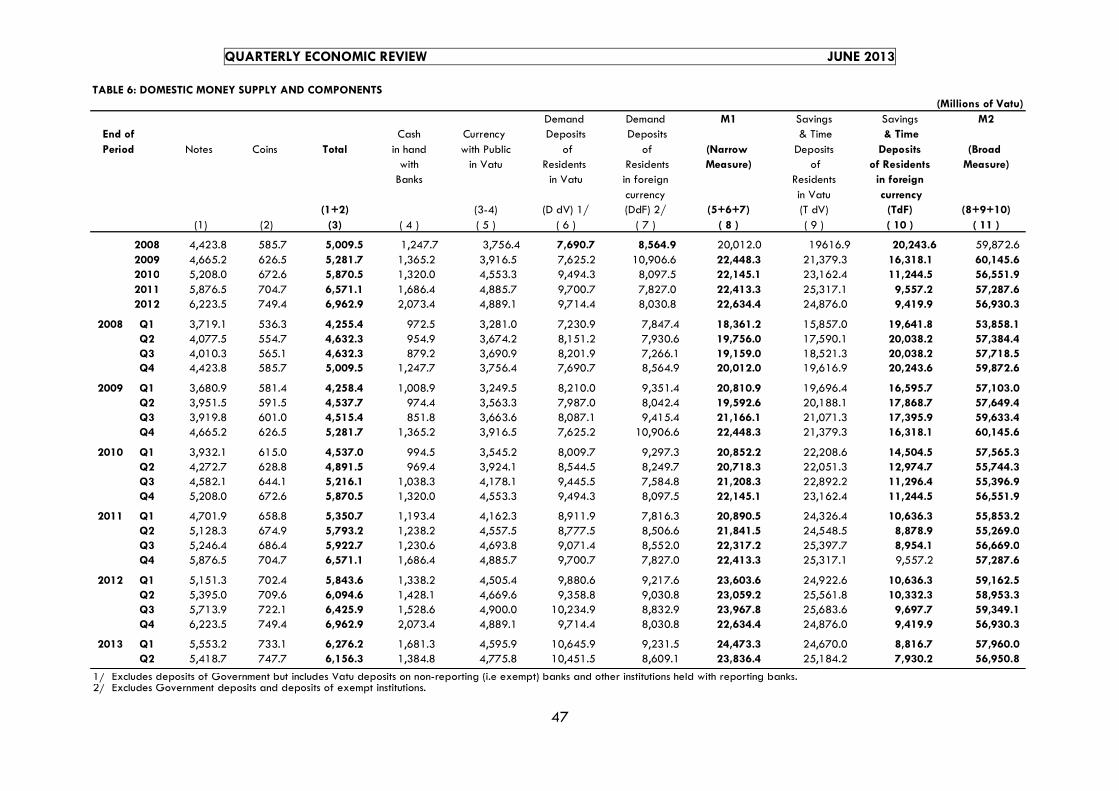
QUARTERLY ECONOMIC REVIEW JUNE 2013
47
TABLE 6: DOMESTIC MONEY SUPPLY AND COMPONENTS(Millions of Vatu)
Demand Demand M1 Savings Savings M2End of Cash Currency Deposits Deposits & Time & Time
Period Notes Coins Total in hand with Public of of (Narrow Deposits Deposits (Broad with in Vatu Residents Residents Measure) of of Residents Measure)Banks in Vatu in foreign Residents in foreign
currency in Vatu currency(1+2) (3-4) (D dV) 1/ (DdF) 2/ (5+6+7) (T dV) (TdF) (8+9+10)
(1) (2) (3) ( 4 ) ( 5 ) ( 6 ) ( 7 ) ( 8 ) ( 9 ) ( 10 ) ( 11 )
2008 4,423.8 585.7 5,009.5 1,247.7 3,756.4 7,690.7 8,564.9 20,012.0 19616.9 20,243.6 59,872.6 2009 4,665.2 626.5 5,281.7 1,365.2 3,916.5 7,625.2 10,906.6 22,448.3 21,379.3 16,318.1 60,145.6 2010 5,208.0 672.6 5,870.5 1,320.0 4,553.3 9,494.3 8,097.5 22,145.1 23,162.4 11,244.5 56,551.9 2011 5,876.5 704.7 6,571.1 1,686.4 4,885.7 9,700.7 7,827.0 22,413.3 25,317.1 9,557.2 57,287.6 2012 6,223.5 749.4 6,962.9 2,073.4 4,889.1 9,714.4 8,030.8 22,634.4 24,876.0 9,419.9 56,930.3
2008 Q1 3,719.1 536.3 4,255.4 972.5 3,281.0 7,230.9 7,847.4 18,361.2 15,857.0 19,641.8 53,858.1 Q2 4,077.5 554.7 4,632.3 954.9 3,674.2 8,151.2 7,930.6 19,756.0 17,590.1 20,038.2 57,384.4 Q3 4,010.3 565.1 4,632.3 879.2 3,690.9 8,201.9 7,266.1 19,159.0 18,521.3 20,038.2 57,718.5 Q4 4,423.8 585.7 5,009.5 1,247.7 3,756.4 7,690.7 8,564.9 20,012.0 19,616.9 20,243.6 59,872.6
2009 Q1 3,680.9 581.4 4,258.4 1,008.9 3,249.5 8,210.0 9,351.4 20,810.9 19,696.4 16,595.7 57,103.0 Q2 3,951.5 591.5 4,537.7 974.4 3,563.3 7,987.0 8,042.4 19,592.6 20,188.1 17,868.7 57,649.4 Q3 3,919.8 601.0 4,515.4 851.8 3,663.6 8,087.1 9,415.4 21,166.1 21,071.3 17,395.9 59,633.4 Q4 4,665.2 626.5 5,281.7 1,365.2 3,916.5 7,625.2 10,906.6 22,448.3 21,379.3 16,318.1 60,145.6
2010 Q1 3,932.1 615.0 4,537.0 994.5 3,545.2 8,009.7 9,297.3 20,852.2 22,208.6 14,504.5 57,565.3 Q2 4,272.7 628.8 4,891.5 969.4 3,924.1 8,544.5 8,249.7 20,718.3 22,051.3 12,974.7 55,744.3 Q3 4,582.1 644.1 5,216.1 1,038.3 4,178.1 9,445.5 7,584.8 21,208.3 22,892.2 11,296.4 55,396.9 Q4 5,208.0 672.6 5,870.5 1,320.0 4,553.3 9,494.3 8,097.5 22,145.1 23,162.4 11,244.5 56,551.9
2011 Q1 4,701.9 658.8 5,350.7 1,193.4 4,162.3 8,911.9 7,816.3 20,890.5 24,326.4 10,636.3 55,853.2 Q2 5,128.3 674.9 5,793.2 1,238.2 4,557.5 8,777.5 8,506.6 21,841.5 24,548.5 8,878.9 55,269.0 Q3 5,246.4 686.4 5,922.7 1,230.6 4,693.8 9,071.4 8,552.0 22,317.2 25,397.7 8,954.1 56,669.0 Q4 5,876.5 704.7 6,571.1 1,686.4 4,885.7 9,700.7 7,827.0 22,413.3 25,317.1 9,557.2 57,287.6
2012 Q1 5,151.3 702.4 5,843.6 1,338.2 4,505.4 9,880.6 9,217.6 23,603.6 24,922.6 10,636.3 59,162.5 Q2 5,395.0 709.6 6,094.6 1,428.1 4,669.6 9,358.8 9,030.8 23,059.2 25,561.8 10,332.3 58,953.3 Q3 5,713.9 722.1 6,425.9 1,528.6 4,900.0 10,234.9 8,832.9 23,967.8 25,683.6 9,697.7 59,349.1 Q4 6,223.5 749.4 6,962.9 2,073.4 4,889.1 9,714.4 8,030.8 22,634.4 24,876.0 9,419.9 56,930.3
2013 Q1 5,553.2 733.1 6,276.2 1,681.3 4,595.9 10,645.9 9,231.5 24,473.3 24,670.0 8,816.7 57,960.0 Q2 5,418.7 747.7 6,156.3 1,384.8 4,775.8 10,451.5 8,609.1 23,836.4 25,184.2 7,930.2 56,950.8
1/ Excludes deposits of Government but includes Vatu deposits on non-reporting (i.e exempt) banks and other institutions held with reporting banks.2/ Excludes Government deposits and deposits of exempt institutions.

QUARTERLY ECONOMIC REVIEW JUNE 2013
48
TABLE 7: DISTRIBUTION OF VATU AND FOREIGN CURRENCY DEPOSITS OF RESIDENTS BY CATEGORIES(Millions of Vatu)
End of Vatu Deposits(MVT) 1/ 'Foreign currency Deposits (MVT) 1/ Percent Distribution ( % ) GovernmentPeriod Vatu Foreign Total Depostis
Demand Savings Time Total Demand Savings Time Total Deposits Currency (MVT)Deposits 2/
2008 7,690.7 4,315.6 35,283.2 47,289.6 8,564.9 261.7 19,981.9 28,808.5 62.1 37.9 100.0 671.7
2009 7,627.4 4,047.1 17,332.2 29,006.7 10,906.6 280.8 16,037.3 27,224.6 51.6 48.4 100.0 966.2 2010 9,494.3 5,146.1 18,016.3 32,656.6 8,097.5 390.4 10,854.1 19,342.0 62.8 37.2 100.0 632.2 2011 9,700.7 5,360.6 19,956.5 35,017.8 7,827.0 376.8 9,180.4 17,384.2 66.8 33.2 100.0 593.9 2012 9,714.4 6,094.8 18,781.2 34,590.5 8,030.8 410.4 9,009.5 17,450.7 66.5 33.5 100.0 651.2
2008 Q1 7,230.9 3,324.3 12,532.7 23,087.9 7,847.4 269.6 19,372.2 27,489.2 45.6 54.4 100.0 295.8 Q2 8,151.3 3,624.6 13,965.5 25,741.4 8,151.2 261.8 13,965.5 22,378.5 53.5 46.5 100.0 372.2 Q3 8,201.9 3,698.8 14,822.4 26,723.2 8,201.9 370.1 14,680.9 23,252.9 53.5 46.5 100.0 339.4 Q4 7,690.7 4,315.6 15,301.2 27,307.6 8,564.9 260.9 19,981.9 28,807.7 48.7 51.3 100.0 671.7
2009 Q1 8,210.0 3,704.6 15,991.8 27,906.4 9,351.4 260.9 16,334.7 25,947.0 51.8 48.2 100.0 791.2 Q2 7,987.0 3,981.9 16,206.2 28,175.1 8,042.4 228.6 17,640.1 25,911.1 52.1 47.9 100.0 784.7 Q3 8,087.1 4,104.7 16,966.6 29,158.4 9,415.4 208.8 17,187.2 26,811.3 52.1 47.9 100.0 908.1 Q4 7,627.4 4,047.1 17,332.2 29,006.7 10,906.6 280.8 16,037.3 27,224.6 51.6 48.4 100.0 966.2
2010 Q1 8,009.7 4,144.4 18,064.2 30,218.4 9,297.3 406.7 14,097.8 23,801.7 55.9 44.1 100.0 1,332.1 Q2 8,544.5 4,255.2 17,796.1 30,595.8 8,249.7 996.2 11,978.5 21,224.4 59.0 41.0 100.0 1,349.0 Q3 9,445.5 4,820.0 18,072.2 32,337.7 7,584.8 406.6 10,889.8 18,881.2 63.1 36.9 100.0 622.5 Q4 9,494.3 5,146.1 18,016.3 32,656.6 8,097.5 390.4 10,854.1 19,342.0 62.8 37.2 100.0 632.2
2011 Q1 8,911.9 5,327.6 18,998.8 33,238.3 7,816.3 366.6 10,269.7 18,452.6 64.3 35.7 100.0 599.0 Q2 8,777.5 5,558.6 18,989.8 33,325.9 8,506.6 369.5 8,509.5 17,385.5 65.7 34.3 100.0 634.9 Q3 9,071.4 5,378.0 20,019.7 34,469.2 8,552.0 438.1 8,516.0 17,506.1 66.3 33.7 100.0 547.4 Q4 9,700.7 5,360.6 19,956.5 35,017.8 7,827.0 376.8 9,180.4 17,384.2 66.8 33.2 100.0 593.9
2012 Q1 9,880.6 5,261.4 19,661.3 34,803.2 9,217.6 371.5 9,948.4 19,537.6 64.0 36.0 100.0 519.6 Q2 9,358.8 5,857.3 19,704.5 34,920.6 9,030.8 408.2 9,924.1 19,363.1 64.3 35.7 100.0 575.4 Q3 10,234.9 6,168.8 19,514.8 35,918.6 8,832.9 589.1 9,108.6 18,530.6 66.0 34.0 100.0 665.0 Q4 9,714.4 6,094.8 18,781.2 34,590.5 8,030.8 410.4 9,009.5 17,450.7 66.5 33.5 100.0 651.2
2013 Q1 10,645.9 5,938.7 18,731.3 35,316.0 9,231.5 373.5 8,443.1 18,048.2 66.2 33.8 100.0 631.9 Q2 10,451.5 6,120.7 19,063.5 35,635.6 8,609.1 425.8 7,504.4 16,539.3 68.3 31.7 100.0 810.5
1/ Excludes deposits of the Vanuatu Government.2/ Government deposits in Vatu and Foreign currencies.

QUARTERLY ECONOMIC REVIEW JUNE 2013
49
TABLE 8: TIME DEPOSITS IN VATU OF RESIDENTS WITH COMMERCIAL BANKS(Millions of Vatu)
Maturity Period
End of Up to and incl- Over 7 days and 1 to 2 2 to 3 3 to 6 6 to 12 Over one Total
Period usive of 7 days and up to 1 month Months Months Months Months Year2008 1,125.5 5,462.0 1,955.0 1,547.1 2,011.3 3,675.0 2,546.0 18,321.9 2009 1,617.6 6,152.8 3,734.5 1,814.7 2,568.0 4,742.9 1,281.0 21,911.5
2010 1,617.6 6,152.8 3,734.5 1,814.7 2,568.0 4,742.9 1,281.0 21,911.5 2011 2,858.6 6,028.4 3,077.2 2,323.1 2,595.8 5,317.2 1,942.7 24,143.1
2012 2,523.5 6,231.6 2,480.5 2,055.2 2,617.5 6,036.3 929.5 22,874.0
2008 Q1 426.4 2,548.4 1,484.4 1,040.9 2,815.1 4,426.0 61.5 12,802.6 Q2 1,257.9 3,987.3 2,280.6 1,591.0 3,215.8 3,418.3 109.7 15,860.5
Q3 741.4 5,174.0 2,510.4 2,041.3 2,550.9 3,342.4 1,089.5 17,449.9 Q4 1,125.5 5,462.0 1,955.0 1,547.1 2,011.3 3,675.0 2,546.0 18,321.9
2009 Q1 1,304.0 4,846.2 2,376.2 1,733.0 2,045.8 3,015.0 3,437.8 18,758.2
Q2 1,447.4 5,508.5 2,045.4 1,412.8 2,174.6 2,736.0 3,711.3 19,036.1 Q3 1,933.2 6,235.0 1,938.4 989.0 2,265.9 3,598.3 3,091.3 20,051.0
Q4 1,718.0 5,976.3 2,105.2 1,781.1 1,932.2 4,503.5 2,459.2 20,475.5
2010 Q1 1,602.3 5,965.6 2,335.7 1,928.1 2,995.8 3,421.3 2,749.3 20,998.1 Q2 1,363.8 6,910.6 1,960.4 2,026.3 3,114.6 3,216.2 1,884.6 20,476.6
Q3 1,805.0 7,499.8 2,780.7 1,631.6 2,619.5 3,045.8 2,207.0 21,589.4 Q4 1,617.6 6,152.8 3,734.5 1,814.7 2,568.0 4,742.9 1,281.0 21,911.5
2011 Q1 1,974.1 6,994.6 3,462.3 1,694.6 2,499.5 5,760.4 1,542.8 23,928.4
Q2 1,930.3 4,913.2 2,805.0 1,879.7 3,704.9 5,635.8 2,365.7 23,234.7 Q3 305.7 4,069.6 2,131.0 1,449.1 2,645.0 2,775.9 1,304.5 14,680.8 Q4 2,858.6 6,028.4 3,077.2 2,323.1 2,595.8 5,317.2 1,942.7 24,143.1
2012 Q1 3,135.3 5,878.5 2,636.0 1,786.9 2,595.8 4,066.9 2,337.0 22,436.4
Q2 2,666.3 6,471.3 3,411.2 2,733.5 2,760.3 4,040.2 1,918.5 24,001.3 Q3 2,460.9 5,203.0 3,782.7 2,039.7 2,232.8 4,911.1 1,802.9 22,433.2
Q4 2,523.5 6,231.6 2,480.5 2,055.2 2,617.5 6,036.3 929.5 22,874.0
2013 Q1 2,146.0 5,216.4 3,250.0 2,238.5 2,630.3 5,813.1 764.8 22,059.1 Q2 1,763.0 6,398.4 3,381.5 2,556.9 4,277.5 4,135.5 745.8 23,258.6

QUARTERLY ECONOMIC REVIEW JUNE 2013
50
TABLE 9: COMMERCIAL BANKS SECTORAL DISTRIBUTION OF LOANS & ADVANCES IN VATU AND FOREIGN CURRENCY(Millions of Vatu)
End of Agriculture Fisheries Mining & Manufact- Tourism Entertain- Transport Public Construc- (a) Govern- (b) PublicPeriod Quarrying turing ment & Utilities tion ment Corporation
Catering2008 393.7 79.2 102.2 1,357.0 2,187.4 81.6 1,458.4 10.0 3,645.2 22.5 22.3 2009 595.3 52.2 129.9 2,084.5 3,020.1 135.0 1,651.0 36.0 5,182.7 5.1 37.5 2010 806.9 59.1 122.4 1,704.0 3,994.1 166.1 1,494.5 37.5 7339.5 9.9 18.0 2011 659.4 39.1 146.1 1,832.8 4,762.2 322.9 1,406.1 50.1 7214.7 29.8 21.0 2012 931.1 34.4 194.4 1,637.1 4,350.2 352.2 1,321.1 85.2 5660.6 32.3 39.7
2008 Q1 340.2 39.5 88.8 1,447.5 1,749.2 34.8 1,229.9 11.2 2592.1 2.0 22.8
Q2 362.4 41.7 92.2 1,518.2 1,955.7 40.2 1,252.2 11.4 2562.0 2.1 31.9
Q3 359.2 51.7 96.8 1,374.2 2,023.1 39.5 1,387.9 11.5 2749.8 0.2 39.3
Q4 393.7 79.2 102.2 1,357.0 2,187.4 81.6 1,458.4 10.0 3645.2 0.2 20.4
2009 Q1 526.3 95.9 107.7 2,232.1 2,429.1 102.4 1,703.3 28.9 4130.6 4.6 25.3
Q2 551.2 97.4 113.9 2,242.2 2,464.4 132.8 1,600.4 36.4 4573.7 1.4 25.0
Q3 615.3 87.1 120.8 2,242.6 2,891.1 124.0 1,504.2 36.4 4961.6 7.4 6.3
Q4 595.3 52.2 129.9 2,084.5 3,020.1 135.0 1,651.0 36.0 5182.7 5.1 37.5
2010 Q1 801.6 51.7 88.4 1,744.2 2,712.8 146.5 1,564.7 36.0 4971.1 1.3 27.7
Q2 798.8 58.1 91.2 1,592.8 2,710.7 144.4 1,491.5 38.3 5123.3 2.4 24.4
Q3 808.8 94.3 93.7 1,489.9 2,495.4 147.7 1,695.9 37.7 5460.0 3.8 24.4
Q4 806.9 59.1 122.4 1,704.0 3,994.1 166.1 1,494.5 37.5 7339.5 9.9 18.0
2011 Q1 791.9 49.1 128.2 1,826.0 4,465.1 316.9 1,613.4 36.9 6776.0 2.3 24.0
Q2 660.9 44.6 133.0 1,709.9 3,975.7 329.4 1,563.8 36.3 7044.9 1.1 17.6
Q3 677.6 46.6 139.6 1,850.2 3,779.6 320.4 1,563.7 50.4 7203.2 4.7 21.3
Q4 659.4 39.1 146.1 1,832.8 4,762.2 322.9 1,406.1 50.1 7214.7 29.8 21.0
2012 Q1 673.4 38.4 152.0 1,786.2 4,907.8 422.0 1,408.4 49.1 7377.5 27.2 193.8
Q2 707.5 35.4 213.1 1,790.0 5,139.6 414.3 1,397.0 48.3 7008.6 0.0 119.5
Q3 898.6 33.1 188.2 2,542.4 4,037.3 369.0 1,494.9 89.9 5557.9 29.4 71.6
Q4 931.1 34.4 194.4 1,637.1 4,350.2 352.2 1,321.1 85.2 5660.6 32.3 39.7
2013 Q1 930.2 32.8 201.0 1,528.1 4,464.2 256.4 1,210.7 81.3 5509.4 32.5 229.6
Q2 945.9 34.0 157.4 1,511.5 4,408.6 273.2 1,151.2 271.8 5743.6 29.5 180.8
1/ Non-reporting banks includes Trust companies, Insurances etc.
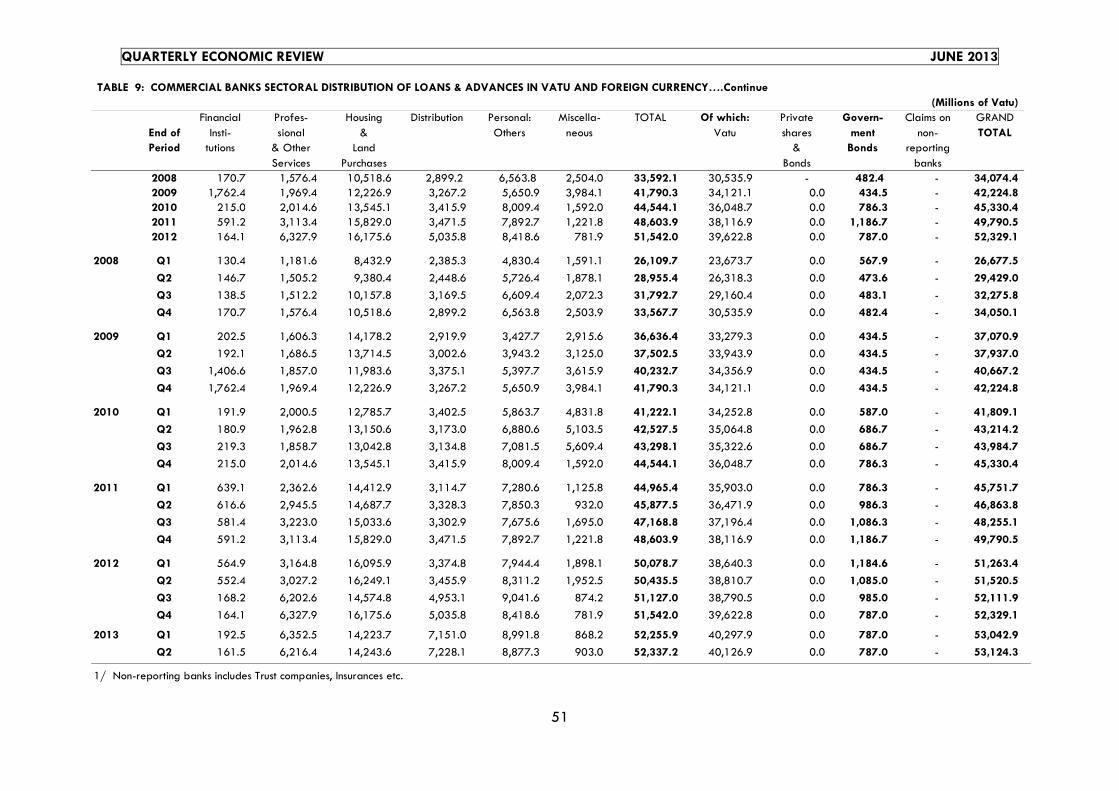
QUARTERLY ECONOMIC REVIEW JUNE 2013
51
TABLE 9: COMMERCIAL BANKS SECTORAL DISTRIBUTION OF LOANS & ADVANCES IN VATU AND FOREIGN CURRENCY….Continue(Millions of Vatu)
Financial Profes- Housing Distribution Personal: Miscella- TOTAL Of which: Private Govern- Claims on GRANDEnd of Insti- sional & Others neous Vatu shares ment non- TOTALPeriod tutions & Other Land & Bonds reporting
Services Purchases Bonds banks2008 170.7 1,576.4 10,518.6 2,899.2 6,563.8 2,504.0 33,592.1 30,535.9 - 482.4 - 34,074.4 2009 1,762.4 1,969.4 12,226.9 3,267.2 5,650.9 3,984.1 41,790.3 34,121.1 0.0 434.5 - 42,224.8 2010 215.0 2,014.6 13,545.1 3,415.9 8,009.4 1,592.0 44,544.1 36,048.7 0.0 786.3 - 45,330.4 2011 591.2 3,113.4 15,829.0 3,471.5 7,892.7 1,221.8 48,603.9 38,116.9 0.0 1,186.7 - 49,790.5 2012 164.1 6,327.9 16,175.6 5,035.8 8,418.6 781.9 51,542.0 39,622.8 0.0 787.0 - 52,329.1
2008 Q1 130.4 1,181.6 8,432.9 2,385.3 4,830.4 1,591.1 26,109.7 23,673.7 0.0 567.9 - 26,677.5
Q2 146.7 1,505.2 9,380.4 2,448.6 5,726.4 1,878.1 28,955.4 26,318.3 0.0 473.6 - 29,429.0
Q3 138.5 1,512.2 10,157.8 3,169.5 6,609.4 2,072.3 31,792.7 29,160.4 0.0 483.1 - 32,275.8
Q4 170.7 1,576.4 10,518.6 2,899.2 6,563.8 2,503.9 33,567.7 30,535.9 0.0 482.4 - 34,050.1
2009 Q1 202.5 1,606.3 14,178.2 2,919.9 3,427.7 2,915.6 36,636.4 33,279.3 0.0 434.5 - 37,070.9
Q2 192.1 1,686.5 13,714.5 3,002.6 3,943.2 3,125.0 37,502.5 33,943.9 0.0 434.5 - 37,937.0
Q3 1,406.6 1,857.0 11,983.6 3,375.1 5,397.7 3,615.9 40,232.7 34,356.9 0.0 434.5 - 40,667.2
Q4 1,762.4 1,969.4 12,226.9 3,267.2 5,650.9 3,984.1 41,790.3 34,121.1 0.0 434.5 - 42,224.8
2010 Q1 191.9 2,000.5 12,785.7 3,402.5 5,863.7 4,831.8 41,222.1 34,252.8 0.0 587.0 - 41,809.1
Q2 180.9 1,962.8 13,150.6 3,173.0 6,880.6 5,103.5 42,527.5 35,064.8 0.0 686.7 - 43,214.2
Q3 219.3 1,858.7 13,042.8 3,134.8 7,081.5 5,609.4 43,298.1 35,322.6 0.0 686.7 - 43,984.7
Q4 215.0 2,014.6 13,545.1 3,415.9 8,009.4 1,592.0 44,544.1 36,048.7 0.0 786.3 - 45,330.4
2011 Q1 639.1 2,362.6 14,412.9 3,114.7 7,280.6 1,125.8 44,965.4 35,903.0 0.0 786.3 - 45,751.7
Q2 616.6 2,945.5 14,687.7 3,328.3 7,850.3 932.0 45,877.5 36,471.9 0.0 986.3 - 46,863.8
Q3 581.4 3,223.0 15,033.6 3,302.9 7,675.6 1,695.0 47,168.8 37,196.4 0.0 1,086.3 - 48,255.1
Q4 591.2 3,113.4 15,829.0 3,471.5 7,892.7 1,221.8 48,603.9 38,116.9 0.0 1,186.7 - 49,790.5
2012 Q1 564.9 3,164.8 16,095.9 3,374.8 7,944.4 1,898.1 50,078.7 38,640.3 0.0 1,184.6 - 51,263.4
Q2 552.4 3,027.2 16,249.1 3,455.9 8,311.2 1,952.5 50,435.5 38,810.7 0.0 1,085.0 - 51,520.5
Q3 168.2 6,202.6 14,574.8 4,953.1 9,041.6 874.2 51,127.0 38,790.5 0.0 985.0 - 52,111.9
Q4 164.1 6,327.9 16,175.6 5,035.8 8,418.6 781.9 51,542.0 39,622.8 0.0 787.0 - 52,329.1
2013 Q1 192.5 6,352.5 14,223.7 7,151.0 8,991.8 868.2 52,255.9 40,297.9 0.0 787.0 - 53,042.9
Q2 161.5 6,216.4 14,243.6 7,228.1 8,877.3 903.0 52,337.2 40,126.9 0.0 787.0 - 53,124.3
1/ Non-reporting banks includes Trust companies, Insurances etc.
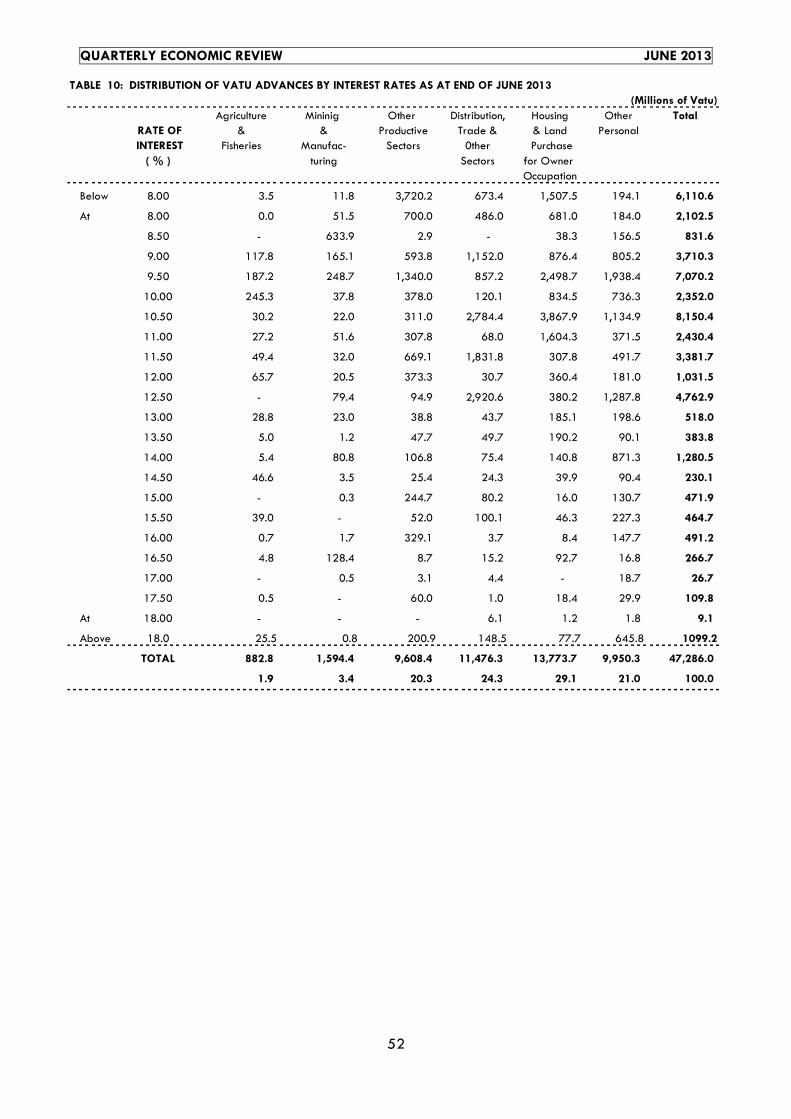
QUARTERLY ECONOMIC REVIEW JUNE 2013
52
TABLE 10: DISTRIBUTION OF VATU ADVANCES BY INTEREST RATES AS AT END OF JUNE 2013 (Millions of Vatu)
Agriculture Mininig Other Distribution, Housing Other Total RATE OF & & Productive Trade & & Land Personal INTEREST Fisheries Manufac- Sectors 0ther Purchase
( % ) turing Sectors for Owner Occupation
Below 8.00 3.5 11.8 3,720.2 673.4 1,507.5 194.1 6,110.6
At 8.00 0.0 51.5 700.0 486.0 681.0 184.0 2,102.5
8.50 - 633.9 2.9 - 38.3 156.5 831.6
9.00 117.8 165.1 593.8 1,152.0 876.4 805.2 3,710.3
9.50 187.2 248.7 1,340.0 857.2 2,498.7 1,938.4 7,070.2
10.00 245.3 37.8 378.0 120.1 834.5 736.3 2,352.0
10.50 30.2 22.0 311.0 2,784.4 3,867.9 1,134.9 8,150.4
11.00 27.2 51.6 307.8 68.0 1,604.3 371.5 2,430.4
11.50 49.4 32.0 669.1 1,831.8 307.8 491.7 3,381.7
12.00 65.7 20.5 373.3 30.7 360.4 181.0 1,031.5
12.50 - 79.4 94.9 2,920.6 380.2 1,287.8 4,762.9
13.00 28.8 23.0 38.8 43.7 185.1 198.6 518.0
13.50 5.0 1.2 47.7 49.7 190.2 90.1 383.8
14.00 5.4 80.8 106.8 75.4 140.8 871.3 1,280.5
14.50 46.6 3.5 25.4 24.3 39.9 90.4 230.1
15.00 - 0.3 244.7 80.2 16.0 130.7 471.9
15.50 39.0 - 52.0 100.1 46.3 227.3 464.7
16.00 0.7 1.7 329.1 3.7 8.4 147.7 491.2
16.50 4.8 128.4 8.7 15.2 92.7 16.8 266.7
17.00 - 0.5 3.1 4.4 - 18.7 26.7
17.50 0.5 - 60.0 1.0 18.4 29.9 109.8
At 18.00 - - - 6.1 1.2 1.8 9.1
Above 18.0 25.5 0.8 200.9 148.5 77.7 645.8 1099.2
TOTAL 882.8 1,594.4 9,608.4 11,476.3 13,773.7 9,950.3 47,286.0
1.9 3.4 20.3 24.3 29.1 21.0 100.0

QUARTERLY ECONOMIC REVIEW JUNE 2013
53
TABLE 11: SELECTED INTEREST RATES FOR LOCAL COMMERCIAL BANKS 1/
Vatu Deposit RatesForeign Currency Vatu Advance Rates 2/
Local Inter-Bank
End Deposit Rates Rates
Period (Aust. Dollar) Weighted Call
2-6 Above 1 month Commercial Personal Housing average or (Locally rate for Over-
Savings 1 month Months 6 months Fixed Bank quoted) bank night
loans
2008 0.50-3.00 1.25-9.00 1.25-9.00 2.25-9.00 5.92 2.69 2.50-5.85 5.93-18.50 4.50-21.50 5.50-12.00 10.33 5.502009 0.5-5.00 1.25-8.00 1.25-8.00 2.25-9.80 6.17 3.19 1.80-4.40 9.50-23.00 5.50-26.50 8.99-13.00 10.92 5.502010 0.5-3.00 1.50-6.00 1.50-6.50 2.50-9.00 5.25 1.75 2.29-4.80 8.95-23.00 5.50-21.50 8.90-11.99 10.99 5.502011 0.5-5.00 1.50-7.50 1.50-7.30 2.50-8.02 5.42 2.81 2.75-5.17 7.00-23.00 5.50-26.50 8.45-13.00 10.28 5.502012 0.5-4.00 1.25-5.00 1.25-5.05 2.00-8.18 4.05 2.15 1.00-3.90 5.00-23.00 6.60-28.00 7.60-13.75 9.40 5.50
2008 Q1 0.50-3.00 1.25-5.45 1.25-5.75 2.25-5.75 4.39 1.88 4.00-7.20 8.95-18.50 10.00-21.50 7.00-10.75 10.09 5.50Q2 0.50-3.00 1.25-5.60 1.25-6.95 2.25-7.00 5.13 2.12 4.00-6.90 7.50-18.50 4.50-21.50 6.90-8.95 10.07 5.50Q3 0.50-3.00 1.25-7.25 1.25-7.50 2.25-9.09 5.44 2.56 3.00-6.85 6.99-18.50 4.50-21.50 4.50-10.75 10.04 5.50Q4 0.50-3.00 1.25-9.00 1.25-9.00 2.25-9.00 5.92 2.69 2.50-5.85 5.93-18.50 4.50-21.50 5.50-10.75 10.33 5.95
2009 Q1 0.50-3.00 1.25-8.00 1.25-8.45 2.25-9.80 6.07 3.35 2.00-3.40 8.50-19.50 5.50-21.50 5.50-12.00 10.49 5.95Q2 0.50-3.00 1.25-8.00 1.25-8.45 2.25-9.80 6.15 3.33 2.00-2.90 9.50-19.50 5.50-21.50 8.99-13.00 10.69 5.50Q3 0.5-5.00 1.25-8.00 1.25-8.45 2.25-9.80 6.26 3.17 2.00-2.84 9.50-19.50 5.50-26.50 8.99-13.00 11.14 5.50Q4 0.5-5.00 1.25-8.00 1.25-8.00 2.25-9.80 6.17 3.19 1.80-4.40 9.50-23.00 5.50-26.50 8.99-13.00 10.92 5.50
2010 Q1 0.5-5.00 1.25-8.00 1.60-8.45 2.50-9.80 6.30 2.77 1.80-4.16 8.90-13.00 5.5-26.5 8.90-13.00 10.97 5.50Q2 0.50-5.00 1.50-7.50 1.60-7.00 2.50-9.80 6.17 3.28 1.75-4.50 8.95-23.00 5.50-26.50 8.90-13.00 10.83 5.50Q3 0.5-5.00 1.50-7.50 1.60-7.01 2.50-9.81 5.60 3.08 1.75-4.50 8.95-23.00 5.50-26.50 8.90-13.00 10.83 5.50Q4 0.5-3.00 1.50-6.00 1.50-6.50 2.50-9.00 5.25 1.75 2.29-4.80 8.95-23.00 5.50-21.50 8.90-11.99 10.99 5.50
2011 Q1 0.5-3.00 1.50-8.00 1.50-8.00 2.50-8.00 4.59 2.25-4.77 8.95-23.00 9.99-26.50 8.95-11.99 9.73 5.50Q2 0.5-5.00 1.50-5.75 1.50-6.00 2.50-8.00 4.77 1.59 2.75-4.57 7.00-23.00 5.50-20.90 8.75-13.00 9.82 5.50Q3 0.5-5.00 1.50-5.75 1.75-6.00 1.75-8.02 5.06 1.69 2.29-4.83 7.00-23.00 5.50-26.50 8.45-13.00 9.69 5.50Q4 0.5-5.00 1.50-7.50 1.50-7.30 2.50-8.02 5.42 2.81 2.75-5.17 7.00-23.00 5.50-26.50 8.45-13.00 10.28 5.50
2012 Q1 0.5-5.00 1.25-6.00 1.25-7.00 1.50-8.02 5.05 2.60 1.20-4.39 7.00-23.00 9.99-26.50 8.45-13.00 10.70 5.50Q2 0.5-5.00 1.25-5.10 1.25-5.00 2.00-8.18 4.60 2.60 1.20-3.80 8.50-23.00 9.99-26.50 8.45-13.00 10.80 5.50Q3 0.5-5.00 1.25-5.00 1.25-5.05 2.00-8.18 4.17 2.43 1.20-3.80 5.00-23.00 6.60-28.00 7.60-14.00 10.54 5.50Q4 0.5-4.00 1.25-5.00 1.25-5.05 2.00-8.18 4.05 2.15 1.00-3.90 5.00-23.00 6.60-28.00 7.60-13.75 9.40 5.50
2013 Q1 0.5-4.00 1.25-5.00 1.25-5.05 2.00-6.00 3.92 2.09 1.20-2.85 5.00-23.00 6.60-28.00 7.60-14.00 10.45 5.50Q2 0.5-4.00 1.25-5.00 1.25-5.05 2.00-8.18 4.20 2.13 1.00-2.90 5.00-20.25 6.60-28.00 7.60-14.00 10.01 5.00-5.50
Source: Local Commercial banks returns:
2/ Interest rates relating to vatu advances ranging from the minimum 4.5-5.5 percent also reflect rates offered to their staff.
Weighted
averagerate for
deposits
1/ From (Qtr 3, 2002) Data covers 2 out of 3 banks (2 banks merged). From Qtr 4 2003 data covers all commercial banks. From Qtr4, 2007 to date, data covers 4 commercial banks

QUARTERLY ECONOMIC REVIEW JUNE 2013
54
TABLE 12: DENOMINATIONS OF CURRENCY ON ISSUE
( Millions of Vatu )
End of Notes Coins Total Notes
Period VT100 VT200 VT500 VT1,000 VT5,000 VT10,000 Total & Coins
2008 25.4 96.7 230.8 1,728.2 2,342.7 4,423.8 585.7 5,009.5
2009 24.8 96.1 211.9 1,815.6 2,516.7 4,665.2 626.5 5,291.8
2010 24.7 116.6 246.4 2,044.4 2,426.9 348.9 5,208.0 672.6 5,880.6
2011 24.7 124.3 272.3 2,198.5 2,746.5 510.2 5,876.5 704.7 6,581.2
2012 24.7 135.2 282.3 2,436.6 2,858.7 486.1 6,223.5 749.4 6,972.9
2008 Q1 26.0 75.8 184.1 1,461.8 1,971.4 3,719.1 536.3 4,255.4
Q2 26.0 75.8 184.1 1,461.8 2,090.3 4,077.5 536.3 4,255.4
Q3 25.6 103.2 226.9 1,673.6 1,981.0 4,010.3 565.1 4,575.4
Q4 25.4 96.7 230.8 1,728.2 2,342.7 4,423.8 585.7 5,009.5
2009 Q1 25.2 95.0 205.9 1,398.5 1,956.2 3,680.9 581.4 4,262.2
Q2 25.1 100.5 204.9 1,509.7 2,111.3 3,951.5 591.5 4,543.1
Q3 24.9 87.9 203.8 1,584.4 2,018.9 3,919.8 601.0 4,520.8
Q4 24.8 96.1 211.9 1,815.6 2,516.7 4,665.2 626.5 5,291.8
2010 Q1 24.9 93.6 198.7 1,546.3 2,068.6 3,932.1 615.0 4,547.1
Q2 24.8 97.4 209.9 1,702.5 2,238.1 4,272.7 628.8 4,901.6
Q3 24.8 102.7 224.6 1,834.2 2,179.2 216.6 4,582.1 644.1 5,226.2
Q4 24.7 116.6 246.4 2,044.4 2,426.9 348.9 5,208.0 672.6 5,880.6
2011 Q1 24.7 109.4 238.3 1,843.5 2,148.3 337.7 4,701.9 658.8 5,360.8
Q2 24.7 114.0 244.7 1,960.9 2,391.7 392.3 5,128.3 674.9 5,803.3
Q3 24.7 119.3 246.6 2,043.0 2,419.4 393.3 5,246.4 686.4 5,932.8
Q4 24.7 124.3 272.3 2,198.5 2,746.5 510.2 5,876.5 704.7 6,581.2
2012 Q1 24.7 126.4 249.2 1,974.2 2,350.5 426.2 5,151.3 702.4 5,853.6
Q2 24.7 109.8 250.1 2,123.0 2,443.4 444.0 5,395.0 709.6 6,104.7
Q3 24.7 124.1 261.9 2,243.7 2,614.3 445.1 5,713.9 722.1 6,436.0
Q4 24.7 135.2 282.3 2,436.6 2,858.7 486.1 6,223.5 749.4 6,972.9
2013 Q1 24.7 136.6 254.1 2,238.5 2,455.0 444.4 5,108.8 733.1 5,841.9
Q2 24.7 147.6 261.5 2,074.1 2,433.0 477.8 4,940.9 747.7 5,688.6

QUARTERLY ECONOMIC REVIEW JUNE 2013
55
TABLE 13: NET OFFICIAL RESERVES(Millions of Vatu)
1. Net Official Reserves 2. Net Foreign Assets of Commercial Banks
End of Foreign Special Reserve Total Foreign Net Foreign Foreign Net Period Exchange Drawing Position Holdings Liabilities Position Assets Liabilities Position
of RBV Rights in IMF(1) (2) (3) (1+2+3) (4) (5) (4-5) (6) (7) (8) (7-8) (9)
2008 12,319.3 225.6 434.2 12,979.1 164.8 12,814.3 36,695.3 8,631.9 28,063.4 2009 13,928.0 244.1 382.2 14,554.3 2,954.7 11,599.7 30,350.3 8,540.9 21,809.4 2010 14,452.5 224.0 358.6 15,035.1 2,714.1 12,321.1 21,780.6 12,226.1 9,554.4 2011 15,686.9 212.4 359.3 16,258.7 2,477.4 13,781.2 16,198.7 9,867.0 6,331.7 2012 16,148.8 214.3 350.5 16,713.6 2,421.1 14,292.5 12,957.9 8,403.8 4,554.0
2008 Q1 11,162.2 193.1 389.7 11,745.0 275.9 11,469.1 34,695.1 8,174.7 26,520.4 Q2 11,241.5 196.2 389.7 11,827.4 362.7 11,464.7 36,446.2 7,874.8 28,571.4 Q3 11,710.9 199.5 389.7 12,300.1 611.8 11,688.3 34,679.0 8,298.8 26,380.2 Q4 12,319.3 225.6 434.2 12,979.1 164.8 12,814.3 36,695.3 8,631.9 28,063.4
2009 Q1 11,577.6 226.9 434.2 12,238.7 163.4 12,075.2 31,631.8 8,675.5 22,956.3 Q2 12,162.7 227.5 434.2 12,824.4 627.5 12,196.9 28,990.2 6,591.4 22,398.8 Q3 12,387.7 3,057.6 434.2 15,879.5 3,409.3 12,470.1 30,377.5 7,366.9 23,010.6 Q4 13,928.0 244.1 382.2 14,554.3 2,954.7 11,599.7 30,350.3 8,540.9 21,809.4
2010 Q1 14,362.2 241.8 382.2 14,986.2 2,706.2 12,280.0 28,100.2 10,438.2 17,662.0 Q2 14,882.5 243.1 382.2 15,507.9 2,813.2 12,694.7 25,751.9 11,071.4 14,680.4 Q3 14,686.1 243.6 382.2 15,312.0 2,715.0 12,596.9 22,778.2 12,210.7 10,567.5 Q4 14,452.5 224.0 358.6 15,035.1 2,714.1 12,321.1 21,780.6 12,226.1 9,554.4
2011 Q1 14,586.1 223.0 362.0 15,171.1 2,508.6 12,662.5 19,297.0 11,357.5 7,939.5 Q2 14,795.7 217.4 356.2 15,369.3 2,467.4 12,901.9 18,185.1 10,933.8 7,251.3 Q3 15,027.4 222.8 369.6 15,619.8 2,547.7 13,072.1 18,024.3 10,550.6 7,473.7 Q4 15,686.9 212.4 359.3 16,258.7 2,477.4 13,781.2 16,198.7 9,867.0 6,331.7
2012 Q1 15,884.7 211.2 353.2 16,449.1 2,436.8 14,012.3 16,772.9 9,850.9 6,921.9 Q2 16,388.0 212.2 356.0 16,956.2 2,457.7 14,498.5 15,709.2 8,736.9 6,972.2 Q3 16,421.5 209.2 353.1 16,983.8 2,438.8 14,545.0 15,327.8 8,757.1 6,570.6 Q4 16,148.8 214.3 350.5 16,713.6 2,421.1 14,292.5 12,957.9 8,403.8 4,554.0
2012 Q1 16,077.8 209.2 342.7 16,629.7 2,368.7 14,260.9 10,677.0 6,076.3 4,600.8 Q2 16,136.6 221.9 364.1 16,722.6 2,542.7 14,179.9 10,445.4 6,996.6 3,448.8
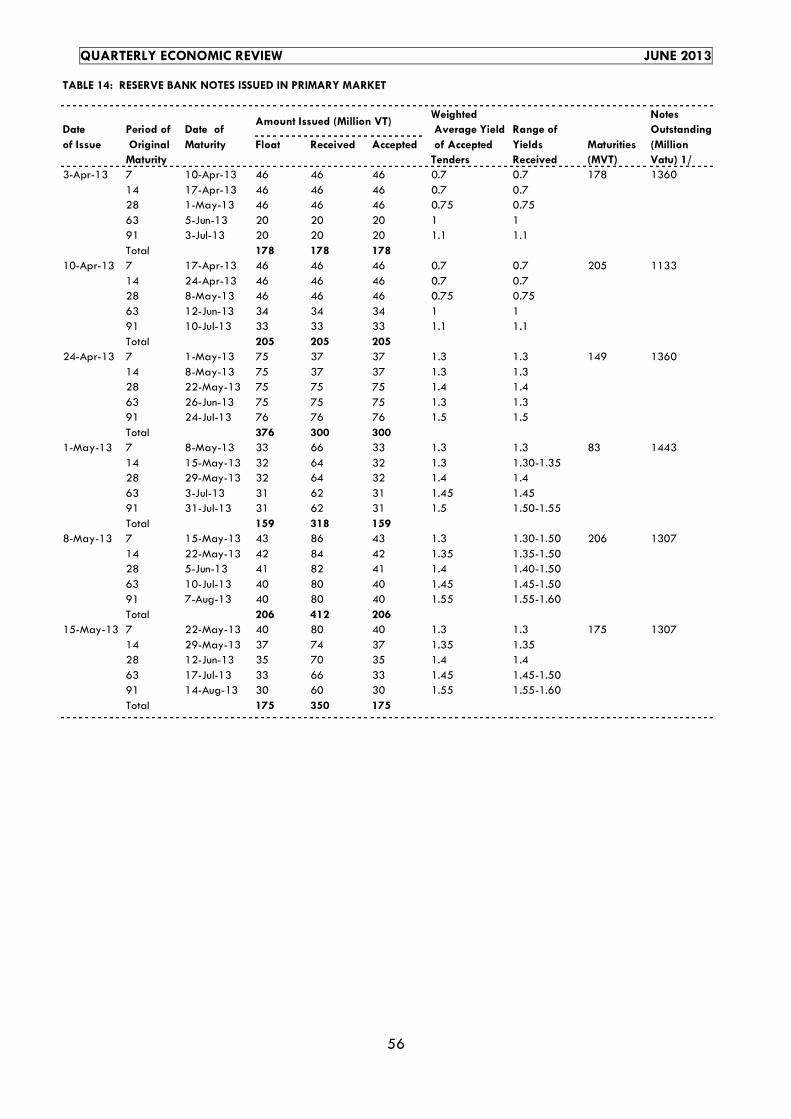
QUARTERLY ECONOMIC REVIEW JUNE 2013
56
TABLE 14: RESERVE BANK NOTES ISSUED IN PRIMARY MARKET
Weighted NotesDate Period of Date of Average Yield Range of Outstanding
of Issue Maturity Float Received Accepted of Accepted MaturitiesTenders (MVT)
3-Apr-13 7 10-Apr-13 46 46 46 0.7 0.7 178 136014 17-Apr-13 46 46 46 0.7 0.728 1-May-13 46 46 46 0.75 0.7563 5-Jun-13 20 20 20 1 191 3-Jul-13 20 20 20 1.1 1.1Total 178 178 178
10-Apr-13 7 17-Apr-13 46 46 46 0.7 0.7 205 113314 24-Apr-13 46 46 46 0.7 0.728 8-May-13 46 46 46 0.75 0.7563 12-Jun-13 34 34 34 1 191 10-Jul-13 33 33 33 1.1 1.1Total 205 205 205
24-Apr-13 7 1-May-13 75 37 37 1.3 1.3 149 136014 8-May-13 75 37 37 1.3 1.328 22-May-13 75 75 75 1.4 1.463 26-Jun-13 75 75 75 1.3 1.391 24-Jul-13 76 76 76 1.5 1.5Total 376 300 300
1-May-13 7 8-May-13 33 66 33 1.3 1.3 83 144314 15-May-13 32 64 32 1.3 1.30-1.3528 29-May-13 32 64 32 1.4 1.463 3-Jul-13 31 62 31 1.45 1.4591 31-Jul-13 31 62 31 1.5 1.50-1.55Total 159 318 159
8-May-13 7 15-May-13 43 86 43 1.3 1.30-1.50 206 130714 22-May-13 42 84 42 1.35 1.35-1.5028 5-Jun-13 41 82 41 1.4 1.40-1.5063 10-Jul-13 40 80 40 1.45 1.45-1.5091 7-Aug-13 40 80 40 1.55 1.55-1.60Total 206 412 206
15-May-13 7 22-May-13 40 80 40 1.3 1.3 175 130714 29-May-13 37 74 37 1.35 1.3528 12-Jun-13 35 70 35 1.4 1.463 17-Jul-13 33 66 33 1.45 1.45-1.5091 14-Aug-13 30 60 30 1.55 1.55-1.60Total 175 350 175
Amount Issued (Million VT)
(Million Vatu) 1/
Yields Received
Original Maturity

QUARTERLY ECONOMIC REVIEW JUNE 2013
57
TABLE 14: RESERVE BANK NOTES ISSUED IN PRIMARY MARKET…Continue
Weighted Notes
Date Period of Date of Average Yield Range of Outstanding
of Issue Maturity Float Received Accepted of Accepted Maturities
Tenders (MVT)22-May-13 7 29-May-13 48 96 48 1.3 1.3 274 1307
14 5-Jun-13 48 96 48 1.35 1.3528 19-Jun-13 48 96 48 1.4 1.463 24-Jul-13 48 96 48 1.45 1.4591 21-Aug-13 43 91 43 1.55 1.55Total 235 475 235
29-May-13 7 5-Jun-13 42 84 42 1.3 1.3 197 126814 12-Jun-13 39 78 39 1.35 1.3528 26-Jun-13 42 84 42 1.4 1.463 31-Jul-13 39 78 39 1.45 1.4591 28-Aug-13 35 70 35 1.55 1.55Total 197 394 197
5-Jun-13 7 12-Jun-13 42 126 42 1.25 1.25-1.40 211 121514 19-Jun-13 42 126 42 1.3 1.30-1.4528 3-Jul-13 42 126 42 1.35 1.35-1.5063 7-Aug-13 42 126 42 1.4 1.40-1.5591 4-Sep-13 43 128 43 1.5 1.50-1.65Total 211 632 211
12-Jun-13 7 19-Jun-13 45 90 45 1.2 1.20-1.30 224 121514 26-Jun-13 45 90 45 1.25 1.25-1.3028 10-Jul-13 45 90 45 1.3 1.30-1.3563 14-Aug-13 45 90 45 1.35 1.35-1.4091 11-Sep-13 44 88 44 1.45 1.45-1.50Total 224 448 224
19-Jun-13 7 26-Jun-13 42 84 42 1.15 1.15 213 121514 3-Jul-13 42 84 42 1.2 1.228 17-Jul-13 42 84 42 1.25 1.2563 21-Aug-13 42 84 42 1.3 1.391 18-Sep-13 45 90 45 1.4 1.4Total 213 426 213
26-Jun-13 7 3-Jul-13 72 216 72 1.1 1.10-1.20 284 121514 10-Jul-13 72 216 72 1.15 1.15-1.2528 24-Jul-13 72 216 72 1.2 1.20-1.3063 28-Aug-13 72 216 72 1.25 1.25-1.3591 25-Sep-13 62 186 62 1.35 1.35-1.45Total 350 1050 350
Amount Issued (Million VT)
Original Maturity
Yields Received
(Million Vatu) 1/

QUARTERLY ECONOMIC REVIEW JUNE 2013
58
TABLE 15: COMMERCIAL BANK'S LIQUIDITY(Millions of Vatu)
Liquid Assets Statutory Reserve RBV TotalVault Deposits Total Deposits Notes
End of Cash with RBV (SRD) Period (Excess Reserves)
(1+2) (3+4+5)(1) (2) (3) (4) (5) (6)
2008 1,247.7 1,983.4 3,231.1 2,453.3 1,275.2 6,959.6 2009 1,365.2 2,399.9 3,765.1 1,739.2 950.0 6,454.3
2010 1,320.0 3,087.6 4,407.6 2,195.8 1,196.5 7,799.9 2011 1,686.4 2,555.0 4,241.4 2,753.7 1,619.1 8,614.2
2012 2,073.4 3,170.3 5,243.7 2,859.3 804.0 8,907.0
2008 Q1 972.5 1,629.5 2,602.0 2,658.6 1,321.1 6,581.7 Q2 954.9 1,029.0 1,983.9 2,762.5 1,147.4 5,893.7
Q3 879.2 1,207.7 2,086.9 3,024.7 238.6 5,350.1 Q4 1,247.7 1,820.0 3,067.7 2,453.1 1,275.2 6,796.0
2009 Q1 1,008.9 1,622.4 2,631.3 1,621.5 2,012.7 6,265.5
Q2 974.4 2,513.0 3,487.4 1,652.4 1,135.0 6,274.8 Q3 851.8 2,510.0 3,361.8 1,641.2 1,650.0 6,653.0
Q4 1,365.2 2,399.9 3,765.1 1,739.2 950.0 6,454.3
2010 Q1 994.5 3,643.0 4,637.5 1,756.4 1,082.5 7,476.4 Q2 969.4 2,795.4 3,764.8 1,798.3 1,946.4 7,509.5 Q3 1,038.3 3,105.3 4,143.6 2,157.8 647.8 6,949.2
Q4 1,320.0 3,087.6 4,407.6 2,195.8 1,196.5 7,799.9
2011 Q1 1,193.4 2,633.7 3,827.1 2,240.5 2,195.6 8,263.2 Q2 1,238.2 2,452.1 3,690.3 2,272.2 1,816.8 7,779.4
Q3 1,230.6 2,897.8 4,128.4 2,663.1 1,036.1 7,827.6 Q4 1,686.4 2,555.0 4,241.4 2,753.7 1,619.1 8,614.2
2012 Q1 1,338.2 3,892.2 5,230.4 2,706.6 1,120.9 9,057.8
Q2 1,428.1 3,200.8 5,230.4 2,812.0 1,086.0 9,057.8 Q3 1,528.6 4,145.5 5,674.1 2,807.9 1,068.1 9,550.1
Q4 2,073.4 3,170.3 5,243.7 2,859.3 804.0 8,907.0
2013 Q1 1,681.3 3,577.8 5,259.1 2,747.1 1,360.0 9,366.2 Q2 1,628.3 4,096.1 5,724.4 2,833.6 1,281.0 9,839.0

QUARTERLY ECONOMIC REVIEW JUNE 2013
59
Table 16: DOMESTIC BANKS CONSOLIDATED CAPITAL - 1/(Millions of Vatu)
TOTAL Less Capital
End of Paid-UpAudited Retained Other Less Less Total Unaudited Asset
General Provisions Total Tier 1 holdings Base
PeriodCapital Earnings goodwill Unaudited Tier 1 Profits
revalua- tion
for doubtful depts Tier 2 &
of other1/
(losses) etc Losses Capital reserves Eligible Gross Eligible Capital Tier 2 banks1/ 1/ 1/ capital
2008 3,478.0 5,907.5 - - - 9,385.5 - 48.0 217.0 - - 265.0 9,650.4 - 9,650.4
2009 3,471.0 5,677.8 - - - 9,148.8 - - 329.0 - - 329.0 9,477.8 - 9,477.8
2010 3,468.0 5,148.3 - 41.0 - 8,575.3 - (1.0) 329.1 - - 328.1 8,903.4 - 8,903.4
2011 3,558.0 5,119.5 (124.0) 24.0 - 8,529.5 806.1 (1.0) 421.3 - - 1,226.3 9,755.9 - 9,755.9
2012 3,986.5 5,441.7 - 10.0 - r 9,418.2 r 701.0 r - 463.5 - - 1,164.5 r 10,582.7 - 10,582.7
2008 Q1 2,523.0 5,408.5 - - - 7,931.5 - - 233.2 - - 233.2 8,164.8 - 8,164.8
Q2 2,522.0 5,645.4 - - - 8,167.4 - - 241.7 - - 241.7 8,409.1 - 8,409.1
Q3 2,527.0 6,354.5 - - - 8,881.5 - - 256.5 - - 256.5 9,138.0 - 9,138.0
Q4 3,478.0 5,907.5 - - - 9,385.5 - 48.0 217.0 - - 265.0 9,650.4 - 9,650.4
2009 Q1 3,479.0 6,068.0 - - - 9,547.0 - - 309.6 - - 309.6 9,856.7 - 9,856.7
Q2 3,474.0 5,896.5 - - - 9,370.5 - - 305.1 - - 305.1 9,675.6 - 9,675.6
Q3 3,471.0 6,239.5 - - - 9,710.5 - - 321.9 - - 321.9 10,032.4 - 10,032.4
Q4 3,471.0 5,677.8 - - - 9,148.8 - - 329.0 - - 329.0 9,477.8 - 9,477.8
2010 Q1 3,471.0 5,756.6 - - - 9,227.6 - - 326.0 - - 326.0 9,553.6 - 9,553.6
Q2 3,562.0 5,894.3 - - - 9,456.3 - (2.0) 326.0 - - 324.0 9,780.3 - 9,780.3
Q3 3,469.0 5,116.0 - 46.0 - 8,539.0 - - 328.0 - - 328.0 8,867.0 - 8,867.0
Q4 3,468.0 5,148.3 - 41.0 - 8,575.3 - (1.0) 329.1 - - 328.1 8,903.4 - 8,903.4
2011 Q1 3,468.0 4,678.5 90.0 37.0 - 8,199.5 758.1 (2.0) 412.1 - - 1,168.2 9,367.7 - 9,367.7
Q2 3,466.0 4,682.5 90.0 32.0 - 8,206.5 1,220.0 (1.0) 430.1 - - 1,649.1 9,855.6 - 9,855.6
Q3 3,558.0 4,689.5 (124.0) 28.0 - 8,095.5 1,322.2 (2.0) 438.1 - - 1,758.3 9,853.9 - 9,853.9
Q4 3,558.0 5,119.5 (124.0) 24.0 - 8,529.5 806.1 (1.0) 421.3 - - 1,226.3 9,755.9 - 9,755.9
2012 Q1 3,521.0 5,352.7 - 20.0 - 8,853.7 721.5 (1.0) 414.0 - - 1,134.5 9,988.2 - 9,988.2
Q2 3,558.0 r 5,047.7 - 16.0 6.0 8,583.7 1,037.1 - 425.5 - - 1,462.6 10,046.3 - 10,046.3
Q3 3,557.0 4,607.7 - 13.0 8.0 8,143.7 1,358.2 - 455.3 - - 1,813.5 9,957.2 - 9,957.2
Q4 3,986.5 5,441.7 - 10.0 - r 9,418.2 r 701.0 r - 463.5 - - 1,164.5 r 10,582.7 - 10,582.7
2013 Q1 3,986.5 5,534.2 - 7.0 28.0 9,485.7 560.4 - 495.6 - - 1,056.0 10,541.7 - 10,541.7
Q2 3,988.5 5,379.4 - 3.0 4.0 9,360.9 755.4 - 517.4 - - 1,272.8 10,633.7 - 10,633.7
TIER 1 TIER 2
Term subordinated
dept etc.

QUARTERLY ECONOMIC REVIEW JUNE 2013
60
Table 16: DOMESTIC BANKS CONSOLIDATED CAPITAL - 1/…continue(Millions of Vatu)
Total riskEnd of weighted Total Total risk Restructured Non-accrualPeriod assets Standard Substan- Doubtful Loss lending weighted items items Provisions Provisions Security
3/ dard (D) (L) losses assets 1/ (D+L) 2/ (specific) (General)
2008 35,709.6 30,695.5 686.3 3,101.9 365.3 34,849.1 26,810.6 20.7 3,467.2 1,353.7 130.6 23,537.2 2009 39,052.7 37,223.0 1,091.2 2,705.9 314.2 41,334.3 28,133.7 159.5 3,020.1 1,380.5 150.8 26,393.5 2010 41,366.3 42,255.2 777.7 1,869.7 367.8 45,270.4 29,101.3 22.7 2,237.5 737.3 186.9 28,596.4 2011 58,365.8 44,213.0 1,286.3 2,996.5 1,026.4 49,522.2 45,718.8 396.0 4,022.9 1,773.5 606.2 31,482.3 2012 61,900.7 45,306.3 2,224.9 2,784.8 1,429.0 51,745.0 51,548.7 536.8 4,213.8 2,111.0 833.9 35,184.6
2008 Q1 28,562.4 22,926.2 763.8 2,780.8 223.4 26,694.1 20,940.4 163.2 3,004.1 792.4 66.9 15,464.4 Q2 31,670.6 25,741.4 783.3 2,795.1 230.0 29,549.8 23,154.6 169.1 3,025.1 759.3 97.0 16,055.2 Q3 33,136.9 28,294.4 699.6 2,930.5 354.6 32,279.1 24,723.9 189.0 3,285.1 1,343.9 100.8 20,773.1 Q4 35,709.6 30,695.5 686.3 3,101.9 365.3 34,849.1 26,810.6 206.5 3,467.2 1,353.7 130.6 23,537.2
2009 Q1 36,188.5 32,382.8 840.7 2,919.3 361.2 36,504.0 26,593.5 177.6 3,280.5 1,434.7 227.0 23,087.2 Q2 36,140.3 33,082.2 979.6 2,838.8 369.0 37,269.5 26,084.3 238.9 3,207.7 1,216.1 328.1 23,243.5 Q3 37,818.3 35,711.2 879.9 2,882.6 347.8 39,821.5 27,481.3 186.5 3,230.4 1,287.2 119.8 25,699.6 Q4 39,052.7 37,223.0 1,091.2 2,705.9 314.2 41,334.3 28,133.7 159.5 3,020.1 1,380.5 150.8 26,393.5
2010 Q1 40,044.6 38,388.8 1,111.1 2,340.0 287.0 42,127.0 28,073.6 115.5 2,627.0 1,024.5 358.4 25,749.9 Q2 40,390.7 40,158.6 925.4 2,281.9 280.0 43,645.9 28,234.7 81.3 2,561.9 1,028.1 186.2 27,579.7 Q3 40,560.3 41,094.9 853.9 1,753.5 414.3 44,116.5 28,567.3 34.6 2,167.8 687.6 239.2 28,070.0 Q4 41,366.3 42,255.2 777.7 1,869.7 367.8 45,270.4 29,101.3 22.7 2,237.5 737.3 186.9 28,596.4
2011 Q1 60,233.8 41,859.7 1,884.1 1,852.9 411.5 46,008.2 47,972.8 86.7 2,264.4 615.7 243.2 29,424.2 Q2 57,272.9 42,204.2 2,214.4 1,950.6 458.9 46,828.2 44,838.9 159.1 2,409.6 616.5 199.5 40,703.7 Q3 57,974.2 42,586.7 1,272.7 2,911.0 1,270.2 48,040.7 46,560.2 249.4 4,181.2 1,913.6 976.6 40,196.9 Q4 58,365.8 44,213.0 1,286.3 2,996.5 1,026.4 49,522.2 45,718.8 396.0 4,022.9 1,773.5 606.2 31,482.3
2012 Q1 63,143.9 44,030.8 1,874.9 3,185.7 1,066.1 50,157.5 51,043.9 458.0 4,251.8 1,776.5 674.9 32,196.8 Q2 61,519.1 44,042.9 2,010.1 3,471.8 1,173.8 50,698.6 49,829.1 650.4 4,645.6 1,980.5 938.2 32,855.9 Q3 61,027.4 44,736.3 1,405.0 3,205.0 1,324.6 50,670.8 50,545.4 574.6 4,529.6 2,105.6 782.3 34,590.8 Q4 61,900.7 45,306.3 2,224.9 2,784.8 1,429.0 51,745.0 51,548.7 536.8 4,213.8 2,111.0 833.9 35,184.6
2013 Q1 65,337.9 44,447.6 2,055.0 3,107.9 1,463.3 51,073.8 55,244.9 54.7 4,571.1 2,191.4 838.8 34,687.9 Q2 63,681.1 44,120.0 2,294.9 1,029.3 3,841.0 51,285.2 54,284.1 76.9 4,870.3 2,220.3 881.9 35,409.5
1/ Excluding branches of foreign banks2/ Impared assets3/ including branches of foreign banks
ASSETS QUALITY - 3/
1 Asset Quality 2 Provisioning

QUARTERLY ECONOMIC REVIEW JUNE 2013
61
TABLE 17 : INTERNATIONAL BANKS - BALANCE SHEET (A)
TOTAL ASSETS (Thousands of USD)
End of
PeriodCash Balances Gold Cash TOTAL Zone Zone A: Other TOTAL Public Banks Other TOTAL
& CDs and items in A: Bank securities Sector loans &issued by Silver process of Other securities advancesbanks Bullion collection public
sector2008 4,524 118,713 14,615 137,852 10,853 32,219 43,072 2009 195 54,782 22,517 77,494 11,574 32,825 44,3992010 313 55,524 17,554 73,391 1,318 1,318 6,050 24,584 30,6342011 1,717 33,240 16,596 51,553 2,755 2,755 0 23,828 23,8282012 5,630 11,350 14,801 31,781 2,722 2,722 0 21,853 21,853
2008 Q1 147 118,824 16,920 135,891 0 0 20,393 38,591 58,984Q2 919 113,716 15,994 130,629 0 0 19,583 37,207 56,790Q3 1,899 120,140 14,484 136,523 0 0 14,764 32,116 46,880Q4 4,524 118,713 14,615 137,852 10,853 32,219 43,072
2009 Q1 1,476 122,408 22,938 146,822 13,959 18,347 32,306Q2 604 137,585 22,904 161,093 13,237 16,884 30,121Q3 176 148,245 24,052 172,473 14,842 47,769 62,611Q4 195 54,782 22,517 77,494 11,574 32,825 44,399
2010 Q1 697 40,618 21,175 62,490 9,057 25,854 34,911Q2 724 28,488 17,511 46,723 6,037 27,992 34,029Q3 655 30,381 18,213 49,249 1,102 1,102 6,302 28,454 34,756Q4 313 55,524 17,554 73,391 1,318 1,318 6,050 24,584 30,634
2011 Q1 417 r 21,286 r 0 19,816 41,519 0 0 2,269 2,269 0 11,161 22,103 33,264Q2 1,404 16,024 0 20,331 37,759 0 0 3,107 3,107 0 10,087 20,796 30,883Q3 695 15,135 0 17,003 32,833 0 0 2,891 2,891 0 0 24,281 24,281Q4 1,717 33,240 0 16,596 51,553 0 0 2,755 2,755 0 0 23,828 23,828
2012 Q1 721 29,587 0 15,177 45,485 0 0 3,466 3,466 0 0 24,204 24,204Q2 1,733 25,795 0 14,118 41,646 0 0 3,451 3,451 0 0 24,005 24,005Q3 5,018 12,347 0 14,437 31,802 0 0 2,782 2,782 0 0 21,078 21,078Q4 5,630 11,350 0 14,801 31,781 0 0 2,722 2,722 0 0 21,853 21,853
2013 Q1 2,487 10,680 0 15,006 28,173 0 0 5,846 5,846 0 0 22,813 22,813Q2 1,278 10,622 0 15,345 27,245 0 0 5,734 5,734 0 0 5,994 5,994
1 CASH ITEMS 2 MARKET SECURITIES 3 LOANS & ADVANCES
(up to 1 yr. Original Maturity)

QUARTERLY ECONOMIC REVIEW JUNE 2013
62
TABLE 17: INTERNATIONAL BANKS - BALANCE SHEET (A) … continue
TOTAL ASSETS (Thousands of USD)
End of 6 TOTALPeriod ASSETS
Zone A: Affiliated Other Other TOTAL Equipement Accured Other TOTAL
Public Institutions Securities Equities & other fixed interest assetsSector & assets(net of receivable r/Bank accumulated r/
Securities depreciation)2008 500,532 2,727 503,259 378 22 131 531 684,714 2009 500,333 5,697 506,030 40 1,138 16 1,194 629,117 2010 7 7 138 828 115 1,081 106,431 2011 5,818 7 - - 5,825 170 618 52 840 84,801 2012 5,075 7 - - 5,082 233 680 150 1,063 62,501
2008 Q1 502,212 2,716 44 504,972 26 6 143 175 700,022 Q2 501,297 2,675 - 503,972 52 - 186 238 691,629 Q3 501,195 2,638 - 503,833 64 2 228 294 687,530 Q4 500532 2727 0 503,259 378 22 131 531 684,714
2009 Q1 500,305 5,481 505,786 877 498 150 1,525 686,439 Q2 500,324 5,568 505,892 1,126 669 403 2,198 699,304 Q3 500,336 5,700 506,036 1,431 1,011 44 2,486 743,606 Q4 500,333 5,697 506,030 40 1,138 16 1,194 629,117
2010 Q1 500,309 5,885 506,194 34 298 14 346 603,941 Q2 6 5,885 5,891 32 440 15 487 87,130 Q3 7 - 7 44 617 14 675 85,789 Q4 7 - 7 138 828 115 1,081 782
2011 Q1 - 7 - 7 149 216 77 442 77,501 Q2 - 7 - 7 146 395 127 668 72,424 Q3 6,030 7 - 6,037 158 536 47 741 66,783 Q4 5,818 7 - 5,825 170 618 52 840 84,801
2012 Q1 6,544 7 - 6,551 167 169 98 434 80,140 Q2 4,883 6 - 4,889 149 361 70 580 74,571 Q3 5,571 6 - 5,577 248 510 32 790 62,029 Q4 5,075 7 - 5,082 233 680 150 1,063 62,501
2013 Q1 4,545 6 - - 4,551 252 195 168 615 61,998
Q2 5,537 7 - - 5,544 236 70 94 400 44,917
4 INVESTMENTS 5 OTHER ASSETS(Over 1 yr Original Maturity for dept instrument)
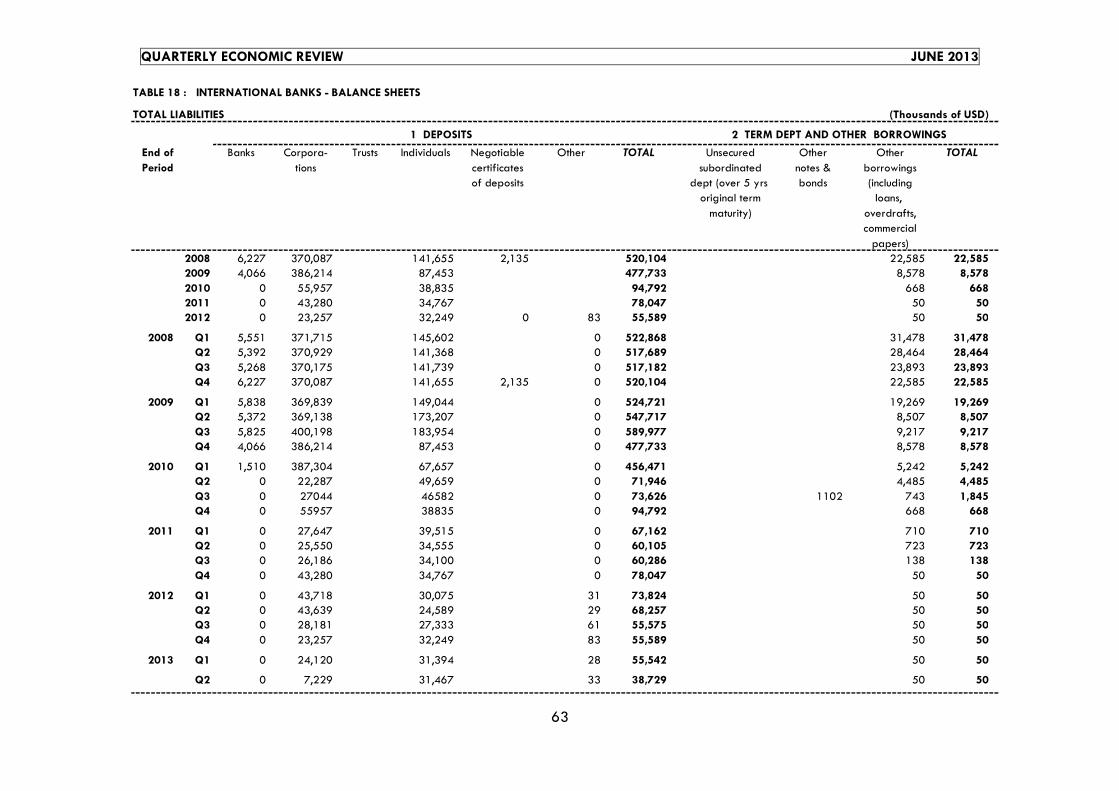
QUARTERLY ECONOMIC REVIEW JUNE 2013
63
TABLE 18 : INTERNATIONAL BANKS - BALANCE SHEETS
TOTAL LIABILITIES (Thousands of USD)
End of Banks Corpora- Trusts Individuals Negotiable Other TOTAL Unsecured Other Other TOTAL
Period tions certificates subordinated notes & borrowingsof deposits dept (over 5 yrs bonds (including
original term loans, maturity) overdrafts,
commercialpapers)
2008 6,227 370,087 141,655 2,135 520,104 22,585 22,5852009 4,066 386,214 87,453 477,733 8,578 8,5782010 0 55,957 38,835 94,792 668 6682011 0 43,280 34,767 78,047 50 502012 0 23,257 32,249 0 83 55,589 50 50
2008 Q1 5,551 371,715 145,602 0 522,868 31,478 31,478Q2 5,392 370,929 141,368 0 517,689 28,464 28,464Q3 5,268 370,175 141,739 0 517,182 23,893 23,893Q4 6,227 370,087 141,655 2,135 0 520,104 22,585 22,585
2009 Q1 5,838 369,839 149,044 0 524,721 19,269 19,269Q2 5,372 369,138 173,207 0 547,717 8,507 8,507Q3 5,825 400,198 183,954 0 589,977 9,217 9,217Q4 4,066 386,214 87,453 0 477,733 8,578 8,578
2010 Q1 1,510 387,304 67,657 0 456,471 5,242 5,242Q2 0 22,287 49,659 0 71,946 4,485 4,485Q3 0 27044 46582 0 73,626 1102 743 1,845Q4 0 55957 38835 0 94,792 668 668
2011 Q1 0 27,647 39,515 0 67,162 710 710Q2 0 25,550 34,555 0 60,105 723 723Q3 0 26,186 34,100 0 60,286 138 138Q4 0 43,280 34,767 0 78,047 50 50
2012 Q1 0 43,718 30,075 31 73,824 50 50Q2 0 43,639 24,589 29 68,257 50 50Q3 0 28,181 27,333 61 55,575 50 50Q4 0 23,257 32,249 83 55,589 50 50
2013 Q1 0 24,120 31,394 28 55,542 50 50
Q2 0 7,229 31,467 33 38,729 50 50
1 DEPOSITS 2 TERM DEPT AND OTHER BORROWINGS

QUARTERLY ECONOMIC REVIEW JUNE 2013
64
TABLE 18 : INTERNATIONAL BANKS - BALANCE SHEETS…Continue
TOTAL LIABILITIES ( Thousands of USD)
4 OTHER 6 TOTAL 9 TOTALEnd of LIABILI- LIABILI- LIABILITIESPeriod Accrued Dividend Other TOTAL TIES General Other TOTAL TIES Issued & Additional Unappro- Current Perpertual 8 TOTAL & SHARE-
interest payable accured loan loss loss fully paid paid up priated year's on HOLDERSpayable expenses reserves reserves up common capital in retained net comulative EQUITY
stock excess of earnings income/ issued &(at par or par or (loss) fully paid upnorminal nominal preferencevalue) value share
2008 0 208 208 1,324 460 0 460 544,681 5,448 920 133,242 423 140,033 684,7142009 885 34 919 192 460 0 460 487,882 6,472 383 133,361 976 141,192 629,0742010 587 165 752 1,730 0 0 0 97,942 5,912 353 2,016 207 8,488 106,4302011 452 127 579 123 0 4 4 78,803 4,239 285 1,551 -78 5,997 84,8002012 593 0 66 659 0 0 10 10 56,308 4,257 554 1,458 -76 6,193 62,501
2008 Q1 4 13 17 131 460 0 460 554,954 9,679 1,000 134,091 298 145,068 700,022Q2 10 24 34 273 460 0 460 546,920 9,533 1,004 133,816 356 144,709 691,629Q3 0 641r 28 669 1,191 460 0 460 543,395 9,471 943 133,865 -144 144,135 687,530Q4 208 208 1,324 460 0 460 544,681 5,448 920 133,242 423 140,033 684,714
2009 Q1 430 670 1,100 1,180 460 0 460 546,730 5,409 694 133,443 163 139,709 686,439Q2 556 503 1,059 141 460 460 557,884 5,916 1,276 133,382 846 141,420 699,304Q3 794 84 878 305 460 0 460 600,837 7,445 926 133,351 1,047 142,769 743,606Q4 885 34 919 192 460 460 487,882 6,472 383 133,361 976 141,192 629,074
2010 Q1 224 26 250 182 460 460 462,605 6,417 356 133,850 713 141,336 603,941Q2 315 64 379 1,414 0 0 78,224 6,370 333 2,078 125 8,906 87,130Q3 465 59 524 1,321 0 0 77,316 5,939 366 2,000 168 8,473 85,789Q4 587 165 752 1,730 0 0 97,942 5,912 353 2,016 207 8,488 106,430
2011 Q1 178 255 92 525 3,136 0 4 4 71,537 4,331 99 1,500 34 5,964 77,501Q2 323 0 214 537 5,037 0 4 4 66,406 4,362 102 1,482 72 6,018 72,424Q3 335 0 84 419 71 0 4 4 60,918 4,272 161 1,532 -100 5,865 66,783Q4 452 0 128 580 123 0 4 4 78,804 4,239 285 1,551 -78 5,997 84,801
2012 Q1 147 0 75 222 26 0 4 4 74,126 4,265 293 1,454 2 6,014 80,140Q2 316 0 65 381 0 0 10 10 68,698 4,214 279 1,487 -107 5,873 74,571Q3 446 0 18 464 0 0 10 10 56,099 4,232 283 1,475 -60 5,930 62,029Q4 593 0 66 659 0 0 10 10 56,308 4,257 554 1,458 -76 6,193 62,501
2013 Q1 171 0 126 297 0 0 10 10 55,899 4,227 538 1,412 -78 6,099 61,998
Q2 29 0 126 155 0 0 12 12 38,946 4,241 546 1,394 -210 5,971 44,917
3 ACCRUED LIABILITIES 5 LOSS RESERVES 7 SHAREHOLDERS EQUITY

QUARTERLY ECONOMIC REVIEW JUNE 2013
65
TABLE 19: DOMESTIC BANKING INDUSTRY FOREIGN EXCHANGE TURNOVER AGAINST VATU AND USD CURRENCY ( Excluding Cross Currency)
FOREIGN EXCHANGE TURNOVER AGAINST VATU CURRENCY (Millions of Vatu)End of Total FX
Period Resident Over- Resident Non- Internal Total Resident Over- Resident Non- Internal Total Resident Over- Resident Non- Internal Total turnoverDealers seas Customers resident Transac- Dealers seas Customers Resident Transac- Dealers seas Customers Resident Transac- against
Banks Customers tions Banks Customers tions Banks Customers tions Vatu
2009 502.6 942.8 4,333.6 - 5,779.1 355.3 - 355.3 - - - - - - 6,134.4 2010 1,203.7 270.5 3,963.9 492.7 - 5,930.8 111.7 - 111.7 - - - - - - 6,042.5
2011 142.8 555.5 4,469.6 0.5 1.4 5,169.9 - - 76.8 - - 76.8 - - - - - - 5,246.7 2012 130.5 665.0 4,580.2 - 347.4 5,723.0 127.9 - - - - 127.9 - - - - - - 5,851.0
2008 Q1 39.3 230.4 2,428.1 52.0 2,749.7 5.2 88.8 672.2 766.2 - 3,515.9 Q2 321.6 758.7 3,895.5 116.1 5,091.9 786.8 786.8 - 5,878.8
Q3 211.7 339.7 6,101.6 620.7 7,273.6 568.9 568.9 - 7,842.5 Q4 116.4 659.8 3,573.9 - 4,350.0 97.2 97.2 - 4,447.3
2009 Q1 724.5 202.4 5,576.1 - 6,503.1 193.7 193.7 - 6,696.8 Q2 545.8 369.2 3,782.9 268.1 4,966.0 10.5 10.5 10.5 - 4,976.5
Q3 1,495.1 549.0 3,671.4 407.3 6,122.8 260.7 260.7 - 6,383.4 Q4 502.6 942.8 4,333.6 - 5,779.1 355.3 355.3 - 6,134.4
2010 Q1 627.3 739.7 2,875.9 551.6 4,794.5 110.9 110.9 - 4,905.3 Q2 1,473.2 536.7 2,764.9 414.8 5,189.6 61.0 61.0 - 5,250.5
Q3 906.8 733.8 3,181.6 595.2 5,417.3 167.6 167.6 - 5,584.9 Q4 1,203.7 270.5 3,963.9 492.7 - 5,930.8 111.7 111.7 - 6,042.5
2011 Q1 161.2 388.8 3,685.9 - 0.2 4,236.1 147.0 0 147.0 - 4,383.1
Q2 222.0 437.5 4,414.2 - 0.5 5,074.2 270.7 0 270.7 - 5,344.9 Q3 574.4 1,486.5 5,683.1 - 0.4 7,744.4 277.3 0 277.3 - 8,021.7 Q4 142.8 555.5 4,469.6 0.5 1.4 5,169.9 76.8 0 76.8 - 5,246.7
2012 Q1 299.0 529.6 4,080.7 - 55.9 4,965.1 224.6 3.1 0 227.6 - 5,192.8
Q2 146.3 689.3 5,173.6 - 49.7 6,058.9 141.8 - 0 141.8 - 6,200.7 Q3 94.5 992.6 4,361.9 52.9 288.9 5,790.9 188.4 11.1 - 199.5 - 5,990.4 Q4 130.5 665.0 4,580.2 - 347.4 5,723.0 127.9 - - 127.9 - 5,851.0
2013 Q1 82.8 500.2 3,482.8 - 186.1 4,251.9 52.8 - 191.0 0 243.8 - 4,495.7
Q2 236.2 577.2 4,188.5 - 136.1 5,138.0 105.0 74.0 - 0 179.0 - 5,317.0
OUTRIGHT SPOT OUTRIGHT FORWARD SWAPS

QUARTERLY ECONOMIC REVIEW JUNE 2013
66
TABLE 19: DOMESTIC BANKING INDUSTRY FOREIGN EXCHANGE TURNOVER AGAINST VATU AND USD CURRENCY ( Excluding Cross Currency)…Continue
FOREIGN EXCHANGE TURNOVER AGAINST USD CURRENCY (Millions of Vatu)
End of Total FX TOTAL FXPeriod Resident Over- Resident Non- Internal Total Resident Over- Resident Non- Internal Total Resident Over- Resident Non- Internal Total turnover TURNOVER
Dealers seas Customers resident Transac- Dealers seas Customers resident Transac- Dealers seas Customers resident Transac- against AGAINSTBanks Customers tions Banks Customers tions Banks Customers tions USD VATU &
USD2008 4 659 638 0 1,301 1,301 5,748 2009 3 810 96 0 908 - 908 7,043 2010 3 460 71 0 - 534 - 0 534 6,577 2011 321 386 122 - - 829 - 0 829 6,076 2012 362 625 190 15 - 1,192 - - 1,192 7,043
2008 Q1 80 673 755 1,509 257 257 0 1,766 5,282 Q2 566 141 3 710 15 15 0 724 6,603 Q3 7 705 377 4 1,094 0 0 1,094 8,937 Q4 4 659 638 0 1,301 1,301 5,748
2009 Q1 1 511 727 0 1,240 0 0 1,240 7,937 Q2 2 324 175 1 501 0 0 501 5,478 Q3 402 272 113 0 787 787 7,170 Q4 3 810 96 0 908 0 908 7,043
2010 Q1 1 406 196 0 602 0 0 602 5,508 Q2 1 332 0 0 0 334 0 0 334 5,585 Q3 1 464 60 - 526 0 0 526 6,111 Q4 3 460 71 0 - 534 0 0 534 6,577
2011 Q1 - 413 151 0 1 565 0 0 565 4,948 Q2 230 507 256 - - 993 0 0 993 6,338 Q3 366 520 61 - - 947 0 0 947 8,969 Q4 321 386 122 - - 829 0 0 829 6,076
2012 Q1 186 955 635 4 0 1,780 0 0 1,780 6,972 Q2 333 751 333 0 - 1,418 0 0 1,418 7,618 Q3 239 994 118 - - 1,350 0 0 1,350 7,341 Q4 362 625 190 15 - 1,192 0 0 1,192 7,043
2013 Q1 294 694 306 0 - 1,295 0 0 1,295 5,791 Q2 500 614 427 - 6 1,548 0 0 1,548 6,865
OUTRIGHT SPOT OUTRIGHT FORWARD SWAPS

QUARTERLY ECONOMIC REVIEW JUNE 2013
67
TABLE 20: DOMESTIC BANKING INDUSTRY CORE SET OF FINANCIAL SOUNDNESS INDICATORS
Percent (%)
End of 4 LIQUIDITY
Period Regulatory Regulatory Nonperform- Nonperform- Return on Return on Interest Noninterest Liquid assetsCapital to Tier 1 Capital loans net of loans to assets equity margin to expenses to total assetsrisk - to risk - provisions total gross (ROA) (ROE) gross to gross
Weighted Weighted to capital loans income incomeassets 1/ assets 1/
2008 36.0 35.0 20.5 9.9 0.8 6.7 37.6 36.2 18.62009 33.7 32.5 15.7 7.3 0.6 4.6 42.5 46.1 16.52010 30.6 29.5 14.7 4.9 0.8 6.2 41.9 37.8 16.52011 21.3 18.7 16.8 8.1 0.6 4.7 43.1 46.4 18.22012 20.5 18.3 12.0 8.1 0.6 4.3 46.5 52.4 18.8
2008 Q1 39.0 37.9 26.3 11.3 0.6 6.2 38.5 39.2 16.6Q2 36.3 35.3 25.8 10.2 0.7 5.8 36.6 38.0 15.3Q3 37.0 35.9 20.1 10.2 0.6 5.6 37.1 37.3 11.9Q4 36.0 35.0 20.5 9.9 0.8 6.7 37.6 36.2 18.6
2009 Q1 37.1 35.9 16.4 9.2 0.5 3.9 37.4 41.8 17.6Q2 37.1 35.9 17.2 8.6 0.8 5.5 40.5 41.2 16.1Q3 36.5 35.3 18.2 8.1 1.0 6.9 43.3 33.2 17.9Q4 33.7 32.5 15.7 7.3 0.6 4.6 42.5 46.1 16.5
2010 Q1 34.0 32.9 13.0 6.2 0.7 4.9 43.5 41.9 19.3Q2 34.6 33.5 13.8 5.9 0.7 5.1 42.6 41.8 19.3Q3 31.0 29.9 14.0 4.9 0.8 5.8 42.4 43.6 16.1Q4 30.6 29.5 14.7 4.9 0.8 6.2 41.9 37.8 16.5
2011 Q1 19.5 17.1 15.0 4.9 0.7 5.1 42.0 47.0 16.8Q2 22.0 18.3 16.2 5.1 0.7 5.0 42.4 49.0 17.6Q3 21.2 17.4 13.1 8.7 0.4 2.6 41.0 60.4 17.3Q4 21.3 18.7 16.8 8.1 0.6 4.7 43.1 46.4 18.2
2012 Q1 19.6 17.4 18.0 8.5 0.3 2.5 39.8 58.6 19.6Q2 20.2 17.2 17.2 9.2 0.5 3.5 43.7 54.9 18.9Q3 19.7 16.1 16.5 8.9 0.6 4.2 44.0 51.8 21.8Q4 20.5 18.3 12.0 8.1 0.6 4.3 46.5 52.4 18.8
2013 Q1 19.1 17.2 14.6 9.0 0.5 3.1 47.5 57.5 20.2
Q2 19.6 17.2 16.6 9.5 0.4 2.3 47.2 64.0 21.4
1/ - Excluding branches of foreign banks2/including foreign branches
DEPOSIT - TAKING INSTRUMENTS
1 CAPITAL ADEQUACY 2 ASSET QUALITY 3 EARNINGS & PROFITABILITY

QUARTERLY ECONOMIC REVIEW JUNE 2013
68
TABLE 21: DOMESTIC BANKING INDUSTRY - PROFIT
(Millions of Vatu)
End of Interest Non- Total Interest Operating Total Net Operating Provisions General Extra- Bad Depts Bad- NetPeriod income interest Operating Expense Expenses Operating Interest Profit Reserves ordinary Written-off depts Operating
income Income (Excluding expenses Income before tax, Items recovered Profitbad depts write-offs
& provision & provisionscharges
2008 1,321 648 1,968 581 712 1,293 739 675 35 33 (110) 72 2009 1,260 599 1,858 471 858 1,328 789 530 (8) 13 97 428 2010 1,301 685 1,986 468 751 1,219 833 767 7 17 120 623 2011 1,308 589 1,897 491 880 1,371 817 526 13 - - r 113 - r 400 2012 1,230 611 1,841 964 964 1,338 855 502 38 - - 25 - 439
2008 Q1 1,163 489 1,652 527 647 1,173 636 479 23 - 456 Q2 1,235 557 1,792 579 682 1,261 656 531 28 (13) 516 Q3 1,289 519 1,808 618 675 1,292 671 515 31 410 74 Q4 1,321 648 1,968 581 712 1,293 739 675 35 33 (110) 717
2009 Q1 1,114 511 1,625 506 679 1,185 608 440 (1) 2 7 431 Q2 1,183 639 1,822 446 752 1,197 738 625 3 2 (160) 780 Q3 1,281 611 1,893 462 629 1,091 820 802 3 1 (85) 884 Q4 1,260 599 1,858 471 858 1,328 789 530 (8) 13 97 428
2010 Q1 1,231 528 1,759 466 738 1,204 765 555 16 4 75 460 Q2 1,268 567 1,835 487 767 1,254 781 581 62 1 (33) 550 Q3 1,316 660 1,976 479 860 1,339 837 637 24 20 58 534 Q4 1,301 685 1,986 468 751 1,219 833 767 7 17 120 623
2011 Q1 1,277 633 1,910 474 898 1,372 803 538 0 1 81 456 Q2 1,291 685 1,976 454 968 1,422 837 554 3- 5 26 527 Q3 1,262 661 1,923 473 1,162 1,634 789 288 25 - 988 724- Q4 1,308 589 1,897 491 880 1,371 817 526 13 - 113 400
2012 Q1 1,211 622 1,833 481 1,075 1,555 730 278 5 - 399 126- Q2 1,242 602 1,844 436 1,012 1,448 806 396 14 - 156 226
Q3 1,189 610 1,800 397 932 1,329 792 470 12 - 915 456- Q4 1,230 611 1,841 374 964 1,338 855 502 38 - 25 439
2013 Q1 1,147 546 1,693 343 973 1,315 805 378 4 17 99 258 Q2 1,160 563 1,723 346 1,102 1,448 814 275 13 32 35 195
1 INCOME 2 EXPENSES 3 PROFIT & LOSS STATEMENT

QUARTERLY ECONOMIC REVIEW JUNE 2013
69
TABLE 22: TOTAL GOVERNMENT FISCAL OPERATIONS
(Millions of Vatu)
TOTAL REVENUE AND GRANTS
Taxes on
property
TOTAL REVENUE
Value-Added Tax
Excise Other Total
2010 485.4 4,301.1 1,882.3 1,774.0 7,957.4 2,645.9 4,431.4 1,187.4 16,707.5
2011 430.6 4,710.9 1,935.7 1,681.1 8,327.7 2,871.4 2,883.1 1,220.3 15,733.1 2012 548.3 5,011.0 1,875.7 1,967.2 8,853.9 2,580.2 2,174.1 1,607.7 15,764.2
2010 Q1 113.5 948.4 325.3 982.1 2,255.8 640.3 1,174.0 188.5 4,372.1 Q2 133.3 937.9 431.9 287.8 1,657.6 538.1 1,769.8 265.0 4,363.8
Q3 137.5 1,272.9 523.0 212.2 2,008.1 689.3 952.2 339.3 4,126.4
Q4 101.1 1,141.9 602.1 291.9 2,035.8 778.3 535.4 394.6 3,845.2
2011 Q1 86.9 1,041.8 447.0 871.9 2,360.7 614.5 1,598.1 318.7 4,978.9
Q2 96.4 1,102.0 484.6 251.2 1,837.8 688.1 710.6 244.1 3,577.0 Q3 130.4 1,388.5 483.7 366.5 2,238.6 752.0 333.2 389.2 3,843.6
Q4 116.8 1,178.6 520.5 191.5 1,890.5 816.8 241.1 268.3 3,333.6
2012 Q1 158.4 1,098.9 460.3 797.7 2,356.9 571.4 743.5 548.3 4,378.4 Q2 118.6 1,112.4 398.3 356.1 1,866.8 558.1 1,004.2 309.5 3,857.2
Q3 124.3 1,339.6 463.9 402.1 2,205.6 700.5 186.3 516.1 3,732.7 Q4 147.1 1,460.0 553.2 411.4 2,424.6 750.3 240.2 233.8 3,795.9
2013 Q1 97.4 1,195.5 410.7 1,175.4 2,781.5 544.4 269.4 382.4 4,075.1 Q2 79.1 1,356.5 491.8 387.1 2,235.5 674.6 852.7 319.0 4,160.9
(Millions of Vatu)
Compen. of employees
Uses of G&S
Interest Grants S.
Benefits
Other Expenditu
res
TOTAL EXPENSES
NET OPERATI
NG BALANC
E
NET ACQUISITI
ON OF NON-
FINANCIAL ASSETS
FISCAL SURPLUS/
DEFICT
2010 7,830.8 4,693.3 333.5 1,510.4 410.0 330.9 15,108.9 1,598.6 3,306.8 -1,708.2
2011 7,869.9 4,684.5 397.8 1,572.8 240.0 669.2 15,434.2 298.9 1,280.5 -981.6
2012 8,411.7 4,156.1 463.1 1,892.8 311.6 569.2 15,804.5 -40.3 1,138.5 -1,178.8
2010 Q1 1,554.2 1,005.8 108.9 536.3 104.6 58.0 3,367.8 1,004.2 686.6 317.7
Q2 2,029.8 1,160.8 66.9 380.8 92.5 90.1 3,820.8 543.0 822.9 -280.0Q3 1,816.2 1,093.6 101.8 496.4 132.2 100.1 3,740.4 386.0 727.1 -341.1
Q4 2,430.6 1,433.0 56.0 96.9 80.7 82.7 4,179.9 -334.7 1,070.2 -1,404.8
2011 Q1 1,597.4 1,184.5 87.0 673.4 48.3 167.9 3,758.6 1,220.4 158.8 1,061.5
Q2 2,086.1 1,233.4 90.7 282.8 36.6 207.0 3,936.6 -359.6 175.7 -535.3
Q3 2,137.6 1,179.4 175.7 285.4 70.8 142.4 3,991.3 -147.8 292.8 -440.6
Q4 2,048.8 1,087.1 44.4 331.2 84.3 151.9 3,747.7 -414.1 653.2 -1,067.3
2012 Q1 1,970.8 987.6 123.2 641.3 71.8 232.0 4,026.7 351.8 330.7 21.1
Q2 1,876.2 1,169.8 110.5 289.7 67.1 128.1 3,641.5 215.7 245.2 -29.5Q3 2,458.8 978.3 185.9 646.4 55.6 138.8 4,463.9 -731.2 288.8 -1,020.0
Q4 2,106.0 1,020.3 43.4 315.3 117.2 70.3 3,672.5 123.4 273.8 -150.4
2013 Q1 1,972.5 865.8 150.5 587.8 41.4 262.4 3,880.4 295.2 182.7 11.9Q2 1,962.0 1,165.2 160.1 852.7 83.5 116.4 4,340.0 386.4 156.7 229.7
Taxes on goods & services
Taxes on inter.
trade & transact.
Grants Other revenue
TOTAL EXPENSES

QUARTERLY ECONOMIC REVIEW JUNE 2013
70
TABLE 23: GOVERNMENT OPERATIONS EXCLUDING DONORS
(Millions of Vatu)
Taxes on
property Taxes on goods & services
Taxes on inter. trade
& transact.
Grants Other
revenue
TOTAL
REVENUE
Value-Added Tax
Excise OtherTotal
2010 485.4 4,301.1 1,882.3 1,774.0 7,957.4 2,645.9 - 1,187.4 12,276.0 2011 430.6 4,710.9 1,935.7 1,681.1 8,327.7 2,871.4 - 1,220.3 12,850.0
2012 548.3 5,011.0 1,875.7 1,967.2 8,853.9 2,580.2 - 1,607.7 13,590.1
2010 Q1 113.5 948.4 325.3 982.1 2,255.8 640.3 - 188.5 3,198.1
Q2 133.3 937.9 431.9 287.8 1,657.6 538.1 - 265.0 2,594.0 Q3 137.5 1,272.9 523.0 212.2 2,008.1 689.3 - 339.3 3,174.2
Q4 101.1 1,141.9 602.1 291.9 2,035.8 778.3 - 394.6 3,309.8
2011 Q1 86.9 1,041.8 447.0 871.9 2,360.7 614.5 - 318.7 3,380.8 Q2 96.4 1,102.0 484.6 251.2 1,837.8 688.1 - 244.1 2,866.4
Q3 130.4 1,388.5 483.7 366.5 2,238.6 752.0 - 389.2 3,510.3 Q4 116.8 1,178.6 520.5 191.5 1,890.5 816.8 - 268.3 3,092.5
2012 Q1 158.4 1,098.9 460.3 797.7 2,356.9 571.4 - 548.3 3,635.0
Q2 118.6 1,112.4 398.3 356.1 1,866.8 558.1 - 309.5 2,852.9
Q3 124.3 1,339.6 463.9 402.1 2,205.6 700.5 - 516.1 3,546.4 Q4 147.1 1,460.0 553.2 411.4 2,424.6 750.3 - 233.8 3,555.8
2013 Q1 97.4 1,195.5 r 410.7 r 1,175.4 r 2,781.5 r 544.4 r - 382.4 3,805.7 rQ2 79.1 1,356.5 491.8 387.1 2,235.5 674.6 - 319.0 3,308.2
(Millions of Vatu)
TOTAL EXPENSES
S.Benefits
2010 7,526.0 3,339.4 333.5 1,115.6 404.6 319.9 13,039.0 -763.0 443.1 -1,206.02011 7,651.1 3,101.8 397.8 1,283.7 239.7 658.8 13,333.0 -483.0 426.0 -908.92012 8,164.7 2,940.7 463.1 1,462.7 309.8 554.9 13,896.0 -305.9 313.0 -618.9
2010 Q1 1,515.0 786.1 108.9 317.6 104.6 58.0 2,890.1 308.0 117.2 190.7Q2 1,929.1 832.9 66.9 370.1 87.1 89.0 3,375.0 -781.1 102.7 -883.7Q3 1,754.3 778.9 101.8 293.1 132.2 96.3 3,156.6 17.6 79.3 -61.8Q4 2,327.7 941.4 56.0 134.9 80.7 76.6 3,617.3 -307.4 143.8 -451.3
2011 Q1 1,546.5 903.9 87.0 536.4 48.0 167.0 3,288.7 92.1 97.7 -5.6Q2 2,036.0 924.6 90.7 254.2 36.6 206.1 3,548.2 -681.8 145.4 -827.2Q3 2,074.0 552.2 175.7 270.8 70.8 135.8 3,279.3 231.0 59.6 171.4Q4 1,994.6 721.1 44.4 222.4 84.3 149.9 3,216.8 -124.3 123.3 -247.5
2012 Q1 1,906.4 759.1 123.2 547.1 70.4 224.7 3,630.9 4.0 65.3 -61.3Q2 1,820.8 936.2 110.5 244.1 66.7 125.9 3,304.3 -451.3 86.7 -538.1Q3 2,397.4 706.0 185.9 440.2 55.6 133.1 3,918.2 -371.7 82.6 -454.3Q4 2,040.1 539.4 43.4 231.3 117.2 71.3 3,042.6 513.1 78.4 434.7
2013 Q1 1,924.8 r 649.7 r 150.5 r 550.0 r 41.5 244.4 r 3,560.9 r 244.7 r 47.3 r 197.4 rQ2 1,873.5 809.5 160.1 291.6 63.7 114.8 3,313.4 -5.2 62.7 -67.9
NET
OPERATING
BALANCE or
TOTAL REVENUE AND GRANTS
NET ACQUISITI
ON OF NON-
FINANCIAL ASSETS
FISCAL DEFICIT/ SURPLU
S Compen. of employees
Uses of G&S Interest Grants S.Benefits Other Exp
TOTAL
EXPENSES

QUARTERLY ECONOMIC REVIEW JUNE 2013
71
TABLE 24: GOVERNMENT OPERATIONS FUNDED BY DONORS THROUGH THE CENTRAL TREASURY
(Millions of Vatu)
Grants Other
revenue TOTAL
REVENUECompen. of employees
Uses of G&S Grants S.Benefits Other ExpTOTAL
EXPENSESNET OPERATING
BALANCE
NET ACQUISITION
OF NON-FINANCIAL
ASSETS
FISCAL DEFICIT
2010 4,431.4 0.0 4,431.4 304.8 1,353.9 394.8 5.5 11.0 2,069.9 2,361.5 2,863.7 -502.22011 2,883.1 0.0 2,883.1 218.8 1,582.6 289.1 0.3 10.4 2,101.2 781.9 854.5 -72.7
2012 2,174.1 0.0 2,174.1 247.1 1,215.4 430.0 1.8 14.3 1,908.5 265.6 825.5 -559.9
2010 Q1 1,174.0 0.0 1,174.0 39.3 219.7 218.7 0.0 0.0 477.7 696.3 569.3 126.9
Q2 1,769.8 0.0 1,769.8 100.7 327.8 10.8 5.5 1.0 445.8 1,324.0 720.3 603.8Q3 952.2 0.0 952.2 61.9 314.7 203.3 0.0 3.9 583.8 368.5 647.8 -279.3
Q4 535.4 0.0 535.4 102.9 491.6 -38.0 0.0 6.1 562.6 -27.2 926.4 -953.6
2011 Q1 1,598.1 0.0 1,598.1 51.0 280.6 137.1 0.3 0.9 469.9 1,128.3 61.1 1,067.2
Q2 710.6 0.0 710.6 50.0 308.8 28.6 0.0 0.9 388.4 322.2 30.3 291.9Q3 333.2 0.0 333.2 63.6 627.2 14.7 0.0 6.5 712.0 -378.8 233.2 -612.0
Q4 241.1 0.0 241.1 54.2 366.0 108.7 0.0 2.0 530.9 -289.8 529.9 -819.7
2012 Q1 743.5 0.0 743.5 64.4 228.5 94.2 1.4 7.2 395.7 347.7 265.4 82.3Q2 1,004.2 0.0 1,004.2 55.3 233.6 45.6 0.4 2.2 337.2 667.0 158.4 508.6Q3 186.3 0.0 186.3 61.5 272.3 206.2 0.0 5.8 545.7 -359.4 206.2 -565.7
Q4 240.2 0.0 240.2 65.9 480.9 84.0 0.0 -0.9 629.9 -389.7 195.4 -585.1
2013 Q1 269.4 r 0.0 269.4 r 47.7 r 216.1 37.8 -0.1 18.0 319.5 r -50.1 r 135.4 r -185.5 rQ2 852.7 0.0 852.7 88.5 355.7 (4.4) 19.8 1.6 461.1 391.6 94.0 297.6
TOTAL REVENUE AND GRANTS TOTAL EXPENSES

QUARTERLY ECONOMIC REVIEW JUNE 2013
72
TABLE 25: VANUATU GOVERNMENT OUTSTANDING BONDS
(Millions of Vatu)
BOND HOLDERS
Period
Ended Reserve Bank Commercial (1). Public Others Total
of Vanuatu Banks Corporation Outstanding
2008 Q1 394.0 582.4 2,000.0 6.9 2,983.2
Q2 394.0 482.4 2,099.8 6.9 2,983.0
Q3 394.0 482.4 2,099.8 6.9 2,983.0
Q4 394.0 482.4 1,699.8 5.0 2,581.1
2009 Q1 394.0 436.7 1,647.4 5.0 2,483.0
Q2 394.0 441.5 1,647.4 1.9 2,484.7
Q3 394.0 441.5 1,647.4 1.9 2,484.7
Q4 394.0 441.5 1,647.4 1.9 2,484.7
2010 Q1 394.5 589.0 1,499.8 1.5 2,484.7
Q2 394.7 688.7 1,400.0 1.4 2,484.7
Q3 1,193.7 688.7 1,300.0 2.4 3,184.7
Q4 1,193.7 788.3 1,300.0 2.7 3,284.7
2011 Q1 1,143.7 788.3 1,348.9 3.8 3,284.7
Q2 1,292.7 988.3 1,748.9 4.9 4,034.8
Q3 1,292.7 1,088.3 1,748.9 5.0 4,134.9
Q4 1,293.8 1,186.6 1,748.9 5.6 4,234.9
2012 Q1 1,293.8 1,085.0 2,198.9 10.6 4,588.3
Q2 1,293.8 1,085.0 2,898.9 11.5 5,289.2
Q3 1,293.8 1,085.0 2,999.1 19.4 5,397.2
Q4 1,293.8 787.0 3,499.1 43.6 5,623.5
2013 Q1 1,293.8 787.0 3,499.1 43.6 5,623.5
Q2 1,293.9 787.0 3,399.1 43.5 5,523.5

QUARTERLY ECONOMIC REVIEW JUNE 2013
73
TABLE 26: EXCHANGE RATES
Period
(Yr/Mth) Australian US NZ ECU / Euro Australian US
Dollar Dollar Dollar Dollar Dollar2009 87.58 97.93 70.70 140.39 83.13 105.912010 94.72 93.15 71.84 123.75 90.87 97.162011 94.91 93.56 72.17 121.99 91.66 94.612012 95.10 91.73 75.18 121.19 95.36 92.64
2009 J 77.59 118.03 60.58 152.87 78.00 115.00F 77.21 119.10 60.61 151.69 77.08 118.78M 78.12 114.76 64.59 151.58 77.70 116.89A 80.96 111.58 63.17 147.96 80.17 112.28M 83.06 105.87 65.98 147.59 82.41 107.99J 83.85 103.88 67.50 146.25 83.72 104.54J 84.94 102.91 67.09 144.84 83.69 104.25A 85.21 101.14 69.22 144.72 84.95 101.74S 86.13 98.91 70.68 144.30 85.75 99.58O 88.16 96.27 70.59 142.85 87.62 96.52N 88.13 96.55 69.12 145.01 88.51 95.95D 87.58 97.93 70.70 140.39 87.91 97.40
2010 J 88.19 98.65 69.49 137.77 88.61 96.99F 88.47 99.55 68.85 134.97 88.03 99.45M 90.06 98.05 69.60 131.55 98.25 89.63A 90.53 97.62 70.64 129.11 90.51 97.61M 87.33 103.35 69.95 126.79 88.27 101.34J 87.38 102.96 71.25 125.50 87.61 102.74J 88.66 99.50 71.82 129.29 88.02 100.78A 82.29 100.15 70.62 126.62 89.39 99.25S 92.25 93.23 70.23 129.75 91.12 97.41O 92.23 94.21 71.01 131.28 92.49 94.17N 92.26 95.77 71.53 125.65 93.65 92.85D 94.72 93.15 71.84 123.75 94.52 93.70
2011 J 92.89 93.88 72.30 127.69 93.99 93.64F 94.49 93.09 69.80 128.07 93.31 93.96M 94.88 91.89 70.02 129.82 93.15 94.13A 96.73 88.52 71.04 131.23 90.43 95.40M 95.80 89.64 73.16 128.02 90.06 95.96J 95.45 89.39 73.77 129.04 89.83 95.27J 96.54 87.72 76.41 125.73 88.95 95.74A 95.06 88.93 75.91 128.49 89.77 94.53S 92.24 94.32 72.69 128.22 91.67 93.99O 96.00 89.60 73.51 126.80 92.40 93.94N 94.05 93.77 71.48 124.99 92.95 94.18D 94.91 93.56 72.17 121.29 93.45 94.59
2012 J 96.43 90.99 74.50 119.44 95.91 92.24F 96.73 89.75 75.21 120.88 96.76 94.64M 95.13 91.61 74.90 121.86 96.01 91.10A 95.54 91.32 75.12 120.89 95.10 91.81M 93.35 96.16 72.44 118.95 94.09 94.29J 94.59 94.23 74.22 117.24 94.25 94.54J 96.95 92.32 74.69 113.20 95.91 93.24A 95.74 93.03 74.27 116.37 96.66 92.27S 95.61 91.56 76.13 118.26 93.48 92.02O 95.30 91.96 75.51 119.20 94.94 92.25N 95.65 91.66 75.45 118.95 95.66 91.99D 95.10 91.73 75.18 121.19 95.57 91.26
2013 J 94.74 90.97 76.05 123.41 95.47 90.90F 94.55 92.41 76.40 121.47 94.47 91.54M 95.79 91.74 76.78 117.25 95.25 92.13A 94.77 91.59 78.35 119.97 95.12 91.65M 91.78 95.00 76.70 123.96 88.42 93.86J 90.00 97.02 75.65 126.50 90.68 96.01
EXCHANGE RATES: VATU PER UNIT OF FOREIGN CURRENCIES
End of Period Rates Averages
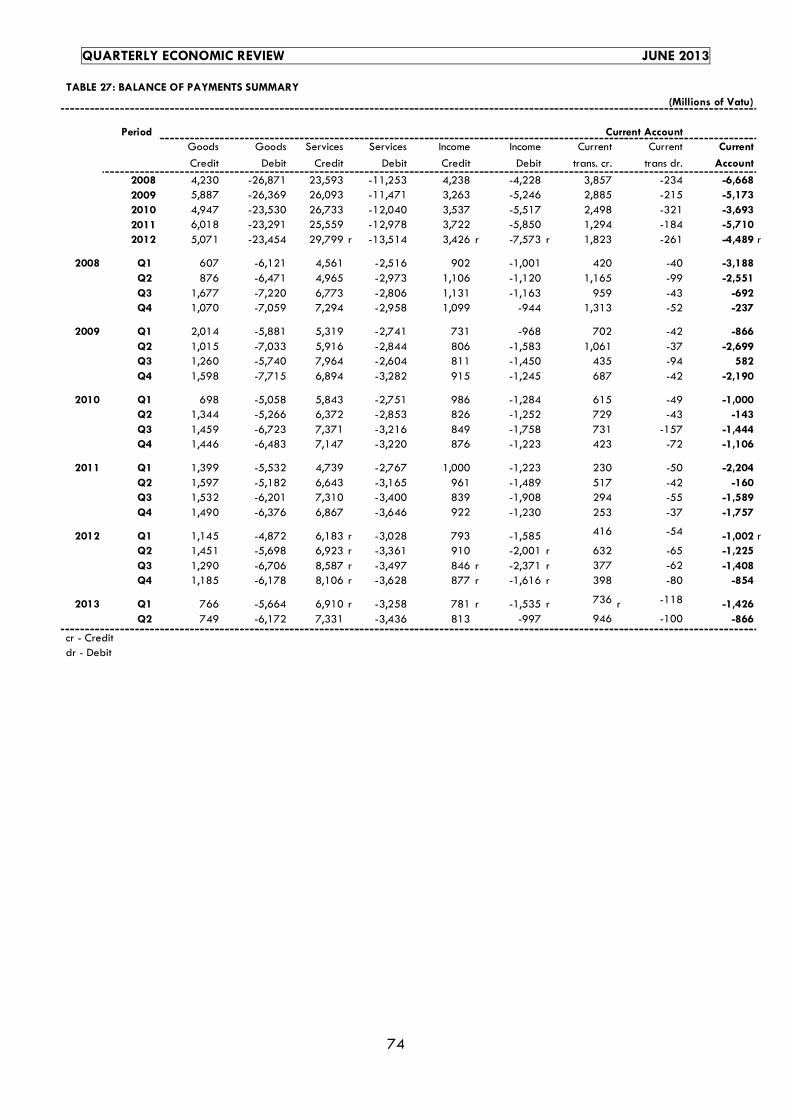
QUARTERLY ECONOMIC REVIEW JUNE 2013
74
TABLE 27: BALANCE OF PAYMENTS SUMMARY(Millions of Vatu)
PeriodGoods Goods Services Services Income Income Current Current Current
Credit Debit Credit Debit Credit Debit trans. cr. trans dr. Account
2008 4,230 -26,871 23,593 -11,253 4,238 -4,228 3,857 -234 -6,668
2009 5,887 -26,369 26,093 -11,471 3,263 -5,246 2,885 -215 -5,173
2010 4,947 -23,530 26,733 -12,040 3,537 -5,517 2,498 -321 -3,693
2011 6,018 -23,291 25,559 -12,978 3,722 -5,850 1,294 -184 -5,710
2012 5,071 -23,454 29,799 r -13,514 3,426 r -7,573 r 1,823 -261 -4,489 r
2008 Q1 607 -6,121 4,561 -2,516 902 -1,001 420 -40 -3,188
Q2 876 -6,471 4,965 -2,973 1,106 -1,120 1,165 -99 -2,551
Q3 1,677 -7,220 6,773 -2,806 1,131 -1,163 959 -43 -692Q4 1,070 -7,059 7,294 -2,958 1,099 -944 1,313 -52 -237
2009 Q1 2,014 -5,881 5,319 -2,741 731 -968 702 -42 -866
Q2 1,015 -7,033 5,916 -2,844 806 -1,583 1,061 -37 -2,699Q3 1,260 -5,740 7,964 -2,604 811 -1,450 435 -94 582
Q4 1,598 -7,715 6,894 -3,282 915 -1,245 687 -42 -2,190
2010 Q1 698 -5,058 5,843 -2,751 986 -1,284 615 -49 -1,000Q2 1,344 -5,266 6,372 -2,853 826 -1,252 729 -43 -143
Q3 1,459 -6,723 7,371 -3,216 849 -1,758 731 -157 -1,444Q4 1,446 -6,483 7,147 -3,220 876 -1,223 423 -72 -1,106
2011 Q1 1,399 -5,532 4,739 -2,767 1,000 -1,223 230 -50 -2,204
Q2 1,597 -5,182 6,643 -3,165 961 -1,489 517 -42 -160Q3 1,532 -6,201 7,310 -3,400 839 -1,908 294 -55 -1,589
Q4 1,490 -6,376 6,867 -3,646 922 -1,230 253 -37 -1,757
2012 Q1 1,145 -4,872 6,183 r -3,028 793 -1,585 416 -54 -1,002 rQ2 1,451 -5,698 6,923 r -3,361 910 -2,001 r 632 -65 -1,225
Q3 1,290 -6,706 8,587 r -3,497 846 r -2,371 r 377 -62 -1,408Q4 1,185 -6,178 8,106 r -3,628 877 r -1,616 r 398 -80 -854
2013 Q1 766 -5,664 6,910 r -3,258 781 r -1,535 r 736 r -118 -1,426
Q2 749 -6,172 7,331 -3,436 813 -997 946 -100 -866`cr - Credit
dr - Debit
Current Account
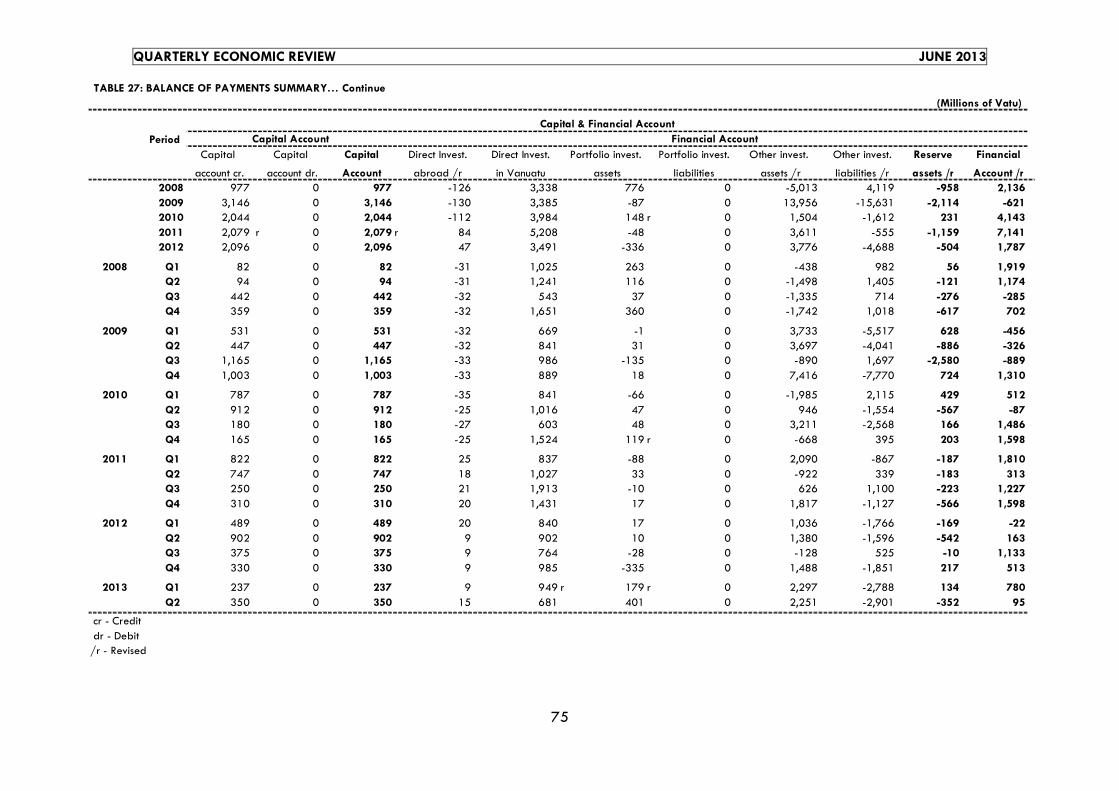
QUARTERLY ECONOMIC REVIEW JUNE 2013
75
TABLE 27: BALANCE OF PAYMENTS SUMMARY… Continue
(Millions of Vatu)
Period
Capital Capital Capital Direct Invest. Direct Invest. Portfolio invest. Portfolio invest. Other invest. Other invest. Reserve Financial
account cr. account dr. Account abroad /r in Vanuatu assets liabilities assets /r liabilities /r assets /r Account /r2008 977 0 977 -126 3,338 776 0 -5,013 4,119 -958 2,136
2009 3,146 0 3,146 -130 3,385 -87 0 13,956 -15,631 -2,114 -6212010 2,044 0 2,044 -112 3,984 148 r 0 1,504 -1,612 231 4,143
2011 2,079 r 0 2,079 r 84 5,208 -48 0 3,611 -555 -1,159 7,1412012 2,096 0 2,096 47 3,491 -336 0 3,776 -4,688 -504 1,787
2008 Q1 82 0 82 -31 1,025 263 0 -438 982 56 1,919Q2 94 0 94 -31 1,241 116 0 -1,498 1,405 -121 1,174
Q3 442 0 442 -32 543 37 0 -1,335 714 -276 -285Q4 359 0 359 -32 1,651 360 0 -1,742 1,018 -617 702
2009 Q1 531 0 531 -32 669 -1 0 3,733 -5,517 628 -456Q2 447 0 447 -32 841 31 0 3,697 -4,041 -886 -326Q3 1,165 0 1,165 -33 986 -135 0 -890 1,697 -2,580 -889
Q4 1,003 0 1,003 -33 889 18 0 7,416 -7,770 724 1,310
2010 Q1 787 0 787 -35 841 -66 0 -1,985 2,115 429 512
Q2 912 0 912 -25 1,016 47 0 946 -1,554 -567 -87Q3 180 0 180 -27 603 48 0 3,211 -2,568 166 1,486
Q4 165 0 165 -25 1,524 119 r 0 -668 395 203 1,598
2011 Q1 822 0 822 25 837 -88 0 2,090 -867 -187 1,810
Q2 747 0 747 18 1,027 33 0 -922 339 -183 313Q3 250 0 250 21 1,913 -10 0 626 1,100 -223 1,227
Q4 310 0 310 20 1,431 17 0 1,817 -1,127 -566 1,598
2012 Q1 489 0 489 20 840 17 0 1,036 -1,766 -169 -22
Q2 902 0 902 9 902 10 0 1,380 -1,596 -542 163Q3 375 0 375 9 764 -28 0 -128 525 -10 1,133
Q4 330 0 330 9 985 -335 0 1,488 -1,851 217 513
2013 Q1 237 0 237 9 949 r 179 r 0 2,297 -2,788 134 780
Q2 350 0 350 15 681 401 0 2,251 -2,901 -352 95
cr - Creditdr - Debit/r - Revised
Capital & Financial Account
Capital Account Financial Account
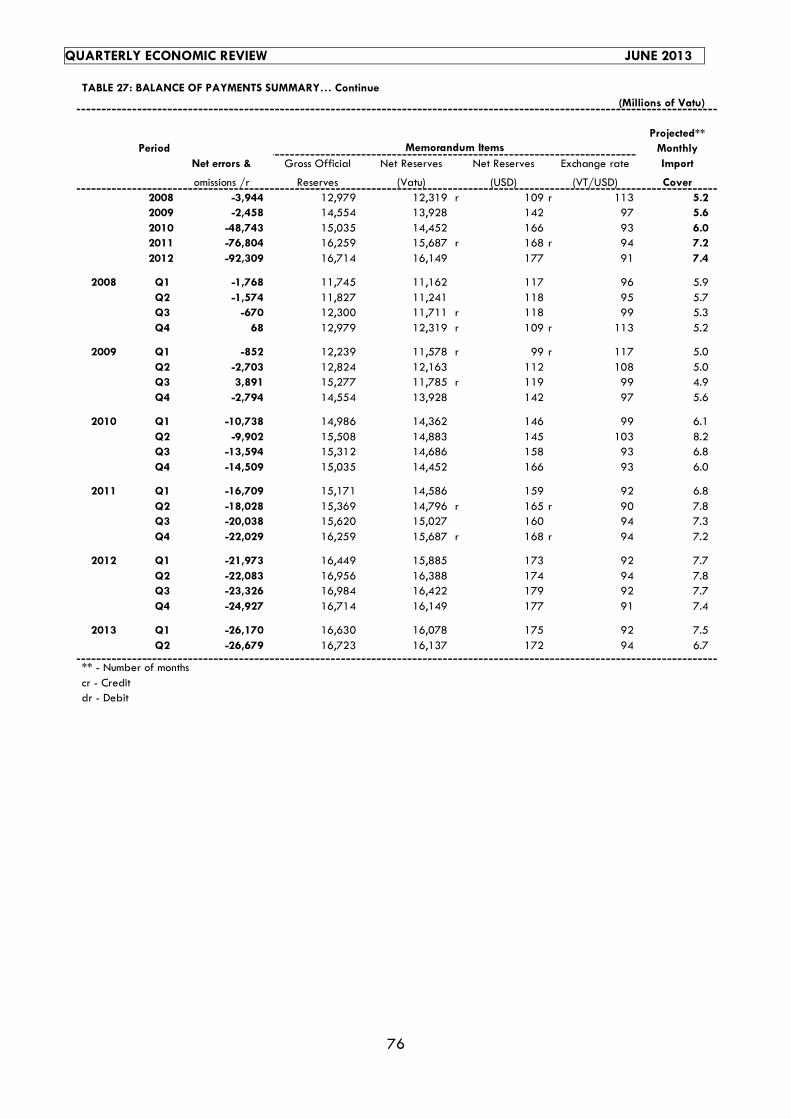
QUARTERLY ECONOMIC REVIEW JUNE 2013
76
TABLE 27: BALANCE OF PAYMENTS SUMMARY… Continue(Millions of Vatu)
Projected**Period Monthly
Net errors & Gross Official Net Reserves Net Reserves Exchange rate Import
omissions /r Reserves (Vatu) (USD) (VT/USD) Cover
2008 -3,944 12,979 12,319 r 109 r 113 5.22009 -2,458 14,554 13,928 142 97 5.6
2010 -48,743 15,035 14,452 166 93 6.02011 -76,804 16,259 15,687 r 168 r 94 7.2
2012 -92,309 16,714 16,149 177 91 7.4
2008 Q1 -1,768 11,745 11,162 117 96 5.9Q2 -1,574 11,827 11,241 118 95 5.7Q3 -670 12,300 11,711 r 118 99 5.3Q4 68 12,979 12,319 r 109 r 113 5.2
2009 Q1 -852 12,239 11,578 r 99 r 117 5.0Q2 -2,703 12,824 12,163 112 108 5.0Q3 3,891 15,277 11,785 r 119 99 4.9Q4 -2,794 14,554 13,928 142 97 5.6
2010 Q1 -10,738 14,986 14,362 146 99 6.1Q2 -9,902 15,508 14,883 145 103 8.2Q3 -13,594 15,312 14,686 158 93 6.8Q4 -14,509 15,035 14,452 166 93 6.0
2011 Q1 -16,709 15,171 14,586 159 92 6.8Q2 -18,028 15,369 14,796 r 165 r 90 7.8Q3 -20,038 15,620 15,027 160 94 7.3Q4 -22,029 16,259 15,687 r 168 r 94 7.2
2012 Q1 -21,973 16,449 15,885 173 92 7.7Q2 -22,083 16,956 16,388 174 94 7.8Q3 -23,326 16,984 16,422 179 92 7.7Q4 -24,927 16,714 16,149 177 91 7.4
2013 Q1 -26,170 16,630 16,078 175 92 7.5Q2 -26,679 16,723 16,137 172 94 6.7
** - Number of monthscr - Creditdr - Debit
Memorandum Items

QUARTERLY ECONOMIC REVIEW JUNE 2013
77
TABLE 28: INTERNATIONAL INVESTMENT POSITION(Millions of Vatu)
Period Net Direct Portfolio Other Reserves Assets Direct Portfolio Other Liabilities Position
Investment / r Investment Investment / r Investment / r Investment Investment / r / r / r2008 1,855 2,220 48,115 12,979 64,944 37,340 1 39,788 77,129 -12,1852009 1,984 2,155 34,132 14,554 52,825 40,440 1 24,499 64,940 -12,115
2010 2,098 2,303 r 51,073 15,035 70,509 44,251 1 40,766 85,018 -14,5092011 2,184 2,255 47,423 16,259 68,121 49,319 1 40,830 90,150 -22,029
2012 2,231 1,915 43,526 16,714 r 64,386 52,753 1 36,559 89,313 -24,927
2008 Q1 1,763 1,962 42,914 11,745 58,384 33,821 1 39,575 73,397 -15,013
Q2 1,793 2,077 44,356 11,827 60,053 34,788 1 41,061 75,850 -15,797Q3 1,824 2,113 45,697 12,300 61,934 35,912 1 39,008 74,921 -12,987Q4 1,855 2,220 48,115 12,979 65,169 37,340 1 39,788 77,129 -11,960
2009 Q1 1,886 2,246 44,473 12,239 60,844 37,926 1 34,300 72,227 -11,383
Q2 1,918 2,277 40,195 12,824 57,214 38,665 1 30,315 68,981 -11,767Q3 1,951 2,137 41,128 15,277 60,493 39,593 1 32,245 71,839 -11,346Q4 1,984 2,155 34,132 14,554 52,825 40,440 1 24,499 64,940 -12,115
2010 Q1 2,019 2,089 54,540 14,986 73,634 41,243 1 43,128 84,372 -10,738Q2 2,044 2,136 53,516 15,508 73,204 42,201 1 40,903 83,105 -9,901
Q3 2,071 2,184 r 50,390 15,312 69,957 42,780 1 40,771 83,552 -13,595Q4 2,098 2,303 r 51,073 15,035 70,509 44,251 1 40,766 85,018 -14,509
2011 Q1 2,125 2,215 49,045 15,171 68,556 45,041 1 40,224 85,266 -16,710Q2 2,143 2,248 49,901 15,369 69,661 46,030 1 41,659 87,690 -18,029
Q3 2,164 2,238 49,230 15,620 69,252 47,913 1 41,376 89,290 -20,038Q4 2,184 2,255 47,423 16,259 68,121 49,319 1 40,830 90,150 -22,029
2012 Q1 2,204 2,272 46,308 16,449 r 67,233 50,139 1 39,066 89,206 -21,973Q2 2,213 2,282 44,936 16,956 r 66,387 51,026 1 37,444 88,471 -22,083
Q3 2,222 2,233 45,010 16,984 r 66,449 51,778 1 37,997 89,776 -23,327Q4 2,231 1,915 43,526 16,714 r 64,386 52,753 1 36,559 89,313 -24,927
2013 Q1 2,240 1,172 r 41,229 16,630 r 61,271 53,694 1 33,746 87,441 -26,170Q2 2,255 651 38,978 16,723 58,607 54,378 1 30,907 85,286 -26,679
** - Number of monthscr - Credit
International Investment Position Assets Liabilities

QUARTERLY ECONOMIC REVIEW JUNE 2013
78
TABLE 29: VALUE OF EXPORTS
(Millions of Vatu)
Period Other
Domestic Other Re-exports TotalValue Tonnes Value Tonnes Value Tonnes Value Tonnes Value Tonnes Value Tonnes Products
2008 1,194 21,380 251 1,132 475 1,023 167 19 616 438 828 16,545 92 1,210 577 4,368
2009 569 15,107 343 1,480 399 904 47 17 616 477 272 5,315 286 1,562 2,031 6,125
2010 579 12,133 383 1,802 494 1,123 26 - 508 498 934 10,325 645 921 214 4,705
2011 1,066 13,595 246 1,068 517 1,106 64 - 746 735 1,591 12,001 884 898 - 6,012
2012 1,087 16,846 258 1,414 518 1,031 41 - 660 643 1,162 10,011 641 705 - 5,072
2008 Q1 199 4,211 19 106 95 245 12 4 172 123 217 3,756 10 261 218 607
Q2 156 2,627 40 208 97 217 10 4 141 102 180 4,573 15 192 204 876
Q3 723 12,116 135 553 145 304 90 6 164 121 250 5,052 22 319 116 1,677
Q4 116 2,426 57 265 138 257 55 5 139 92 181 3,164 45 438 39 1,208
2009 Q1 237 4,304 22 94 105 227 8 7 131 97 - - 82 498 1,101 2,184
Q2 50 1,814 132 575 75 167 9 6 174 119 7 119 59 387 219 1,112
Q3 156 5,014 128 553 116 261 19 4 168 136 129 2,911 56 226 233 1,231
Q4 126 3,975 61 258 104 249 11 - 143 125 135 2,286 89 451 478 1,598
2010 Q1 36 1,067 15 60 96 214 14 - 81 69 - - 114 221 121 700
Q2 91 2,042 186 929 117 279 6 - 332 335 199 2,579 185 194 35 1,116
Q3 148 3,419 100 438 151 341 5 - 160 154 349 3,943 209 280 58 1,460
Q4 304 5,605 82 375 130 289 1 - 163 160 386 3,803 137 226 - 1,429
2011 Q1 306 3,768 6 25 136 300 3 - 95 94 432 3,461 310 115 - 1,403
Q2 386 4,526 104 446 128 271 31 - 179 186 292 1,957 259 206 - 1,585
Q3 205 3,032 88 380 132 290 - - 238 225 302 2,299 185 384 - 1,534
Q4 169 2,269 48 217 121 245 30 - 234 230 565 4,284 129 193 - 1,489
2012 Q1 434 6,188 10 40 123 236 8 - 97 99 208 1,674 131 134 - 1,145
Q2 298 5,098 70 381 135 284 20 - 189 184 317 2,696 184 238 - 1,451
Q3 253 3,791 97 539 120 240 5 - 195 187 280 2,423 202 139 - 1,290
Q4 102 1,769 81 454 140 271 8 - 179 173 357 3,218 125 194 - 1,186
2013 Q1 143 4,022 23 136 89 205 15 - 168 158 90 838 154 82 - 764
Q2 83 2,438 98 491 73 142 10 - 223 223 95 1,689 110 57 - 749
Source: National Statistics Office
Principal Exports
Copra Cocoa Beef Timber Kava Coconut Oil

QUARTERLY ECONOMIC REVIEW JUNE 2013
79
TABLE 30: VALUE OF IMPORTS
(Millions of Vatu)Period Imports for home consumption
Food and live animals
Bev. And tobacco
Mineral fuels
Chemicals Misc. TotalImports for Re-exports
Total Imports (c.i.f)
2008 4,782 621 428 4,237 169 2,690 4,339 9,532 2,643 617 30,056 197 30,253 2009 4,840 1,016 319 3,755 107 3,310 4,284 7,814 3,165 781 27,013 683 27,696 2010 5,108 1,023 419 3,618 134 2,923 3,818 7,252 2,736 361 27,392 120 27,512 2011 5,537 1,038 377 4,835 129 2,856 3,567 5,543 2,819 361 27,063 193 27,256
2012 5,308 1,152 433 4,621 141 2,810 3,589 5,964 2,576 314 26,908 547 27,453
2008 Q1 1,046 125 79 901 35 616 976 2,088 583 260 6,708 22 6,730 Q2 1,180 162 105 899 44 737 1,040 2,448 645 63 7,322 66 7,388 Q3 1,352 130 128 1,123 44 694 1,118 2,391 667 211 7,858 43 7,901 Q4 1,204 204 116 1,314 46 643 1,205 2,605 748 83 8,168 66 8,234
2009 Q1 996 92 52 158 31 729 828 1,997 782 62 5,726 7 5,733 Q2 1,237 103 85 210 16 700 1,077 1,431 719 201 5,779 402 6,181 Q3 1,221 163 102 682 20 947 964 1,709 626 94 6,527 213 6,740 Q4 1,383 317 80 1,490 40 864 1,403 2,040 940 424 8,981 61 9,042
2010 Q1 1,028 233 91 562 25 661 845 1,889 469 66 5,869 22 5,891 Q2 950 170 93 1,205 32 680 808 1,543 522 84 6,087 38 6,125 Q3 1,516 239 128 1,122 27 765 1,166 2,019 773 111 7,866 30 7,896 Q4 1,614 381 107 729 50 817 999 1,801 972 100 7,570 30 7,600
2011 Q1 1,044 216 77 1,208 22 750 935 1,527 582 49 6,409 54 6,464 Q2 1,343 239 74 866 29 729 822 1,134 705 98 6,040 13 6,053 Q3 1,551 297 123 1,266 35 699 946 1,468 773 80 7,239 29 7,267 Q4 1,599 286 103 1,495 43 678 864 1,414 759 134 7,375 97 7,472
2012 Q1 1,103 303 79 855 41 630 736 1,243 494 86 5,571 110 5,681 Q2 1,059 225 90 1,442 20 647 804 1,585 607 74 6,553 110 6,663 Q3 1,552 257 128 1,471 44 675 1,087 1,615 684 75 7,588 279 7,867 Q4 1,594 367 136 853 36 858 962 1,521 791 79 7,196 48 7,244
2013 Q1 1,394 236 88 1,204 24 548 1,006 1,332 657 100 6,587 35 6,622 Q2 1,349 315 154 1,504 29 689 879 1,457 731 80 7,187 38 7,225
Source: National Statistics Office
Crude mtrls, excl.fuels
Animal, veg., and oil fats
Basic manufact.
Mach. and
transpt. equip.
Goods not specified
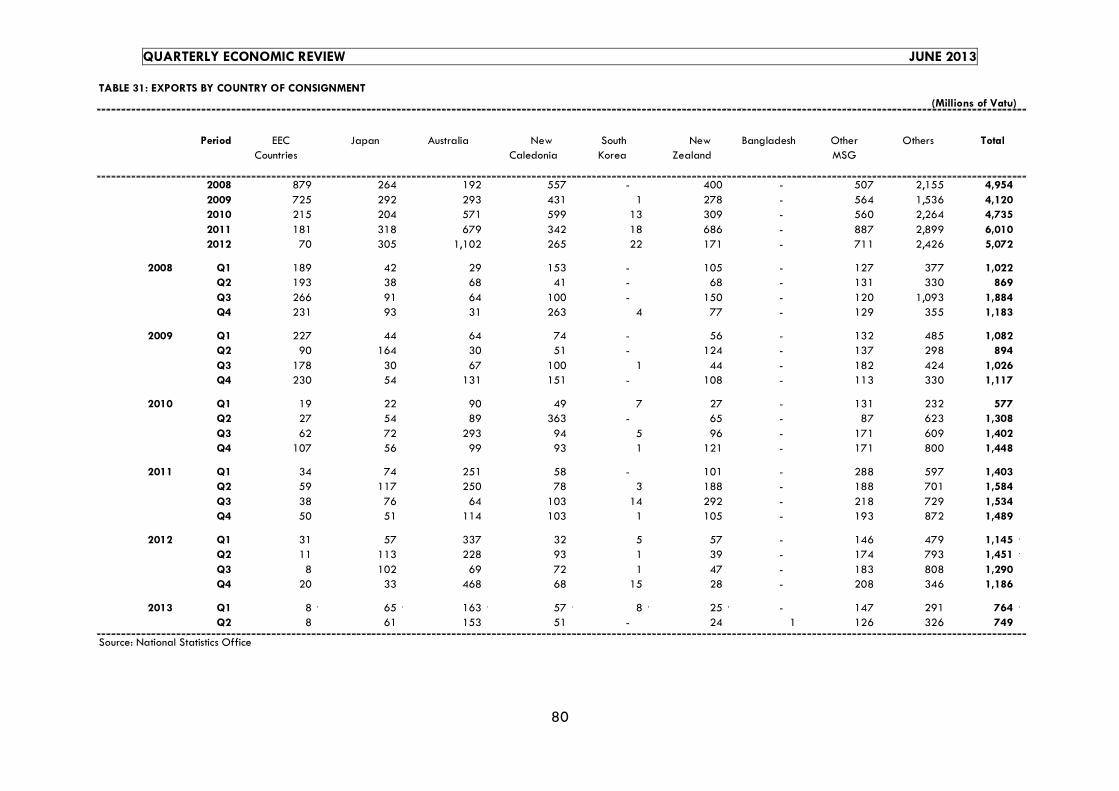
QUARTERLY ECONOMIC REVIEW JUNE 2013
80
TABLE 31: EXPORTS BY COUNTRY OF CONSIGNMENT
(Millions of Vatu)
Period EEC Japan Australia New South New Bangladesh Other Others TotalCountries Caledonia Korea Zealand MSG
2008 879 264 192 557 - 400 - 507 2,155 4,954
2009 725 292 293 431 1 278 - 564 1,536 4,120 2010 215 204 571 599 13 309 - 560 2,264 4,735
2011 181 318 679 342 18 686 - 887 2,899 6,010 2012 70 305 1,102 265 22 171 - 711 2,426 5,072
2008 Q1 189 42 29 153 - 105 - 127 377 1,022 Q2 193 38 68 41 - 68 - 131 330 869
Q3 266 91 64 100 - 150 - 120 1,093 1,884 Q4 231 93 31 263 4 77 - 129 355 1,183
2009 Q1 227 44 64 74 - 56 - 132 485 1,082 Q2 90 164 30 51 - 124 - 137 298 894
Q3 178 30 67 100 1 44 - 182 424 1,026 Q4 230 54 131 151 - 108 - 113 330 1,117
2010 Q1 19 22 90 49 7 27 - 131 232 577 Q2 27 54 89 363 - 65 - 87 623 1,308
Q3 62 72 293 94 5 96 - 171 609 1,402 Q4 107 56 99 93 1 121 - 171 800 1,448
2011 Q1 34 74 251 58 - 101 - 288 597 1,403 Q2 59 117 250 78 3 188 - 188 701 1,584
Q3 38 76 64 103 14 292 - 218 729 1,534 Q4 50 51 114 103 1 105 - 193 872 1,489
2012 Q1 31 57 337 32 5 57 - 146 479 1,145 rQ2 11 113 228 93 1 39 - 174 793 1,451 rQ3 8 102 69 72 1 47 - 183 808 1,290 Q4 20 33 468 68 15 28 - 208 346 1,186
2013 Q1 8 r 65 r 163 r 57 r 8 r 25 r - 147 r 291 r 764 rQ2 8 61 153 51 - 24 1 126 326 749
Source: National Statistics Office

QUARTERLY ECONOMIC REVIEW JUNE 2013
81
TABLE 32: IMPORTS BY COUNTRY OF CONSIGNMENT
(Millions of Vatu)
Period New NewAustralia Zealand Japan France Fiji Caledonia Hong Kong Singapore Others Total
2008 8,255 4,076 1,715 1,448 2,741 476 655 3,514 7,176 30,056 2009 8,390 3,969 1,229 716 2,390 298 302 1,985 7,755 27,034
2010 8,540 3,725 1,007 661 2,138 631 290 3,456 6,940 27,388 2011 8,092 3,103 696 875 1,686 471 1,245 4,927 5,965 27,060
2012 8,292 3,139 544 786 1,583 489 1,348 4,860 5,866 26,908
2008 Q1 2,044 969 217 702 489 149 24 758 1,356 6,708 Q2 2,155 796 433 331 649 120 423 728 1,688 7,323 Q3 2,075 1,368 328 266 806 111 55 896 1,953 7,858
Q4 1,981 943 737 149 797 96 153 1,132 2,179 8,167
2009 Q1 1,689 612 53 168 608 72 68 111 2,343 5,724 Q2 2,140 938 307 154 352 74 75 122 1,616 5,778
Q3 2,228 983 140 166 689 81 66 495 1,703 6,551 Q4 2,333 1,436 729 228 741 71 93 1,257 2,093 8,981
2010 Q1 1,683 936 347 125 610 109 45 387 1,625 5,867 Q2 1,727 885 161 190 512 92 30 1,146 1,343 6,086
Q3 2,537 952 193 194 537 255 124 1,117 1,956 7,865 Q4 2,593 952 306 152 479 175 91 806 2,016 7,570
2011 Q1 1,798 849 192 248 476 122 125 1,182 1,417 6,409 Q2 1,925 792 204 263 557 86 58 843 1,311 6,039
Q3 2,234 869 170 240 498 136 91 1,296 1,704 7,238 Q4 2,135 593 130 124 155 127 971 1,606 1,533 7,374
2012 Q1 1,757 663 115 225 447 168 88 818 1,289 5,571 Q2 1,946 787 108 175 466 68 132 1,424 1,446 6,553
Q3 2,081 695 113 223 187 125 980 1,750 1,434 7,588 Q4 2,508 994 208 163 483 128 148 868 1,697 7,196
2013 Q1 1,804 739 330 180 652 66 96 1,192 1,527 6,587
Q2 1,991 934 165 275 644 78 177 1,460 1,463 7,186
Source: National Statistics Office

QUARTERLY ECONOMIC REVIEW JUNE 2013
82
TABLE 33 COMPANY REGISTRATION IN VANUATU
Part A: Number of Companies on the Registry at end of each Year/Quarter PART B: Company Registration during individual Year/Quarter
End of Type of company Of Which Hold Licenses as: 1. Number of Fresh Registrations 2. Number
Period International Exempt Exempt Insurance Trust Local Overseas Exempt International Total of
Local Exempt Overseas Companies Total Banks Financial Companies Companies Companies Companies Companies of Companies Struck off
Institutions which: Banks2008 1,820 95 38 2,124 4,077 7 1 26 15 46 0 0 56 102 7002009 1,932 86 38 2,238 4,294 7 1 28 15 52 0 0 32 84 252010 1,668 72 35 1,713 3,488 7 2 28 15 39 0 0 29 68 8442011 1,818 69 36 1,898 3,821 7 2 2 15 38 0 0 47 85 na2012 1,937 0 37 2,395 4,369 7 2 31 12 33 0 0 614 647 na
2008 Q1 1,731 105 37 2,715 4,588 7 1 27 18 72 3 1 75 151 52Q2 1,792 104 38 2,784 4,718 7 2 11 12 61 0 1 62 124 7Q3 1,783 97 40 2,801 4,721 7 2 11 15 29 2 0 77 108 54Q4 1,820 95 38 2,124 4,077 7 1 26 15 46 0 0 56 102 700
2009 Q1 1,866 94 38 2,147 4,145 7 1 37 15 33 0 0 43 76 35Q2 1,876 94 38 2,210 4,218 20 1 67 18 24 0 0 32 56 26Q3 1,904 89 38 2,226 4,257 7 1 28 15 57 0 0 40 97 67Q4 1,932 86 38 2,238 4,294 7 1 28 15 52 0 0 32 84 25
2010 Q1 1,829 65 32 2,155 4,081 7 2 28 15 31 0 0 32 63 23Q2 1,885 84 37 2,207 4,212 10 1 38 16 41 0 0 34 75 35Q3 1,489 53 29 1,634 3,205 7 2 28 15 41 0 0 45 87 131Q4 1,668 72 35 1,713 3,488 7 2 28 15 39 0 0 29 68 844
2011 Q1 1,676 61 33 1,696 3,465 7 2 28 15 37 0 0 57 93 naQ2 1,683 49 30 1,679 3,441 7 2 28 15 34 0 0 84 118 naQ3 1,781 49 30 1,679 3,539 7 2 28 15 30 1 0 63 94 naQ4 1,818 69 36 1,898 3,821 7 2 2 15 38 0 0 47 85 na
2012 Q1 1,775 81 35 2,178 4,070 7 2 30 16 43 1 0 52 96 naQ2 1,809 83 36 2,220 4,147 7 2 36 15 40 0 0 59 99 naQ3 1,955 71 38 2,571 4,635 7 2 28 15 42 1 0 666 709 naQ4 1,937 0 37 2,395 4,369 7 2 31 12 33 0 0 614 647 na
2013 Q1 1,996 0 37 3,186 5,219 7 2 0 12 26 0 0 310 336 naQ2 2,042 0 33 3,706 5,781 7 2 0 13 66 0 0 503 569 na

QUARTERLY ECONOMIC REVIEW JUNE 2013
83
TABLE 34: FINANCE CENTRE INSTITUTIONS: LOCAL EXPENDITURE BY NATURE OF FINANCE CENTER INSTITUTIONS (Millions of Vatu) (Number)
RECURRENT EXPENDITURE TAXES AND LEVIES TOTAL LOCAL EMPLOYMENTINSTITUTIONS Total Local Total Rent Interest Total Other Central Import Local CAPITAL VALUE OF Expat. Ni-Van. TOTAL
Expenditure Wages & (3+4+5) Recurrent TOTAL Govern- Duties TOTAL(8+12+13) Salaries Expendi- (6+7) (9+10+1 (15+16)
Fees(1) (2) (3) (4) (5) (6) (7) (8) (9) (10) (11) (12) (13) (14) (15) (16) (17)
GRANT TOTAL
2011 7,934 2,063 237 787 3,088 3,115 6,202 295 23 15 332 1,400 63,890 79 665 744
2012 8,934 2,161 239 859 3,259 4,365 7,623 311 18 16 345 966 51,842 81 793 874
2012 Q1 2,867 544 51 230 824 1,207 2,031 75 1 5 80 755 65,381 77 783 860Q2 1,796 530 79 217 827 804 1,630 76 14 4 95 71 22,332 83 775 858Q3 2,483 546 56 177 779 1,547 2,325 81 2 4 87 71 37,932 84 789 873Q4 1,789 542 53 234 829 807 1,636 79 2 3 84 69 51,842 81 793 874
2013 Q1 1,888 562 56 229 846 901 1,747 79 2 3 84 57 50,037 82 798 880Q2 1,798 566 56 156 778 772 1,550 83 0 3 86 162 35,092 79 790 869
Banks
2012 Q1 1,675 329 36 222 587 988 1,575 55 1 4 60 40 49,685 26 523 549Q2 1,381 337 64 207 609 654 1,262 57 14 3 74 45 21,498 29 521 550Q3 2,043 347 42 170 558 1,361 1,920 65 2 2 68 55 21,693 30 536 566Q4 1,326 343 40 227 610 615 1,225 63 2 1 65 36 35,607 27 540 567
2013 Q1 1,422 354 41 221 615 706 1,321 64 2 1 66 34 33,801 28 543 571
Q2 1,345 360 41 149 550 583 1,133 65 0 2 67 145 18,754 27 535 562
Trust & Insurance Companies
2012 Q1 937 85 5 0 91 125 215 15 0 0 15 707 14,837 15 146 161Q2 217 64 4 3 70 129 199 14 0 0 14 3 0 17 143 160Q3 222 69 4 0 73 135 208 11 0 0 12 2 15,373 17 143 160Q4 222 69 4 0 73 135 208 11 0 0 12 2 15,373 17 143 160
2013 Q1 237 79 5 0 84 140 224 11 0 1 12 2 15,375 17 145 162Q2 237 77 5 0 83 139 222 13 0 0 13 2 15,467 15 145 160
Accounting Firms
2012 Q1 210 103 7 7 118 85 203 3 0 0 3 4 622 29 83 112Q2 132 104 7 7 117 8 125 3 0 0 3 4 576 30 80 110Q3 165 101 7 7 116 45 161 3 0 0 3 2 602 30 79 109Q4 183 101 7 7 116 45 161 3 0 0 3 19 603 30 79 109
2013 Q1 172 101 7 7 116 44 160 3 0 0 3 9 607 30 79 109Q2 164 101 7 7 116 43 159 3 0 0 3 3 608 30 79 109
Legal Firms/ offshore instns
2012 Q1 45 26 2 1 29 9 38 1 0 1 2 5 237 7 31 38Q2 66 26 4 1 30 14 44 2 0 1 4 19 257 7 31 38Q3 53 28 3 0 32 5 37 2 0 1 4 12 263 7 31 38Q4 59 28 2 0 31 12 43 2 0 1 4 12 259 7 31 38
2013 Q1 57 28 3 1 32 11 42 1 0 2 3 12 255 7 31 38Q2 51 27 3 0 30 6 36 2 0 1 3 12 263 7 31 38
Sources: Commercial Banks, Trust Companies, Accounting Firms, Legal Firms and Offshore Institutions

QUARTERLY ECONOMIC REVIEW JUNE 2013
84
TABLE 35: VISITOR ARRIVALS (Number)
Period Visiting Business Other Not friends / Meetings Purposes Stated
2008 90,521 106,138 196,659 594 70,201 9,766 9,960 - -2009 100,634 124,818 225,452 488 84,956 5,498 9,420 311 -2010 97,180 140,468 237,648 692 80,681 6,079 9,616 113 -2011 93,960 154,938 248,898 790 75,790 7,299 9,859 86 -2012 108,161 218,667 326,828 602 88,085 7,910 11,294 270 -
2008 Q1 17,518 31,906 49,424 113 12,901 3,115 1,389 0 -
Q2 19,322 16,700 36,022 79 15,827 2,163 2,529 0 -
Q3 27,625 18,673 46,298 189 22,116 2,075 3,245 0 -
Q4 24,780 38,859 63,639 213 19,357 2,413 2,797 0 -
2009 Q1 20,732 44,898 65,630 168 16,596 1,719 2,046 203 -
Q2 22,305 30,587 52,892 95 17,649 1,940 2,599 62 -
Q3 31,030 22,914 53,944 125 27,244 874 2,741 46 -
Q4 26,567 26,419 52,986 100 23,467 965 2,034 0 -
2010 Q1 19,897 33,930 53,827 217 16,122 1,147 2,409 2 -
Q2 21,523 33,316 54,839 157 17,330 1,473 2,554 10 -
Q3 29,513 32,186 61,699 205 24,105 1,988 3,143 72 -
Q4 26,247 41,036 67,283 113 23,124 1,471 1,510 29 -
2011 Q1 16,600 33,541 50,141 198 13,066 1,361 1,969 6 -
Q2 22,181 51,119 73,300 253 17,495 1,723 2,686 24 -
Q3 29,897 31,988 61,885 213 24,624 2,120 2,885 55 -
Q4 25,282 30,866 56,148 126 20,605 2,095 2,319 1 -
2012 Q1 19,798 69,025 88,823 95 15,661 1,828 2,136 78 -
Q2 25,310 45,833 71,143 234 20,470 1,660 2,912 34 -
Q3 34,357 43,280 77,637 145 28742 2141 3,271 58 -
Q4 28,696 60,529 89,225 128 23212 2281 2,975 100 -
2013 Q1 19,520 65,678 85,198 136 15,303 1,627 2,139 315 -
Q2 27,529 62,005 89,534 196 31,043 2,877 4,013 1,317 -
Source: National Statistics Office
Non Resident Visitors by mode of travel Air arrivals by purpose of Visit
Air Cruiseship Total Stop-over Holiday

QUARTERLY ECONOMIC REVIEW JUNE 2013
85
TABLE 36: VISITOR ARRIVALS BY COUNTRY OF ORIGIN(Number)
Period New New Other North Other Not Australia Zealand Caledonia Pacific Europe America Japan Countries Stated Total
2008 53,249 13,917 9,531 3,757 4,868 2,579 591 2,028 - 90,520
2009 64,909 12,606 9,155 3,707 4,891 2,549 643 2,215 - 100,675 2010 58,759 11,928 11,409 4,720 4,887 2,394 517 2,563 - 97,177
2011 57,806 11,396 11,374 3,312 5,260 1,919 630 2,127 93,824 2012 65,405 14,430 13,138 4,313 5,491 2,094 705 2,585 108,161
2008 Q1 10,373 2,043 2,284 764 895 561 149 449 - 17,518
Q2 11,623 3,446 2,075 1,108 939 671 172 562 - 20,596
Q3 15,563 5,237 2,638 939 1,743 883 145 477 - 27,625
Q4 15,690 3,191 2,534 946 1,291 464 125 540 - 24,781
2009 Q1 14,456 1,658 1,842 648 1,075 416 167 470 - 20,732
Q2 14,408 2,917 1,924 828 1,122 570 134 442 - 22,345
Q3 18,818 5,163 2,571 1,119 1,476 933 227 723 - 31,030
Q4 17,227 2,868 2,818 1,112 1,218 630 115 580 - 26,568
2010 Q1 11,589 1,837 2,787 1,313 1,066 568 142 593 - 19,895
Q2 12,574 3,146 2,372 966 1,073 598 101 692 - 21,522
Q3 17,754 4,457 3,027 1,195 1,536 684 137 723 - 29,513
Q4 16,842 2,488 3,223 1,246 1,212 544 137 555 - 26,247
2011 Q1 10,311 1,402 2,024 887 1,006 350 139 481 - 16,600
Q2 13,592 2,474 2,829 837 1,262 610 123 454 - 22,181
Q3 17,861 4,857 3,063 839 1,801 618 215 643 - 29,897
Q4 16,042 2,663 3,458 749 1,191 341 153 549 25,146
2012 Q1 12,010 1,752 2,979 927 1,040 366 160 564 19,798
Q2 15,360 3,349 2,915 1,034 1,268 555 169 660 25,310
Q3 20,620 5,908 3,343 1,182 1,741 628 212 723 34,357
Q4 17,415 3,421 3,901 1,170 1,442 545 164 638 28,696
2013 Q1 11,444 1,768 3,024 1,015 1,092 424 94 659 19,520
Q2 15,511 3,854 3,068 1,276 1,326 666 159 678 26,538
Source: National Statistics Office
Air arrivals by Country of origin

QUARTERLY ECONOMIC REVIEW JUNE 2013
86
TABLE 37: CONSUMER PRICE INDEX ( Growth relative to previous quarter )
Percent (%)
Period Food Drinks & Clothing etc Rent, Transport Household Recreation Health Education ALL
End Year Tobacco Water Supplies GROUPSElectricty
2008 -0.2 0.7 -0.9 1.0 1.1 N/A -1.0 -0.7 N/A N/A N/A 0.22009 -1.2 0.2 0.3 -1.3 0.5 -4.2 -0.3 1.1 0.7 0 0.1 -1.82010 0.4 0.9 0.1 -0.2 0.1 0.2 0.3 0.0 -0.6 0.0 0.0 0.22011 -0.6 -0.1 -2.9 -0.1 2.8 0.4 4.9 0.1 -0.5 0.2 6.6 0.42012 -0.3 -0.1 0.2 0.1 -0.1 0.3 0.1 2.5 0.0 0.0 2.5 0.1
2008 Q1 2.6 2.6 0.8 -0.2 4.4 N/A 1.0 -2.8 N/A N/A N/A 1.6Q2 2.6 2.7 1.4 1.5 0.2 N/A 0.4 -0.2 N/A N/A N/A 1.5Q3 5.5 0.1 -1.5 0.1 2.5 N/A 1.5 0.1 N/A N/A N/A 2.4Q4 -0.2 0.7 -0.9 1.0 1.1 N/A -1.0 -0.7 N/A N/A N/A 0.2
2009 Q1 2.5 0.5 0.3 0.3 6.2 N/A 1.4 0.1 N/A N/A N/A 1.9Q2 2.6 1.9 0.2 -0.2 -1.8 0 -0.9 1.2 -0.3 0.5 0.6 1.8Q3 0.1 0.1 1.1 0.0 0.8 0 0.4 5.7 0.0 0.0 2.0 0.4Q4 -1.2 0.2 0.3 -1.3 0.5 -4.2 -0.3 1.1 0.7 0.0 0.1 -1.8
2010 Q1 3.6 7.4 -1.9 1.7 1.2 2.3 0.2 1.8 0.3 -4.2 -0.7 2.4Q2 1.2 1.1 0.0 1.3 0.1 0.0 -0.6 -0.9 0.4 0.1 0.0 0.7Q3 -0.1 0.2 -0.3 0.2 0.7 0.0 0.2 0.0 -0.3 0.0 -0.1 0.1Q4 0.4 0.9 0.1 -0.2 0.1 0.2 0.3 0.0 -0.6 0.0 0.0 0.2
2011 Q1 -1.0 -1.0 0.0 -0.2 0.1 0.0 -0.4 0.1 1.1 3.4 -0.1 -0.4Q2 0.7 0.8 1.0 1.9 1.8 -0.1 -2.0 -0.4 0.0 -0.3 0.3 0.7Q3 1.6 2.1 1.1 0.0 -6.7 0.0 -1.3 5.1 0.2 1.7 -2.1 0.5Q4 -0.6 -0.1 -2.9 -0.1 2.8 0.4 4.9 0.1 -0.5 0.2 6.6 0.4
2012 Q1 1.1 -0.2 -1.1 0.4 -0.3 -1.3 1.4 -1.2 0.3 1.6 0.4 0.5Q2 0.5 0.5 2.1 -1.4 0.0 -0.1 0.1 0.4 -1.0 -0.2 2.5 0.1Q3 0.3 0.1 1.9 -0.5 -0.1 0.2 0.8 0.4 -0.4 0.0 0.1 0.1Q4 -0.3 -0.1 0.2 0.1 -0.1 0.3 0.1 2.5 0.0 0.0 2.5 0.1
2012 Q1 1.0 0.1 0.6 2.3 0.1 0.4 0.8 0.9 0.8 2.3 -0.7 1.1Q2 0.3 0.3 2.6 0.6 -0.3 0.0 -1.5 -2.0 0.1 0.4 2.1 0.2
Source: Vanuatu Statistics OfficeN/A - Not availableNote - All figures have been revised from 2007 to 2011. Groups have been seperated as according to VNSO standard reporting. Data not available in this quarter will be updated in September quarter tables. For more information please contact VNSO.
Communi-cation
Miscella-neous

QUARTERLY ECONOMIC REVIEW JUNE 2013
87
TABLE 38: CONSUMER PRICE INDICES BY EXPENDITURE GROUP (Quarter to same quarter of previous year)
Percent (%)
Period Food Drinks & Clothing etc Rent, Transport Household Recreation Health Education ALL
Tobacco Water & Supplies GROUPSEnd Year Electricity
2008 10.7 6.2 -0.2 2.3 8.3 N/A 1.9 -3.6 N/A N/A N/A 5.82009 3.9 2.7 1.9 -1.2 5.6 N/A 0.6 8.2 N/A N/A N/A 2.32010 5.2 9.7 -2.1 3.0 2.1 2.5 0.1 0.9 -0.2 -4.1 -0.8 3.42011 0.7 1.8 -0.9 1.5 -2.3 0.3 1.1 4.8 0.8 5.0 4.5 1.22012 1.6 0.3 2.8 -1.4 -0.5 -0.9 2.5 2.2 -1.1 1.4 5.6 0.9
2008 Q1 4.5 4.0 0.9 0.6 7.1 N/A 0.4 3.0 N/A N/A N/A 3.6Q2 5.6 6.1 2.3 2.7 5.2 N/A 0.8 -1.5 N/A N/A N/A 3.9Q3 11.3 5.8 0.8 2.4 7.2 N/A 2.9 -2.9 N/A N/A N/A 6.0Q4 10.7 6.2 -0.2 2.3 8.3 N/A 1.9 -3.6 N/A N/A N/A 5.8
2009 Q1 10.6 4.0 -0.7 2.9 10.2 N/A 2.2 -0.7 N/A N/A N/A 6.1Q2 10.7 3.1 -1.8 1.3 8.1 N/A 1.0 0.7 N/A N/A N/A 6.4Q3 5.0 3.1 0.7 1.2 6.3 N/A -0.1 6.3 N/A N/A N/A 4.4Q4 3.9 2.7 1.9 -1.2 5.6 N/A 0.6 8.2 N/A N/A N/A 2.3
2010 Q1 5.0 9.7 -0.4 0.2 0.7 -2.0 -0.6 10.1 0.7 -3.7 2.0 2.8Q2 3.6 8.9 -0.6 1.7 2.6 -2.0 -0.3 7.8 1.4 -4.1 1.4 1.7Q3 3.4 9.0 -2.0 1.9 2.5 -2.0 -0.5 2.0 1.1 -4.1 -0.7 1.3Q4 5.2 9.7 -2.1 3.0 2.1 2.5 0.1 0.9 -0.2 -4.1 -0.8 3.4
2011 Q1 0.6 1.1 -0.2 1.0 1.0 0.2 -0.5 -0.8 0.6 3.5 -0.2 0.7Q2 0.1 0.8 0.8 1.5 2.7 0.1 -1.9 -0.3 0.2 3.1 0.1 0.6Q3 1.7 2.8 2.2 1.4 -4.8 0.1 -3.4 4.8 0.7 4.9 -2.0 1.0Q4 0.7 1.8 -0.9 1.5 -2.3 0.3 1.1 4.8 0.8 5.0 4.5 1.2
2012 Q1 2.8 2.7 -2.0 2.2 -2.7 -1.0 2.9 3.5 0.0 3.3 5.0 2.1Q2 2.6 2.4 -0.9 -1.1 -4.5 -1.0 5.1 4.4 -1.0 3.4 7.3 1.5Q3 1.3 0.3 -0.1 -1.5 2.4 -0.8 7.4 -0.2 -1.6 1.6 9.8 1.1Q4 1.6 0.3 2.8 -1.4 -0.5 -0.9 2.5 2.2 -1.1 1.4 5.6 0.9
2013 Q1 1.5 0.5 4.9 0.5 0.0 0.8 1.9 4.3 -0.6 2.1 4.5 1.4Q2 1.3 0.4 5.4 2.5 -0.3 0.9 0.3 1.8 0.5 2.7 4.0 1.5
Source: Vanuatu Statistics OfficeN/A - Not AvailableNote - All figures have been revised from 2007 to 2011. Groups have been seperated as according to VNSO standard reporting. Data not available in this quarter will be updated in September quarter tables. For more information please contact VNSO.
Communi-cation
Miscella-neous

QUARTERLY ECONOMIC REVIEW JUNE 2013
88
TABLE 39: CONSUMER PRICE INDICES BY REGION (Growth relative to previous quarter)Percent (%)
Period Group
Region Port Vila Luganville Port Vila Luganville Port Vila Luganville Port Vila Luganville Port Vila Luganville Port Vila Luganville
2008 -0.3 0.0 0.7 0.2 -0.9 -0.2 1.1 0.6 -1.1 -0.4 1.3 0.02009 -1.3 -1.4 0.1 0.2 0.0 1.6 -1.5 0.0 -0.4 0.2 0.3 1.62010 0.3 0.8 0.2 3.6 0.0 0.0 -0.2 -0.9 0.3 0.0 0.1 0.02011 -1.0 1.0 -0.1 0.5 -3.5 1.4 -0.1 -0.3 5.7 0.8 3.1 0.82012 -0.3 -0.2 -0.1 0.0 0.2 0.2 0.0 0.4 0.1 -0.2 -0.1 r 0.1 r
2008 Q1 2.5 2.8 2.9 1.2 0.1 0.3 1.7 0.1 0.9 -0.2 3.8 7.7Q2 2.7 2.2 3.1 0.0 1.8 0.0 0.0 0.0 0.3 1.0 0.2 0.0Q3 4.8 8.5 0.0 1.5 -0.8 -1.3 0.0 0.7 1.9 0.8 2.3 2.7Q4 -0.3 0.0 0.7 0.2 -0.9 -0.2 1.1 0.6 -1.1 -0.4 1.3 0.0
2009 Q1 2.9 0.9 0.6 0.0 0.1 1.4 0.0 2.7 1.4 0.6 7.3 -0.3Q2 2.7 2.4 2.4 0.0 0.2 0.0 -0.2 -0.3 -0.9 -0.4 -1.9 -0.6Q3 -0.2 1.4 0.1 0.0 0.9 2.0 -0.1 0.2 0.4 0.4 0.8 0.5Q4 -1.3 -1.4 0.1 0.2 0.0 1.6 -1.5 0.0 -0.4 0.2 0.3 1.6
2010 Q1 4.5 0.3 8.3 4.0 -2.3 -0.2 1.7 2.1 0.0 1.5 1.2 2.1Q2 1.4 0.7 0.9 1.8 0.0 -0.1 1.5 0.3 -0.7 0.0 0.0 0.6Q3 -0.4 1.4 0.2 0.1 -0.3 -0.1 0.2 0.1 0.2 0.1 0.7 0.1Q4 0.3 0.8 0.2 3.6 0.0 0.0 -0.2 -0.9 0.3 0.0 0.1 0.0
2011 Q1 -0.7 -2.0 -1.3 0.0 0.0 0.2 0.0 -1.7 -0.5 0.6 0.3 -1.2Q2 0.8 0.6 0.8 0.7 1.1 0.6 2.0 1.2 -2.3 0.3 1.9 1.3Q3 2.2 -1.0 2.5 0.8 2.6 -5.4 -0.9 6.1 -0.9 -4.1 -7.5 -2.1Q4 -1.0 1.0 -0.1 0.5 -3.5 1.4 -0.1 -0.3 5.7 0.8 3.1 0.8
2012 Q1 1.5 -0.1 0.1 -1.5 -1.5 -0.8 0.3 0.8 1.4 0.8 0.0 -2.2Q2 0.8 0.1 r 0.2 1.5 r 2.2 0.9 r -1.6 -0.8 r 0.1 -0.8 r 0.0 2.2 rQ3 0.3 -0.6 r 0.1 0.0 r 2.0 2.3 r -0.6 1.0 r 1.1 0.7 r -0.1 -2.0 rQ4 -0.3 -0.2 -0.1 0.0 0.2 0.2 0.0 0.4 0.1 -0.2 -0.1 r 0.1 r
2012 Q1 0.8 1.5 -0.1 0.3 0.3 1.9 2.6 0.6 1.0 0.0 0.6 -2.5Q2 0.2 1.0 0.2 1.0 1.9 5.5 0.6 0.3 -2.5 4.1 0.2 -3.5
Source: Vanuatu Statistics OfficeN/A - Not AvailableNote - All figures have been revised from 2007 to 2011. Groups have been seperated as according to VNSO standard reporting. Data not available in this quarter will be updated in September quarter tables. For more information please contact VNSO.
Transport Food Drinks & Tabacco Clothing etc Rent, Water, Electricity Household Supplies

QUARTERLY ECONOMIC REVIEW JUNE 2013
89
TABLE 39: CONSUMER PRICE INDICES BY REGION (Growth relative to previous quarter)…ContinuePercent (%)
Period Group
Region Port Vila Luganville Port Vila Luganville Port Vila Luganville Port Vila Luganville Port Vila Luganville Port Vila Luganville
2008 N/A N/A -0.8 N/A N/A N/A N/A N/A N/A N/A 0.2 0.22009 -25.4 0.3 1.2 0.0 0.8 0.0 0.0 0.0 -0.3 2.4 -2.0 -0.42010 0.0 1.0 0.0 0.2 -0.6 0.0 0.0 0.0 0.1 -0.7 0.1 0.62011 0.5 0.4 -0.1 1.2 0.4 0.1 0.2 0.0 7.9 -1.7 0.3 0.72012 0.1 2.0 2.9 0.0 0.0 0.0 0.0 0.0 2.9 -0.3 0.1 0.1
2008 Q1 N/A N/A -3.2 N/A N/A N/A N/A N/A N/A N/A 1.4 2.4Q2 N/A N/A -0.2 N/A N/A N/A N/A N/A N/A N/A 1.7 1.0Q3 N/A N/A 0.1 N/A N/A N/A N/A N/A N/A N/A 2.1 3.7Q4 N/A N/A -0.8 N/A N/A N/A N/A N/A N/A N/A 0.2 0.2
2009 Q1 N/A N/A 0 N/A N/A N/A N/A N/A N/A N/A 2.0 1.0Q2 0.0 1.0 1.3 0.2 0.0 -2.6 0.6 0.0 0.6 0.3 2.2 0.4Q3 27.5 -1.0 6.7 0.2 0.0 0.0 0.0 0.0 2.3 0.6 0.2 1.3Q4 -25.4 0.3 1.2 0 0.8 0.0 0.0 0.0 -0.3 2.4 -2.0 -0.4
2010 Q1 2.8 0.0 2.2 -0.2 0.4 -0.6 -4.3 -3.3 -0.8 0.4 2.7 0.7Q2 0.0 0.0 -1.1 -0.1 0.4 0.0 0.1 0.0 0 0 0.7 0.6Q3 0.0 0.0 0 0.2 -0.3 0.1 0.0 0.0 -0.1 0 0.0 0.7Q4 0.0 1.0 0 0.2 -0.6 0.0 0.0 0.0 0.1 -0.7 0.1 0.6
2011 Q1 0.1 -0.6 0.1 0 0.2 7.3 4.2 0.0 -0.1 0 -0.1 -1.2Q2 0.0 -0.6 -0.2 -1.2 0.0 0.0 -0.4 0.1 0 1.6 0.7 0.6Q3 -0.1 0.0 5.9 0 0.1 0.7 0.8 5.4 -2.5 0.1 0.5 0.4Q4 0.5 0.4 -0.1 1.2 0.4 0.1 0.2 0.0 7.9 -1.7 0.3 0.7
2012 Q1 -1.4 -1.0 -1.4 0.6 0.0 -4.2 0.0 7.8 0.0 2.8 0.5 0.4Q2 0.0 1.0 0.4 0.4 r -0.9 4.4 -0.2 -7.2 2.1 -2.7 0.1 -0.4Q3 0.1 -1.0 0.4 0.6 r -0.4 -6.0 0.0 7.8 0.2 7.8 0.1 0.4Q4 0.1 2.0 2.9 0 0.0 0.0 0.0 0.0 2.9 -0.3 0.1 0.1
2012 Q1 0.3 0.5 0.9 0.3 0.9 0.1 2.5 1.4 -1.2 2.5 1.1 0.9Q2 0.1 0.0 -2.0 -1.8 0.1 0.0 0.5 0.4 2.3 1.1 0.1 0.8
Source: Vanuatu Statistics OfficeN/A - Not AvailableNote - All figures have been revised from 2007 to 2011. Groups have been seperated as according to VNSO standard reporting. Data not available in this quarter will be updated in September quarter tables. For more information please contact VNSO.
ALL GROUPSCommunication Recreation Health Education Miscellaneous
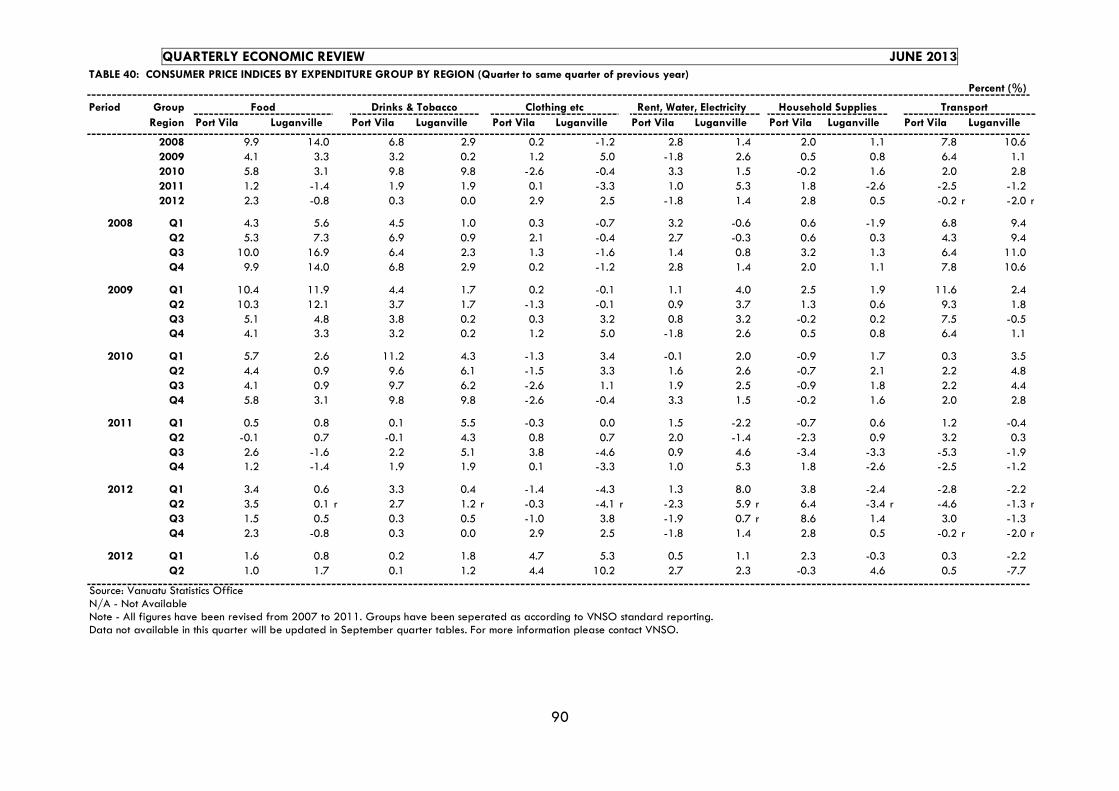
QUARTERLY ECONOMIC REVIEW JUNE 2013
90
TABLE 40: CONSUMER PRICE INDICES BY EXPENDITURE GROUP BY REGION (Quarter to same quarter of previous year)Percent (%)
Period Group
Region Port Vila Luganville Port Vila Luganville Port Vila Luganville Port Vila Luganville Port Vila Luganville Port Vila Luganville
2008 9.9 14.0 6.8 2.9 0.2 -1.2 2.8 1.4 2.0 1.1 7.8 10.62009 4.1 3.3 3.2 0.2 1.2 5.0 -1.8 2.6 0.5 0.8 6.4 1.12010 5.8 3.1 9.8 9.8 -2.6 -0.4 3.3 1.5 -0.2 1.6 2.0 2.82011 1.2 -1.4 1.9 1.9 0.1 -3.3 1.0 5.3 1.8 -2.6 -2.5 -1.22012 2.3 -0.8 0.3 0.0 2.9 2.5 -1.8 1.4 2.8 0.5 -0.2 r -2.0 r
2008 Q1 4.3 5.6 4.5 1.0 0.3 -0.7 3.2 -0.6 0.6 -1.9 6.8 9.4Q2 5.3 7.3 6.9 0.9 2.1 -0.4 2.7 -0.3 0.6 0.3 4.3 9.4Q3 10.0 16.9 6.4 2.3 1.3 -1.6 1.4 0.8 3.2 1.3 6.4 11.0Q4 9.9 14.0 6.8 2.9 0.2 -1.2 2.8 1.4 2.0 1.1 7.8 10.6
2009 Q1 10.4 11.9 4.4 1.7 0.2 -0.1 1.1 4.0 2.5 1.9 11.6 2.4Q2 10.3 12.1 3.7 1.7 -1.3 -0.1 0.9 3.7 1.3 0.6 9.3 1.8Q3 5.1 4.8 3.8 0.2 0.3 3.2 0.8 3.2 -0.2 0.2 7.5 -0.5Q4 4.1 3.3 3.2 0.2 1.2 5.0 -1.8 2.6 0.5 0.8 6.4 1.1
2010 Q1 5.7 2.6 11.2 4.3 -1.3 3.4 -0.1 2.0 -0.9 1.7 0.3 3.5Q2 4.4 0.9 9.6 6.1 -1.5 3.3 1.6 2.6 -0.7 2.1 2.2 4.8Q3 4.1 0.9 9.7 6.2 -2.6 1.1 1.9 2.5 -0.9 1.8 2.2 4.4Q4 5.8 3.1 9.8 9.8 -2.6 -0.4 3.3 1.5 -0.2 1.6 2.0 2.8
2011 Q1 0.5 0.8 0.1 5.5 -0.3 0.0 1.5 -2.2 -0.7 0.6 1.2 -0.4Q2 -0.1 0.7 -0.1 4.3 0.8 0.7 2.0 -1.4 -2.3 0.9 3.2 0.3Q3 2.6 -1.6 2.2 5.1 3.8 -4.6 0.9 4.6 -3.4 -3.3 -5.3 -1.9Q4 1.2 -1.4 1.9 1.9 0.1 -3.3 1.0 5.3 1.8 -2.6 -2.5 -1.2
2012 Q1 3.4 0.6 3.3 0.4 -1.4 -4.3 1.3 8.0 3.8 -2.4 -2.8 -2.2Q2 3.5 0.1 r 2.7 1.2 r -0.3 -4.1 r -2.3 5.9 r 6.4 -3.4 r -4.6 -1.3 rQ3 1.5 0.5 0.3 0.5 -1.0 3.8 -1.9 0.7 r 8.6 1.4 3.0 -1.3Q4 2.3 -0.8 0.3 0.0 2.9 2.5 -1.8 1.4 2.8 0.5 -0.2 r -2.0 r
2012 Q1 1.6 0.8 0.2 1.8 4.7 5.3 0.5 1.1 2.3 -0.3 0.3 -2.2Q2 1.0 1.7 0.1 1.2 4.4 10.2 2.7 2.3 -0.3 4.6 0.5 -7.7
Source: Vanuatu Statistics OfficeN/A - Not AvailableNote - All figures have been revised from 2007 to 2011. Groups have been seperated as according to VNSO standard reporting. Data not available in this quarter will be updated in September quarter tables. For more information please contact VNSO.
Transport Food Drinks & Tobacco Clothing etc Rent, Water, Electricity Household Supplies

QUARTERLY ECONOMIC REVIEW JUNE 2013
91
TABLE 40: CONSUMER PRICE INDICES BY EXPENDITURE GROUP BY REGION (Quarter to same quarter of previous year)… ContinuePercent (%)
Period GroupRegion Port Vila Luganville Port Vila Luganville Port Vila Luganville Port Vila Luganville Port Vila Luganville Port Vila Luganville
2008 N/A N/A -4.0 -0.7 N/A N/A N/A N/A N/A N/A 5.4 7.32009 N/A N/A 9.5 0.9 N/A N/A N/A N/A N/A N/A 2.3 2.32010 2.8 1.0 1.0 0.2 -0.1 -0.5 -4.2 -3.3 -0.8 -0.3 3.5 2.62011 0.5 -0.8 5.6 -0.1 0.7 8.1 4.8 5.5 5.2 0.0 1.4 0.42012 -1.2 r 1.0 r 2.3 r 1.6 r -1.3 r -6.0 r -0.2 7.8 5.3 7.5 0.9 0.5
2008 Q1 N/A N/A 3.6 -0.8 N/A N/A N/A N/A N/A N/A 3.6 3.3Q2 N/A N/A -1.5 -0.9 N/A N/A N/A N/A N/A N/A 3.9 4.2Q3 N/A N/A -3.2 -0.5 N/A N/A N/A N/A N/A N/A 5.5 8.1Q4 N/A N/A -4 -0.7 N/A N/A N/A N/A N/A N/A 5.4 7.3
2009 Q1 N/A N/A -0.9 0.3 N/A N/A N/A N/A N/A N/A 6.0 5.9Q2 N/A N/A 0.6 0.6 N/A N/A N/A N/A N/A N/A 6.5 5.3Q3 N/A N/A 7.3 0.7 N/A N/A N/A N/A N/A N/A 4.6 3.0Q4 N/A N/A 9.5 0.9 N/A N/A N/A N/A N/A N/A 2.3 2.3
2010 Q1 -2.3 0.3 11.9 0.3 1.2 -3.2 -3.8 -3.3 1.8 3.7 3.1 2.1Q2 -2.3 -0.7 9.1 0.0 1.6 -0.6 -4.2 -3.3 1.2 3.4 1.6 2.2Q3 -23.3 0.3 2.3 0.0 1.3 -0.5 -4.2 -3.3 -1.2 2.8 1.3 1.5Q4 2.8 1.0 1.0 0.2 -0.1 -0.5 -4.2 -3.3 -0.8 -0.3 3.5 2.6
2011 Q1 0.1 0.4 -1.1 0.4 -0.3 7.4 4.3 0.0 -0.1 -0.7 0.7 0.6Q2 0.1 -0.2 -0.2 -0.7 -0.7 7.4 3.8 0.1 -0.1 1.0 0.7 0.6Q3 0.0 -0.2 5.7 -1.0 -0.3 8.0 4.6 5.5 -2.5 1.1 1.2 0.3Q4 0.5 -0.8 5.6 -0.1 0.7 8.1 4.8 5.5 5.2 0.0 1.4 0.4
2012 Q1 -1.0 -1.2 4.0 0.5 0.5 -3.5 0.6 13.7 5.3 2.8 2.1 2.0Q2 -1.0 0.4 r 4.7 2.1 -0.4 0.7 r 0.8 5.4 r 7.5 -1.6 r 1.5 1.0 rQ3 -0.8 -0.6 -0.6 2.8 -0.9 -6 0 7.8 10.5 5.9 1.1 1.1Q4 -1.2 r 1 r 2.3 r 1.6 r -1.3 r -6 r -0.2 7.8 5.3 7.5 0.9 0.5
2012 Q1 0.5 2.5 4.8 1.4 -0.4 -1.8 2.3 1.4 4.0 7.2 1.4 1.0Q2 0.6 1.5 2.2 0.1 0.6 -5.9 3 9.6 4.2 11.3 1.4 2.2
Source: Vanuatu Statistics OfficeN/A - Not AvailableNote - All figures have been revised from 2007 to 2011. Groups have been seperated as according to VNSO standard reporting. Data not available in this quarter will be updated in September quarter tables. For more information please contact VNSO.
ALL GROUPSCommunication Recreation Health Education Miscellaneous
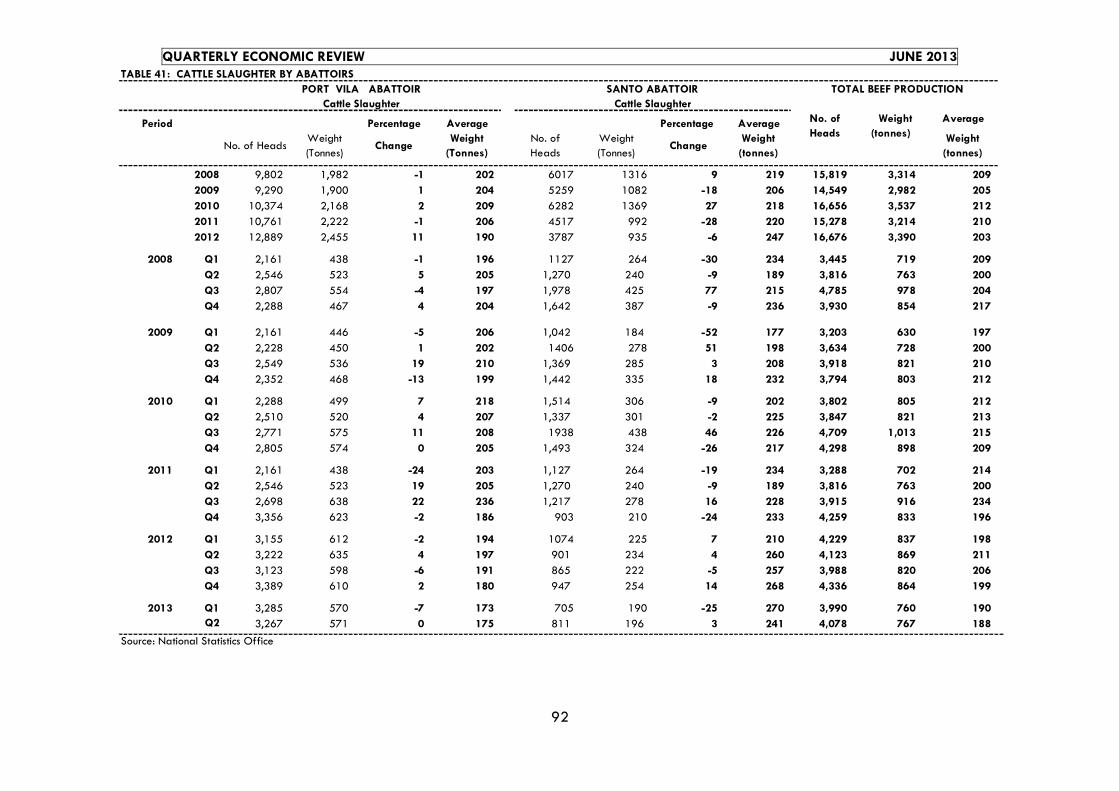
QUARTERLY ECONOMIC REVIEW JUNE 2013
92
TABLE 41: CATTLE SLAUGHTER BY ABATTOIRS
Period Percentage Average Percentage Average Average
No. of HeadsWeight (Tonnes)
ChangeWeight
(Tonnes)No. of Heads
Weight (Tonnes)
ChangeWeight
(tonnes)Weight
(tonnes)
2008 9,802 1,982 -1 202 6017 1316 9 219 15,819 3,314 209
2009 9,290 1,900 1 204 5259 1082 -18 206 14,549 2,982 205
2010 10,374 2,168 2 209 6282 1369 27 218 16,656 3,537 212
2011 10,761 2,222 -1 206 4517 992 -28 220 15,278 3,214 210
2012 12,889 2,455 11 190 3787 935 -6 247 16,676 3,390 203
2008 Q1 2,161 438 -1 196 1127 264 -30 234 3,445 719 209
Q2 2,546 523 5 205 1,270 240 -9 189 3,816 763 200
Q3 2,807 554 -4 197 1,978 425 77 215 4,785 978 204
Q4 2,288 467 4 204 1,642 387 -9 236 3,930 854 217
2009 Q1 2,161 446 -5 206 1,042 184 -52 177 3,203 630 197
Q2 2,228 450 1 202 1406 278 51 198 3,634 728 200
Q3 2,549 536 19 210 1,369 285 3 208 3,918 821 210
Q4 2,352 468 -13 199 1,442 335 18 232 3,794 803 212
2010 Q1 2,288 499 7 218 1,514 306 -9 202 3,802 805 212
Q2 2,510 520 4 207 1,337 301 -2 225 3,847 821 213
Q3 2,771 575 11 208 1938 438 46 226 4,709 1,013 215
Q4 2,805 574 0 205 1,493 324 -26 217 4,298 898 209
2011 Q1 2,161 438 -24 203 1,127 264 -19 234 3,288 702 214
Q2 2,546 523 19 205 1,270 240 -9 189 3,816 763 200
Q3 2,698 638 22 236 1,217 278 16 228 3,915 916 234
Q4 3,356 623 -2 186 903 210 -24 233 4,259 833 196
2012 Q1 3,155 612 -2 194 1074 225 7 210 4,229 837 198
Q2 3,222 635 4 197 901 234 4 260 4,123 869 211
Q3 3,123 598 -6 191 865 222 -5 257 3,988 820 206
Q4 3,389 610 2 180 947 254 14 268 4,336 864 199
2013 Q1 3,285 570 -7 173 705 190 -25 270 3,990 760 190 Q2 3,267 571 0 175 811 196 3 241 4,078 767 188
Source: National Statistics Office
No. of Heads
Weight (tonnes)
PORT VILA ABATTOIR SANTO ABATTOIR TOTAL BEEF PRODUCTIONCattle Slaughter Cattle Slaughter

QUARTERLY ECONOMIC REVIEW JUNE 2013
93
TABLE 42: ENERGY CONSUMPTION
Thousand Kwh Thousand Litres
Petrol Fuel KerosenePeriod Port-Vila Luganville Malekula Tanna TOTAL
2008 47,780 6,481 550 315 55,126 6,963 38,189 603 2009 49,520 6,529 503 372 56,924 8,238 36,747 295 2010 52,568 7,504 579 420 61,071 9,703 36,039 69 2011 54,014 7,572 597 461 62,644 8,494 39,880 1,380 2012 52,243 7,748 620 510 61,120 8,364 34,859 -
2008 Q1 13,045 1,649 153 72 14,919 1,376 9,564 155
Q2 11,067 1,562 133 80 12,842 2,285 8,075 82
Q3 11,339 1,615 134 77 13,165 1,875 10,947 49
Q4 12,329 1,655 130 86 14,200 1,427 9,603 317
2009 Q1 13,635 1,585 130 89 15,435 1,806 7,937 -
Q2 12,311 1,612 125 89 14,137 1,938 10,082 98
Q3 11,274 1,629 120 99 13,122 1,862 6,932 110
Q4 12,300 1,703 128 99 14,230 2,632 11,796 87
2010 Q1 13,820 1,773 143 99 15,836 1,699 5,025 33
Q2 12,748 1,834 150 104 14,835 3,031 12,558 20
Q3 12,501 1,837 148 107 14,593 3,024 12,426 16
Q4 13,499 2,061 137 110 15,807 1,949 6,030 -
2011 Q1 14,075 1,751 154 117 16,097 2,150 12,088 842
Q2 13,716 1,985 145 113 15,959 1,513 6,955 1
Q3 12,554 1,868 146 114 14,682 1,571 9,857 -
Q4 13,669 1,968 152 117 15,906 3,260 10,980 -
2012 Q1 14,118 1,934 156 125 16,333 1,928 5,964 -
Q2 12,695 1,969 157 129 14,950 2,643 11,074 -
Q3 12,099 1,887 148 126 14,259 2,489 12,034 -
Q4 13,331 1,958 159 130 15,578 1,304 5,787 -
2013 Q1 14,025 2,000 159 131 16,315 2,576 8,316 -Q2 13,280 2,019 157 160 15,616 2,337 9,916 -
Source: Unelco Vanuatu Limited and Department of Customes/ Unelco Vanuatu Limited et Sercies des Douanes(1) Includes White Spirit / Y compris le White Spirit
Imports Cleared for Home consumption
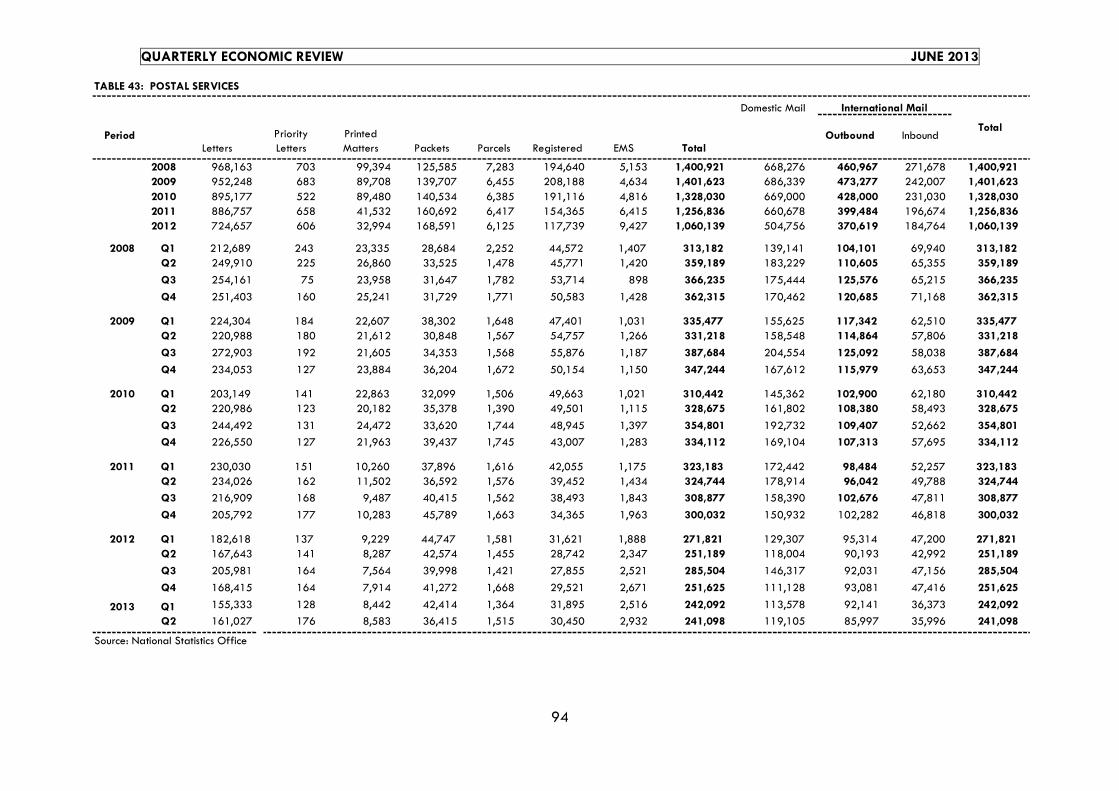
QUARTERLY ECONOMIC REVIEW JUNE 2013
94
TABLE 43: POSTAL SERVICES
Domestic Mail
PeriodLetters
Priority Letters
Printed Matters Packets Parcels Registered EMS Total
Outbound Inbound
2008 968,163 703 99,394 125,585 7,283 194,640 5,153 1,400,921 668,276 460,967 271,678 1,400,921 2009 952,248 683 89,708 139,707 6,455 208,188 4,634 1,401,623 686,339 473,277 242,007 1,401,623
2010 895,177 522 89,480 140,534 6,385 191,116 4,816 1,328,030 669,000 428,000 231,030 1,328,030 2011 886,757 658 41,532 160,692 6,417 154,365 6,415 1,256,836 660,678 399,484 196,674 1,256,836 2012 724,657 606 32,994 168,591 6,125 117,739 9,427 1,060,139 504,756 370,619 184,764 1,060,139
2008 Q1 212,689 243 23,335 28,684 2,252 44,572 1,407 313,182 139,141 104,101 69,940 313,182 Q2 249,910 225 26,860 33,525 1,478 45,771 1,420 359,189 183,229 110,605 65,355 359,189
Q3 254,161 75 23,958 31,647 1,782 53,714 898 366,235 175,444 125,576 65,215 366,235
Q4 251,403 160 25,241 31,729 1,771 50,583 1,428 362,315 170,462 120,685 71,168 362,315
2009 Q1 224,304 184 22,607 38,302 1,648 47,401 1,031 335,477 155,625 117,342 62,510 335,477 Q2 220,988 180 21,612 30,848 1,567 54,757 1,266 331,218 158,548 114,864 57,806 331,218
Q3 272,903 192 21,605 34,353 1,568 55,876 1,187 387,684 204,554 125,092 58,038 387,684
Q4 234,053 127 23,884 36,204 1,672 50,154 1,150 347,244 167,612 115,979 63,653 347,244
2010 Q1 203,149 141 22,863 32,099 1,506 49,663 1,021 310,442 145,362 102,900 62,180 310,442 Q2 220,986 123 20,182 35,378 1,390 49,501 1,115 328,675 161,802 108,380 58,493 328,675
Q3 244,492 131 24,472 33,620 1,744 48,945 1,397 354,801 192,732 109,407 52,662 354,801
Q4 226,550 127 21,963 39,437 1,745 43,007 1,283 334,112 169,104 107,313 57,695 334,112
2011 Q1 230,030 151 10,260 37,896 1,616 42,055 1,175 323,183 172,442 98,484 52,257 323,183 Q2 234,026 162 11,502 36,592 1,576 39,452 1,434 324,744 178,914 96,042 49,788 324,744
Q3 216,909 168 9,487 40,415 1,562 38,493 1,843 308,877 158,390 102,676 47,811 308,877
Q4 205,792 177 10,283 45,789 1,663 34,365 1,963 300,032 150,932 102,282 46,818 300,032
2012 Q1 182,618 137 9,229 44,747 1,581 31,621 1,888 271,821 129,307 95,314 47,200 271,821 Q2 167,643 141 8,287 42,574 1,455 28,742 2,347 251,189 118,004 90,193 42,992 251,189
Q3 205,981 164 7,564 39,998 1,421 27,855 2,521 285,504 146,317 92,031 47,156 285,504
Q4 168,415 164 7,914 41,272 1,668 29,521 2,671 251,625 111,128 93,081 47,416 251,625
2013 Q1 155,333 128 8,442 42,414 1,364 31,895 2,516 242,092 113,578 92,141 36,373 242,092
Q2 161,027 176 8,583 36,415 1,515 30,450 2,932 241,098 119,105 85,997 35,996 241,098 rSource: National Statistics Office
International Mail
Total

QUARTERLY ECONOMIC REVIEW JUNE 2013
95
TABLE 44: PRIVATE MOTOR VEHICLE REGISTRATION - PORT VILA AND LUGANVILLE
(Number)
Period Motorcars Pickups Trucks Buses Motor-cycle Total
2008 485 465 169 202 88 1,409
2009 391 385 105 151 86 1,118 2010 380 360 98 209 110 1,157
2011 426 355 68 229 94 1,172 2012 353 329 41 226 77 1,026
2008 Q1 88 90 50 34 4 266 Q2 126 100 48 60 18 352 Q3 161 153 42 62 42 460 Q4 110 122 29 46 24 331
2009 Q1 130 102 20 30 25 307 Q2 106 100 28 36 25 295 Q3 75 86 37 38 21 257 Q4 80 97 20 47 15 259
2010 Q1 106 70 25 40 36 277 Q2 101 94 26 44 25 290 Q3 76 103 27 63 22 291 Q4 97 98 20 62 27 304
2011 Q1 96 94 11 64 25 280 Q2 115 95 23 82 25 340 Q3 118 84 40 39 23 286 Q4 97 82 12 44 21 256
2012 Q1 103 74 16 59 27 279 Q2 85 88 6 51 13 243 Q3 98 94 9 70 18 289 Q4 67 73 10 46 19 215
2013 Q1 82 102 22 68 9 283 Q2 95 158 18 55 40 366
Source: Vanuatu Statistics Office

QUARTERLY ECONOMIC REVIEW JUNE 2013
96
TABLE 45: NUMBER OF PROVIDENT FUND CONTRIBUTING MEMBERS / FORMAL EMPLOYMENT
Period Males % Females % Total
2008 13,819 62 8,345 38 22,1642009 9,922 60 6,720 40 16,6422010 10,265 60 6,925 40 17,1902011 10,362 60 6,998 40 17,3602012 12,257 59 8,488 41 20,745
2008 Q1 8,678 61 5,525 39 14,203Q2 11,046 61 6,930 39 17,976Q3 9,673 61 6,178 39 15,851Q4 13,819 62 8,345 38 22,164
2009 Q1 9,248 60 6,066 40 15,314Q2 9,218 60 6,148 40 15,366Q3 9,855 60 6,646 40 16,501Q4 9,922 60 6,720 40 16,642
2010 Q1 9,901 60 6,546 40 16,447Q2 9,856 60 6,692 40 16,548Q3 9,854 60 6,608 40 16,462Q4 10,265 60 6,925 40 17,190
2011 Q1 10,239 60 6,957 41 17,196Q2 9,724 59 6,730 41 16,454Q3 8,729 59 6,047 41 14,776Q4 10,362 60 6,998 40 17,360
2012 Q1 10,205 59 7,030 41 17,235Q2 9,535 59 6,591 41 16,126Q3 10,520 59 7,266 41 17,786Q4 12,257 59 8,488 41 20,745
2013 Q1 9,837 59 6,888 41 16,725Q2 10,599 59 7,481 41 18,080
Source: Vanuatu National Provident Fund