Embed Size (px)
Citation preview

Quarterly Budget Report
March 31, 2015
(AVAILABLE ON-LINE AT: HTTP://WWW1.CO.SNOHOMISH.WA.US/DEPARTMENTS/FINANCE/BUDGET_SYSTEMS/MONTHLY)

2
INTRODUCTION
I. General Overview 3 General Fund 4 YTD Revenue 5 YTD Expenditures 7 5-Year Projection 8
Real Estate Excise Tax 8 Economic Outlook 8
Closing Comments 10 County Sales Summary 11
CORPORATE
II. County Revenues by Fund 12
III. County Expenditures by Fund 13
DEPARTMENT
IV. General Fund Revenues by Department 14
General Fund Expenditures by Department 15
ALL FUNDS
V. Major Funds Revenues, Expenditures, and Fund Balances: General Fund 16 Special Revenue 16 County Road 17 Human Services (CD/MH Sales Tax) 17 Real Estate Excise Tax (REET) 18 Transportation Mitigation 18 Community Development 18 Solid Waste Management 19 Airport Operations and Maintenance 19 Surface Water Management 20 Equipment Rental and Revolving 20 Information Services 21 Snohomish County Insurance 21 Employee Benefits 21 Facility Services 22
VI. Detail Revenue: General Fund 23
Table of Contents
QUARTERLY BUDGET REPORT
March 31, 2015

3
QUARTERLY BUDGET REPORT: MARCH 2015
This is the First Quarter financial update for Snohomish County fiscal operations.
General Economic Overview The number of Americans filing new claims for jobless benefits tumbled to a 15-year low last week and consumer spending rose in March, signs the economy was regaining momentum after stumbling badly in the first quarter. "This morning's reports all point to an economy that is doing a lot better than the near-stagnation in first-quarter GDP suggests," said Paul Ashworth, chief U.S. economist at Capital Economics in Toronto – April 30 (Reuters) The U.S. Bureau of Economic Analysis showed that real gross domestic product (GDP), the value of the production of goods and services in the United States, adjusted for price changes, increased at an annual rate of 0.2 percent in the first quarter of 2015, according to the "advance" estimate released by the Bureau of Economic Analysis. In the fourth quarter, real GDP increased 2.2 percent. The two major consumer confidence measures both suggest consumers are more optimistic regarding the state of the economy. The Conference Board index of consumer confidence increased for a second straight month, rising 9.8 points to 102.9 in January. This is its highest reading since August 2007. After increasing for six straight months, the University of Michigan consumer sentiment index declined 4.5 points to 93.6 in February. However, this is still the second highest reading for the index since January 2007.
Continued employment gains indicate a strengthening labor market. The Washington economy added 31,600 jobs in the three months since the November forecast was adopted, 13,300 more than the 18,300 expected in the forecast. Washington employment is expected to grow 2.9 percent. The upward revision to growth in 2015 (2.3 percent was expected in the November forecast) is mostly due to higher employment data through January. The February forecast for average annual employment growth from 2016 through 2019 is now 1.6 percent per year.
In March 2015, the state’s unemployment rate was 5.7 percent (preliminary), compared to 6.9 percent in March of last year. Locally, Snohomish County’s employment rate was even better than the state, preliminarily at 4.5 percent, compared to last year’s 5.6 percent. At the close of this first quarter of 2015, Snohomish County’s rate was the second lowest in the state and one of only three counties in the state below 5 percent.
General Fund, fund balance
As previously reported in the 2014 fourth quarter report, general fund, fund balance decreased in 2014 from $21.1 million to $15.3 million. This occurred due to the following issues.
• Revenue shortfalls in Law and Justice • SR 530 slide event • Additional use of fund balance for several emerging issues

4
FIGURE 1: GENERAL FUND PROJECTED ENDING BALANCE RECONCILIATION
The 2015 revenue was adjusted to reflect the reductions that occurred in 2014. Even with these downward adjustments there are issues that occurred in 2014 that are anticipated to continue to be issues in the 2015 budget year. These include shortfalls in Law and Justice and property tax penalties. Year to Date Revenue: Figure 2 on the following page is the first quarter estimate of 2015 projected revenues. Law and Justice revenues (jail and court fees) are projected to be $2.7 million lower than the 2015 Adopted Budget. Charges for detention and corrections have fallen since the fourth quarter of 2013 related to the Sheriff’s decision to reduce inmate population to a more manageable level for inmate and officer health and safety. Partially to offset this decline, the Sheriff has increased rates to account for increased costs related to medical and mental health issues. Court fees are trending $1.1 million below the 2015 Adopted Budget; this decline is primarily in District Court fines and penalties. Property tax penalties are projecting a $1.0 million shortfall in 2015.
The good news for 2015 is that the County anticipates receiving approximately $1.6 million as one-time repayments to the general fund from the state and federal government related to the SR 530 incident. This represents the federal reimbursement and Washington State’s 12.5 percent share of the costs for the SR 530 response.
Included in property tax revenues are amounts for a new courthouse. In 2013, the County issued a $75 million bond to build this courthouse. The second courthouse bond has not been issued. The timing of additional bond issues will be dependent upon the cash flow needs of the project, and projected bond market interest rates. The County’s financial advisors and bond counsel will assist the County in determining the appropriate timing for bonding needs. In the 2015 Adopted Budget, Council reserved $5.0 million for the courthouse project.
Fund Balance Factor Amount
Prelim year end fund balance 12/31/14 $ 15,289,789
Plus projected 2015 revenue $ 226,990,989 Less 2015 Adopted Budget expenditures $(226,122,275) Plus anticipated 2015 under-expenditure $ 3,467,299 Projected year end fund balance 12/31/15 $ 14,575,984 Ratio of fund balance to revenues 12/31/15 6.89% Committed to Courthouse $ 5,049,818

5
FIGURE 2: GENERAL FUND YEAR-TO-DATE REVENUES
2015 Mod Actual Actual YTD Budget Forecast YE Budget Receipts Receipts Estimate Variance Estimate Variance REVENUE SOURCE $ % $ $ $ $ Taxes Property Tax $82,770,710 $ 3,091,697 3.74% $ 4,967,430 $ (1,875,732) $ 82,770,710 $ - Sales Tax 45,474,472 9,787,770 21.52% 9,947,409 (159,639) 44,974,472 (500,000) Law & Justice–Sales Tax 6,704,544 1,462,483 21.81% 1,509,510 (47,027) 6,630,826 (73,718) Leasehold Tax 612,000 (1,247) -0.20% 75,183 (76,430) 612,000 - Real Estate Excise Tax 1,265,000 258,425 20.43% 242,744 15,681 1,346,720 81,720 Gambling Fees 2,022,951 5,554 0.27% - 5,554 2,022,951 - Admission Fees 359,126 40,087 11.16% 36,939 3,148 359,126 - Property Tax Penalties 7,505,780 1,545,337 20.59% 904,850 640,488 6,505,780 (1,000,000) Private Timber Harvest Tax 260,000 73,750 28.37% 62,279 11,470 260,000 - Sub-Total 146,974,583 16,263,858 11.07% 17,746,344 (1,482,486) 145,482,585 (1,491,998) Licenses & Permits Franchise Fees 3,947,210 11,745 0.30% 12,793 (1,048) 3,947,210 - Other Permits 462,000 78,360 16.96% 121,518 (43,158) 297,916 (164,084) Sub-Total 4,409,210 90,105 17.26% 134,311 (44,206) 4,245,126 (164,084) Intergovernmental Revenues Federal Grants 2,402,474 112,696 4.69% 291,396 (178,700) 2,796,584 394,110 State Grants 436,620 75,153 17.21% 61,360 13,793 1,705,258 1,268,638 State Shared Revenues 3,961,967 - 0.00% - - 3,961,967 - Sale of Timber from State 950,000 208,902 21.99% 272,113 (63,211) 950,000 - State Entitlements 527,330 84,352 16.00% 133,964 (49,612) 527,330 - Liquor Profit & Tax 1,425,024 366,616 25.73% 223,920 142,697 1,425,024 - State Criminal Justice 3,010,016 742,457 24.67% 743,906 (1,449) 2,969,828 (40,188) Other Intergovernmental 10,724,588 3,294,137 30.72% 2,708,334 585,803 10,724,588 - Sub-Total 23,438,019 4,884,313 20.84% 4,434,993 449,320 25,060,579 1,622,560 Charges for Service Superior Court Fees 2,781,510 477,334 17.16% 570,969 (93,636) 2,359,336 (422,174) District Court Fees 481,517 162,074 33.66% 114,414 47,660 582,098 100,581 Recording Legal Instr. 1,500,000 391,006 26.07% 338,742 52,264 1,631,432 131,432 Vehicle License Fees 3,600,000 696,756 19.35% 730,149 (33,393) 3,600,000 - Detention & Corrections 11,850,650 2,352,437 19.85% 2,710,916 (358,479) 10,350,650 (1,500,000) Adult Probation 1,568,781 369,737 23.57% 405,899 (36,161) 1,429,018 (139,763) Events Admission Fees 1,424,571 20,477 1.44% 28,640 (8,163) 1,424,571 - Indirect Cost Allocation 6,776,928 1,694,232 25.00% 1,694,232 0 6,776,928 0 Other Charges for Service 4,612,908 775,292 16.81% 655,845 119,447 4,612,908 - Sub-Total 34,596,865 6,939,344 20.06% 7,249,804 (310,461) 32,766,942 (1,829,923) Fines & Forfeits District/Court Fines 6,488,757 1,449,897 22.34% 1,744,096 (294,200) 5,723,997 (764,760) Other Fines 147,865 42,353 28.64% 36,316 6,036 147,865 - Sub-Total 6,636,622 1,492,249 22.49% 1,780,413 (288,164) 5,871,862 (764,760) Miscellaneous Revenues Investment Interest 672,224 160,098 23.82% 148,634 11,464 672,224 - Parking Rental 683,744 17,247 2.52% 19,191 (1,944) 683,744 - Space Facilities Rentals 1,420,233 336,898 23.72% 271,123 65,775 1,420,233 - Interfund Rents/Concess’ns 1,270,657 160,030 12.59% 66,740 93,290 1,270,657 - Other Misc. Revenue 2,274,808 284,889 12.52% 412,910 (128,021) 2,274,808 - Sub-Total 6,321,666 959,162 15.17% 918,598 40,564 6,321,666 - Interfund Transfers 7,242,229 220,308 3.04% 1,714,723 (1,494,415) 7,242,229 - Total General Fund Revenues $229,619,194 $ 30,849,338 13.43% $33,979,186 $ (3,129,848) $226,990,989 $(2,628,205)
.

6
Year to Date Expenditures:
General fund year-to-date expenditures are running at 24.3% through the end of the first quarter. The 2015 Adopted Budget includes approximately $2.0 million of unallocated reductions spread across the departments. Department heads are providing reports monthly to show their progress in achieving these unallocated reductions. In addition, the Adopted Budget also anticipates an aggregate 1.5% of additional under-expenditure. This will be a challenge to achieve in addition to the unallocated reductions. The Sheriff’s Office has indicated that they are currently projecting to exceed their budget by an excess of $1.0 million.

7
FIGURE 3: GENERAL FUND FIVE YEAR PROJECTION
Real Estate Excise Tax
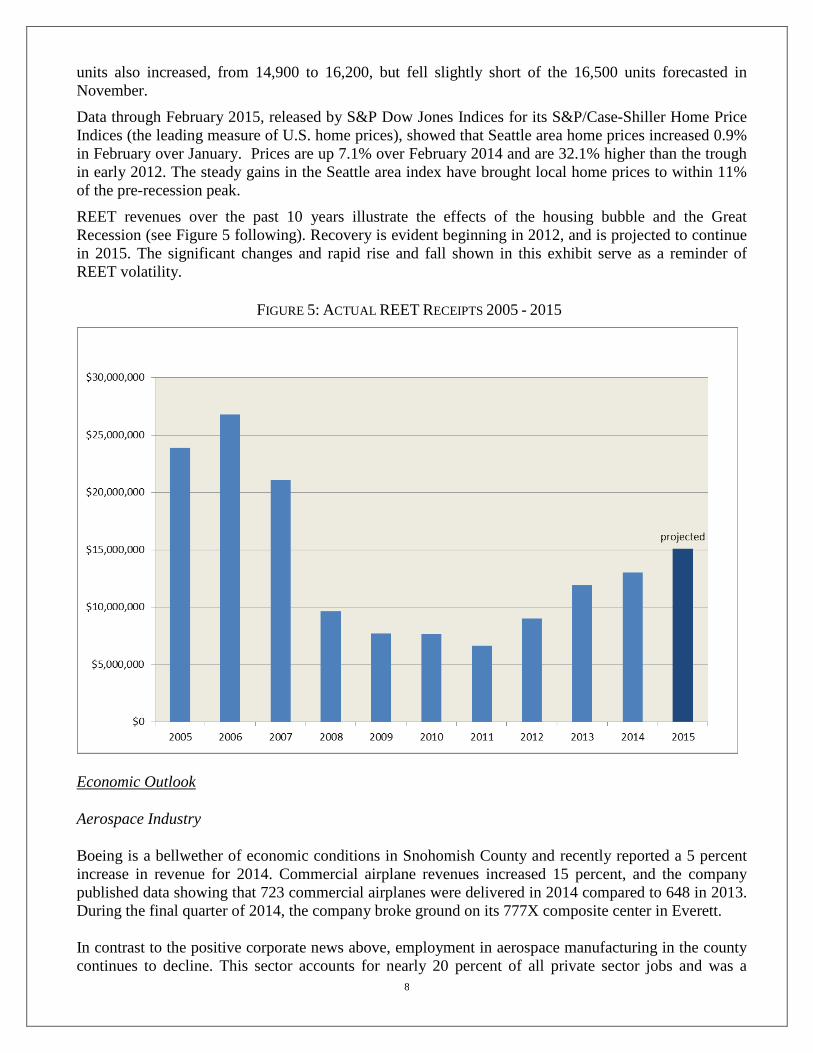
Real estate excise tax (REET) is an important source of revenue for the County and an indicator of the strength of the Snohomish County economy. In 2014, REET revenues were stronger than expected, and the 2015 projection continues that trend.
FIGURE 4: REAL ESTATE EXCISE TAX REVENUES
Element 2015 Actual YTD Receipts –Through March 2015 $ 3,175,000 2015 Budgeted Amount for Full Year 13,200,000 Projected Year End Surplus (Shortfall) $ 1,683,000
Housing construction improved in the fourth quarter of 2014. The number of housing units authorized by building permits increased to 35,000 (SAAR) in the fourth quarter from 32,600 in the third quarter. The previous November 2014 forecast predicted 34,100 units. The number of single-family units increased from 17,700 to 18,800, exceeding the forecast of 17,600 units. The number of multi-family
8
units also increased, from 14,900 to 16,200, but fell slightly short of the 16,500 units forecasted in November.
Data through February 2015, released by S&P Dow Jones Indices for its S&P/Case-Shiller Home Price Indices (the leading measure of U.S. home prices), showed that Seattle area home prices increased 0.9% in February over January. Prices are up 7.1% over February 2014 and are 32.1% higher than the trough in early 2012. The steady gains in the Seattle area index have brought local home prices to within 11% of the pre-recession peak.
REET revenues over the past 10 years illustrate the effects of the housing bubble and the Great Recession (see Figure 5 following). Recovery is evident beginning in 2012, and is projected to continue in 2015. The significant changes and rapid rise and fall shown in this exhibit serve as a reminder of REET volatility.
FIGURE 5: ACTUAL REET RECEIPTS 2005 - 2015
Economic Outlook
Aerospace Industry
Boeing is a bellwether of economic conditions in Snohomish County and recently reported a 5 percent increase in revenue for 2014. Commercial airplane revenues increased 15 percent, and the company published data showing that 723 commercial airplanes were delivered in 2014 compared to 648 in 2013. During the final quarter of 2014, the company broke ground on its 777X composite center in Everett. In contrast to the positive corporate news above, employment in aerospace manufacturing in the county continues to decline. This sector accounts for nearly 20 percent of all private sector jobs and was a

9
primary driver of the county’s early economic recovery following the Great Recession. Despite its importance, employment in this sector fell by 1,300 jobs between March 2014 and March 2015, a larger drop than any other industry in the County. According to state economists, the downward pace of manufacturing employment is the continuation of trends which began in 2012. However, the fact that the recovery continues to move forward despite these declines shows the resilience of Snohomish County’s economy.
Employment
Estimates from the State’s Employment Security Department show Washington employment increasing by 100,900 jobs from March 2014 through March 2015. Year over year, the private sector added 88,900 jobs while the public sector gained an estimated 12,000 jobs. Washington’s preliminary seasonally adjusted unemployment rate for March 2015 is 5.9 percent.
The Snohomish County unemployment rate (not seasonally adjusted) was 4.5 percent for March 2015. This is better than the 5.6 percent rate seen in March 2014. The graphic below shows the unemployment history for Snohomish County for the last three years. It shows that employment conditions continue to improve each year.
FIGURE 6: SNOHOMISH COUNTY UNEMPLOYMENT RATE 2013-2015
Note: Data are not seasonally adjusted. Source: Washington State Employment Security Department, April 2015.
10
County Taxable Retail Sales
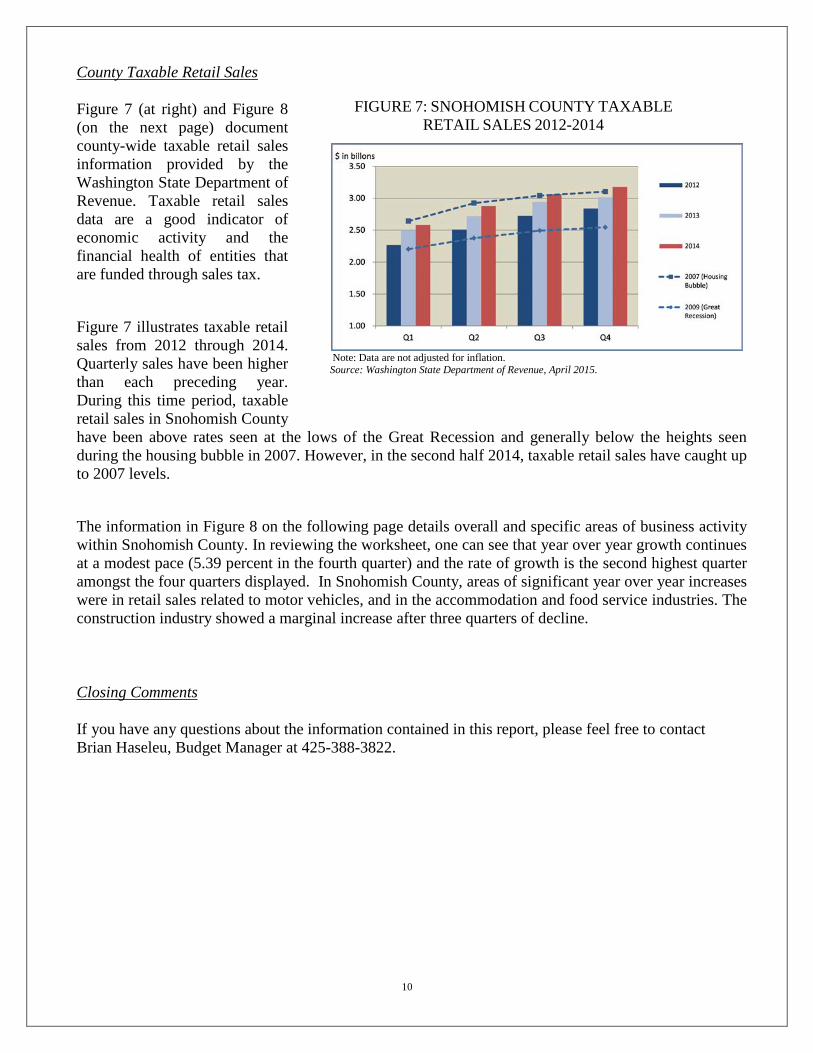
Figure 7 (at right) and Figure 8 (on the next page) document county-wide taxable retail sales information provided by the Washington State Department of Revenue. Taxable retail sales data are a good indicator of economic activity and the financial health of entities that are funded through sales tax.
Figure 7 illustrates taxable retail sales from 2012 through 2014. Quarterly sales have been higher than each preceding year. During this time period, taxable retail sales in Snohomish County have been above rates seen at the lows of the Great Recession and generally below the heights seen during the housing bubble in 2007. However, in the second half 2014, taxable retail sales have caught up to 2007 levels.
The information in Figure 8 on the following page details overall and specific areas of business activity within Snohomish County. In reviewing the worksheet, one can see that year over year growth continues at a modest pace (5.39 percent in the fourth quarter) and the rate of growth is the second highest quarter amongst the four quarters displayed. In Snohomish County, areas of significant year over year increases were in retail sales related to motor vehicles, and in the accommodation and food service industries. The construction industry showed a marginal increase after three quarters of decline.
Closing Comments
If you have any questions about the information contained in this report, please feel free to contact Brian Haseleu, Budget Manager at 425-388-3822.
FIGURE 7: SNOHOMISH COUNTY TAXABLE
RETAIL SALES 2012-2014
Note: Data are not adjusted for inflation. Source: Washington State Department of Revenue, April 2015.

11
FIGURE 8: FOURTH QUARTER 2014 SNOHOMISH COUNTY TAXABLE RETAIL SALES
Source: Washington State Department of Revenue, April 2015.
’14 / ’13 ’14 / ’13 ’14 / ’13 ’14 / ’13 2014 Year to Year Comparison % Change % Change % Change % Change 4th Qtr Gross Sales 1st Qtr 2nd Qtr 3rd Qtr 4th Qtr Actual $ Retail Trade 4.45% 7.45% 6.69% 6.13% $1,774,547,451
Motor Vehicles & Parts 6.57% 10.80% 11.43% 8.99% 417,321,811 New & Used Auto Dealers 10.47% 11.39% 15.04% 10.19% 349,409,169 Rv, Boat, Motorcycle Dealers 1.83% 16.98% -7.48% 15.03% 19,761,922 Automotive Parts & Tire -12.91% 2.71% 1.58% -0.96% 48,150,720
Furniture & Home Furnishing 6.38% -0.05% 4.40% 3.21% 56,972,677 Electronics & Appliances 7.97% 13.37% 7.27% 15.07% 92,765,723 Building , Garden Equip & Supplies 4.50% 8.38% 11.58% 12.34% 123,690,077
Building Materials 4.28% 7.81% 9.97% 12.15% 109,777,393 Garden Supplies & Equip. 6.54% 12.23% 28.07% 13.83% 13,912,684
Food & Beverage Stores 7.96% 5.15% 3.14% 5.28% 99,771,409 Grocery & Convenience Stores 5.53% 3.10% 2.96% 5.94% 90,557,285 Other Food & Beverage Stores 50.81% 35.04% 5.16% -0.84% 9,214,124
Drug/Health Stores 3.19% 9.95% 11.17% 12.22% 59,945,278 Gas Stations & Convenience Stores -0.18% 1.76% 2.54% 2.02% 34,745,984 Apparel & Accessories -0.03% 7.07% 2.65% -0.84% 191,831,310
Clothing & Shoe Stores -0.36% 7.79% 2.91% -0.49% 162,960,474 Jewelry & Luggage Stores 1.92% 2.90% 0.95% -2.76% 28,870,836
Sports, Toys, Book & Music Stores 2.78% 5.90% -1.20% 2.32% 90,042,495 Sporting Goods, Toys, Hobby 1.26% 5.40% -0.38% 2.40% 84,938,864 Book/Periodical/Music Store 25.12% 13.81% -10.89% 1.12% 5,103,631
General Merchandise Stores -0.92% 4.61% 4.03% 2.92% 378,612,430 Department Stores -8.84% -0.04% -1.50% -1.28% 101,215,519 General Merchandise Stores 2.20% 6.39% 5.95% 4.54% 277,396,911
E-Commerce & Mail Order 23.93% 24.51% 17.46% 17.93% 71,008,503 Miscellaneous Retailers 6.70% 1.47% 3.28% 4.19% 157,839,754
Agriculture, Forestry, Fishing 162.10% 46.94% 25.04% -27.70% 1,774,872 Mining -25.67% 19.47% -1.22% 128.92% 1,369,677 Utilities 10.69% 10.23% -4.86% -0.57% 1,616,933 Construction -9.81% -5.68% -5.86% 1.28% 413,572,885 Manufacturing 6.93% 1.38% 4.89% 21.37% 52,739,528 Wholesale Trade 5.68% 9.75% 8.61% 3.15% 178,642,814 Transportation & Warehousing 6.76% 4.22% -7.53% 10.52% 8,082,014 Information 17.73% 9.22% -2.58% 1.34% 139,192,365 Finance, Insurance -4.64% -8.88% 1.46% 16.71% 19,353,468 Real Estate, Rental/Leasing 5.15% 12.57% -1.66% 3.82% 54,001,274 Professional, Scientific & Technical Srvcs 16.83% 32.79% 12.97% -2.41% 45,547,335 Management, Education & Health Srvcs -6.57% -1.45% -2.84% 3.47% 65,198,377 Arts, Entertainment & Recreation 2.01% 4.08% -0.10% 6.37% 22,752,712 Accommodations & Food Services 4.90% 7.83% 8.90% 8.43% 306,997,785
Accommodations 2.04% 19.26% 17.26% 13.09% 27,348,077 Restaurants, Food & Drinking Places 5.16% 6.65% 7.75% 7.99% 279,649,708
Other Services 5.55% 7.65% 5.23% 7.25% 91,726,169 Public Administration, Other 69.54% 39.41% -8.54% 8.82% 1,123,442
TOTAL ALL INDUSTRIES 3.22% 5.86% 4.23% 5.39% $3,178,239,101
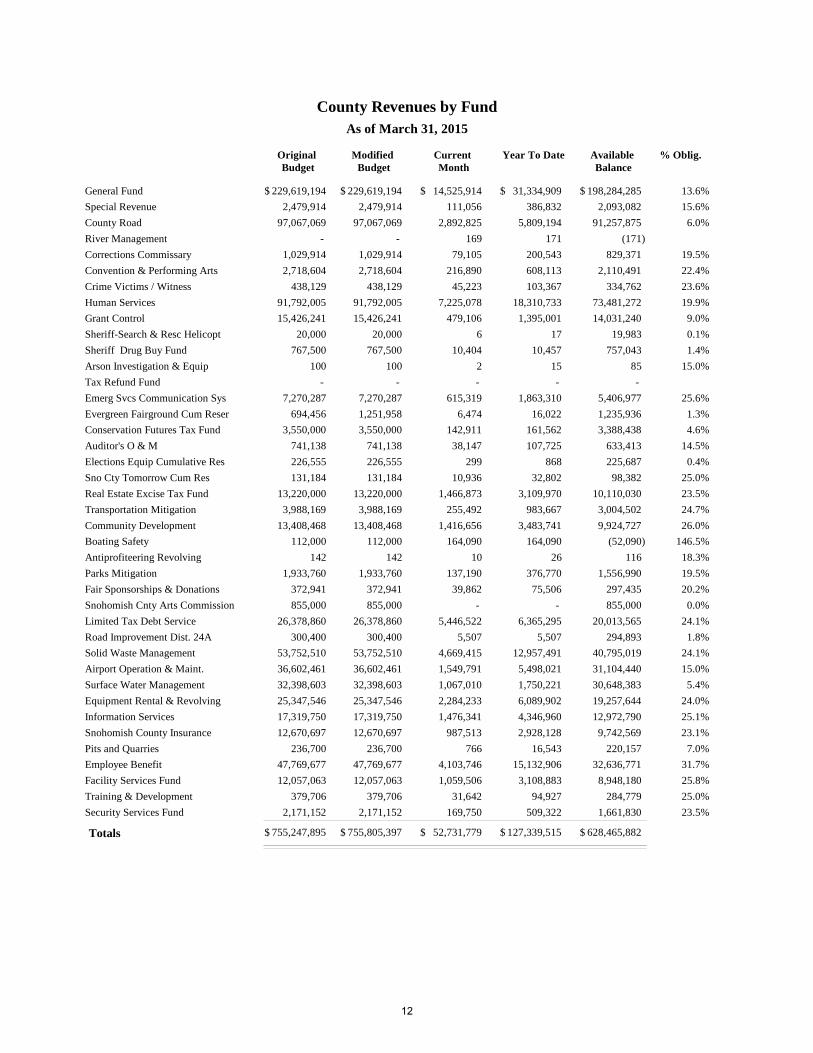
County Revenues by FundAs of March 31, 2015
Original Budget
Modified Budget
Current Month
Year To Date Available Balance
% Oblig.
General Fund 229,619,194 229,619,194 14,525,914 31,334,909 198,284,285 13.6%$ $ $ $$
Special Revenue 2,479,914 2,479,914 111,056 386,832 2,093,082 15.6%
County Road 97,067,069 97,067,069 2,892,825 5,809,194 91,257,875 6.0%
River Management - - 169 171 (171)
Corrections Commissary 1,029,914 1,029,914 79,105 200,543 829,371 19.5%
Convention & Performing Arts 2,718,604 2,718,604 216,890 608,113 2,110,491 22.4%
Crime Victims / Witness 438,129 438,129 45,223 103,367 334,762 23.6%
Human Services 91,792,005 91,792,005 7,225,078 18,310,733 73,481,272 19.9%
Grant Control 15,426,241 15,426,241 479,106 1,395,001 14,031,240 9.0%
Sheriff-Search & Resc Helicopt 20,000 20,000 6 17 19,983 0.1%
Sheriff Drug Buy Fund 767,500 767,500 10,404 10,457 757,043 1.4%
Arson Investigation & Equip 100 100 2 15 85 15.0%
Tax Refund Fund - - - - -
Emerg Svcs Communication Sys 7,270,287 7,270,287 615,319 1,863,310 5,406,977 25.6%
Evergreen Fairground Cum Reser 694,456 1,251,958 6,474 16,022 1,235,936 1.3%
Conservation Futures Tax Fund 3,550,000 3,550,000 142,911 161,562 3,388,438 4.6%
Auditor's O & M 741,138 741,138 38,147 107,725 633,413 14.5%
Elections Equip Cumulative Res 226,555 226,555 299 868 225,687 0.4%
Sno Cty Tomorrow Cum Res 131,184 131,184 10,936 32,802 98,382 25.0%
Real Estate Excise Tax Fund 13,220,000 13,220,000 1,466,873 3,109,970 10,110,030 23.5%
Transportation Mitigation 3,988,169 3,988,169 255,492 983,667 3,004,502 24.7%
Community Development 13,408,468 13,408,468 1,416,656 3,483,741 9,924,727 26.0%
Boating Safety 112,000 112,000 164,090 164,090 (52,090) 146.5%
Antiprofiteering Revolving 142 142 10 26 116 18.3%
Parks Mitigation 1,933,760 1,933,760 137,190 376,770 1,556,990 19.5%
Fair Sponsorships & Donations 372,941 372,941 39,862 75,506 297,435 20.2%
Snohomish Cnty Arts Commission 855,000 855,000 - - 855,000 0.0%
Limited Tax Debt Service 26,378,860 26,378,860 5,446,522 6,365,295 20,013,565 24.1%
Road Improvement Dist. 24A 300,400 300,400 5,507 5,507 294,893 1.8%
Solid Waste Management 53,752,510 53,752,510 4,669,415 12,957,491 40,795,019 24.1%
Airport Operation & Maint. 36,602,461 36,602,461 1,549,791 5,498,021 31,104,440 15.0%
Surface Water Management 32,398,603 32,398,603 1,067,010 1,750,221 30,648,383 5.4%
Equipment Rental & Revolving 25,347,546 25,347,546 2,284,233 6,089,902 19,257,644 24.0%
Information Services 17,319,750 17,319,750 1,476,341 4,346,960 12,972,790 25.1%
Snohomish County Insurance 12,670,697 12,670,697 987,513 2,928,128 9,742,569 23.1%
Pits and Quarries 236,700 236,700 766 16,543 220,157 7.0%
Employee Benefit 47,769,677 47,769,677 4,103,746 15,132,906 32,636,771 31.7%
Facility Services Fund 12,057,063 12,057,063 1,059,506 3,108,883 8,948,180 25.8%
Training & Development 379,706 379,706 31,642 94,927 284,779 25.0%
Security Services Fund 2,171,152 2,171,152 169,750 509,322 1,661,830 23.5%
755,247,895 755,805,397 52,731,779 127,339,515 628,465,882Totals $ $ $ $$
12

County Expenditures by FundAs of March 31, 2015
Original Budget
Modified Budget
Current Month
Year To Date
Available Balance
% Oblig.
General Fund 226,122,275 226,679,777 19,280,027 55,285,382 171,394,395 24.4%$ $ $ $$
Special Revenue 20,053,573 20,053,573 80,363 178,536 19,875,037 0.9%
County Road 104,321,809 105,066,709 8,958,989 19,145,443 85,921,266 18.2%
River Management 26,888 26,888 6,722 6,722 20,166 25.0%
Corrections Commissary 1,029,914 1,029,914 67,163 206,803 823,111 20.1%
Convention & Performing Arts 2,753,178 2,753,178 267,975 294,694 2,458,484 10.7%
Crime Victims / Witness 438,129 438,129 7,599 101,768 336,361 23.2%
Human Services 95,930,567 95,930,567 7,384,461 18,337,901 77,592,666 19.1%
Grant Control 15,704,657 15,704,657 782,993 2,213,420 13,491,237 14.1%
Sheriff-Search & Resc Helicopt 20,000 20,000 - - 20,000 0.0%
Sheriff Drug Buy Fund 825,000 825,000 134,681 189,145 635,855 22.9%
Arson Investigation & Equip 100 100 - - 100 0.0%
Tax Refund Fund 5,000 5,000 - - 5,000 0.0%
Emerg Svcs Communication Sys 8,319,721 8,319,721 546,438 1,630,208 6,689,513 19.6%
Evergreen Fairground Cum Reser 1,269,848 1,827,350 113,549 122,564 1,704,786 6.7%
Conservation Futures Tax Fund 22,628,857 22,628,857 5,884,321 5,978,007 16,650,850 26.4%
Auditor's O & M 1,224,759 1,224,759 151,383 188,901 1,035,858 15.4%
Elections Equip Cumulative Res 378,000 378,000 37,500 42,525 335,475 11.2%
Sno Cty Tomorrow Cum Res 141,367 141,367 9,930 28,848 112,519 20.4%
Real Estate Excise Tax Fund 15,441,983 15,441,983 3,860,496 3,860,496 11,581,487 25.0%
Transportation Mitigation 7,829,000 7,829,000 - - 7,829,000 0.0%
Community Development 14,220,368 14,286,368 1,083,900 3,101,416 11,184,952 21.7%
Boating Safety 112,000 112,000 824 5,991 106,009 5.3%
Antiprofiteering Revolving 79,245 79,245 - - 79,245 0.0%
Parks Mitigation 1,933,760 1,933,760 483,440 483,440 1,450,320 25.0%
Fair Sponsorships & Donations 372,941 372,941 8,629 18,967 353,974 5.1%
Snohomish Cnty Arts Commission 855,000 855,000 354 3,168 851,832 0.4%
Limited Tax Debt Service 28,116,097 28,116,097 - 622 28,115,475 0.0%
Road Improvement Dist. 24A 300,400 300,400 - 240 300,160 0.1%
Solid Waste Management 55,334,015 55,334,015 1,718,678 8,992,339 46,341,676 16.3%
Airport Operation & Maint. 36,406,966 36,406,966 1,754,447 3,997,068 32,409,898 11.0%
Surface Water Management 40,075,026 40,075,026 1,587,501 3,595,060 36,479,966 9.0%
Equipment Rental & Revolving 25,423,050 25,423,050 1,499,225 3,927,735 21,495,315 15.4%
Information Services 18,108,577 18,108,577 1,407,501 4,781,168 13,327,409 26.4%
Snohomish County Insurance 12,820,127 12,820,127 2,751,172 3,831,134 8,988,993 29.9%
Pits and Quarries 236,525 236,525 2,081 4,819 231,706 2.0%
Employee Benefit 48,143,606 48,143,606 3,443,498 10,850,916 37,292,690 22.5%
Facility Services Fund 12,461,609 12,461,609 1,222,041 2,603,756 9,857,853 20.9%
Training & Development 391,692 391,692 15,819 34,886 356,806 8.9%
Security Services Fund 2,171,554 2,171,554 148,438 404,029 1,767,525 18.6%
822,027,183 823,953,087 64,702,136 154,448,116 669,504,971Totals $ $ $ $$
13

Original Budget
Modified Budget
Current Month
Year To Date
Available Balance
% Oblig.
General Fund Revenues by Department
As of March 31, 2015
Executive 156,990 156,990 39,115 39,121 117,869 24.9%$ $ $ $$
Legislative - - 1 1 (1)
Planning 572,808 572,808 37,637 117,026 455,782 20.4%
Hearing Examiner 376,490 376,490 36,632 103,012 273,478 27.4%
Parks And Recreation 6,660,780 6,660,780 466,550 933,135 5,727,645 14.0%
Assessor 107,022 107,022 1,590 2,490 104,532 2.3%
Auditor 7,206,276 7,206,276 448,969 1,198,746 6,007,530 16.6%
Finance 512,573 512,573 11,995 14,062 498,511 2.7%
Human Resources 127,790 127,790 2 6 127,784 0.0%
Nondepartmental 160,860,977 160,860,977 8,886,057 18,098,128 142,762,849 11.3%
Treasurer 9,016,144 9,016,144 682,575 840,855 8,175,290 9.3%
District Court 8,977,795 8,977,795 810,660 2,104,955 6,872,840 23.4%
Sheriff 15,663,193 15,663,193 1,723,701 3,657,764 12,005,429 23.4%
Prosecuting Attorney 565,089 565,089 54,905 127,576 437,513 22.6%
Office of Public Defense 603,468 603,468 11,077 482,114 121,354 79.9%
Medical Examiner 114,348 114,348 1,144 2,416 111,932 2.1%
Superior Court 1,606,315 1,606,315 148,168 389,243 1,217,072 24.2%
Clerk 3,832,330 3,832,330 277,371 754,913 3,077,417 19.7%
Sheriff's Corrections Bureau 12,404,250 12,404,250 870,264 2,451,504 9,952,746 19.8%
Dept Emergency Management 254,556 254,556 17,500 17,841 236,715 7.0%
229,619,194 229,619,194 14,525,914 31,334,909 198,284,285Totals $ $ $ $$
14

Original Budget
Modified Budget
Current Month
Year To Date
Available Balance
% Oblig.
General Fund Expenditures by Department
As of March 31, 2015
Executive 1,960,824 1,960,824 164,612 496,258 1,464,566 25.3%$ $ $ $$
Legislative 4,262,317 4,262,317 339,883 969,585 3,292,732 22.7%
Human Services 3,742,445 3,742,445 751,258 839,291 2,903,154 22.4%
Planning 4,017,603 4,017,603 319,212 971,841 3,045,762 24.2%
Hearing Examiner 1,046,551 1,046,551 77,777 229,527 817,024 21.9%
Parks And Recreation 9,990,117 9,990,117 777,285 1,785,916 8,204,201 17.9%
Assessor 7,102,774 7,102,774 571,457 1,714,460 5,388,314 24.1%
Auditor 7,508,436 7,508,436 421,459 1,215,283 6,293,153 16.2%
Finance 3,972,230 3,972,230 320,047 926,176 3,046,054 23.3%
Human Resources 2,222,360 2,222,360 172,166 489,439 1,732,921 22.0%
Nondepartmental 11,739,605 12,247,107 1,124,126 2,191,760 10,055,347 17.9%
Treasurer 3,240,546 3,240,546 255,809 810,122 2,430,424 25.0%
District Court 9,308,802 9,308,802 745,659 2,203,515 7,105,287 23.7%
Sheriff 52,540,780 52,540,780 4,236,430 14,202,592 38,338,188 27.0%
Prosecuting Attorney 15,382,092 15,382,092 1,291,350 3,768,549 11,613,543 24.5%
Office of Public Defense 7,813,440 7,813,440 657,965 2,462,430 5,351,010 31.5%
Medical Examiner 2,445,696 2,445,696 175,444 539,368 1,906,328 22.1%
Superior Court 21,711,068 21,761,068 1,847,303 5,350,068 16,411,000 24.6%
Clerk 6,968,347 6,968,347 554,414 1,700,811 5,267,536 24.4%
Sheriff's Corrections Bureau 48,054,845 48,054,845 4,357,275 12,161,492 35,893,353 25.3%
Dept Emergency Management 1,091,397 1,091,397 119,097 256,902 834,495 23.5%
226,122,275 226,679,777 19,280,027 55,285,382 171,394,395Totals $ $ $ $$
15

Original Budget
Modified Budget
Current Month
Year to Date
Available Balance
% Oblig.
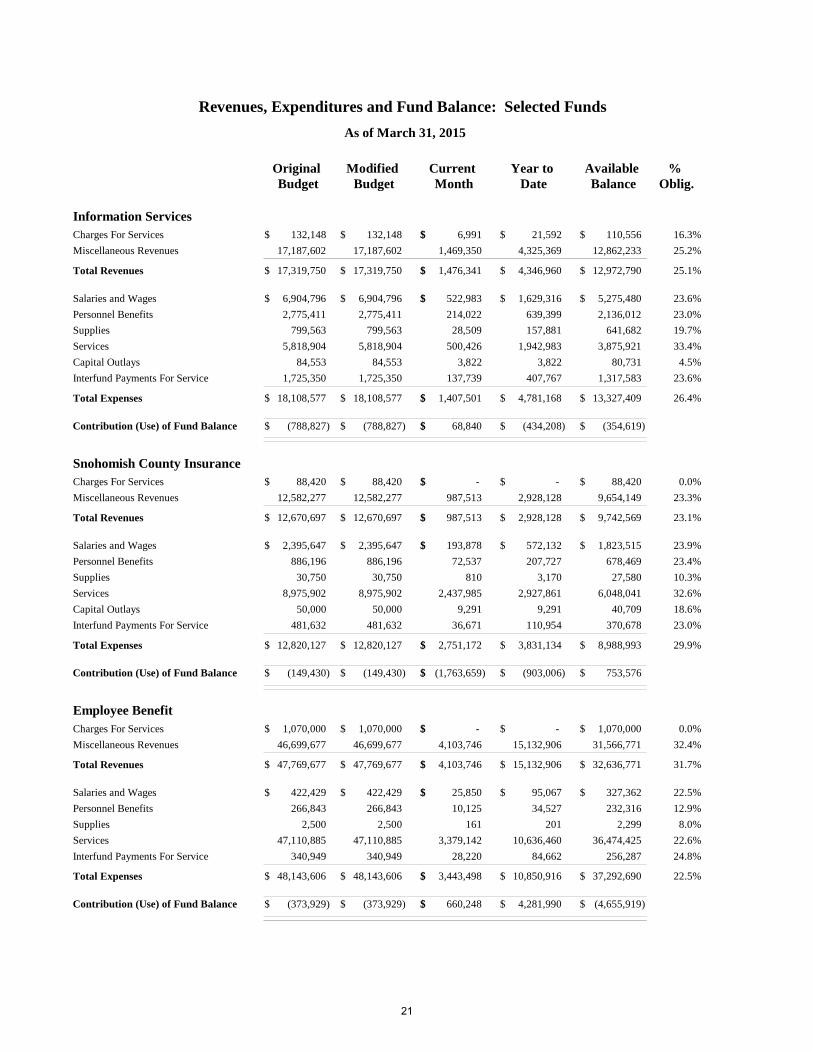
Revenues, Expenditures and Fund Balance: Selected Funds
As of March 31, 2015
General FundTaxes 146,974,583 146,974,583 7,929,492 15,102,199 131,872,384 10.3%$ $$ $$ $
Licenses And Permits 4,409,210 4,409,210 34,111 90,105 4,319,106 2.0%
Intergovernmental Revenue 23,066,897 23,066,897 1,267,014 4,861,600 18,205,297 21.1%
Charges For Services 34,967,987 34,967,987 2,656,474 6,987,817 27,980,170 20.0%
Fines And Forfeits 6,636,986 6,636,986 568,040 1,492,377 5,144,609 22.5%
Miscellaneous Revenues 6,321,302 6,321,302 318,560 990,254 5,331,048 15.7%
Non-Revenues 7,242,229 7,242,229 1,752,224 1,810,557 5,431,672 25.0%
Total Revenues 229,619,194 229,619,194 14,525,914 31,334,909 198,284,285 13.6%$ $$ $$ $
Salaries and Wages 106,951,186 106,974,962 8,783,390 26,486,120 80,488,842 24.8%$ $$ $$ $
Personnel Benefits 44,474,851 44,451,075 3,718,939 10,730,342 33,720,733 24.1%
Supplies 3,502,029 3,502,029 242,483 559,235 2,942,794 16.0%
Services 35,853,394 36,410,896 3,589,061 8,824,551 27,586,345 24.2%
Intergovtl Svcs & Pmts 2,253,400 2,253,400 187,767 563,300 1,690,100 25.0%
Capital Outlays 13,810 13,810 10,893 14,336 (526) 103.8%
Debt Service Costs - - 2,191 3,714 (3,714)
Interfund Payments For Service 33,073,605 33,073,605 2,745,303 8,103,784 24,969,821 24.5%
Total Expenses 226,122,275 226,679,777 19,280,027 55,285,382 171,394,395 24.4%$ $$ $$ $
3,496,919 2,939,417 (4,754,112) (23,950,474) 26,889,891Contribution (Use) of Fund Balance $ $$ $$ $
Special RevenueTaxes 1,055,603 1,055,603 86,691 242,042 813,561 22.9%$ $$ $$ $
Intergovernmental Revenue 336,866 336,866 2,749 47,333 289,533 14.1%
Charges For Services 221,687 221,687 16,231 50,023 171,664 22.6%
Miscellaneous Revenues 860,965 860,965 4,187 46,237 814,728 5.4%
Non-Revenues 4,793 4,793 1,198 1,198 3,595 25.0%
Total Revenues 2,479,914 2,479,914 111,056 386,832 2,093,082 15.6%$ $$ $$ $
Salaries and Wages 178,170 178,170 (7,068) 40,157 138,013 22.5%$ $$ $$ $
Personnel Benefits 69,720 69,720 (561) 16,946 52,774 24.3%
Supplies 261,960 261,960 177 4,269 257,691 1.6%
Services 19,126,119 19,126,119 18,061 27,862 19,098,257 0.1%
Intergovtl Svcs & Pmts - - 68,911 86,776 (86,776)
Capital Outlays 407,500 407,500 - - 407,500 0.0%
Interfund Payments For Service 10,104 10,104 842 2,526 7,578 25.0%
Total Expenses 20,053,573 20,053,573 80,363 178,536 19,875,037 0.9%$ $$ $$ $
(17,573,659) (17,573,659) 30,693 208,297 (17,781,956)Contribution (Use) of Fund Balance $ $$ $$ $
16

Original Budget
Modified Budget
Current Month
Year to Date
Available Balance
% Oblig.
Revenues, Expenditures and Fund Balance: Selected Funds
As of March 31, 2015
County RoadTaxes 57,859,697 57,859,697 2,077,183 2,206,934 55,652,763 3.8%$ $$ $$ $
Intergovernmental Revenue 18,898,735 18,898,735 328,173 2,668,538 16,230,197 14.1%
Charges For Services 6,992,618 6,992,618 162,178 561,921 6,430,697 8.0%
Miscellaneous Revenues 1,393,449 1,393,449 20,536 82,111 1,311,338 5.9%
Non-Revenues 11,872,570 11,872,570 301,043 283,193 11,589,378 2.4%
Insurance Recoveries 50,000 50,000 3,713 6,497 43,503 13.0%
Total Revenues 97,067,069 97,067,069 2,892,825 5,809,194 91,257,875 6.0%$ $$ $$ $
Salaries and Wages 29,163,637 29,163,637 2,002,459 5,947,837 23,215,800 20.4%$ $$ $$ $
Personnel Benefits 11,633,926 11,633,926 901,690 2,615,208 9,018,718 22.5%
Supplies 7,658,962 7,658,962 122,365 436,986 7,221,976 5.7%
Services 19,553,138 19,553,138 3,003,799 3,942,778 15,610,360 20.2%
Capital Outlays 17,033,000 17,777,900 1,520,758 2,073,422 15,704,478 11.7%
Debt Service: Principal 695,584 695,584 - - 695,584 0.0%
Debt Service Costs 37,410 37,410 601 604 36,806 1.6%
Interfund Payments For Service 18,546,152 18,546,152 1,407,318 4,128,609 14,417,543 22.3%
Total Expenses 104,321,809 105,066,709 8,958,989 19,145,443 85,921,266 18.2%$ $$ $$ $
(7,254,740) (7,999,640) (6,066,164) (13,336,249) 5,336,609Contribution (Use) of Fund Balance $ $$ $$ $
Human ServicesTaxes 15,038,752 15,038,752 1,129,559 3,012,545 12,026,207 20.0%$ $$ $$ $
Intergovernmental Revenue 61,020,111 61,020,111 4,913,108 13,367,748 47,652,363 21.9%
Charges For Services 5,852,507 5,852,507 406,712 1,088,456 4,764,051 18.6%
Fines And Forfeits 90,244 90,244 4,450 16,250 73,994 18.0%
Miscellaneous Revenues 6,892,030 6,892,030 49,159 103,644 6,788,386 1.5%
Non-Revenues 2,898,361 2,898,361 722,090 722,090 2,176,271 24.9%
Total Revenues 91,792,005 91,792,005 7,225,078 18,310,733 73,481,272 19.9%$ $$ $$ $
Salaries and Wages 14,985,886 14,985,886 1,187,428 3,371,801 11,614,085 22.5%$ $$ $$ $
Personnel Benefits 6,516,216 6,516,216 528,969 1,458,801 5,057,415 22.4%
Supplies 433,266 433,266 22,068 49,907 383,359 11.5%
Services 69,831,498 69,831,498 5,288,215 12,451,864 57,379,634 17.8%
Intergovtl Svcs & Pmts 110,000 110,000 - - 110,000 0.0%
Capital Outlays - - 23,991 23,991 (23,991)
Interfund Payments For Service 4,053,701 4,053,701 333,790 981,538 3,072,163 24.2%
Total Expenses 95,930,567 95,930,567 7,384,461 18,337,901 77,592,666 19.1%$ $$ $$ $
(4,138,562) (4,138,562) (159,382) (27,168) (4,111,394)Contribution (Use) of Fund Balance $ $$ $$ $
17

Original Budget
Modified Budget
Current Month
Year to Date
Available Balance
% Oblig.
Revenues, Expenditures and Fund Balance: Selected Funds
As of March 31, 2015
Real Estate Excise Tax FundTaxes 13,200,000 13,200,000 1,463,686 3,100,993 10,099,007 23.5%$ $$ $$ $
Interest and Other Earnings 20,000 20,000 3,187 8,977 11,023 44.9%
Total Revenues 13,220,000 13,220,000 1,466,873 3,109,970 10,110,030 23.5%$ $$ $$ $
Services 15,441,983 15,441,983 3,860,496 3,860,496 11,581,487 25.0%$ $$ $$ $
Total Expenses 15,441,983 15,441,983 3,860,496 3,860,496 11,581,487 25.0%$ $$ $$ $
(2,221,983) (2,221,983) (2,393,623) (750,525) (1,471,458)Contribution (Use) of Fund Balance $ $$ $$ $
Transportation MitigationIntergovernmental Revenue 554,748 554,748 20,545 20,545 534,203 3.7%$ $$ $$ $
Charges For Services 3,380,244 3,380,244 228,272 945,252 2,434,992 28.0%
Miscellaneous Revenues 53,177 53,177 6,674 17,869 35,308 33.6%
Total Revenues 3,988,169 3,988,169 255,492 983,667 3,004,502 24.7%$ $$ $$ $
Services 7,829,000 7,829,000 - - 7,829,000 0.0%$ $$ $$ $
Total Expenses 7,829,000 7,829,000 - - 7,829,000 0.0%$ $$ $$ $
(3,840,831) (3,840,831) 255,492 983,667 (4,824,498)Contribution (Use) of Fund Balance $ $$ $$ $
Community DevelopmentLicenses And Permits 373,684 373,684 - - 373,684 0.0%$ $$ $$ $
Intergovernmental Revenue 14,000 14,000 1,998 4,654 9,346 33.2%
Charges For Services 12,964,884 12,964,884 1,405,697 3,455,853 9,509,031 26.7%
Fines And Forfeits - - 175 225 (225)
Miscellaneous Revenues 55,900 55,900 8,787 23,009 32,891 41.2%
Total Revenues 13,408,468 13,408,468 1,416,656 3,483,741 9,924,727 26.0%$ $$ $$ $
Salaries and Wages 7,252,414 7,252,414 548,859 1,608,594 5,643,820 22.2%$ $$ $$ $
Personnel Benefits 3,008,499 3,008,499 225,840 647,785 2,360,714 21.5%
Supplies 512,807 512,807 29,170 56,022 456,785 10.9%
Services 870,004 936,004 73,162 177,218 758,786 18.9%
Interfund Payments For Service 2,576,644 2,576,644 206,869 611,796 1,964,848 23.7%
Total Expenses 14,220,368 14,286,368 1,083,900 3,101,416 11,184,952 21.7%$ $$ $$ $
(811,900) (877,900) 332,756 382,325 (1,260,225)Contribution (Use) of Fund Balance $ $$ $$ $
18

Original Budget
Modified Budget
Current Month
Year to Date
Available Balance
% Oblig.
Revenues, Expenditures and Fund Balance: Selected Funds
As of March 31, 2015
Solid Waste ManagementIntergovernmental Revenue 814,305 814,305 12,500 12,500 801,805 1.5%$ $$ $$ $
Charges For Services 52,083,305 52,083,305 4,594,036 12,764,011 39,319,294 24.5%
Fines And Forfeits - - - 2 (2)
Miscellaneous Revenues 839,900 839,900 62,879 180,978 658,922 21.5%
Non-Revenues 15,000 15,000 - - 15,000 0.0%
Total Revenues 53,752,510 53,752,510 4,669,415 12,957,491 40,795,019 24.1%$ $$ $$ $
Salaries and Wages 8,301,418 8,301,418 594,047 1,833,859 6,467,559 22.1%$ $$ $$ $
Personnel Benefits 3,866,056 3,866,056 312,912 915,596 2,950,460 23.7%
Supplies 651,560 651,560 79,172 129,051 522,509 19.8%
Services 29,692,823 29,692,823 248,521 4,653,679 25,039,144 15.7%
Intergovtl Svcs & Pmts 780,000 780,000 - - 780,000 0.0%
Capital Outlays 2,162,500 2,162,500 19,494 87,782 2,074,718 4.1%
Debt Service: Principal 2,683,959 2,683,959 - - 2,683,959 0.0%
Debt Service Costs 882,770 882,770 - 11 882,759 0.0%
Interfund Payments For Service 6,312,929 6,312,929 464,532 1,372,361 4,940,568 21.7%
Total Expenses 55,334,015 55,334,015 1,718,678 8,992,339 46,341,676 16.3%$ $$ $$ $
(1,581,505) (1,581,505) 2,950,737 3,965,152 (5,546,657)Contribution (Use) of Fund Balance $ $$ $$ $
Airport Operation & Maint.Intergovernmental Revenue 6,655,537 6,655,537 133,497 280,425 6,375,112 4.2%$ $$ $$ $
Charges For Services 5,388,100 5,388,100 72,353 1,288,074 4,100,026 23.9%
Miscellaneous Revenues 16,608,824 16,608,824 1,330,176 3,898,680 12,710,144 23.5%
Non-Revenues 7,950,000 7,950,000 13,765 30,843 7,919,157 0.4%
Total Revenues 36,602,461 36,602,461 1,549,791 5,498,021 31,104,440 15.0%$ $$ $$ $
Salaries and Wages 4,264,335 4,264,335 322,597 1,004,776 3,259,559 23.6%$ $$ $$ $
Personnel Benefits 1,562,288 1,562,288 122,653 361,752 1,200,536 23.2%
Supplies 615,000 615,000 51,444 146,360 468,640 23.8%
Services 5,271,900 5,271,900 379,228 1,047,205 4,224,695 19.9%
Capital Outlays 16,525,000 16,525,000 719,113 1,075,507 15,449,493 6.5%
Debt Service: Principal 3,323,213 3,323,213 - - 3,323,213 0.0%
Debt Service Costs 3,157,462 3,157,462 - 96 3,157,366 0.0%
Interfund Payments For Service 1,687,768 1,687,768 159,412 361,372 1,326,396 21.4%
Total Expenses 36,406,966 36,406,966 1,754,447 3,997,068 32,409,898 11.0%$ $$ $$ $
195,495 195,495 (204,657) 1,500,953 (1,305,458)Contribution (Use) of Fund Balance $ $$ $$ $
19

Original Budget
Modified Budget
Current Month
Year to Date
Available Balance
% Oblig.
Revenues, Expenditures and Fund Balance: Selected Funds
As of March 31, 2015
Surface Water ManagementTaxes 35,570 35,570 2,061 3,005 32,566 8.4%$ $$ $$ $
Intergovernmental Revenue 12,368,148 12,368,148 245,312 246,832 12,121,316 2.0%
Charges For Services 1,684,129 1,684,129 55,424 55,424 1,628,705 3.3%
Miscellaneous Revenues 16,814,738 16,814,738 515,138 1,195,886 15,618,852 7.1%
Non-Revenues 1,496,018 1,496,018 249,075 249,075 1,246,943 16.6%
Total Revenues 32,398,603 32,398,603 1,067,010 1,750,221 30,648,383 5.4%$ $$ $$ $
Salaries and Wages 7,122,629 7,122,629 488,348 1,418,549 5,704,080 19.9%$ $$ $$ $
Personnel Benefits 2,794,317 2,794,317 188,306 549,673 2,244,644 19.7%
Supplies 387,300 387,300 14,157 28,994 358,306 7.5%
Services 6,163,523 6,163,523 464,783 592,093 5,571,430 9.6%
Capital Outlays 14,611,900 14,611,900 3,468 69,114 14,542,786 0.5%
Debt Service: Principal 1,080,923 1,080,923 - - 1,080,923 0.0%
Debt Service Costs 361,473 361,473 - 107 361,366 0.0%
Interfund Payments For Service 7,552,961 7,552,961 428,439 936,529 6,616,432 12.4%
Total Expenses 40,075,026 40,075,026 1,587,501 3,595,060 36,479,966 9.0%$ $$ $$ $
(7,676,423) (7,676,423) (520,491) (1,844,840) (5,831,583)Contribution (Use) of Fund Balance $ $$ $$ $
Equipment Rental & RevolvingCharges For Services 25,022,546 25,022,546 2,046,611 5,836,791 19,185,755 23.3%$ $$ $$ $
Miscellaneous Revenues 45,000 45,000 4,489 10,673 34,327 23.7%
Other Gains 30,000 30,000 233,133 242,438 (212,438) 808.1%
Non-Revenues 250,000 250,000 - - 250,000 0.0%
Total Revenues 25,347,546 25,347,546 2,284,233 6,089,902 19,257,644 24.0%$ $$ $$ $
Salaries and Wages 3,519,009 3,519,009 258,471 794,952 2,724,057 22.6%$ $$ $$ $
Personnel Benefits 1,484,903 1,484,903 119,514 348,169 1,136,734 23.4%
Supplies 7,172,196 7,172,196 565,953 1,174,197 5,997,999 16.4%
Services 538,584 538,584 16,978 55,659 482,925 10.3%
Capital Outlays 5,265,977 5,265,977 18,401 163,832 5,102,145 3.1%
Debt Service: Principal 366,645 366,645 - - 366,645 0.0%
Debt Service Costs 276,120 276,120 - - 276,120 0.0%
Interfund Payments For Service 6,799,616 6,799,616 519,908 1,390,926 5,408,690 20.5%
Total Expenses 25,423,050 25,423,050 1,499,225 3,927,735 21,495,315 15.4%$ $$ $$ $
(75,504) (75,504) 785,008 2,162,166 (2,237,670)Contribution (Use) of Fund Balance $ $$ $$ $
20
Original Budget
Modified Budget
Current Month
Year to Date
Available Balance
% Oblig.
Revenues, Expenditures and Fund Balance: Selected Funds
As of March 31, 2015
Information ServicesCharges For Services 132,148 132,148 6,991 21,592 110,556 16.3%$ $$ $$ $
Miscellaneous Revenues 17,187,602 17,187,602 1,469,350 4,325,369 12,862,233 25.2%
Total Revenues 17,319,750 17,319,750 1,476,341 4,346,960 12,972,790 25.1%$ $$ $$ $
Salaries and Wages 6,904,796 6,904,796 522,983 1,629,316 5,275,480 23.6%$ $$ $$ $
Personnel Benefits 2,775,411 2,775,411 214,022 639,399 2,136,012 23.0%
Supplies 799,563 799,563 28,509 157,881 641,682 19.7%
Services 5,818,904 5,818,904 500,426 1,942,983 3,875,921 33.4%
Capital Outlays 84,553 84,553 3,822 3,822 80,731 4.5%
Interfund Payments For Service 1,725,350 1,725,350 137,739 407,767 1,317,583 23.6%
Total Expenses 18,108,577 18,108,577 1,407,501 4,781,168 13,327,409 26.4%$ $$ $$ $
(788,827) (788,827) 68,840 (434,208) (354,619)Contribution (Use) of Fund Balance $ $$ $$ $
Snohomish County InsuranceCharges For Services 88,420 88,420 - - 88,420 0.0%$ $$ $$ $
Miscellaneous Revenues 12,582,277 12,582,277 987,513 2,928,128 9,654,149 23.3%
Total Revenues 12,670,697 12,670,697 987,513 2,928,128 9,742,569 23.1%$ $$ $$ $
Salaries and Wages 2,395,647 2,395,647 193,878 572,132 1,823,515 23.9%$ $$ $$ $
Personnel Benefits 886,196 886,196 72,537 207,727 678,469 23.4%
Supplies 30,750 30,750 810 3,170 27,580 10.3%
Services 8,975,902 8,975,902 2,437,985 2,927,861 6,048,041 32.6%
Capital Outlays 50,000 50,000 9,291 9,291 40,709 18.6%
Interfund Payments For Service 481,632 481,632 36,671 110,954 370,678 23.0%
Total Expenses 12,820,127 12,820,127 2,751,172 3,831,134 8,988,993 29.9%$ $$ $$ $
(149,430) (149,430) (1,763,659) (903,006) 753,576Contribution (Use) of Fund Balance $ $$ $$ $
Employee BenefitCharges For Services 1,070,000 1,070,000 - - 1,070,000 0.0%$ $$ $$ $
Miscellaneous Revenues 46,699,677 46,699,677 4,103,746 15,132,906 31,566,771 32.4%
Total Revenues 47,769,677 47,769,677 4,103,746 15,132,906 32,636,771 31.7%$ $$ $$ $
Salaries and Wages 422,429 422,429 25,850 95,067 327,362 22.5%$ $$ $$ $
Personnel Benefits 266,843 266,843 10,125 34,527 232,316 12.9%
Supplies 2,500 2,500 161 201 2,299 8.0%
Services 47,110,885 47,110,885 3,379,142 10,636,460 36,474,425 22.6%
Interfund Payments For Service 340,949 340,949 28,220 84,662 256,287 24.8%
Total Expenses 48,143,606 48,143,606 3,443,498 10,850,916 37,292,690 22.5%$ $$ $$ $
(373,929) (373,929) 660,248 4,281,990 (4,655,919)Contribution (Use) of Fund Balance $ $$ $$ $
21

Original Budget
Modified Budget
Current Month
Year to Date
Available Balance
% Oblig.
Revenues, Expenditures and Fund Balance: Selected Funds
As of March 31, 2015
Facility Services FundCharges For Services 10,655,327 10,655,327 902,085 2,684,031 7,971,296 25.2%$ $$ $$ $
Miscellaneous Revenues 1,401,736 1,401,736 157,422 424,853 976,883 30.3%
Total Revenues 12,057,063 12,057,063 1,059,506 3,108,883 8,948,180 25.8%$ $$ $$ $
Salaries and Wages 3,100,876 3,100,876 248,188 722,616 2,378,260 23.3%$ $$ $$ $
Personnel Benefits 1,442,077 1,442,077 119,475 342,207 1,099,870 23.7%
Supplies 591,466 591,466 61,564 133,450 458,016 22.6%
Services 5,676,635 5,676,635 676,952 1,082,118 4,594,517 19.1%
Intergovtl Svcs & Pmts 32,424 32,424 11,245 11,245 21,179 34.7%
Interfund Payments For Service 1,618,131 1,618,131 104,616 312,121 1,306,010 19.3%
Total Expenses 12,461,609 12,461,609 1,222,041 2,603,756 9,857,853 20.9%$ $$ $$ $
(404,546) (404,546) (162,534) 505,127 (909,673)Contribution (Use) of Fund Balance $ $$ $$ $
22
Original Budget
Modified Budget
Current Month
Year To Date
Available Balance
% Oblig
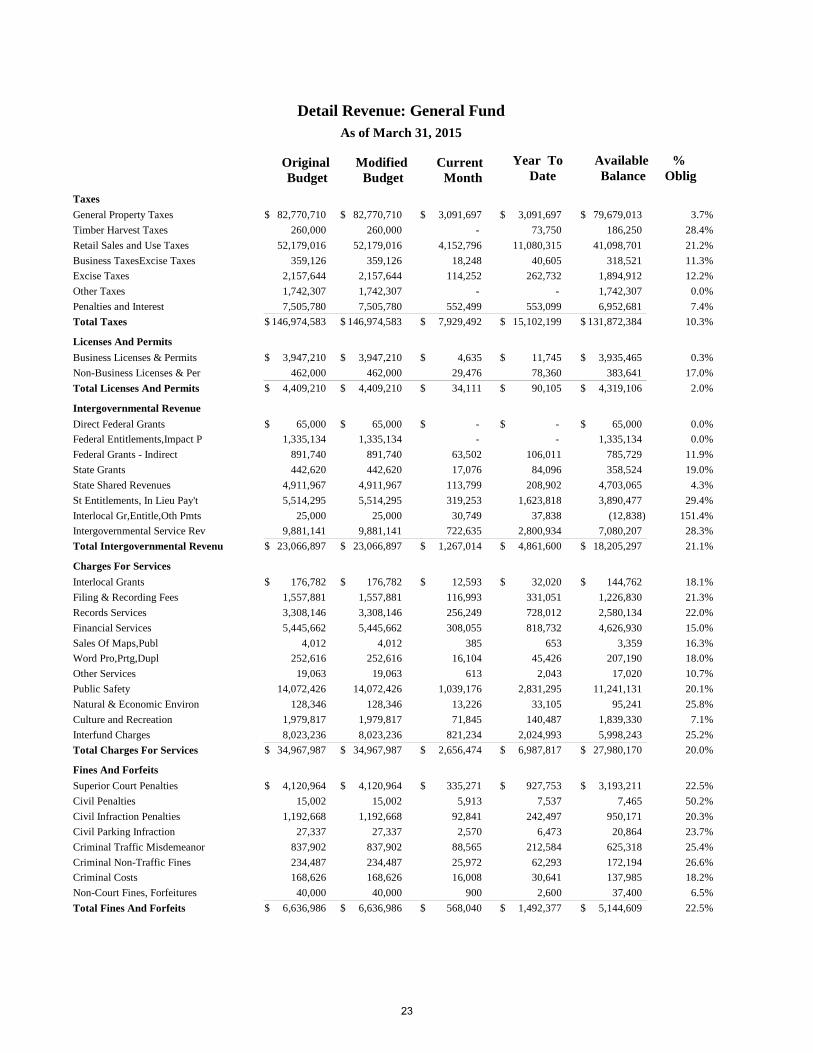
Detail Revenue: General FundAs of March 31, 2015
Taxes
82,770,710 82,770,710 3,091,697 3,091,697 79,679,013General Property Taxes 3.7%$ $ $ $$
260,000 260,000 - 73,750 186,250Timber Harvest Taxes 28.4%
52,179,016 52,179,016 4,152,796 11,080,315 41,098,701Retail Sales and Use Taxes 21.2%
359,126 359,126 18,248 40,605 318,521Business TaxesExcise Taxes 11.3%
2,157,644 2,157,644 114,252 262,732 1,894,912Excise Taxes 12.2%
1,742,307 1,742,307 - - 1,742,307Other Taxes 0.0%
7,505,780 7,505,780 552,499 553,099 6,952,681Penalties and Interest 7.4%
146,974,583 146,974,583 7,929,492 15,102,199 131,872,384Total Taxes 10.3%$ $ $ $$
Licenses And Permits
3,947,210 3,947,210 4,635 11,745 3,935,465Business Licenses & Permits 0.3%$ $ $ $$
462,000 462,000 29,476 78,360 383,641Non-Business Licenses & Per 17.0%
4,409,210 4,409,210 34,111 90,105 4,319,106Total Licenses And Permits 2.0%$ $ $ $$
Intergovernmental Revenue
65,000 65,000 - - 65,000Direct Federal Grants 0.0%$ $ $ $$
1,335,134 1,335,134 - - 1,335,134Federal Entitlements,Impact P 0.0%
891,740 891,740 63,502 106,011 785,729Federal Grants - Indirect 11.9%
442,620 442,620 17,076 84,096 358,524State Grants 19.0%
4,911,967 4,911,967 113,799 208,902 4,703,065State Shared Revenues 4.3%
5,514,295 5,514,295 319,253 1,623,818 3,890,477St Entitlements, In Lieu Pay't 29.4%
25,000 25,000 30,749 37,838 (12,838)Interlocal Gr,Entitle,Oth Pmts 151.4%
9,881,141 9,881,141 722,635 2,800,934 7,080,207Intergovernmental Service Rev 28.3%
23,066,897 23,066,897 1,267,014 4,861,600 18,205,297Total Intergovernmental Revenu 21.1%$ $ $ $$
Charges For Services
176,782 176,782 12,593 32,020 144,762Interlocal Grants 18.1%$ $ $ $$
1,557,881 1,557,881 116,993 331,051 1,226,830Filing & Recording Fees 21.3%
3,308,146 3,308,146 256,249 728,012 2,580,134Records Services 22.0%
5,445,662 5,445,662 308,055 818,732 4,626,930Financial Services 15.0%
4,012 4,012 385 653 3,359Sales Of Maps,Publ 16.3%
252,616 252,616 16,104 45,426 207,190Word Pro,Prtg,Dupl 18.0%
19,063 19,063 613 2,043 17,020Other Services 10.7%
14,072,426 14,072,426 1,039,176 2,831,295 11,241,131Public Safety 20.1%
128,346 128,346 13,226 33,105 95,241Natural & Economic Environ 25.8%
1,979,817 1,979,817 71,845 140,487 1,839,330Culture and Recreation 7.1%
8,023,236 8,023,236 821,234 2,024,993 5,998,243Interfund Charges 25.2%
34,967,987 34,967,987 2,656,474 6,987,817 27,980,170Total Charges For Services 20.0%$ $ $ $$
Fines And Forfeits
4,120,964 4,120,964 335,271 927,753 3,193,211Superior Court Penalties 22.5%$ $ $ $$
15,002 15,002 5,913 7,537 7,465Civil Penalties 50.2%
1,192,668 1,192,668 92,841 242,497 950,171Civil Infraction Penalties 20.3%
27,337 27,337 2,570 6,473 20,864Civil Parking Infraction 23.7%
837,902 837,902 88,565 212,584 625,318Criminal Traffic Misdemeanor 25.4%
234,487 234,487 25,972 62,293 172,194Criminal Non-Traffic Fines 26.6%
168,626 168,626 16,008 30,641 137,985Criminal Costs 18.2%
40,000 40,000 900 2,600 37,400Non-Court Fines, Forfeitures 6.5%
6,636,986 6,636,986 568,040 1,492,377 5,144,609Total Fines And Forfeits 22.5%$ $ $ $$
23

Original Budget
Modified Budget
Current Month
Year To Date
Available Balance
% Oblig
Detail Revenue: General FundAs of March 31, 2015
Miscellaneous Revenues
1,038,386 1,038,386 100,995 305,722 732,664Interest Earnings 29.4%$ $ $ $$
4,136,048 4,136,048 165,121 552,304 3,583,744Rents and Leases 13.4%
6,000 6,000 - - 6,000Interfund Miscellaneous 0.0%
20,923 20,923 1,342 1,988 18,935Special Assessment Principal 9.5%
1,119,945 1,119,945 51,102 130,240 989,705Other 11.6%
6,321,302 6,321,302 318,560 990,254 5,331,048Total Miscellaneous Revenues 15.7%$ $ $ $$
Non-Revenues
7,242,229 7,242,229 1,752,224 1,810,557 5,431,672Operating Transfers 25.0%$ $ $ $$
7,242,229 7,242,229 1,752,224 1,810,557 5,431,672Total Non-Revenues 25.0%$ $ $ $$
229,619,194 229,619,194 14,525,914 31,334,909 198,284,285Total Revenue 13.6%$ $ $ $$
24