Embed Size (px)
Citation preview
1Quarter 1 / 2019
Disclaimer
The information contained in this presentation is strictly confidential and is provided by The Platinum Group Public Company Limited (“PLAT” or the "Company") to you solely for your reference. Neitherthis presentation nor any part thereof may be (i) used or relied upon by any other party or for any other purpose; (ii) copied, photocopied, duplicated or otherwise reproduced in any form or by anymeans; or (iii) redistributed, passed on or otherwise disseminated, to any other person either in your organization or elsewhere, without the prior written consent of the Company and their respectiveaffiliates or advisors. By attending this presentation, participants agree not to remove this document, or any materials provided in connection herewith, from the conference room where suchdocuments are provided without express consent from the Company and their respective affiliates or advisors.
Although care has been taken to ensure that the information in this presentation is accurate, and that the opinions expressed are fair and reasonable, the information is subject to change without notice,its accuracy is not guaranteed, has not been independently verified and it may not contain all material information concerning the Company and its subsidiaries. None of the Company nor any of itsrespective affiliates or advisors nor any of its or their respective members, directors, officers, employees or affiliates make any representation or warranty (express or implied) regarding, nor assumes anyresponsibility or liability for, the accuracy or completeness of, or any errors or omissions in, any information contained herein. Accordingly, none of the above nor any other person accepts any liability (innegligence, or otherwise) for any loss arising from or in connection with any use of this presentation or its contents.
This presentation is for information purposes only and does not constitute or form part of any offer or invitation by or on behalf of the Company for sale or subscription of or solicitation or invitation ofany offer to or recommendation to buy or subscribe for any securities, nor shall it or any part of it form the basis of or be relied on in connection with any contract, commitment or investment decision inrelation thereto in Thailand or any other jurisdiction. Any recipient considering a purchase of securities is hereby reminded that any such purchase should be made solely on the basis of the informationcontained in the final offering document (which may be different from the information contained in this presentation ) and subject to the selling restrictions set out therein. The information in thispresentation does not take into consideration the investment objectives, financial situation or particular needs of any particular investor, and should not be treated as giving investment advice.
In addition, this presentation contains certain financial information and results of operation, and may also contain certain projections, plans, strategies, and objectives of the Company, that are notstatements of historical fact which would be treated as forward looking statements that reflect the Company's current views with respect to future events and financial performance. These views arebased on a number of estimates and current assumptions which are subject to business, economic and competitive uncertainties and contingencies as well as various risks which are in many casesoutside the control of the Company, and which may change over time and may cause actual events and the Company's future results to be materially different than expected or indicated by suchstatements. No assurance can be given that future events will occur, that projections will be achieved, or that the Company's assumptions are correct. Such forward‐looking statements are notguarantees of future performance and accordingly, the actual results, financial condition, performance or achievements of the Company may differ materially from those anticipated by the Company inthe forward looking statements. You are cautioned not to place undue reliance on these forward looking statements.
In providing this document, the Company does not undertake to provide you with access to any additional information or to update the information contained in the document or to correct anyinaccuracies therein which may become apparent.
None of PLAT or any of their respective affiliates or other advisors accepts any liability to any person in relation to the granting of access to, or possession of, this document in any jurisdiction.
2
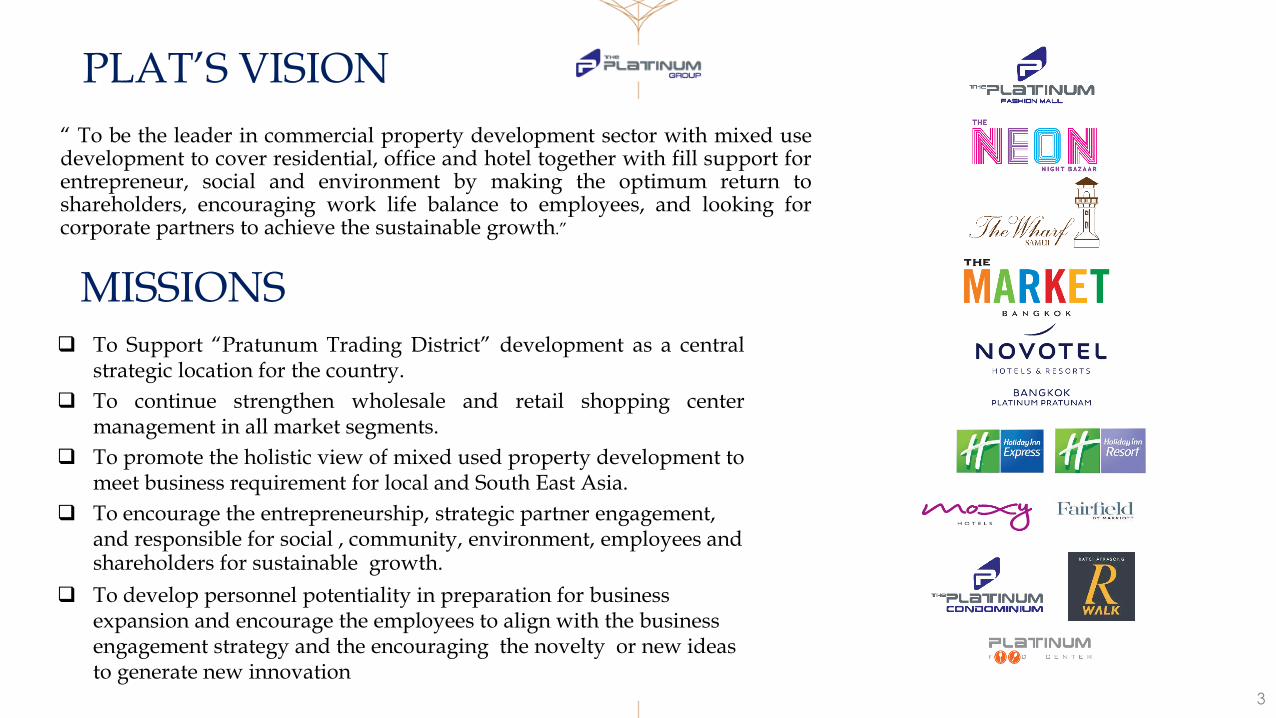
“ To be the leader in commercial property development sector with mixed usedevelopment to cover residential, office and hotel together with fill support forentrepreneur, social and environment by making the optimum return toshareholders, encouraging work life balance to employees, and looking forcorporate partners to achieve the sustainable growth.”
3
PLAT’S VISION
MISSIONS To Support “Pratunum Trading District” development as a central
strategic location for the country.
To continue strengthen wholesale and retail shopping centermanagement in all market segments.
To promote the holistic view of mixed used property development tomeet business requirement for local and South East Asia.
To encourage the entrepreneurship, strategic partner engagement, and responsible for social , community, environment, employees and shareholders for sustainable growth.
To develop personnel potentiality in preparation for business expansion and encourage the employees to align with the business engagement strategy and the encouraging the novelty or new ideas to generate new innovation

Major Shareholders
Choturangkool Family, 49%
Wijithanarak family, 11%
Limpiviwatkul family, 8%
Pongsuthimanus family, 4%
Institutional Investors,
14%
Others, 14%
2,800,000,000Shares
As of Mar 2019
PLAT’S Profile
Symbol “PLAT”
4
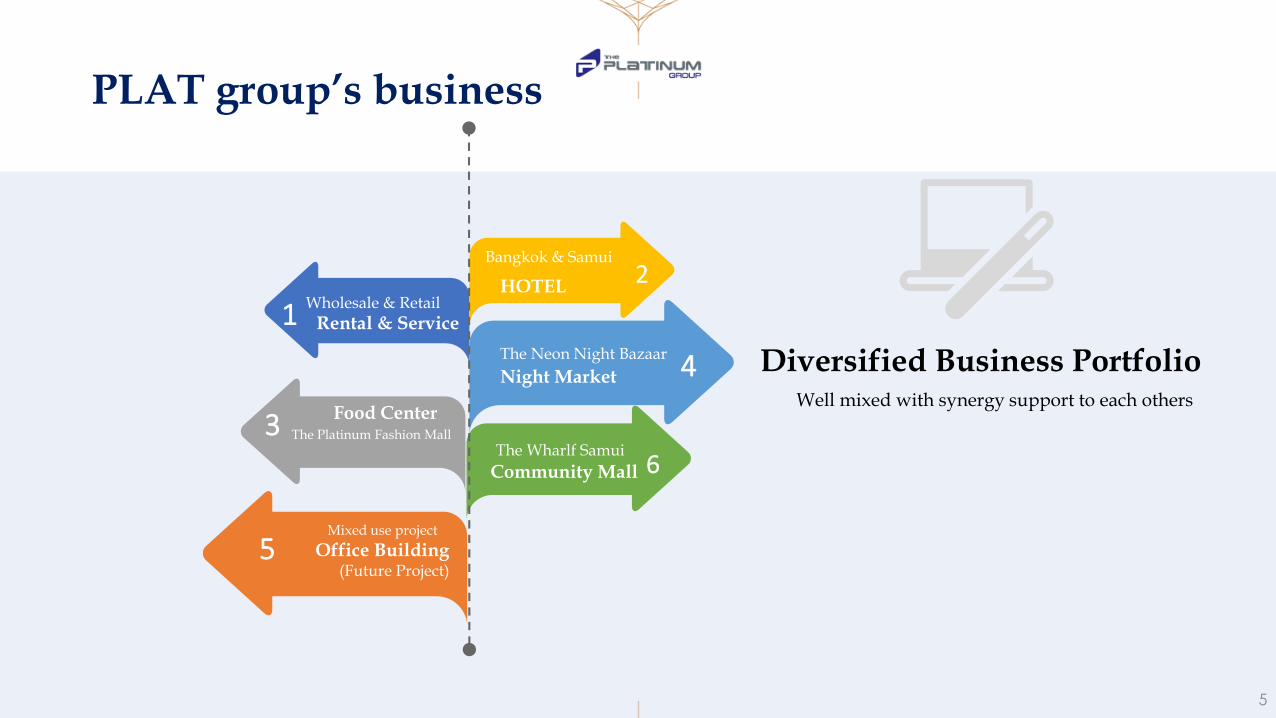
Rental & ServiceWholesale & Retail
Food CenterThe Platinum Fashion Mall
HOTEL
Bangkok & Samui
Night Market
The Neon Night Bazaar
Community MallThe Wharlf Samui
1
3
Office Building(Future Project)
Mixed use project
5
2
4
6
Well mixed with synergy support to each others
Diversified Business Portfolio
PLAT group’s business
5
6
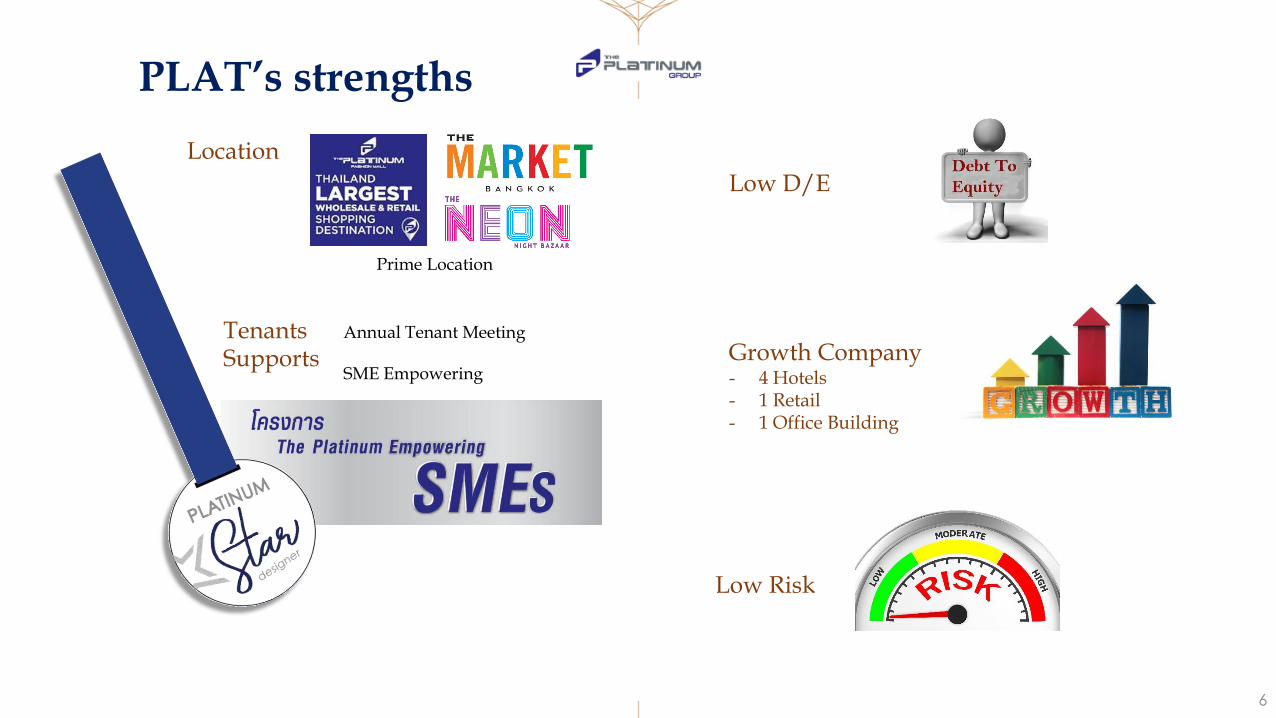
Location
Annual Tenant Meeting
SME Empowering
Prime Location
PLAT’s strengths
Tenants Supports
Low D/E
Low Risk
Growth Company- 4 Hotels- 1 Retail- 1 Office Building
7
Executive Summary
Industry
International Tourism Arrival increased by 2% YoY in Q1/19 to 10.8 Million.
Thailand’s Consumer Confidence Index (CCI) slightly up to 80.7 in Q1/19 from 80.4 inQ4/18. Household debt remained high and affects the spending power of consumers.
Same-store sales growth(SSSG) in Q1/19 of major retailers drop to 12.5% from 14.5% inQ1/18 due to weak domestic consumption.
Source : CBRE, BOT, Ministry of Tourism & Sports
8
Executive Summary
Business
Q1/19 Revenue = 604 MB(+14% YoY), Net Profit = 201MB (-1% YoY)
Q1/19 SG&A per Total Revenue = 17% (0% YoY)
Q1/19 Group’s Revenue proportion : Rental & Service 67%, Hotel Business 19%, F&B 10%, Others 4%
Q1/19 GP Margin = GP Margin 57%, NP Margin 33%
AGENDA
Industry Update
Q4/2018 and Year 2018 Performance Review
Outlook
The Market Project Update
Q&A
Appendix
9
10
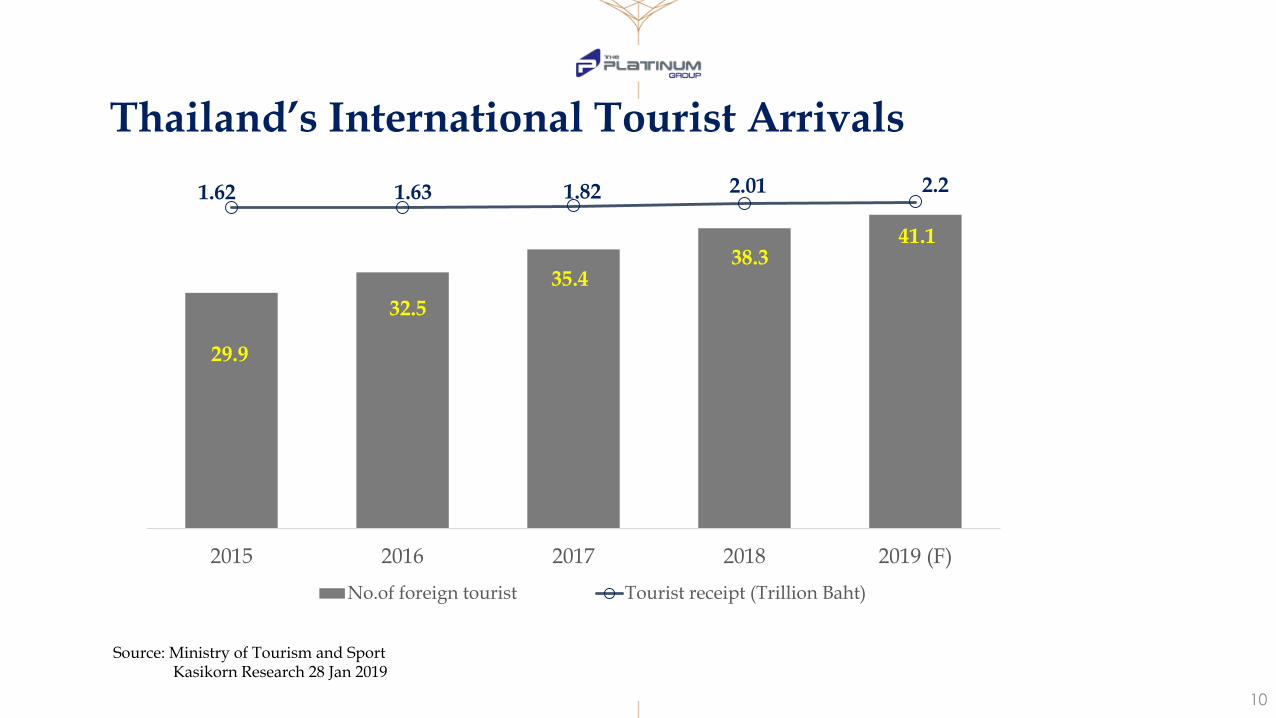
29.9
32.5
35.438.3
41.1
1.62 1.63 1.82 2.01 2.2
-30
-25
-20
-15
-10
-5
0
5
0
5
10
15
20
25
30
35
40
45
2015 2016 2017 2018 2019 (F)
No.of foreign tourist Tourist receipt (Trillion Baht)
Thailand’s International Tourist Arrivals
Source: Ministry of Tourism and SportKasikorn Research 28 Jan 2019
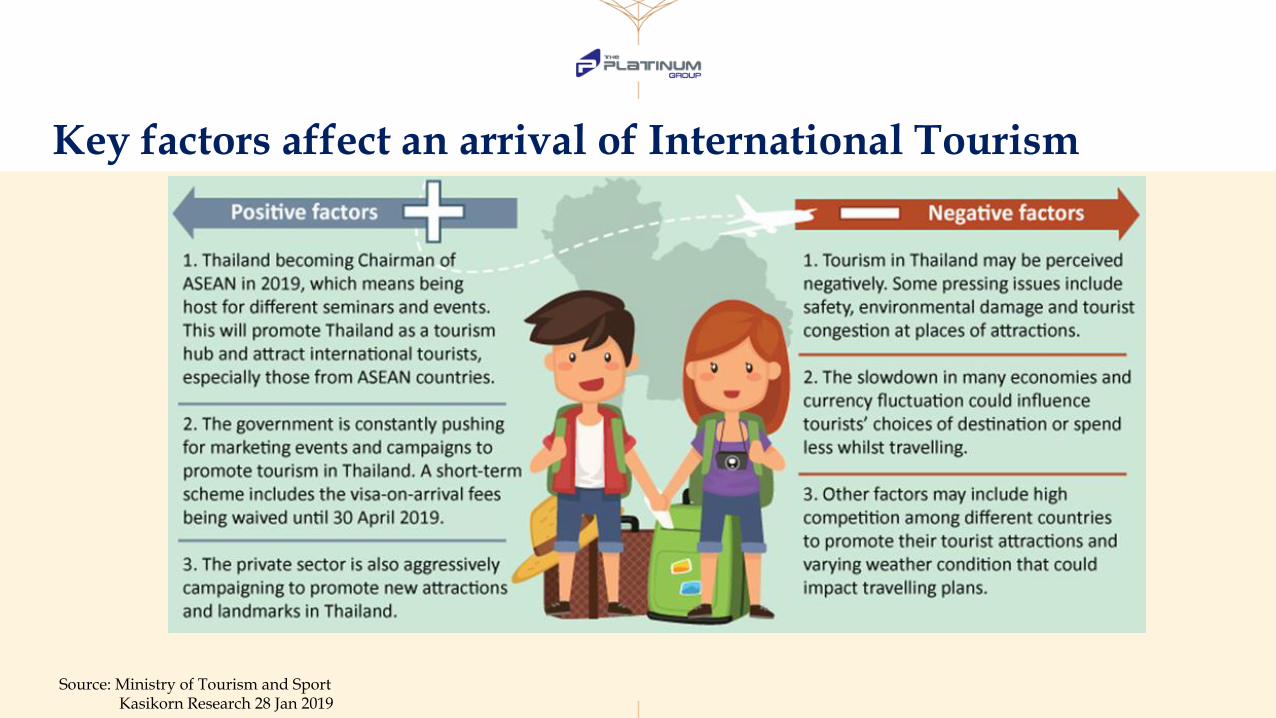
Source: Ministry of Tourism and SportKasikorn Research 28 Jan 2019
Key factors affect an arrival of International Tourism

12
Thailand’s International Tourist Arrivals
Source: Ministry of Tourism and Sport
0
500,000
1,000,000
1,500,000
2,000,000
2,500,000
3,000,000
3,500,000
4,000,000
4,500,000
JAN FEB MAR APR MAY JUN JULY AUG SEP OCT NOV DEC
2015 2016 2017 2018 2019

AGENDA
Industry Update
Q1/2019 Performance view
Outlook
The Market Project Update
Q&A
Appendix13
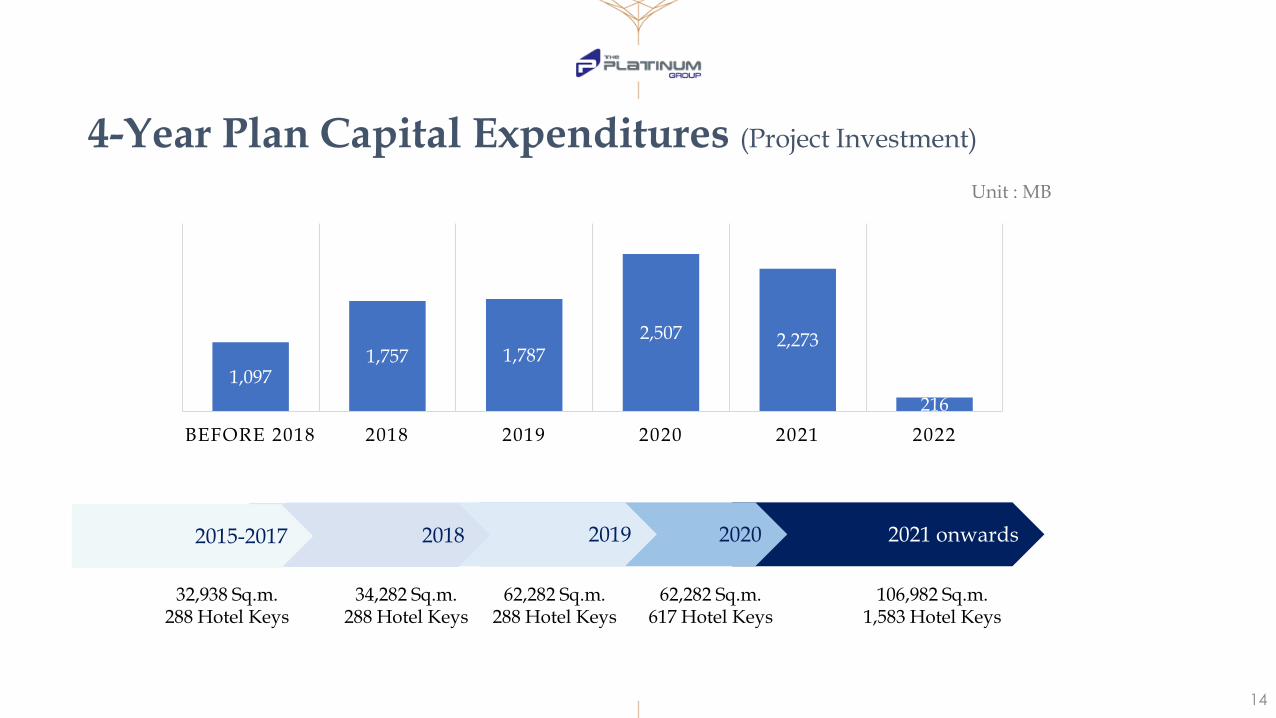
1,0971,757 1,787
2,507 2,273
216
BEFORE 2018 2018 2019 2020 2021 2022
2021 onwards
4-Year Plan Capital Expenditures (Project Investment)
20202019
32,938 Sq.m.288 Hotel Keys
62,282 Sq.m.288 Hotel Keys
62,282 Sq.m.617 Hotel Keys
106,982 Sq.m.1,583 Hotel Keys
14
2018
34,282 Sq.m.288 Hotel Keys
2015-2017
Unit : MB
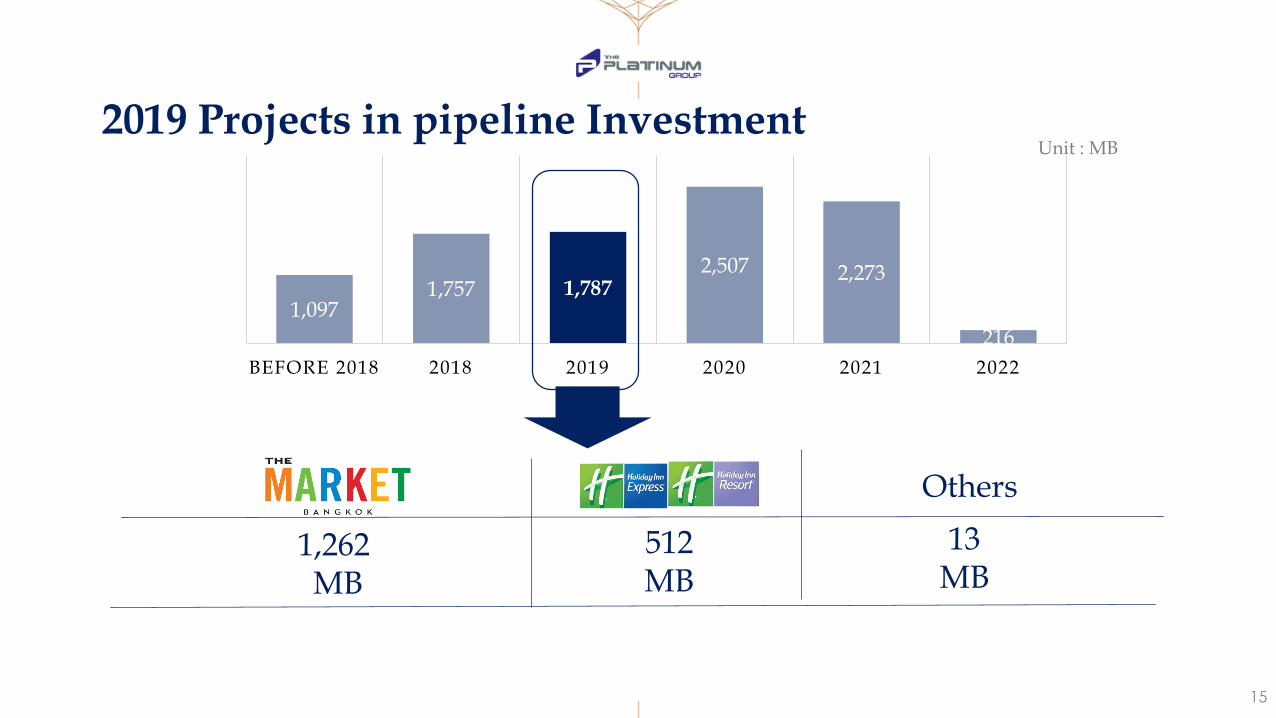
1,0971,757 1,787
2,507 2,273
216
BEFORE 2018 2018 2019 2020 2021 2022
2019 Projects in pipeline Investment
15
1,262 MB
512MB
13MB
Others
Unit : MB

Operate LandOwnership
Leasable Area (sq.m.)
Avg Rental Rate %OCC
The Platinum Fashion Mall
Dec 2005 Freehold 23,087 3,092 97%
Wharf Samui Jan 2015 Leasehold 5,423 543 28%
Neon Night Bazaar Phase 1:Dec 2016Phase 2: Dec 2018
Leasehold 5,772 1,721 83%
The Market BangkokRetail Phase 1
14 February 2019 Leashold 28,000 1,112 77%
Novotel Platinum Pratunam
Nov 2011 Freehold 288 keys 3,472 95%
Current Projects (Q1/2019)
16

Investment value(MB)
Tentative Opening Ownership Leasable Area
The Market Retail Phase 2 1,000 Q2/2021 Leasehold 30 +30 Years ended 2079
6,700 sq.m.
The Platinum Tower @ M2
1,900 Q2/2021 Leasehold 30 +30 Years ended 2079
38,000 sq.m.
Fairfield by Marriot@ M3
1,300 Q2/2021 Leasehold 30 +30 Years ended 2079
434 keys
Moxy Hotel @ M1
1,400 Q2/2021 Leasehold 30 +30 Years ended 2079
532 keys
Holiday Inn Resort Samui 425 Q3/2020 Freehold 127 keys
Holiday Inn Express 475 Q3/2020 Freehold 202 keys
Projects in pipeline
17

Since December 2018, Neon Phase 2 contributes additional NLA 1,344 Sq.m. Since February 2019, The leasable area from Rental &Service business increases from 34,282 sq.m. to 62,282 sq.m. (+82%)
from The Market Bangkok (M1,M2 building).
23,087 23,087 23,087 23,087 23,087
5,423 5,423 5,423 5,423 5,423
4,4285,772 5,772 5,772 5,772
28,000 28,000
34,700
38,000
2017 2018 2019 2020 2021
Platinum Fashion Mall The Wharlf Samui Neon Night BazarRetail@The Market The Platinum Tower (office)
Expansion Plan –Rental & ServiceRental & Service Business ( Sq.m. Leasable Area)
Y201732,938
Y201962,282
Y201834,282
Y2021106,982
Y202062,282
18

Expansion Plan- HotelHotel Business (Keys)
288 288 288 288 288
127 127
202 202
434
532
2017 2018 2019 2020 2021
Novotel BKK Holiday Inn Resort samui Holiday Inn Express Samui Fairefield @ M3 Moxy @ M1
Y2017288
Y2019288
Y2018288
Y20211,583Y2020
617
19
In year 2020, there will be 329 additional keys from Holiday Inn Samui. In year 2021, there will be another 2 hotels in The Market Bangkok project with 966 keys from Moxy
Hotel on M1 and Fairfiled by Marriott on M3 Building.
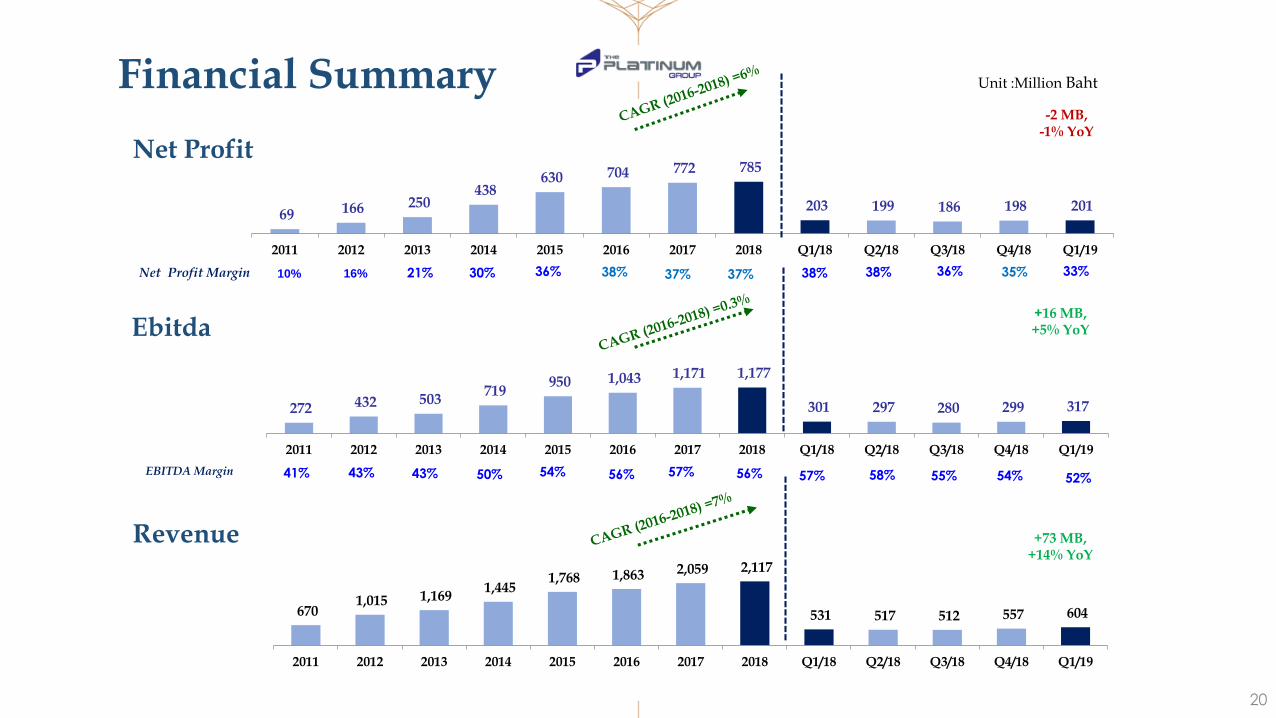
69 166 250 438
630 704 772 785
203 199 186 198 201
2011 2012 2013 2014 2015 2016 2017 2018 Q1/18 Q2/18 Q3/18 Q4/18 Q1/19
272 432 503 719
950 1,043 1,171 1,177
301 297 280 299 317
2011 2012 2013 2014 2015 2016 2017 2018 Q1/18 Q2/18 Q3/18 Q4/18 Q1/19
Financial Summary
670 1,015 1,169
1,445 1,768 1,863 2,059 2,117
531 517 512 557 604
2011 2012 2013 2014 2015 2016 2017 2018 Q1/18 Q2/18 Q3/18 Q4/18 Q1/19
Unit :Million Baht
EBITDA Margin
Net Profit Margin
41% 43% 43% 50% 54%
10% 16% 21% 30% 36%
56%
38%
52%58%
38%
57%
33%
Overview
57%
36%
55%
38% 37% 35%
56% 54%
20
-2 MB,-1% YoY
+73 MB,+14% YoY
37%
+16 MB,+5% YoY
Net Profit
Ebitda
Revenue
59%
20%
13%
8%
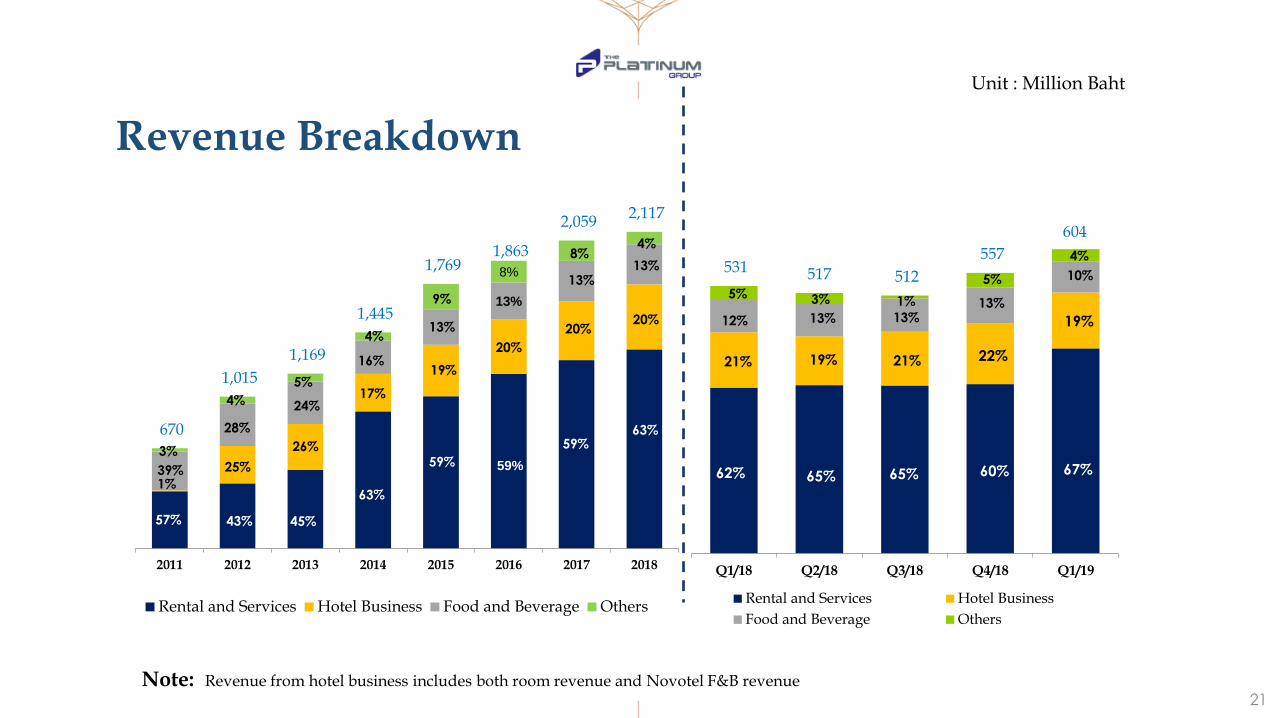
670
1,015
1,169
1,445
1,769 1,863
2,059 2,117
2011 2012 2013 2014 2015 2016 2017 2018
Rental and Services Hotel Business Food and Beverage Others
Note: Revenue from hotel business includes both room revenue and Novotel F&B revenue
Unit : Million Baht
Revenue Breakdown
531 517 512
557
604
Q1/18 Q2/18 Q3/18 Q4/18 Q1/19
Rental and Services Hotel Business
Food and Beverage Others
59%62%
57%
39%
3%
43%
28%
25%
4%
45%
26%
24%
5%
63%
17%
16%
4%
59%
13%
19%
9%
1%
21%
12%
5%
59%
13%
20%
8%
Key
Highlights
Financial
Highlights
Business
Overview
Future
Projects
65%
13%
19%
3%
65%
13%
21%
1%
13%
63%
20%
4%
60%
22%
13%
5%
21
67%
19%
10%
4%

296
454
582
836
992 1,068
1,213 1,307
323 319 326 336 330
2011 2012 2013 2014 2015 2016 2017 2018 Q1/18 Q2/18 Q3/18 Q4/18 Q1/19
62%
-7 MB,-2 % YoY
Gross profit Margin 63% 64%46% 47% 52% 60% 61% 62% 64%
Unit : Million Baht
64% 64%
22
Gross Profit from Core Business
57%
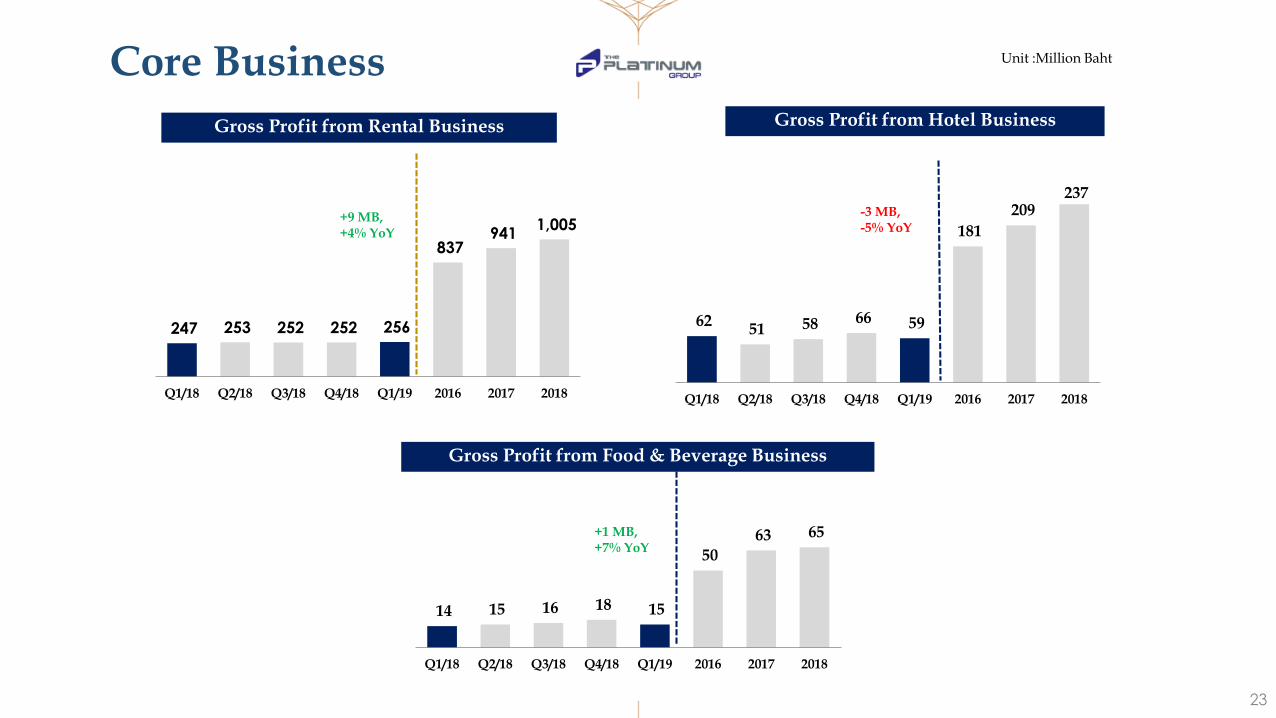
62 51 58 66 59
181
209 237
Q1/18 Q2/18 Q3/18 Q4/18 Q1/19 2016 2017 2018
Unit :Million BahtCore Business
247 253 252 252 256
837 941
1,005
Q1/18 Q2/18 Q3/18 Q4/18 Q1/19 2016 2017 2018
Gross Profit from Rental Business Gross Profit from Hotel Business
Gross Profit from Food & Beverage Business
+9 MB,+4% YoY
14 15 16 18 15
50
63 65
Q1/18 Q2/18 Q3/18 Q4/18 Q1/19 2016 2017 2018
-3 MB,-5% YoY
+1 MB,+7% YoY
23

24
% GP of Core Business
69%
76% 76% 76% 75% 75% 75% 76% 76% 75%
63%
50%
40%45%
50% 53%
55% 56%53% 54%
55%
53%
24%
19%21% 20%
24% 24%22%
23% 24% 25%24%
0%
10%
20%
30%
40%
50%
60%
70%
80%
90%
2013 2014 2015 2016 2017 2018 Q1/18 Q2/18 Q3/18 Q4/18 Q1/19
Rental &Service Hotel F&B
RENTAL & SERIVICE
F&B
HOTEL

25

Business Type The Biggest wholesale and retail fashion shopping mall over 2,600 shops where had opened since November 2005
The Platinum Fashion Mall
26
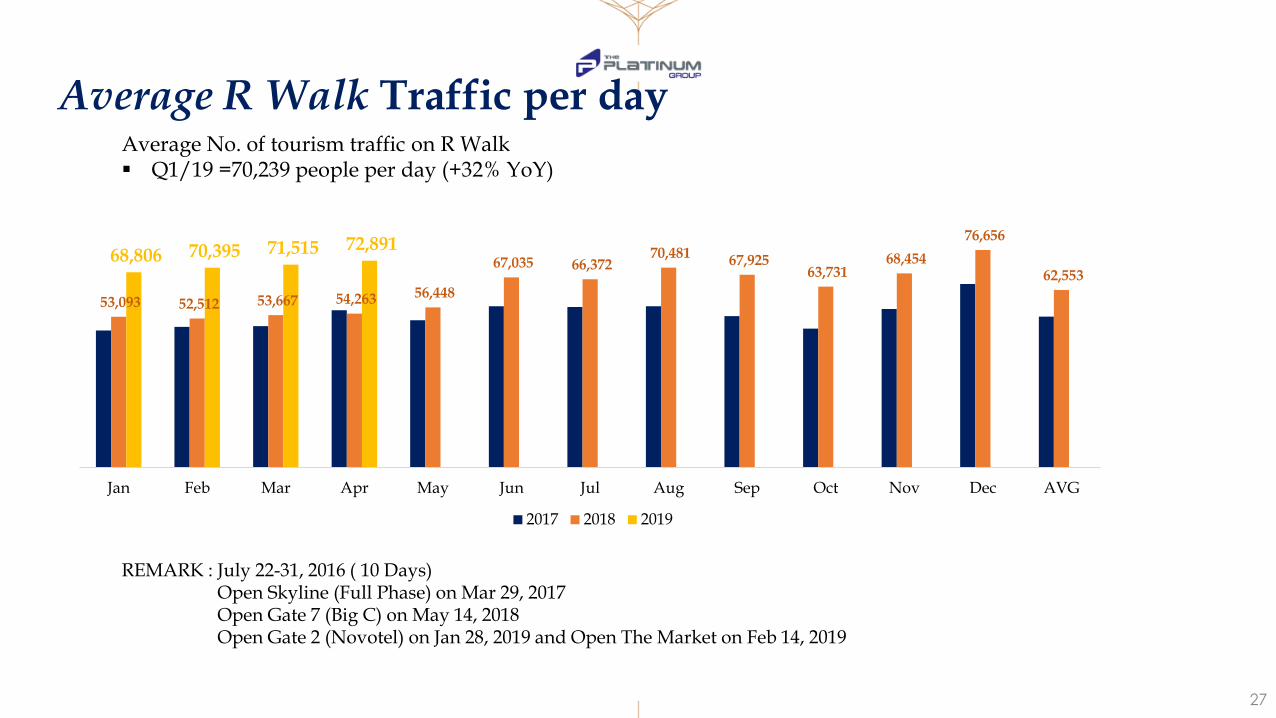
Average R Walk Traffic per dayAverage No. of tourism traffic on R Walk Q1/19 =70,239 people per day (+32% YoY)
27
53,093 52,512 53,667 54,263 56,448
67,035 66,372 70,481 67,925
63,731 68,454
76,656
62,553
68,806 70,395 71,515 72,891
Jan Feb Mar Apr May Jun Jul Aug Sep Oct Nov Dec AVG
2017 2018 2019
REMARK : July 22-31, 2016 ( 10 Days)Open Skyline (Full Phase) on Mar 29, 2017Open Gate 7 (Big C) on May 14, 2018Open Gate 2 (Novotel) on Jan 28, 2019 and Open The Market on Feb 14, 2019

Platinum Fashion Mall Traffic
0
50
100
150
200
250
300
350
400
Jan Feb Mar Apr May Jun Jul Aug Sep Oct Nov Dec
No. of Bus
2017 2018 2019
0
200
400
600
800
1000
1200
1400
1600
1800
Jan Feb Mar Apr May Jun Jul Aug Sep Oct Nov Dec
No. of Van
2017 2018 2019
28
No. of Bus visiting the Platinum Fashion MallQ1 2019 : 741 bus -3% YoY
No. of Van visiting the Platinum Fashion MallQ1 2019 : 3,052 vans -28% YoY

2,974 3,101
3,175 3,183 3,184 3,175 3,156 3,092
2016 2017 2018 Q1/18 Q2/18 Q3/18 Q4/18 Q1/19
Baht per sq.m. per month
Occupancy Rate
Rental Rate
The Platinum Fashion Mall
2016 2017 2018 Q1/18 Q2/18 Q3/18 Q4/18 Q1/19
98% 98% 98% 98% 99% 99% 98% 97%
29
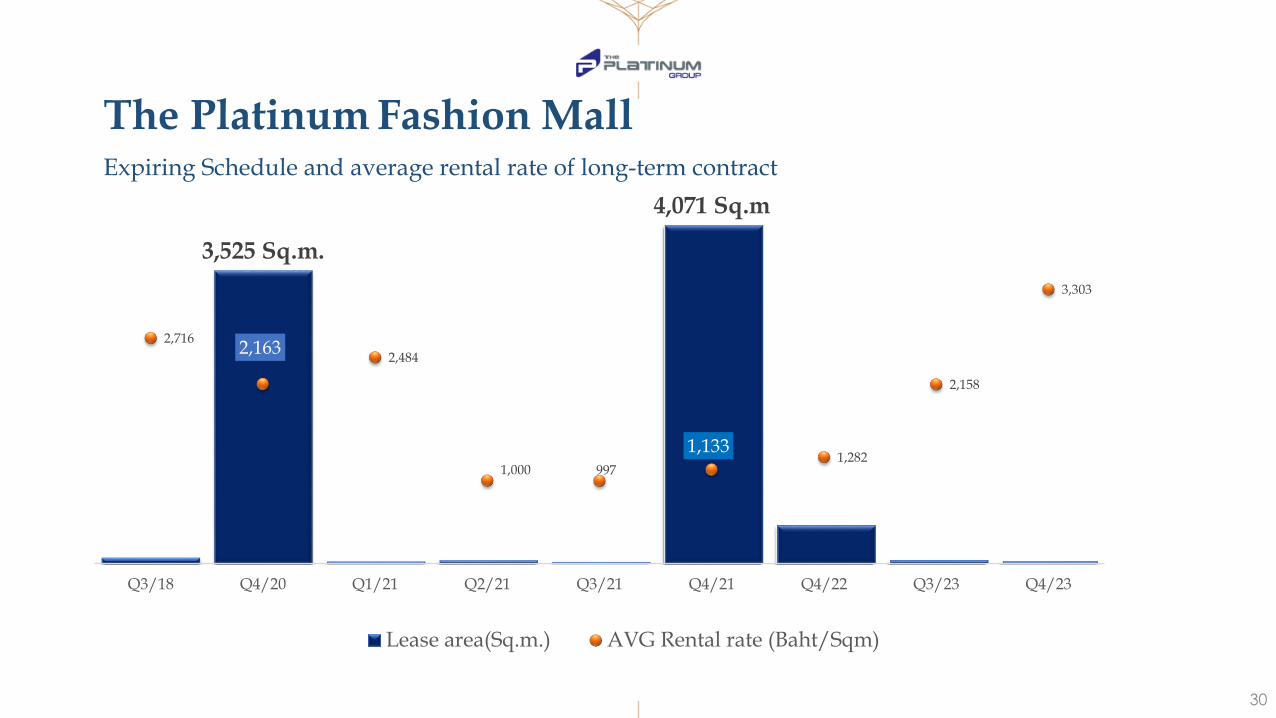
3,525 Sq.m.
4,071 Sq.m
2,7162,163
2,484
1,000 997
1,1331,282
2,158
3,303
Q3/18 Q4/20 Q1/21 Q2/21 Q3/21 Q4/21 Q4/22 Q3/23 Q4/23
Lease area(Sq.m.) AVG Rental rate (Baht/Sqm)
The Platinum Fashion MallExpiring Schedule and average rental rate of long-term contract
30
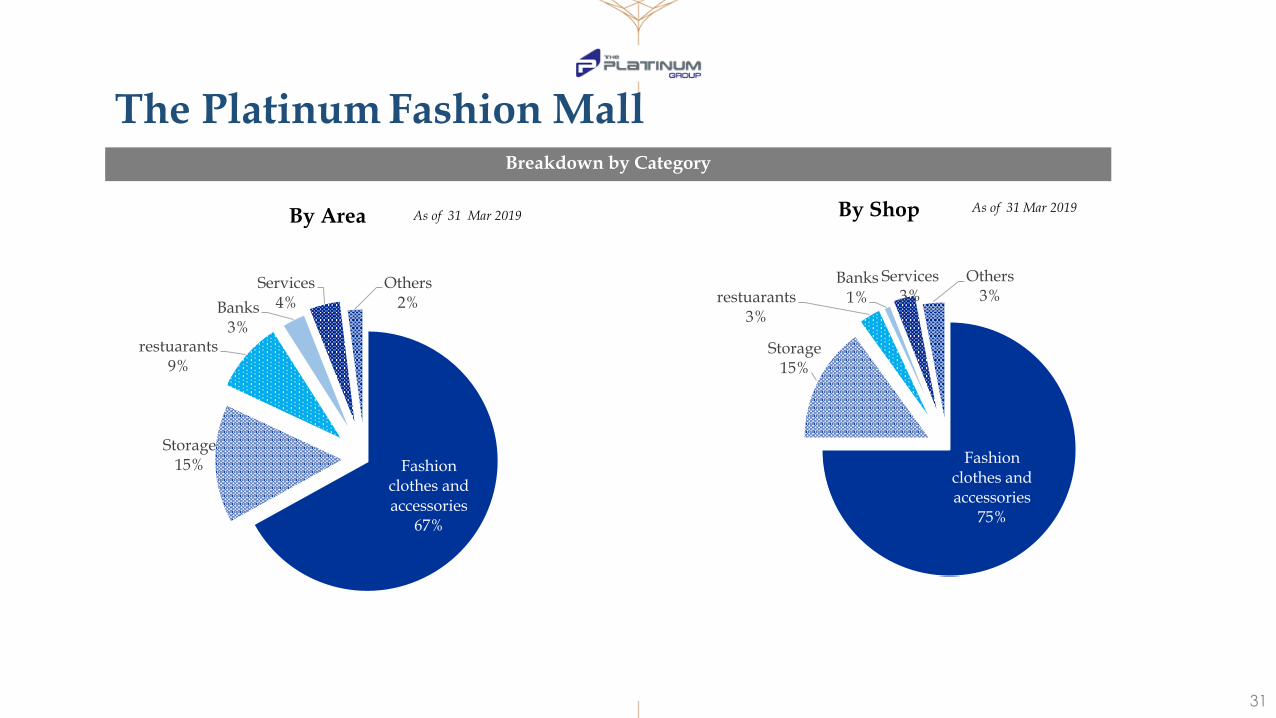
Breakdown by Category
As of 31 Mar 2019As of 31 Mar 2019
The Platinum Fashion Mall
By Area By Shop
Fashion clothes and accessories
67%
Storage15%
restuarants9%
Banks3%
Services4%
Others 2%
Fashion clothes and accessories
75%
Storage15%
restuarants3%
Banks1%
Services3%
Others 3%
31
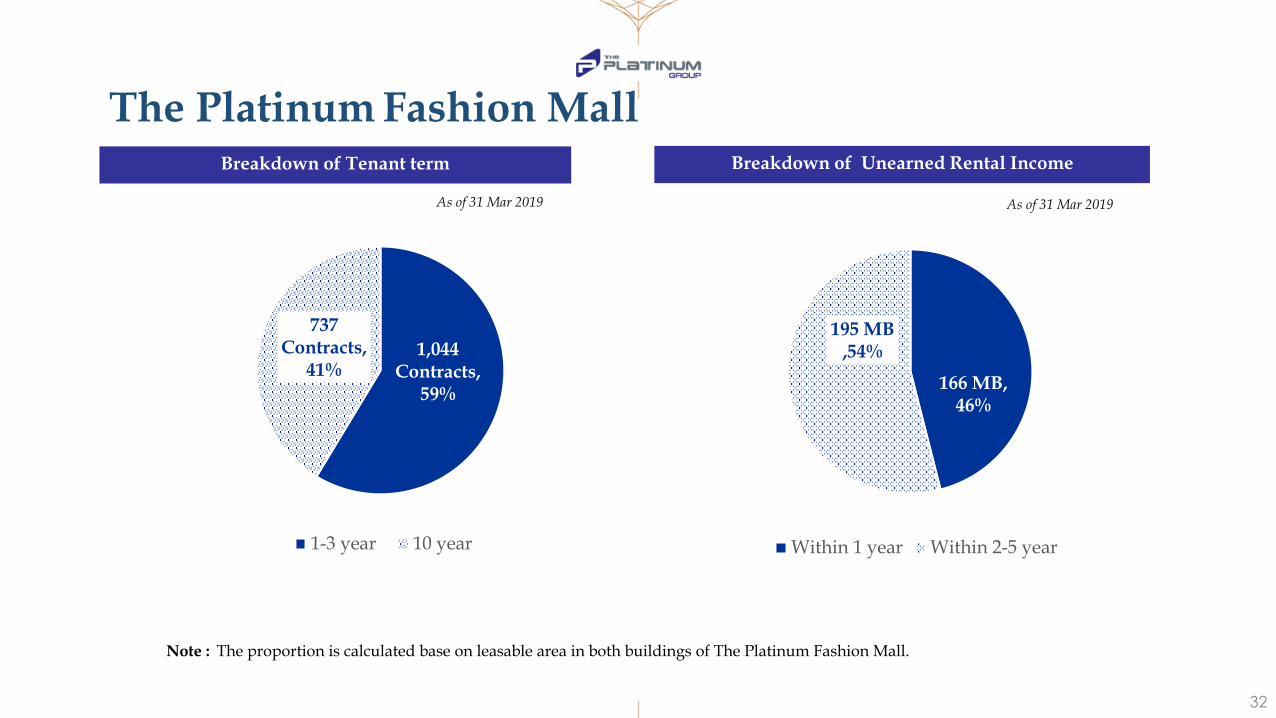
Breakdown of Unearned Rental Income
Note : The proportion is calculated base on leasable area in both buildings of The Platinum Fashion Mall.
Breakdown of Tenant term
As of 31 Mar 2019 As of 31 Mar 2019
The Platinum Fashion Mall
166 MB, 46%
195 MB ,54%
Within 1 year Within 2-5 year
1,044Contracts,
59%
737Contracts,
41%
1-3 year 10 year
32
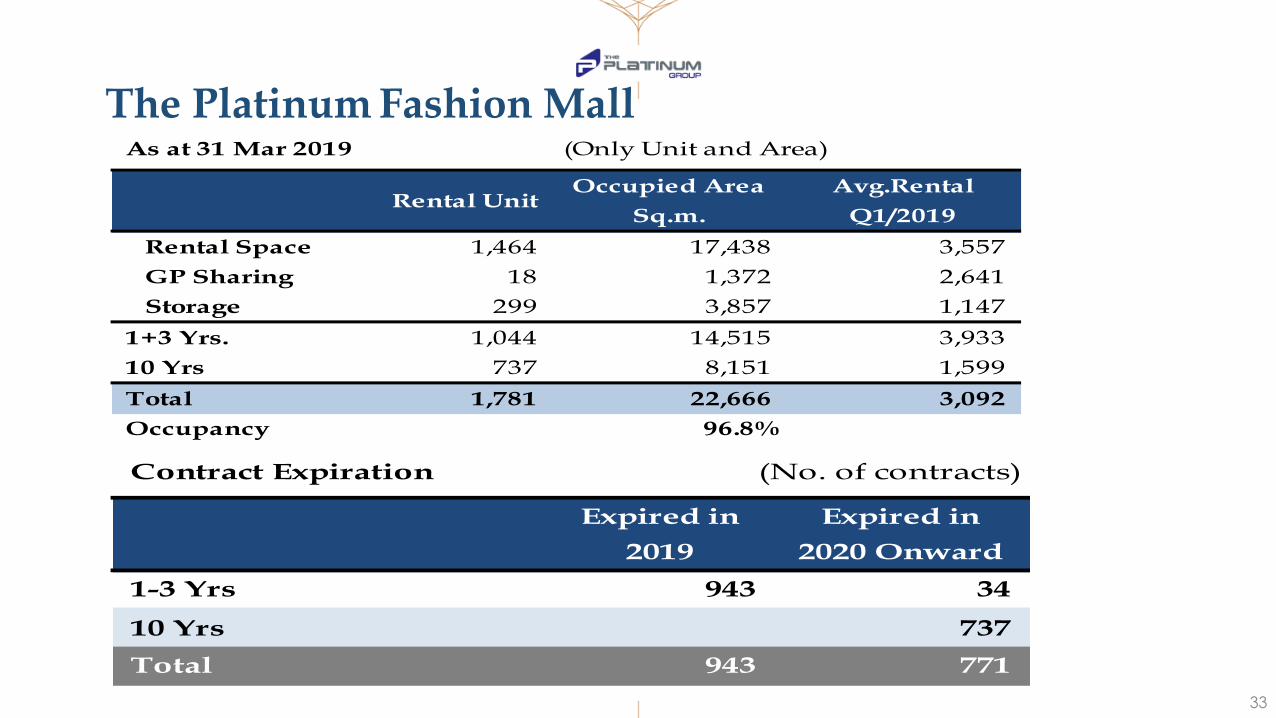
The Platinum Fashion MallAs at 31 Mar 2019 (Only Unit and Area)
Rental Unit Occupied Area
Sq.m.
Avg.Rental
Q1/2019
Rental Space 1,464 17,438 3,557
GP Sharing 18 1,372 2,641
Storage 299 3,857 1,147
1+3 Yrs. 1,044 14,515 3,933
10 Yrs 737 8,151 1,599
Total 1,781 22,666 3,092
Occupancy 96.8%
Contract Expiration (No. of contracts)
Expired in
2019
Expired in
2020 Onward
1-3 Yrs 943 34
10 Yrs 737
Total 943 771
33
34

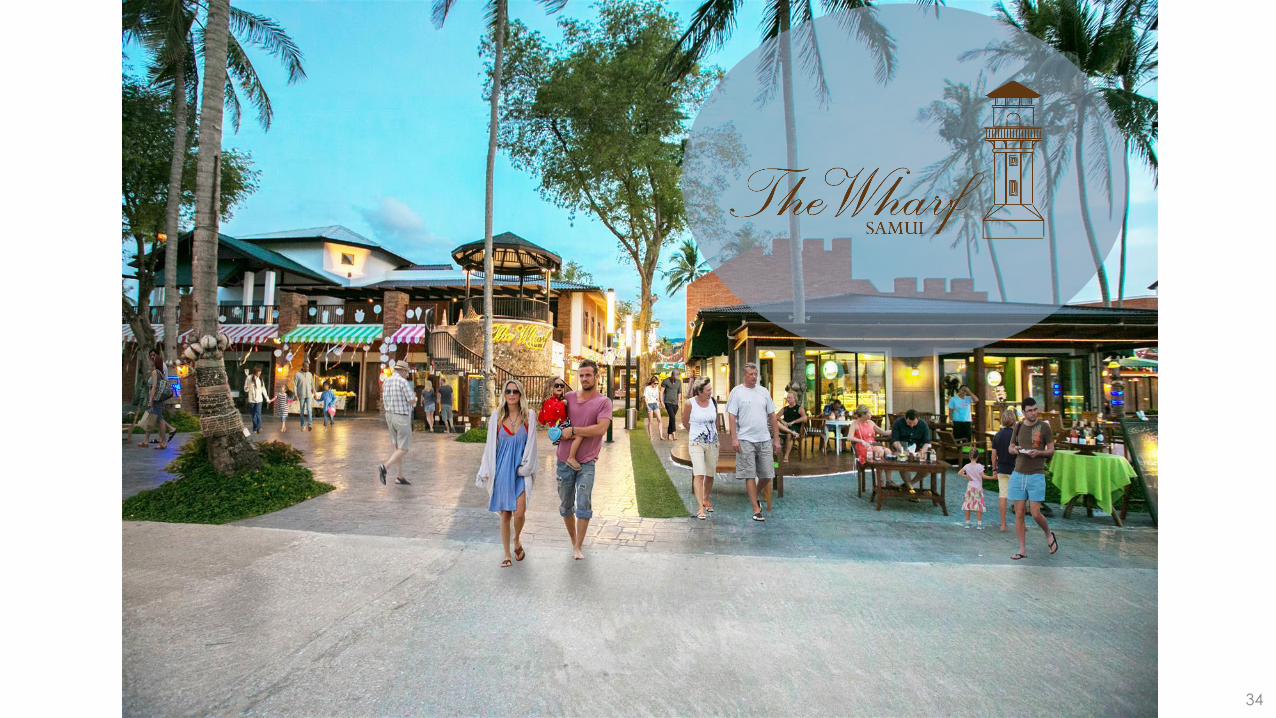
Business Type The first beachfront community mall in Samui Island with the vintage architecture in the combination of the western and eastern styles targeting to Thai and Foreign tourists.
The Wharf Samui
35

511
546
640 645 655 632 626
543
2016 2017 2018 Q1/18 Q2/18 Q3/18 Q4/18 Q1/19
Occupancy Rate
Rental Rate
The Wharf Samui
Baht per sq.m. per month
-102 Baht,-16% YoY
2016 2017 2018 Q1/18 Q2/18 Q3/18 Q4/18 Q1/19
62% 57% 38% 39% 39% 36% 37% 28%
36

3737

Business Type New shopping destination in the center of Bangkok gathered with various delicious food and more than 585 shops, 24 containers and 28 mini-shops in the comfortable atmosphere.
TOURIST , LOCAL RESIDENT & OFFICR WORKER
The Neon Night Bazaar
38
39
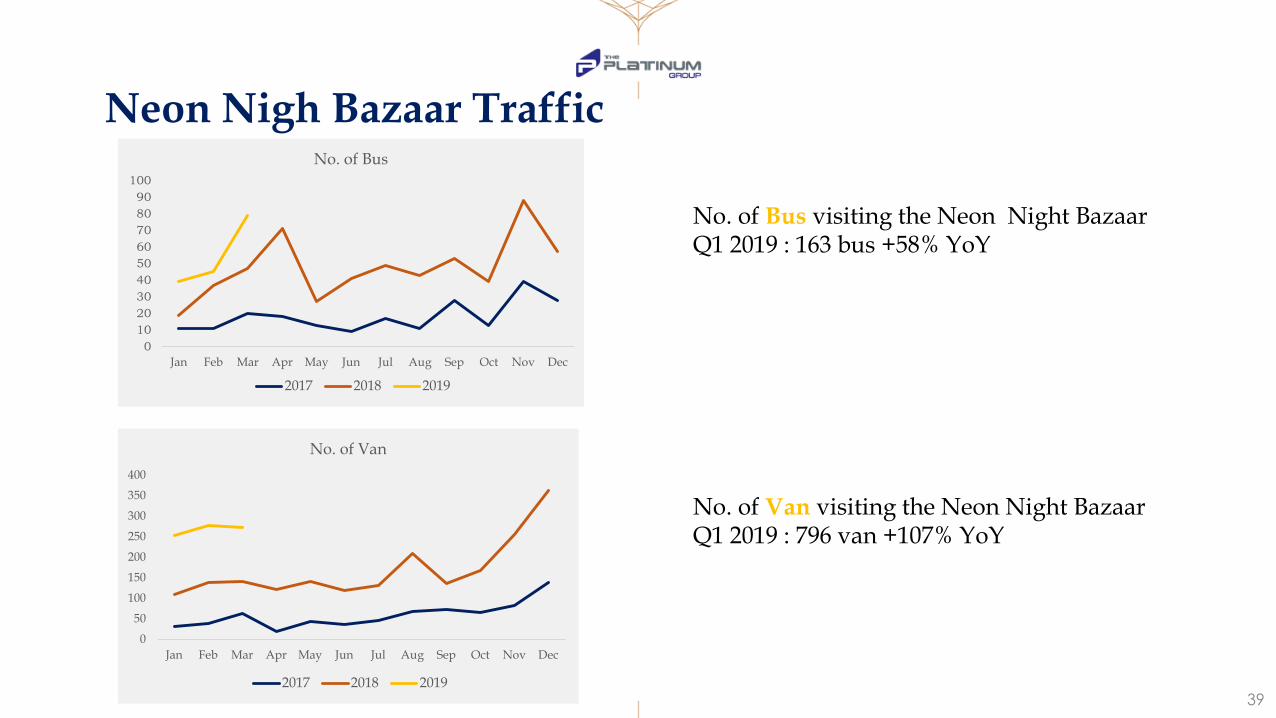
Neon Nigh Bazaar Traffic
No. of Bus visiting the Neon Night BazaarQ1 2019 : 163 bus +58% YoY
No. of Van visiting the Neon Night BazaarQ1 2019 : 796 van +107% YoY
0
10
20
30
40
50
60
70
80
90
100
Jan Feb Mar Apr May Jun Jul Aug Sep Oct Nov Dec
No. of Bus
2017 2018 2019
0
50
100
150
200
250
300
350
400
Jan Feb Mar Apr May Jun Jul Aug Sep Oct Nov Dec
No. of Van
2017 2018 2019

973
1,392
1,667 1,633 1,710
1,618 1,708 1,721
2016 2017 2018 Q1/18 Q2/18 Q3/18 Q4/18 Q1/19
Occupancy Rate
Rental Rate
The Neon Night Bazaar
Baht per sq.m. per month
Appendix
+88 Baht,+5% YoY
2016* 2017 2018 Q1/18 Q2/18 Q3/18 Q4/18** Q1/19
65% 70% 87% 86% 84% 92% 88% 83%
Note : * Phase 1 -opened in Dec 2016**Phase 2-opened 15 Dec 18 40

1TENTSTANDARD COMMERCIAL SHELTERSIZE : 2 x 2 M. = 557 UNITS
2CONTAINER1 STOREY & MEZZANINESIZE : 8 x 7.5 M. = 32 UNITS
4Take AwaySIZE : 2 x 3 M. = 28 UNITS3
SHOPFREE FROM STYERSIZE : 6 x 4 M. = 73 UNITS
41
Shop types
42
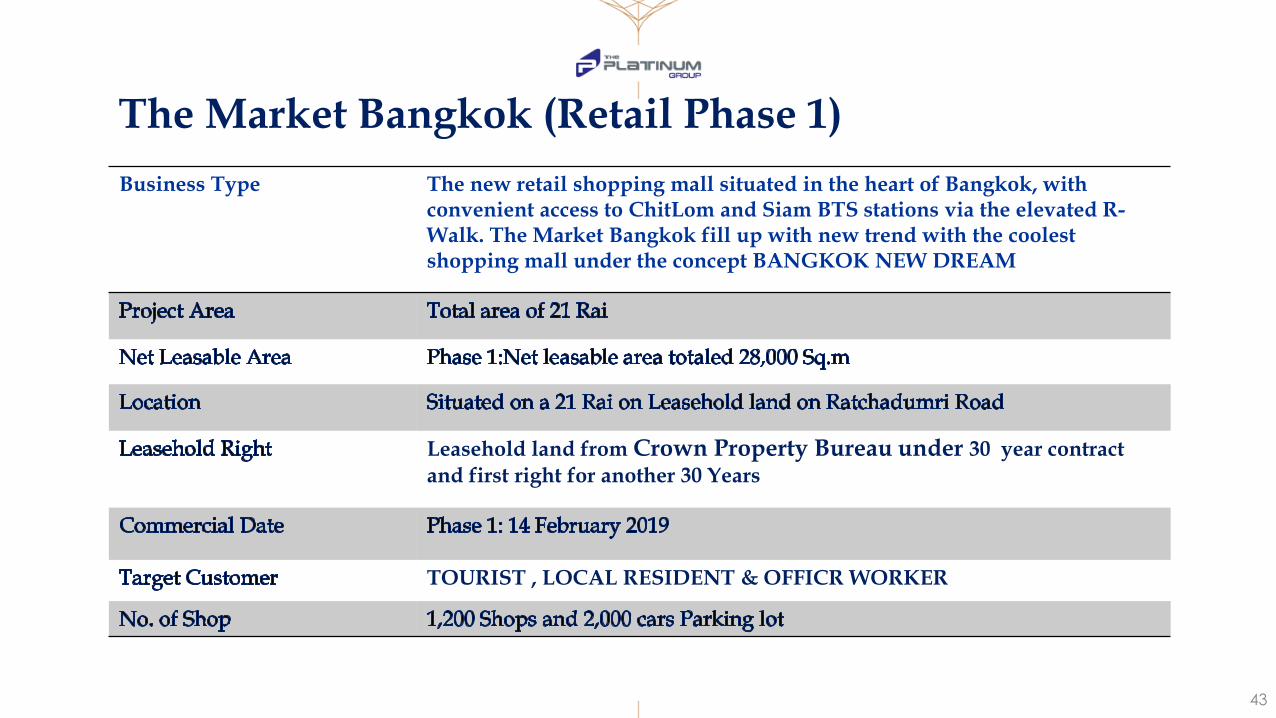
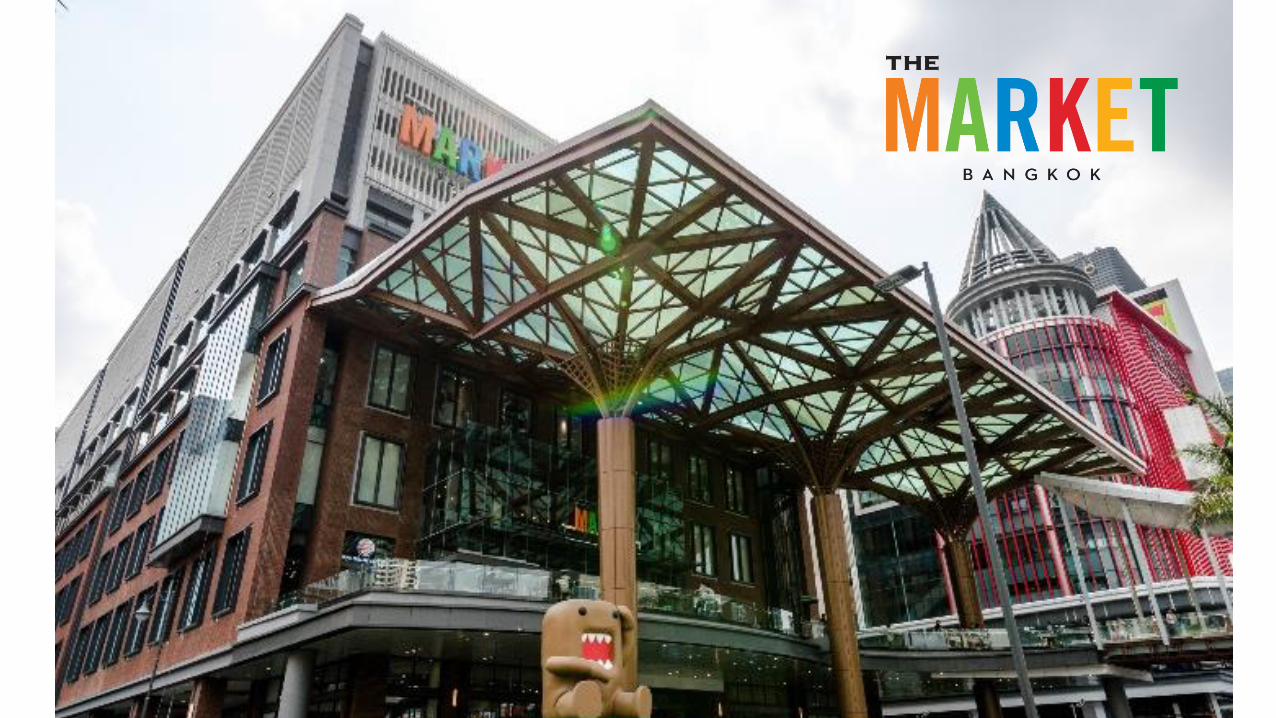
Business Type The new retail shopping mall situated in the heart of Bangkok, with convenient access to ChitLom and Siam BTS stations via the elevated R-Walk. The Market Bangkok fill up with new trend with the coolest shopping mall under the concept BANGKOK NEW DREAM
Leasehold land from Crown Property Bureau under 30 year contract
and first right for another 30 Years
TOURIST , LOCAL RESIDENT & OFFICR WORKER
The Market Bangkok (Retail Phase 1)
43
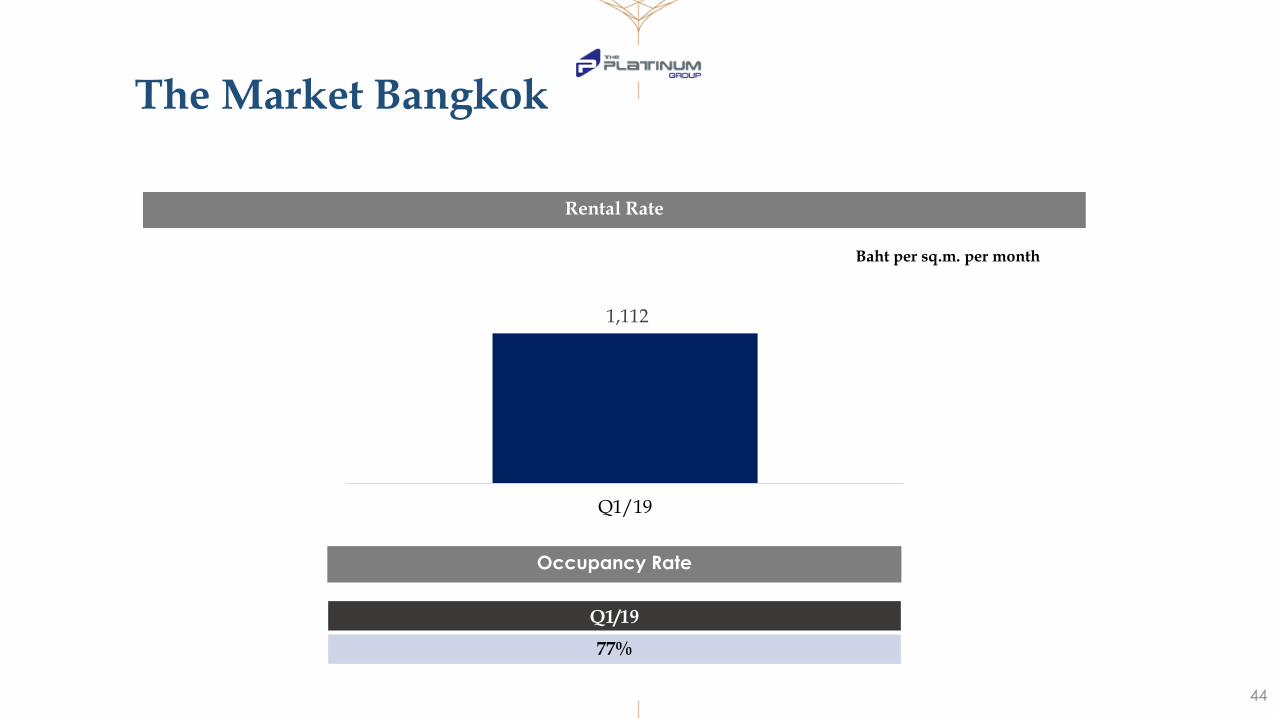
1,112
Q1/19
Occupancy Rate
Rental Rate
The Market Bangkok
Baht per sq.m. per month
Appendix
Q1/19
77%
44
12,995
14,263
14,855
12,308
11,55711,879
12,50413,059
14,258
13,394
11,382
10,693
10,83411,714
13,111
20,171
17,388
18,128
17,581
19,782
20,997
21,055
20,677
18,831
18,960
17,80617,222
19,749
22,907
20,050
21,494
17,605
16,597 16,748
18,15519,032
19,25119,048
0
5,000
10,000
15,000
20,000
0
200
400
600
800
1000
1200
1400
Visitors
Car Motorcycle Tour (Pax) Visitor
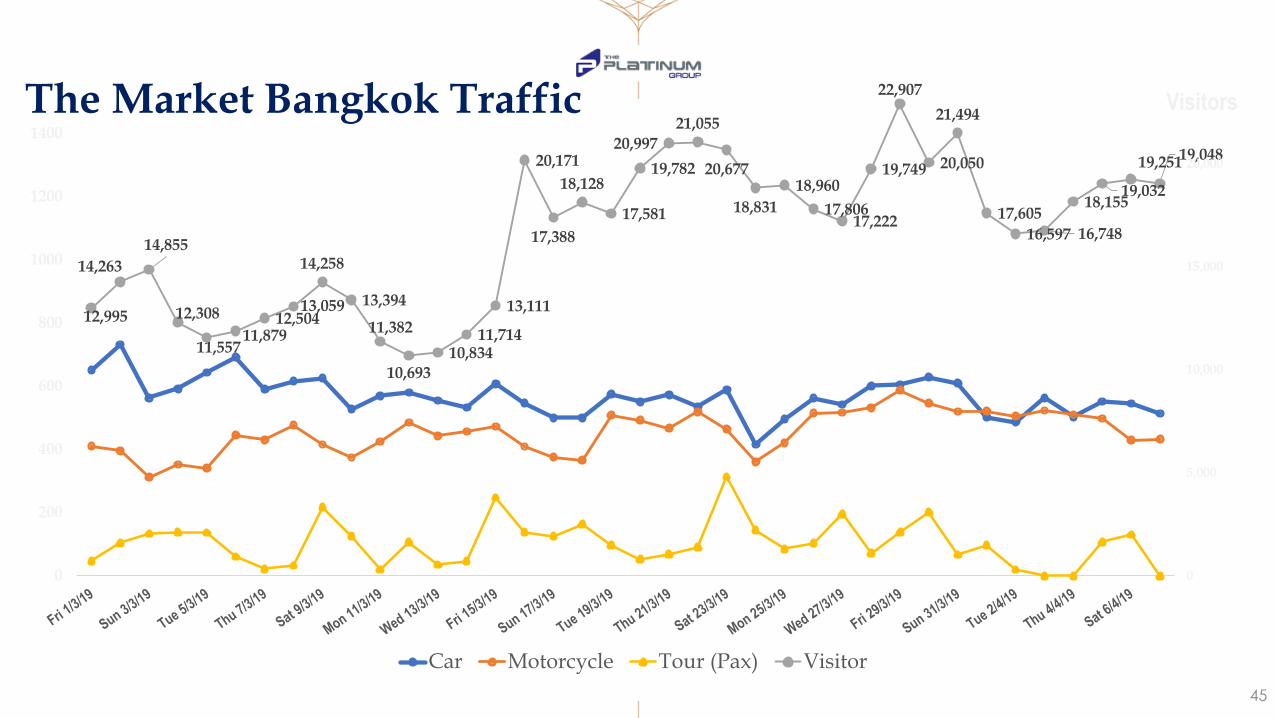
The Market Bangkok Traffic
45

EXPERIENCED LOCAL STREET FOOD &
TAKEAWAY
URBAN QUICK MEAL EATERY
LIFESTYLE CAFE
FASHION & ACCESSORIES
FASHION & ACCESSORIES
SPECIALTY STORE
RESTAURANT
M3 M2
RAJDHAMRI ROAD
BANGKOKSKYLINE
DECORATIVE ITEMS
COSMETIC & SKIN CAREBANK
4F
LOCAL WISDOM
SOUVENIR
RETAIL FLOOR CONCEPTM1
3F
2F
1F
GF
MFEXPERIENCED
THAI CONCEPT STORE & BEAUTY MEGA STORE
EXPERIENCED THAI CONCEPT STORE &
BEAUTY MEGA STORE
WELLNESS & VITALITY
4646

TARGET VISITORS
OFFICE WORKERS
&STUDENTS
RESIDENTSLOCAL THAIS FOREIGN TOURISTS
A complete
EVERYDAYshopping & dinning venue in the heart of
Bangkok
A GATHERINGwelcoming place for
family & friends
An enjoyable placewith various kinds of
food, activities and trendy merchandises
at AFFORDABLE price
A MUST VISIT destination whenever visiting Bangkok. This place will offer a
UNIQUE EXPERIENCE like no others
47
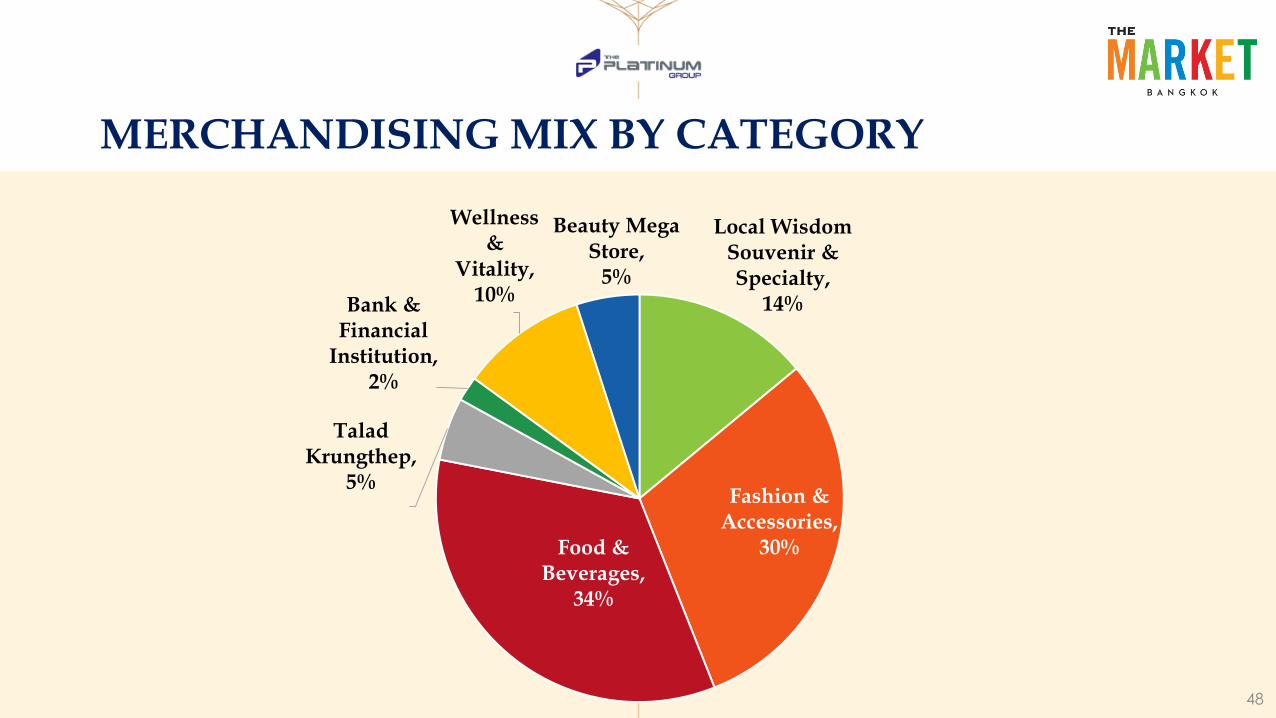
MERCHANDISING MIX BY CATEGORY
Local Wisdom Souvenir & Specialty,
14%
Fashion & Accessories,
30%Food & Beverages,
34%
Talad Krungthep,
5%
Bank & Financial
Institution, 2%
Wellness &
Vitality, 10%
Beauty Mega Store,
5%
48

Novotel Bangkok Platinum Pratunam
49

Objective To compliment the Platinum Fashion Mall business as it provides the hospitality services to those visiting The Platinum Fashion Mall
50
Novotel Bangkok Platinum Pratunam
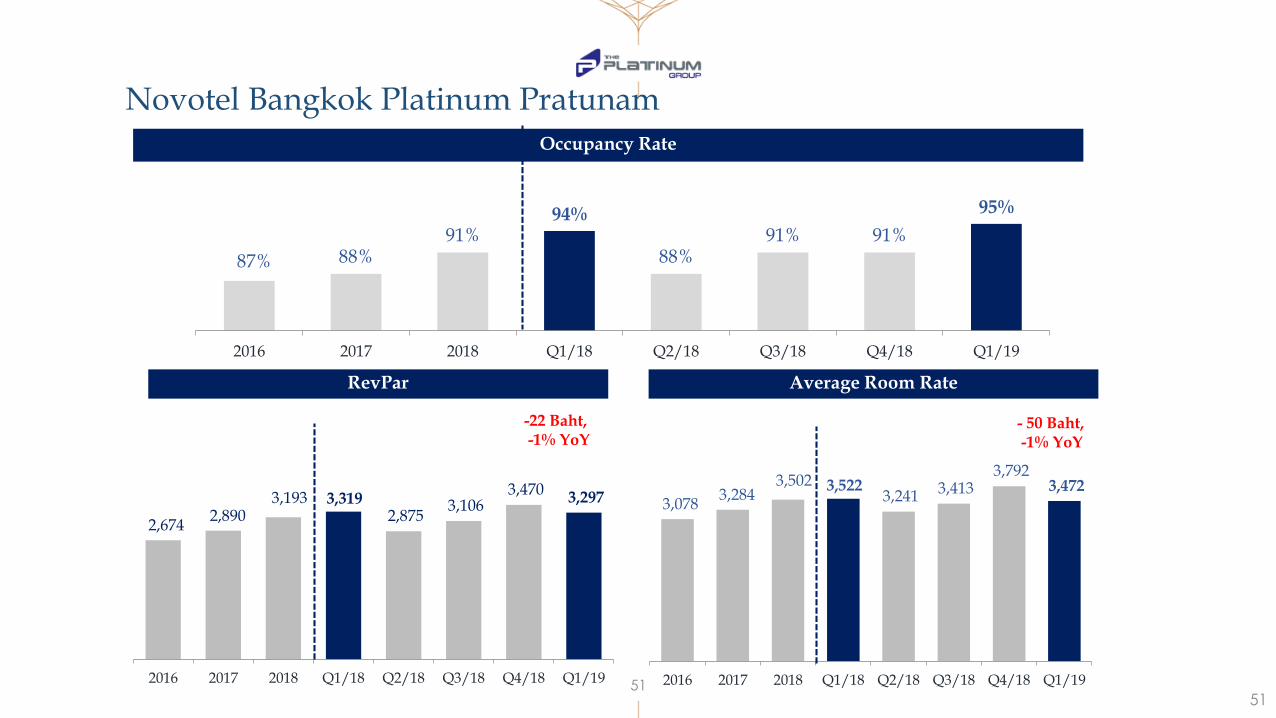
Occupancy Rate
Average Room RateRevPar
Novotel Bangkok Platinum Pratunam
87% 88%91%
94%
88%91% 91%
95%
2016 2017 2018 Q1/18 Q2/18 Q3/18 Q4/18 Q1/19
51
-22 Baht,-1% YoY
- 50 Baht,-1% YoY
2,674 2,890
3,193 3,319 2,875
3,106 3,470
3,297
2016 2017 2018 Q1/18 Q2/18 Q3/18 Q4/18 Q1/19
3,078 3,284
3,502 3,522 3,241 3,413
3,792 3,472
2016 2017 2018 Q1/18 Q2/18 Q3/18 Q4/18 Q1/19
51
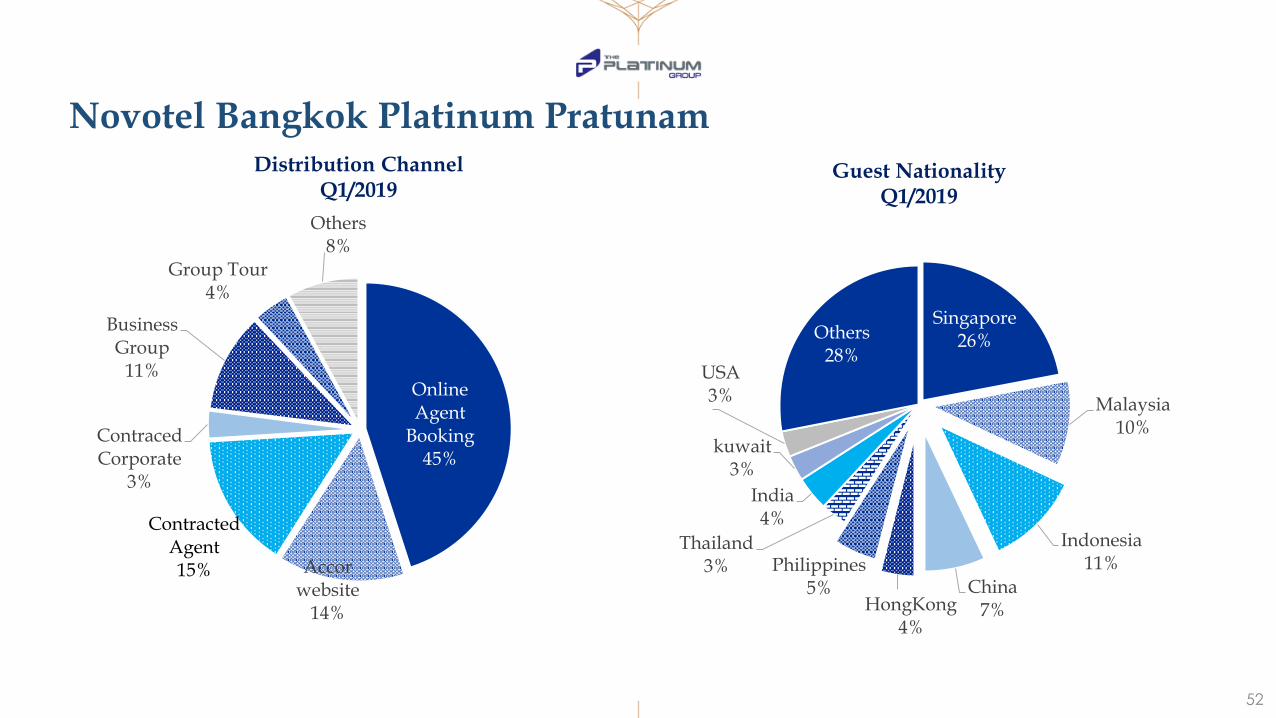
Distribution ChannelQ1/2019
Guest NationalityQ1/2019
Appendix
Online Agent
Booking45%
Accor website
14%
Contracted Agent15%
Contraced Corporate
3%
Business Group
11%
Group Tour4%
Others8%
Singapore26%
Malaysia10%
Indonesia11%
China7%HongKong
4%
Philippines5%
Thailand3%
India4%
kuwait3%
USA3%
Others28%
Novotel Bangkok Platinum Pratunam
52
AGENDA
Industry Update
Q4/2018 and Year 2018 Performance Review
Outlook
The Market Project Update
Q&A
Appendix53
54
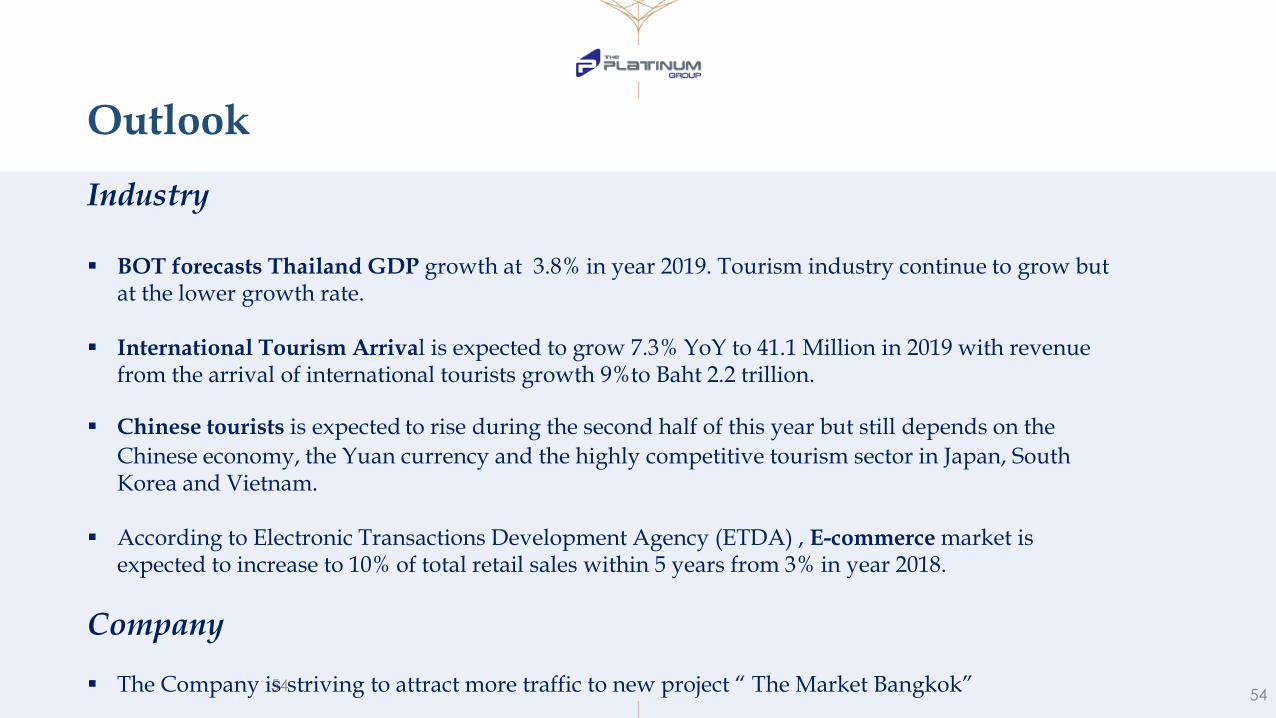
Industry
BOT forecasts Thailand GDP growth at 3.8% in year 2019. Tourism industry continue to grow but at the lower growth rate.
International Tourism Arrival is expected to grow 7.3% YoY to 41.1 Million in 2019 with revenue from the arrival of international tourists growth 9%to Baht 2.2 trillion.
Chinese tourists is expected to rise during the second half of this year but still depends on the
Chinese economy, the Yuan currency and the highly competitive tourism sector in Japan, South Korea and Vietnam.
According to Electronic Transactions Development Agency (ETDA) , E-commerce market is expected to increase to 10% of total retail sales within 5 years from 3% in year 2018.
Company
The Company is striving to attract more traffic to new project “ The Market Bangkok”
Outlook
54
55
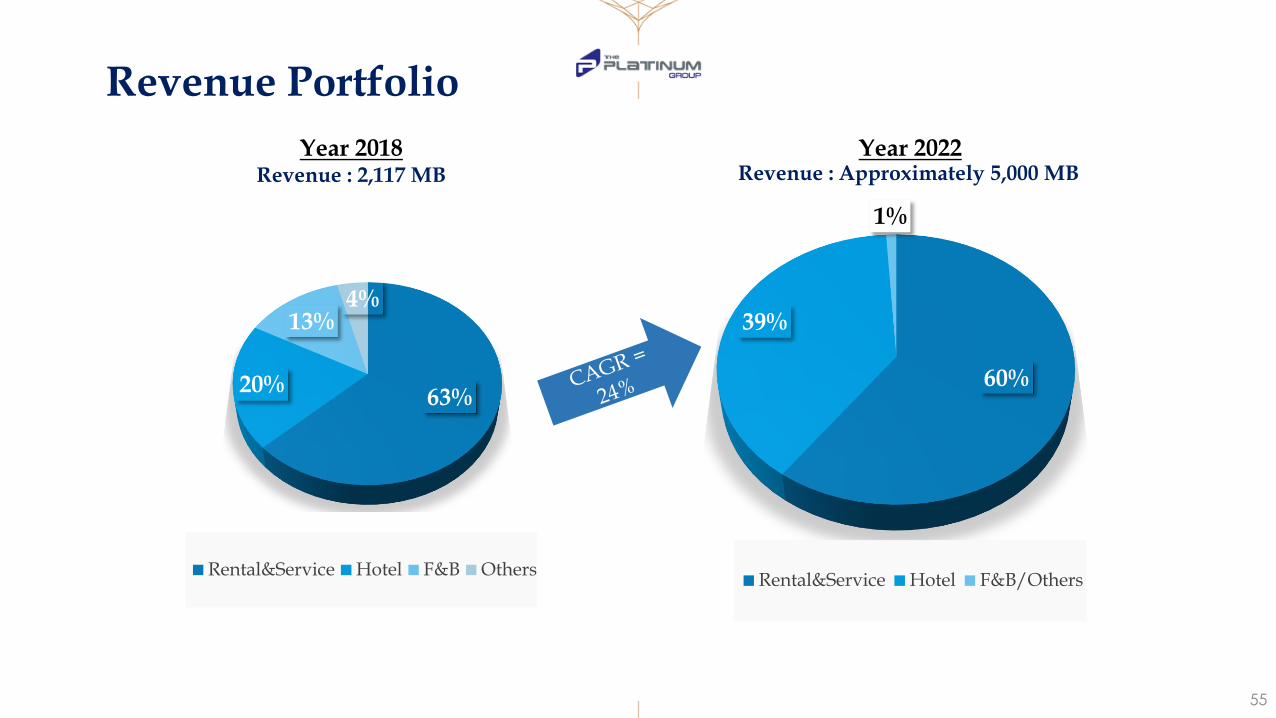
Revenue Portfolio
63%20%
13%4%
Rental&Service Hotel F&B Others
Year 2018Revenue : 2,117 MB
Year 2022Revenue : Approximately 5,000 MB
60%
39%
1%
Rental&Service Hotel F&B/Others

AGENDA
Industry Update
Q4/2018 and Year 2018 Performance Review
Outlook
The Market Project Update
Q&A
Appendix56

More Plans are coming to attract traffic ….
57

AGENDA
Industry Update
Q4/2018 and Year 2018 Performance Review
Outlook
The Market Project Update
Q&A
Appendix58
AGENDA
Industry Update
Q4/2018 and Year 2018 Performance Review
Outlook
The Market Project Update
Q&A
Appendix59

4,375 4,107
9,547 9,822 10,49111,339 11,707
2013 2014 2015 2016 2017 2018 31-Mar-19
Current Assets Total Liabilities Non Current Assets Equities
81%
51%
39%
64%
36%
30%
59%
86%
53%
83%
14%
86%
14%
41%47%
17%
49%15%
85%64%
36%
79%
21%
43%
57%41%
59%
58%
42%
78%
22%
Consolidated Financial Position
19%
60
Unit :MB

61
0.1575Baht/Share
0.18Baht/Share
0.2Baht/Share
0.2Baht/Share
441 MB
Dividend Payment
504 MB560 MB
Dividend : PLAT’s payout policy at least 40% of net profit after tax and legal reserves of separate financial statement
70% 72% 72%
2015 2016 2017
% of Net profit
560 MB
72%
2018
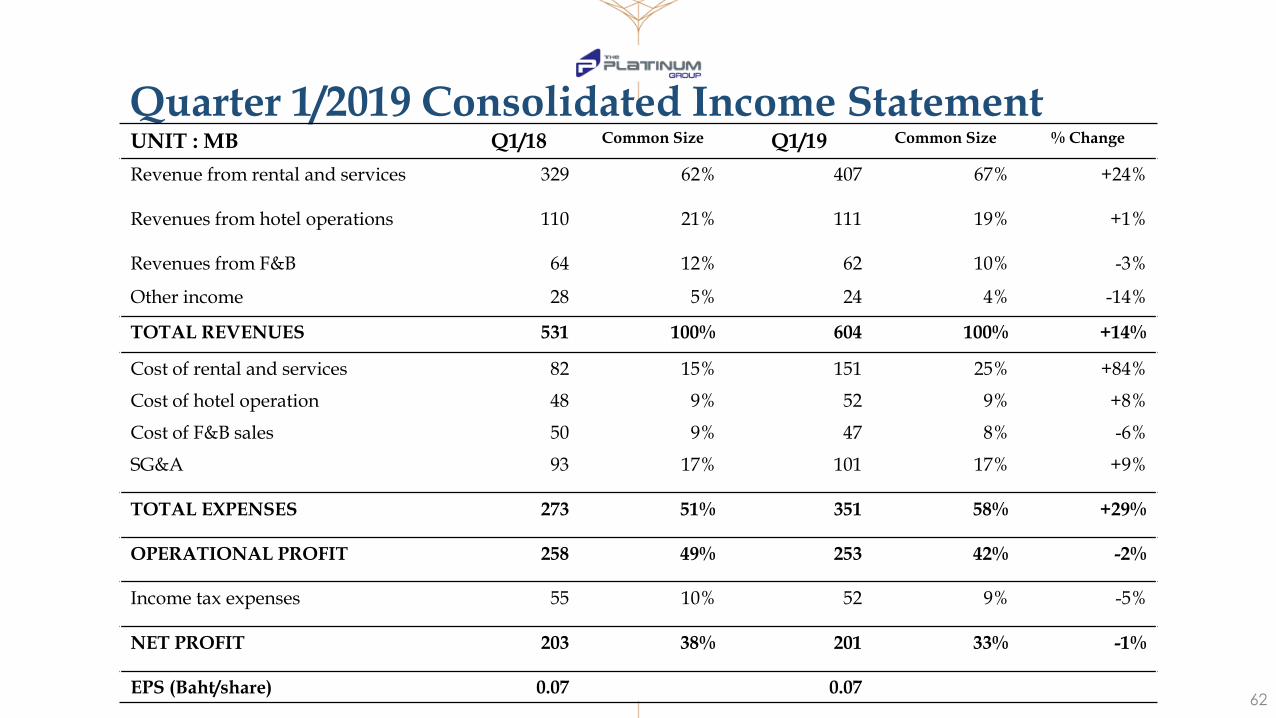
Quarter 1/2019 Consolidated Income StatementUNIT : MB Q1/18 Common Size Q1/19 Common Size % Change
Revenue from rental and services 329 62% 407 67% +24%
Revenues from hotel operations 110 21% 111 19% +1%
Revenues from F&B 64 12% 62 10% -3%
Other income 28 5% 24 4% -14%
TOTAL REVENUES 531 100% 604 100% +14%
Cost of rental and services 82 15% 151 25% +84%
Cost of hotel operation 48 9% 52 9% +8%
Cost of F&B sales 50 9% 47 8% -6%
SG&A 93 17% 101 17% +9%
TOTAL EXPENSES 273 51% 351 58% +29%
OPERATIONAL PROFIT 258 49% 253 42% -2%
Income tax expenses 55 10% 52 9% -5%
NET PROFIT 203 38% 201 33% -1%
EPS (Baht/share) 0.07 0.0762

Consolidated Financial PositionUNIT : MB Year
201731 Dec 2018 31 Mar 2019
Cash & Cash equivalents &Current Investment 5,472 4,648 4,517
Trade and Other receivables 43 47 138
Other Current Assets 75 171 237
Total Current Assets 5,590 4,866 4,892
Investment Properties 3,418 4,957 5,294
Property, Plant and equipment 1,171 1,170 1,179
Intangible Assets 252 231 226
Other non-current Assets 60 114 115
Total Non-current Assets 4,901 6,472 6,814
TOTAL ASSETS 10,491 11,339 11,707
63
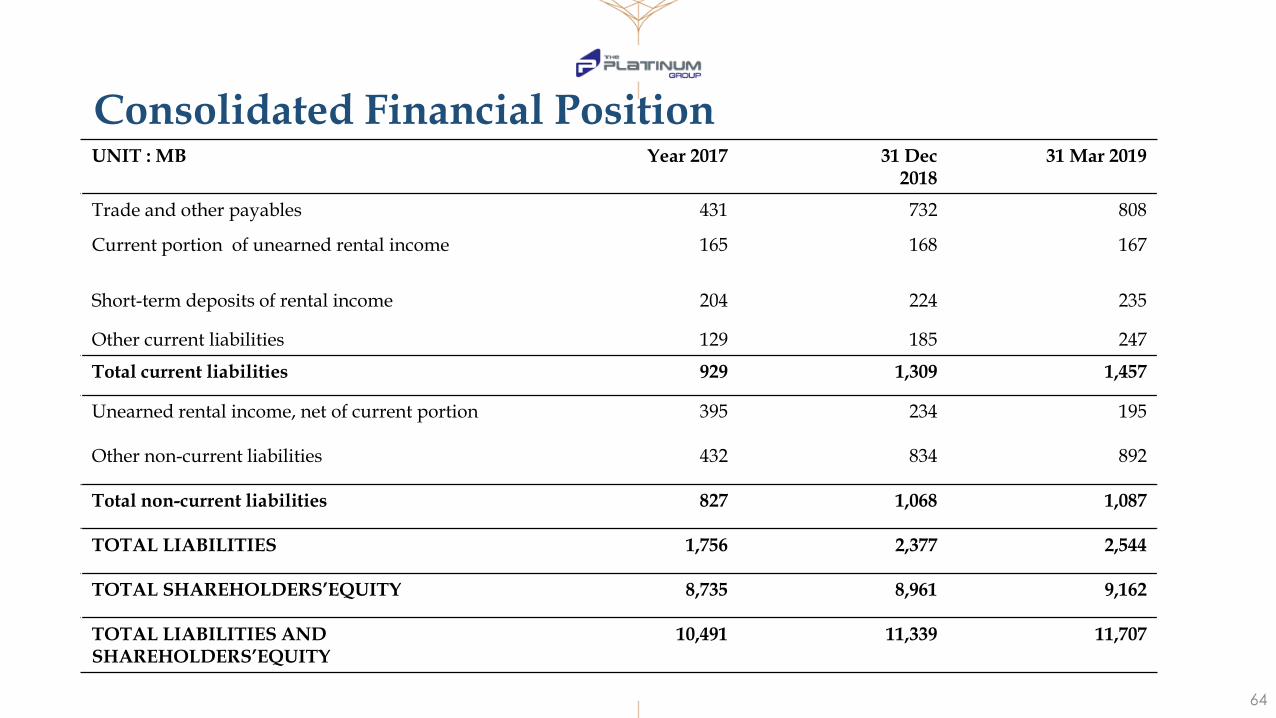
Consolidated Financial PositionUNIT : MB Year 2017 31 Dec
201831 Mar 2019
Trade and other payables 431 732 808
Current portion of unearned rental income 165 168 167
Short-term deposits of rental income 204 224 235
Other current liabilities 129 185 247
Total current liabilities 929 1,309 1,457
Unearned rental income, net of current portion 395 234 195
Other non-current liabilities 432 834 892
Total non-current liabilities 827 1,068 1,087
TOTAL LIABILITIES 1,756 2,377 2,544
TOTAL SHAREHOLDERS’EQUITY 8,735 8,961 9,162
TOTAL LIABILITIES AND SHAREHOLDERS’EQUITY
10,491 11,339 11,707
64

THANK YOU