Embed Size (px)
Citation preview

QUANTITATIVE VULNERABILITY FUNCTIONS FOR USE IN
MOUNTAIN HAZARD RISK MANAGEMENT
THE CHALLENGE OF TRANSFER
Sven Fuchs1, Ting-Chi Tsao
2 and Margreth Keiler
3
ABSTRACT
In natural hazards research, risk is defined as a function of (1) the probability of occurrence of a
hazardous process, and (2) the assessment of the related extent of damage, defined by the value of
elements at risk exposed and their physical vulnerability. Until now, various works have been
undertaken to determine vulnerability values for objects exposed to torrent processes. Yet, many
studies only provide rough estimates for vulnerability values based on proxies for process intensities.
However, the deduced vulnerability functions proposed in the literature show a high range, in
particular with respect to medium and high process intensities. In our study, we compare vulnerability
functions for torrent processes derived from studies in test sites located in the Austrian Alps and in
Taiwan. Based on this comparison we address challenges for future research in order to enhance
mountain hazard risk management with a particular focus on vulnerability on a catchment scale.
Keywords: Vulnerability, torrents, risk management, loss, Taiwan, Austria
INTRODUCTION
Major losses (world-wide, Keiler in press, as well as on the European level, Hübl et al. 2011) in
mountain areas are associated with torrent events. The term torrent refers to steep rivers within a
mountainous environment. Torrents are defined as constantly or temporarily flowing watercourses
with strongly changing perennial or intermittent discharge and flow conditions (Aulitzky 1980; ONR
2009), originating within small catchment areas (Slaymaker 1988). At the outlet of these watersheds,
torrent fans are developed which are used for settlement purpose since the beginning of the historical
colonisation and commodification of the landscape. Therefore, torrent events are a main challenge for
society in many countries, in particular due to the spatial overlap of these settlements with the
potential deposition area in periods of extraordinary discharge.
The concept of risk has been introduced in natural hazard management since experiences from past
years suggested that elements at risk and vulnerability should be increasingly considered within the
framework of hazard management in order to reduce losses (e.g., Commission of the European
Communities 2007; International Standards Organisation 2009). Following the axiom that natural
hazard risk is a function of hazard and consequences, the ability to determine vulnerability
quantitatively is an essential prerequisite for reducing these consequences and therefore natural
hazard risk.
However, the review of the concept of risk for mountain areas resulted in gaps concerning appropriate
tools for the assessment of vulnerability of elements at risk and of communities exposed (Papathoma-
Köhle et al. 2011). To overcome these shortcomings, studies on vulnerability have been undertaken
aiming at (1) the methodological development of loss functions with respect to buildings located in
the run-out areas of torrent processes (Fuchs et al. 2007; Akbas et al. 2009; Tsao et al. 2010; Quan
Luna et al. 2011; Totschnig et al. 2011); and (2) the conceptualisation of an overarching vulnerability
1 Priv.-Doz. Dr. Sven Fuchs. Institute of Mountain Risk Engineering, University of Natural Resources and Life Sciences,
Peter-Jordan-Straße 82, 1190 Vienna, Austria (e-mail: [email protected]) 2 Ting-Chi Tsao, MSc. Sinotech Engineering Consultants Inc., Taipei, Taiwan (e-mail: [email protected]) 3 Dr. Margreth Keiler. Institute of Geography, University of Bern, Switzerland (e-mail: [email protected])
12th
Congress INTERPRAEVENT 2012 – Grenoble / France
Conference Proceedings
www.interpraevent.at
- 885 -

model including structural, economic, social and institutional vulnerability (Fuchs 2009). Apart from
Tsao et al. (2010), whose work was related on the mountain areas of Taiwan (Republic of China),
these studies were all focused on the quantification of vulnerability in the context of the European
Alps. With the exception of Quana Luna et al. (2011), who used a numerical debris flow model to
obtain vulnerability curves, these studies were rooted in an ex-post assessment of the event magnitude
or intensity, the height of loss and the reinstatement value of the buildings at risk in order to obtain a
damage ratio. By combining these three factors, vulnerability curves were deduced for both, debris
flows (Fuchs et al. 2007; Akbas et al. 2009; Tsao et al. 2010) and fluvial sediment transport
(Totschnig et al. 2011).
When comparing the results of those studies undertaken in the European Alps with the data assessed
in Taiwan, considerable differences and methodological issues arise even if the authors claimed a
universal applicability of their studies on mountain areas with a comparable environment. These
aspects will be discussed in the following sections in order to provide an outlook of the challenges
that come up when a method developed within the specific setting in one mountain region is
transferred to another region of the world with a slightly different setting. The aim is to highlight
possible pitfalls and shortcomings in order to contribute to the ongoing discussion on vulnerability to
torrent events in mountain areas; therefore, (1) possible aspects of physical vulnerability will be
discussed but also (2) the wider implications with respect to social vulnerability.
METHOD: QUANTIFICATION OF VULNERABILITY
The assessment of vulnerability requires an ability to both identify and understand the susceptibility
of elements at risk and – in a broader sense – of the society to these hazards (Birkmann 2006). Studies
related to vulnerability of human and natural systems to mountain hazards, and of the ability of these
systems to adapt to changes in the functional chain of hazards, are a relatively recent field of research
that brings together experts from a wide range of disciplines, including natural science, social science,
disaster management, policy development and economics, to name only a few. Researchers from these
fields bring their own conceptual models to study vulnerability and adaptation, models which often
address similar problems and processes using different languages (Brooks 2003). However, apart from
the overall discussion on linguistic placements and semantic dimensions of the term (Cutter 1996,
2003; Alexander 2005), vulnerability in the context of mountain natural hazards is, from a
practitioner’s side, such as the Austrian Torrent and Avalanche Control Service or the Soil and Water
Conservation Bureau in Taiwan, usually defined as the physical impact of hazardous events on
elements at risk. Accordingly, if quantitatively assessed, vulnerability is defined as the expected
degree of loss for an element at risk due to the impact of a defined hazardous event within a defined
period of time and a defined location. These events are themselves conditioned by a certain intensity,
frequency and duration, all of which affect vulnerability. From this technical point of view, as a
general rule, vulnerability assessment is based on the evaluation of parameters and factors such as
building categories or types, construction materials and techniques, state of maintenance, presence of
protection structures, and presence of warning systems (Fell et al. 2008). Nevertheless, many of these
factors are usually not assessed, above all due to limitations in the assessment method and due to
practical limitations of feasibility (Kappes et al. 2012). For this reason, vulnerability values are used
to describe the susceptibility of elements at risk to damage, which is conceptualised by a damage ratio
between loss and the value of affected elements at risk, facing different process types with different
spatial and temporal distributions of process intensities (e.g., flow depths, accumulation heights, flow
velocities and pressures).
The overall framework of the method applied is outlined in Fig. 1. The damage ratio is quantified
using an economic approach by establishing a ratio between the loss and the reconstruction value of
every individual element at risk exposed, if data on incurring losses is available (Austrian case study,
compare Fuchs et al. 2007). Alternatively, a synthetic approach of loss assessment may be used by
using e.g. averaged damage values empirically derived (Taiwanese case study, compare Lo et al. in
press). In a second set of calculations, this ratio obtained for every individual element at risk is linked
to the respective process intensities which are regularly documented ex-post by the respective
authorities or their subcontractors. Otherwise, if such data is not available, process intensities may
- 886 -
result from modelling approaches. For such assessment information on the elements at risk exposed
on the individual torrent fans is necessary, as well as data on the process intensities for the particular
hazardous events. As a result, scatterplots can be developed linking process intensities to object
vulnerability values (Fuchs et al. 2007). These data can be analysed using regression approaches in
order to develop vulnerability functions which serve as a proxy for the structural resistance of
buildings with respect to fluvial sediment transport processes or debris flows on the studied torrent
fans.
Damage ratio
Loss data
Loss proxy
oror
Reconstructionvalue
Reconstructionproxy
oror
Ex-postdocumentation
Process intensity
ModellingEx-postdocumentationEx-postdocumentation
Process intensity
ModellingModelling
Vulnerability function
oror
Fig. 1 Framework for the deduction of vulnerability functions for torrent events.
RESULTS FROM AUSTRIAN TEST SITES
Taking fluvial sediment transport as an example, Totschnig et al. (2011) presented a vulnerability
function which was deduced from three well-documented events in the Austrian Alps. These events
were triggered by extraordinary rainfall events and characterised by the mobilisation of high amounts
of bedload leading to considerable damage to the settlements located on the torrent fans (Fuchs et al.
in press). In total, 116 buildings were damaged in the three test sites, 67 of which were residential
buildings and included in their study. The total damage of the considered houses amounted to
approximately € 5.5 million while the individual loss was between € 438 and € 828,240. Because of
different building sizes, the reconstruction values showed a wide range from about € 221,000 to €
1.34 million. These variations lead to individual vulnerabilities ranging from 0.001 to 1.0, whereas the
mean vulnerability per exposed building was equal to 0.168. In Tab. 1, damage and property values,
the range of vulnerability, and the mean vulnerability per exposed residential building for the
individual test sites is shown.
Tab. 1 Number of buildings included in the study, reported loss, property value, range of vulnerability, and
mean vulnerability for each test site in the Austrian Alps.
Test site (event) Number of
buildings [N]
Reported
loss [€]
Property
value [€]
Range in
vulnerability
Mean
vulnerability
Stubenbach (2005) 28 4,851,800 13,483,267 0.013-1.000 0.369
Schnannerbach (2005) 10 403,700 6,444,471 0.005-0.131 0.045
Vorderbergerbach (2003) 29 260,509 17,629,091 0.001-0.045 0.015
In Fig. 2 the resulting vulnerability curve is shown, based on absolute deposition heights as a proxy
for process intensities in the affected area. The process intensity is plotted on the abscissa and the
damage ratio is plotted on the ordinate. In general, vulnerability increases with increasing intensity.
For low process intensities (I < 1 m) all distributions show a slow increase in vulnerability. For
medium process intensities (1 m ≤ I ≤ 2.5 m) the highest rate of increase in vulnerability is observed,
following an almost linear shape. For high process intensities (I > 2.5 m) the observed rate of increase
in vulnerability again decreases and the curves converge towards 1. Due to these specific shapes, the
- 887 -

effect of an increase in process intensity is different in all three sections of these curves; an increase
in process intensity of 0.5 m causes as such more additional damage at medium process intensities if
compared to low and high intensities. For the process intensity of 1.0 m to 1.5 m, the statistical spread
of the vulnerability values is considerable, which can be attributed to a possible intrusion of material
through building openings (Fuchs et al. 2007). The best-fitting function to describe the range in the
analysed data (highest value of utility) is a modified Weibull distribution (Totschnig et al. 2011),
which is highlighted in Fig. 2 by a bold graph.
Fig. 2 Different vulnerability functions for residential buildings based on deposition height as a proxy for the
process intensity. Vulnerability values originating from the study sites are indicated by dots. The best-fitting
function to describe the range in the analysed data (highest value of utility; Weibull) is highlighted in bold, and is
provided in terms of the mathematical notation (V = degree of loss, I = intensity, modified from Totschnig et al.,
2011).
Physical susceptibility of elements at risk and thus vulnerability is strongly dependent on the
construction material used. The developed vulnerability function is applicable to buildings which are
constructed by using brick masonry and concrete, a typical design in post-1950s building craft in
Alpine countries. Consequently, the adjusted function is applicable to this mixed construction type.
RESULTS FROM TEST SITES IN TAIWAN
Data from six counties were used in order to apply the method in mountain areas of Taiwan, almost
all of them from torrent events that occurred as a result from one typhoon event. On 7 August 2009,
typhoon Morakot hit Taiwan, resulting in more than 600 dead and approximately 70 missing persons,
a temporary evacuation of almost 25,000 residents, and around € 3.6 billion economic loss (Central
Emergency Operation Center 2009). For 39 buildings, the process intensity and the loss was recorded
after the event with sufficient accuracy, these buildings with a damage ratio between 0.05 and 1.0
were included in our analysis (Tab. 2).
Tab. 2 Construction material, number of buildings considered, range in process intensity, range of vulnerability,
and mean vulnerability for each construction type in the test sites in Taiwan.
Construction
material
Number of
buildings [N]
Range in process
intensity [m]
Range in
vulnerability
Mean
vulnerability
Wood 3 1.0-3.0 - 1.00
Sheet metal 4 1.0-2.0 0.05-1.00 0.76
Brick 16 1.0-3.5 0.05-1.00 0.71
Reinforced brick 10 1.5-4.0 0.10-1.00 0.63
Reinforced concrete 6 1.6-5.0 0.20-1.00 0.73
The best fitting function was again a Weibull function, however, with a very low coefficient of
determination (R2 = 0.172). This is due to the wide range in process intensities observed (1.0-5.0 m),
- 888 -

which are clearly above intensities usually observed in European mountain regions. As a result, the
mean vulnerability is also considerably higher than the mean values reported in Tab. 1 for the
Austrian test sites. To give an example, four out of six buildings composed from reinforced concrete
were affected a process intensities between 3.0 m and 5.0 m which obviously results in a high degree
of loss and therefore also in a comparatively high mean vulnerability. Moreover, the study involved
buildings with different construction material used, and therefore the resistance towards the impact of
torrent processes is considerably different.
During the field work, 13 buildings were assessed with a process intensity between 1.0 and 2.0 m and
a damage ratio of 100 %, which seems to be high compared to data presented for the European Alps
(due to overlap only six data points are visible in Fig. 3). These buildings were composed from brick
(7 buildings), wood (2 buildings), sheet-metal (3 buildings) and reinforced concrete (1 building). Only
if these 13 buildings were excluded from the analysis, the Weibull function followed a similar shape
as for the Austrian case study (Fig. 3), and the coefficient of determination was reasonable
(R2 = 0.739). Apparently, this is not the aim of a statistical treatment of data, since the exclusion of
nearly one third of data from the population leads to considerable biases, and restricts the overall
explanatory power.
Fig. 3 Different vulnerability functions for buildings based on deposition height as a proxy for the process
intensity. Vulnerability values originating from the study sites are indicated by dots. The best-fitting function to
describe the range in the analysed data (highest value of utility; Weibull) is highlighted in bold. Since between
1.0 and 2.0 m process intensity, 13 buildings were assessed with a damage ratio of 1.0, the best fitting approach
did not result in reasonable outcomes. If these data points were neglected in the statistical treatment, an adopted
Weibull function results and is provided in terms of the mathematical notation (V = degree of loss, I = intensity).
DISCUSSION: LIMITATIONS OF TRANSFER
The application of a method developed in the context of the European Alps to another mountain
environment clearly has some limitations.
(1) The first shortcoming is that in environments affected by tropical cyclones much higher
rainfall intensities are observed than in regions characterised by a warm-temperate maritime
and continental climate sensu Lauer and Frankenberg (1988). As a result, the triggered torrent
magnitudes and intensities are much higher.
(2) Secondly, unlimited sediment supply – amplified by a multi-hazard situation such as
translational landsliding of the slopes in the upper part of the torrent catchments (Kappes et
al. 2010), which leads to a temporal channel blocking and a subsequent erosion with a high
flood hydrograph (Chen et al. 2004) – may result in process patterns other than those
observed in the European Alps so far.
- 889 -
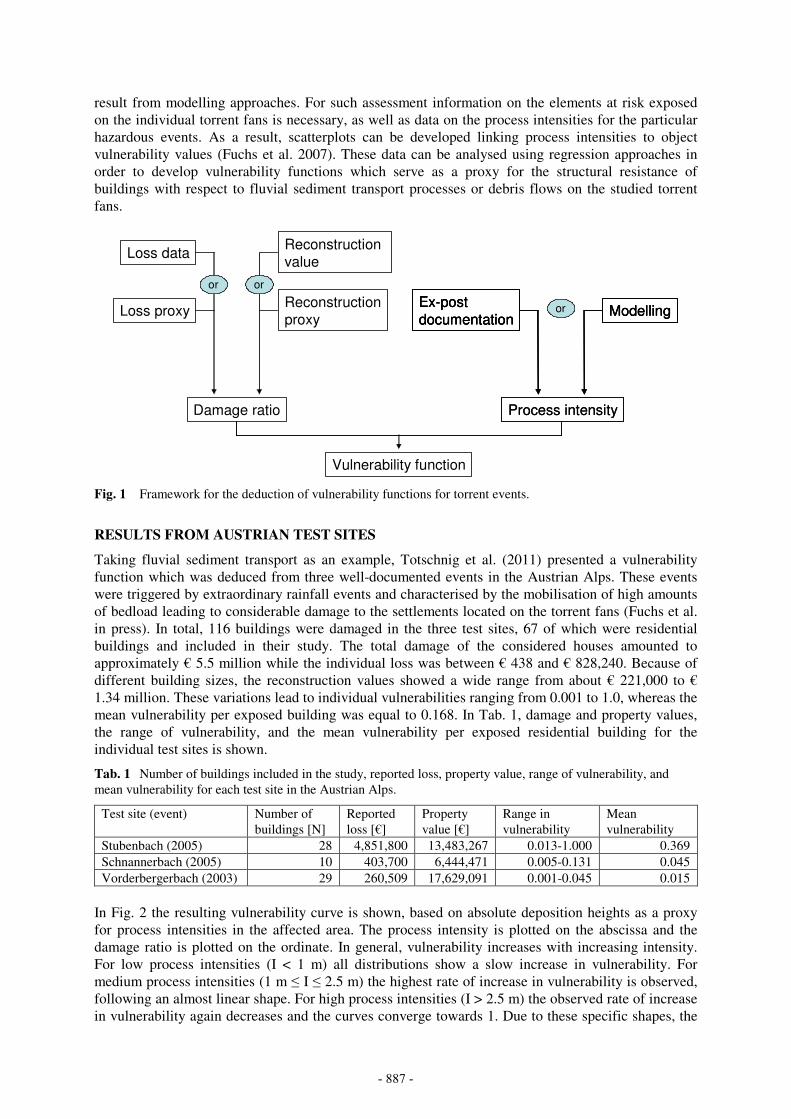
Fig. 4 Typical damage patterns for buildings affected by torrent processes in Taiwan (top) and Austria
(bottom). Upper left: Songhe community, Taiwan, event of August 2004, upper right: Min-Zu community,
Taiwan, event of August 2009, lower left: Pfunds community, Austria, event of August 2005, lower right:
Wartschensiedlung village, event of August 1997. Credits: upper left: S. Fuchs (27 August 2011), upper right: S.
Fuchs (28 August 2011), lower left: Gebietsbauleitung 6.2 (23 August 2005), lower right: anonymous (event of
16 August 1997).
Putting these two aspects in a broader context, the application of the concept of frequency and
magnitude to different mountain environments may be the explanation for these different system
behaviours in Austria and Taiwan: Each process has internal threshold values or external trigger
values at which the process becomes effective and is initiated, and sediment transport and landform
change is mobilised (Brunsden 2002). Since the work of Melton (1958) there have been many
attempts to predict the frequency or magnitude of torrent processes based on basin variables (Johnson
et al. 1991) in combination with geomorphic indicators (Jakob and Jordan 2001). Traditional
approaches to determining frequency and magnitude have centred on fluvial processes (Wolman and
Miller 1960) and have dealt with frequency in terms of discrete hydrological events and magnitude by
measures of volume or mass of water and sediment associated with those events. They assume a direct
relationship between the hydrological processes and the geomorphic response, such as the capacity of
the water body to entrain and transport a certain amount of sediment in dependence of the exerted
shear stress (combination of flow velocity and flow depth) and the grain size (Hjulstöm 1935).
Therefore, these approaches have been empirically applied to a wide spectrum of geomorphic
processes in recent decades (see e.g., Crozier and Glade 1999). With respect to torrent processes, such
a frequency-magnitude approach (1) provides the rationale for extrapolating short-term measurements
of episodic processes over longer periods, and (2) allows at a first glance the statistical identification
of the most relevant work force operating within a system, thereby providing a key variable for
- 890 -

predicting other system qualities (Crozier 1999) such as vulnerability. Nevertheless, multi-hazard
patterns – understood in terms of a hazard chain such as landsliding and subsequent channel blocking
within a catchment – are not a priori identifiable with such an approach.
Focusing on the elements at risk exposed damage patterns observed vary considerably. Even if
building materials used and construction techniques differ between the two case studies, buildings in
Taiwan and in Austria are regularly filled with debris material which penetrated through building
openings and damaged outer walls (Fig. 4). While in Taiwan these buildings are either reinforced
brick based on a concrete frame or reinforced concrete (16 out of 39 studied buildings), often due to
the earthquake-resistance building codes, the typical alpine building style is dominated by brick
masonry and concrete baseplates. As a result, given the same impact pressure the buildings in Austria
would collapse while the buildings in Taiwan still resist even if an economic total loss is evident, as
shown in Fig. 4, upper right. In Taiwan buildings are regularly heavily damaged (damage ratio
> 50 %, 25 out of 39 buildings), while in Austria only few buildings are a total loss (Totschnig et al.
2011). These differences are again a result of different impact towards elements at risk exposed,
resulting from different process characteristics.
With respect to the losses recorded, some issues arise for a transfer of the method. In the Austrian
case studies, loss data was collected using information derived from the individual administrative
bodies on the Federal State level. Professional damage appraisers of these administrative bodies
estimated the loss of any individual element at risk in monetary terms on an object level. Losses
which can be attributed to the building envelope only were identified and prepared for the subsequent
analysis. These monetary loss assessments were applied within this study for the calculation of the
damage ratio of every individual element at risk, defined by the ratio between loss and reconstruction
value. Principally the case studies in Taiwan were assessed similarly, however, if the claimant
received compensation in terms of an alternative building supplied by the governmental
administration, by public social aid or relief organisations, the loss ratio of the damaged building
mandatory had to be assessed with 1.0 since a further economic use of the (partly) damaged structure
is not allowed. This regulation necessarily leads to some biases during the economic assessment of the
loss ratio, such as for the building shown in Fig 4, upper left: Even if the accumulated debris could be
removed from the interior, and even if serious structural damage was not reported, the building had to
be abundant and therefore the loss ratio equals the construction costs of the building. In contrast, if
the claimant is not supplied with a new building in an alternative location, the governmental
compensation in Taiwan is a lump sum independent from the damage height, while losses in Austria
(if they are compensated, compare the discussion in Holub and Fuchs 2009) are in relation to the
actual amount of damage.
CONCLUSION: FUTURE CHALLENGES
Two particular challenges were identified during the comparison of case studies carried out in Austria
and in Taiwan. Firstly, event documentation is a requirement to precisely identify process patterns
and to provide an accurate input into hazard modelling. Secondly, a legally prescribed land-use
planning and associated building regulation are inevitably necessary if future losses due to torrent
events should be reduced.
(1) The fact that vulnerability is hazard-dependant should not be ignored (Papathoma-Köhle et al.
2011). Information regarding the properties of the hazardous phenomenon should be collected
as well as information regarding the impact of past events on the built environment.
Standardised event documentation is crucial which has been comprehensively discussed in the
framework of the DIS-ALP project (Berger et al. 2007). Moreover, the vulnerability
assessment method differs with the type of disaster and therefore, characteristics regarding its
frequency and magnitude should be taken into consideration. For hazard analysis, the
frequency of a torrent event may be described by several probability concepts and in different
ways, such as the probability of the main triggering mechanism (e.g., recurrence interval of
meteorological phenomena), or the probability to reach a defined point during run-out in the
deposition area. The determination of frequency must be accompanied by an estimation of
magnitude for the potential event, which is a matter of scale. Therefore, it is necessary to
- 891 -
explicitly define which probability value is used in the set of calculations. Several methods
have been proposed to estimate the likelihood of debris flow occurrence in a particular torrent
catchment (e.g., Nakamura 1980; Rickenmann and Zimmermann 1993; VanDine 1985).
However, there are no rigorous methods that allow a strict determination of an exact
probability or magnitude for any torrential process so far, neither based on physically
measured characteristics of a catchment nor based on statistical analyses. The information
available on past torrential events is often the most reliable indication (Rickenmann 1999).
Therefore, a sound multi-scale event documentation on the catchment level, but also on the
level of individual elements at risk exposed, is desirable, and is a particular challenge with
respect to climate change (Keiler et al. 2010) and multi-hazard analyses (Kappes et al. 2012).
(2) Legislation related to natural hazards is diverse in both countries studied. Due to the federal
structure of the Republic of Austria, several articles at federal level are supplemented by
various regulations on the level of the Federal States and even below at community level, in
particular with respect to land use planning (Holub and Fuchs 2009). In Taiwan, the Disaster
Prevention and Protection Act was issued in the year 2000. However, this act is less focused
on regional development and land use planning than the Austrian regulations, it is rather
centred on disaster response and recovery responsibilities of governmental agencies. A
regulation or ordinance related to land development and land use zoning on a national scale is
under development for almost two decades. On a regional scale, the Geology Act recently put
into force regulates some development restrictions with respect to natural hazards, however,
the enforcement with respect to hazard mapping and zoning will still take some years for a
comprehensive implementation. Land use planning activities such as hazard maps are based
on the concept of recurrence intervals of hazard processes. Since the hazard potential and thus
the delimitation of hazard zones is subject to temporal changes, the resulting coping strategies
in order to minimise risk have to be variable. From the point of view of spatial planning
dealing with such changes is of particular difficulty since the required stability of the law
restricts short-term modifications in land use planning regulations to a minimum. In particular
building bans and re-zoning of already permitted land development activities remain an
unsolved task since once enacted and approved by the regulatory authority additional
prescriptions or prohibitions could hardly be accomplished. Hence, the overlap between
hazard areas and areas used for settlement purpose and economic activities increasingly
provokes conflicts of interest that need to be addressed in natural hazard risk management.
Nevertheless, due diligence as legal obligation resulting in usage limitations and prohibitions
executed during the individual construction process is inevitable, in particular with respect to
the prescription of local structural protection.
WIDER IMPLICATIONS
Given the sharp rise in studies related to the quantification of vulnerability for buildings exposed to
torrent processes (Fuchs et al. 2007; Akbas et al. 2009; Tsao et al. 2010; Quan Luna et al. 2011;
Totschnig et al. 2011), a comparative analysis of data still remains vaguely proposed and fragmentary
(see also Papathoma-Köhle et al., this volume). This is even more surprising if the limited amount of
data, which is repeatedly stated in the conclusion sections of the above-cited papers, is taken into
consideration. Within our study we combined data from Austrian test sites and data from Taiwan
torrent fans in order to analyse similarities and differences with respect to the damage ratio and the
process intensity. Moreover, methodological shortcomings and avoidable pitfalls were identified and
discussed, aiming at a better applicability of the method and an in-depth understanding of
vulnerability beyond economic quotients.
- 892 -

Fig. 5 Debris flow evacuation map for the Songhe community, Taiwan. Source: http://246eng.swcb.gov.tw/
debrispage/refugeimg.asp, accessed 01 October 2011.
Fig. 6 Monitoring station of Qiang-Huang-Keng, catchment no. Tainan DF 048, Taiwan. Source: http://246eng.
swcb.gov.tw/information/monitoringstations.aspx, accessed 01 October 2011.
Future needs concerning vulnerability research might include the temporal changes in vulnerability to
natural hazards. During the past decades, European mountain regions as well as Taiwan experienced
major transformations in population size, economic conditions, social characteristics and development
patterns. As a result of this evolution in socio-economic activity, and an associated relative increase of
- 893 -

individual assets, vulnerability might have changed considerably (Fuchs et al. 2005; Keiler et al.
2006). To improve natural hazard risk management, these changes should be quantified according to
arising institutional, economic, and social implications.
Apart from such academic concerns, methods to reduce vulnerability to natural hazards may include
innovative approaches of risk sharing, as discussed in Holub and Fuchs (2009). These approaches are
pillared by a mandatory insurance system against natural hazards, based on premiums which are
commensurate with the risk. Thereby, legislation, loss compensation, and risk transfer are
accompanied by the overall aim to increase risk awareness and to implement a sustainable and long-
term land use planning. In order to achieve this goal, information on hazard and risk at a specific
location should be communicated in a target-oriented way to the stakeholders involved in order to
create risk awareness and to provide incentives for vulnerability-reducing behaviour. So far, in
European mountain regions the focus is more on loss compensation, while in Taiwan the emphasis is
put on evacuation. Therefore, in Taiwan evacuation maps and procedures are publicly available (Fig.
5), and real-time information disaster prevention information is available online for major catchments
(Fig. 6), while in Austria such information is not yet available. It has been shown by Fuchs et al.
(2009) how standardised guidelines for the visual representation of risk could be used to improve the
dissemination of information accordingly. As a result, overall vulnerability to mountain hazards may
decrease in the future.
ACKNOWLEDGEMENTS
The authors kindly acknowledge the financial support of the following institutions: The Austrian
Science Fund (FWF: contract L535-N10) for supporting the analyses in the Austrian test sites, the
European Union (7th Framework Programme, MOVE project: contract 211590) for insights gained
with respect to the situation in the European Alps, and the Soil and Water Conservation Bureau,
Nantou, Taiwan, for supporting the field work in Taiwan. Moreover, S. F. and M. K. kindly would
like to thank the staff of the Geotechnical Engineering Research Centre, Sinotech Engineering
Consultants, Taipei, Taiwan, for their warm hospitality and the inspiring discussions.
REFERENCES
Akbas S.O., Blahut J., Sterlacchini S. (2009). Critical assessment of existing physical vulnerability
estimation approaches for debris flows. In: Malet J., Remaître A., Bogaard T. (eds). Landslide
processes: from geomorphological mapping to dynamic modelling. CERG Editions, Strasbourg,
229-233.
Alexander D. (2005). Vulnerability to landslides. In: Glade T., Anderson M., Crozier M. (eds).
Landslide hazard and risk. John Wiley & Sons, Chichister, 175-198.
Aulitzky H. (1980). Preliminary two-fold classification of torrents. In: Aulitzky, H., Grubinger, H.,
Nemecek, E. (eds). International Symposium Interpraevent – Bad Ischl. Forschungsgesellschaft für
vorbeugende Hochwasserbekämpfung, Klagenfurt, 285-310.
Berger E., Grisotto S., Hübl J., Kienholz H., Kollarits S., Leber D., Loipersberger A., Marchi L.,
Mazzorana B., Moser M., Nössing T., Riedler S., Scheidl C., Schmid F., Schnetzer I., Siegel H.,
Volk G. (2007). DIS-ALP. Disaster information system of alpine regions. Final report. www.dis-
alp.org/modules/UpDownload/store_folder/DIS_ALP_final_report_v1_0.pdf, access 01 October
2011.
Birkmann J. (2006). Measuring vulnerability to promote disaster-resilient societies: Conceptual
frameworks and definitions. In: Birkmann J. (ed). Measuring vulnerability to natural hazards.
United Nations University Press, Tokyo, 9-54.
Brooks N. (2003). Vulnerability, risk and adaptation: A conceptual framework. Tyndall Centre for
Climate Change Research Working Paper 38.
Brunsden D. (2002). Geomorphological roulette for engineers and planners: some insights into an old
game. Quarterly Journal of Engineering Geology Hydrogeology 35, 101-142.
Central Emergency Operation Center (2009). Typhoon Morakot disaster responses reports from
typhoon Morakot Central Emergency Operating Center 74th report.
www.nfa.gov.tw/upload/content/2009/20090909/2009998323063.pdf, access 01 October 2011.
- 894 -

Chen C.-Y., Chen T.-C., Yu F.-C., Hung F.-Y. (2004). A landslide dam breach induced debris flow - a
case study on downstream hazard areas delineation. Environmental Geology 47, 91-101.
Commission of the European Communities (2007). Directive of the European Parliament and of the
Council on the assessment and management of floods. http://eur-
lex.europa.eu/LexUriServ/LexUriServ.do?uri=OJ:L:2007:288:0027:0034:en:pdf, access 01
October 2011.
Crozier M. (1999). The frequency and magnitude of geomorphic processes and landform behaviour.
Zeitschrift für Geomorphologie Suppl.-Bd. 115, 35-50.
Crozier M., Glade T. (1999). Frequency and magnitude of landsliding: Fundamental research issues.
Zeitschrift für Geomorphologie Suppl.-Bd. 115, 141-155.
Cutter S. (1996). Vulnerability to environmental hazards. Progress in Human Geography 20, 529-539.
Cutter S. (2003). The vulnerability of science and the science of vulnerability. Annals of the
Association of American Geographers 93, 1-12.
Fell R., Corominas J., Bonnard C., Cascini L., Leroi E., Savage W. (2008). Guidelines for landslide
susceptibility, hazard and risk zoning for land-use planning. Engineering Geology 102, 85-98.
Fuchs S. (2009). Susceptibility versus resilience to mountain hazards in Austria – Paradigms of
vulnerability revisited. Natural Hazards and Earth System Sciences 9, 337-352.
Fuchs S., Heiss K., Hübl J. (2007). Towards an empirical vulnerability function for use in debris flow
risk assessment. Natural Hazards and Earth System Sciences 7, 495-506.
Fuchs S., Keiler M., Zischg A., Bründl M. (2005). The long-term development of avalanche risk in
settlements considering the temporal variability of damage potential. Natural Hazards and Earth
System Sciences 5, 893-901.
Fuchs S., Ornetsmüller C., Totschnig R. (in press). Spatial scan statistics in vulnerability assessment –
an application to mountain hazards. Natural Hazards.
Fuchs S., Spachinger K., Dorner W., Rochman J., Serrhini K. (2009). Evaluating cartographic design
in flood risk mapping. Environmental Hazards 8, 52-70.
Hjulstöm F. (1935). Studies of the morphological activity of rivers as illustrated by the river Fyris.
Bulletin of the Geological Institute 25, 221-527.
Holub M., Fuchs S. (2009). Mitigating mountain hazards in Austria – Legislation, risk transfer, and
awareness building. Natural Hazards and Earth System Sciences 9, 523-537.
Hübl J., Fuchs S., Sitter F., Totschnig R. (2011). Towards a frequency-magnitude relationship for
torrent events in Austria. In: Genevois R., Hamilton D., Prestininzi A. (eds). Proceedings of the 5th
International Conference on Debris-Flow Hazards Mitigation: Mechanics, Prediction and
Assessment. Casa Editrice Università La Sapienza, Padova, 895-902.
International Standards Organisation (2009). ISO 31000:2009, Risk management – Principles and
guidelines. ISO, Geneva.
Jakob M., Jordan P. (2001). Design flood estimates in mountain streams – the need for a geomorphic
approach. Canadian Journal of Civil Engineering 28, 425-439.
Johnson P., McCuen R., Hromadka T. (1991). Magnitude and frequency of debris flows. Journal of
Hydrology 123, 68-82.
Kappes M., Keiler M., Glade T. (2010). From Single- to Multi-Hazard Risk Analyses: a concept
addressing emerging challenges. In: Malet J.-P., Glade T., Casagli N. (eds). Mountain risks:
bringing science to society. CERG, Strasbourg, 351-356.
Kappes M., Papathoma-Köhle M., Keiler M. (2012). Assessing physical vulnerability for multi-
hazards using an indicator-based methodology. Applied Geography 32, 577-590.
Keiler M. (in press) World-wide trends in natural disasters. In: Bobrowski P. (ed). Encyclopedia of
natural hazards. Springer, Dordrecht.
Keiler M., Knight J., Harrison S. (2010). Climate change and geomorphological hazards in the eastern
European Alps. Philosophical Transactions of the Royal Society of London Series A:
Mathematical, Physical and Engineering Sciences 368, 2461-2479.
Keiler M., Sailer R., Jörg P., Weber C., Fuchs S., Zischg A., Sauermoser S. (2006). Avalanche risk
assessment – a multi-temporal approach, results from Galtür, Austria. Natural Hazards and Earth
System Sciences 6, 637-651.
Lauer W., Frankenberg P. (1988). Klimaklassifikation der Erde. Geographische Rundschau 40, 55-59.
- 895 -

Lo W.-C., Tsao T.-C., Hsu C.-H. (in press). Building vulnerability to debris flows in Taiwan – a
preliminary study. Natural Hazards.
Melton M. (1958). Correlation structure of morphometric properties of drainage systems and their
controlling agents. Journal of Geology 66, 442-460.
Nakamura J. (1980). Investigation manual on prediction of occurrence of Dosekiryu [debris flows],
delineation of dangerous zone affected by Dosekiryu and arrangement of warning and evacuation
system in mountain torrents in Japan. In: In: Aulitzky, H., Grubinger, H., Nemecek, E. (eds).
International Symposium Interpraevent – Bad Ischl. Forschungsgesellschaft für vorbeugende
Hochwasserbekämpfung, Klagenfurt, 41-81.
ONR (2009). Schutzbauwerke der Wildbachverbauung – Begriffe und ihre Definitionen sowie
Klassifizierung. ONR 24800. Österreichisches Normungsinstitut, Wien.
Papathoma-Köhle M., Kappes M., Keiler M., Glade T. (2011). Physical vulnerability assessment for
alpine hazards: state of the art and future needs. Natural Hazards 58, 645-680.
Quan Luna B., Blahut J., van Westen C., Sterlacchini S., van Asch T., Akbas S. (2011). The
application of numerical debris flow modelling for the generation of physical vulnerability curves.
Natural Hazards and Earth System Sciences 11, 2047-2060.
Rickenmann D. (1999). Empirical relationships for debris flows. Natural Hazards 19, 47-77.
Rickenmann D., Zimmermann M. (1993). The 1987 debris flows in Switzerland: documentation and
analysis. Geomorphology 8, 175-189.
Slaymaker O. (1988) The distinctive attributes of debris torrents. Hydrological Sciences Journal 33,
567-573.
Totschnig R., Sedlacek W., Fuchs S. (2011). A quantitative vulnerability function for fluvial sediment
transport. Natural Hazards 58, 681-703.
Tsao T.-C., Hsu W.-K., Cheng C.-T., Lo W.-C., Chen C.-Y., Chang Y.-L., Ju J.-P. (2010). A
preliminary study of debris flow risk estimation and management in Taiwan. In: Chen S.-C. (ed).
Internationales Symposion Interpraevent in the Pacific Rim – Taipei (26.-30. April). Internationale
Forschungsgesellschaft Interpraevent, Klagenfurt, 930-939.
VanDine D. (1985). Debris flows and debris torrents in the Southern Canadian Cordillera. Canadian
Geotechnical Journal 22, 44-68.
Wolman M., Miller J. (1960). Magnitude and frequency of forces in geomorphic processes. Journal of
Geology 68, 54-74.
- 896 -