Embed Size (px)
Citation preview

Chemosphere 119 (2015) 1126–1133
Contents lists available at ScienceDirect
Chemosphere
journal homepage: www.elsevier .com/locate /chemosphere
Quantitative proteomic analysis reveals proteins involvedin the neurotoxicity of marine medaka Oryzias melastigma chronicallyexposed to inorganic mercury
http://dx.doi.org/10.1016/j.chemosphere.2014.09.0530045-6535/� 2014 Elsevier Ltd. All rights reserved.
⇑ Corresponding author. Tel./fax: +86 592 2880219.E-mail address: [email protected] (M. Wang).
Yuyu Wang a,b, Dazhi Wang a, Lin Lin a, Minghua Wang a,⇑a Key Laboratory of the Ministry of Education for Coastal and Wetland Ecosystems, College of the Environment and Ecology, Xiamen University, Xiamen 361005, Chinab Center for Environmental Health Research, South China Institute of Environmental Sciences, Ministry of Environmental Protection of the People’s Republic of China,Guangzhou 510655, China
h i g h l i g h t s
�We investigated protein profiles of fish brain using 2D-DIGE analysis.� Accumulation of Hg and the cellular ultrastructure of fish brain were examined.� The results showed that Hg was significantly accumulated in the fish brain.� Inorganic Hg caused noticeable damage to the fish brain.� Multiple proteins and biological processes are involved in Hg neurotoxicity.
a r t i c l e i n f o
Article history:Received 26 January 2014Received in revised form 11 September 2014Accepted 18 September 2014Available online 15 October 2014
Handling Editor: J. de Boer
Keywords:Inorganic mercuryMarine medakaNeurotoxicityProteomics
a b s t r a c t
Mercury is a ubiquitous environmental contaminant which exerts neurotoxicity upon animals.Nevertheless, the molecular mechanisms involved in inorganic mercury neurotoxicity are unknown.We investigated protein profiles of marine medaka, chronically exposed to mercuric chloride usingtwo-dimensional difference gel electrophoresis (2D-DIGE) and matrix-assisted laser desorption/ionizationtandem time-of-flight mass spectrometry (MALDI-TOF-TOF MS) analysis. The mercury accumulation andultrastructure were also examined in the brain. The results showed that mercury was significantlyaccumulated in the treated brain, and subsequently caused a noticeable damage. The comparison of2D-DIGE protein profiles between the control and treatment revealed that 16 protein spots were remark-ably altered in abundance, which were further submitted for MALDI-TOF-TOF MS analysis. The identifiedproteins indicated that inorganic mercury may cause neurotoxicity through the induction of oxidativestress, cytoskeletal assembly dysfunction and metabolic disorders. Thus, this study provided a basis fora better understanding of the molecular mechanisms involved in mercury neurotoxicity.
� 2014 Elsevier Ltd. All rights reserved.
1. Introduction
Mercury is a ubiquitous environmental contaminant found inocean and freshwater fish, shellfish, and plants, and it causes awide range of adverse effects in humans (Ung et al., 2010). Mercurypollution originating from anthropogenic activities and industrial-ization has resulted in several catastrophes in Japan (Kudo et al.,1998), Iraq (Bakir et al., 1973) and the Amazon basin (Pfeifferand Lacerda, 1988). Moreover, many high-risk sites have beenidentified in Asia (Li et al., 2009). Mercury pollution has becomea worldwide public health concern.
In the environment, mercury exists in three forms possessingdifferent bioavailability and toxicity: the metallic element, inor-ganic salts and organic compounds (Clarkson, 2002; Mousaviet al., 2011). Among them, methylmercury (MeHg) is consideredto be the most toxic and has extensively been studied. MeHg canpass through the blood-brain barrier and accumulate in the centralnervous system (CNS) in both humans and fish (Aschner et al.,2007; Clarkson and Magos, 2006), thus leading to neurologicaldamage to the brain (Berntssen et al., 2003; Clarkson, 1997;Zheng et al., 2003). Moreover, MeHg also causes toxicity to the kid-neys, as well as the CNS, and cardiovascular, gastrointestinal, andimmune systems (Holmes et al., 2009; Virtanen et al., 2007). Sev-eral molecular and cellular mechanisms of MeHg toxicity havebeen postulated. However, so far, little is known concerning the

Y. Wang et al. / Chemosphere 119 (2015) 1126–1133 1127
molecular mechanisms involved in the neurotoxicity caused byinorganic mercury, although inorganic mercury species are widelydistributed in the environment (Fitzgerald, 2003; Goldman andShannon, 2001). Guzzi and La Porta (2008) report that MeHg isslowly metabolized to inorganic mercury by the intestinal micro-flora, and elevated levels of inorganic mercury are found in thebrains of humans, pups and monkeys exposed to MeHg (Daviset al. 1994; Ishitobi et al., 2010; Vahter et al., 1995). Thus, evenafter MeHg exposure, mercury toxicity to organisms might beascribed to inorganic mercury attack, due to the conversion ofMeHg to inorganic mercury. Furthermore, infants and childrenpresent a higher absorption rate of inorganic mercury comparedto adults (Goyer and Clarkson, 2001; Walsh, 1982). Overall, it isvery important to explore the molecular mechanisms of inorganicmercury neurotoxicity in organisms.
Two-dimensional fluorescence difference gel electrophoresis(2D-DIGE) is a newly developed quantitative proteomic approach,which directly labels lysine groups on proteins with cyanine CyDyeDIGE Fluor minimal dyes prior to isoelectric focusing, enabling thelabeling of 2–3 samples with different dyes and electrophoresis ofall the samples on the same 2D-DIGE gel (Tannu and Hemby,2006). 2D-DIGE has facilitated vital advances in the measurementof protein expression alterations in control and treatment samples.Recently this approach has been applied to investigate the toxicitymechanisms of several pollutants in aquatic organisms (Eyckmanset al., 2012; Roland et al., 2013).
In our study, marine medaka (Oryzias melastigma) were chroni-cally exposed to different mercuric chloride (HgCl2) concentrations(1 or 10 lg L�1) for 60 d, and the protein profiles of the brains ofexposed and non-exposed medaka were analyzed using 2D-DIGE,and the differentially expressed protein spots were identified usingmatrix-assisted laser desorption/ionization tandem time-of-flightmass spectrometry (MALDI-TOF-TOF MS) analysis. In addition, themercury content as well as cellular ultrastructural changes in thebrain were also investigated. This study aimed to elucidate themode-of-action of inorganic mercury neurotoxicity, and to identifypotential protein biomarker candidates for aquatic environmentalmonitoring.
2. Materials and methods
2.1. Medaka exposure experiment
Medaka (O. melastigma) were acclimatized in aerated seawatertanks for 15 d prior to the experiment at a water temperature of25 �C under a 12 h light/dark cycle, and fed twice a day, 9:00 amand 3:00 pm, with commercial artemia dry bait. Then, fish (weigh-ing 0.5 ± 0.05 g) were randomly assigned to three experimentalgroups for exposure to two mercury treatments, 1 and 10 lg L�1,and non-exposure. Each treatment included two groups with 40 fish.The experiments were carried out in glass tanks (44 � 30 � 28 cm3)with 30 L filtered seawater water and lasted for 60 d under the sameconditions as during acclimation described above. Each day half ofthe aged water was renewed with fresh seawater containing 1 or10 lg L�1 HgCl2, or none. No mortality was found in the controland 1 lg L�1-treated groups, but 5% were observed to be dead inthe 10 lg L�1 treatment. At the end of exposure, the brains of 24medaka (12 fish per tank) were dissected and pooled. Then thepooled tissues were randomly divided into three parts, and sub-jected to proteomic analysis, representing three independent repli-cates. For the mercury accumulation analysis, the brains of another36 medaka (18 fish per tank) were collected and divided into threeparts, concomitantly producing three replicates for each treatment.The remaining carcasses were fixed in 2.5% glutaraldehyde for cellultrastructure analysis. It should be noted that the medaka used inthis study were mixed-sex adult fish with the same age of six
months. All seawater used was filtered through 0.45 lm acetatefiber membranes, with the background concentration of total-mer-cury (T-Hg) being 0.0051 lg L�1. The seawater characteristics weredescribed as follows: dissolved oxygen, 6.2–6.7 mg L�1; salinity,29–30 PSU; and pH, 8.0–8.1.
2.2. Mercury concentration analysis
T-Hg concentrations in the medaka brain were measured usingthe EPA 7474 method, with a few modifications. After freeze-dry-ing for 2 d, the tissues were digested in 70% nitric acid in a heatingblock at 80 �C overnight. In the hydrochloride/bromate/bromidemixture (Sigma–Aldrich), mercury was oxidized with stannouschloride (Wako) and analyzed using cold vapor atomic fluores-cence spectrometry (CVAFS, Brooks Rand Model III). Standard ref-erence materials (Mussel Homogenate IAEA 142 and Tuna FishFlesh homogenate IAEA 436) were concurrently digested and mea-sured for T-Hg, and the recoveries were >90% in the standards. TheT-Hg content of the medaka brains was measured as ng g�1 dryweight (DW), and the data were expressed as mean values ± stan-dard deviation (SD).
2.3. Ultrastructure analysis
For ultrastructure analysis, fish brains were fixed in 2.5%glutaraldehyde in 0.1 M phosphate buffer (pH 7.3) for 3 h at 4 �C.The fixed brains were washed three times using 0.1 M phosphatebuffer (pH 7.3) at 20 min intervals with periodic agitation, thenfurther fixed in 1% osmium tetroxide for 2 h at 4 �C, followed bya phosphate buffer wash three times at 20 min intervals. Afterdehydration in alcohol, brains were embedded in Epon-Araldite.Ultra-thin sections (50–80 nm) were moved onto titanium grids,stained with uranyl acetate and lead citrate and observed using aJEM 2100 Transmission Electron Microscope. Image analysis wasconducted using the ImageJ 1.36 program (NIH, Washington, DC).
2.4. Proteomic analysis
2.4.1. Protein extractionFrozen fish brains were suspended in 1 mL of 10% w/v trichloro-
acetic acid (TCA)/acetone for 1 h at 4 �C. After centrifugation at18000 g for 30 min at 4 �C, the pellets were recovered and subse-quently homogenized in 1.0 mL of 20% TCA/acetone (w/v) lysis buf-fer using an ultrasonic disrupter. The supernatant was removed bycentrifugation at 18000 g for 30 min at 4 �C, and the pellet waswashed twice with 80% acetone (v/v) and twice with ice-cold ace-tone. The pellet was recovered by centrifugation at 18000 g for30 min at 4 �C each time. Residual acetone was removed in aSpeedVac for about 5 min. The pellet was dissolved in 120 lL rehy-dration buffer containing 30 mM Tris, 7 M urea, 2 M thiourea, and4% CHAPS (Bio-Rad, USA). The solution was centrifuged at 20000 gfor 30 min at 10 �C and the supernatant was collected for 2D-DIGEanalysis. Protein concentrations were quantified using the 2-DQuant kit (GE Healthcare).
2.4.2. CyDye labelingThe proteins were labeled with CyDyes for performing 2D-DIGE.
Prior to protein labeling, the pH of the samples was checked with apH indicator strip and, if necessary, the pH was adjusted to 8.5using 50 mM NaOH. An internal standard was prepared by makinga mixture with equal amounts of all the samples used in this exper-iment. The protein samples were labeled with Cy3 or Cy5 cyaninedye and the internal standard with Cy2 dye, by adding 400 pmol ofCyDye per 50 lg protein. The labeling reaction was performed for30 min on ice in the dark. Afterward, the reaction was quenched

1128 Y. Wang et al. / Chemosphere 119 (2015) 1126–1133
with the addition of 1 lL 10 mM L-lysine (Sigma, USA) followed byincubation for 10 min on ice in the dark.
2.4.3. 2D-DIGE analysisAfter labeling, the samples were combined according to the
dye-swapping scheme, as shown in Table 1. The combined mix-tures containing 150 lg protein were brought up to a final volumeof 450 lL with 1 � rehydration buffer, after which 0.5% IPG buffer4-7 (GE healthcare, USA) was added and they were thoroughlymixed. The labeled samples were then applied to the strips on anEttan IPGphor III Isoelectric Focusing System (GE Healthcare,USA). Isoelectric focusing was conducted for a total of 60 kV-husing the following conditions: 40 V for 5 h, 100 V for 6 h, gradientto 500 V in 30 min, gradient to 1000 V in 30 min, gradient to2000 V in 1 h, gradient to 10000 V in 1 h, and finally 10000 V for6 h. After the first dimension was run, each strip was equilibratedwith about 10 mL equilibration buffer containing 50 mM Tris (pH8.8), 6 M urea, 30% glycerol, 2% SDS, 1% DTT and a trace amountof bromophenol blue, for 17 min. The strip was then placed in freshequilibration buffer containing 2.5% iodoacetamide (instead ofDTT) for another 17 min. Subsequently an 11.5% SDS-PAGE seconddimension was performed. Electrophoresis was carried out at10 mA gel�1 for 15 min, followed by a 6 h run at 200 V until thebromophenol blue front reached the edge of the gels. The proteinspot patterns of the three different dyes were acquired using anEttan DIGE Imager laser scanner (GE Healthcare) at the excita-tion/emission wavelength of 488/520 nm (Cy2), 532/670 nm(Cy3), and 633/670 nm (Cy5). The exposure time of the laser waschosen in such a way that the protein spots had no saturated sig-nal. After imaging for CyDye, the gels were further subjected to sil-ver staining.
2.4.4. Data analysisImage analysis was performed with the aid of the DeCyder ver-
sion 6.5 suite (GE Healthcare, USA). First, protein spot detectionand quantification compared with the internal standard as a vol-ume ratio was performed with the Differential In-gel Analysismodule. Second, protein spots on different gels were matched,and statistical analysis was carried out with the Biological Varia-tion Analysis module. The one-way ANOVA test (P < 0.05) was usedto pick out the significant differentially expressed protein spotsamong the groups. When the spots were selected to be significant,they were carefully checked for correct matching throughout allthe gels and were included in the pick list. The fold changes oftreatment/control were calculated based on their differences instandardized abundance.
2.4.5. Silver stainingSilver staining was performed following the method of Wang
et al. (2010). Briefly, the gel was fixed for 2 h initially in a fixationsolution containing 40% (v/v) ethanol and 10% (v/v) acetic acid. Itwas then sensitized in a solution containing 30% (v/v) ethanol,0.2% (w/v) sodium thiosulphate, 6.8% (w/v) sodium acetate and
Table 1Experimental design for the 2D-DIGE proteome profiling.
Gel Cy2 Cy3 Cy5
1 Internal standard Control 1 Low treatment 12 Internal standard High treatment 1 Control 23 Internal standard Low treatment 2 Control 34 Internal standard Control 4 High treatment 25 Internal standard Low treatment 3 High treatment 3
Note: At least three replicate samples for each group (control, 1 and 10 lg L�1
mercury treatments) were used and labeled with Cy3 or Cy5. Each gel contained aninternal standard and two samples. The 1 and 10 lg L�1 mercury treatments wereassigned as low and high treatments respectively.
0.125% (v/v) glutaraldehyde, followed by three Milli-Q waterwashes (5 min each time). Then the gel was stained for 20 min in0.25% (w/v) silver nitrate with 0.015% (v/v) formaldehyde andwashed twice with Milli-Q water (0.5 min each time). The gel wasdeveloped in 2.5% (w/v) sodium carbonate containing 0.0074% (v/v) formaldehyde. The reaction was stopped with 1.5% (w/v) ethyl-enediaminetetraacetic acid, disodium salt.
2.4.6. Mass spectrometric analysisThe altered protein spots were manually excised from 2-DE
gels. The gel pieces were washed with buffer containing 25 mMammonium bicarbonate in 50% acetonitrile (ACN), destained with30 mM potassium ferricyanide and 100 mM sodium thiosulfate,and washed again with 25 mM ammonium bicarbonate in 50%ACN. After dehydration with 100% ACN, the dry gel pieces weredigested by adding 10.0 ng lL�1 trypsin (Promega, Madison, WI)in 10 mM ammonium bicarbonate overnight at 37 �C. For MALDI-TOF/TOF MS analysis, 1 lL of the digest mixture was mixed on-tar-get with 0.5 lL of 100 mM a-cyano-4-hydroxy-cinnamic acid in50% ACN and 0.1% trifluoroacetic acid on the target plate beforebeing dried and analyzed with a MALDI-TOF/TOF mass spectrome-ter (5800 Proteomics Analyzer, Applied Biosystems, Foster City,CA). MALDI-TOF MS and TOF-TOF tandem MS were performedand data were acquired in the positive MS reflector mode with ascan range from 900 to 4000 Da, and five monoisotopic precursors(S/N > 200) were selected for MS/MS analysis. For interpretation ofthe mass spectra, a combination of peptide mass fingerprints andpeptide fragmentation patterns was used for protein identificationin an NCBI nonredundant database using the Mascot search engine(http://www.matrixscience.com). All mass values were consideredmonoisotopic, and the mass tolerance was set at 75 ppm. Onemissed cleavage site was allowed for trypsin digestion; cysteinecarbamidomethylation was assumed as a fixed modification, andmethionine was assumed to be partially oxidized. Results withC.I.% (Confidence Interval%) values greater than 95% were consid-ered to be a positive identification. The identified proteins werethen matched to specific processes or functions by searching GeneOntology (http://www.geneontology.org/).
2.5. Statistical tests
All measurements were replicated at least three times and thedata were expressed as mean values ± standard deviation (SD). Sta-tistical analysis was carried out using a one-way ANOVA or anindependent-samples t-test to evaluate whether the means weresignificantly different among the groups. Significant differenceswere indicated at P < 0.05. Prior to one-way ANOVA, data werelog transformed to meet ANOVA assumptions of normality andvariance homoscedasticity.
3. Results
3.1. Mercury accumulation in the medaka brain
After exposure to HgCl2 for 60 d, the medaka brain was subjectedto T-Hg content analysis. T-Hg concentration in the brain of unex-posed medaka was 163.8 ± 13.2 ng g�1 DW. However, the presenceof HgCl2 significantly enhanced mercury accumulation in the mer-cury-exposed medaka brains (Fig. 1; P < 0.001), i.e. the T-Hg con-tents reached 8582.9 ± 168.7 and 12329.4 ± 287.9 ng g�1 DW inthe medaka brains exposed to 1 and 10 lg L�1 HgCl2, respectively.
3.2. Effects of HgCl2 on cellular ultrastructure in the medaka brain
The ultrastructure of medaka brain chronically exposed to HgCl2
is shown in Fig. 2. The results showed that the neurocyte of

0
100
200
300
400
2000400060008000
100001200014000160001800020000
b
b
aT-H
g co
nten
t (n
g g_ 1
DW
)
Treatment
Fig. 1. Total-mercury (T-Hg) content in the brain tissue of the medaka Oryziasmelastigma after 60 d exposure to different mercury chloride (HgCl2) concentrations(control, 1 and 10 lg L�1). Data are expressed as mean values ± SD (n = 3). Differentletters indicate a statistically significant difference at P < 0.05.
Y. Wang et al. / Chemosphere 119 (2015) 1126–1133 1129
unexposed medaka contained few cisternae in the cell. Meanwhile,the well-shaped organelles were evenly distributed in the cellularcytoplasm (Fig. 2A). Numerous ribosomes as well as mitochondriawere found in the cells. However, after 60 d exposure, widespreadcisternae were observed in the cytoplasm, with dilation or evenvesiculation, especially in the medaka brain exposed to 10 lg L�1
HgCl2. Ridge disappearance and swelling of the mitochondria werealso observed in the treatment. In the control, myelinated nervefibers were tightly packed, slender and uniform-shaped (Fig. 2B).However, the arrangement of the myelinated nerve fiber in the
A
B
Fig. 2. Transmission electron micrographs of brain cells of the medaka Oryzias melastigmaand 10 lg L�1). (A) Mitochondria (black arrow) and cisternae (white arrow). (B) Myelina
mercury exposed medaka brain became loose and a large numberof separated nodes of Ranvier directly induced discontinuation ofthe nerve fibers.
3.3. 2D-DIGE analysis of differential protein expression
In total, nine samples were obtained in this study (three biolog-ical replicates per group). After being labeled with Cy3 or Cy5, thesamples were run in five gels together with an internal standardlabeled with Cy2 (Table 1). The internal standard represented anaverage of all the samples which were compared, and was usedas a normalization standard across all gels. A representative 2D-DIGE image is shown in Fig. 3. More than 600 protein spots couldbe matched with all the images. Among them, a total of 16 signif-icantly differentially expressed protein spots were detected with aone-way ANOVA test (P < 0.5 with differences of P1.5 in expres-sion). Among them, eight protein spots were significantly up-regu-lated in the mercury exposed medaka, while the other eight weredown-regulated.
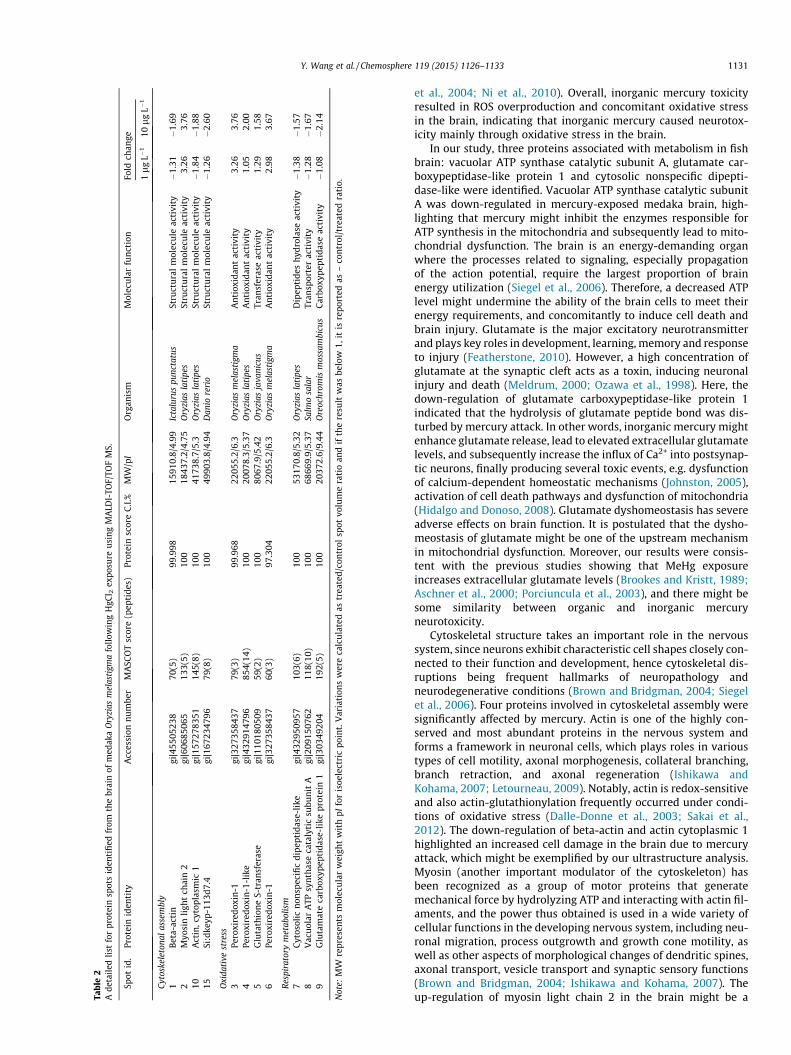
3.4. Identification of the differentially expressed proteins in themedaka brain
All the differentially expressed protein spots were submitted foridentification using MALDI-TOF-TOF MS analysis and searched inthe NCBI medaka database. Meanwhile, the protein spots whichcould not identified from the medaka fish database were searchedagainst the NCBI fish database. Consequently, 11 protein spots weresuccessfully identified with C.I.% values higher than 95% (Table 2).Of them, four oxidative stress proteins including glutathioneS-transferase (GST, spot 5), peroxiredoxin-1 (spots 3 and 6), andperoxiredoxin-1-like (spot 4) were up-regulated after mercuryexposure. Three proteins involved in metabolism were markedlydown-regulated under mercury treatment, and these were vacuolar
after 60 d exposure to different mercury chloride (HgCl2) concentrations (control, 1ted nerve fiber.

A
4 7pI
100 kD
10 kD
MW
81
7
16
4
13
11
12
105
3
6 2
14
9
15
DC B
Fig. 3. Representative proteome map of the differentially expressed proteins in medaka Oryzias melastigma brain. (A) The labeled proteins were visualized for all of thefluorophores, and the differentially expressed protein spots are marked with numbers. (B) Cy2 represents mixing equal amounts of all the proteins as the internal standard.(C) Cy3 indicates the protein sample of the treated group. (D) Cy5 indicates the protein sample of the control group.
1130 Y. Wang et al. / Chemosphere 119 (2015) 1126–1133
ATP synthase catalytic subunit A (spot 8), cytosolic nonspecificdipeptidase-like (spot 7) and glutamate carboxypeptidase-like pro-tein (spot 9). Interestingly, four proteins were concerned with cyto-skeletal assembly. Namely, beta-actin (spot 1), actin, cytoplasmic 1(spot 10), and si:dkeyp-113d7.4 (spot 15) were consistentlydepressed under mercury treatment; however, myosin light chain2 (spot 2) was increased in expression.
4. Discussion
Most studies are devoted to the nephrotoxicity of inorganicmercury in various aquatic organisms because inorganic mercuryis mostly accumulated in the kidney (Goering et al., 2000; Rana,2008; Risher and De Rosa, 2007; Zalups, 2000). However, the pres-ent study showed that high concentrations of mercury could beaccumulated in the brain after mercury exposure, which is in linewith previous studies that mercury evidently accumulates in thebrain under mercury chloride treatment (Agarwal and Behari,2007; Danscher et al., 1990; Hahn et al., 1990; Monteiro et al.,2010; Nylander and Weiner 1991; Yasutake et al., 2004). In ourstudy, mercury treatment caused noticeable damage to themedaka brain, i.e. the ridge disappearance and swelling of themitochondria, as well as the discontinuation of the nerve fiber intoa large number of separated nodes of Ranvier being observed in thetreated brain. Similarly, a study shows that nerves display disorga-nized disposition of axons and mainly disruption and dissociationof myelin sheaths in the brain of Trichomycterus brasiliensis afterexposure to inorganic mercury (Oliveira Ribeiro et al., 1996). Obvi-ous ultrastructural changes are also observed in the brain cortex ofrats due to inorganic mercury toxicity (Gajkowska et al., 1992).Taken together, our study demonstrated that the brain is animportant target organ of inorganic mercury and the exposure ofinorganic mercury might cause neurotoxicity to medaka.
Inorganic mercury has a great affinity for the SH groups ofendogenous biomolecules, reaching into the cells and tissuesattached to thiol-containing proteins and low-molecular-weightthiols (Perottoni et al., 2004), and hence affecting the expressionof various proteins (Agarwal and Behari, 2007). Proteomic analysisshowed that inorganic mercury caused a significant alteration ofprotein profiles in medaka brain, and the proteins involved in oxi-dative stress, cytoskeletal assembly and macromolecular metabo-lism were significantly affected by HgCl2 toxicity.
Peroxiredoxins play an important role in the removal of reactiveoxygen species (ROS), thus minimizing their deleterious effects(Radyuk et al., 2001). GST plays a critical role in the defense againstoxidative stress induced by cell injury (Sheehan et al., 1991), sinceit catalyzes the conjugation of glutathione with a variety of electro-philic compounds, including products resulting from oxidativedamage in biological membranes and macromolecules (Beckettand Hayes, 1993; Carmagnol et al., 1981; Guemouri et al., 1991).There is evidence that in the presence of hydroxide, GST may playa role as glutathione reductase to increase reduced glutathionecontent, hence reducing the cell damage generated by the ROS(Marrs, 1996). Moreover, brain GST is mainly found in the glialcompartment and in neurons (Cammer et al., 1989; Johnsonet al., 1993). The above proteins provide a major intracellulardefense against mercury-induced neurotoxicity (James et al.,2005). Consequently, the upregulation of peroxiredoxin-1, perox-iredoxin-1-like and GST in the brain might effectively cooperateto fight against excess ROS production caused by mercury toxicity,considering that the brain is especially vulnerable to free radical-induced damage because of its high oxygen consumption, abun-dant lipid content, and a limited amount of antioxidant capacity(Hasan et al., 2011). Previous studies also demonstrate that antiox-idant systems have significantly been affected by MeHg exposure,being attributed to mercury-induced ROS overproduction (Gatti
Tabl
e2
Ade
taile
dlis
tfo
rpr
otei
nsp
ots
iden
tifi
edfr
omth
ebr
ain
ofm
edak
aO
ryzi
asm
elas
tigm
afo
llow
ing
HgC
l 2ex
posu
reus
ing
MA
LDI-
TOF/
TOF
MS.
Spot
id.
Prot
ein
iden
tity
Acc
essi
onn
um
ber
MA
SCO
Tsc
ore
(pep
tide
s)Pr
otei
nsc
ore
C.I.
%M
W/p
IO
rgan
ism
Mol
ecu
lar
fun
ctio
nFo
ldch
ange
1l
gL�
110
lg
L�1
Cyto
skel
eton
alas
sem
bly
1B
eta-
acti
ngi
|455
0523
870
(5)
99.9
9815
910.
8/4.
99Ic
talu
rus
punc
tatu
sSt
ruct
ura
lm
olec
ule
acti
vity
�1.
31�
1.69
2M
yosi
nli
ght
chai
n2
gi|6
0685
065
133(
5)10
018
437.
2/4.
75O
ryzi
asla
tipe
sSt
ruct
ura
lm
olec
ule
acti
vity
3.26
3.76
10A
ctin
,cyt
opla
smic
1gi
|157
2783
5114
5(8)
100
4173
8.7/
5.3
Ory
zias
lati
pes
Stru
ctu
ral
mol
ecu
leac
tivi
ty�
1.84
�1.
8815
Si:d
keyp
-113
d7.4
gi|1
6723
4796
79(8
)10
049
903.
8/4.
94D
anio
reri
oSt
ruct
ura
lm
olec
ule
acti
vity
�1.
26�
2.60
Oxi
dati
vest
ress
3Pe
roxi
redo
xin
-1gi
|327
3584
3779
(3)
99.9
6822
055.
2/6.
3O
ryzi
asm
elas
tigm
aA
nti
oxid
ant
acti
vity
3.26
3.76
4Pe
roxi
redo
xin
-1-l
ike
gi|4
3291
4796
854(
14)
100
2007
8.3/
5.37
Ory
zias
lati
pes
An
tiox
idan
tac
tivi
ty1.
052.
005
Glu
tath
ion
eS-
tran
sfer
ase
gi|1
1018
0509
59(2
)10
080
67.9
/5.4
2O
ryzi
asja
vani
cus
Tran
sfer
ase
acti
vity
1.29
1.58
6Pe
roxi
redo
xin
-1gi
|327
3584
3760
(3)
97.3
0422
055.
2/6.
3O
ryzi
asm
elas
tigm
aA
nti
oxid
ant
acti
vity
2.98
3.67
Res
pira
tory
met
abol
ism
7C
ytos
olic
non
spec
ific
dipe
ptid
ase-
like
gi|4
3295
0957
103(
6)10
053
170.
8/5.
32O
ryzi
asla
tipe
sD
ipep
tide
sh
ydro
lase
acti
vity
�1.
38�
1.57
8V
acu
olar
ATP
syn
thas
eca
taly
tic
subu
nit
Agi
|209
1507
6211
8(10
)10
068
669.
9/5.
37Sa
lmo
sala
rTr
ansp
orte
rac
tivi
ty�
1.28
�1.
679
Glu
tam
ate
carb
oxyp
epti
dase
-lik
epr
otei
n1
gi|3
0349
204
192(
5)10
020
372.
6/9.
44O
reoc
hrom
ism
ossa
mbi
cus
Car
boxy
pept
idas
eac
tivi
ty�
1.08
�2.
14
Not
e:M
Wre
pres
ents
mol
ecu
lar
wei
ght
wit
hpI
for
isoe
lect
ric
poin
t.V
aria
tion
sw
ere
calc
ula
ted
astr
eate
d/co
ntr
olsp
otvo
lum
era
tio
and
ifth
ere
sult
was
belo
w1,
itis
repo
rted
as–
con
trol
/tre
ated
rati
o.
Y. Wang et al. / Chemosphere 119 (2015) 1126–1133 1131
et al., 2004; Ni et al., 2010). Overall, inorganic mercury toxicityresulted in ROS overproduction and concomitant oxidative stressin the brain, indicating that inorganic mercury caused neurotox-icity mainly through oxidative stress in the brain.
In our study, three proteins associated with metabolism in fishbrain: vacuolar ATP synthase catalytic subunit A, glutamate car-boxypeptidase-like protein 1 and cytosolic nonspecific dipepti-dase-like were identified. Vacuolar ATP synthase catalytic subunitA was down-regulated in mercury-exposed medaka brain, high-lighting that mercury might inhibit the enzymes responsible forATP synthesis in the mitochondria and subsequently lead to mito-chondrial dysfunction. The brain is an energy-demanding organwhere the processes related to signaling, especially propagationof the action potential, require the largest proportion of brainenergy utilization (Siegel et al., 2006). Therefore, a decreased ATPlevel might undermine the ability of the brain cells to meet theirenergy requirements, and concomitantly to induce cell death andbrain injury. Glutamate is the major excitatory neurotransmitterand plays key roles in development, learning, memory and responseto injury (Featherstone, 2010). However, a high concentration ofglutamate at the synaptic cleft acts as a toxin, inducing neuronalinjury and death (Meldrum, 2000; Ozawa et al., 1998). Here, thedown-regulation of glutamate carboxypeptidase-like protein 1indicated that the hydrolysis of glutamate peptide bond was dis-turbed by mercury attack. In other words, inorganic mercury mightenhance glutamate release, lead to elevated extracellular glutamatelevels, and subsequently increase the influx of Ca2+ into postsynap-tic neurons, finally producing several toxic events, e.g. dysfunctionof calcium-dependent homeostatic mechanisms (Johnston, 2005),activation of cell death pathways and dysfunction of mitochondria(Hidalgo and Donoso, 2008). Glutamate dyshomeostasis has severeadverse effects on brain function. It is postulated that the dysho-meostasis of glutamate might be one of the upstream mechanismin mitochondrial dysfunction. Moreover, our results were consis-tent with the previous studies showing that MeHg exposureincreases extracellular glutamate levels (Brookes and Kristt, 1989;Aschner et al., 2000; Porciuncula et al., 2003), and there might besome similarity between organic and inorganic mercuryneurotoxicity.
Cytoskeletal structure takes an important role in the nervoussystem, since neurons exhibit characteristic cell shapes closely con-nected to their function and development, hence cytoskeletal dis-ruptions being frequent hallmarks of neuropathology andneurodegenerative conditions (Brown and Bridgman, 2004; Siegelet al., 2006). Four proteins involved in cytoskeletal assembly weresignificantly affected by mercury. Actin is one of the highly con-served and most abundant proteins in the nervous system andforms a framework in neuronal cells, which plays roles in varioustypes of cell motility, axonal morphogenesis, collateral branching,branch retraction, and axonal regeneration (Ishikawa andKohama, 2007; Letourneau, 2009). Notably, actin is redox-sensitiveand also actin-glutathionylation frequently occurred under condi-tions of oxidative stress (Dalle-Donne et al., 2003; Sakai et al.,2012). The down-regulation of beta-actin and actin cytoplasmic 1highlighted an increased cell damage in the brain due to mercuryattack, which might be exemplified by our ultrastructure analysis.Myosin (another important modulator of the cytoskeleton) hasbeen recognized as a group of motor proteins that generatemechanical force by hydrolyzing ATP and interacting with actin fil-aments, and the power thus obtained is used in a wide variety ofcellular functions in the developing nervous system, including neu-ronal migration, process outgrowth and growth cone motility, aswell as other aspects of morphological changes of dendritic spines,axonal transport, vesicle transport and synaptic sensory functions(Brown and Bridgman, 2004; Ishikawa and Kohama, 2007). Theup-regulation of myosin light chain 2 in the brain might be a

Fig. 4. The proposed scheme illustrating cellular events in brain tissue of medaka fish resulting from inorganic mercury toxicity.
1132 Y. Wang et al. / Chemosphere 119 (2015) 1126–1133
compensatory reaction to instability of the actin cytoskeleton dueto mercury toxicity. Moreover, it is suggested that myosin lightchain 2 is not only a component of each myosin molecule (Collinset al., 1986), but also a member of the superfamily of Ca2+-bindingproteins (Moncrief et al., 1990), hinting an importance of calciumhomeostasis in inorganic mercury neurotoxicity.
5. Conclusions
This study aimed to investigate, for the first time, the proteomeof medaka brain exposed to inorganic mercury and to provide newinsights into the molecular mechanism concerning inorganic mer-cury-induced neurotoxicity. The results showed that mercury wasable to accumulate in the brain, and caused damage to the cellularultrastructure of the medaka brain. Proteomic analysis demon-strated that proteins involved in oxidative stress, cytoskeletal dis-ruptions and energy metabolism dysregulation were significantlyaffected by inorganic mercury, suggesting that inorganic mercuryresulted in the neurotoxicity mainly through oxidative stress, cyto-skeletal assembly dysfunction and metabolic disorders in themedaka brain (Fig. 4). It seems that inorganic mercury neurotox-icity is complex and diverse, and that multiple proteins and biolog-ical processes are involved. We noticed that the proteomic responsein this study showed some similarity with that in the medaka brainacutely exposed to HgCl2 in our previous work (Wang et al., 2011),i.e. the major cellular processes affected by inorganic mercury tox-icity were similar in terms of their general functional categories(e.g. cytoskeletonal assembly, oxidative stress, and energy metabo-lism). However, most of the individual proteins were different,highlighting that the toxic mechanisms caused by acute or chronicmercury attack were different. It should also be noted that severalprotein spots were definitely identified as the same protein (i.e.spots 3 and 6 for peroxiredoxin-1), and these proteins are likelyto be protein isoforms. Protein isoforms can arise from alternativemRNA splicing and various post-translational modifications, suchas cleavage, phosphorylation, acetylation, and glycosylation.
Acknowledgements
This work was supported by the National Natural Science Foun-dation of China (Nos. 40806051 and 41476094). The authorsappreciate the kind help of Dr. Wen-Xiong Wang and Ke Pan
(The Hong Kong University of Science & Technology) in mercuryanalysis. Professor John Hodgkiss (The University of Hong Kong)is thanked for polishing the English in this manuscript.
References
Agarwal, R., Behari, J.R., 2007. Role of selenium in mercury intoxication in mice. Ind.Health 45, 388–395.
Aschner, M., Yao, C.P., Allen, J.W., Tan, K.H., 2000. Methylmercury alters glutamatetransport in astrocytes. Neurochem. Int. 37, 199–206.
Aschner, M., Syversen, T., Souza, D.O., Rocha, J.B., Farina, M., 2007. Involvement ofglutamate and reactive oxygen species in methylmercury neurotoxicity. Braz. J.Med. Biol. Res. 40, 285–291.
Bakir, F., Damluji, S.F., Amin-Zaki, L., Murtadha, M., Khalidi, A., al-Rawi, N.Y., Tikriti,S., Dahahir, H.I., Clarkson, T.W., Smith, J.C., Doherty, R.A., 1973. Methylmercurypoisoning in Iraq. Science 181, 230–241.
Beckett, G.J., Hayes, J.D., 1993. Glutathione-s-transferase: biomedical applications.Adv. Clin. Chem. 30, 282–380.
Berntssen, M.H.G., Aatland, A., Handy, R.D., 2003. Chronic dietary mercury exposurecauses oxidative stress, brain lesions, and altered behaviour in Atlantic salmon(Salmo salar) parr. Aquat. Toxicol. 65, 55–72.
Brookes, N., Kristt, D.A., 1989. Inhibition of amino acid transport and proteinsynthesis by HgCl2 and methylmercury in astrocytes: selectivity andreversibility. J. Neurochem. 53, 1228–1237.
Brown, M.E., Bridgman, P.C., 2004. Myosin function in nervous and sensory systems.Neurobiology 58, 118–130.
Cammer, W., Tansey, E., Abramovitz, M., Ishigaki, S., Listowski, I., 1989. Differentiallocalization of glutathione-S-transferases Yp and Yb subunits inoligodendrocytes and astrocytes of rat brain. J. Neurochem. 52, 876–883.
Carmagnol, F., Sinet, P.M., Rapin, J., Jerome, H., 1981. Glutathione-S-transferase ofhuman red blood cells, assay, values in normal subjects, and in two pathologicalcircumstance; Hyperbilirubinemia, and impaired renal function. Clin. Chim.Acta 117, 209–217.
Clarkson, T.W., 1997. The toxicology of mercury. Crit. Rev. Clin. Lab. Sci. 34, 369–403.
Clarkson, T.W., 2002. The three modern faces of mercury. Environ. Health Perspect.110, 11–23.
Clarkson, T.W., Magos, L., 2006. The toxicology of mercury and its chemicalcompounds. Crit. Rev. Toxicol. 36, 609–662.
Collins, J.H., Theibert, J.L., Dalla Libera, L., 1986. Amino acid sequence of rabbitventricular myosin light chain-2: identity with the slow skeletal muscleisoform. Biosci. Rep. 6, 655–661.
Dalle-Donne, I., Rossi, R., Giustarini, D., Colombo, R., Milzani, A., 2003. Actin S-glutathionylation: evidence against a thiol-disulphide exchange mechanism.Free Radic. Biol. Med. 35, 1185–1193.
Danscher, G., Horsted-Bindslev, P., Rungby, J., 1990. Traces of mercury in organsfrom primates with amalgam fillings. Exp. Mol. Pathol. 52, 291–299.
Davis, L.E., Kornfeld, M., Mooney, H.S., Fiedler, K.J., Haaland, K.Y., Orrison, W.W.,Cernichiari, E., Clarkson, T.W., 1994. Methylmercury poisoning: long-termclinical, radiological, toxicological, and pathological studies of an affectedfamily. Ann. Neurol. 35, 680–688.
Y. Wang et al. / Chemosphere 119 (2015) 1126–1133 1133
Eyckmans, M., Benoot, D., Van Raemdonck, G.A., Zegels, G., Van Ostade, X.W.,Witters, E., Blust, R., De Boeck, G., 2012. Comparative proteomics of copperexposure and toxicity in rainbow trout, common carp and gibel carp. Comp.Biochem. Physiol. Part D Genom. Proteom. 7, 220–232.
Featherstone, D.E., 2010. Intercellular glutamate signaling in the nervous systemand beyond. ACS Chem. Neurosci. 1, 4–12.
Fitzgerald, W.F., 2003. Geochemistry of mercury in the environment. In: Lollar, B.S.(Ed.), In Environmental Geochemistry, Treatise on Geochemistry, vol. 9.Elsevier-Pergamon, Oxford, pp. 107–148.
Gajkowska, B., Szumanska, G., Gadamski, R., 1992. Ultrastructural alterations ofbrain cortex in rat following intraperitoneal administration of mercuricchloride. J. Hirnforsch. 33, 471–476.
Gatti, R., Belletti, S., Uggeri, J., Vettori, M.V., Mutti, A., Scandroglio, R., Orlandini, G.,2004. Methylmercury cytotoxicity in PC12 cells is mediated by primaryglutathione depletion independent of excess reactive oxygen speciesgeneration. Toxicology 204, 175–185.
Goering, P.L., Fisher, B.R., Noren, B.T., Papaconstatinou, A., Rojko, J.L., Marler, R.J.,2000. Mercury induces regional and cell-specific stress protein expression in ratkidney. Toxicol. Sci. 53, 447–457.
Goldman, L.R., Shannon, M.W., 2001. Technical report: mercury in the environment:implications for pediatricians. Pediatrics 108, 197–205.
Goyer, R.A., Clarkson, T.W., 2001. Toxic effects of metals. In: Klaassen, C.D. (Ed.),Casarett & Doull’s Toxicology: The Basic of Poisons, sixth ed. McGraw Hill, NY,pp. 822–826.
Guemouri, L., Artur, Y., Herbeth, B., Jeandel, C., Cuny, G., Siest, G., 1991. Biologicalvariability of superoxide dismutase, glutathione peroxidase and catalase inblood. Clin. Chem. 37, 1932–1941.
Guzzi, G., La Porta, C.A., 2008. Molecular mechanisms triggered by mercury.Toxicology 244, 1–12.
Hahn, L.J., Kloiber, R., Leininger, R.W., Vimy, M.I., Lorscheider, F.L., 1990. Whole-body imaging of the distribution of mercury released from dental fillings intomonkey tissues. FASEB J. 4, 3256–3260.
Hasan, S., Bilal, N., Naqvi, S., Ashraf, G.M., Suhail, N., Sharma, S., Banu, N., 2011.Multivitamin-mineral and vitamins (E + C) supplementation modulate chronicunpredictable stress-induced oxidative damage in brain and heart of mice. Biol.Trace Elem. Res. 142, 589–597.
Hidalgo, C., Donoso, P., 2008. Crosstalk between calcium and redox signaling: frommolecular mechanisms to health implications. Antioxid. Redox Signal. 10,1275–1312.
Holmes, P., James, K.A., Levy, L.S., 2009. Is low-level environmental mercuryexposure of concern to human health. Sci. Total Environ. 408, 171–182.
Ishikawa, R., Kohama, K., 2007. Actin-binding proteins in nerve cell growth cones. J.Pharmacol. Sci. 105, 6–11.
Ishitobi, H., Sander Stern, S., Thurston, S.W., Zareba, G., Langdon, M., Gelein, R.,Weiss, B., 2010. Organic and inorganic mercury in neonatal rat brain afterprenatal exposure to methylmercury and mercury vapor. Environ. HealthPerspect. 118, 242–248.
James, S.J., Slikker, W., Melnyk, S., New, E., Pogribna, M., Jernigan, S., 2005.Thimerosal neurotoxicity is associated with glutathione depletion: protectionwith glutathione precursors. Neurotoxicology 26, 1–8.
Johnson, J.A., el Barbary, A., Kornguth, S.E., Brugge, J.F., Siegel, F.L., 1993.Glutathione-S-transferase isoenzymes in rat brain neurons and glia. J.Neurosci. 13, 2013–2023.
Johnston, M.V., 2005. Excitotoxicity in perinatal brain injury. Brain Pathol. 15, 234–240.
Kudo, A., Fujikawa, Y., Miyahara, S., Zheng, J., Takigami, H., Sugahara, M.,Muramatsu, T., 1998. Lessons from minamata mercury pollution, Japan – aftera continuous 22 years of observation. Water Sci. Technol. 38, 187–193.
Letourneau, P.C., 2009. Actin in axons: stable scaffolds and dynamic filaments.Results Probl. Cell Differ. 48, 265–290.
Li, P., Feng, X.B., Qiu, G.L., Shang, L.H., Li, Z.G., 2009. Mercury pollution in Asia: areview of the contaminated sites. J. Hazard. Mater. 168, 591–601.
Marrs, K.A., 1996. The functions and regulation of glutathione S-transferases inplants. Annu. Rev. Plant Physiol. Plant Mol. Biol. 47, 127–158.
Meldrum, B.S., 2000. Glutamate as a neurotransmitter in the brain: review ofphysiology and pathology. J. Nutr. 130, 1007–1015.
Moncrief, N.D., Kretsinger, R.H., Goodman, M., 1990. Evolution of EF-hand calcium-modulated proteins: relationships based on amino acid sequences. J. Mol. Evol.30, 522–562.
Monteiro, D.A., Rantin, F.T., Kalinin, A.L., 2010. Inorganic mercury exposure:toxicological effects, oxidative stress biomarkers and bioaccumulation in thetropical freshwater fish matrinxã, Brycon amazonicus (Spix and Agassiz, 1829).Ecotoxicology 19, 105–123.
Mousavi, A., Chávez, R.D., Ali, A.M.S., Cabanissa, S.E., 2011. Mercury in naturalwaters: a mini-review. Environ. Forensics 12, 14–18.
Ni, M.W., Li, X., Yin, Z.B., Jiang, H.Y., Sidoryk-Wegrzynowicz, M., Milatovic, D., Cai,J.Y., Aschner, M., 2010. Methylmercury induces acute oxidative stress,altering Nrf2 protein level in primary microglial cells. Toxicol. Sci. 116,590–603.
Nylander, M., Weiner, J., 1991. Mercury and selenium concentrations and theirinterrelations in organs from dental staff and the general population. Br. J. Ind.Med. 48, 729–734.
Oliveira Ribeiro, A.O., Fanta, E., Turcatti, N.M., Cardoso, R.J., Carvalho, C.S., 1996.Lethal effects of inorganic mercury on cells and tissues of Trichomycterusbrasiliensis (Pisces; Siluroidei). Biocell 20, 171–178.
Ozawa, S., Kamiya, H., Tsuzuki, K., 1998. Glutamate receptors in the mammaliancentral nervous system. Prog. Neurobiol. 54, 581–618.
Perottoni, J., Rodrigues, O.E.D., Paixao, M.W., Zeni, G., Lobato, L.P., Braga, A.L., Rocha,J.B.T., Emanuelli, T., 2004. Renal and hepatic ALA-D activity and selectedoxidative stress parameters of rats exposed to inorganic mercury andorganoselenium compounds. Food Chem. Toxicol. 42, 17–28.
Pfeiffer, W.C., Lacerda, L.D., 1988. Mercury inputs in the Amazon region. Environ.Technol. Lett. 9, 325–330.
Porciuncula, L.O., Rocha, J.B., Tavares, R.G., Ghisleni, G., Reis, M., Souza, D.O., 2003.Methylmercury inhibits glutamate uptake by synaptic vesicles from rat brain.NeuroReport 14, 577–580.
Radyuk, S.N., Klichko, V.I., Spinola, B., Sohal, R.S., Orr, W.C., 2001. The peroxiredoxingene family in Drosophila melanogaster. Free Radic. Biol. Med. 31, 1090–1100.
Rana, S.V.S., 2008. Metals and apoptosis: recent developments. J. Trace Elem. MedBiol. 22, 262–284.
Risher, J.F., De Rosa, C.T., 2007. Inorganic: the other mercury. J. Environ. Health 70,9–16.
Roland, K., Kestemont, P., Hénuset, L., Pierrard, M.A., Raes, M., Dieu, M., Silvestre, F.,2013. Proteomic responses of peripheral blood mononuclear cells in theEuropean eel (Anguilla anguilla) after perfluorooctane sulfonate exposure.Aquat. Toxicol. 128–129, 43–52.
Sakai, J., Li, J., Subramanian, K.K., Mondal, S., Bajrami, B., Hattori, H., Jia, Y.,Dickinson, B.C., Zhong, J., Ye, K., Chang, C.J., Ho, Y.S., Zhou, J., Luo, H.R., 2012.Reactive oxygen species-induced actin glutathionylation controls actindynamics in neutrophils. Immunity 37, 1037–1049.
Sheehan, D., Crimmins, K.M., Burnell, G.M., 1991. Evidence for glutathione S-transferase activity in Mytilus edulis as an index of chemical pollution inmarine estuaries, in: Jeffrcy, D.W., Maden, B. (Eds.), Bioindicators andEnvironmental Management. London, pp. 419–425.
Siegel, G.J., Albers, R.W., Brady, S.T., Price, D.L., 2006. Basic Neurochemistry:Molecular, Cellular, and Medical Aspects, seventh ed. Elsevier Academic Press,Amsterdam.
Tannu, N.S., Hemby, S.E., 2006. Two-dimensional fluorescence difference gelelectrophoresis for comparative proteomics profiling. Nat. Protoc. 1, 1732–1742.
Ung, C.Y., Lam, S.H., Hlaing, M.M., Winata, C.L., Korzh, S., Mathavan, S., Gong, Z.,2010. Mercury-induced hepatotoxicity in zebrafish: in vivo mechanisticinsights from transcriptome analysis, phenotype anchoring and targeted geneexpression validation. BMC Genom. 11, 212–227.
Vahter, M.E., Mottet, N.K., Friberg, L.T., Lind, S.B., Charleston, J.S., Burbacher, T.M.,1995. Demethylation of methyl mercury in different brain sites of Macacafascicularis monkeys during long-term subclinical methylmercury exposure.Toxicol. Appl. Pharmacol. 134, 273–284.
Virtanen, J., Rissanen, T., Voutilainen, S., Tuomainen, T., 2007. Mercury as a riskfactor for cardiovascular disease. J. Nutr. Biochem. 18, 75–85.
Walsh, C.T., 1982. The influence of age on the gastrointestinal absorption ofmercury chloride and methyl mercury chloride in the rat. Environ. Res. 27, 412–420.
Wang, M., Chan, L.L., Si, M., Hong, H., Wang, D., 2010. Proteomic analysis of hepatictissue of zebrafish (Danio rerio) experimentally exposed to chronic microcystin-LR. Toxicol. Sci. 113, 60–69.
Wang, M., Wang, Y., Wang, J., Lin, L., Hong, H., Wang, D., 2011. Proteome profiles inmedaka (Oryzias melastigma) liver and brain experimentally exposed to acuteinorganic mercury. Aquat. Toxicol. 103, 129–139.
Yasutake, A., Sawada, M., Shimada, A., Satoh, M., Tohyama, C., 2004. Mercuryaccumulation and its distribution to metallothionein in mouse brain after sub-chronic pulse exposure to mercury vapor. Arch. Toxicol. 78, 489–495.
Zalups, R.K., 2000. Molecular interactions with mercury in the kidney. Pharmacol.Rev. 52, 113–143.
Zheng, W., Aschner, M., Ghersi-Egea, J.F., 2003. Brain barrier systems: a new frontierin metal neurotoxicological research. Toxicol. Appl. Pharmacol. 192, 1–11.