Embed Size (px)
Citation preview

EnvironmentalScienceProcesses & Impacts
PAPER
Publ
ishe
d on
13
Janu
ary
2014
. Dow
nloa
ded
by U
nive
rsity
of
Win
dsor
on
31/1
0/20
14 0
5:16
:14.
View Article OnlineView Journal | View Issue
aGeosyntec Consultants, Inc., 130 Research
Canada. E-mail: [email protected];
515 0831bDepartment of Earth and Environmental Sc
Ontario, CanadacDepartment of Chemistry, University of Wa
† Electronic supplementary informa10.1039/c3em00652b
Cite this: Environ. Sci.: ProcessesImpacts, 2014, 16, 482
Received 30th November 2013Accepted 13th January 2014
DOI: 10.1039/c3em00652b
rsc.li/process-impacts
482 | Environ. Sci.: Processes Impacts,
Quantitative passive soil vapor sampling forVOCs- part 1: theory†
Todd McAlary,*ac Xiaomin Wang,b Andre Unger,b Hester Groenevelta
and Tadeusz Goreckic
Volatile organic compounds are the primary chemicals of concern at many contaminated sites and soil
vapor sampling and analysis is a valuable tool for assessing the nature and extent of contamination. Soil
gas samples are typically collected by applying vacuum to a probe in order to collect a whole-gas
sample, or by drawing gas through a tube filled with an adsorbent (active sampling). There are challenges
associated with flow and vacuum levels in low permeability materials, and leak prevention and detection
during active sample collection can be cumbersome. Passive sampling has been available as an
alternative to conventional gas sample collection for decades, but quantitative relationships between the
mass of chemicals sorbed, the soil vapor concentrations, and the sampling time have not been
established. This paper presents transient and steady-state mathematical models of radial vapor diffusion
to a drilled hole and considerations for passive sampler sensitivity and practical sampling durations. The
results indicate that uptake rates in the range of 0.1 to 1 mL min�1 will minimize the starvation effect for
most soil moisture conditions and provide adequate sensitivity for human health risk assessment with a
practical sampling duration. This new knowledge provides a basis for improved passive soil vapour
sampler design.
Environmental impact
Conventional soil vapor sampling for VOC analysis can be time-consuming if quality control measures are implemented to verify the absence of leaks andsample collection may be impractical in low-permeability soils. Passive adsorptive sampling has been an alternative to conventional active sampling for decades,but the uptake rate of the sampler has never been well understood or controlled, so passive sampling has been considered a qualitative or semi-quantitativemethod. This paper provides a theoretical framework using a combination of steady-state and transient mathematical models to support an improved design forpassive diffusive samplers for soil vapor monitoring, which minimizes the starvation effect, maximizes the sensitivity and provides quantitative concentrationmeasurements for a wide range of soil types.
Introduction
Knowledge of the spatial distribution of volatile organiccompound (VOC) vapors in the subsurface is essential forassessing human health risks associated with subsurface vapormigration and intrusion to indoor air, as well as for monitoringthe performance of related mitigation and remediation systems(sub-slab venting, soil vapor extraction, multiphase extraction,air sparging, bioventing, etc.). There are a wide variety ofdifferent methods and guidance available for soil vapor
Lane, #2, Guelph, Ontario, N1G 5G3,
Fax: +1 (519) 822-3151; Tel: +1 (519)
iences, University of Waterloo, Waterloo,
terloo, Waterloo, Ontario, Canada
tion (ESI) available. See DOI:
2014, 16, 482–490
sampling and analysis,1–8 but few comparative studies thatevaluate the relative performance between various active soilvapor sampling methods.9 Currently, the most commonmethod for collection and analysis of sub-slab or soil vaporsamples during vapor intrusion investigations in North America(and to varying degrees elsewhere) is an active method wherebysoil gas is drawn into an evacuated, passivated stainless steelcontainer (e.g., SilcoTek™ SilcoCan® or Summa® canisters)through a ow controller, followed by shipment to a laboratoryfor analysis by EPA Method TO-15.10 Sampling protocols forcanisters are complicated because subsurface permeabilitiesand soil vapor concentrations can both vary over many orders ofmagnitude and because care is needed to prevent and docu-ment the absence of leaks of atmospheric air into the sampletrain.11 Passive sampling does not involve applying a vacuum todraw a volume of gas as a sample, and with no induced pressuregradient, the potential for low bias attributable to leakage isdramatically reduced or eliminated.
This journal is © The Royal Society of Chemistry 2014

Paper Environmental Science: Processes & Impacts
Publ
ishe
d on
13
Janu
ary
2014
. Dow
nloa
ded
by U
nive
rsity
of
Win
dsor
on
31/1
0/20
14 0
5:16
:14.
View Article Online
At the present time, there are varying opinions regarding thereliability of soil vapor sampling for assessing human healthrisks posed by VOCs. For example, the ITRC vapor intrusionguidance6 states: “Soil gas data are recommended over otherdata, specically soil matrix and groundwater data, because soilgas data represent a direct measurement of the contaminantthat can potentially migrate into indoor air”. However, theempirical database of soil vapor and indoor air concentrationscompiled by the USEPA12 shows a worse correlation between soilvapor and indoor air VOC concentrations than the corre-sponding comparison between groundwater and indoor airVOC concentrations. It is not clear what role sampling errors orbiases play in the relatively poor correlation between soil vaporand indoor air concentrations; however, protocols using passivesampling devices are considerably simpler than active samplingprotocols, and simpler protocols are likely to reduce variabilityattributable to operator error, which provides an incentive toadvance the science of passive soil vapor sampling.
Passive sampling is an alternative approach with severalpotential advantages over conventional whole-gas sampling,including simpler protocols, smaller size for ease of shippingand handling, and lower overall cost (including the labor costfor sample collection). Much of the historic application ofpassive sampling has been indoor and outdoor air qualitymonitoring and industrial hygiene applications.13–17 Severalpassive soil gas sampling methods have been developed overthe past quarter century since the earliest efforts,18 includingPetrex tubes,19,20 EMFLUX®cartridges,21 Beacon B-Sure SampleCollection Kits™22 and Gore™Modules (formerly known as theGore-Sorber®).23 Each of these methods provides results in unitsof the mass adsorbed over the duration of the sample; however,the correlation between the mass adsorbed and the soil vaporconcentration has not been quantitatively established.21,23,24
Concentration values are needed for comparison to risk-basedscreening levels when assessing human health risks via vaporintrusion, so many regulatory guidance documents caution thatpassive soil gas sampling should only be used as a qualitative orsemi-quantitative screening tool.24,25Overcoming this limitationwas the primary motivation of this research.
Theory
Quantitative passive samplers are of two general varieties:equilibrium samplers (where the sampler equilibrates with thesurrounding medium), and kinetic samplers (where thesampler is designed to have a constant uptake rate throughoutthe sample duration). This paper deals exclusively with kineticpassive samplers because the focus of this research was humanhealth risk assessment associated with subsurface vapourintrusion to indoor air, where time-weighted average concen-trations are preferred.
The basic principles of operation for quantitative passivesamplers are as follows. Each device is supplied by the labora-tory certied clean and sealed in air-tight packing. The sampleris exposed to the air or soil gas being investigated for ameasured amount of time (t), during which VOCs diffuse orpermeate into the device from the surrounding gas or air in
This journal is © The Royal Society of Chemistry 2014
response to the chemical potential (i.e. concentration)gradient.26 A certain mass of VOCs is trapped by the sorptivemediumwithin the device. Aer sampling, the device is shippedin an air-tight container to the analytical laboratory, where themass sorbed is quantied. The time-weighted average (TWA)concentration (c) of a particular analyte in the medium beingsampled is then calculated as follows:26
c ¼ Mk
t(1)
where:c¼ TWA concentration of a particular analyte in the sampled
air [mg m�3].M ¼ mass of analyte on the sorbent, blank-corrected if
needed [pg]k ¼ calibration constant [min mL�1]t ¼ sampling time [min] (note that there are two offsetting
conversion factors from pg to mg and mL to m3).The reciprocal of the calibration constant (1/k) is referred to as
the uptake rate (UR), which has units of mL min�1. Even thoughthe uptake rate has units of [volume/time], it is important toemphasize that it does not represent a real ow; rather, it issimply a number equivalent to the ow that would produce thesame mass loading on an active adsorptive sampler that had airpulled through it for the same c and t. The mass adsorbed andthe sample duration can both be measured very accurately(commonly within 5% to 15%), so the accuracy of the uptake rateis the key factor controlling the accuracy of the calculatedconcentration. Quantitative kinetic passive samplers aredesigned to control the uptake rate of chemicals during samplingusing well-dened barriers between the sorbent and the mediabeing sampled of a xed cross-sectional area and known diffu-sion or permeation characteristics for the chemicals of interest.The uptake rates of kinetic samplers are typically measured incontrolled exposure chamber experiments or calculated fromrst principles based on the free-air diffusion coefficient orpermeation rate of the particular compound of interest.27–33
High uptake rates allow lower concentrations to be quantiedwith shorter sample durations, which can be an advantage insome instances. Lower uptake rates reduce the risk of the “star-vation effect”, which occurs when the rate-limiting step is trans-port of chemicals to the sampler instead of the uptake rate of thesampler itself. This situation results in a reduction in vaporconcentrations near the sampler, and a negative bias in thecalculated passive sampler concentrations compared to theconditions under which the passive sampler uptake rate wasmeasured. Advection from wind and ventilation during indoorand outdoor air sampling is oen sufficient to minimize oreliminate the starvation effect completely. For soil gas sampling,advection is likely to be minimal and the rate of contaminantvapor replenishment in the gas-lled void space surrounding thesampler is likely to be dominated by diffusive transport, which isthe focus of the mathematical models presented in this paper.The uptake rate of a passive sampler can be increased ordecreased by design, and the calculations presented here supportthe selection of appropriate uptake rates for quantitative passivesoil vapor sampling.
Environ. Sci.: Processes Impacts, 2014, 16, 482–490 | 483

Environmental Science: Processes & Impacts Paper
Publ
ishe
d on
13
Janu
ary
2014
. Dow
nloa
ded
by U
nive
rsity
of
Win
dsor
on
31/1
0/20
14 0
5:16
:14.
View Article Online
Conceptual model for quantitative passive soil vaporsampling
Passive soil vapor sampling is usually performed by drilling ahole in the ground, removing soil, placing a passive sampler inthe void space created by drilling, sealing the hole from theatmosphere for the duration of the sample, then retrieving thesampler and backlling or grouting the hole. A simpleconceptual model of this scenario is as follows:
� Immediately aer the hole is drilled and the soil is removed,the void space lls with air. Assuming atmospheric air can enterthe void space with less resistance than gas owing through thesurrounding soil, the initial concentration of vapors insidethe void space would be expected to be much lower than that inthe surrounding soil, and at worst could be assumed to beessentially zero (if atmospheric air is contaminant-free).
� In most cases, passive samplers are placed in the boreholeand the space above the sampler is sealed without purging toremove atmospheric air from the void space around the sampler(purging is feasible during passive soil vapor sampling, but notcommon).
� During the period of sampling, vapors diffuse into the voidspace from the surrounding soil. If the void space is long rela-tive to its diameter and short enough that the geologic proper-ties and vapor concentrations are relatively uniform over thevertical interval of the void space, then the diffusion will beessentially radially symmetric (this has been assumed for theremainder of this paper).
� The rate of diffusive mass transport into the void space overtime will depend on the concentration gradient and effectivediffusion coefficient, and will gradually diminish as theconcentration in the void space increases toward equilibrationwith the surrounding soil. If a passive sampler is present in thevoid space, the concentration in the void space will remainsomewhat below the concentration in the surrounding soildepending on the uptake rate of the passive sampler.
� If the uptake rate of the sampler is small relative to the rateof diffusion into the void space (a goal if the starvation effect isto be small), then the steady-state concentration in the voidspace will be similar to the concentration in the surroundingsoil and passive sampling will be able to provide a quantitativemeasure of the soil vapor concentration.
Mathematical modeling of quantitative passive sampling
Passive soil vapor sampling involves transport of vaporsthrough the soil surrounding the drillhole into the void space in
Table 1 Parameter Values used in Model Simulations (representative of
Parameter name Symbol Units
Free air diffusion coefficient Dair cm2 s�1
Aqueous diffusion coefficient Dw cm2 s�1
Dimensionless Henry's Law constant H Mass perTotal porosity qT Volume oWater-lled porosity qw Volume oAir-lled porosity qa qT–qw
484 | Environ. Sci.: Processes Impacts, 2014, 16, 482–490
which the sampler is deployed, diffusion through the air insidethe void space, and uptake by the sampler. The free-air diffusioncoefficient through the air inside the void space will be roughlyone to several orders of magnitude higher than the effectivediffusion coefficient in the surrounding soil, so vapor transportthrough the air inside the void space is not expected to be therate-limiting step. This allows the mathematical analysis tofocus on two components: the rate of vapor diffusion into thevoid space (the “diffusive delivery rate”, or DDR) and the rate ofvapor uptake by the passive sampler (“passive sampler uptakerate” or UR). Understanding the rate of diffusion of vapors intothe void space is necessary to design an uptake rate for thepassive sampler that is low enough to minimize the starvationeffect. However, the uptake rate must also be high enough toprovide adequate sensitivity (ability to meet target reportinglimits with an acceptable sampling duration), so bothconstraints must be considered.
Inuence of soil moisture on the effective diffusion coefficientin soil
The effective diffusion coefficient depends strongly on the totalporosity (volume of pores divided by total volume of soil) andwater-lled porosity (volume of water divided by total volume ofsoil, otherwise known as the volumetric water content). Under-standing this relationship is helpful for context in the theory ofpassive soil gas sampling if diffusion is the main process deliv-ering vapors to the void space in which the sampler is deployed.Johnson and Ettinger34 adopted the Millington–Quirk35 equationin their well-known model for assessing the potential forsubsurface vapor intrusion to indoor air. Their formulation of theeffective diffusion coefficient also includes diffusion in theaqueous phase, assuming the Millington–Quirk empirical rela-tionship is equally valid for both the gas and water phases:
Deff ¼ Dair
qa10=3
qT2
þDw
H
qw10=3
qT2
(2)
where the parameters are dened in Table 1. Parameter valuesused for all calculations in this paper were selected to berepresentative of trichloroethene (TCE), one of the mostcommon VOCs of interest for human health risk assessmentassociated with contaminated land. Many other VOCs havesimilar diffusion coefficients and Henry's Law constants, so thegeneral trend applies to a range of VOCs of interest for humanhealth risk assessments. Eqn (2) was used to calculate Deff forboth the transient and steady-state models in this paper.
TCE)
Value
0.0690.00001
mL gas/mass per mL water 0.35f voids/total volume of soil 0.375f water/total volume of soil Various values from 0.01 to 0.36
Various values from 0.365 to 0.015
This journal is © The Royal Society of Chemistry 2014

Fig. 1 Effective diffusion coefficient versus water-filled porosity forTCE in a soil with 37.5% total porosity, typical of a sandy soil.
Fig. 2 Schematic of transient mathematical model domain includingboundary and initial conditions.
Paper Environmental Science: Processes & Impacts
Publ
ishe
d on
13
Janu
ary
2014
. Dow
nloa
ded
by U
nive
rsity
of
Win
dsor
on
31/1
0/20
14 0
5:16
:14.
View Article Online
A series of calculations were performed using eqn (2) andthe parameter values in Table 1 to show the relationshipbetween the effective diffusion coefficient and the water-lledporosity. The calculated Deff values span a range from about0.01 to about 0.00001 cm2 s�1 over a range of water-lledporosities from 1% to 36% in a soil with 37.5% porosity(Fig. 1). These values are indeed much lower than the free-airdiffusion coefficient (0.069 cm2 s�1), which supports theassumption that diffusion through the air in the void space inwhich the sampler is deployed is not rate-limiting.
Two models (transient and steady-state) are presented tosimulate the passive sampling process.
Transient model
The conceptualization for a transient mathematical model ofradial diffusion of vapors from soil into the void space isshown in Fig. 2. For simplicity, the transient model simulatesan empty void space (i.e., no passive sampler), which is areasonable approximation because a passive sampler with anuptake rate low enough to minimize the starvation effectwould only become signicant as the concentration inside thevoid space approached steady-state. The derivation of thetransient model is provided in ESI.† In summary, the govern-ing equations are:
Concentration in the gas phase within the void space cg(r, t);
vcg
vt�Dair
�v2cg
vr2þ 1
r
vcg
vr
�¼ 0 0# r\r2 (3)
Concentration in the soil vapor surrounding the void spacecs(r,t);
vcs
vt�Deff
�v2cs
vr2þ 1
r
vcs
vr
�¼ 0 r2 # r\r3 (4)
The initial and boundary conditions are also shown inFig. 2. A Laplace transform is applied to convert the partialdifferential equations into ordinary differential equations andother operations are performed as described in the ESI† toobtain:
This journal is © The Royal Society of Chemistry 2014
cg ¼ cs0p
42
4244 � 414345
"K1
�qgr1
�I1�qgr1
� I0�qgr
�þ K0
�qgr
�#
for 0# r\r2
(5)
cs ¼ cs0pþ k
cs0p
42
4244 � 414345
4143
42
�K1ðqsr3ÞI1ðqsr3Þ I0ðqsrÞ þ K0ðqsrÞ
�for r2 # r\r3
(6)
Eqn (7) and (8) allow the calculation of the mass in the voidspace based on the mass ux across the borehole wall from thevoid side and soil side, respectively.
MðpÞ ¼ Daircs0p2
qg42
4244 � 414345
"K1
�qgr1
�I1�qgr1
� I1�qgr2
�� K1
�qgr2
�#
¼ Daircs0p2
qg4241
4244 � 414345
(7)
MðpÞ ¼ Dscs0p2
qs42
4244 � 414345
4143
42
�K1ðqsr3ÞI1ðqsr3Þ I1ðqsr2Þ � K1ðqsr2Þ
�
¼ Dscs0p2
qs424143
4244 � 414345
(8)
The inverse Laplace transforms of eqn (5)–(8) are computednumerically using the algorithm developed by DeHoog et al.36
The modied Bessel functions Ia and Ka used for eqn (5)–(8) aredened by:
IaðxÞ ¼ i�aJaðixÞ ¼XNm¼0
1
m!Gðmþ aþ 1Þ�x
2
�2mþa
(9)
KaðxÞ ¼ p
2
I�aðxÞ � IaðxÞsinðapÞ ¼ p
2iaþ1H ð1Þ
a ðixÞ ¼ p
2ð�iÞaþ1
Hð2Þa ð�ixÞ
(10)
The meaning of the symbols in the equations is explained inthe ESI.†
Environ. Sci.: Processes Impacts, 2014, 16, 482–490 | 485
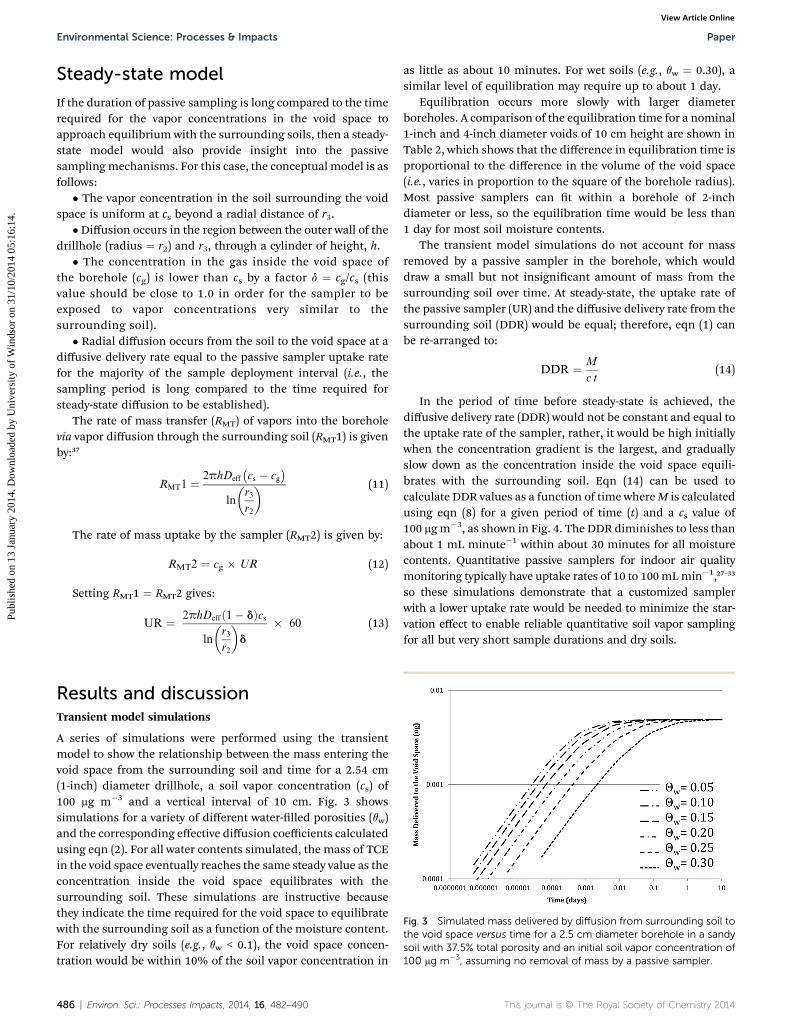
Fig. 3 Simulated mass delivered by diffusion from surrounding soil tothe void space versus time for a 2.5 cm diameter borehole in a sandysoil with 37.5% total porosity and an initial soil vapor concentration of100 mg m�3, assuming no removal of mass by a passive sampler.
Environmental Science: Processes & Impacts Paper
Publ
ishe
d on
13
Janu
ary
2014
. Dow
nloa
ded
by U
nive
rsity
of
Win
dsor
on
31/1
0/20
14 0
5:16
:14.
View Article Online
Steady-state model
If the duration of passive sampling is long compared to the timerequired for the vapor concentrations in the void space toapproach equilibrium with the surrounding soils, then a steady-state model would also provide insight into the passivesamplingmechanisms. For this case, the conceptual model is asfollows:
� The vapor concentration in the soil surrounding the voidspace is uniform at cs beyond a radial distance of r3.
�Diffusion occurs in the region between the outer wall of thedrillhole (radius ¼ r2) and r3, through a cylinder of height, h.
� The concentration in the gas inside the void space ofthe borehole (cg) is lower than cs by a factor d ¼ cg/cs (thisvalue should be close to 1.0 in order for the sampler to beexposed to vapor concentrations very similar to thesurrounding soil).
� Radial diffusion occurs from the soil to the void space at adiffusive delivery rate equal to the passive sampler uptake ratefor the majority of the sample deployment interval (i.e., thesampling period is long compared to the time required forsteady-state diffusion to be established).
The rate of mass transfer (RMT) of vapors into the boreholevia vapor diffusion through the surrounding soil (RMT1) is givenby:37
RMT1 ¼ 2phDeff
�cs � cg
�ln
�r3
r2
� (11)
The rate of mass uptake by the sampler (RMT2) is given by:
RMT2 ¼ cg � UR (12)
Setting RMT1 ¼ RMT2 gives:
UR ¼ 2phDeffð1� dÞcsln
�r3
r2
�d
� 60 (13)
Results and discussionTransient model simulations
A series of simulations were performed using the transientmodel to show the relationship between the mass entering thevoid space from the surrounding soil and time for a 2.54 cm(1-inch) diameter drillhole, a soil vapor concentration (cs) of100 mg m�3 and a vertical interval of 10 cm. Fig. 3 showssimulations for a variety of different water-lled porosities (qw)and the corresponding effective diffusion coefficients calculatedusing eqn (2). For all water contents simulated, the mass of TCEin the void space eventually reaches the same steady value as theconcentration inside the void space equilibrates with thesurrounding soil. These simulations are instructive becausethey indicate the time required for the void space to equilibratewith the surrounding soil as a function of the moisture content.For relatively dry soils (e.g., qw < 0.1), the void space concen-tration would be within 10% of the soil vapor concentration in
486 | Environ. Sci.: Processes Impacts, 2014, 16, 482–490
as little as about 10 minutes. For wet soils (e.g., qw ¼ 0.30), asimilar level of equilibration may require up to about 1 day.
Equilibration occurs more slowly with larger diameterboreholes. A comparison of the equilibration time for a nominal1-inch and 4-inch diameter voids of 10 cm height are shown inTable 2, which shows that the difference in equilibration time isproportional to the difference in the volume of the void space(i.e., varies in proportion to the square of the borehole radius).Most passive samplers can t within a borehole of 2-inchdiameter or less, so the equilibration time would be less than1 day for most soil moisture contents.
The transient model simulations do not account for massremoved by a passive sampler in the borehole, which woulddraw a small but not insignicant amount of mass from thesurrounding soil over time. At steady-state, the uptake rate ofthe passive sampler (UR) and the diffusive delivery rate from thesurrounding soil (DDR) would be equal; therefore, eqn (1) canbe re-arranged to:
DDR ¼ M
c t(14)
In the period of time before steady-state is achieved, thediffusive delivery rate (DDR) would not be constant and equal tothe uptake rate of the sampler, rather, it would be high initiallywhen the concentration gradient is the largest, and graduallyslow down as the concentration inside the void space equili-brates with the surrounding soil. Eqn (14) can be used tocalculate DDR values as a function of time whereM is calculatedusing eqn (8) for a given period of time (t) and a cs value of100 mgm�3, as shown in Fig. 4. The DDR diminishes to less thanabout 1 mL minute�1 within about 30 minutes for all moisturecontents. Quantitative passive samplers for indoor air qualitymonitoring typically have uptake rates of 10 to 100mLmin�1,27–33
so these simulations demonstrate that a customized samplerwith a lower uptake rate would be needed to minimize the star-vation effect to enable reliable quantitative soil vapor samplingfor all but very short sample durations and dry soils.
This journal is © The Royal Society of Chemistry 2014
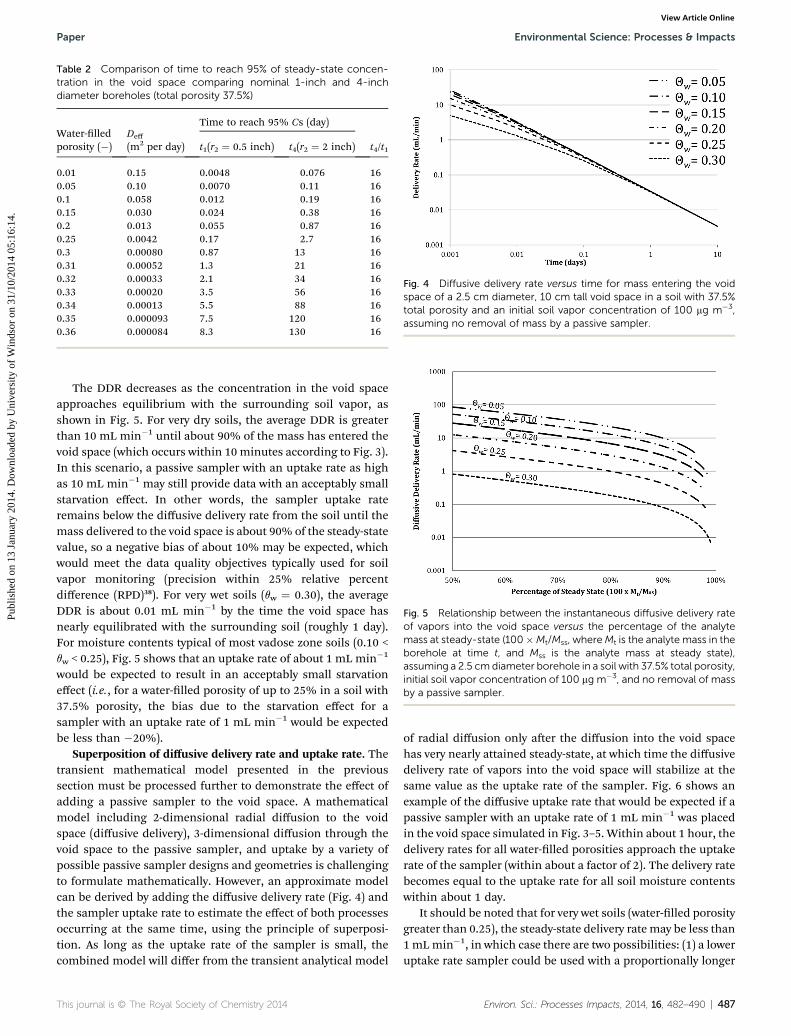
Table 2 Comparison of time to reach 95% of steady-state concen-tration in the void space comparing nominal 1-inch and 4-inchdiameter boreholes (total porosity 37.5%)
Water-lledporosity (�)
Deff
(m2 per day)
Time to reach 95% Cs (day)
t4/t1t1(r2 ¼ 0.5 inch) t4(r2 ¼ 2 inch)
0.01 0.15 0.0048 0.076 160.05 0.10 0.0070 0.11 160.1 0.058 0.012 0.19 160.15 0.030 0.024 0.38 160.2 0.013 0.055 0.87 160.25 0.0042 0.17 2.7 160.3 0.00080 0.87 13 160.31 0.00052 1.3 21 160.32 0.00033 2.1 34 160.33 0.00020 3.5 56 160.34 0.00013 5.5 88 160.35 0.000093 7.5 120 160.36 0.000084 8.3 130 16
Fig. 4 Diffusive delivery rate versus time for mass entering the voidspace of a 2.5 cm diameter, 10 cm tall void space in a soil with 37.5%total porosity and an initial soil vapor concentration of 100 mg m�3,assuming no removal of mass by a passive sampler.
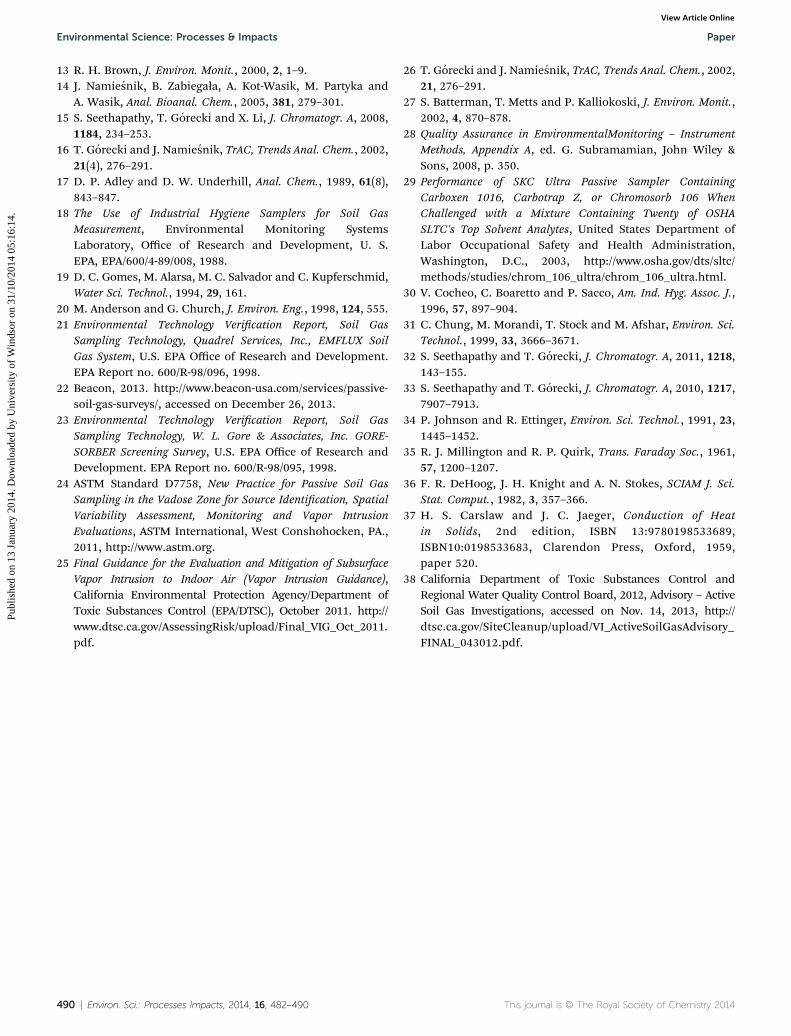
Fig. 5 Relationship between the instantaneous diffusive delivery rateof vapors into the void space versus the percentage of the analytemass at steady-state (100�Mt/Mss, whereMt is the analyte mass in theborehole at time t, and Mss is the analyte mass at steady state),assuming a 2.5 cm diameter borehole in a soil with 37.5% total porosity,initial soil vapor concentration of 100 mg m�3, and no removal of massby a passive sampler.
Paper Environmental Science: Processes & Impacts
Publ
ishe
d on
13
Janu
ary
2014
. Dow
nloa
ded
by U
nive
rsity
of
Win
dsor
on
31/1
0/20
14 0
5:16
:14.
View Article Online
The DDR decreases as the concentration in the void spaceapproaches equilibrium with the surrounding soil vapor, asshown in Fig. 5. For very dry soils, the average DDR is greaterthan 10 mL min�1 until about 90% of the mass has entered thevoid space (which occurs within 10 minutes according to Fig. 3).In this scenario, a passive sampler with an uptake rate as highas 10 mL min�1 may still provide data with an acceptably smallstarvation effect. In other words, the sampler uptake rateremains below the diffusive delivery rate from the soil until themass delivered to the void space is about 90% of the steady-statevalue, so a negative bias of about 10% may be expected, whichwould meet the data quality objectives typically used for soilvapor monitoring (precision within 25% relative percentdifference (RPD)38). For very wet soils (qw ¼ 0.30), the averageDDR is about 0.01 mL min�1 by the time the void space hasnearly equilibrated with the surrounding soil (roughly 1 day).For moisture contents typical of most vadose zone soils (0.10 <qw < 0.25), Fig. 5 shows that an uptake rate of about 1 mL min�1
would be expected to result in an acceptably small starvationeffect (i.e., for a water-lled porosity of up to 25% in a soil with37.5% porosity, the bias due to the starvation effect for asampler with an uptake rate of 1 mL min�1 would be expectedbe less than �20%).
Superposition of diffusive delivery rate and uptake rate. Thetransient mathematical model presented in the previoussection must be processed further to demonstrate the effect ofadding a passive sampler to the void space. A mathematicalmodel including 2-dimensional radial diffusion to the voidspace (diffusive delivery), 3-dimensional diffusion through thevoid space to the passive sampler, and uptake by a variety ofpossible passive sampler designs and geometries is challengingto formulate mathematically. However, an approximate modelcan be derived by adding the diffusive delivery rate (Fig. 4) andthe sampler uptake rate to estimate the effect of both processesoccurring at the same time, using the principle of superposi-tion. As long as the uptake rate of the sampler is small, thecombined model will differ from the transient analytical model
This journal is © The Royal Society of Chemistry 2014
of radial diffusion only aer the diffusion into the void spacehas very nearly attained steady-state, at which time the diffusivedelivery rate of vapors into the void space will stabilize at thesame value as the uptake rate of the sampler. Fig. 6 shows anexample of the diffusive uptake rate that would be expected if apassive sampler with an uptake rate of 1 mL min�1 was placedin the void space simulated in Fig. 3–5. Within about 1 hour, thedelivery rates for all water-lled porosities approach the uptakerate of the sampler (within about a factor of 2). The delivery ratebecomes equal to the uptake rate for all soil moisture contentswithin about 1 day.
It should be noted that for very wet soils (water-lled porositygreater than 0.25), the steady-state delivery rate may be less than1mLmin�1, in which case there are two possibilities: (1) a loweruptake rate sampler could be used with a proportionally longer
Environ. Sci.: Processes Impacts, 2014, 16, 482–490 | 487

Fig. 7 Calculated uptake rate corresponding to various d values as afunction of water-filled porosity for a 10 cm tall and 2.54 cm diametervoid space assuming r3 ¼ 1 m.
Environmental Science: Processes & Impacts Paper
Publ
ishe
d on
13
Janu
ary
2014
. Dow
nloa
ded
by U
nive
rsity
of
Win
dsor
on
31/1
0/20
14 0
5:16
:14.
View Article Online
sample duration, or (2) a negative bias attributable to starvationmay still be experienced. If the negative bias is predictable oracceptably small, the data may still be useful and this may bereasonably evaluated using the models presented here as longas the porosity and moisture content are known or can bereasonably estimated. From a practical perspective, very wetsoils have an effective diffusion coefficient about two orders ofmagnitude lower than dry soils (Fig. 1), which would reduce therisk to human health from subsurface vapor intrusion to indoorair by a similar amount. Therefore, a slight negative bias in thepassive sampler result may still result in protective decision-making if the results are compared to screening levels derivedto be protective of dry soil conditions. Also, it may be possible toavoid low bias associated with wet soils by design via either: (1)coring the soil and selecting coarse-textured, well-drainedintervals for monitoring; (2) sampling during dry seasons; or (3)sampling within the rain-shadow below buildings (a.k.a., sub-slab samples).
Steady state model simulations
For a passive sampler deployed in a borehole with a nominaldiameter of 1-inch (r1 ¼ 1.25 cm) and sealed within a 10 cmvoid space (h ¼ 10 cm), the uptake rates calculated using eqn(13) are shown in Fig. 7 for d values of 0.5, 0.75 and 0.95. The r3value for these calculations was assumed to be 1 m. Fig. 7shows that an uptake rate of 10 mL min�1 might be acceptablefor very dry soil if the data quality objective was to quantifyconcentrations within a factor of 2 (i.e., d ¼ 0.5), however; anuptake rate of 1 mL min�1 would be more suitable for soilswith water-lled porosity of up to about 15%, assuming a morestringent data quality objective of �25% (i.e., d ¼ 0.75).Progressively lower uptake rates would be required to furtherreduce the negative bias or meet typical data quality objectivesin very wet soils.
A sensitivity analysis on the r3 value is shown in Fig. 8 for thesame conditions as in Fig. 7 and a d value of 0.75. This plotshows that the value assumed for r3 does not affect the
Fig. 6 Superimposed diffusive delivery rate plus uptake rate for a 10cm tall and 2.5 cm diameter void space in a soil with 37.5% porosity andan initial soil vapor concentration of 100 mg m�3 containing a passivesampler with an uptake rate of 1 mL min�1.
488 | Environ. Sci.: Processes Impacts, 2014, 16, 482–490
conclusions in a signicant way even when it is varied by anorder of magnitude.
Practical constraints on the uptake rate
There is a practical lower limit to the uptake rate for passivesampling, which is imposed by the sample duration needed toachieve a specied reporting limit. Eqn (1) can be rearranged tocalculate the sample duration (t) required to achieve a targetreporting limit (cRL) if the uptake rate of the sampler and thelaboratory mass reporting limit (MRL) are known:
t ¼ MRL
cRL �UR(15)
For example, consider an initial soil vapor concentration of100 mg m�3 of TCE and a sampler with an uptake rate of 1 mLmin�1. A detectable mass of TCE (MRL �0.05 mg via solventextraction, GC/MS) would be adsorbed by the sampler in500 min (0.35 d). This demonstrates that a low-uptake rate
Fig. 8 Calculated uptake rate corresponding to various r3 values as afunction of water-filled porosity for a 10 cm tall and 2.54 cm diametervoid space assuming d ¼ 0.75.
This journal is © The Royal Society of Chemistry 2014

Paper Environmental Science: Processes & Impacts
Publ
ishe
d on
13
Janu
ary
2014
. Dow
nloa
ded
by U
nive
rsity
of
Win
dsor
on
31/1
0/20
14 0
5:16
:14.
View Article Online
sampler can provide practical sensitivity within a reasonableamount of time and still avoid or minimize the starvation effect.However, if the uptake rate was reduced to 0.1 or 0.01 mLmin�1,the sample duration would need to increase to 3.5 or 35 days,respectively. There are logistical challenges with long sampledurations (costs of return travel to eld sites, security, etc.). Thesensitivity can be increased using thermal desorption instead ofsolvent extraction (MRL� 0.002 mg); however, weaker sorbents aretypically used with thermal desorption, hence less-strongly sor-bed analytes may not be effectively retained, especially for longersampling durations.
Conclusions
In order for a kinetic passive sampler to provide quantitativesoil vapor concentration data, it must have a known and reliableuptake rate for all of the compounds of interest. The passivesampler uptake rate should be low enough to allow the rate ofdiffusive delivery of vapors into the void space from thesurrounding soil to sustain vapor concentrations in the voidspace similar to those of the surrounding soil in order tominimize the starvation effect. The uptake rate must also behigh enough to provide the ability to detect concentrations at orbelow risk-based screening levels with acceptable samplingduration. This paper demonstrates that kinetic samplers withan uptake rates in the range of �0.01 to �10 mL min�1 candeliver quantitative passive soil vapor concentration data withonly a small bias, depending on the soil moisture, and that anuptake rate of about 1 mL min�1 provides acceptable accuracyand sensitivity for most commonly-encountered water-lledporosities in unsaturated soils. These conclusions are sup-ported by both transient and steady-state models. The knowl-edge gained from the mathematical modeling in this paperallows passive samplers to be modied as needed to achieve anuptake rate small enough to minimize starvation and highenough to provide adequate sensitivity, which will simplify andimprove the cost-effectiveness of quantitative soil vaporconcentration measurement and monitoring for VOCs.
Acknowledgements
Funding for this work was provided by the EnvironmentalSecurity Technology Certication Program (ESTCP) with SamBrock of the Air Force Civil Engineering Center and AndreaLeeson of ESTCP as the DOD Liaisons and the U.S. Navy SPA-WAR Systems Center Pacic with Ignacio Rivera-Duarte andBart Chadwick as contracting officers, under subcontract toRichard Brady and Associates and Computer Sciences Corpo-ration under the Improved Assessment Strategies for the VaporIntrusion project, which is funded by the Navy's EnvironmentalSustainability Development to Integration (NESDI) Program.Co-investigators for the ESTCP project include Paul Johnson(Arizona State University), Derrick Crump (Craneld University,UK), Paolo Sacco (Fondazione Salvatore Maugeri, Italy), BrianSchumacher (USEPA, Las Vegas), Michael Tuday (formerly ofColumbia Analytical Services, Simi Valley, CA), Heidi Hayes(Eurons/Air Toxics Limited, Folsom, CA) and Suresh
This journal is © The Royal Society of Chemistry 2014
Seethapathy (formerly of the University of Waterloo). Thanksalso to Robert Ettinger and Chris Neville for input on themathematical models.
References
1 ASTM D5314 – 92, Standard Guide for Soil Gas Monitoring inthe Vadose Zone, ASTM International, West Conshohocken,P.A., 2006, http://www.astm.org.
2 ASTM D7663 – 11, Standard Practice for Active Soil GasSampling in the Vadose Zone for Vapor Intrusion Evaluations,ASTM International, West Conshohocken, P.A., 2011,http://www.astm.org.
3 Electric Power Research Institute (EPRI), Reference Handbookfor the Site-Specic Assessment of Subsurface Vapor Intrusion toIndoor Air, EPRI Document #1008492, Palo Alto, CA, March2005.
4 American Petroleum Institute (API), Collecting andInterpreting Soil Gas Samples from the Vadose Zone: APractical Strategy for Assessing the Subsurface Vapor-to-IndoorAir Migration Pathway at Petroleum Hydrocarbon Sites, APIPublication #4741, 2005.
5 Direct-Push Installation of Devices for Active Soil GasSampling and Monitoring, Geoprobe®Technical Bulletin#3099, May 2006, http://geoprobe.com/sites/default/les/pdfs/soil_gas_sampling_and_monitoring_mk3098.pdf.
6 Vapor Intrusion Pathway, A Practical Guideline, InterstateTechnology and Regulatory Council (ITRC), 2007, http://www.itrcweb.org/Documents/VI-1.pdf.
7 Final Scoping Assessment of Soil Vapor Monitoring Protocols forEvaluation of Subsurface Vapor Intrusion to Indoor Air,Canadian Council of Ministers of the Environment(CCME), PN1427 2009, http://www.ccme.ca/assets/pdf/pn_1427_ vapor_scoping1.pdf.
8 Advisory – Active Soil Gas Investigation, California Departmentof Toxic Substances Control (DTSC), Cypress, CA, April 2012,http://www.dtsc.ca.gov/SiteCleanup/upload/VI_ActiveSoilGas-Advisory_FINAL_043012.pdf.
9 Comparison of Geoprobe® PRT and AMS GVP Soil-Gas SamplingSystems With Dedicated Vapor Probes in Sandy Soils at theRaymark Superfund Site, EPA/600/R/111, November, 2006,http://permanent.access.gpo.gov/lps85174/600R06111.pdf.
10 Compendium of Methods for the Determination of Toxic OrganicCompounds in Ambient Air, Second Edition, CompendiumMethod TO-15:-Determination Of Volatile OrganicCompounds (VOCs) In Air Collected In Specially-PreparedCanisters And Analyzed By Gas Chromatography/MassSpectrometry (GC/MS), Center for Environmental ResearchInformation Office of Research and Development, U.S. EPA,Cincinnati, OH, January 1999, PA, EPA/625/R-96/010b.
11 T. A. McAlary, P. Nicholson, H. Groenevelt and D. Bertrand,Groundwater Monit. Rem., 2009, 29, 144–152.
12 EPA's Vapor Intrusion Database, Evaluation andCharacterization of Attenuation Factors for ChlorinatedVolatile Organic Compounds and Residential Buildings, Officeof Solid Waste, U.S. EPA, Washington, DC 20460 EPA/530-R-10–002, March 2012.
Environ. Sci.: Processes Impacts, 2014, 16, 482–490 | 489
Environmental Science: Processes & Impacts Paper
Publ
ishe
d on
13
Janu
ary
2014
. Dow
nloa
ded
by U
nive
rsity
of
Win
dsor
on
31/1
0/20
14 0
5:16
:14.
View Article Online
13 R. H. Brown, J. Environ. Monit., 2000, 2, 1–9.14 J. Namiesnik, B. Zabiegała, A. Kot-Wasik, M. Partyka and
A. Wasik, Anal. Bioanal. Chem., 2005, 381, 279–301.15 S. Seethapathy, T. Gorecki and X. Li, J. Chromatogr. A, 2008,
1184, 234–253.16 T. Gorecki and J. Namiesnik, TrAC, Trends Anal. Chem., 2002,
21(4), 276–291.17 D. P. Adley and D. W. Underhill, Anal. Chem., 1989, 61(8),
843–847.18 The Use of Industrial Hygiene Samplers for Soil Gas
Measurement, Environmental Monitoring SystemsLaboratory, Office of Research and Development, U. S.EPA, EPA/600/4-89/008, 1988.
19 D. C. Gomes, M. Alarsa, M. C. Salvador and C. Kupferschmid,Water Sci. Technol., 1994, 29, 161.
20 M. Anderson and G. Church, J. Environ. Eng., 1998, 124, 555.21 Environmental Technology Verication Report, Soil Gas
Sampling Technology, Quadrel Services, Inc., EMFLUX SoilGas System, U.S. EPA Office of Research and Development.EPA Report no. 600/R-98/096, 1998.
22 Beacon, 2013. http://www.beacon-usa.com/services/passive-soil-gas-surveys/, accessed on December 26, 2013.
23 Environmental Technology Verication Report, Soil GasSampling Technology, W. L. Gore & Associates, Inc. GORE-SORBER Screening Survey, U.S. EPA Office of Research andDevelopment. EPA Report no. 600/R-98/095, 1998.
24 ASTM Standard D7758, New Practice for Passive Soil GasSampling in the Vadose Zone for Source Identication, SpatialVariability Assessment, Monitoring and Vapor IntrusionEvaluations, ASTM International, West Conshohocken, PA.,2011, http://www.astm.org.
25 Final Guidance for the Evaluation and Mitigation of SubsurfaceVapor Intrusion to Indoor Air (Vapor Intrusion Guidance),California Environmental Protection Agency/Department ofToxic Substances Control (EPA/DTSC), October 2011. http://www.dtsc.ca.gov/AssessingRisk/upload/Final_VIG_Oct_2011.pdf.
490 | Environ. Sci.: Processes Impacts, 2014, 16, 482–490
26 T. Gorecki and J. Namiesnik, TrAC, Trends Anal. Chem., 2002,21, 276–291.
27 S. Batterman, T. Metts and P. Kalliokoski, J. Environ. Monit.,2002, 4, 870–878.
28 Quality Assurance in EnvironmentalMonitoring – InstrumentMethods, Appendix A, ed. G. Subramamian, John Wiley &Sons, 2008, p. 350.
29 Performance of SKC Ultra Passive Sampler ContainingCarboxen 1016, Carbotrap Z, or Chromosorb 106 WhenChallenged with a Mixture Containing Twenty of OSHASLTC's Top Solvent Analytes, United States Department ofLabor Occupational Safety and Health Administration,Washington, D.C., 2003, http://www.osha.gov/dts/sltc/methods/studies/chrom_106_ultra/chrom_106_ultra.html.
30 V. Cocheo, C. Boaretto and P. Sacco, Am. Ind. Hyg. Assoc. J.,1996, 57, 897–904.
31 C. Chung, M. Morandi, T. Stock and M. Afshar, Environ. Sci.Technol., 1999, 33, 3666–3671.
32 S. Seethapathy and T. Gorecki, J. Chromatogr. A, 2011, 1218,143–155.
33 S. Seethapathy and T. Gorecki, J. Chromatogr. A, 2010, 1217,7907–7913.
34 P. Johnson and R. Ettinger, Environ. Sci. Technol., 1991, 23,1445–1452.
35 R. J. Millington and R. P. Quirk, Trans. Faraday Soc., 1961,57, 1200–1207.
36 F. R. DeHoog, J. H. Knight and A. N. Stokes, SCIAM J. Sci.Stat. Comput., 1982, 3, 357–366.
37 H. S. Carslaw and J. C. Jaeger, Conduction of Heatin Solids, 2nd edition, ISBN 13:9780198533689,ISBN10:0198533683, Clarendon Press, Oxford, 1959,paper 520.
38 California Department of Toxic Substances Control andRegional Water Quality Control Board, 2012, Advisory – ActiveSoil Gas Investigations, accessed on Nov. 14, 2013, http://dtsc.ca.gov/SiteCleanup/upload/VI_ActiveSoilGasAdvisory_FINAL_043012.pdf.
This journal is © The Royal Society of Chemistry 2014