Embed Size (px)
Citation preview
gGRE Math Preparation Guide
QUANTITATIVE COMPARISONS & DATA INTERPRETATION
This volume focuses on two of the GRE’s unique quantitative question types. The guide to Quantitative Comparisons briefs students on how to attack these problems and provides time-saving strategies. The guide to Data Interpretation demonstrates approaches to quickly synthesize graphical information on test day.

Quantitative Comparisons/Data Interpretation GRE Preparation Guide, First Edition
10-digit International Standard Book Number: 1-935707-07-813-digit International Standard Book Number: 978-1-935707-07-3
Copyright © 2010 MG Prep, Inc.
ALL RIGHTS RESERVED. No part of this work may be reproduced or used in any form by any means—graphic, electronic, or mechanical, including photocopying, recording, taping, Web distribution—without the prior written permission of the publisher, MG Prep Inc.
Note: GRE, Graduate Record Examination, Educational Testing Services, and ETS are all registered trademarks of Educational Testing Services, which neither sponsors nor is affiliated in any way with this product.
5
Manha�an GRE
September 1st, 2010.
Dear Student,
Thank you for picking up one of the Manhattan GRE Strategy Guides—we hope that it refreshes your memory of junior-high school math that you haven’t used in years. Maybe it will even teach you a new thing or two.
As with most accomplishments, there were many people involved in the book that you’re holding. First and foremost is Zeke Vanderhoek, the founder of MG Prep. Zeke was a lone tutor in New York when he started the Company in 2000. Now, ten years later, the Company has Instructors and offices nationwide and contributes to the studies and successes of thousands of students each year.
Our Manhattan GRE Strategy Guides are based on the continuing experiences of our Instructors and our students. On the Company side, we are indebted to many of our Instructors, including but not limited to Jen Dziura, Stacey Koprince, David Mahler, Chris Ryan, Michael Schwartz, and Tommy Wallach, all of whom either wrote or edited the books to their present form. Dan McNaney and Cathy Huang provided their formatting expertise to make the books as user-friendly as possible. Last, many people, too numerous to list here but no less appreciated, assisted in the development of the online resources that accompany this guide.
At Manhattan GRE, we continually aspire to provide the best Instructors and resources possible. We hope that you’ll find our dedication manifest in this book. If you have any comments or questions, please e-mail me at [email protected]. I’ll be sure that your comments reach Chris and the rest of the team—and I’ll read them too.
Best of luck in preparing for the GRE!
Sincerely,
Andrew Yang President Manhattan GRE
www.manhattangre.com 138 West 25th St., 7th Floor NY, NY 10001 Tel: 212-721-7400 Fax: 646-514-7425
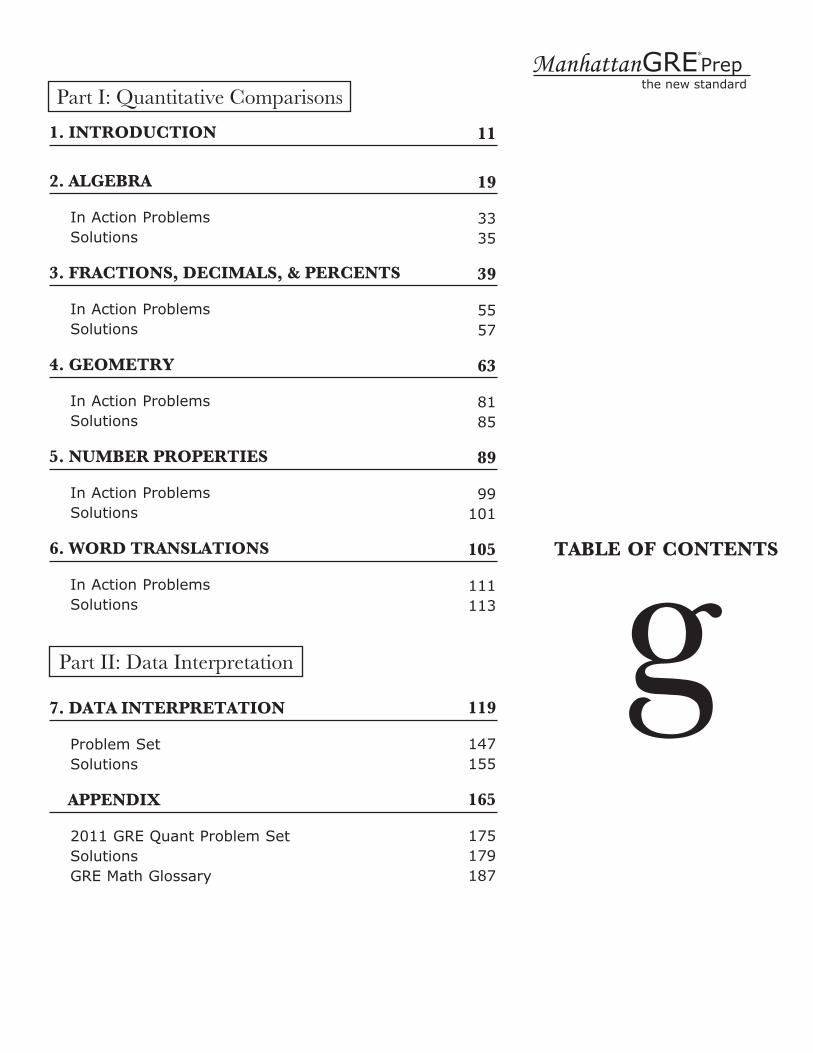
1. INTRODUCTION
2. ALGEBRA
In Action ProblemsSolutions
3. FRACTIONS, DECIMALS, & pERCENTS
In Action ProblemsSolutions
4. GEOMETRY
In Action ProblemsSolutions
5. NUMBER pROpERTIES
In Action ProblemsSolutions
6. WORD TRANSLATIONS
In Action ProblemsSolutions
Part II: Data Interpretation
7. DATA INTERpRETATION
Problem Set Solutions
AppENDIX
2011 GRE Quant Problem SetSolutionsGRE Math Glossary
11
19
3335
39
5557
63
8185
89
99101
105
111113
119
147155
165
175179 187
gTABLE OF CONTENTS
Manhattan GRE Prepthe new standard
*
Part I: Quantitative Comparisons
g Chapter 1of
QUANTITATIVE COMPARISONS &DATA INTERPRETATION
INTRODUCTION
PART 1: QUANTITATIVE COMPARISONS

In This Chapter . . .
g • Format and Directions
• Trying to Prove D
• Compare, Don’t Calculate
13Manhattan GRE Prep
the new standard
*
QUANTITATIVE COMPARISONS/DATA INTERPRETATION Introduction
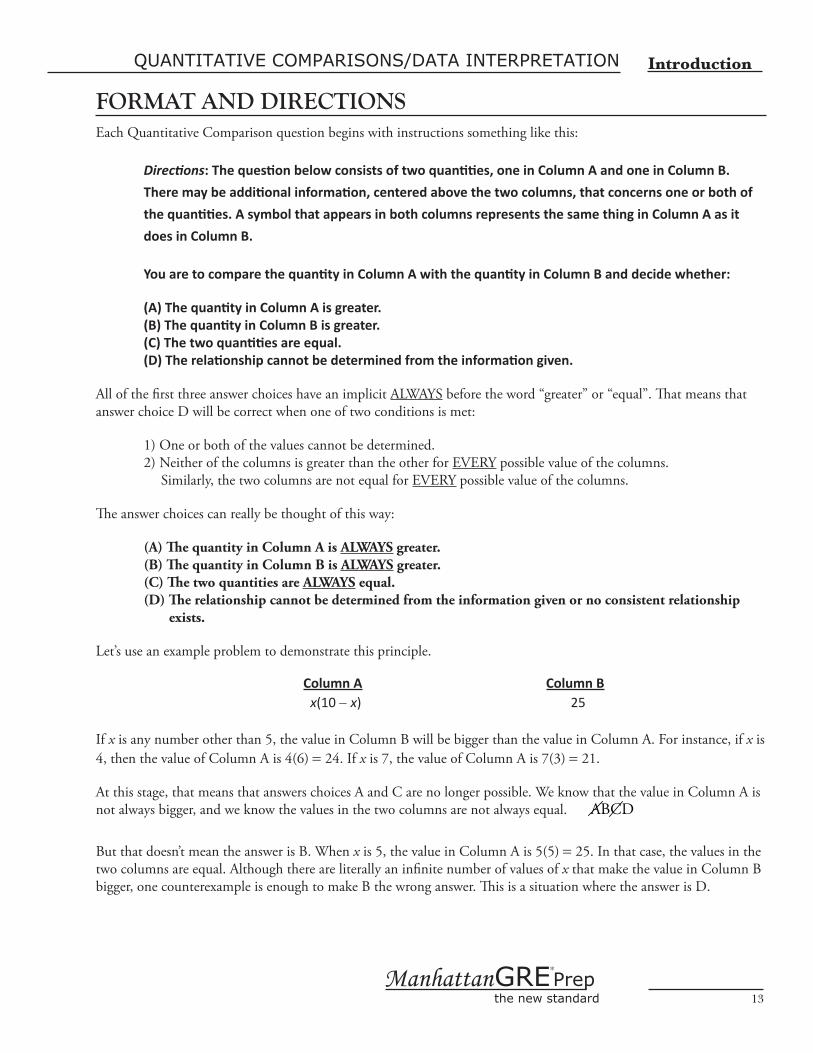
FORMAT AND DIRECTIONSEach Quantitative Comparison question begins with instructions something like this:
Directions: The question below consists of two quantities, one in Column A and one in Column B.
There may be additional information, centered above the two columns, that concerns one or both of
the quantities. A symbol that appears in both columns represents the same thing in Column A as it
does in Column B.
You are to compare the quantity in Column A with the quantity in Column B and decide whether:
(A) The quantity in Column A is greater.(B) The quantity in Column B is greater.(C) The two quantities are equal.(D) The relationship cannot be determined from the information given.
All of the first three answer choices have an implicit ALWAYS before the word “greater” or “equal”. That means that answer choice D will be correct when one of two conditions is met:
1) One or both of the values cannot be determined.2) Neither of the columns is greater than the other for EVERY possible value of the columns. Similarly, the two columns are not equal for EVERY possible value of the columns.
The answer choices can really be thought of this way:
(A) The quantity in Column A is ALWAYS greater.(B) The quantity in Column B is ALWAYS greater.(C) The two quantities are ALWAYS equal.(D) The relationship cannot be determined from the information given or no consistent relationship exists.
Let’s use an example problem to demonstrate this principle.
Column A Column Bx(10 - x) 25
If x is any number other than 5, the value in Column B will be bigger than the value in Column A. For instance, if x is 4, then the value of Column A is 4(6) = 24. If x is 7, the value of Column A is 7(3) = 21.
At this stage, that means that answers choices A and C are no longer possible. We know that the value in Column A is
not always bigger, and we know the values in the two columns are not always equal. ABCD
But that doesn’t mean the answer is B. When x is 5, the value in Column A is 5(5) = 25. In that case, the values in the two columns are equal. Although there are literally an infinite number of values of x that make the value in Column B bigger, one counterexample is enough to make B the wrong answer. This is a situation where the answer is D.
14
Manhattan GRE Prepthe new standard
*
QUANTITATIVE COMPARISONS/DATA INTERPRETATIONIntroduction
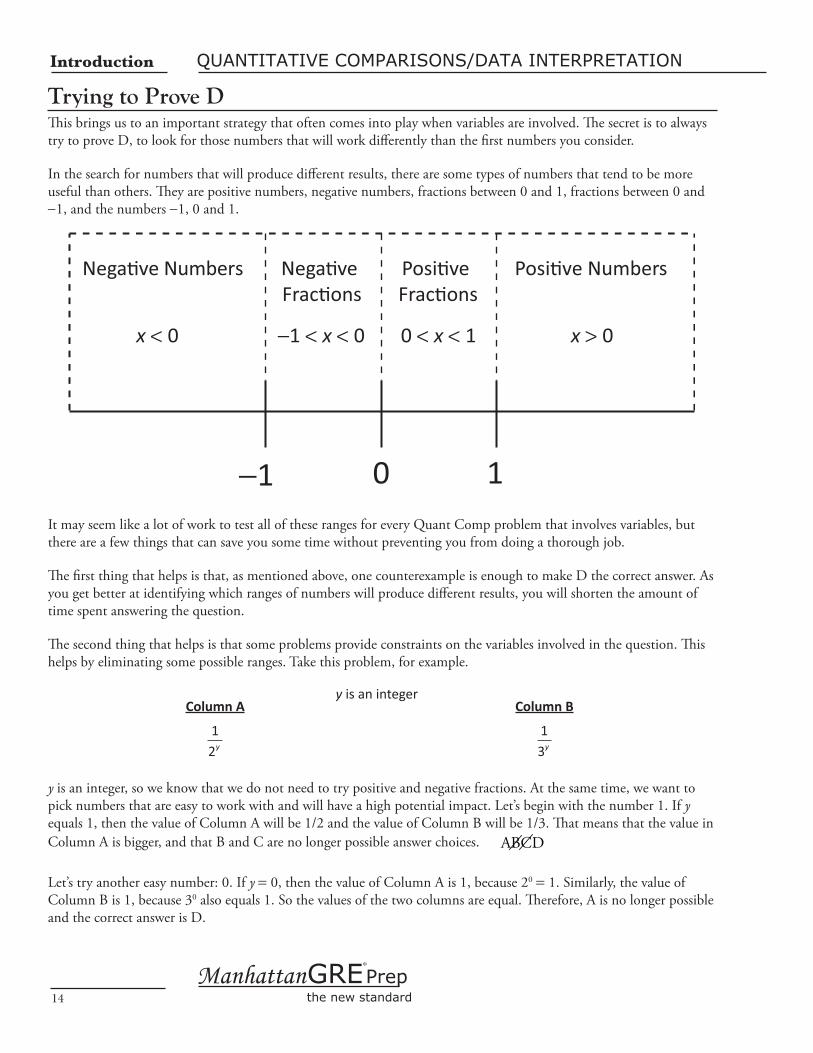
Trying to Prove DThis brings us to an important strategy that often comes into play when variables are involved. The secret is to always try to prove D, to look for those numbers that will work differently than the first numbers you consider.
In the search for numbers that will produce different results, there are some types of numbers that tend to be more useful than others. They are positive numbers, negative numbers, fractions between 0 and 1, fractions between 0 and -1, and the numbers -1, 0 and 1.
−1 0 1
Nega�ve Numbers
x < 0 −1 < x < 0 0 < x < 1 x > 0
Nega�ve Frac�ons
Posi�ve Frac�ons
Posi�ve Numbers
It may seem like a lot of work to test all of these ranges for every Quant Comp problem that involves variables, but there are a few things that can save you some time without preventing you from doing a thorough job.
The first thing that helps is that, as mentioned above, one counterexample is enough to make D the correct answer. As you get better at identifying which ranges of numbers will produce different results, you will shorten the amount of time spent answering the question.
The second thing that helps is that some problems provide constraints on the variables involved in the question. This helps by eliminating some possible ranges. Take this problem, for example.
y is an integerColumn A Column B
12y
13y
y is an integer, so we know that we do not need to try positive and negative fractions. At the same time, we want to pick numbers that are easy to work with and will have a high potential impact. Let’s begin with the number 1. If y equals 1, then the value of Column A will be 1/2 and the value of Column B will be 1/3. That means that the value in Column A is bigger, and that B and C are no longer possible answer choices. ABCD
Let’s try another easy number: 0. If y = 0, then the value of Column A is 1, because 20 = 1. Similarly, the value of Column B is 1, because 30 also equals 1. So the values of the two columns are equal. Therefore, A is no longer possible and the correct answer is D.
15Manhattan GRE Prep
the new standard
*
QUANTITATIVE COMPARISONS/DATA INTERPRETATION Introduction
0 was a good number to try for a couple of reasons. First, as mentioned, the calculations were easy to perform. Secondly, because the variable was an exponent, we were able to make use of the rule that any number, when raised to a power of 0, equals 1. Even though we had two different bases, we managed to make them, and the columns, equal.
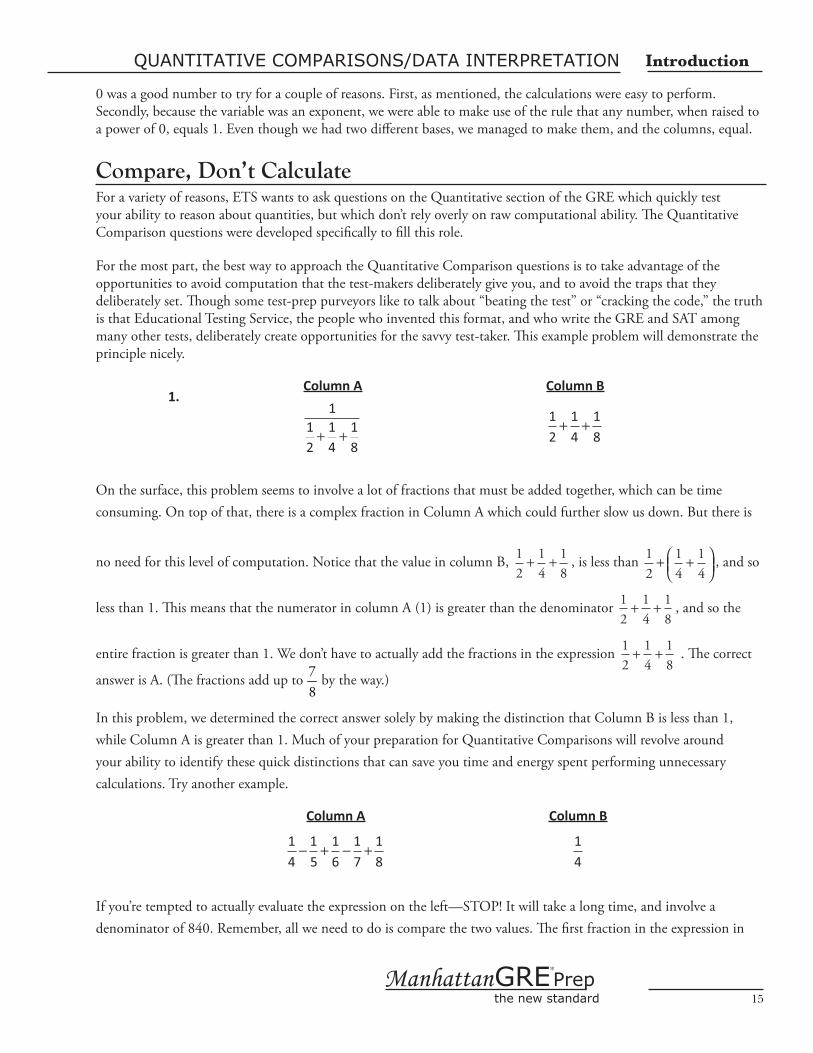
Compare, Don’t CalculateFor a variety of reasons, ETS wants to ask questions on the Quantitative section of the GRE which quickly test your ability to reason about quantities, but which don’t rely overly on raw computational ability. The Quantitative Comparison questions were developed specifically to fill this role.
For the most part, the best way to approach the Quantitative Comparison questions is to take advantage of the opportunities to avoid computation that the test-makers deliberately give you, and to avoid the traps that they deliberately set. Though some test-prep purveyors like to talk about “beating the test” or “cracking the code,” the truth is that Educational Testing Service, the people who invented this format, and who write the GRE and SAT among many other tests, deliberately create opportunities for the savvy test-taker. This example problem will demonstrate the principle nicely.
Column A Column B1.
112
14
18
+ +12
14
18
+ +
On the surface, this problem seems to involve a lot of fractions that must be added together, which can be time consuming. On top of that, there is a complex fraction in Column A which could further slow us down. But there is
no need for this level of computation. Notice that the value in column B, 12
14
18
+ + , is less than
12
14
14
+ +
, and so
less than 1. This means that the numerator in column A (1) is greater than the denominator 12
14
18
+ + , and so the
entire fraction is greater than 1. We don’t have to actually add the fractions in the expression 12
14
18
+ + . The correct
answer is A. (The fractions add up to 78
by the way.)
In this problem, we determined the correct answer solely by making the distinction that Column B is less than 1, while Column A is greater than 1. Much of your preparation for Quantitative Comparisons will revolve around your ability to identify these quick distinctions that can save you time and energy spent performing unnecessary calculations. Try another example.
Column A Column B
14
15
16
17
18
− + − + 14
If you’re tempted to actually evaluate the expression on the left—STOP! It will take a long time, and involve a denominator of 840. Remember, all we need to do is compare the two values. The first fraction in the expression in
16
Manhattan GRE Prepthe new standard
*
Introduction QUANTITATIVE COMPARISONS/DATA INTERPRETATION
Column A is 14
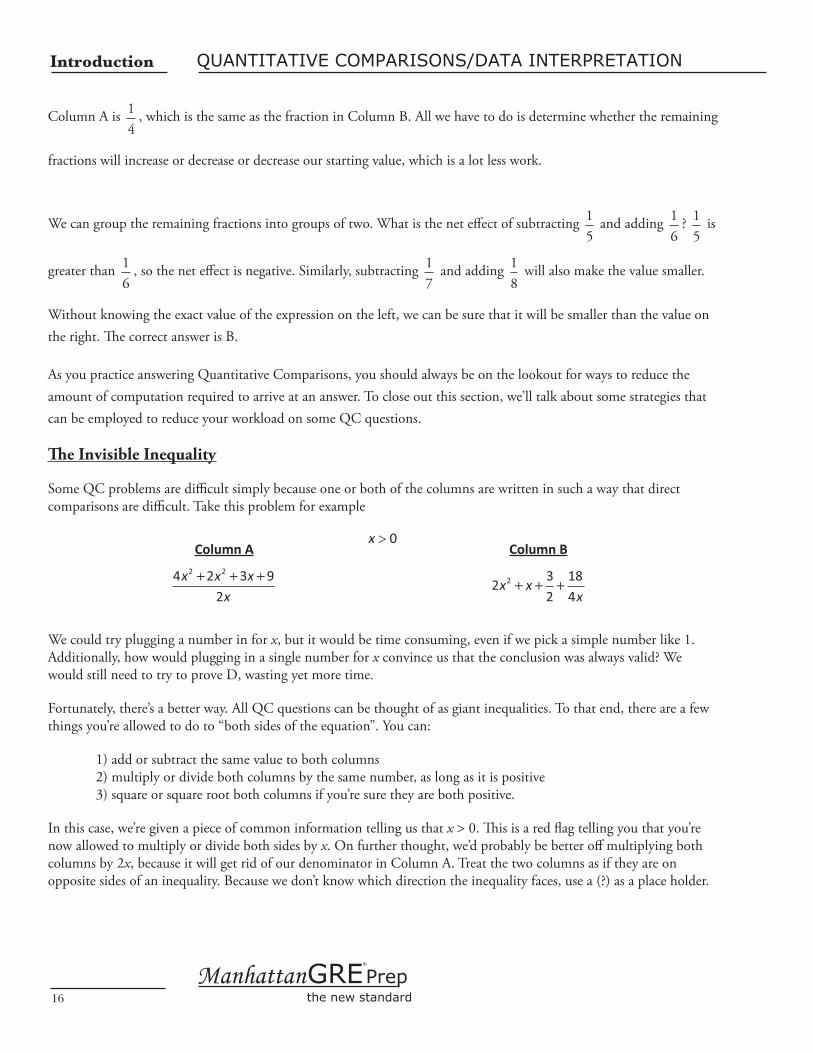
, which is the same as the fraction in Column B. All we have to do is determine whether the remaining
fractions will increase or decrease or decrease our starting value, which is a lot less work.
We can group the remaining fractions into groups of two. What is the net effect of subtracting 15
and adding 16
? 15
is
greater than 16
, so the net effect is negative. Similarly, subtracting 17
and adding 18
will also make the value smaller.
Without knowing the exact value of the expression on the left, we can be sure that it will be smaller than the value on the right. The correct answer is B.
As you practice answering Quantitative Comparisons, you should always be on the lookout for ways to reduce the amount of computation required to arrive at an answer. To close out this section, we’ll talk about some strategies that can be employed to reduce your workload on some QC questions.
The Invisible Inequality
Some QC problems are difficult simply because one or both of the columns are written in such a way that direct comparisons are difficult. Take this problem for example
x > 0Column A Column B
4 2 3 92
2 2x x xx
+ + +2
32
184
2x xx
+ + +
We could try plugging a number in for x, but it would be time consuming, even if we pick a simple number like 1. Additionally, how would plugging in a single number for x convince us that the conclusion was always valid? We would still need to try to prove D, wasting yet more time.
Fortunately, there’s a better way. All QC questions can be thought of as giant inequalities. To that end, there are a few things you’re allowed to do to “both sides of the equation”. You can:
1) add or subtract the same value to both columns2) multiply or divide both columns by the same number, as long as it is positive3) square or square root both columns if you’re sure they are both positive.
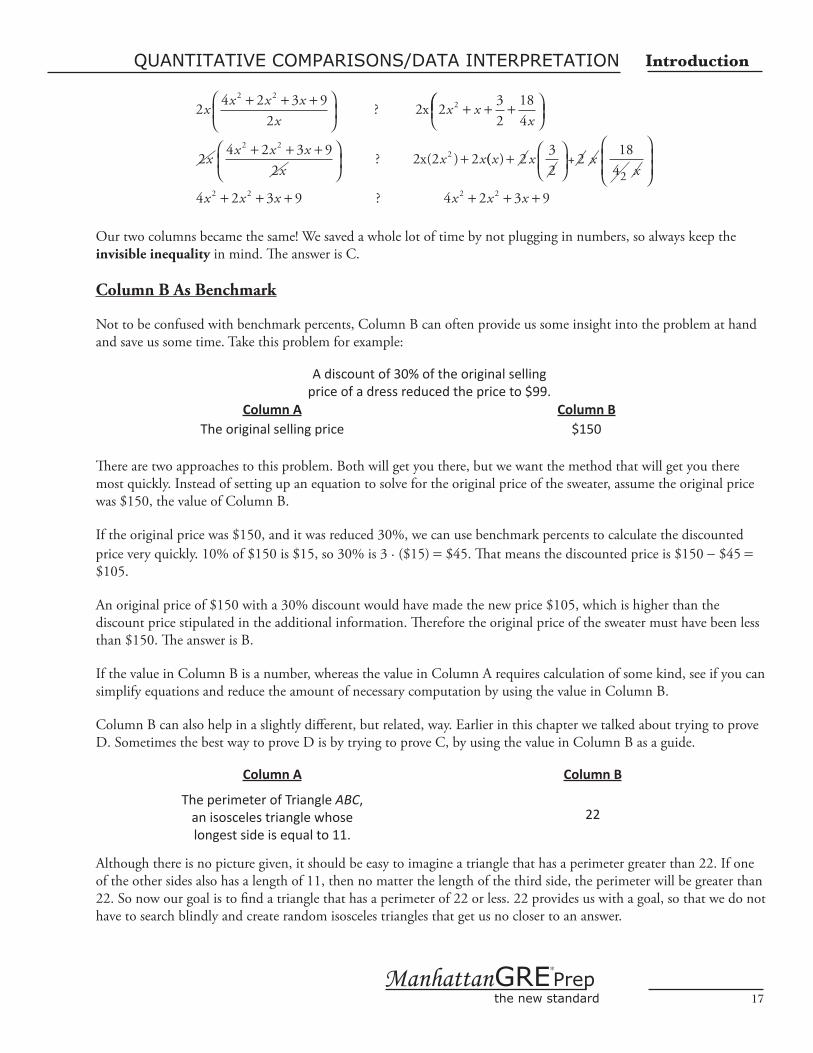
In this case, we’re given a piece of common information telling us that x > 0. This is a red flag telling you that you’re now allowed to multiply or divide both sides by x. On further thought, we’d probably be better off multiplying both columns by 2x, because it will get rid of our denominator in Column A. Treat the two columns as if they are on opposite sides of an inequality. Because we don’t know which direction the inequality faces, use a (?) as a place holder.
17Manhattan GRE Prep
the new standard
*
QUANTITATIVE COMPARISONS/DATA INTERPRETATION Introduction
2 4 2 3 92
2 32
184
2 22x
x x xx
x xx
+ + +
+ + + ? 2x
+ + +
+2 4 2 3 9
22 2
2 22x
x x xx
x x ? 2x( ) (( )x x xx
x x x
+
+ + +
2 32
184
4 2 3 92
2 2
+ 2
? 4 2 3 92 2x x x+ + +
Our two columns became the same! We saved a whole lot of time by not plugging in numbers, so always keep the invisible inequality in mind. The answer is C.
Column B As Benchmark
Not to be confused with benchmark percents, Column B can often provide us some insight into the problem at hand and save us some time. Take this problem for example:
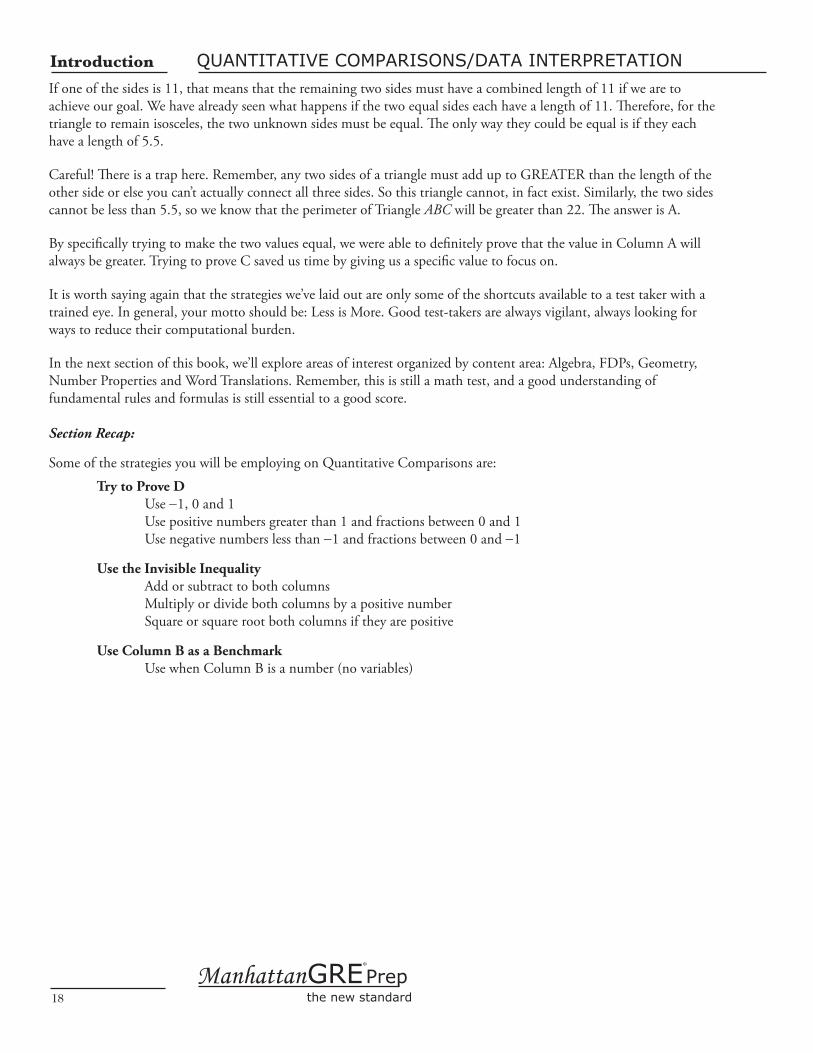
A discount of 30% of the original selling price of a dress reduced the price to $99.
Column A Column BThe original selling price $150
There are two approaches to this problem. Both will get you there, but we want the method that will get you there most quickly. Instead of setting up an equation to solve for the original price of the sweater, assume the original price was $150, the value of Column B.
If the original price was $150, and it was reduced 30%, we can use benchmark percents to calculate the discounted price very quickly. 10% of $150 is $15, so 30% is 3 · ($15) = $45. That means the discounted price is $150 - $45 = $105.
An original price of $150 with a 30% discount would have made the new price $105, which is higher than the discount price stipulated in the additional information. Therefore the original price of the sweater must have been less than $150. The answer is B.
If the value in Column B is a number, whereas the value in Column A requires calculation of some kind, see if you can simplify equations and reduce the amount of necessary computation by using the value in Column B.
Column B can also help in a slightly different, but related, way. Earlier in this chapter we talked about trying to prove D. Sometimes the best way to prove D is by trying to prove C, by using the value in Column B as a guide.
Column A Column B
The perimeter of Triangle ABC, an isosceles triangle whose longest side is equal to 11.
22
Although there is no picture given, it should be easy to imagine a triangle that has a perimeter greater than 22. If one of the other sides also has a length of 11, then no matter the length of the third side, the perimeter will be greater than 22. So now our goal is to find a triangle that has a perimeter of 22 or less. 22 provides us with a goal, so that we do not have to search blindly and create random isosceles triangles that get us no closer to an answer.
18
Manhattan GRE Prepthe new standard
*
QUANTITATIVE COMPARISONS/DATA INTERPRETATIONIntroduction
If one of the sides is 11, that means that the remaining two sides must have a combined length of 11 if we are to achieve our goal. We have already seen what happens if the two equal sides each have a length of 11. Therefore, for the triangle to remain isosceles, the two unknown sides must be equal. The only way they could be equal is if they each have a length of 5.5.
Careful! There is a trap here. Remember, any two sides of a triangle must add up to GREATER than the length of the other side or else you can’t actually connect all three sides. So this triangle cannot, in fact exist. Similarly, the two sides cannot be less than 5.5, so we know that the perimeter of Triangle ABC will be greater than 22. The answer is A.
By specifically trying to make the two values equal, we were able to definitely prove that the value in Column A will always be greater. Trying to prove C saved us time by giving us a specific value to focus on.
It is worth saying again that the strategies we’ve laid out are only some of the shortcuts available to a test taker with a trained eye. In general, your motto should be: Less is More. Good test-takers are always vigilant, always looking for ways to reduce their computational burden.
In the next section of this book, we’ll explore areas of interest organized by content area: Algebra, FDPs, Geometry, Number Properties and Word Translations. Remember, this is still a math test, and a good understanding of fundamental rules and formulas is still essential to a good score.
Section Recap:
Some of the strategies you will be employing on Quantitative Comparisons are:
Try to Prove D Use -1, 0 and 1 Use positive numbers greater than 1 and fractions between 0 and 1 Use negative numbers less than -1 and fractions between 0 and -1
Use the Invisible Inequality Add or subtract to both columns Multiply or divide both columns by a positive number Square or square root both columns if they are positive
Use Column B as a Benchmark Use when Column B is a number (no variables)