Embed Size (px)
Citation preview
Akash Khandelwal
Nov 8th 2018
International Workshop on Clinical Pharmacology of Anticancer
drugs (IACPD) 8-9 November 2018, Amsterdam
Quantitative Clinical Pharmacology Considerations for the development of Avelumab
2
This is an invited presentation at International workshop on Clinical Pharmacology of Anticancer drugs (IACPD) 8-9 November 2018, Amsterdam
The data and conclusions in this presentation are based on published data and at times verbatim. Abstract/publications used to draft slide deck is included in reference slide # 26
Slide #24 flat dose will be substituted with US PI excerpt if we hear back from FDA before the presentation and conclusion will be changed accordingly.
Note to reviewers

3
• Mechanism of action
• Time-varying clearance
• Label examples based on PopPK
• Exposure-response MCC, UC & NSCLC
• Simulations for alternate dosing
• Summary
Contents
4
• Merck and Pfizer are co-developing avelumab in global strategic alliance
• Avelumab is currently approved as monotherapy
in the US, the EU, Australia, Canada, Israel and Switzerland for metastaticMerkel Cell carcinoma (mMCC)
in Japan for curatively unresectable MCC
in the US and Israel for locally advanced or metastatic urothelial carcinoma withdisease progression during or following platinum-containing chemotherapy ordisease progression within 12 months of neoadjuvant or adjuvant treatment withplatinum-containing chemotherapy.
Merck / Pfizer Global Strategic Alliance
Avelumab Development and Marketing Approvals
5
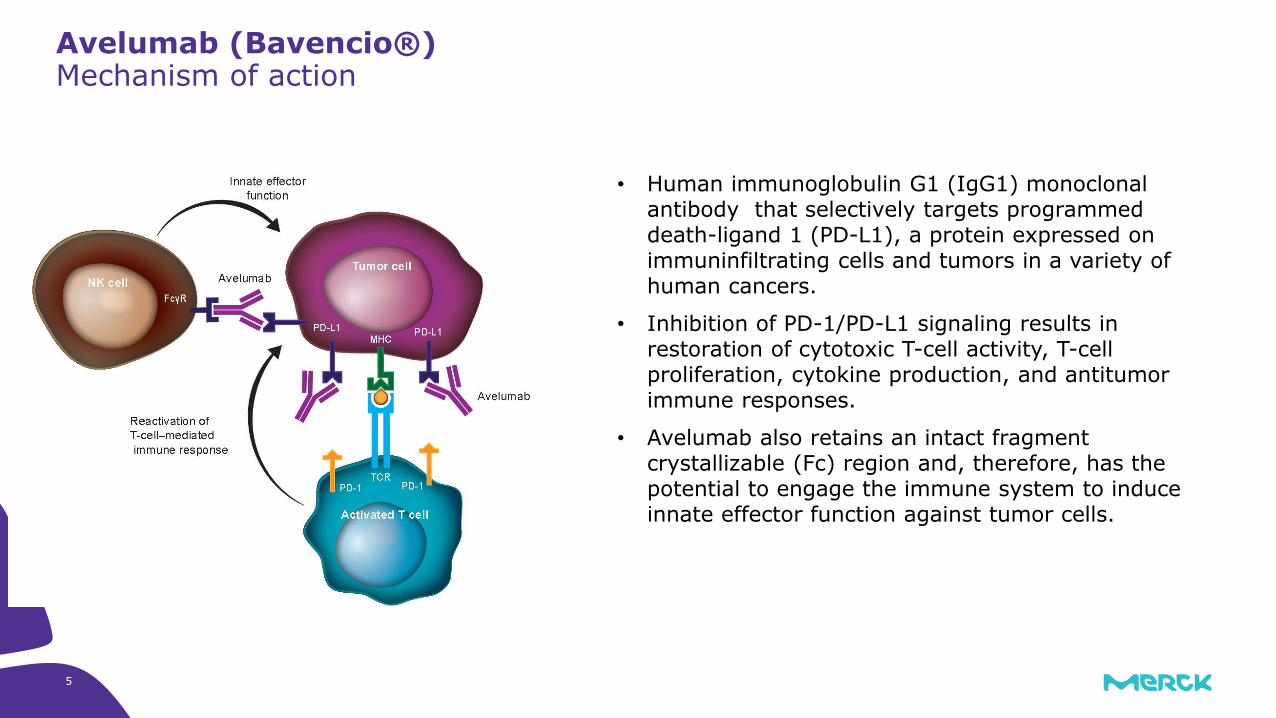
• Human immunoglobulin G1 (IgG1) monoclonal antibody that selectively targets programmed death-ligand 1 (PD-L1), a protein expressed on immuninfiltrating cells and tumors in a variety of human cancers.
• Inhibition of PD-1/PD-L1 signaling results in restoration of cytotoxic T-cell activity, T-cell proliferation, cytokine production, and antitumor immune responses.
• Avelumab also retains an intact fragment crystallizable (Fc) region and, therefore, has the potential to engage the immune system to induce innate effector function against tumor cells.
Mechanism of actionAvelumab (Bavencio®)

6
Characterizing the PK of avelumab and its relation to response Support dose and regimen selection for intended indications and populations
NCA: non-compartmental analysisADA: anti-drug antibodypopPK: population pharmacokineticsTO: target occupancyTMDD: target-mediated drug dispositionBOR: best overall responseDDI: drug-drug interaction
Dose
PopPK
Exposure
(Plasma Conc)
Exposure-BOR
Exposure-surivalExposure/Adverse events
NCA PKDose-proportionality, TMDD
ADA
PD (TO%, cytokines)
QT interpretation
• Intrinsic/extrinsic factors (including DDI)• TMDD • Special populations: pediatrics,
renal/hepatic impariment • Manufacturing process changes• Dosing regimens: flat dosing
7
TrialsPopulation PK Model
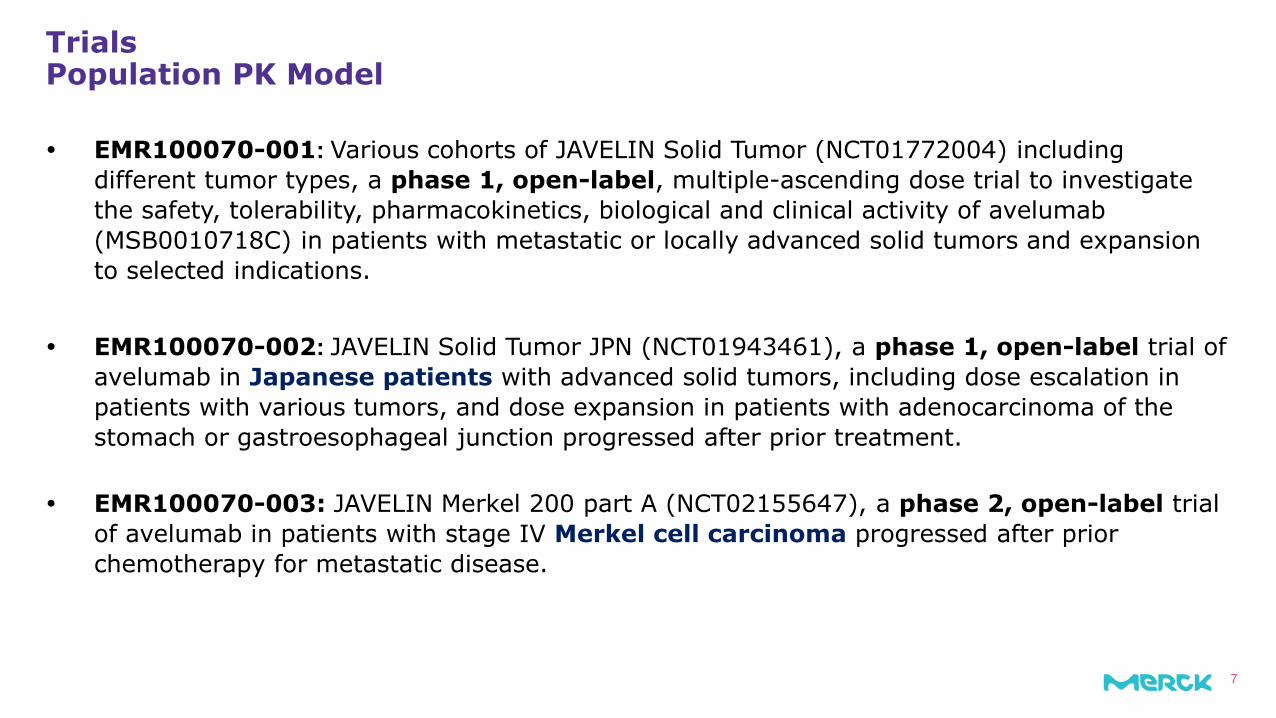
EMR100070-001: Various cohorts of JAVELIN Solid Tumor (NCT01772004) including
different tumor types, a phase 1, open-label, multiple-ascending dose trial to investigate
the safety, tolerability, pharmacokinetics, biological and clinical activity of avelumab
(MSB0010718C) in patients with metastatic or locally advanced solid tumors and expansion
to selected indications.
EMR100070-002: JAVELIN Solid Tumor JPN (NCT01943461), a phase 1, open-label trial of
avelumab in Japanese patients with advanced solid tumors, including dose escalation in
patients with various tumors, and dose expansion in patients with adenocarcinoma of the
stomach or gastroesophageal junction progressed after prior treatment.
EMR100070-003: JAVELIN Merkel 200 part A (NCT02155647), a phase 2, open-label trial
of avelumab in patients with stage IV Merkel cell carcinoma progressed after prior
chemotherapy for metastatic disease.

8
Data
Nominal dose
EMR100070-001
EMR100070-002
EMR100070-003 Total
1 mg/kg 4 (0.237%) 0 (0%) 0 (0%) 4 (0.219%)3 mg/kg 13 (0.77%) 5 (9.8%) 0 (0%) 18 (0.985%)10 mg/kg 1650 (97.7%) 40 (78.4%) 88 (100%) 1778 (97.3%)20 mg/kg 21 (1.24%) 6 (11.8%) 0 (0%) 27 (1.48%)
Population PK Model
Title of Presentation | DD.MM.YYYY
Models
Population PK Model
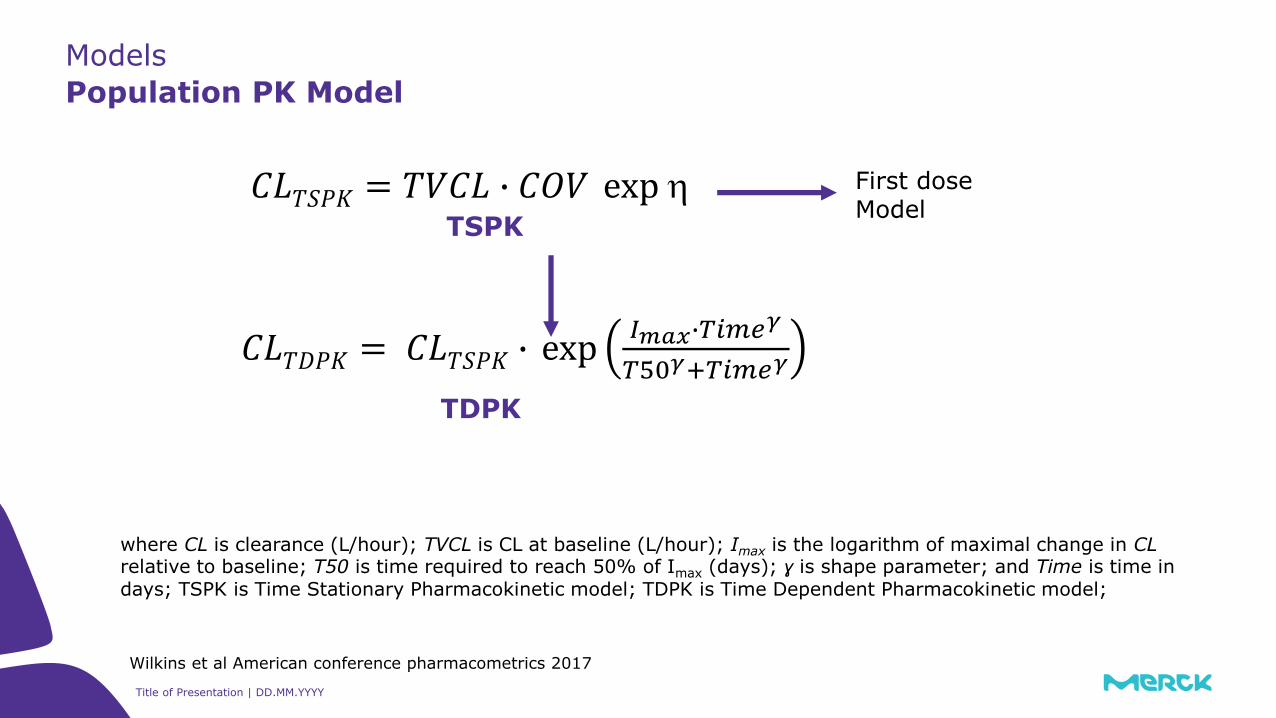
First dose Model
TSPK
TDPK
where CL is clearance (L/hour); TVCL is CL at baseline (L/hour); Imax is the logarithm of maximal change in CLrelative to baseline; T50 is time required to reach 50% of Imax (days); ɣ is shape parameter; and Time is time in days; TSPK is Time Stationary Pharmacokinetic model; TDPK is Time Dependent Pharmacokinetic model;
𝐶𝐿𝑇𝐷𝑃𝐾 = 𝐶𝐿𝑇𝑆𝑃𝐾 ∙ exp𝐼𝑚𝑎𝑥∙𝑇𝑖𝑚𝑒𝛾
𝑇50𝛾+𝑇𝑖𝑚𝑒𝛾
𝐶𝐿𝑇𝑆𝑃𝐾 = 𝑇𝑉𝐶𝐿 ∙ 𝐶𝑂𝑉 exp
Wilkins et al American conference pharmacometrics 2017

10
Change in CL from baseline
Wilkins et al American conference pharmacometrics 2017
11
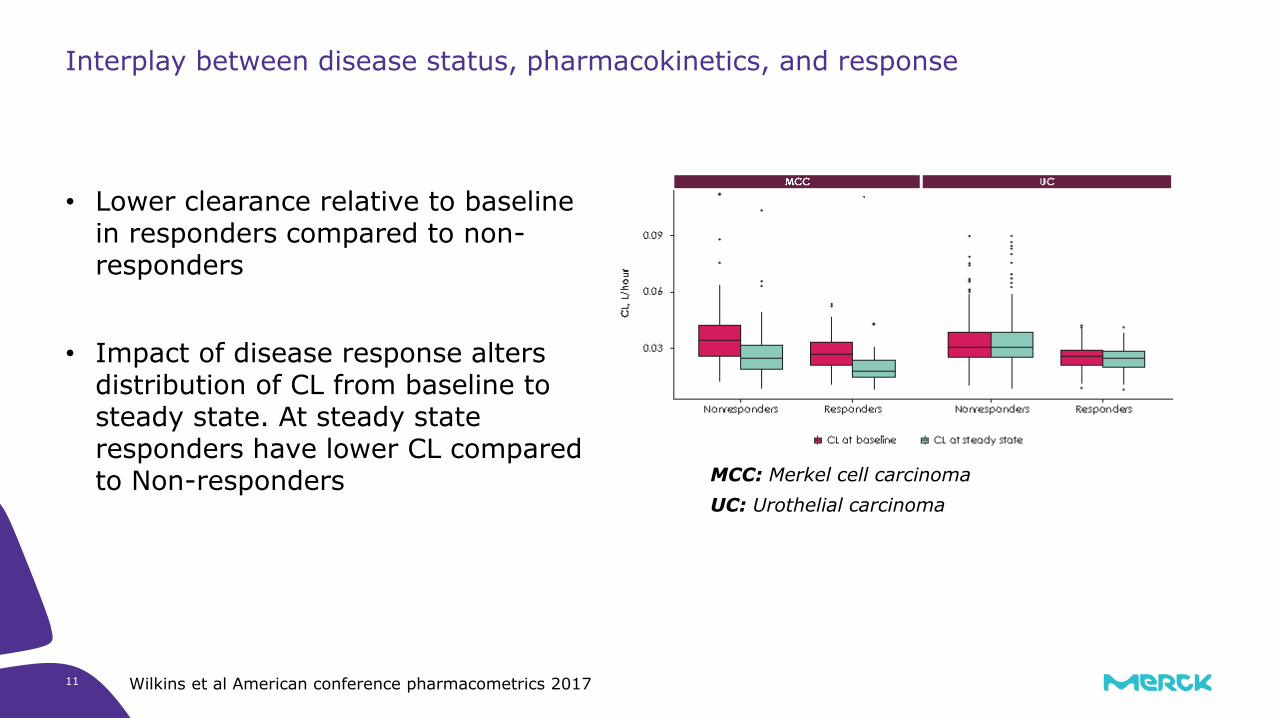
Interplay between disease status, pharmacokinetics, and response
• Lower clearance relative to baselinein responders compared to non-responders
• Impact of disease response alters distribution of CL from baseline to steady state. At steady stateresponders have lower CL comparedto Non-responders MCC: Merkel cell carcinoma
UC: Urothelial carcinoma
Wilkins et al American conference pharmacometrics 2017

12
Relationships between covariates and PK parameters (CL, V1 and Imax)
None of the identified covariates require dose adjustment
Wilkins et al American conference pharmacometrics 2017

Title of Presentation | DD.MM.YYYY13
US PI
Time-varying Clearance
https://www.accessdata.fda.gov/drugsatfda_docs/label/2017/761049s000lbl.pdf
Title of Presentation | DD.MM.YYYY14
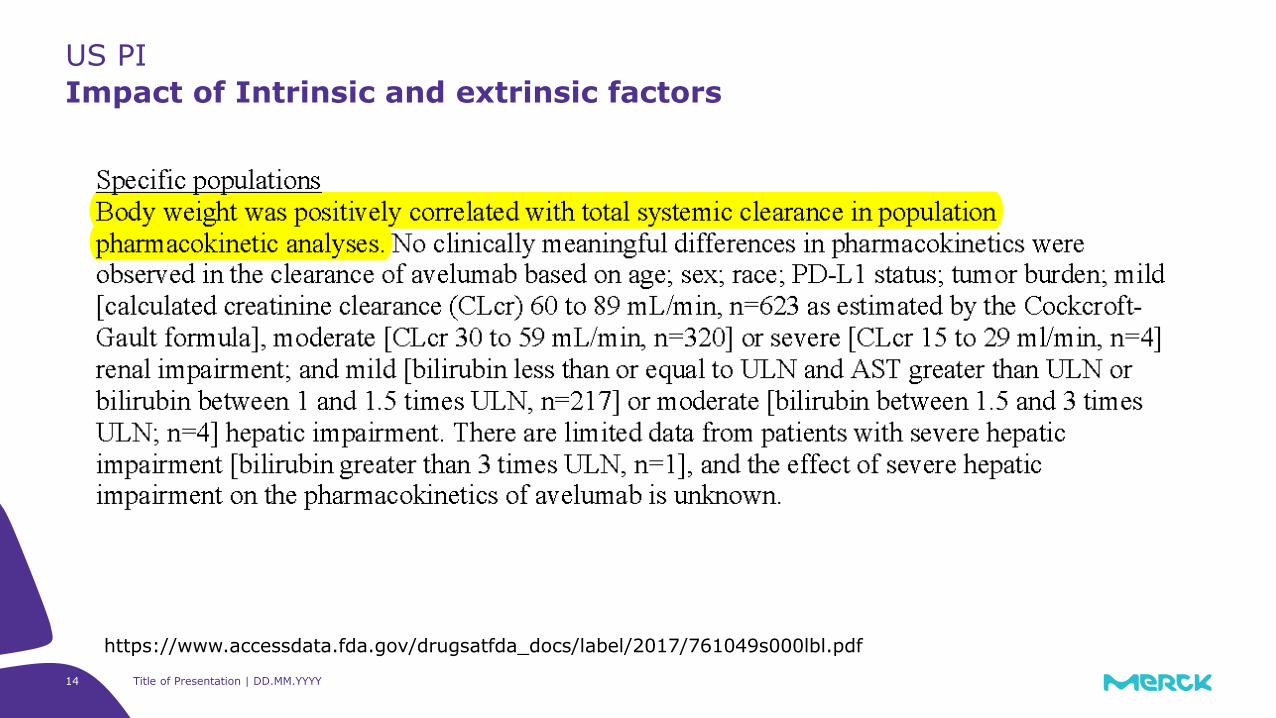
US PI
Impact of Intrinsic and extrinsic factors
https://www.accessdata.fda.gov/drugsatfda_docs/label/2017/761049s000lbl.pdf
Title of Presentation | DD.MM.YYYY15
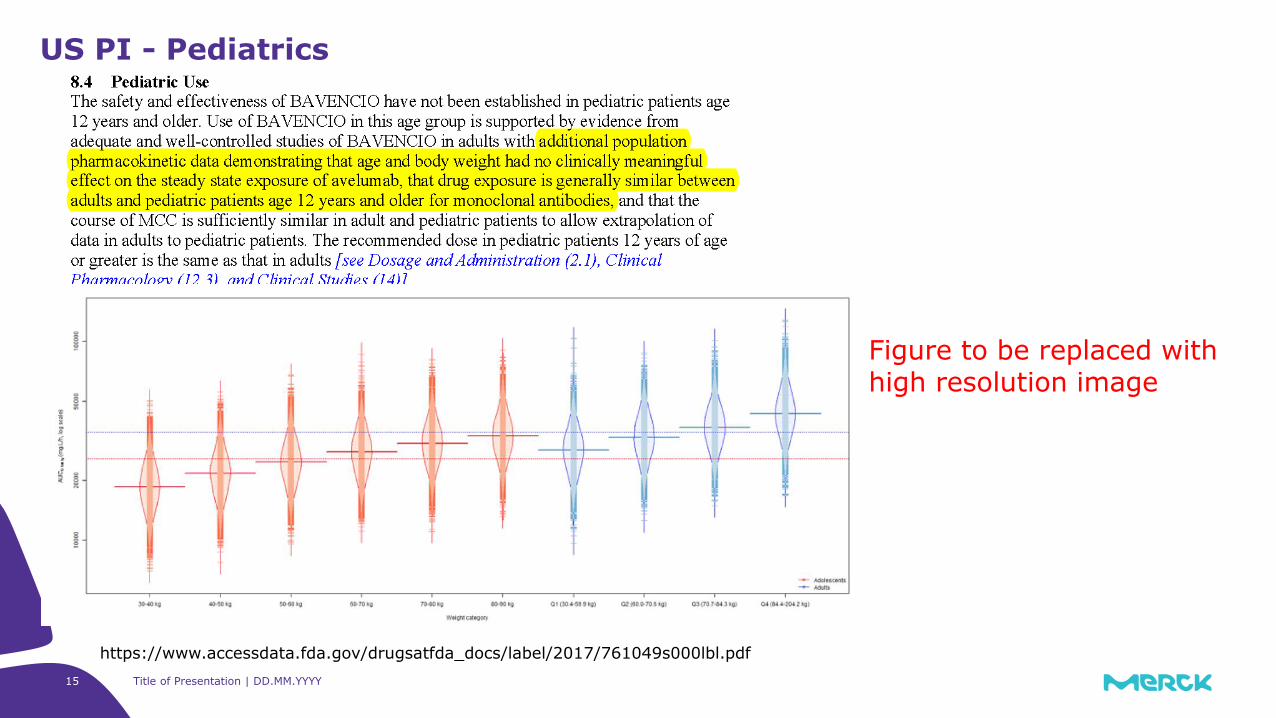
US PI - Pediatrics
https://www.accessdata.fda.gov/drugsatfda_docs/label/2017/761049s000lbl.pdf
Figure to be replaced with high resolution image
16
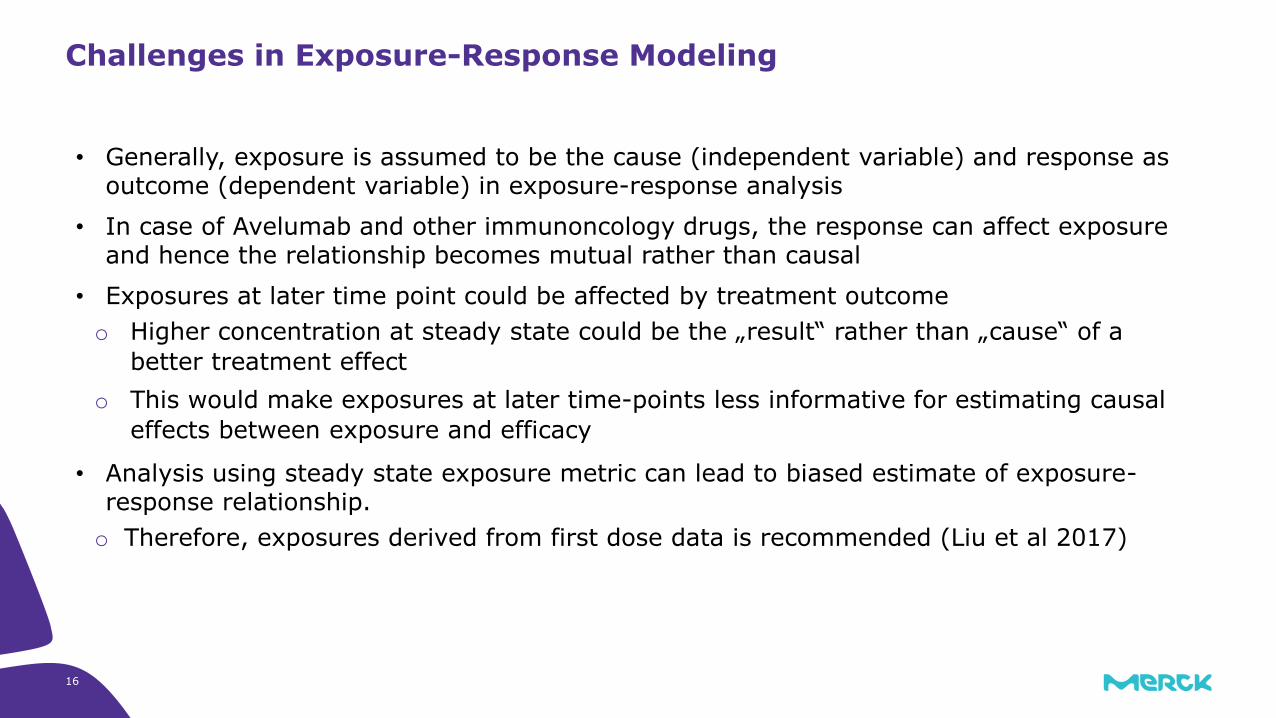
• Generally, exposure is assumed to be the cause (independent variable) and response as outcome (dependent variable) in exposure-response analysis
• In case of Avelumab and other immunoncology drugs, the response can affect exposure and hence the relationship becomes mutual rather than causal
• Exposures at later time point could be affected by treatment outcome
o Higher concentration at steady state could be the „result“ rather than „cause“ of a
better treatment effect
o This would make exposures at later time-points less informative for estimating causal
effects between exposure and efficacy
• Analysis using steady state exposure metric can lead to biased estimate of exposure-response relationship.
o Therefore, exposures derived from first dose data is recommended (Liu et al 2017)
Challenges in Exposure-Response Modeling

17 Title of Presentation | DD.MM.YYYY
Endpoint: Best overall response (BOR) according to RECIST 1.1
• Responder (complete response and partial response)
• Non-responder (all the others)
Endpoint: Progression Free Survival (PFS) and Overall Survival (OS)
Exposure-Response Analysis
Exposure-Efficacy
Exposure-Safety (N=1629)
Endpoints:
• irAE: Occurrence of at least one treatment-emergent immune-related adverse event (grade 1)
• IRR: Occurrence of at least one IV infusion reaction
• teAE: Occurrence of at least one treatment-emergent adverse event (grades 1-3)
Indication Dose N ORR(%)
MCC 10 mg/kg 88 31.8
UC 10 mg/kg 249 17.3
2L NSCLC 10 mg/kg 184 14.1

18
• Differences in avelumab exposure were not associated with overall rates of AEs (grade ≥1 or grade ≥3) or with different types of Aes
• Higher avelumab exposure was associated with a modest increase in immune-related irAEs of grade ≥1, although data are sparse at higher exposure levels.
• The benefit–risk balance for avelumab appears favorable at all levels of avelumab exposure
Relationship between avelumab exposure and safety (n=1629)
Gulley et al, 2017 American Society of Clinical Oncology Annual Meeting, Abstract # 9086

19
MCC (univariate model)
Exposure Efficacy relationship
MCC first cycle popPK model
Apparent increase in response with increase in exposure
https://www.accessdata.fda.gov/drugsatfda_docs/nda/2017/761049Orig1s000MultidisciplineR.pdf
𝐴𝑈𝐶0−336ℎ (g·h/L)(N=88)
Responders/N (ORR%)
Q1 (15.15 - 20.74) 3/22 (14)Q2 (20.74 - 23.84) 6/22 (27)Q3 (23.84 – 28) 8/22 (36)Q4 (28 - 51.74) 11/22 (50)
20
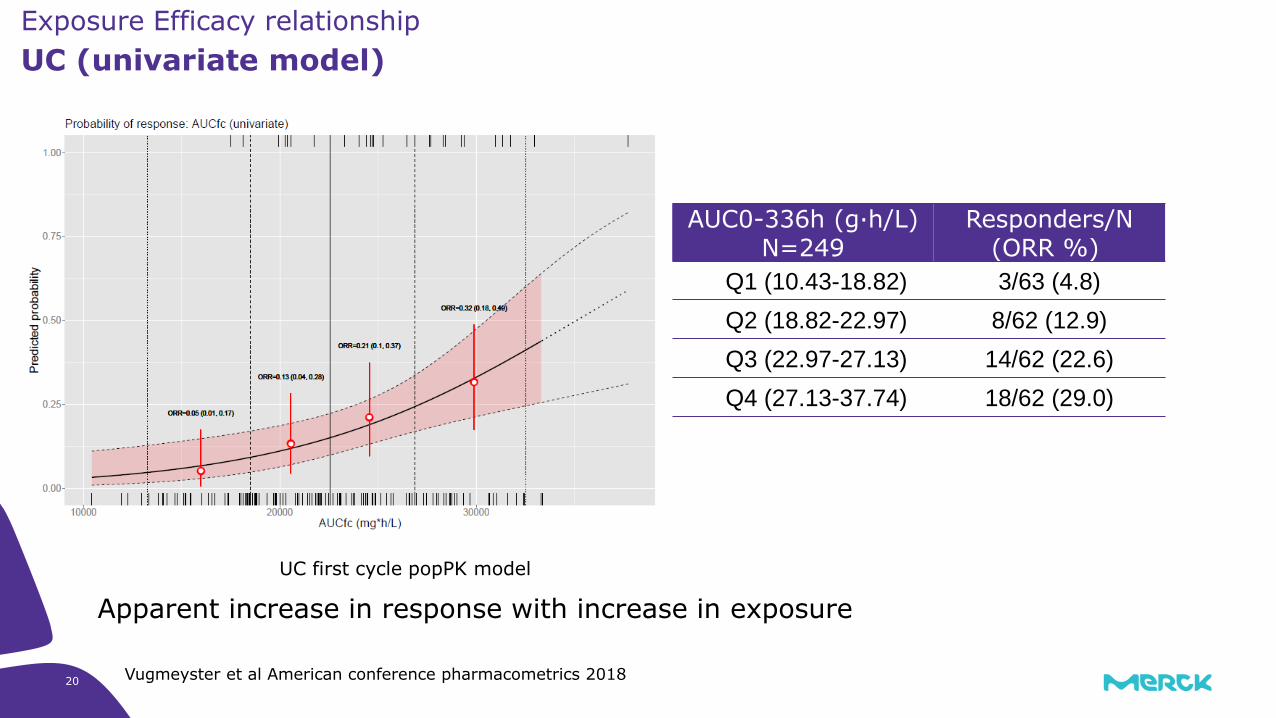
UC (univariate model)
Exposure Efficacy relationship
UC first cycle popPK model
Apparent increase in response with increase in exposure
Vugmeyster et al American conference pharmacometrics 2018
AUC0-336h (g·h/L) N=249
Responders/N (ORR %)
Q1 (10.43-18.82) 3/63 (4.8)
Q2 (18.82-22.97) 8/62 (12.9)
Q3 (22.97-27.13) 14/62 (22.6)
Q4 (27.13-37.74) 18/62 (29.0)

21
Exposure Efficacy relationshipAdvanced NSCLC progressed after platinum doublet chemotherapy (n=184)
Gulley et al, 2017 American Society of Clinical Oncology Annual Meeting, Abstract # 9086
Ctrough first dose (ug/ml) N=184
Responders/N (ORR %)
Q1 (2.79 - 11.84) 4/46 (8.7)
Q2 (11.87 - 18-55) 5/46 (10.9)
Q3 (18.56 - 25.28) 9/46 (19.6)
Q4 (25.8 – 59.6) 8/46 (17.4)
Apparent increase in response with increase in exposure
22
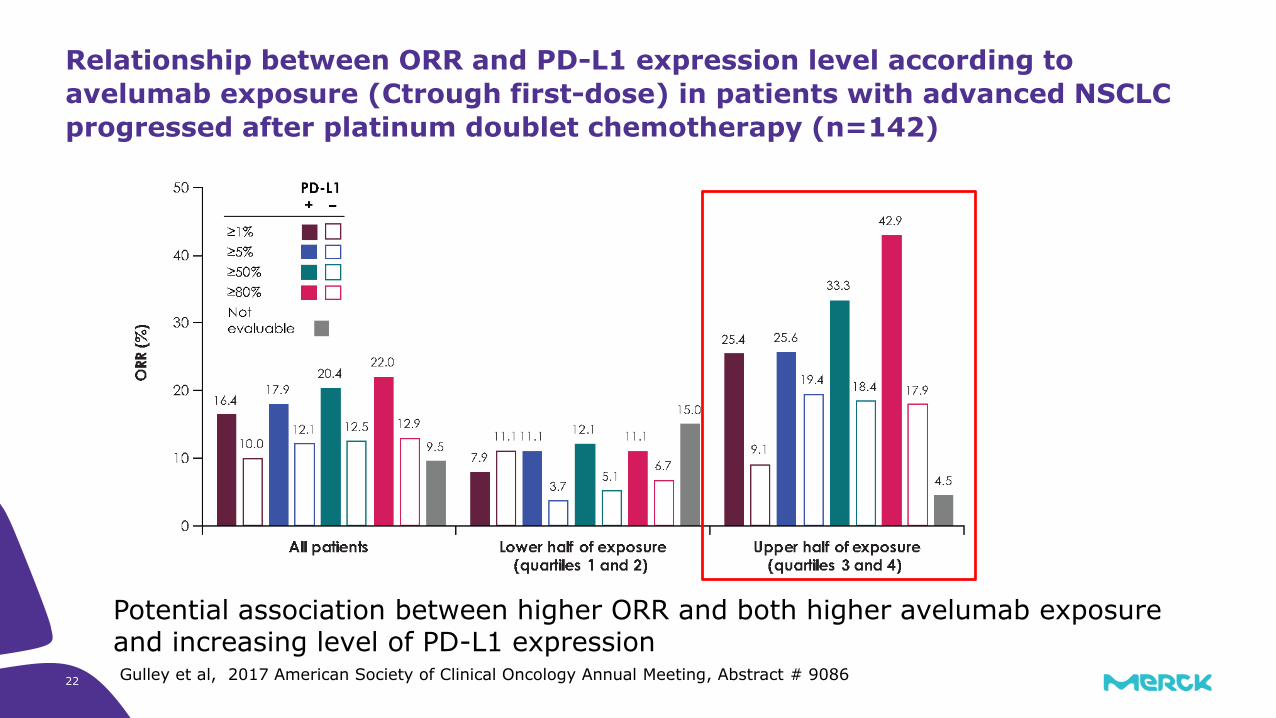
Relationship between ORR and PD-L1 expression level according to
avelumab exposure (Ctrough first-dose) in patients with advanced NSCLC
progressed after platinum doublet chemotherapy (n=142)
Gulley et al, 2017 American Society of Clinical Oncology Annual Meeting, Abstract # 9086
Potential association between higher ORR and both higher avelumab exposure and increasing level of PD-L1 expression
23
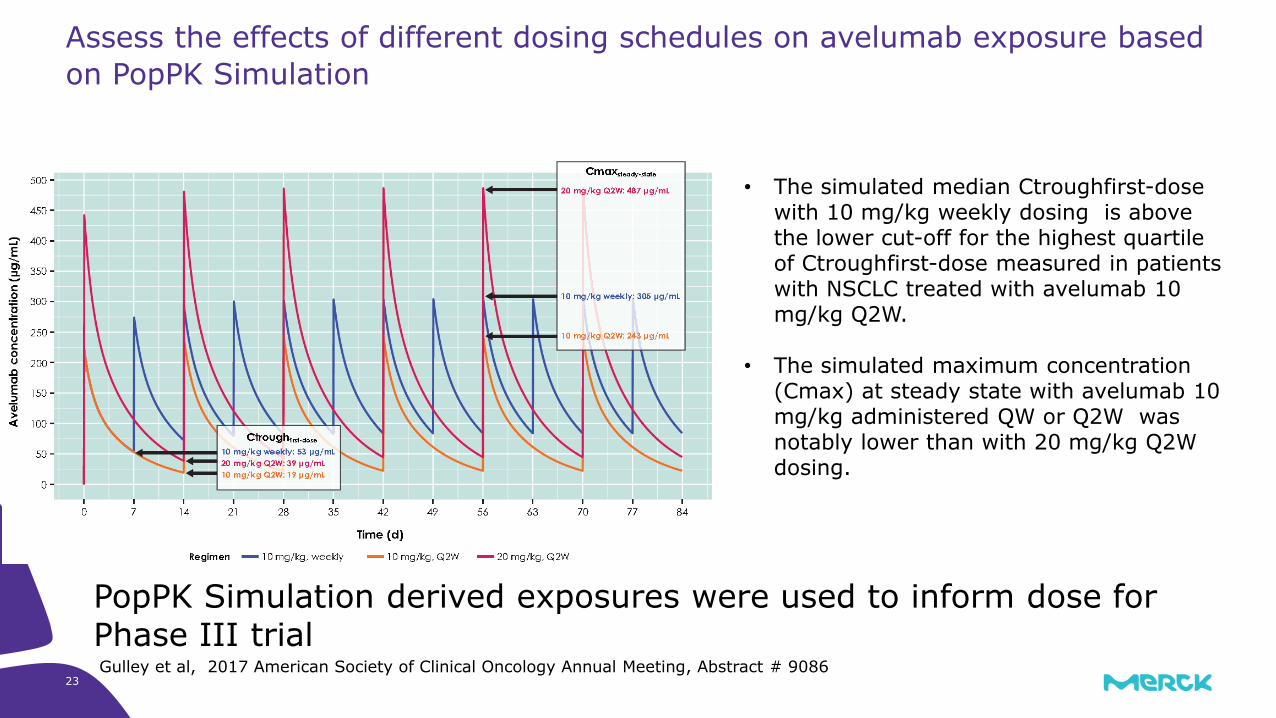
Assess the effects of different dosing schedules on avelumab exposure based
on PopPK Simulation
Gulley et al, 2017 American Society of Clinical Oncology Annual Meeting, Abstract # 9086
• The simulated median Ctroughfirst-dose with 10 mg/kg weekly dosing is above the lower cut-off for the highest quartile of Ctroughfirst-dose measured in patients with NSCLC treated with avelumab 10 mg/kg Q2W.
• The simulated maximum concentration (Cmax) at steady state with avelumab 10 mg/kg administered QW or Q2W was notably lower than with 20 mg/kg Q2W dosing.
PopPK Simulation derived exposures were used to inform dose for Phase III trial
24
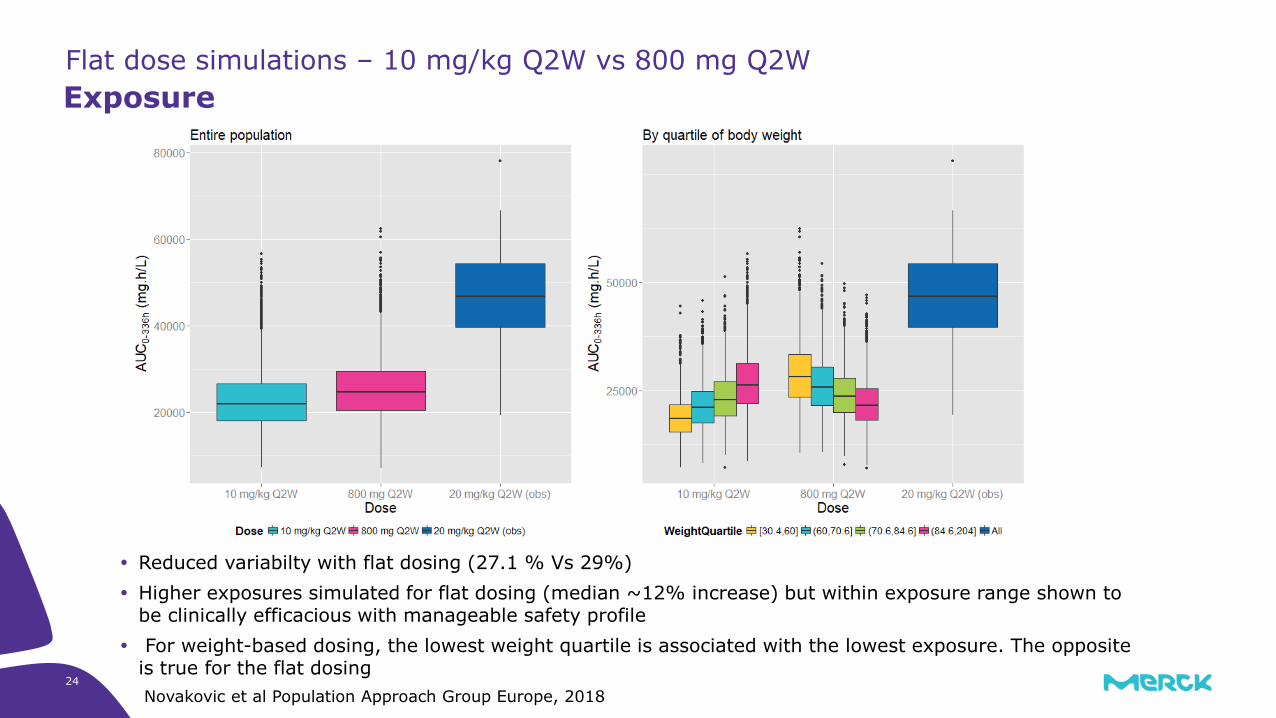
Flat dose simulations – 10 mg/kg Q2W vs 800 mg Q2W
Exposure
Reduced variabilty with flat dosing (27.1 % Vs 29%)
Higher exposures simulated for flat dosing (median ~12% increase) but within exposure range shown to be clinically efficacious with manageable safety profile
For weight-based dosing, the lowest weight quartile is associated with the lowest exposure. The opposite is true for the flat dosing
Novakovic et al Population Approach Group Europe, 2018

25
Summary
1Gulley et al, 2017 American Society of Clinical Oncology Annual Meeting, Abstract # 9086
• Population PK modeling was used to support label statements in approved indications.
• PopPK simulations were performed to avoid conducting a clinical trial to compare the weight-based and flat dosing regimens. A flat dose regimen is currently being evaluated in several trials.
• The interpretation of the apparent exposure–response association for avelumab is confounded by the study design, single dose level data, imbalance in the distribution of covariates, immortal bias and selection bias. Therefore, these observations do not confirm that a dose/exposure–response relationship exists.
• These analyses provide a rationale for studies of more intensive avelumab dosing regimens in NSCLC populations with different levels of tumor PD-L1 expression to assess the potential for further increased clinical benefit with avelumab, and to confirm the existence of an exposure–response relationship.1
• The ongoing phase 3 JAVELIN Lung 100 trial (NCT02576574) is comparing 2 regimens of avelumab vs platinum doublet chemotherapy as first-line treatment for patients with PD-L1+ NSCLC, and will therefore investigate the effects of higher avelumab exposure.1
26
• Gulley et al, Exposure–response and PD-L1 expression analysis of second-line avelumab in patients with advanced NSCLC: data from the JAVELIN Solid Tumor trial. American Society of Clinical Oncology Annual Meeting 2017
• Wilkins et al, Clearance over time and effect of response in the pharmacokinetics of avelumab. American conference pharmacometrics 2017
• Wilkins et al, Population pharmacokinetic analysis of avelumab in different cancer types. American conference pharmacometrics 2017
• Vugmeyster et al, Exposure-response analysis of avelumab in patients with advanced urothelial carcinoma via a full-model approach. American conference pharmacometrics 2018
• Novakovic et al, Simulation-based assessment of flat dose regimen of an anti-PD-L1 antibody: case study of avelumab. Population Approach Group Europe, 2018
• https://www.accessdata.fda.gov/drugsatfda_docs/label/2017/761049s000lbl.pdf
• https://www.accessdata.fda.gov/drugsatfda_docs/nda/2017/761049Orig1s000MultidisciplineR.pdf
References
27
Acknowledgements
Merck KgaA EMD Serono Merck Serono S.A Occams Pfizer
Ana Novakovic Berend Neuteboom Pascal Girard Justin Wilkins Satjit Brar
Brigitte Brockhaus Isaac Dai Janet Wade Carlo Bello
Linghui Li
Yulia Vugemyster