Embed Size (px)
Citation preview

Quantitative Circulatory Physiology
Laboratory Manual

QCP Laboratory Manual
Contents
Before Starting
Normal Values
Exercise Tolerance
Laboratory Exercises
Hemorrhage A-V Fistula Fick’s Principle Pulmonary Shunt Respiratory Acidosis Water Load Starvation Baroreceptor Reflex Insulin Overdose Renal Artery Stenosis Heart Failure High Altitude Changes In Salt Intake Aldosterone And Sodium
Escape A Normal Meal

Contents
QCP Laboratory Manual
Diabetes Mellitus Pericardial Hemorrhage Carbon Monoxide Inhalation Anemia Diabetes Insipidus Pneumothorax Cardiac Arrest Asphyxia Cardiopulmonary Resuscitation Introduction To Acid / Base Sodium Bicarbonate Ketoacidosis Mitral Stenosis Aortic Regurgitation Osmolarity Nephrotic Syndrome
Clinical Exercises
Mr. Johnson Mr. Johnson – Notes Ms. Lake Ms. Lake – Notes

Contents
QCP Laboratory Manual
Ms. Nance Ms. Nance – Notes Mr. Parks Mr. Parks – Notes Mr. Stone Mr. Stone – Notes Ms. Thomas Ms. Thomas – Notes Mr. White Mr. White – Notes Mr. Wilson Mr. Wilson – Notes
QCP Laboratory Manual
Before Starting
If QCP is not installed on your computer, read Installation in the User’s Guide. If QCP is installed on your computer but you have never used the program, read Basic Stuff and A Complete Simulation in the User’s Guide. If you are interested in seeing some simulated patients, read Patients in the User’s Guide. If you have used QCP, you might find some useful, more advanced information in Patients, Emergencies and Special Features in the User’s Guide. Otherwise, you’re ready to go …

QCP User’s Guide
Installation Before Installing
Make sure that the destination disk drive 2 megabytes of free space.
Installation Is Automatic Insert the distribution diskette in disk drive A: (or B:). In Windows 3.x, use the Program Manager. Select File / Run. Enter A:SETUP (or B:SETUP). In Windows 95 , use Start / Settings / Control Panel / Add/Remove Programs. Click on Install and then Next. Windows will find A:SETUP (or B:SETUP). Click on Finish to finish. The installation software will complete the installation. The installation software will recommend that you install QCP in drive and directory C:\QCP3. In fact, you can specify any drive and directory name. In this documentation we’ll refer to your choice as C:\QCP3.
At The End Of A Successful Installation At the end of a successful installation, the specified directory will contain 2 files: QCP3.EXE and QCP3.DAT. Windows 3.x will create a program group with an icons for QCP.
Installation
QCP User’s Guide
Windows 95 will create a folder with a similar icon.
What Installation Won’t Do Installation only copies 2 files into the directory that you specified. Installation does not alter CONFIG.SYS, AUTOEXEC.BAT or WIN.INI. Installation does not load any DLL’s.
Uninstall Use the program UNINSTAL.EXE in QCP’s main directory to uninstall QCP.

QCP Laboratory Manual
Normal Values Use Normal Values To Identify Abnormal Ones
Develop a knowledge of QCP’s normal numerical values and use this knowledge to identify abnormal values as they occur.
Record Important Normal Values Here Click Restart to reestablish initial conditions. Then click the toolbar buttons to display the initial (presumably normal) values of QCP’s variables. The View main menu selection can be used to adjust the toolbar button lineup.
Charts Blood Pressure (mmHg)
Heart Rate (/Min)
Respiratory Rate (/Min)
Body Temperature (deg. F)
ECG

Normal Values
QCP Laboratory Manual
Blood Chemistry Blood [Na+] (mEq/L)
Venous [HCO3-] (mEq/L)
Blood [Glucose] (mG/dL)
Venous pH
Venous [H+] (nEq/L)
Blood [Protein] (G/dL)
Colloid Pressure (mmHg)
Osmolarity (mOsm/L)
Hematocrit (%)
Arterial pO2 (mmHg)
Arterial O2 Content (mL/mL)
Venous pO2 (mmHg)
Venous O2 Content (mL/mL)
Arterial pCO2 (mmHg)
Venous pCO2 (mmHg)
Plasma [AII] (pG/mL)
Venous [ADH] (pG/mL)
Plasma [Aldosterone] (pMol/L)

Normal Values
QCP Laboratory Manual
Flow Cardiac Output (mL/Min)
Stroke Volume (mL)
Pressure Right Atrial Pressure (mmHg)
Left Atrial Pressure (mmHg)
Pulm. Art. Pressure (mmHg)
Conductance TPR (mmHg / (mL / Min))
Blood Volume Blood Volume (mL)
Left Heart End-Diastolic Volume (mL)
End-Diastolic Pressure (mmHg)
End-Systolic Volume (mL)
End-Systolic Pressure (mmHg)

Normal Values
QCP Laboratory Manual
H2O Total Body H2O (L)
Extracellular Volume (L)
Plasma Volume (mL)
Lungs Total Ventilation (L/Min)
Alveolar Ventilation (L/Min)
Tidal Volume (mL)
Metabolism Metabolic Rate (kCal/Min)
Autonomic Efferents Sympathetic Ganglia Firing (Hz)
Circulating Catecholamines [Norepinephrine] (pG/mL)
[Epinephrine] (pG/mL)

Normal Values
QCP Laboratory Manual
Erythropoietin Plasma [Erythropoietin] (mU/mL)
Insulin Plasma [Insulin] (uU/mL)
Glucagon Plasma [Glucagon] (pG/mL)
Glomerulus Filtration Rate (mL/Min)
Urine Water Excretion (mL/Min)
Sodium Excretion (mEq/Min)

QCP Laboratory Manual
Exercise Tolerance The Energy Cost Of Running
The energy required for walking and running is proportional to speed and body weight. O2 use as a function of velocity is shown below (data from Menier).
O2 Use(mL/Min) / kG
Velocity (kM/Hr)0 8 12 16 20
0
20
40
60
4
WalkingRunning ...
Since both energy required and distance covered are proportional to walking and running speed, it takes a fixed amount of energy to travel a fixed distance: 0.2 ml O2 per meter traveled per kg body weight (Margaria, 1975). The energy required to run up a grade is proportional to the steepness of the grade (shown below, data from Margaria, 1963). The premium is 0.20 x level-ground needs per % grade.

Exercise Tolerance
QCP Laboratory Manual
O2 Use(x Level Use)
Grade (%)-10 10 20
0
1
2
0
Use Exercise Tolerance To Evaluate Respiratory-Circulatory Function
Inadequate function in either the respiratory system or circulatory system will decrease a subject’s tolerance to physical exercise. At some point, oxygen delivery to the working skeletal muscle will become inadequate, metabolism will switch from aerobic to anaerobic, and the subject will be unable to continue. Thus, the subject’s tolerance to exercise can be used as a measure of respiratory-circulatory function.
An Exercise Tolerance Test We’ll use the treadmill in this section to measure a normal subject’s tolerance to exercise. The general idea is to observe the subject’s response to exercise, as the exercise becomes more and more strenuous.

Exercise Tolerance
QCP Laboratory Manual
0 5 2 01 0
Tre adm illG ra de( % )
1 5
5
1 0
15
2 0
Time (M in )
0
B a lk e a nd W are , 19 59.
This will be a slightly modified Balke and Ware (1959) protocol. Click Restart to reestablish initial conditions. Note that the patient has to be standing when using
the treadmill. Click and suggest standing. Record the initial or control values in the table below
(at 0’). Then click to start the treadmill. Set exercise type to treadmill. Select run. Set treadmill speed to 3.5 MPH. Initially set treadmill grade to 0%. The protocol (shown above) is to advance the solution for 1 minute at each treadmill grade. Then increase the treadmill grade 1% and repeat until either the

Exercise Tolerance
QCP Laboratory Manual
protocol is complete or the subject stops exercising. Record data at the intervals shown below.
Treadmill Speed (MPH) Treadmill Grade (%)
Heart Rate (/Min)
Time 0’ 5’ 10’ 15’ 20’
Speed 0 3.5 3.5 3.5 3.5
Grade 0% 5% 10% 15% 20%
Heart Rate
Record the elapsed time and distance when this normal subject finally gives up. Elapsed Time (Min)
Distance Traveled (Ft)
Record additional values in the table below.
Arterial Pressure (mmHg)
Cardiac Output (mL/Min) Heart Rate (/Min) Stroke Volume (mL)
Respiration Rate (/ Min) Total Ventilation (L/Min)
Arterial [O2] (mL/mL) Venous [O2] (mL/mL)
Muscle Blood Flow (mL/Min)

Exercise Tolerance
QCP Laboratory Manual
Temperature (deg. F)
Time 0’ 5’ 10’ 15’ 20’
Speed MPH 0 3.5 3.5 3.5 3.5
Grade 0% 5% 10% 15% 20%
Blood Pressure
Cardiac Output
Heart Rate
Stroke Volume
Respiration Rate
Total Ventilation
Arterial [O2]
Venous [O2]
Muscle Flow
Temperature
You may want to give this test to other subjects. You can then compare their response to the normal response documented here.
Questions For Discussion Why did this subject stop exercising? What interventions might improve exercise tolerance?

Exercise Tolerance
QCP Laboratory Manual
References Balke, B. and R.W. Ware. An experimental study of “physical fitness” of Air Force personnel. U.S. Armed Forces Med. J. 10:675-688, 1959. Margaria, R., P. Aghemo, & F. Piñera Limas. A simple relation between performance in running and maximal aerobic power. J. Appl. Physiol. 38:351-352, 1975. Margaria, R., P. Cerretelli, P. Aghemo, & G. Sassi. Energy cost of running. J. Appl. Physiol. 18:367-370, 1963. Menier, D. R. & L. G. C. E. Pugh. The relation of oxygen intake and velocity of walking and running, in competition walkers. J. Physiol. 197:717-721, 1968.

QCP Laboratory Manual
Laboratory Exercises Reviewing Homeostasis
The body preserves life by maintaining a relatively constant internal environment in the face of threatening changes in the external environment. This is homeostasis. All of the body’s organs make important contributions to homeostasis. These contributions must be controlled and coordinated.
A Typical Laboratory Exercise Our goal here is to explore those parts of human physiology that contribute to homeostasis. Exploring in this case focuses on the interactions of the body’s major organ systems. A typical laboratory exercise or simulation begins with quiet (steady-state) conditions. A disturbance is then created and the body’s response to this disturbance is observed as time advances. In one exercise that follows, the disturbance is hemorrhage. The response over time is a combination of neural and humoral compensations, salt and water retention and increased erythropoiesis. We can observe the magnitude and time course of these different components of the response and in some cases we can study the quantitative importance of the components. Note that this is an interactive environment. You can create multiple disturbances, for instance, or create a

Laboratory Exercises
QCP Laboratory Manual
disturbance and follow it up with some potentially beneficial (therapeutic) interventions.

QCP Laboratory Manual
Hemorrhage
An adequate cardiac output depends on an adequate blood volume. This is evident in hemorrhage when bloods loss decreases cardiac output and imperils oxygen delivery. The physiological response to hemorrhage is a three-part process. The principal features are: • Rapidly responding neural and humoral
mechanisms direct available blood flow toward vital organs.
• More slowly evolving salt and water retention by the kidneys replaces the lost plasma.
• Erythropoiesis gradually replaces the lost red blood cells.
Acute Response To Hemorrhage
The acute response includes a primary decrease in cardiac output, a secondary decrease in arterial pressure and compensatory increases in heart rate and vascular resistance (shown below, data from Barcroft).

Hemorrhage 2
QCP Laboratory Manual
Blood
110
120
130
Pressure(mmHg)
Time (Min)-4 0 8
Systolic
4
4
6
8
Output(L/Min)
Cardiac
60
80
100
Rate(Beats/Min)
Heart
Hemorrhage
0
30
60
Vasoconstriction(% change)
Peripheral
Autonomic Involvement
Increased heart rate and peripheral vasoconstriction signal the autonomic nervous system's participation in the acute response to hemorrhage. Autonomic dysfunction decreases the body's tolerance to blood loss (shown below, data from DuCharme).

Hemorrhage 3
QCP Laboratory Manual
0
20
40 Intact
Spinal
SympatheticBlockade
AnesthesiaBlood Loss
Hypotension: Arterial pressure = 45 mmHgDuration of Hemorrhage: 10 min.
(mL/kG)Producing
Hypotension
Selective Vasoconstriction Sympathetic vasoconstriction during hemorrhage is selective. Many organs show intense vasoconstriction, while the cerebral and coronary circulations show little response to increased sympathetic outflow (shown below, data from Kaihara).
0 50 100
Arterial PressureCardiac OutputBrain FlowHeart FlowKidney FlowVisceral Flow
% of Control The benefit of selectivity is that available blood flow, as meager as it may be, is preferentially directed to the brain and heart -- the vital organs.
Support From Renin-Angiotensin System The renin-angiotensin system supports arterial pressure in hemorrhage by constricting non-vital

Hemorrhage 4
QCP Laboratory Manual
organs. This response is slower than the response of the sympathetic nervous system, but it is still an important part of the acute circulatory response to hemorrhage (shown below, data from Brough).
Arterial
60
80
100
Pressure(mmHg)
Intact
Anephric
Time (Min)-5 0 2010
Hemorrhage
5 15
Salt And Water Retention After hemorrhage, with no intervention, salt and water retention over several days will increase blood volume to normal or above. Erythrocytes are replaced much more slowly, so a fairly severe anemia can result (shown below, data from Ebert, Adamson).

Hemorrhage 5
QCP Laboratory Manual
Hematocrit
35
40
45
(%)
PlasmaVolume
(L)
Time (Days)
2.0
2.5
3.0
-1 0 31
Hemorrhage
2
The Hemorrhage Protocol
Click Restart to reestablish initial conditions and then
record the control data. Go to Blood Volume. In the arterial hemorrhage box, set volume to 1000 and timespan to 10. Turn the hemorrhage switch on and advance the solution 10 minutes. We are interested in the immediate impact of the hemorrhage and the subsequent compensations. Fast compensations are activation of the sympathetic nervous system and increased secretion of renin.
When does each have its maximum effect? Use Autonomic Efferents / Sympathetic Ganglia / Firing Rate as an indicator of sympathetic nerve activity Does this fast response help to maintain blood flow to the brain?

Hemorrhage 6
QCP Laboratory Manual
The medium-term compensation is renal salt and water retention. When does this have its maximum effect? Note that while blood volume is quickly restored, red cell volume is not. Keep an eye on hematocrit. The long-term compensation is replacement of the lost erythrocytes. Track erythropoietin as a stimulus and red cell volume as the response.
Blood Volume (mL) Red Cell Volume (mL) Plasma Volume (mL) Hematocrit (%)
Arterial Pressure (mmHg)
Cardiac Output (mL/Min) Heart Rate (/Min) Stroke Volume (mL)
Sympathetic Nerve Activity
Plasma Renin Activity
Na+ Excretion (mEq/Min)
Erythropoietin
Brain Blood Flow (mL/Min)

Hemorrhage 7
QCP Laboratory Manual
Time 0 Min
10 Min
1 Hour
1 Day
1 Month
Blood Volume
Red Cell Volume
Plasma Volume
Hematocrit
Arterial Pressure
Cardiac Output
Heart Rate
Stroke Volume
Sympathetic Nerve Act.
Plasma Renin Act.
Na+ Excretion
Erythropoietin
Brain Blood Flow
References
Adamson, J. and R. S. Hillman. Blood volume and plasma protein replacement following acute blood loss in normal man. J. Amer. Med. Assn. 205:609-612, 1968.

Hemorrhage 8
QCP Laboratory Manual
Barcroft, H., O. G. Edholm, J. McMichael and E. P. Sharpy-Schafer. Posthaemorrhagic fainting. Study by cardiac output and forearm flow. Lancet 1:489-491, 1944. Brough, R. B., Jr., A. W. Cowley, Jr. and A. C. Guyton. Quantitative analysis of the acute response to haemorrhage of the renin-angiotensin-vasoconstrictor feedback loop in areflexic dogs. Cardiovas. Res. 9:722-733, 1975. DuCharme, D. W. and L. Beck. The relative effect of the renal pressor and sympathetic nervous systems on vascular capacity during hypotension. J. Pharmacol. Exp. Ther. 177:56-68, 1971. Ebert, R. V., E. A. Stead, Jr. and J. G. Gibson, II. Response of normal subjects to acute blood loss. Arch. Int. Med. 68:578-590, 1941. Kaihara, S., R. B. Rutherford, E. P. Schwentker and H. N. Wagner, Jr. Distribution of cardiac output in experimental hemorrhage in dogs. J. Appl. Physiol. 27:218-222, 1969.

QCP Laboratory Manual
A-V Fistula
Trauma may create a direct vascular connection between peripheral artery and vein. This is an arteriovenous or a-v fistula. An a-v fistula shunts oxygenated arterial blood directly to the venous circulation. Fistula flow produces no metabolic benefit. In fact, the flow supporting metabolism may fall (shown below, data from Frank, Murphy).
Time (Min)
00 5
100
150
FlowBlood
(% Control)50
Fistula Flow
Metabolic Flow
Cardiac Output
The immediate effect of opening an a-v fistula is that arterial conductance increases and, consequently, cardiac output increases. Arterial pressure falls. A reflex increase in sympathetic outflow gives cardiac output and arterial pressure a boost (shown below, data from Dobbs).

A-V Fistula
QCP Laboratory Manual
Time (Min)
00 6
100
150
PressureArterial
(mmHg) 50
Areflexic
Intact
FistualOpen
The A-V Fistula Protocol Click Restart to reestablish initial conditions and then
collect control data. Go to Conductance. Scroll down to the a-v fistula box. Slide the size slidebar over to moderate. Advance the solution 10 minutes
Arterial Pressure (mmHg)
Cardiac Output (mL/Min) Heart Rate (/Min) Stroke Volume (mL) Fistula Flow (mL/Min)
Brain Blood Flow (mL/Min)
G.I. Tract Blood Flow (mL/Min)
Kidney Blood Flow (mL/Min)
Skeletal Muscle Blood Flow (mL/Min)
Sympathetic Nerve Activity

A-V Fistula
QCP Laboratory Manual
Plasma Renin Activity
Na+ Excretion (mEq/Min)
Erythropoietin
Blood Volume (mL) Red Cell Volume (mL) Plasma Volume (mL) Hematocrit (%)

A-V Fistula
QCP Laboratory Manual
Time 0 Min
10 Min
1 Day
1 Week
1 Month
Arterial Pressure
Cardiac Output
Heart Rate
Stroke Volume
Fistula Flow
Brain Blood Flow
G.I. Blood Flow
Kidney Blood Flow
Muscle Blood Flow
Symp. Nerves
Plasma Renin
Na+ Excretion
Erythropoietin
Blood Volume
Red Cell Volume
Plasma Volume
Hematocrit
Use an exercise stress test to characterize cardiac function at 1 week.
Treadmill Speed (MPH) Treadmill Grade (%)
Heart Rate (/Min)

A-V Fistula
QCP Laboratory Manual
Time 0’ 1’ 2’ 3’ 4’ 5’
Speed 0 6 6 6 6 6
Grade 0% 0% 2% 4% 6% 8%
Heart Rate
Record the elapsed time and distance when this subject finally gives up. Elapsed Time (Min)
Distance Traveled (Ft)
A-V Fistula And Venous O2 Content
In suspected A-V fistula, a useful clinical finding is mixed venous O2 saturation. Saturation is elevated in proportion to the severity of the fistula, due to shunting of oxygen-rich arterial blood.
Fistula Size Venous O2 Sat (%)
Venous [O2]
None
Small
Moderate
Large
Extreme
Optional Use arterial and venous O2 content and an assumption about metabolic flow to calculate A-V fistula flow. Compare the result to actual fistula flow.

A-V Fistula
QCP Laboratory Manual
References
Dobbs, W. A., Jr., J. W. Prather, & A. C. Guyton. Relative importance of nervous control of cardiac output and arterial pressure. Amer. J. Card. 27:507-512, 1971. Frank, C. W., H.-H. Wang, J. Lammerant, R. Miller, & R. Wégria. An experimental study of the immediate hemodynamic adjustments to acute arteriovenous fistulae of various sizes. J. Clin. Invest. 34:722-731, 1955. Murphy, Q. R., Jr., K. S. Gullixson, C. H. Kratochvil, & J. Simoes e Silva, Jr. Circulatory and renal adjustments to acute femoral arteriovenous fistulas. Circ. Res. 6:710-714, 1958.

QCP Laboratory Manual
Cardiac Output via Fick’s Principle
Fick’s principle has been stated in various ways. The paraphrase used here is: At steady-state, the rate of flow of a material into a compartment is equal to the rate of flow out of the compartment.
Flow * [Cin] Flow * [Cout]
Uptake
In this exercise, we’ll calculate cardiac output using the rate of flow of oxygen into and out of the lungs. Oxygen inflow (O2 Inflow) into the lungs is equal to the cardiac output (Flow) multiplied by the oxygen concentration in the pulmonary artery ([Cin]) plus the rate of oxygen uptake from the environment (Uptake). O2 Inflow = Flow * [Cin] + Uptake (1) Oxygen outflow from the lungs (O2 Outflow) is equal to the cardiac output (Flow) multiplied by the oxygen concentration in the pulmonary veins ([Cout]). O2 Outflow = Flow * [Cout] (2) We now assume oxygen outflow is equal to oxygen inflow. From equations (1) and (2) above, we get Flow * [Cout] = Flow * [Cin] + Uptake (3)

Cardiac Output via Fick’s Principle
QCP Laboratory Manual
We now rearrange equation (3) to solve for cardiac output (Flow). Flow = Uptake / ([Cin] - [Cout]) (4) Click Restart to reestablish initial conditions. Record oxygen concentration (content) in the pulmonary artery and veins and the oxygen uptake. Calculate cardiac output and compare to the actual cardiac output.
Pulmonary Artery [O2] (mL/mL) Pulmonary Vein [O2] (mL/mL)
O2 Uptake (mL/Min)
Cardiac Output (mL/Min))
Pulmonary Artery [O2]
Pulmonary Vein [O2]
O2 Uptake
Calculated Cardiac Output
Actual Cardiac Output
What is the error in calculated cardiac output when either of the 2 oxygen concentrations has a 10% error? What is the error in calculated cardiac output when oxygen uptake has a 10% error?
Questions For Discussion Can Fick’s principle be used to accurately calculate cardiac output during exercise?

Cardiac Output via Fick’s Principle
QCP Laboratory Manual
Where else in the body can Fick’s principle be put to good use?

QCP Laboratory Manual
Pulmonary Shunt
Proper oxygenation of blood in the lungs depends on having almost all of the pulmonary blood flow come in contact with well-ventilated alveoli. If blood shunts from pulmonary artery to pulmonary vein without contacting working alveoli, the blood in the peripheral circulation will subsequently not be fully oxygenated.
Pulmonary shunting, also called venous admixture, can be significant in some cardiovascular and respiratory diseases.
The Pulmonary Shunt Protocol Click Restart to reestablish initial conditions and then
record control data. Go to . Scroll down to the hemodynamics box and slide the basic shunt flow up to 2000. Advance the solution 10 minutes Acutely, focus on the ability of shunt to alter arterial pO2 and oxygen content.
Arterial pO2 (mmHg)

Pulmonary Shunt
QCP Laboratory Manual
Arterial [O2] (mL/mL) Venous pO2 (mmHg) Venous [O2] (mL/mL)
Arterial Pressure (mmHg)
Cardiac Output (mL/Min) Heart Rate (/Min) Stroke Volume (mL) Fistula Flow (mL/Min)
Sympathetic Nerve Activity
Plasma Renin Activity
Na+ Excretion (mEq/Min)
Erythropoietin
Blood Volume (mL) Red Cell Volume (mL) Plasma Volume (mL) Hematocrit (%)
Pulmonary Shunt
QCP Laboratory Manual
Time 0 Min
10 Min
1 Day
1 Month
Arterial pO2
Arterial [O2]
Venous pO2
Venous [O2]
Blood Pressure
Cardiac Output
Heart Rate
Stroke Volume
Symp. Nerves
Plasma Renin
Na+ Excretion
Erythropoietin
Blood Volume
Red Cell Volume
Plasma Volume
Hematocrit
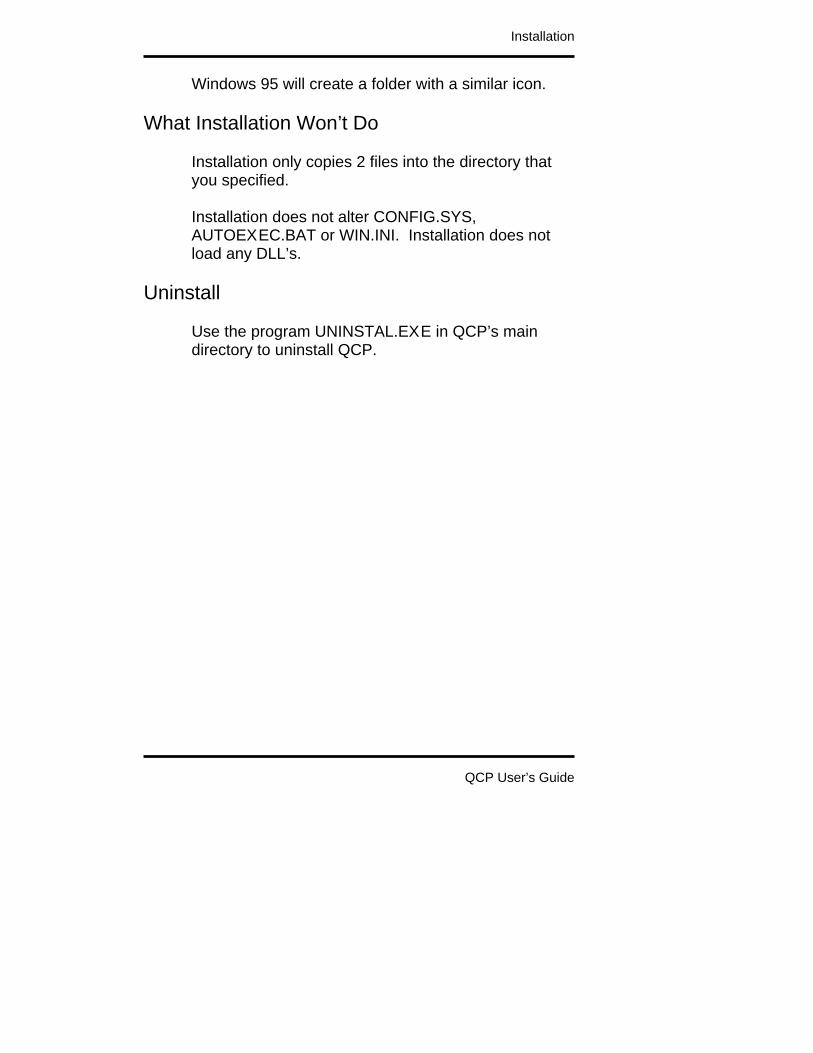
Use an exercise stress test to characterize cardiac function.
Treadmill Speed (MPH) Treadmill Grade (%)
Heart Rate (/Min)

Pulmonary Shunt
QCP Laboratory Manual
Time 0’ 1’ 2’ 3’ 4’ 5’
Speed 0 6 6 6 6 6
Grade 0% 0% 2% 4% 6% 8%
Heart Rate
Record the elapsed time and distance when this subject finally gives up. Elapsed Time (Min)
Distance Traveled (Ft)
Pulmonary Shunt And Arterial pO2
In this exercise, we’ll observe the effect of pulmonary shunt on arterial pO2 and [O2].
Pulmonary Shunt (mL/Min)
Arterial pO2 (mmHg) Arterial [O2] (mL/mL)
Shunt (mL/Min) 500 1000 1500 2000 2500 3000
Shunt (%CO)
Arterial [O2]
Arterial pO2
Art. pO2 (% Norm)
Plot arterial pO2 as a function of pulmonary shunt. Use percent of normal as units for pO2. Use percent of cardiac output as units for shunt.

Pulmonary Shunt
QCP Laboratory Manual
Pulmonary Shunt (% CO)
pO2(% Normal)
Arterial
100
00 100
Can arterial pO2 be used to predict the magnitude of pulmonary shunt?
Question For Discussion To distinguish between pulmonary shunting and diffusion block, a patient is given pure (100%) O2. What is the rationale for this test? Try it.

QCP Laboratory Manual
Respiratory Acidosis
Accumulation of carbon dioxide in the body lowers pH. This condition is called respiratory acidosis. In this exercise, we make the guy inhale some carbon dioxide and this leads to respiratory acidosis.
The Respiratory Acidosis Protocol Click Restart to reestablish initial conditions and record the control data.
Go to . Slide the inhaled CO2 concentration up to 5% and click the gas tanks switch on. Advance the solution and record pertinent data. Note the falling pH as CO2 accumulates. Note also that inhaled CO2 stimulates ventilation.
Use and to track CO2 and pH. Use to track ventilation.
Venous pCO2 (mmHg) Venous [H+] (nEq/L) Venous [HCO3-] (mEq/L) Venous pH Venous pO2 (mmHg)

Respiratory Acidosis
QCP Laboratory Manual
Time 0 Min 30 Min 60 Min
Venous pCO2
Venous [H+]
Venous [HCO3-]
Venous pH
Venous pO2
Plot venous pH as a function of venous pCO2 on the coordinates below.
Venous pH
Venous pCO2 (mmHg) You can use hyperventilation to create lower than
normal blood carbon dioxide levels. Go to and slide the basic respiratory drive in the respiratory center up to a higher value.
CO2 And Ventilation CO2 stimulates ventilation by way of changes in pH in the brain’s respiratory center.

Respiratory Acidosis
QCP Laboratory Manual
Normally, arterial pCO2 does not change a lot and the stimulatory effect of CO2 on ventilation remains hidden. In this exercise, we’ll observe the effect of arterial pCO2 on ventilation, using CO2 inhalation as a stimulus. Click Restart to reestablish initial conditions and record the control data.
Go to . Slide the inhaled CO2 concentration up to 2% and click the gas tanks switch on. Advance the solution for 30 minutes and record pertinent data. Repeat protocol at CO2 concentrations of 4%, 6% and 8%
Arterial pCO2 (mmHg) and pH
Total Ventilation (L/Min)
Inhaled CO2 (%) 0 2 4 6 8
Arterial pCO2
Arterial pH
Ventilation
Plot total ventilation as a function arterial pCO2 on the coordinates below.

Respiratory Acidosis
QCP Laboratory Manual
Arterial pCO2 (mmHg)
Ventilation(L/Min)
Total

QCP Laboratory Manual
Water Load
Water intake in excess of the body’s needs is readily excreted in the urine. Diuresis following a water load is caused by • Absorption of water into the blood from the gut.
Added water decreases plasma osmolarity.
• Decreased osmolarity inhibits antidiuretic hormone (ADH) release and lower ADH concentration causes the kidney to increase water excretion.
Water Absorption Is Quite Rapid
Water absorption from the gut is quite rapid following a 1L oral water load.
Urine Flow(mL/Min)
Osmolarity(mOsm/L)
0
10
Time (Min)
280
290
0 60 120 180 240
1000 mL H2O PO
Water Load
QCP Laboratory Manual
Absorption is nearly complete at about 60 minutes (data above from Baldes & Smirk, 1934; Findley & White,1937). A 1L oral water load will decrease plasma osmolarity about 10 mOsm/L with the nadir occurring at about 60 minutes.
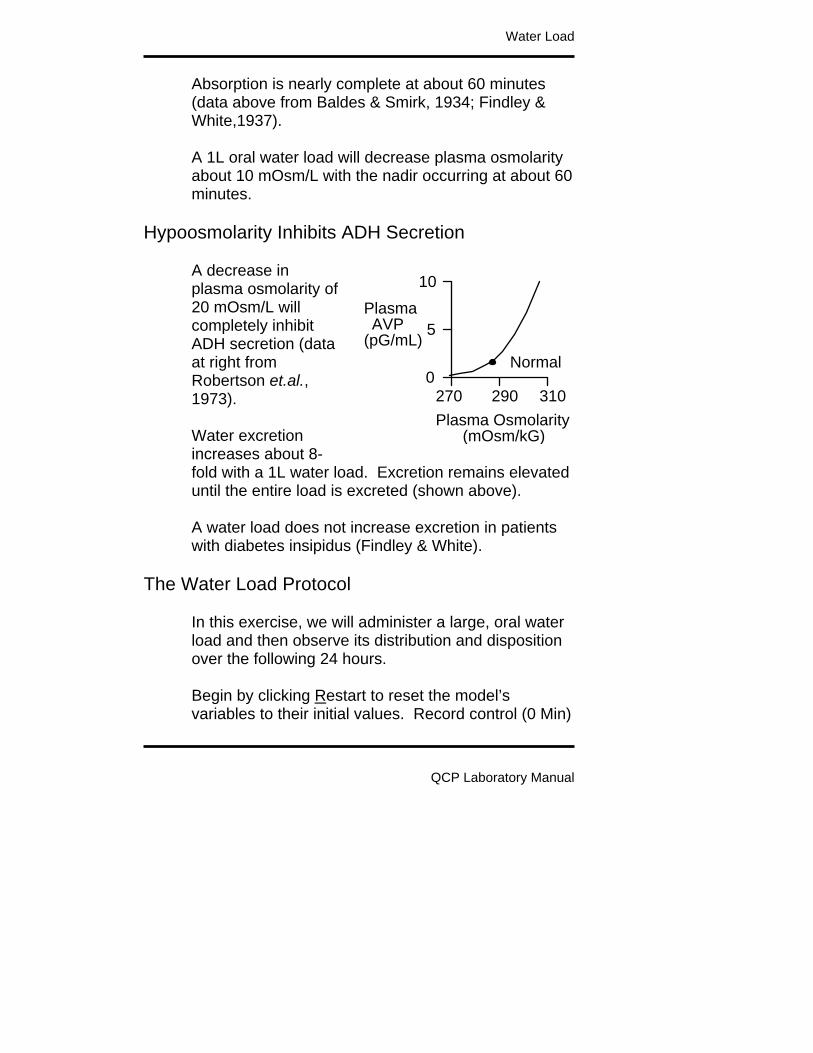
Hypoosmolarity Inhibits ADH Secretion A decrease in plasma osmolarity of 20 mOsm/L will completely inhibit ADH secretion (data at right from Robertson et.al., 1973). Water excretion increases about 8-fold with a 1L water load. Excretion remains elevated until the entire load is excreted (shown above). A water load does not increase excretion in patients with diabetes insipidus (Findley & White).
The Water Load Protocol In this exercise, we will administer a large, oral water load and then observe its distribution and disposition over the following 24 hours. Begin by clicking Restart to reset the model’s variables to their initial values. Record control (0 Min)
Plasma Osmolarity270 290 310
10
AVP(pG/mL)
5Plasma
(mOsm/kG)
Normal0

Water Load
QCP Laboratory Manual
data in the table below. Then click Misc. Treatments. In the oral water / glucose load box set the quantity to 1000 ml, the duration to 10 Min, and the glucose (%) to 0. Click the oral water / glucose load switch to on. Advance the solution and record data.
G.I. Lumen H2O Volume (mL)
Plasma Volume (mL) Plasma Osmolarity (mOsm/L) Interstitial Fluid Volume (L)
Plasma [ADH] (pG/mL)
Urine Flow (mL/Min) Urine Osmolarity (mOsm/L)
Time 0
Min 1 Hr
2 Hrs
3 Hrs
6 Hrs
1 Day
GI H2O Volume
Plasma Volume
Plasma Osm
IFV
Plasma [ADH]
Urine Flow
Urine Osm
Where does the water go as a function of time? Monitor water in the gut, plasma volume and urine formation.

Water Load
QCP Laboratory Manual
What factors control the synthesis and release of antidiuretic hormone?
Role Of Antidiuretic Hormone In Water Balance
In the exercise above changes in antidiuretic hormone concentration [ADH] appeared to be an important part of the response. We will investigate the importance of ADH more completely in this exercise by giving a water load with [ADH] clamped at its normal value. Begin again by clicking Restart to reset the model’s variables to their initial values. Record control (0 Min)
data in the table below. Click Antidiuretic Hormone. Turn the ADH secretion clamp on to clamp plasma [ADH] at its normal value.
Next click Misc. Treatments. In the oral water / glucose load box set the quantity to 1000 ml, the duration to 10 Min, and the glucose (%) to 0. Click the oral water / glucose load switch to on. Advance the solution and record data.
G.I. Lumen H2O Volume (mL)
Plasma Volume (mL) Plasma Osmolarity (mOsm/L) Interstitial Fluid Volume (L)
Plasma [ADH] (pG/mL)
Urine Flow (mL/Min) Urine Osmolarity (mOsm/L)

Water Load
QCP Laboratory Manual
Time 0 Min
1 Hr
2 Hrs
3 Hrs
6 Hrs
1 Day
GI H2O Volume
Plasma Volume
Plasma Osm
IFV
Plasma [ADH]
Urine Flow
Urine Osm
References
Baldes, E.J. and F.H. Smirk. The effect of water drinking, mineral starvation and salt administration on the total osmotic pressure of the blood in man, chiefly in relation to the problems of water absorption and water diuresis. J.Physiol. 82:62-74, 1934. Findley, T., Jr. and H.L. White. The response of normal individuals and patients with diabetes insipidus to the ingestion of water. J.Clin.Invest. 16:197-202, 1937. Robertson, G. L., E. H. Mahr, S. Athar and T. Sinha. Development and clinical application of a new method of radioimmunoassay of arginine vasopressin in human plasma. J. Clin. Invest. 52:2340-2352, 1973.

Starvation
This exercise investigates the metabolic response to complete cessation of caloric intake. If the metabolic substrate is not coming from food intake, where is it coming from? We need to keep an eye on these sources of fuel:
Metabolism / Liver Glycogen
Body Composition / Adipose Tissue Lipids
Cell Composition / Cell Protein We can arbitrarily divide the body’s response into acute (a few hours), intermediate (a few days), and long-term (a few weeks) responses.
The Starvation Protocol Begin by clicking Restart to reset the model’s variables to their initial values. Record control values.
Click and set carbos, fat and protein intake to 0. Advance the solution and record the data.
QCP Laboratory Manual
Liver Glycogen Mass (G)
Adipose Lipid Mass (G)
Cell Protein Mass (G)
Plasma [Ketoacids] (mG/dL) Plasma [Glucose] (mG/dL)
Brain Ketoacid Use (mG/Min) Brain Glucose Use (mG/Min)

Starvation
QCP Laboratory Manual
Skeletal Muscle Glucose Use (mG/Min) Skeletal Muscle FFA Use (mG/Min)
Plasma [Insulin] (uU/mL) Plasma [Glucagon] (pG/mL)
Time 0 6
Hrs1
Day 2
Days 1
Wk 2
Wks3
Wks Liver Glycogen
Adipose Lipid
Cell Protein
Plasma [KA]
Plasma [Glu]
Brain KA Use
Brain Glu Use
Musc. Glu Use
Musc. FFA Use
[Insulin]
[Glucagon]

QCP Laboratory Manual
Baroreceptor Reflex
The baroreceptor reflex stabilizes arterial pressure. Stability helps to provide uninterrupted flow to vital organs. The strength of the reflex can be studied by altering baroreceptor perfusion pressure and then noting the subsequent effect on arterial pressure (show below, data from Angel-James & Daly). A decrease in carotid perfusion pressure causes an increase in systemic arterial pressure, a relationship that helps to stabilize arterial pressure.
Arterial
0
100Pressure(mmHg)
Carotid Pressure (mmHg)0 100 200
200
Normal
Pressure in the carotid arteries stimulates the baroreceptors. This stimulation, via the central nervous system, changes autonomic outflow. The efferent pathways of the baroreceptor reflex innervate the heart, systemic arteries and systemic veins. Changes in heart rate, cardiac contractility, arterial conductance and venous unstressed volume all help to determine arterial pressure. But carotid artery pressure is equal to systemic artery pressure, closing the baroreceptor reflex loop.

Baroreceptor Reflex
QCP Laboratory Manual
Heart RateContractility
VenousUnstressedVolume
ArterialConductance
Heart
Veins
Arteries
}
Arterial Pressure
CNS
In this exercise, we’ll replicate the classical protocol while also following the details of the response to carotid pressure changes.
The Baroreceptor Reflex Protocol Click Restart to reestablish initial conditions.
Go to Autonomic Afferents. Slide carotid perfusion pressure up to 60 mmHg and click the carotid perfusion pump switch to on. Advance the solution for 1 minute and record the appropriate neural and hemodynamic data in the table below. Repeat for carotid perfusion pressures of 80, 100, 120 and 140 mmHg.
Carotid Pressure (mmHg) Autonomic Firing Vagal Firing
Heart Rate (/Min)

Baroreceptor Reflex
QCP Laboratory Manual
Stroke Volume (mL) Cardiac Output (mL/Min) Total Peripheral Resistance
(mmHg/(mL/Min)) Arterial Pressure (mmHg)
Carotid Pressure 60 80 100 120 140
Autonomic Firing
Vagal Firing
Heart Rate
Stroke Volume
Cardiac Output
TPR
Arterial Pressure
Using the data collected above, plot arterial pressure as a function of carotid artery pressure.
ArterialPressure (mmHg)
Carotid Artery Pressure (mmHg) Note that this protocol measures the acute responses to carotid pressure change. Over the longer term,

Baroreceptor Reflex
QCP Laboratory Manual
what factors might modify the response? You can study this by restarting the solution, setting and turning on the carotid perfusion pump, and then advancing the solution for 30 minutes, 1 hour and longer.
References Angel-James, J. & M. de B. Daly. Comparison of reflex vasomotor responses to separate and combined stimulation of carotid sinus and aortic arch baroreceptors by pulsatile and non-pulsatile pressures in the dog. J. Physiol. 209:257-293, 1970.

QCP Laboratory Manual
Insulin Overdose
Elevated blood levels of insulin are appropriate when glucose is being absorbed from the gut. But when glucose is not being absorbed from the gut, elevated blood levels of insulin can, in fact, be fatal. We pay particular attention here to the brain’s fuel supply.
The Insulin Overdose Protocol Begin by clicking Restart to reset the model’s variables to their initial values. Advance the solution 1
hour and record control data. Go to Diet. Create a fasting state in the dietary goals box by sliding carbos, fat and protein goals down to 0. Advance the solution for 6 hours and record data for the fasting state. Now it is time for an insulin
injection. Go to Misc. Treatments. In the insulin injection box, set the dose (U) at 40 U and the duration of action at normal (4 Hrs). To inject the insulin, click the Inject Insulin Now button. The total injections count should now be 1. Advance the solution 10 minutes at a time, recording data at the end of each time period.
Plasma Insulin] (uU/mL) Plasma Glucagon (pG/mL)
Plasma Glucose (mG/dL)
Brain Glucose Use (mG/Min) Brain Ketoacids Use (mG/Min)
Blood Pressure (mmHg) Heart Rate (/ Min)

Insulin Overdose
QCP Laboratory Manual
Neurological Signs
Sympathetic Nerve Activity
Time 12:00 6:00 6:10 6:20 6:30 6:40 6:50
Plasma [Insulin]
Plasma [Glucagon]
Plasma [Glucose]
Brain Glucose Use
Brain KA Use
Blood Pressure
Heart Rate
Neurological Signs
Sympathetic Firing
Where is the glucose coming from and where is it going? Why is the brain not making better use of ketoacids? Demonstrate the proper clinical intervention in this case -- before it’s too late.

QCP Laboratory Manual
Renal Artery Stenosis
Partial obstruction of a renal artery -- renal artery stenosis -- produces hypertension. Clinically, the cause is often atherosclerosis or comparable forms of vascular damage. Experimentally, renal artery stenosis is produced by a clamp. Before the work of Harry Goldblatt, there was no reliable way to produce hypertension in experimental animals. Then Dr. Goldblatt demonstrated that partial constriction of the renal arteries produces a sustained blood pressure increase (shown below, data from Goldblatt) that is proportional to the severity of the constriction. This technique was then simplified to partial constriction of one renal artery with surgical removal of the other kidney.
Time (Days)
SystolicArterialPressure(mmHg)
250
200
150
100Clamp
-10 0 10 20
Clinically, hypertension due to renal artery stenosis is relatively rare and potentially very serious. It is often surgically correctable. Renal artery stenosis decreases pressure in the renal vasculature beyond the obstruction. Decreased pressure immediately decreases salt and water excretion. Renin secretion is stimulated. First

Renal Artery Stenosis
QCP Laboratory Manual
angiotensin II and then retained sodium work to elevate systemic arterial pressure. An increase in arterial pressure elevates renal artery pressure beyond the stenosis and sodium balance is reestablished. The price paid for reestablishing sodium balance is chronic arterial hypertension (shown below, data from Murphy).
Normal Renal ArteryStenosis
ArterialPressure(mmHg)
200
150
100
50
0
Renal ArteryPressure
SystemicPressure
The Renal Artery Stenosis Protocol Begin by clicking Restart to reset the model’s variables to their initial values. Record control data in
the table below. Then go to Circulation. Slide the renal artery stenosis slidebar over to severe and record data for the immediate response (0+). Advance time and record data as hypertension develops.
Arterial Pressure (mmHg)
Arcuate Artery Pressure (mmHg)
Plasma Renin Activity

Renal Artery Stenosis
QCP Laboratory Manual
Sympathetic Nerve Activity
Plasma Volume (mL) Extracellular Fluid Volume (L)
Na+ Excretion (mEq/Min)
Time 0
Min 0+ Min
1 Hr
1 Day
1 Week
Arterial Pressure
Arcuate Pressure
PRA
Sympathetics
Plasma Volume
ECFV
Na+ Excretion
References
Goldblatt, H., J. Lynch, R. F. Hanzal, & W. W. Summerville. Studies on experimental hypertension. I. The production of persistent elevation of systolic blood pressure by means of renal ischemia. J. Exp. Med. 59:347-379, 1934. Murphy, W. R., T. G. Coleman, T. L. Smith, & K. A. Stanek. Effects of graded renal artery constriction on blood pressure, renal artery pressure, and plasma renin activity in Goldblatt hypertension. Hypertension 6:68-74, 1984.

QCP Laboratory Manual
Heart Failure
Left-heart failure typically begins with a myocardial infarction. The infarction decreases both myocardial contractility and blood flow to the heart. Stroke volume is diminished and this causes decreases in cardiac output and arterial pressure. The immediate response to a left-side myocardial infarction is a shift in blood volume from the peripheral circulation to the pulmonary circulation. This shift increases left heart end-diastolic volume. Increased cardiac filling helps to offset impaired emptying. In addition to the volume shift, increased sympathetic outflow increases left-heart contractility (shown below, data from Griffiths, Cody).
0
2000
4000
Plasma[NE]
(pG/mL)
Normal Myocardial
Acute
Chronic
24 Hours
Infarction
The Heart Failure Protocol Click Restart to reestablish initial conditions and then
record the control data. Go to Left Heart. Scroll down to the myocardial infarction box. Slide the slidebar over to serious. Advance the solution 10 minutes.

Heart Failure
QCP Laboratory Manual
We are interested in the acute effect of the infarction on hemodynamics and the subsequent compensations that help to maintain oxygen delivery.
Arterial Pressure (mmHg)
Cardiac Output (mL/Min) Heart Rate (/Min) Stroke Volume (mL)
Left Ventricle EDV (mL) Left Ventricle EDP (mmHg) Ejection Fraction
Sympathetic Nerve Activity
Plasma Renin Activity
Na+ Excretion (mEq/Min)
Erythropoietin
Blood Volume (mL) Red Cell Volume (mL) Plasma Volume (mL) Hematocrit (%)

Heart Failure
QCP Laboratory Manual
Time 0 Min
10 Min
1 Day
1 Week
Arterial Pressure
Cardiac Output
Heart Rate
Stroke Volume
LV EDV
LV EDP
Ejection Fraction
Symp Nerves
Plasma Renin
Na+ Excretion
Erythropoietin
Blood Volume
Red Cell Volume
Plasma Volume
Hematocrit
Ejection Fraction
The heart’s ejection fraction is the ratio of stroke volume to end-diastolic volume. The normal ejection fraction is 0.60. Ejection fraction is a useful clinical finding, since it decreases in proportion to the severity of heart failure. Decreases are typically due to both decreasing stroke volume and increasing end-diastolic volume.

Heart Failure
QCP Laboratory Manual
Exercise Tolerance
Tolerance to exercise is decreased in heart failure (shown below, data from Wilson).
Ejection Fraction (%)
00
30
20Maximum
((mL/Min)/kG) 10
25 50
O2 Uptake
Use an exercise stress test to characterize QCP’s cardiac function at 7 days.
Treadmill Speed (MPH) Treadmill Grade (%)
Heart Rate (/Min)
Time 0’ 1’ 2’ 3’ 4’ 5’
Speed 0 6 6 6 6 6
Grade 0% 0% 2% 4% 6% 8%
Heart Rate
Record the elapsed time and distance when this subject finally gives up.

Heart Failure
QCP Laboratory Manual
Elapsed Time (Min)
Distance Traveled (Ft)
References
Cody, R. J., K. W. Franklin, J. Kluger, & J. H. Laragh. Sympathetic responsiveness and plasma norepinephrine during therapy of chronic congestive heart failure with captopril. Amer. J. Med. 72:791-797, 1982. Griffiths, J. & F. Leung. The sequential estimation of plasma catecholamines and whole blood histamine in myocardial infarction. Amer. Heart J. 82:171-179, 1971. Wilson, J. R., J. L. Martin, D. Schwartz, & N. Ferraro. Exercise intolerance in patients with chronic heart failure. Role of impaired nutritive flow to skeletal muscle. Circulation 69:1079-1087, 1984.

QCP Laboratory Manual
High Altitude
The partial pressure of inspired oxygen decreases with increasing altitude. This causes a decrease in oxygen saturation in the arterial blood and impairs oxygen delivery to the tissues. Record barometric pressure and inspired pO2 as altitude is increased from sea level to 25,000 feet in 5000 foot increments.
Altitude (Feet) Barometric Pressure (mmHg)
Inspired pO2 (mmHg)
Altitude 0 5000 10000 15000 20000 25000Baro. Pressure Inspired pO2
Ventilation At High Altitude
An important part of the acute response to high altitude is increased ventilation (shown below, data from Huston, Pugh). Other important parts of the acute response to high altitude are vasodilation of hypoxic tissues and increased cardiac output supported in part by increased sympathetic outflow.
30,000'
20,000'
10,000'
0'
Mt. Everest
Mt. McKinleyPikes Peak
Mexico CityDenverSea Level

High Altitude
QCP Laboratory Manual
Altitude (Feet)
00 20000
30
20Ventilation(L/Min)
10
10000
Blood Volume At High Altitude
An important part of the chronic response to high altitude is increased erythropoiesis, leading to increased red cell volume and hematocrit (shown below, data from Rotta). The positive part of this response is that the blood's oxygen carrying capacity is increased. The negative part is that blood viscosity is increased.
HemoglobinBlood Volume(G/dL)(mL/kG)
60
80
100
10
15
20
SeaLevel
14,900' 14,900'
SeaLevel
The High Altitude Protocol

High Altitude
QCP Laboratory Manual
Click Restart to reestablish initial conditions. Go to
. In the Altitude box slide the Feet slidebar up to 10,000. Advance the solution 10 minutes. Acutely, focus on effect of altitude on oxygen’s partial pressure and the ability of the body to load arterial hemoglobin. Chronically, focus on compensations that alter the body’s ability to deliver oxygen to the tissues.
Arterial pO2 (mmHg) Arterial [O2] (mL/mL) Venous pO2 (mmHg) Venous [O2] (mL/mL) Arterial pCO2 (mmHg) Venous pH
Cardiac Output (mL/Min) Heart Rate (/Min) Stroke Volume (mL)
Sympathetic Nerve Activity
Plasma Renin Activity
Na+ Excretion (mEq/Min)
Erythropoietin
Blood Volume (mL) Red Cell Volume (mL) Plasma Volume (mL) Hematocrit (%)
Oxygen Uptake (mL/Min)

High Altitude
QCP Laboratory Manual
Time 0 Min
10 Min
1 Day
1 Month
Arterial pO2
Arterial [O2]
Venous pO2
Venous [O2]
Arterial pCO2
Venous pH
Cardiac Output
Heart Rate
Stroke Volume
Symp Nerves
Plasma Renin
Na+ Excretion
Erythropoietin
Blood Volume
Red Cell Volume
Plasma Volume
Hematocrit
Oxygen Uptake
Use an exercise stress test to characterize cardiac function.
Treadmill Speed (MPH) Treadmill Grade (%)

High Altitude
QCP Laboratory Manual
Heart Rate (/Min)
Time 0’ 1’ 2’ 3’ 4’ 5’
Speed 0 6 6 6 6 6
Grade 0% 0% 2% 4% 6% 8%
Heart Rate
Record the elapsed time and distance when this subject finally gives up. Elapsed Time (Min)
Distance Traveled (Ft)
Discussion Question
What is the cardiovascular and respiratory response to loss of cabin pressure in an aircraft flying at 30,000 feet?
References Houston, C. S. & R. L. Riley. Respiratory and circulatory changes during acclimatization to high altitude. Amer. J. Physiol. 149:565-588, 1947. Pugh, L. G. C. E. Resting ventilation and alveolar air on Mount Everest: With remarks on the relation of barometric pressure to altitude in mountains. J. Physiol. 135:590-610, 1957.

High Altitude
QCP Laboratory Manual
Rotta, A., A. Cánepa, A. Hurtado, T. Velásquez, & R. Chávez. Pulmonary circulation at sea level and at high altitude. J. Appl. Physiol. 9:328-336, 1956.

QCP Laboratory Manual
Changes In Salt Intake
We now normally consume a sodium-rich diet, but historically sodium has not always been abundant in the diet. When dietary sodium intake is decreased, excretion initially exceeds intake; extracellular sodium and plasma volume decrease. Then, plasma angiotensin II concentration increases and sodium excretion falls to a level that matches intake. Sodium balance is reestablished. The timecourse of this transition is shown below (data from Epstein).
Sodium
0
100
Excretion(% of Control)
Time (Days)2 4
50
0Low Sodium Diet
The Changes In Salt Intake Protocol
We will give QCP normal, low and high-salt diets in this exercise and follow the mechanisms involved in adjusting renal sodium excretion. Begin by clicking Restart to reset the model’s variables to their initial values. The normal sodium intake is 180 mEq/Day. Advance the solution for 1 week and record normal values in the table below.

Changes In Salt Intake
QCP Laboratory Manual
Next we will study a low-salt diet. Click Restart again.
Click Diet. Slide Na+ intake down to 20 mEq/Day and Cl- intake down to 40 mEq/Day. Advance the solution for 1 week and record values below.
The final diet is high salt. Click Restart. Click Diet. Slide Na+ and Cl- intake up to 500 mEq/Day. Advance the solution for 1 week and record values below.
Arterial Pressure (mmHg) Right Atrial Pressure (mmHg) Left Atrial Pressure (mmHg)
Plasma [AII] (pG/mL) Plasma [Aldosterone] (pMol/L) Plasma [ANP] (pMol/L)
Na+ Excretion (mEq/Min)
Sodium Intake 20 180 500
Arterial Pressure
Right Atrial Pressure
Left Atrial Pressure
Plasma [AII]
Plasma [Aldosterone]
Plasma [ANP]
Urine Na+ Excretion

Changes In Salt Intake
QCP Laboratory Manual
Compare the changes in plasma [AII], [Aldosterone] and [Atrial Natriuretic Peptide]. Why are changes in [ANP] relatively small during changes in salt intake?
Importance Of Angiotensin In Sodium Balance The increase in plasma angiotensin concentration during sodium deprivation has two positive effects:
� • It helps the kidney to reabsorb sodium.
• It supports arterial pressure in the face of decreased blood volume.
The blood pressure response to blocking AII formation while on a low-salt diet is shown below (data from Hall).
Arterial
50
100
Pressure(mmHg)
Time (Days)-2 0 2 4
75
Angiotensin IIblocked
We will now explore the importance of the renin-angiotensin-aldosterone system in the regulation of arterial pressure and body fluid volumes. We will repeat the 3 simulations described above, but in each case formation of angiotensin will be blocked. In each
case, Click Restart. Click Blocker. Slide angiotensin converting enzyme inhibition to 100%.

Changes In Salt Intake
QCP Laboratory Manual
Click Diet. Set the Na+ and Cl- intake as described above. Advance the solution for 1 week and record the data in the table below.
Arterial Pressure (mmHg) Right Atrial Pressure (mmHg) Left Atrial Pressure (mmHg)
Plasma [AII] (pG/mL) Plasma [Aldosterone] (pMol/L) Plasma [ANP] (pMol/L)
Na+ Excretion (mEq/Min)
Sodium Intake 20 180 500
Arterial Pressure
Right Atrial Pressure
Left Atrial Pressure
Plasma [AII]
Plasma [Aldosterone]
Plasma [ANP]
Urine Na+ Excretion
Long-Term Pressure Natriuresis Curve
Plot sodium excretion as a function of arterial pressure on the coordinates below for (a) the normal case, and (b) with AII formation blocked.

Changes In Salt Intake
QCP Laboratory Manual
Sodium Excretion (mEq/Min)
Arterial Pressure (mmHg) Under normal conditions, is arterial pressure salt sensitive? Why?
References Epstein, M. & N. K. Hollenberg. Age as a determinant of renal sodium conservation in normal man. J. Lab. Clin. Med. 87:411-417, 1976. Hall, J. E., A. C. Guyton, M. J. Smith, Jr., & T. G. Coleman. Chronic blockade of angiotensin II formation during sodium deprivation. Amer. J. Physiol. 237:F424-F432, 1979.

QCP Laboratory Manual
Aldosterone And Sodium Escape
Aldosterone increases sodium reabsorption and potassium secretion. However, during chronic aldosterone excess, such as in primary aldosteronism, sodium balance is achieved. Achieving this balance is known as sodium escape. There has been considerable interest in the mechanisms which account for sodium escape. In this exercise, we will simulate primary aldosteronism and then observe the factors which control sodium excretion.
The Aldosterone And Sodium Escape Protocol Begin by clicking Restart to reset the model’s variables to their initial values. Record the control
(Day 0) data in the table below. Click Aldosterone. Slide the basic aldosterone formation rate down to 0. Slide the aldosterone pump rate up to 2000 and click the aldosterone pump switch to on. Advance the solution and record data in table below.
On Day 10, increase the Na+ and Cl- intake (at ) from normal to 500 mEq/Day. Advance the solution for 1 more week and record the Day 17 data.
Arterial Pressure (mmHg) Right Atrial Pressure (mmHg) Left Atrial Pressure (mmHg)

Aldosterone And Sodium Escape
QCP Laboratory Manual
Plasma [AII] (pG/mL) Plasma [Aldosterone] (pMol/L) Plasma [ANP] (pMol/L) Plasma [Na+] (mEq/L) Plasma [K+] (mEq/L)
Glomerular Filtration Rate (mL/Min) Proximal Na+ Inflow (mEq/Min) Proximal Na+ Reabsorption (mEq/Min) Distal Na+ Inflow (mEq/Min) Distal Na+ Reabsorption (mEq/Min) Collecting Duct Na+ Inflow (mEq/Min) Collecting Duct Na+ Reabsorption
(mEq/Min) Na+ Excretion (mEq/Min)
Plasma Volume (mL) ECFV (L) Ascites (mL)
Aldosterone And Sodium Escape
QCP Laboratory Manual
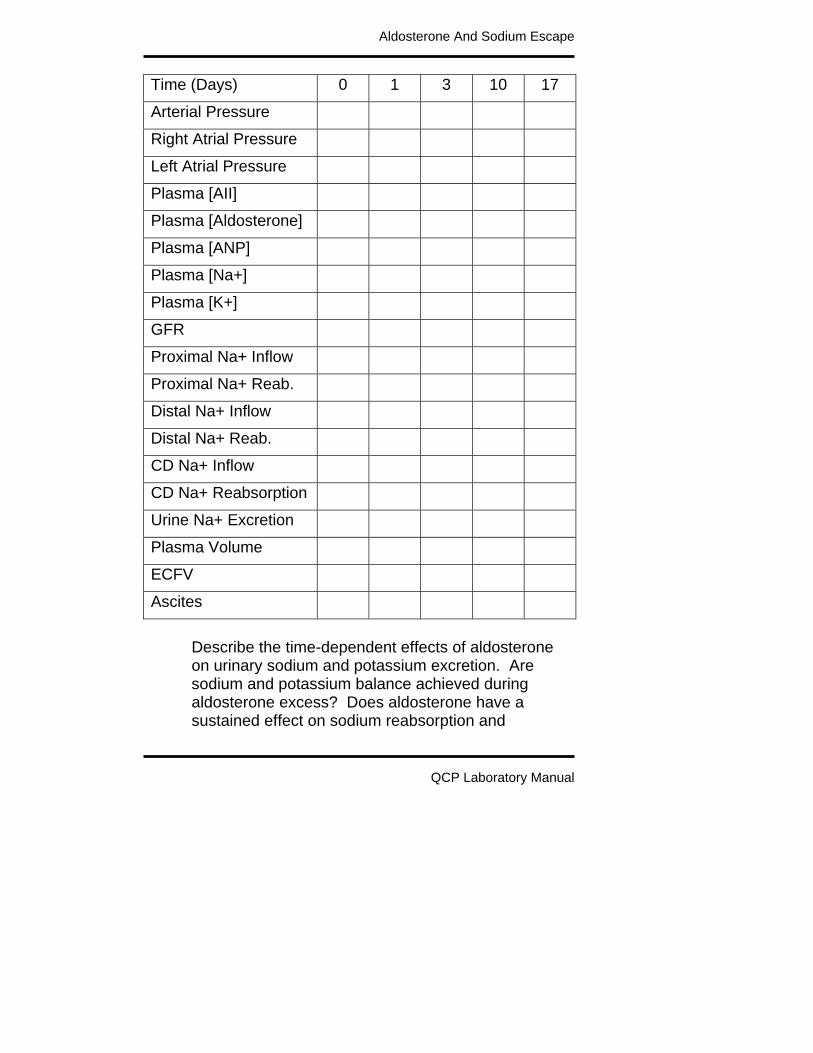
Time (Days) 0 1 3 10 17
Arterial Pressure
Right Atrial Pressure
Left Atrial Pressure
Plasma [AII]
Plasma [Aldosterone]
Plasma [ANP]
Plasma [Na+]
Plasma [K+]
GFR
Proximal Na+ Inflow
Proximal Na+ Reab.
Distal Na+ Inflow
Distal Na+ Reab.
CD Na+ Inflow
CD Na+ Reabsorption
Urine Na+ Excretion
Plasma Volume
ECFV
Ascites
Describe the time-dependent effects of aldosterone on urinary sodium and potassium excretion. Are sodium and potassium balance achieved during aldosterone excess? Does aldosterone have a sustained effect on sodium reabsorption and
Aldosterone And Sodium Escape
QCP Laboratory Manual
potassium secretion in the distal nephron? Does edema occur during primary aldosteronism? Is aldosterone hypertension salt-sensitive? How does increased salt intake affect plasma potassium concentration in primary aldosteronism? When Sodium Escape Does Not Occur In states of secondary aldosteronism, such as congestive heart failure, sodium escape may not occur. In this exercise, we will investigate the role of renal perfusion pressure in sodium escape. We will repeat the protocol given above with renal perfusion pressure clamped at a normal value. Begin again by clicking Restart to reset the model’s variables to their initial values. Record the control
(Day 0) data in the table below. Click Circulation. At the perfusion pump, slide perfusion pressure up to 96 and click the perfusion pump switch
to on. Click Aldosterone. Slide the basic aldosterone formation rate down to 0. Slide the aldosterone pump rate up to 2000 and click the aldosterone pump switch to on. Advance the solution and record data in table below. Stop at Day 10 (see below).
Arterial Pressure (mmHg) Right Atrial Pressure (mmHg) Left Atrial Pressure (mmHg)
Plasma [AII] (pG/mL) Plasma [Aldosterone] (pMol/L) Plasma [ANP] (pMol/L) Plasma [Na+] (mEq/L)

Aldosterone And Sodium Escape
QCP Laboratory Manual
Plasma [K+] (mEq/L)
Glomerular Filtration Rate (mL/Min) Proximal Na+ Inflow (mEq/Min) Proximal Na+ Reabsorption (mEq/Min) Distal Na+ Inflow (mEq/Min) Distal Na+ Reabsorption (mEq/Min) Collecting Duct Na+ Inflow (mEq/Min) Collecting Duct Na+ Reabsorption
(mEq/Min) Na+ Excretion (mEq/Min)
Plasma Volume (mL) ECFV (L) Ascites (mL)

Aldosterone And Sodium Escape
QCP Laboratory Manual
Time (Days) 0 1 3 10 17
Arterial Pressure
Right Atrial Pressure
Left Atrial Pressure
Plasma [AII]
Plasma [Aldosterone]
Plasma [ANP]
Plasma [Na+]
Plasma [K+]
GFR
Proximal Na+ Inflow
Proximal Na+ Reab.
Distal Na+ Inflow
Distal Na+ Reab.
CD Na+ Inflow
CD Na+ Reabsorption
Urine Na+ Excretion
Plasma Volume
ECFV
Ascites
Does sodium escape occur? Why? Is edema present?

Aldosterone And Sodium Escape
QCP Laboratory Manual
As before, on Day 10 increase the Na+ and Cl- intake
(at ) from normal to 500 mEq/Day. Advance the solution 1 more week and record the Day 17 data.

QCP Laboratory Manual
A Normal Meal
A normal meal consists of carbohydrate, fat and protein. In this exercise, we want to see where these fuels go after ingestion. We want to identify the hormonal controls that are involved. Keep an eye on the contents of the gut, plasma insulin and glucagon concentrations, liver metabolic activity and fuel use by the brain and skeletal muscle.
The Normal Meal Protocol Begin by clicking Restart to reset the model’s variables to their initial values. Record control values.
Then go to Diet and change the food and water schedule from continuous to at mealtime.
Go to GI Tract - Lumen to monitor changes in the contents of the gut. The first meal is breakfast, scheduled for 7:00 AM. Advance the solution for 7 (6 + 1) hours. The guy’s been sleeping. The clock should display 7:00 AM. Record fasting data. It’s time for breakfast. Advance the solution to the times shown in the table below and record data.
G.I. Tract Glucose Mass (G) G.I. Tract Fat Mass (G) G.I. Tract Protein Mass (G)
Plasma [Glucose] (mG/dL) Tissue Glucose Use (mG/Min) Brain Glucose Use (mG/Min) Fat Glucose Use (mG/Min) Skeletal Muscle Glucose Use (mG/Min)

A Normal Meal 2
QCP Laboratory Manual
Plasma Free Fatty Acid (mG/dL) Tissue FFA Use (mG/Min) Skeletal Muscle FFA Use (mG/Min) Plasma [Triglycerides] (mG/dL) Fat Triglyceride Uptake (mG/Min) Liver Glycogen Mass (G)
Plasma [Insulin] (uU/mL) Plasma [Glucagon] (pG/mL)
Time 12:00 7:00 7:10 7:20 7:30 8:00 9:00
Glucose Mass
Fat Mass
Protein Mass
Plasma [Glu]
Tissue Glu Use
Brain Glu Use
Fat Glu Use
Muscle Glu Use
Plasma [FFA}
Tissue FFA Use
Muscle FFA Use
Plasma [Trigly.]
Fat Trigly. Uptake
Liver Glycogen
Plasma [Insulin]
Plasma [Glucagon]

QCP Laboratory Manual
Diabetes Mellitus
When glucose is being absorbed, increased blood levels of insulin are beneficial. This insulin facilitates glucose uptake by the tissues and helps to replenish the glycogen stores of liver and skeletal muscle. In diabetes mellitus, the beta cells of the pancreas do not secrete adequate amounts of insulin when it is needed. Need is most evident following a carbohydrate-rich meal. In this exercise, we’ll first stop insulin production and then view the consequences of eating a meal in a repeat of the eating exercise presented in another lab.
The Diabetes Mellitus Protocol Begin by clicking Restart to reset the model’s variables to their initial values. Record control data.
Go to Pancreas - Beta Cells. Set insulin synthesis basic rate and insulin secretion basic fraction to 0.
Go to Diet and change the food and water schedule from continuous to at mealtime. Keep an eye on the contents of the gut, plasma glucagon concentration, liver metabolic activity and fuel use by the brain and skeletal muscle. Plasma insulin should be 0 throughout.

Diabetes Mellitus
QCP Laboratory Manual
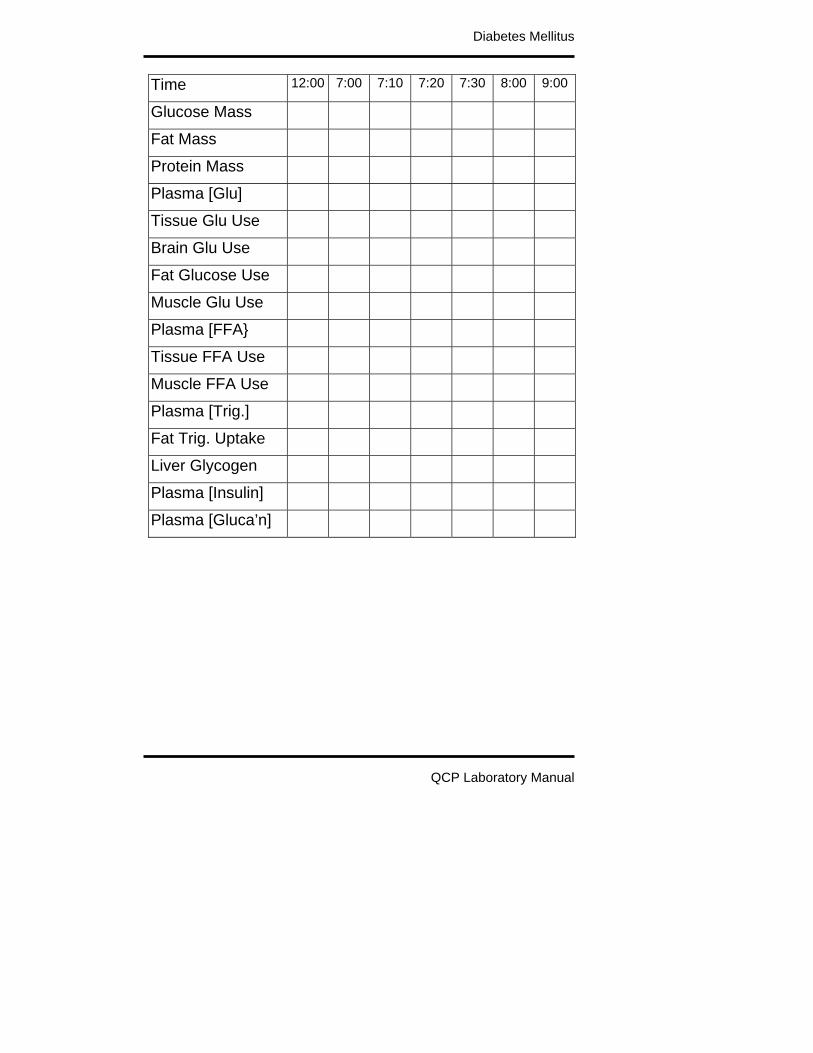
Go to GI Tract - Lumen to monitor changes in the contents of the gut. The first meal is breakfast, scheduled for 7:00 AM. Advance the solution for 7 (6 + 1) hours. The guy’s been sleeping. The clock should display 7:00 AM. Record fasting data. It’s time for breakfast. Advance the solution to the times shown below and record data.
G.I. Tract Glucose Mass (G) G.I. Tract Fat Mass (G) G.I. Tract Protein Mass (G)
Plasma [Glucose] (mG/dL) Brain Glucose Use (mG/Min) Fat Glucose Use (mG/Min) Muscle Glucose Use (mG/Min) Plasma [FFA] (mG/dL) Tissue FFA Use (mG/Min) Muscle FFA Use (mG/Min) Plasma [Triglycerides] (mG/dL) Fat Triglyceride Uptake (mG/Min Liver Glycogen Mass (G)
Plasma [Insulin] (uU/mL) Plasma [Glucagon] (pG/mL)
Diabetes Mellitus
QCP Laboratory Manual
Time 12:00 7:00 7:10 7:20 7:30 8:00 9:00
Glucose Mass
Fat Mass
Protein Mass
Plasma [Glu]
Tissue Glu Use
Brain Glu Use
Fat Glucose Use
Muscle Glu Use
Plasma [FFA}
Tissue FFA Use
Muscle FFA Use
Plasma [Trig.]
Fat Trig. Uptake
Liver Glycogen
Plasma [Insulin]
Plasma [Gluca’n]

QCP Laboratory Manual
Pericardial Hemorrhage
An unspecified amount of bleeding and severe hypotension usually suggests hypovolemic shock, but that is not always the case. This exercise is taken from a case developed by R. Summers (1996). Quoting Dr. Summers
A 23 year old man arrived by ambulance after gunshot wounds to the neck and chest. The patient presented awake, confused and combative, with a heart rate of 120 beats/min, a respiratory rate of 20 breaths/min, and no audible blood pressure.
This patient was severely hypotensive but did not respond to aggressive fluid therapy. Finally, cardiac ultrasound revealed pericardial hemorrhage, presumably caused by a bullet or fragment. A pericardial drain was inserted and the man made a satisfactory recovery.
The Pericardial Hemorrhage Protocol We’ll now recreate the clinical setting. Click Restart to reestablish initial conditions and then record the
control data. Go to Pericardium. Slide the pericardial hemorrhage slidebar over to extreme. Click the pericardial hemorrhage switch to on. Advance the solution 10 minutes at a time to 30 minutes, collecting data every 10 minutes.

Pericardial Hemorrhage
QCP Laboratory Manual
We are interested in the acute effect of the hemorrhage on hemodynamics and the subsequent compensations that help to maintain oxygen delivery.
Pericardial Volume (mL)
Arterial Pressure (mmHg)
Cardiac Output (mL/Min) Heart Rate (/Min) Stroke Volume (mL)
Left Ventricle EDV (mL) Left Ventricle EDP (mmHg)
Sympathetic Nerve Activity
Plasma Renin Activity
Time 0
Min 10 Min
20 Min
30 Min
1 Hour
Pericard. Volume
Arterial Pressure
Cardiac Output
Heart Rate
Stroke Volume
LV EDV
LV EDP
Symp Nerves
Plasma Renin
Pericardial Hemorrhage
QCP Laboratory Manual
Wrapup You can advance time to 1 hour to gauge the severity
of the situation. Then go to Misc. Treatments or
Pericardium and install a pericardial drain.
Supporting Evidence Several experimental studies provide data that is consistent with this simulation. These data are typically collected from canine protocols. Pericardial hemorrhage is simulated using saline or air injection into the pericardial space. Severity is reported as pressure increase. Cardiac output and stroke volume decrease with increased pericardial fluid (Isaacs et.al., 1954; Metcalfe et.al., 1952). Decreased flow does not initially lead to decreased arterial pressure (Metcalfe et.al., 1952) presumabnly due to reflex support.

Pericardial Hemorrhage
QCP Laboratory Manual
StrokeVolume
(mL)
ArterialPressure(mmHg)
0
20
Pericardial Pressure (mmHg)
0
150
0 5 10 15 20
While transfusion will increase cardiac output in a normal subject, it has almost no effect on cardiac output when there has been a pericardial hemorrhage (Isaacs etal, 1954).
CardiacOutput(L/Min)
0
4
Transfusion (mL)
2
0 100 200 300 400 500
Normal
Severe Pericardial Hemorrhage
This would explain the patient’s lack of response to administered fluids.

Pericardial Hemorrhage
QCP Laboratory Manual
References Isaacs, J.P., E. Berglund and S.J. Sarnoff. Ventricular function. III. The pathologic physiology of acute cardiac tamponade studied by means of ventricular function curves. Amer. Heart J. 48:66-76, 1954. Metcalfe, J., J.W. Woodbury, V. Richards and C.S. Burwell. Studies in experimental pericardial tamponade. Effects on intravascular pressures and cardiac output. Circulation 5:518-523, 1952. Summers, R.L. Evidence-based medicine vs. scientific reasoning. Acad. Emer. Med. 3:183-184, 1996.

QCP Laboratory Manual
Carbon Monoxide Inhalation
Carbon monoxide binds to hemoglobin in competition with oxygen. Hemoglobin's affinity for carbon monoxide is 230 times its affinity for oxygen (Allen & Root). Thus, low concentrations of carbon monoxide will displace normal concentrations of oxygen on the hemoglobin molecule. The normal delivery of oxygen to the tissues is disrupted and tissue hypoxia ensues. Hemoglobin (Hgb) bound with carbon monoxide (CO) is carboxyhemoglobin (CO Hgb). The percentage of total Hgb that is CO Hgb is denoted as %CO Hgb. John Haldane administered carbon monoxide to himself and then reported the consequences. His report gives an early but accurate account of CO poisoning (Haldane). Carboxyhemoglobin formation as a function of time is shown below for Haldane’s experiment VII, inhalation of 0.21% CO.
Time (Min)
%CO Hgb
0
20
40
60
0 40 80
"... throbbing in head"
"Feel very decidedly abnormal"
"Stopped experiment.Vision dim. Limbs weak.... difficulty getting up ..."

Carbon Monoxide Inhalation
QCP Laboratory Manual
Inhaled carbon dioxide accumulates in the blood as a function of inhaled concentration and time of exposure (shown below, data from Petersen).
Time (Min)
%COHgb
0
10
20
30
0 100 200 300
0.05%
0.02%
0.005%
Early accumulation of inhaled CO in the blood can be described by the formula (Forbes)
%CO Hgb = 3 * Inhaled CO (%) * Time (Min) Late accumulation is slower than early accumulation, as steady-state is approached. Signs of poisoning appear. Optional The rate of carboxyhemoglobin formation during CO inhalation is highly dependent on the rate of alveolar ventilation. Design a protocol that quantitates CO uptake as a function of alveolar ventilation at one concentration of inhaled CO.

Carbon Monoxide Inhalation
QCP Laboratory Manual
The Carbon Monoxide Inhalation Protocol We will repeat Haldane’s experiment (described above) in this exercise. Click Restart to reestablish initial conditions. Go to
Carbon Monoxide. In the Gas Tanks box slide the CO PPM slidebar up to 2000. To convert parts per million to % concentration, multiply by 10-4. Click the gas tanks switch to on. Advance time and record data. Pay particular attention to the effect of CO on O2
transport by the blood. Blood Volume has a bar graph that shows the status of QCP’s hemoglobin.
Carboxyhemoglobin (%)
Arterial pO2 (mmHg) Arterial [O2] (mL/mL) Venous pO2 (mmHg) Venous [O2] (mL/mL)
Cardiac Output (mL/Min)

Carbon Monoxide Inhalation
QCP Laboratory Manual
Time 0 Min
30 Min
1 Hr
2 Hr
%CO Hgb
Arterial pO2
Arterial [O2]
Venous pO2
Venous [O2]
Cardiac Output
Wrapup
Advance time an additional 1 or 2 hours to show that this CO concentration is fatal with continuing inhalation.
Elimination Of Inhaled CO Once inhalation of CO is stopped, the gas is expired as slowly as it was previously inspired. Since, oxygen and CO are competitive at the hemoglobin molecule, inhaling oxygen at high concentration will displace the CO, thereby accelerating CO blow off (shown below, data from Pace, Petersen). This is a standard treatment for CO poisoning.

Carbon Monoxide Inhalation
QCP Laboratory Manual
Inspired O2 (Atm)
Half-TimeFor CO
Elimination(Min)
0
100
200
300
0 0.21 1.0 2.5
Design a protocol that first creates CO poisoning and then compares normal CO elimination after CO inhalation to the accelerating effect of oxygen administration.
References Allen, T. A. and W. S. Root. Partition of carbon monoxide and oxygen between air and whole blood of rats, dogs and men as affected by plasma pH. J. Appl Physiol. 10:186-190, 1957. Forbes, W. H., F. Sargent and F. J. W. Roughton. The rate of carbon monoxide uptake by normal men. Amer. J. Physiol. 143:594-608, 1945. Haldane, J. S. The action of carbonic oxide in man. J. Physiol. 18:430-462, 1895. Pace, N., E. Strajman and E. L. Walker. Acceleration of carbon monoxide elimination in man by high pressure oxygen. Science 111:652-654, 1950.

Carbon Monoxide Inhalation
QCP Laboratory Manual
Petersen, J. E. and R. D. Steward. Absorption and elimination of carbon monoxide by inactive young men. Arch. Environ. Health 21:165-171, 1970.
QCP Laboratory Manual
Anemia
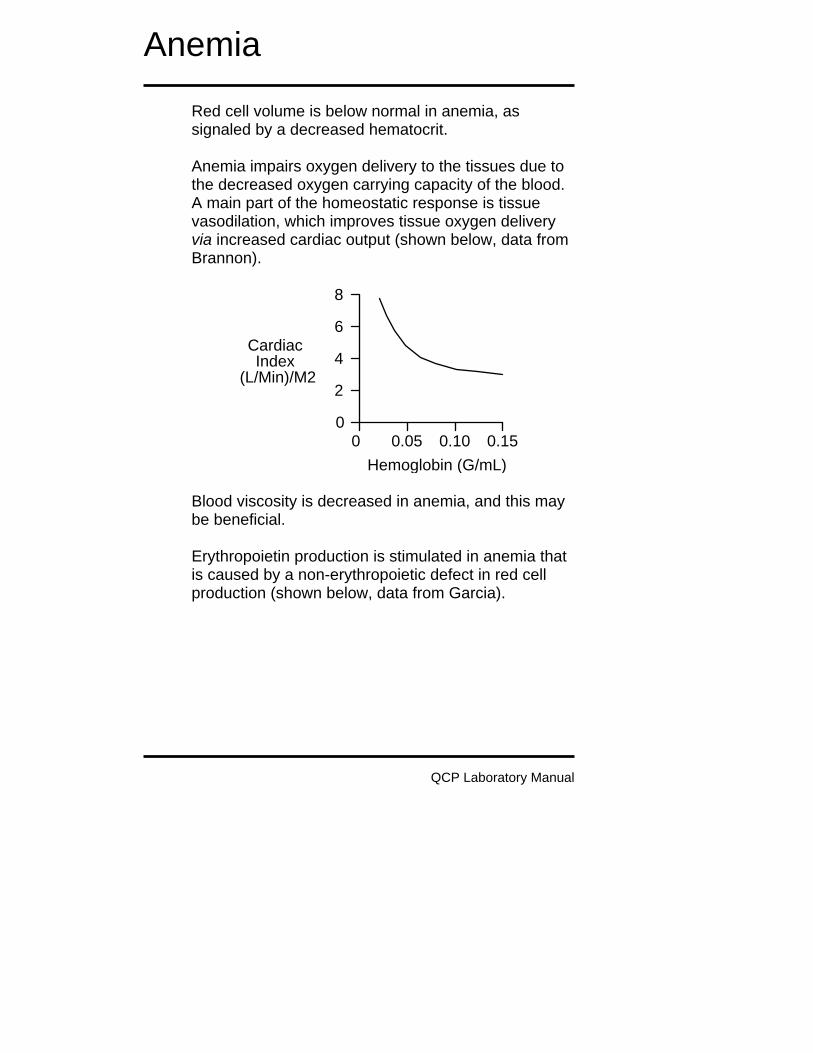
Red cell volume is below normal in anemia, as signaled by a decreased hematocrit. Anemia impairs oxygen delivery to the tissues due to the decreased oxygen carrying capacity of the blood. A main part of the homeostatic response is tissue vasodilation, which improves tissue oxygen delivery via increased cardiac output (shown below, data from Brannon).
Hemoglobin (G/mL)
00 0.05 0.10
6
4
8
0.15
IndexCardiac
(L/Min)/M22
Blood viscosity is decreased in anemia, and this may be beneficial. Erythropoietin production is stimulated in anemia that is caused by a non-erythropoietic defect in red cell production (shown below, data from Garcia).

Anemia
QCP Laboratory Manual
Hemoglobin (G/mL)
10 0.10
1,000
10
10,000
0.20
EPO(mU/mL)
Normal100
The Anemia Protocol Click Restart to reestablish initial conditions and then
record the control data. Go to Blood Volume. In the red cell production box, set the basic production rate to 0. Advance time and record data. Note the slow decline in red cell volume over time due to the long life span of redcells.
Red Cell Volume (mL) Plasma Volume (mL) Hematocrit (%) Arterial [O2] (mL/mL) Arterial pO2 (mmHg) Venous [O2] (mL/mL) Venous pO2 (mmHg)
Cardiac Output (mL/Min)
Anemia
QCP Laboratory Manual
Time 0 Min
1 Month
2 Months
Red Cell Volume
Plasma Volume
Hematocrit
Arterial [O2]
Arterial pO2
Venous [O2]
Venous pO2
Cardiac Output
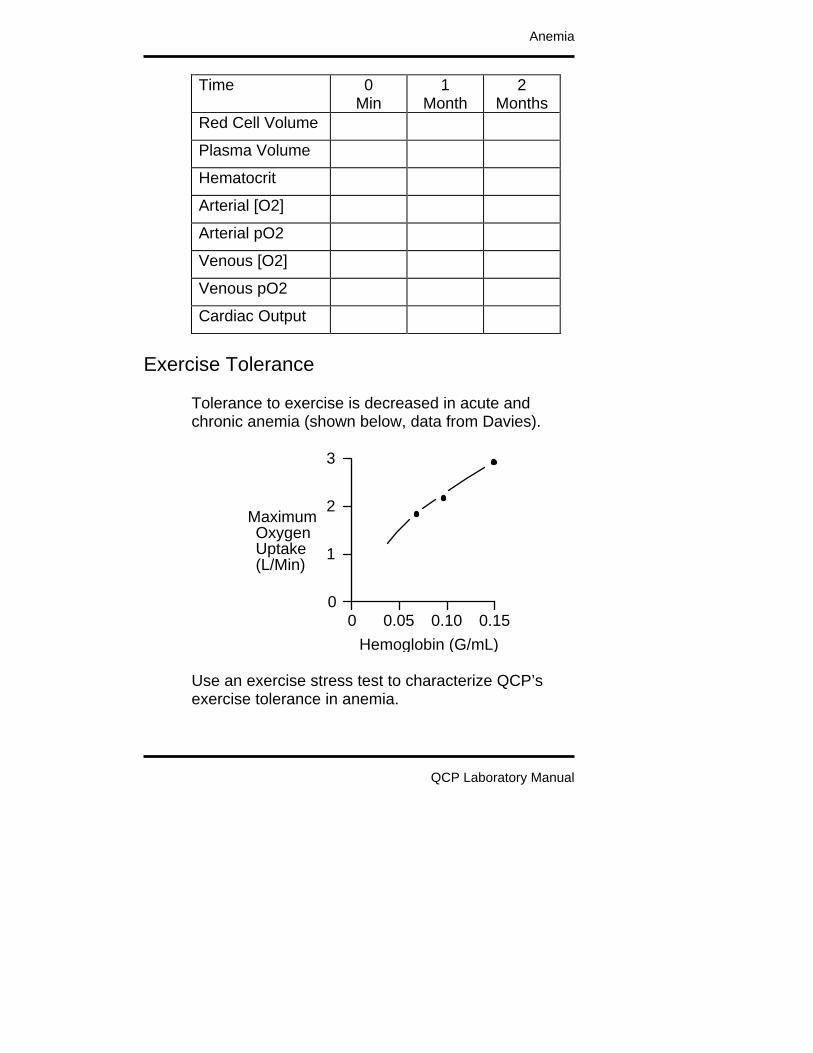
Exercise Tolerance
Tolerance to exercise is decreased in acute and chronic anemia (shown below, data from Davies).
Hemoglobin (G/mL)
00 0.05 0.10
2
1
3
0.15
OxygenMaximum
(L/Min)Uptake
Use an exercise stress test to characterize QCP’s exercise tolerance in anemia.

Anemia
QCP Laboratory Manual
Treadmill Speed (MPH) Treadmill Grade (%)
Heart Rate (/Min)
Time 0’ 1’ 2’ 3’ 4’ 5’
Speed 0 6 6 6 6 6
Grade 0% 0% 2% 4% 6% 8%
Heart Rate
Record the elapsed time and distance when this subject finally gives up. Elapsed Time (Min)
Distance Traveled (Ft)
Wrapup
Return basic red cell production to its normal value of 0.014 mL/Min and follow the recovery of red cell volume. Note the role of EPO.
Blood Viscosity And Anemia Blood viscosity is a function of hematocrit (shown below, data from Whittaker, Stone).

Anemia
QCP Laboratory Manual
Hematocrit (%)
Viscosity(x H2O)
00 20 40 60 80
5
10
Follow changes in blood viscosity during the
development of anemia at Conductance. Click Restart to reestablish initial conditions and then
record the control data. Again, go to Blood Volume and decrease basic red cell production rate to 0. Advance time and record data.
Hematocrit (%) Blood Viscosity (x Normal) Cardiac Output (mL/Min)
Time 0
Min 1
Month 2
Months Blood Viscosity
Hematocrit
Cardiac Output

Anemia
QCP Laboratory Manual
Decreased blood viscosity in anemia has a beneficial effect on cardiac output. Return viscosity to normal
using the fixed viscosity switch at Conductance and note the fall in cardiac output.
References Brannon, E. S., A. J. Merrill, J. V. Warren and E. A. Stead, Jr. The cardiac output in patients with chronic anemia as measured by the technique of right atrial catheterization. J. Clin. Invest. 24:332-336, 1945. Davies, C. T. M., A. C. Chukweumeka and J. P. M. vanHaaren. Iron-deficiency anaemia: Its effect on maximum aerobic power and responses to exercise in African males aged 17-40 years. Clin. Sci. 44:555-562, 1973. Garcia, J. F., S. N. Ebbe, L. Hollander, H. O. Cutting, M. E. Miller and E. P. Cronkite. Radioimmunoassay of erythropoietin: Circulating levels in normal and polycythemic human beings. J. Lab. Clin. Med. 99:624-635, 1982. Stone, H. O., H. K. Thompson, Jr. and K. Schmidt-Nielsen. Influence of erythrocytes on blood viscosity. Amer. J. Physiol. 214:913-918, 1968. Whittaker, S. R. F. and F. R. Winton. The apparent viscosity of blood flowing in the isolated hindlimb of the dog, and its variation with corpuscular concentration. J. Physiol. 78:339-369, 1933.
QCP Laboratory Manual
Diabetes Insipidus
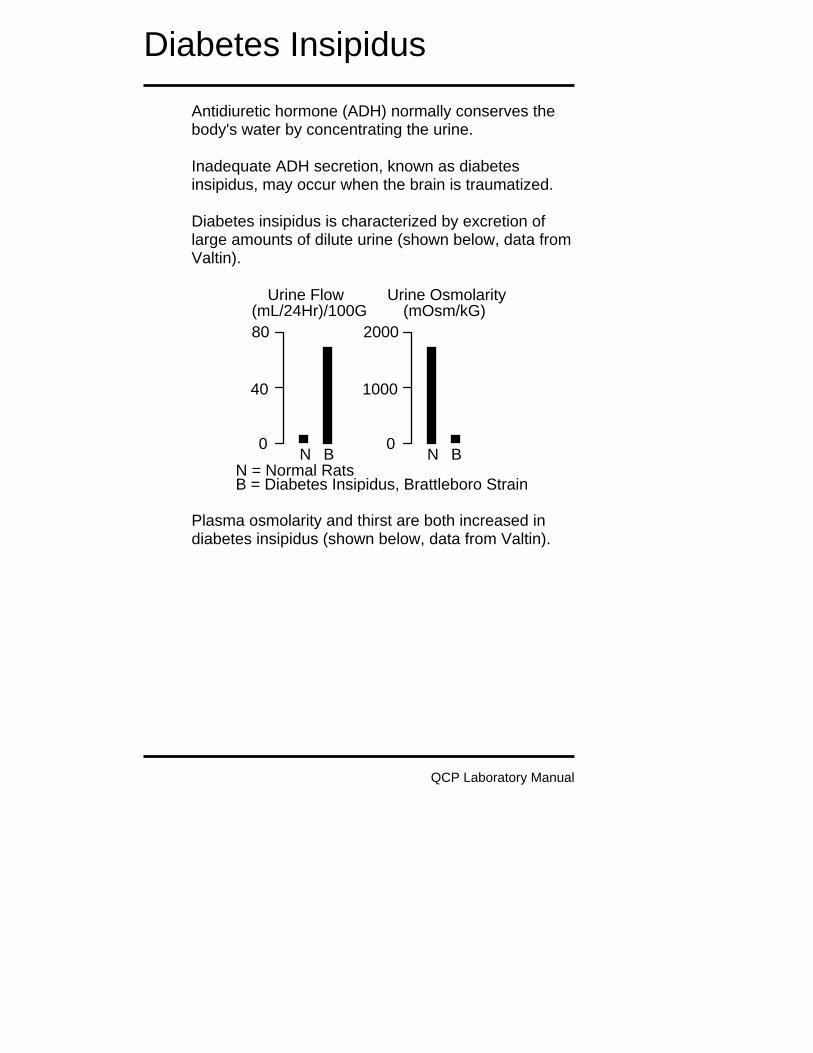
Antidiuretic hormone (ADH) normally conserves the body's water by concentrating the urine. Inadequate ADH secretion, known as diabetes insipidus, may occur when the brain is traumatized. Diabetes insipidus is characterized by excretion of large amounts of dilute urine (shown below, data from Valtin).
Urine OsmolarityUrine Flow(mOsm/kG)(mL/24Hr)/100G
0
40
80
BNN = Normal RatsB = Diabetes Insipidus, Brattleboro Strain
0
1000
2000
BN
Plasma osmolarity and thirst are both increased in diabetes insipidus (shown below, data from Valtin).

Diabetes Insipidus
QCP Laboratory Manual
Plasma Osmolarity Water Intake
(mOsm/kG) (mL/24Hr)/100G
0
40
80
BNN = Normal RatsB = Diabetes Insipidus, Brattleboro Strain
300
310
320
BN
A popular experimental model of diabetes insipidus is a strain of rats, called the Brattleboro strain, which was created upon the chance discovery of a litter of rats with inherited or familial diabetes insipidus (Valtin & Schroeder).
The Diabetes Insipidus Protocol Click Restart to reestablish initial conditions and then
record the control data. Go to Antidiuretic Hormone. Set the secretion basic fraction to 0. Advance the solution and record data. Note the rapid decrease in plasma [ADH].
Plasma [ADH] (pG/mL)
Plasma [Osmolarity] (mOsm/L)
Water Intake (mL/Min)

Diabetes Insipidus
QCP Laboratory Manual
Extracellular Fluid Volume (L)
Urine Flow (mL/Min) Urine [Osmolarity] (mOsm/L)
Time 0
Min 10 Min
1 Day
1 Week
Plasma [ADH]
Plasma [Osm]
H2O Intake
ECFV
Urine Flow
Urine [Osm]
What are the initial and final water intakes in L/Day?
References Valtin, H. and H. A. Schroeder. Familial hypothalamic diabetes insipidus in rats (Brattleboro strain). Amer. J. Physiol. 206:425-430, 1964.

QCP Laboratory Manual
Pneumothorax
Inspiration moves the ribcage out and the diaphragm down, creating a negative pressure in the pleural space. This negative pressure pulls at and inflates the lungs. If air is allowed to enter the pleural space from the lung or through the ribcage during inspiration, the lung does not inflate. This is pneumothorax. Bilateral pneumothorax is quickly fatal if not attended to immediately. Unilateral pneumothorax is more interesting physiologically and is the topic of this exercise. Unilateral pneumothorax has three main components. The negative pleural pressure is lost on the ipsilateral side. This pressure tends to hold open the pulmonary blood vessels and when it is lost the pulmonary vascular resistance increases and cardiac output decreases (Ann. Thoracic Surg., 1993). The loss of negative pleural pressure and increased pulmonary vascular resistance on the ipsilateral side reroutes some pulmonary blood flow the contralateral side where relatively normal lung inflation continues (Carvalho, et.al., 1996). This is beneficial. Thirdly, pulmonary blood flowing though the ipsilateral side is not oxygenated due to the absence of lung inflation. This constitutes a massive right-to-left pulmonary shunt (Rutherford, 1968). Severe arterial hypoxia is the immediate result.

Pneumothorax
QCP Laboratory Manual
You can view these consequences of pneumothorax in the exercise that follows. Before undertaking the exercise, recall that arterial hypoxia stimulates ventilation. Will this be beneficial? Would administering 100% O2 help? What will be the body’s long-term response to this condition?
The Pneumothorax Protocol Click Restart to reestablish initial conditions and then record control values.
Go to Thorax and click open the right hemithorax. Record the acute hemodynamic effects of this stenosis. Advance time and record data. Look for evidence of compensation.
Cardiac Output (mL/Min) Stroke Volume (mL) Heart Rate (Beats/Min
Arterial pO2 (mmHg) Blood Volume (mL)
Total Ventilation (L/Min) Ventilation Rate (/Min) Tidal Volume (mL) Right Lung Inflation (x Normal) Left Lung Inflation (x Normal) Respiratory Drive (x Normal)

Pneumothorax
QCP Laboratory Manual
Time Control Acute 1 Week
Cardiac Output
Heart Rate
Stroke Volume
Arterial pO2
Blood Volume
Total Ventilation
Ventilation Rate
Tidal Volume
Right Inflation
Left Inflation
Respiratory Drive
References
Carvalho, P., J. Hilderbrandt and N.B. Charan. Changes in bronchial and pulmonary artery blood flow with progressive tension pneumothorax. J. Appl. Physiol. 81:1664, 1996. Ann. Thoracic Surg. 55:1379, 1993. Rutherford. J. Trauma 8:212, 1968.

QCP Laboratory Manual
Cardiac Arrest
Cardiac arrest stops oxygen delivery to the tissues. Any remaining metabolism is anaerobic. Organ failure is rapid. Ventilation and sympathetic nerve activity are temporarily stimulated, but this is of little value. In this exercise, we’ll use ventricular fibrillation to create cardiac arrest.
The Cardiac Arrest Protocol Click Restart to reestablish initial conditions and then record control values.
Go to Ventricles and click the fibrillate now button. Record the acute hemodynamic effects of loss of ventilation. Advance time and record data.
Blood Pressure (mmHg)
Cardiac Output (mL/Min)
Total Ventilation (L/Min)
Sympathetic Ganglia Firing (Hz)

Cardiac Arrest
QCP Laboratory Manual
Time Control 30 Sec 1 Min
Blood Pressure
Cardiac Output
Ventilation
Symp Activity
You can go to Structure / Function to monitor
changes in organ function with time. Charts shows neurological signs.
Go to Misc. Treatments to attempt defibrillation. See the exercise Cardiopulmonary Resuscitation for more on this.
References

QCP Laboratory Manual
Asphyxia
Asphyxia occurs when ventilation stops. Oxygen delivery to the tissues subsequently stops and the remaining metabolism in anaerobic. Organ failure is rapid. Asphyxia can be caused by loss of respiratory drive, airway obstruction, or inhalation of inadequately oxygenated air. You can trace the timecourse of organ failure in asphyxia in this exercise.
The Asphyxia Protocol Click Restart to reestablish initial conditions and then record control values.
Go to Ventilation and reduce central and peripheral respiratory drive to 0. Record the acute hemodynamic effects of loss of ventilation. Advance time and record data.
Blood Pressure (mmHg)
Cardiac Output (mL/Min) Heart Rate (Beats/Min) Stroke Volume (mL)
Arterial pO2 (mmHg)
Blood pH

Asphyxia
QCP Laboratory Manual
Time Control 30 Sec 1 Min 5 Min
Blood Pressure
Cardiac Output
Heart Rate
Stroke Volume
Arterial pO2
Blood pH
You can go to Structure / Function to monitor
changes in organ function with time. Charts shows neurological signs. Note that the early problem is re-establishing adequate oxygen delivery, while a later problem is re-establishing a heartbeat. See the exercise Cardiopulmonary Resuscitation for more on this.
References

QCP Laboratory Manual
Cardiopulmonary Resuscitation
Cardiopulmonary resuscitation creates ventilation and cardiac output in an attempt to maintain the myocardium until defibrillation can be attempted. External cardiac compression is often the only means available for producing cardiac output, but it is not particularly effective. Chances of re-establishing a normal heartbeat depend on the coronary blood flow created during CPR (Ann. Emer. Med., 1984).
Coronary Blood Flow (mL/Min/G)
Outcome
0.1 Can’t Revive 0.3 Hard To Revive 0.5 Easy To Revive
Repeated injection of large doses of epinephrine may raise arterial pressure, thus improving coronary blood flow (Crit. Care Med., 1993).
Protocol Coronary Perfusion Pressure (mmHg)
No Epinephrine 15 Epi (0.02 mG/kG) 20 Epi (0.2 mG/kG) 35
In this exercise, we’ll produce cardiac arrest by fibrillating the heart. CPR will then be started and the

Cardiopulmonary Resuscitation
QCP Laboratory Manual
hemodynamic details can be observed. Defibrillation will be attempted at 10 minutes.
The Cardiopulmonary Resuscitation Protocol Click Restart to reestablish initial conditions and then record control values.
Go to Ventricles and click the fibrillate now button. Note that the heart is no longer pumping
blood. Then go to Misc. Treatments and set the CPR switch to on. Record the acute hemodynamic effects of cardiac arrest plus CPR. Advance time and record data.
Blood Pressure (mmHg)
Cardiac Output (mL/Min) Heart Rate (Beats/Min) Stroke Volume (mL)
Left Heart (Coronary) Blood Flow (mL/Min)
Arterial pO2 (mmHg) Blood pH Blood [Lactate-] (mEq/L)
Total Ventilation (L/Min)
Sympathetic Ganglia Firing (Hz)

Cardiopulmonary Resuscitation
QCP Laboratory Manual
Time Control 30 Sec 1 Min 10 Min
Blood Pressure
Cardiac Output
Heart Rate
Stroke Volume
Coronary Flow
Arterial pO2
Blood pH
Blood [Lac-]
Ventilation
Symp Activity
You can go to Structure / Function to monitor
changes in organ function with time. Charts shows neurological signs.
After 10 minutes, go to Misc. Treatments to attempt defibrillation. The probability of successful defibrillation decreases 5% with each passing minute of CPR. Design a strategy for re-establishing a normal heartbeat after 20 minutes of CPR. Design a strategy for re-establishing a normal heartbeat after 10 minutes of cardiac arrest with no

Cardiopulmonary Resuscitation
QCP Laboratory Manual
life support followed by a period of 10 minutes of CPR.
References Ann. Emer. Med. 13:79, 1984. Crit. Care Med. 21:413, 1993.

QCP Laboratory Manual
Introduction To Acid / Base
Pure derangements in acid / base balance can be produced in the laboratory by directly altering the blood’s ionic and carbon dioxide content. Clinically, derangements in acid / base balance are usually complications resulting from one or more underlying disease processes. A primary treatment goal is to diagnose and treat the underlying disease. But in addition, acid / base disturbances can proceed to a severe acidosis or alkalosis that is damaging in its own right and potentially fatal. Thus, accurate evaluation of acid / base status is an important clinical objective. This exercise tests your diagnostic skills by presenting 5 patients who may or may not have derangements in acid / base balance.
In each case, load the patient, go to , take the necessary blood samples, and answer the questions regarding the patent’s acid / base status based on the blood chemistry. If you are not familiar with the process of loading patients, refer to the chapter Patients in QCP’s User’s Guide.
Evaluating Acid / Base Status This is a brief review of what to look for in evaluating acid / base balance. Refer to your textbook for additional information.

Introduction To Acid / Base
QCP Laboratory Manual
Blood pH Examine the pH to see if it is greater than or less than normal. Remember that in certain circumstances, serious derangements in acid / base balances are accompanied by rather small changes in blood pH. Blood H+ concentration, in nMol/L, is an alternative to pH. [H+] and pH supply exactly the same information. pH = -log ([H+]) with H+ in Mol/L Blood pCO2. Examine blood pCO2 to see if it is greater than or less than normal. The partial pressure of CO2 in the blood has a significant affect on blood pH and also respiration rate. Changes may be either primary (and causal) or secondary (and compensatory). Anion Gap. Look for an abnormal blood anion gap. The anion gap is defined as the blood’s sodium concentration minus the chloride concentration minus the bicarbonate concentration. Anion Gap = [Na+] – [Cl-] – [HCO3-] With sodium being the blood’s chief cation and chloride and bicarbonate being the blood’s chief anions, the anion gap represents additional unmeasured anions in the blood. If the gap increases, it signals the presence in the blood of additional, unseen anions. Lactate and ketoacids are prime suspects.

Introduction To Acid / Base
QCP Laboratory Manual
Normal Values
Before loading and analyzing the patients, go to , take the necessary blood samples, and record normal values for venous blood.
pH [H+] (nMol/L) pCO2 (mmHg) [HCO3-] (mEq/L) Anion Gap (mEq/L)
Patient Acid_1
pH [H+] (nMol/L) pCO2 (mmHg) [HCO3-] (mEq/L) Anion Gap (mEq/L)
Primary Disturbance Compensation
Normal None Respiratory Acidosis Respiratory Respiratory Alkalosis Metabolic Metabolic Acidosis Metabolic Alkalosis
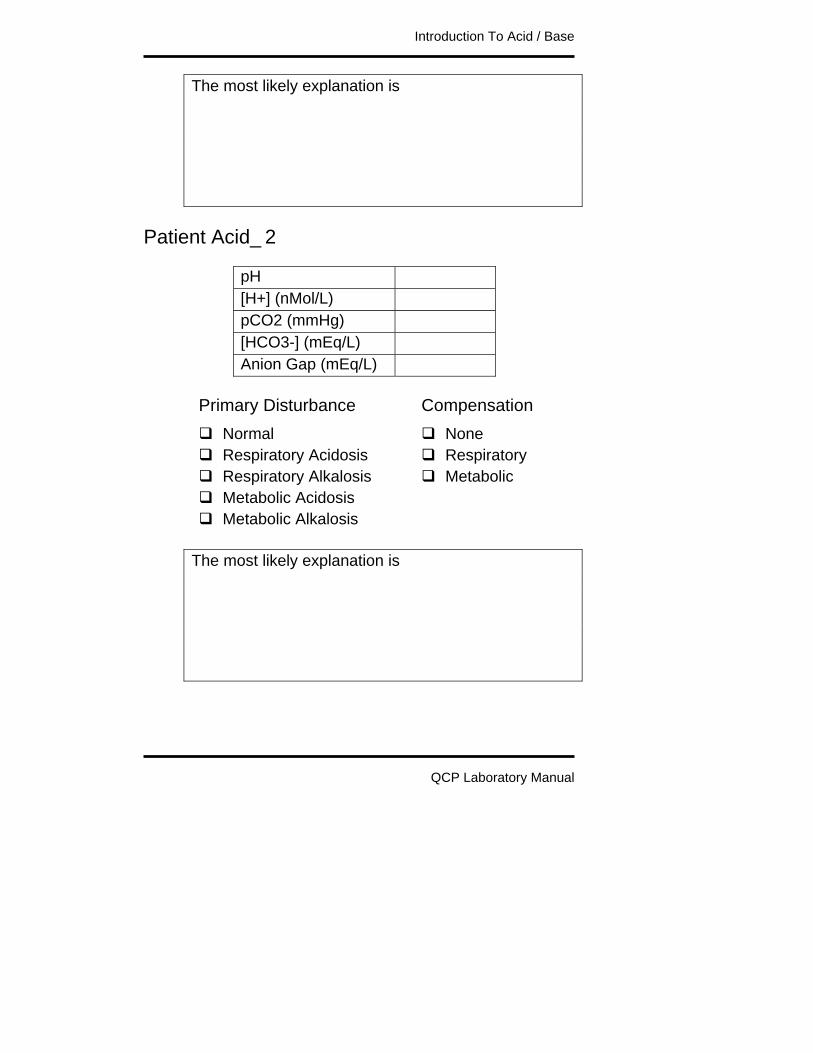
Introduction To Acid / Base
QCP Laboratory Manual
The most likely explanation is
Patient Acid_2
pH [H+] (nMol/L) pCO2 (mmHg) [HCO3-] (mEq/L) Anion Gap (mEq/L)
Primary Disturbance Compensation
Normal None Respiratory Acidosis Respiratory Respiratory Alkalosis Metabolic Metabolic Acidosis Metabolic Alkalosis
The most likely explanation is

Introduction To Acid / Base
QCP Laboratory Manual
Patient Acid_3
pH [H+] (nMol/L) pCO2 (mmHg) [HCO3-] (mEq/L) Anion Gap (mEq/L)
Primary Disturbance Compensation
Normal None Respiratory Acidosis Respiratory Respiratory Alkalosis Metabolic Metabolic Acidosis Metabolic Alkalosis
The most likely explanation is
Patient Acid_4
pH [H+] (nMol/L) pCO2 (mmHg) [HCO3-] (mEq/L) Anion Gap (mEq/L)
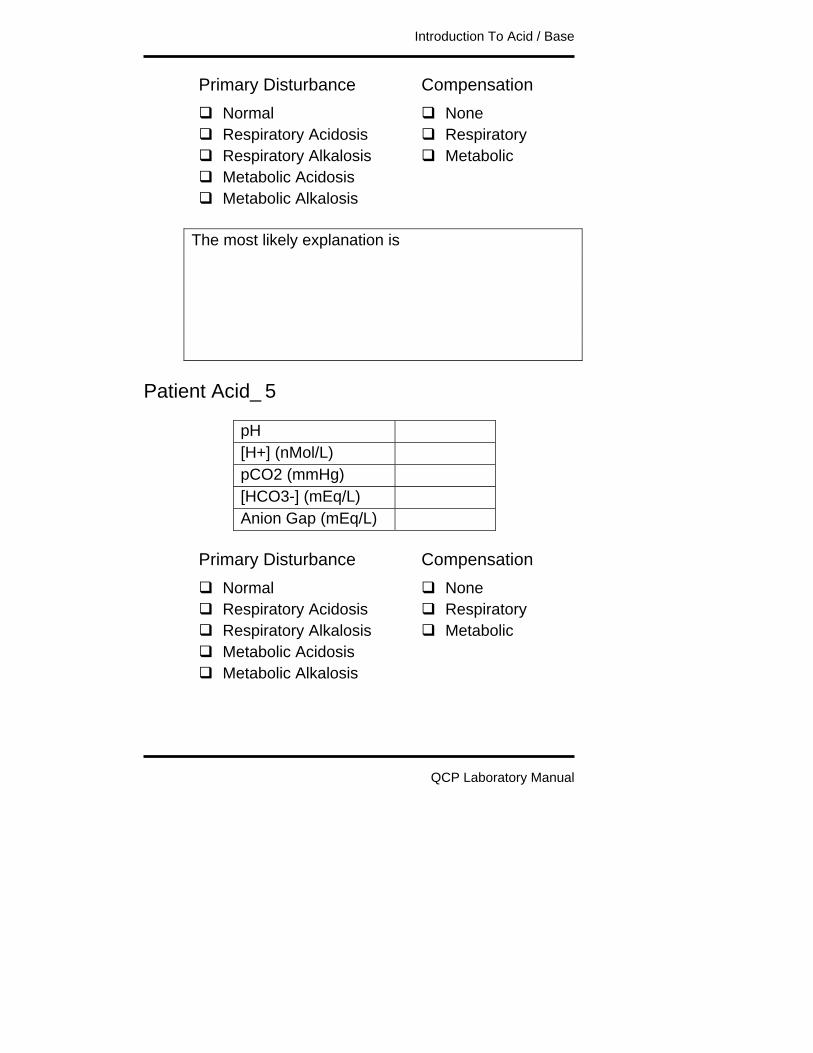
Introduction To Acid / Base
QCP Laboratory Manual
Primary Disturbance Compensation Normal None Respiratory Acidosis Respiratory Respiratory Alkalosis Metabolic Metabolic Acidosis Metabolic Alkalosis
The most likely explanation is
Patient Acid_5
pH [H+] (nMol/L) pCO2 (mmHg) [HCO3-] (mEq/L) Anion Gap (mEq/L)
Primary Disturbance Compensation
Normal None Respiratory Acidosis Respiratory Respiratory Alkalosis Metabolic Metabolic Acidosis Metabolic Alkalosis

Introduction To Acid / Base
QCP Laboratory Manual
The most likely explanation is

QCP Laboratory Manual
Sodium Bicarbonate
Intuitively, sodium bicarbonate would seem to be an ideal agent for treating acidosis. But there are some surprises. The Na+ in NaHCO3 is beneficial since it increases the plasma Na+ concentration which increases the strong ion difference, increasing pH. The HCO3- in NaHCO3 is potentially a big problem since it can be the source of large amounts of CO2 according to [H+] + [HCO3-] CO2 + H2O If NaHCO3 is added to a closed system, the beneficial effects of Na+ are offset by the CO2 generated and the pH doesn’t change much (2). While a closed system may seem far removed from the clinical management of acid / base disorders, I cite 2 examples to the contrary. Both involve impaired respiratory elimination of CO2, making the body a good approximation to a closed system. Any disorder that impedes the respiratory elimination of CO2 will probably cause respiratory acidosis and blunt the therapeutic effect of sodium bicarbonate by impeding the elimination of the newly generated CO2. Respiratory distress syndrome in newborn infants is an example. In another example, a patient in cardiac arrest was intubated for ventilation, given cardiac massage, and given an IV injection of NaHCO3 (3). Unfortunately,
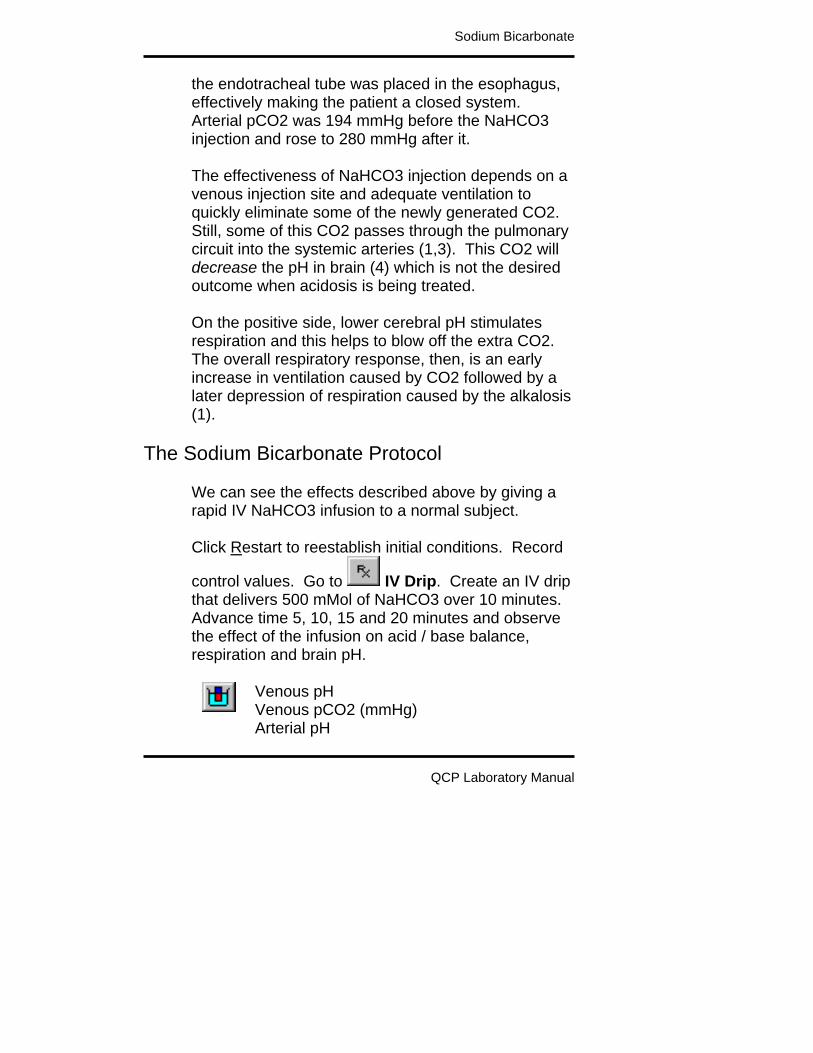
Sodium Bicarbonate
QCP Laboratory Manual
the endotracheal tube was placed in the esophagus, effectively making the patient a closed system. Arterial pCO2 was 194 mmHg before the NaHCO3 injection and rose to 280 mmHg after it. The effectiveness of NaHCO3 injection depends on a venous injection site and adequate ventilation to quickly eliminate some of the newly generated CO2. Still, some of this CO2 passes through the pulmonary circuit into the systemic arteries (1,3). This CO2 will decrease the pH in brain (4) which is not the desired outcome when acidosis is being treated. On the positive side, lower cerebral pH stimulates respiration and this helps to blow off the extra CO2. The overall respiratory response, then, is an early increase in ventilation caused by CO2 followed by a later depression of respiration caused by the alkalosis (1).
The Sodium Bicarbonate Protocol We can see the effects described above by giving a rapid IV NaHCO3 infusion to a normal subject. Click Restart to reestablish initial conditions. Record
control values. Go to IV Drip. Create an IV drip that delivers 500 mMol of NaHCO3 over 10 minutes. Advance time 5, 10, 15 and 20 minutes and observe the effect of the infusion on acid / base balance, respiration and brain pH.
Venous pH Venous pCO2 (mmHg) Arterial pH

Sodium Bicarbonate
QCP Laboratory Manual
Arterial pCO2 (mmHg) Brain pH
Total Ventilation (L/Min)
Time (Min) 0 5 10 15 20
Venous pH
Venous pCO2
Arterial pH
Arterial pCO2
Brain pH
Ventilation
References
(1) J. Clin. Invest. 35:245, 1956. (2) J. Pediatric. 80:671, 1972. (3) J.A.M.A. 235:506, 1976. (4) Am. J. Physiol. 25:H1316, 1989.
QCP Laboratory Manual
Ketoacidosis
The brain generally uses glucose as its exclusive fuel. Fatty acids are not an option since they don’t cross the blood-brain barrier. When dietary glucose is not available, glucose stored in the liver as glycogen is released and used by the brain. Hepatic glycogen storage is limited, however, so this is not a long-term option. See the laboratory exercise titled Starvation. There is a long-term option available for brain fuel in ketoacids. The liver normally synthesizes small amounts of ketoacids from fatty acid, but synthesis is increased markedly when glucose is scarce and fatty acid is abundant. The kidney filters ketoacids and then avidly reabsorbs them, treating them like the precious fuel that they are. Untreated diabetics (Type I) typically have low insulin levels and high glucagon levels. Ketoacid synthesis is stimulated by glucagon, so these untreated diabetics may be synthesizing large amounts of ketoacids. Ketoacids are a very useful part of metabolism when hepatic production is balanced by peripheral consumption. Problems develop when production exceeds consumption. In this exercise, we’ll follow the onset of ketoacidosis caused by deficient insulin.

Ketoacidosis
QCP Laboratory Manual
The Ketoacidosis Protocol Click Restart to reestablish initial conditions and then record control values.
Go to Beta Cells and decrease fractional insulin secretion to 0. Advance time and note the changes in ketoacid balance and acid / base balance. Identify respiratory compensations.
pH Strong Ion Difference (mEq/L) Anion Gap (mEq/L) [Ketoacids] (mG/dL) pCO2 (mmHg)
Hepatic KA Synthesis (mG/Min) Brain KA Use (mG/Min) Renal KA Excretion (mG/Min)
Respiratory Drive (x Normal) Total Ventilation (L/Min)
To convert ketoacids in mG/dL to mEq/L, multiply by 0.1.

Ketoacidosis
QCP Laboratory Manual
Time Control 1 Day 1 Week
pH
SID
Anion Gap
[KA]
PCO2
KA Made
KA Brain Use
KA Excretion
Resp. Drive
Ventilation
Severe Ketoacidosis
Ketoacid synthesis is not well controlled in the normal physiological sense. Any increase in synthesis and / or decrease in disposal beyond that seen above at 1 week can cause a potentially fatal acidosis. Increased synthesis might be caused by additional glucagon secretion. Decreased disposal might be caused by coma decreasing brain ketoacid metabolism or renal dysfunction causing decreased renal ketoacid secretion. Design a protocol that leads to fatal ketoacidosis.

QCP Laboratory Manual
Mitral Stenosis
The 4 valves of the heart are normally very efficient, providing almost no resistance to forward flow when open and nearly infinite resistance to backflow when closed. Valves that fail to open properly can create a significant impediment to forward flow. This is called stenosis. Valves that fail to close properly provide less than infinite resistance to backflow. This backflow is called regurgitation. In this exercise, we’ll investigate the hemodynamic consequences of stenosis of the mitral valve.
The Mitral Stenosis Protocol Click Restart to reestablish initial conditions and then record control values.
Go to Valves and reduce the open area of the mitral valve to 0.8 mM^2. Record the acute hemodynamic effects of this stenosis. Advance time and record data. Look for evidence of compensation.
Cardiac Output (mL/Min) Pulm. Artery Pressure (mmHg) Pulm. Capillary Pressure (mmHg) Pulm. Vein Pressure (mmHg) Left Atrial Pressure (mmHg)
Plasma Colloid Pressure (mmHg) Arterial pO2 (mmHg)

Mitral Stenosis
QCP Laboratory Manual
Blood Volume (mL)
Excess Lung H2O (mL)
Time Control Acute 1 Week
Cardiac Output
Pulm. Artery Pressure
Pulm. Caps Pressure
Pulm. Vein Pressure
Left Atrial Pressure
Plasma COP
Arterial pO2
Blood Volume
Excess Lung H2O
Pulmonary Edema
Normally, the plasma colloid pressure is considerably greater than the pulmonary capillary pressure. Note the control data above. This creates a negative filtration pressure in the pulmonary capillaries and keeps the lungs dry. Mitral stenosis increases the pulmonary capillary pressure and erodes the pressure gradient. In severe mitral stenosis, the pressure gradient can swing to a positive value (Finlayson, et.al., 1961). A life threatening pulmonary edema will result. Click Restart to reestablish initial conditions and then record control values.

Mitral Stenosis
QCP Laboratory Manual
Go to Valves and reduce the open area of the mitral valve to 0.6 mM^2. Record the acute hemodynamic effects of this stenosis. Attempt to advance time for a week, but stop and record data if QCP’s condition deteriorates. Time Control Acute 1 Week
Cardiac Output
Pulm. Artery Pressure
Pulm. Caps Pressure
Pulm. Vein Pressure
Left Atrial Pressure
Plasma COP
Arterial pO2
Blood Volume
Excess Lung H2O
Physical exertion increases the likelihood that a patient with mitral stenosis will develop pulmonary edema. Why?
References Finlayson, J. K., M. N. Luria, C. A. Stanfield, & P. N. Yu. Hemodynamic studies in acute pulmonary edema. Ann Int Med. 54:244-253, 1961.

QCP Laboratory Manual
Aortic Regurgitation
The 4 valves of the heart are normally very efficient, providing almost no resistance to forward flow when open and nearly infinite resistance to backflow when closed. Valves that fail to open properly can create a significant impediment to forward flow. This is called stenosis. Valves that fail to close properly provide less than infinite resistance to backflow. This backflow is called regurgitation. In this exercise, we’ll investigate the hemodynamic consequences of aortic valve regurgitation.
The Aortic Regurgitation Protocol Click Restart to reestablish initial conditions and then record control values.
Go to Left Heart Valves and increase the closed area of the aortic valve to 0.12 mM^2. Record the acute hemodynamic effects of this stenosis. Advance time and record data. Look for evidence of compensation.
Cardiac Output (mL/Min) Pulm. Artery Pressure (mmHg) Pulm. Capillary Pressure (mmHg) Pulm. Vein Pressure (mmHg) Left Atrial Pressure (mmHg)
Plasma Colloid Pressure (mmHg) Arterial pO2 (mmHg)
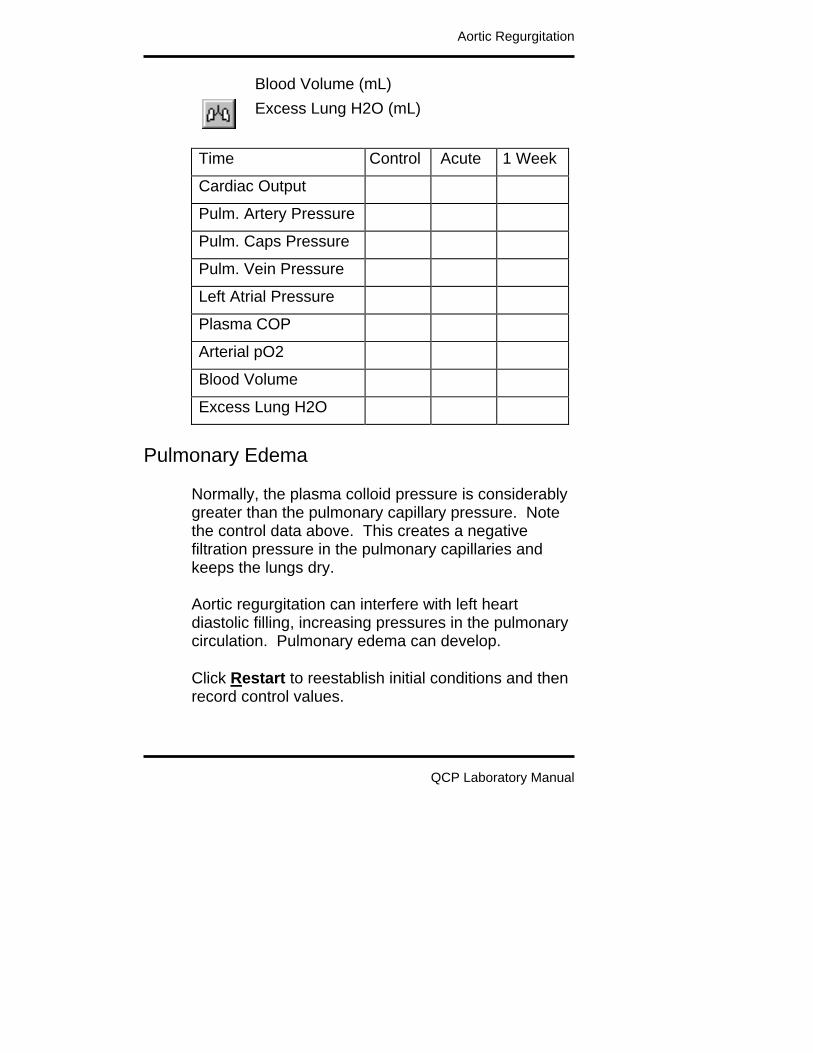
Aortic Regurgitation
QCP Laboratory Manual
Blood Volume (mL)
Excess Lung H2O (mL)
Time Control Acute 1 Week
Cardiac Output
Pulm. Artery Pressure
Pulm. Caps Pressure
Pulm. Vein Pressure
Left Atrial Pressure
Plasma COP
Arterial pO2
Blood Volume
Excess Lung H2O
Pulmonary Edema
Normally, the plasma colloid pressure is considerably greater than the pulmonary capillary pressure. Note the control data above. This creates a negative filtration pressure in the pulmonary capillaries and keeps the lungs dry. Aortic regurgitation can interfere with left heart diastolic filling, increasing pressures in the pulmonary circulation. Pulmonary edema can develop. Click Restart to reestablish initial conditions and then record control values.
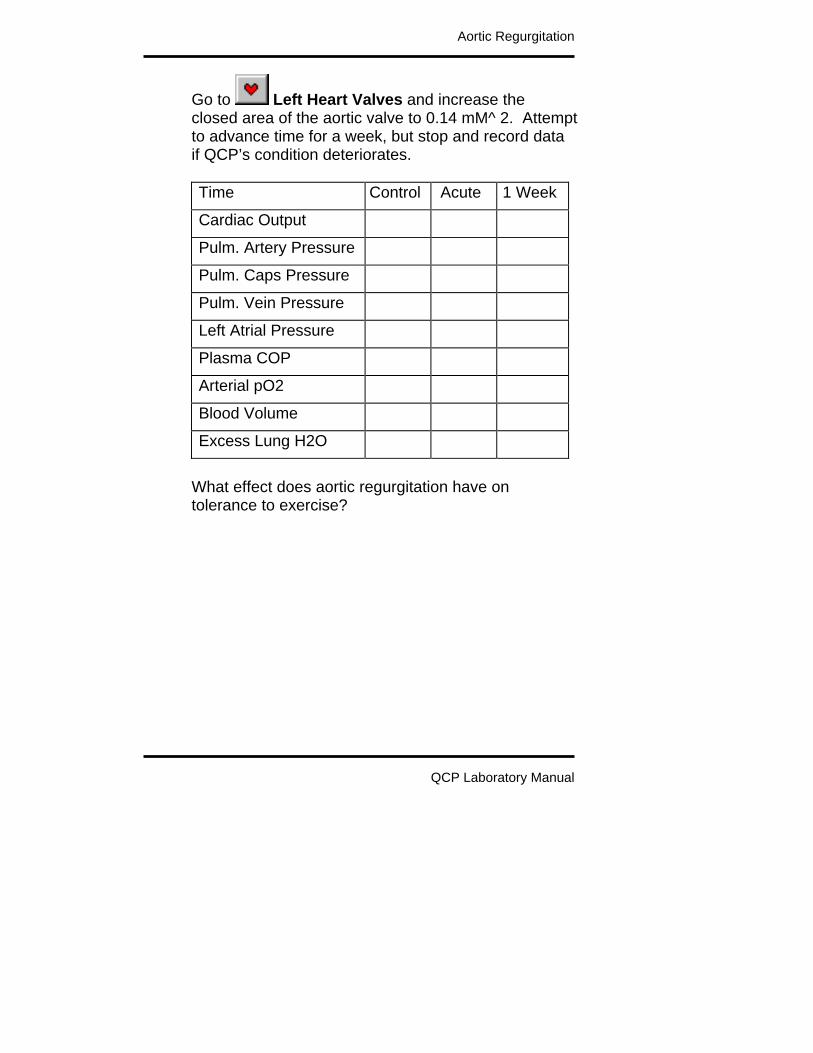
Aortic Regurgitation
QCP Laboratory Manual
Go to Left Heart Valves and increase the closed area of the aortic valve to 0.14 mM^2. Attempt to advance time for a week, but stop and record data if QCP’s condition deteriorates. Time Control Acute 1 Week
Cardiac Output
Pulm. Artery Pressure
Pulm. Caps Pressure
Pulm. Vein Pressure
Left Atrial Pressure
Plasma COP
Arterial pO2
Blood Volume
Excess Lung H2O
What effect does aortic regurgitation have on tolerance to exercise?

QCP Laboratory Manual
Osmolarity
The osmolarity of body fluids is an important part of many physiological responses. This exercise investigates several of the most important. Water can move freely between the intracellular and extracellular spaces and between the plasma and interstitium. Thus, the osmolarities of plasma, interstitial fluid, and intracellular fluid are nearly identical. In this exercise this osmolarity will be called the osmolarity of body fluids. The scenario is that Billy Bob is going hiking. It is a very hot day and Billy Bob forgot his water bottle. But he’s going ahead anyway. We want to know • What changes in body fluid osmolarity can be
expected. • What are the physiological consequences of these
changes. References below to Guyton and Hall, Textbook of Medical Physiology, 10th Edition, 2000 are denoted as G&H.
Importance Of Body Fluid Osmolarity Osmolarity determines the distribution of body water between the intracellular and extracellular compartments. This is equivalent to saying that osmolarity determines cell size. Osmolarity determines thirst.

Osmolarity
QCP Laboratory Manual
Osmolarity controls the secretion of antidiuretic hormone (ADH or vasopressin) Antidiuretic hormone acts on the kidney to help control urine osmolarity. This is equivalent to saying that antidiuretic hormone controls water excretion. Additional important effects of osmolarity are beyond the scope of this exercise.
Distribution Of Body Water Since water can move freely across most cell membranes, the distribution of water between the inside and outside of cells is determined by osmolarity. See G&H, Chapter 25. Note the normal values for osmolarity and intracellular and extracellular osmoles and volume. We will compare these values later to changes that occur during Billy Bob’s hike. Variable Value Osmolarity (mOsm/L) Whole-Body Osmoles Body H2O (L) Intracellular Osmoles Intracellular Volume (L) Extracellular Osmoles Extracellular Volume (L)
Thirst
Osmolarity acts on a special region of the brain to

Osmolarity
QCP Laboratory Manual
help control thirst. Increases in osmolarity cause a shift in water from intracellular to extracellular spaces and this stimulates thirst. See G&H, Chapter 28. Billy Bob won’t be drinking water while hiking since he forgot his water bottle, but we’ll track his thirst anyway. Record the normal value of thirst here. Variable Value Osmolarity (mOsm/L) Thirst (Rate, L/Day)
Antidiuretic Hormone (ADH) Secretion
In a manner similar to thirst, osmolarity acts on a special region of the brain to help control ADH secretion. ADH is synthesized in the hypothalamus and released in the blood stream in the posterior pituitary. ADH’s most important site of action is the renal medulla, as described below. Record the normal ADH secretion rate and plasma concentration here. Variable Value Osmolarity (mOsm/L) Plasma [ADH] (pG/mL) ADH Secretion (nG/Min)
A picogram (pG) is 10-8 G.
True. False.
A nanogram (nG) is 10-9 G.

Osmolarity
QCP Laboratory Manual
True. False.
Effect Of ADH On The Renal Medulla
ADH acts in the kidney, mainly at the collecting duct, to help control the reabsorption of water from the glomerular filtrate. Water that is not reabsorbed is excreted in the urine. Thus, ADH helps to control water excretion. See G&H, Chapter 28. Water reabsorption is determined by the difference in osmolarity between the collecting duct lumen and collecting duct interstitium. Reabsorption is also determined by collecting duct permeability to water. This permeability is controlled by ADH. You may need to use a View menu selection to make the Nephron Details button visible on the toolbar. Record the normal movement of water in the collecting duct (CD) here: Flow in, reabsorption, and flow out. Record osmolarity in the collecting duct lumen (click Collecting Duct) and collecting duct interstitium (click Medulla / Vasa Recta). Record collecting duct permeability. Variable Value Osmolarity (mOsm/L) CD H2O Flow In (mL/Min) CD H2O Reabsorp (mL/Min) CD H2O Flow Out (mL/Min) [Osm] CD Lumen (mOsm/L) [Osm] Medulla (mOsm/L)

Osmolarity
QCP Laboratory Manual
Permeability (x Normal)
The Hiking Protocol Billy Bob’s hiking protocol involves physical exercise, high environmental temperature, and restricted water intake. • Turn the treadmill on and set it to 2 MPH. • Increase ambient temperature to 100
degrees F. • Set water intake to fixed amount and set
the amount (H2O L/Day) to 0. Now, we’re ready for hiking.
1st Hour Advance time 1 hour. Record osmolarity. Variable Normal 1 Hour Osmolarity (mOsm/L)
ADH secretion is sensitive to small changes in osmolarity. Check on ADH secretion. Note the osmotic stimulus. Variable Normal 1 Hour Plasma [ADH] (pG/mL) ADH Secretion (nG/Min)
Billy Bob is not taking in any water, but he is losing water big time. Check on sweating.

Osmolarity
QCP Laboratory Manual
You may need to use a View menu selection to make the Organ Details – Skin button visible on the toolbar. Then on the Skin popdown menu, click Heat.
2nd Hour Advance time another hour for a total of 2 hours of hiking. Record osmolarity. Variable Normal 2 HoursOsmolarity (mOsm/L)
It’s likely that the osmolarity swing is making Billy Bob thirsty right now. Check on thirst. Variable Normal 2 HoursThirst (Rate, L/Day)
3rd Hour
Advance time another hour for a total of 3 hours of hiking. Record osmolarity. Variable Normal 3 HoursOsmolarity (mOsm/L)
Observe the changes in body water and water distribution caused by the water loss and osmolarity increase. Variable Normal 3 HoursWhole-Body Osmoles Body H2O (L)
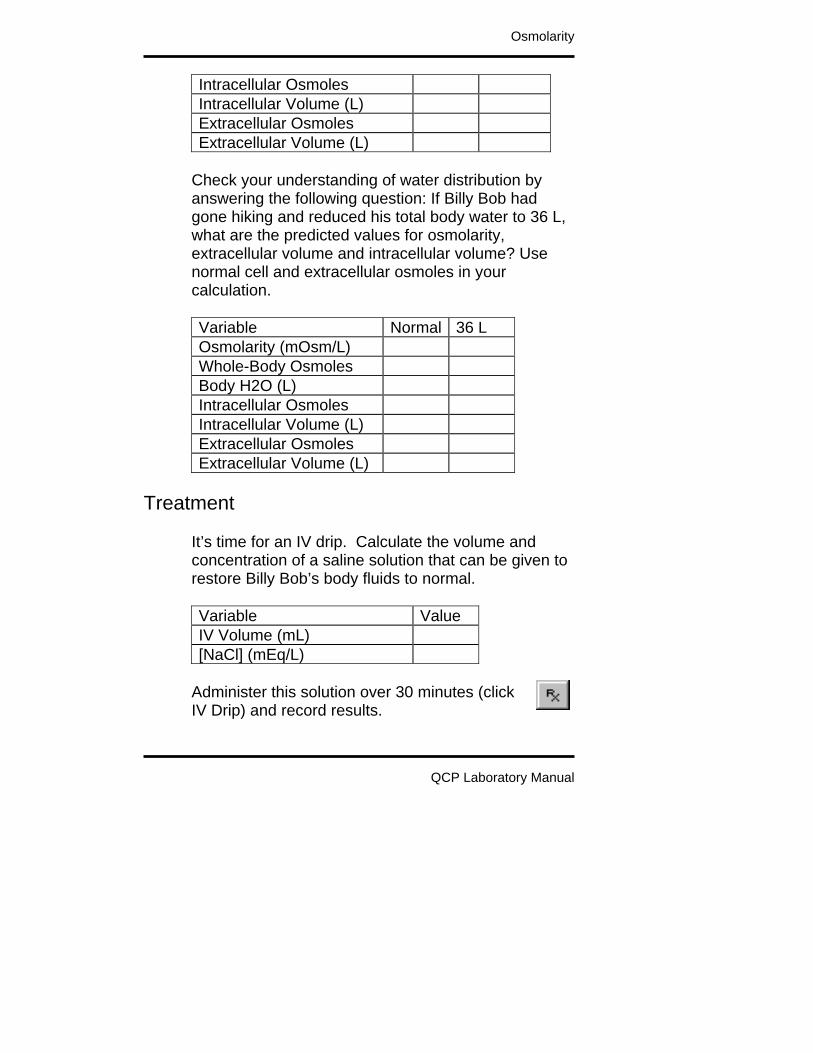
Osmolarity
QCP Laboratory Manual
Intracellular Osmoles Intracellular Volume (L) Extracellular Osmoles Extracellular Volume (L)
Check your understanding of water distribution by answering the following question: If Billy Bob had gone hiking and reduced his total body water to 36 L, what are the predicted values for osmolarity, extracellular volume and intracellular volume? Use normal cell and extracellular osmoles in your calculation. Variable Normal 36 L Osmolarity (mOsm/L) Whole-Body Osmoles Body H2O (L) Intracellular Osmoles Intracellular Volume (L) Extracellular Osmoles Extracellular Volume (L)
Treatment
It’s time for an IV drip. Calculate the volume and concentration of a saline solution that can be given to restore Billy Bob’s body fluids to normal. Variable Value IV Volume (mL) [NaCl] (mEq/L)
Administer this solution over 30 minutes (click IV Drip) and record results.

Osmolarity
QCP Laboratory Manual
Variable Normal Hiking Rx Osmolarity (mOsm/L) Whole-Body Osmoles Body H2O (L) Intracellular Osmoles Intracellular Volume (L) Extracellular Osmoles Extracellular Volume (L)
Check thirst, ADH and kidney function. Is Billy Bob back to normal? If not, why not.

QCP Laboratory Manual
Nephrotic Syndrome
Nephrotic syndrome is characterized by • Loss of protein in the urine.
• Depletion of vascular and extravascular protein.
• Loss of water across capillary walls to form interstitial edema.
• Renal retention of large amounts of salt and water used in creating the edema.
A primary cause of nephrotic syndrome is increased permeability to plasma protein, namely albumin, at the glomerular membrane. Protein loss leads to decreased protein concentration in the plasma and, consequently, decreased plasma colloid osmotic pressure. This alters the Starling forces at the systemic and pulmonary capillaries to increase ultrafiltration. We would also expect decreased colloid pressure to increase glomerular filtration, enhancing sodium excretion. This last response is not observed, leading to the notion that nephrotic syndrome has at least two importance causal components, both involving the glomerular membrane. • Increased protein permeability at the glomerular
membrane.
• Decreased filtration coefficient at the glomerular membrane.
We'll investigate both of these defects in this

Nephrotic Syndrome
QCP Laboratory Manual
laboratory exercise, first separately and then combined. Note that increased sodium reabsorption in the distal tubule and/or collecting has also been implicated in nephrotic syndrome; this possibility will not be explored in this exercise. Use the View main menu selection to place the Nephron Details button on the toolbar.
Protein Loss Click Restart to establish initial conditions. Go to the Glomerular Filtrate box in the Glomerulus panel and slide protein permeability up from none to severe. Go to Urine to observe urinary protein loss. Advance the solution 1 week. Physical units for urinary protein loss are G/Min. Calculate daily loss. ______ G/Min x 1440 = _______ G/Day Go to Circulating Protein and note the changes in vascular and interstitial protein.
Plasma Protein Normal Now Mass (G) 208 Concentration (G/dL) 6.9 Colloid Pressure (mmHg) 28
Interstitial Protein Normal Now

Nephrotic Syndrome
QCP Laboratory Manual
Mass (G) 235 Concentration (G/dL) 2.0 Colloid Pressure (mmHg) 7
Go to Interstitium and note the distribution and movement of extravascular water.
Normal Now Plasma Volume (L) 3.0 Interstitial Volume (L) 12.0 Capillary Filtrate (mL/Min) 1.4 Lymph Flow (mL/Min) 1.0
Go to Glomerulus and note the change in glomerular filtration rate that helped to prevent edema formation. In summary, protein loss has caused some important changes in the body fluids, but it didn't cause significant edema. Keep in mind that rapid edema formation requires a lot of salt and water retention. Note that extreme protein loss is fatal. What do think will be the cause of death?
Sodium Retention Click Restart again to establish initial conditions. Go to the GFR Determinants box in the Glomerulus panel and slide permeability down from 20 to 4. Notice the immediate effect on glomerular filtration rate. Go to Urine to observe urinary sodium excretion. Advance the solution 1 week.

Nephrotic Syndrome
QCP Laboratory Manual
Go to Interstitium and note the distribution and movement of extravascular water.
Normal Now Plasma Volume (L) 3.0 Interstitial Volume (L) 12.0 Capillary Filtrate (mL/Min) 1.4 Lymph Flow (mL/Min) 1.0
Go to Na+ and note the change in extracellular sodium mass. Sodium balance has been reestablished after a modest increase in extracellular sodium.
Extracellular Sodium Normal Now Mass (G) 2170
Over this week, several mechanisms were quietly working to offset the decrease in glomerular membrane permeability. Check on • Arterial pressure at Pressure • Glomerular pressure at Glomerulus • Plasma renin activity at Angiotensin • Atrial natriuretic peptide at Atrial Natriuretic
Peptide • Aldosterone at Aldosterone • Renal nerve activity at Autonomic Efferents
Normal Now Arterial Pressure (mmHg) 97 Glomerular Pressure (mmHg) 60

Nephrotic Syndrome
QCP Laboratory Manual
Plasma Renin Activity 2.0 Atrial Natriuretic Peptide (Art) 26 Aldosterone 300 Renal Nerve Activity 1.5
Nephrotic Syndrome
We will now combine protein loss with sodium retention to create a model of nephrotic syndrome. Click Restart again to establish initial conditions. Go to the Glomerular Filtrate box in the Glomerulus panel and slide protein permeability up from none to severe. Then slide glomerular membrane permeability down from 20 to 4 in the GFR Determinants box. Go to Urine to observe urinary sodium excretion and protein loss. Advance the solution 1 month to capture the full effect. Go to Circulating Protein and note the changes in vascular and interstitial protein.
Plasma Protein Normal Now Mass (G) 208 Concentration (G/dL) 6.9 Colloid Pressure (mmHg) 28
Interstitial Protein Normal Now Mass (G) 235 Concentration (G/dL) 2.0 Colloid Pressure (mmHg) 7
Go to Interstitium and note the distribution and

Nephrotic Syndrome
QCP Laboratory Manual
movement of extravascular water.
Normal Now Plasma Volume (L) 3.0 Interstitial Volume (L) 12.0 Capillary Filtrate (mL/Min) 1.4 Lymph Flow (mL/Min) 1.0
Go to Na+ and note the change in extracellular sodium mass. Again, sodium balance has been reestablished
Extracellular Sodium Normal Now Mass (G) 2170
Wrap up by revisiting the determinants of sodium excretion explored in the previous section.
Normal Now Arterial Pressure (mmHg) 97 Glomerular Pressure (mmHg) 60 Plasma Renin Activity 2.0 Atrial Natriuretic Peptide (Art) 26 Aldosterone 300 Renal Nerve Activity 1.5
In summary, the nephrotic syndrome can show a variety of clinical faces, but the most typical elements are • Protein loss by the kidney that lowers plasma
colloid osmotic pressure and allows loss of salt and water into the interstitium.
• Renal salt and water retention to furnish the

Nephrotic Syndrome
QCP Laboratory Manual
interstitial edema fluid.
References Palmer, B.F. and R.J. Alpern. Pathogenesis of edema formation in the nephrotic syndrome. Kidney Int. Suppl. 59:S21-S27, 1997.

QCP Laboratory Manual
Oxygen Homeostasis
This laboratory exercise examines 5 important components of oxygen delivery:
O2 Supply : High Altitude Blood Oxygenation : Pulmonary Shunt Blood Volume : Hemorrhage The Pump : Myocardial Infarction Blood Flow Distribution : A-V Fistula
The first two components focus on the oxygenation the blood, while the last three focus on transport of oxygen in blood to the tissues that need it. Review exercise tolerance before starting.
O2 Supply : High Altitude
If there is a reduced amount of oxygen in inspired air, all subsequent steps of oxygen delivery are affected. This is evident at high altitude. The body does have some mechanisms that help to cope. Click Restart to reestablish initial conditions. Go to
. In the Altitude box slide the Feet slidebar up to 10,000. Advance the solution 10 minutes. Acutely, focus on effect of altitude on oxygen’s partial pressure and the ability of the body to load arterial hemoglobin. Chronically, focus on compensations that alter the body’s ability to deliver oxygen to the tissues.

Oxygen Homeostasis
QCP Laboratory Manual
Control 10’ ~1 Day ~1 Mon Barometric Pressure
Inspired pO2
Arterial pO2
Arterial O2 Content
Venous pO2
Venous O2 Content
Arterial pCO2
Venous pH
Cardiac Output
Heart Rate
Stroke Volume
Symp Nerves
Plasma Renin
Na+ Excretion
Erythropoietin
Blood Volume
Red Cell Volume
Plasma Volume
Hematocrit
Oxygen Uptake Use an exercise stress test to characterize cardiac function.

Oxygen Homeostasis
QCP Laboratory Manual
Time 0’ 1’ 2’ 3’ 4’ 5’ Speed MPH 0 6 6 6 6 6
Grade 0% 0% 2% 4% 6% 8%
Heart Rate Record the elapsed time and distance when this subject finally gives up. Are the values abnormal? Elapsed Time Min Distance Traveled Ft
Blood Oxygenation : Pulmonary Shunt
Proper oxygenation of blood in the lungs depends on having almost all of the pulmonary blood flow come in contact with well ventilated alveoli. If blood shunts from pulmonary artery to pulmonary vein without contacting working alveoli, the blood in the peripheral circulation will subsequently not be fully oxygenated. Click Restart to reestablish initial conditions and then record control data. Go to . Scroll down to the Hemodynamics box and slide the Basic (Shunt Flow) up to 2000. Advance the solution 10 minutes Acutely, focus on the ability of shunt to alter arterial pO2 and oxygen content.

Oxygen Homeostasis
QCP Laboratory Manual
Control 10’ ~1 Day ~1 Mon Arterial pO2
Arterial O2 Content
Venous pO2
Venous O2 Content
Blood Pressure
Cardiac Output
Heart Rate
Stroke Volume
Symp Nerves
Plasma Renin
Na+ Excretion
Erythropoietin
Blood Volume
Red Cell Volume
Plasma Volume
Hematocrit
Use an exercise stress test to characterize cardiac function. Time 0’ 1’ 2’ 3’ 4’ 5’
Speed MPH 0 6 6 6 6 6
Grade 0% 0% 2% 4% 6% 8%
Heart Rate Record the elapsed time and distance when this subject finally gives up. Are the values abnormal?

Oxygen Homeostasis
QCP Laboratory Manual
Elapsed Time Min Distance Traveled Ft
Blood Volume : Hemorrhage
An adequate cardiac output depends on an adequate blood volume. This is evident in hemorrhage when bloods loss decreases cardiac output and imperils oxygen delivery. Click Restart to reestablish initial conditions and then record the control data. Go to . In the Arterial Hemorrhage box, set Volume to 1000 and Timespan to 10. Click the hemorrhage switch to On and advance the solution 10 minutes. We are interested in the immediate impact of the hemorrhage and the subsequent compensations. Compensations are considered to be fast, medium-term and long-term. Fast compensations are activation of the sympathetic nervous system and increased secretion of renin. When does each have its maximum effect? Use
Autonomic Efferents / Sympathetic Ganglia / Firing Rate as an indicator of sympathetic nerve activity Does this fast response help to maintain blood flow to the brain? The medium-term compensation is renal salt and water retention. When does this have its maximum effect? Note that while blood volume is quickly

Oxygen Homeostasis
QCP Laboratory Manual
restored, red cell volume is not. Keep an eye on hematocrit. The long-term compensation is replacement of the lost erythrocytes. Track erythropoietin as a stimulus and red cell volume as the response.
Control 10’ ~1 Hr ~1 Day ~1 Mon Blood Volume
Red Cell Volume
Plasma Volume
Hematocrit
Arterial Pressure
Cardiac Output
Heart Rate
Stroke Volume
Symp Nerves
Plasma Renin
Na+ Excretion
Erythropoietin
Brain Blood Flow
The Pump : Myocardial Infarction
An adequate cardiac output also requires a strong heart. This is evident after a myocardial infarction when cardiac output is decreased. More importantly, cardiac output and oxygen delivery are often inadequate during physical exertion in these instances.
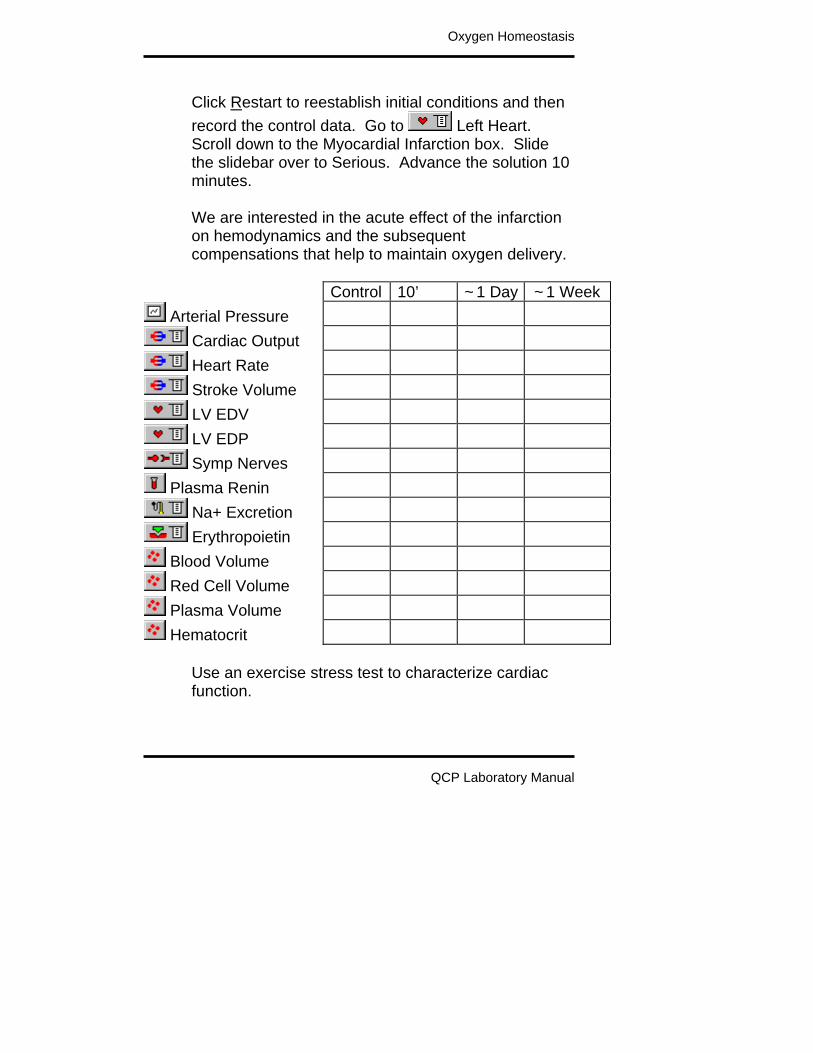
Oxygen Homeostasis
QCP Laboratory Manual
Click Restart to reestablish initial conditions and then record the control data. Go to Left Heart. Scroll down to the Myocardial Infarction box. Slide the slidebar over to Serious. Advance the solution 10 minutes. We are interested in the acute effect of the infarction on hemodynamics and the subsequent compensations that help to maintain oxygen delivery.
Control 10’ ~1 Day ~1 Week Arterial Pressure
Cardiac Output
Heart Rate
Stroke Volume
LV EDV
LV EDP
Symp Nerves
Plasma Renin
Na+ Excretion
Erythropoietin
Blood Volume
Red Cell Volume
Plasma Volume
Hematocrit Use an exercise stress test to characterize cardiac function.

Oxygen Homeostasis
QCP Laboratory Manual
Time 0’ 1’ 2’ 3’ 4’ 5’ Speed MPH 0 6 6 6 6 6
Grade 0% 0% 2% 4% 6% 8%
Heart Rate Record the elapsed time and distance when this subject finally gives up. Are the values abnormal? Elapsed Time Min Distance Traveled Ft
Blood Flow Distribution : A-V Fistula
A normal cardiac output usually means that all organs are getting an adequate supply of oxygen. But there are exceptions. An arterio-venous (A-V) fistula in the peripheral circulation can steal blood flow that usually goes to the body’s organs, for instance. Click Restart to reestablish initial conditions and then collect control data. Go to Conductance. Scroll down to the A-V fistula box. Slide the Size slidebar over to Moderate. Advance the solution 10 minutes.
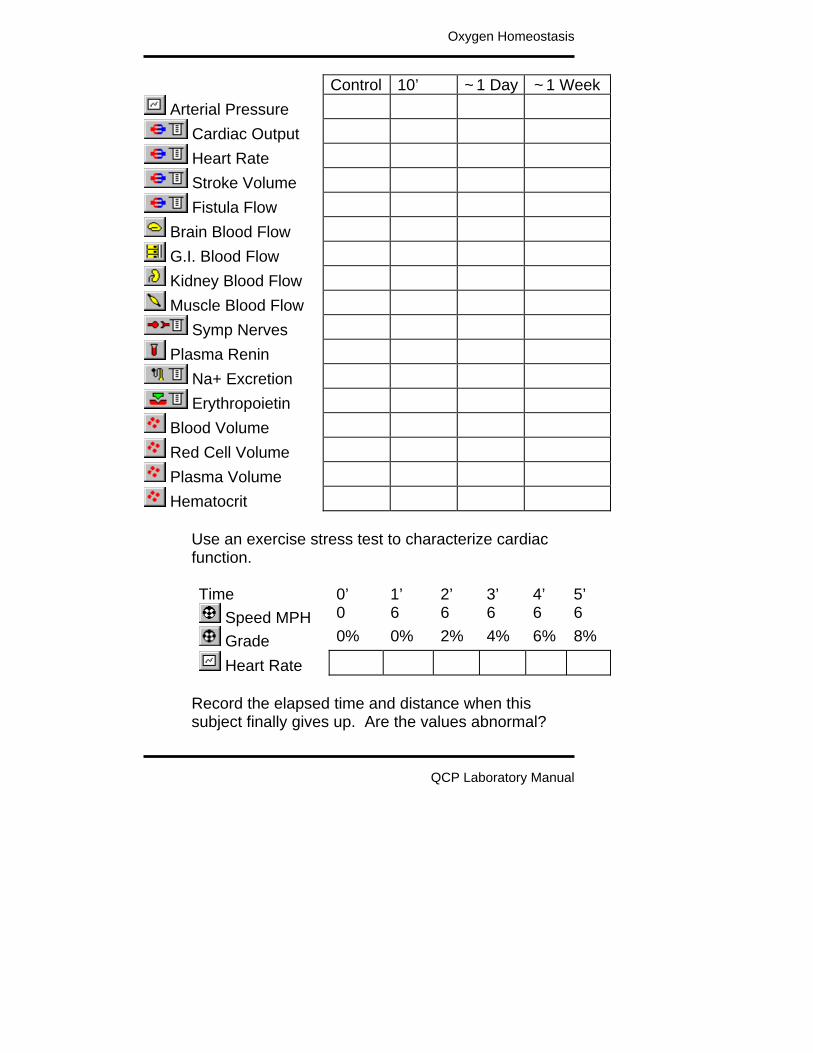
Oxygen Homeostasis
QCP Laboratory Manual
Control 10’ ~1 Day ~1 Week Arterial Pressure
Cardiac Output
Heart Rate
Stroke Volume
Fistula Flow
Brain Blood Flow
G.I. Blood Flow
Kidney Blood Flow
Muscle Blood Flow
Symp Nerves
Plasma Renin
Na+ Excretion
Erythropoietin
Blood Volume
Red Cell Volume
Plasma Volume
Hematocrit Use an exercise stress test to characterize cardiac function. Time 0’ 1’ 2’ 3’ 4’ 5’
Speed MPH 0 6 6 6 6 6
Grade 0% 0% 2% 4% 6% 8%
Heart Rate Record the elapsed time and distance when this subject finally gives up. Are the values abnormal?

Oxygen Homeostasis
QCP Laboratory Manual
Elapsed Time Min Distance Traveled Ft
End
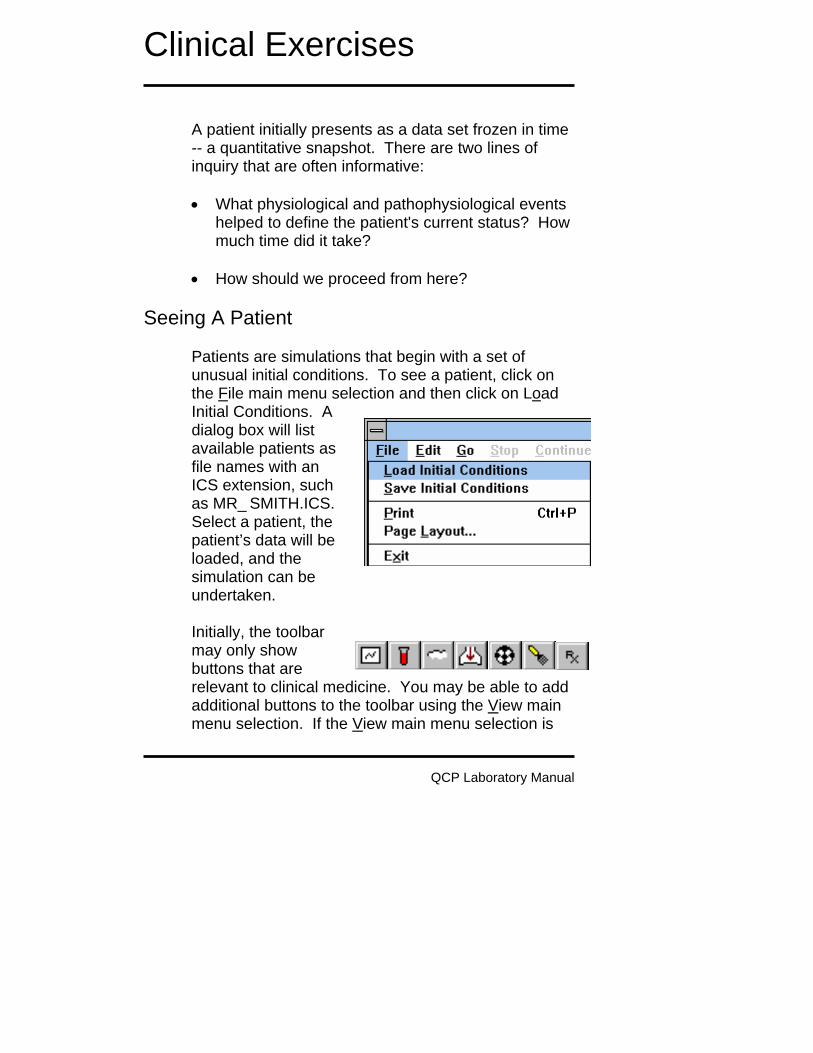
QCP Laboratory Manual
Clinical Exercises
A patient initially presents as a data set frozen in time -- a quantitative snapshot. There are two lines of inquiry that are often informative: • What physiological and pathophysiological events
helped to define the patient's current status? How much time did it take?
• How should we proceed from here?
Seeing A Patient Patients are simulations that begin with a set of unusual initial conditions. To see a patient, click on the File main menu selection and then click on Load Initial Conditions. A dialog box will list available patients as file names with an ICS extension, such as MR_SMITH.ICS. Select a patient, the patient’s data will be loaded, and the simulation can be undertaken. Initially, the toolbar may only show buttons that are relevant to clinical medicine. You may be able to add additional buttons to the toolbar using the View main menu selection. If the View main menu selection is

Clinical Exercises
QCP Laboratory Manual
grayed out, you’re stuck with the initial lineup of toolbar buttons. A brief patient history is presented in the upper left-hand corner of the Charts panel.
Returning To Normal Mr. Norm Subject represents a normal subject. When a patient is loaded, the patient’s initial conditions replace Norm’s initial conditions and the patient history section of the Charts panel is updated. After a patient is loaded, the Restart main menu selection starts the solution again using the patient’s initial conditions.
To re-establish Norm Subject’s initial conditions, click Options / Reset... The default checks are correct. Click OK. If successful, Norm’s thumbnail sketch will reappear on the Charts panel. Norm Subject is your source for normal numerical values.

QCP Laboratory Manual
Mr. Johnson
Load Mr. Johnson (Mr Johnson.ICS) using the File | Load Initial Conditions main menu selection. Is Mr. Johnson OK? Actually, the thumbnail sketch on the Charts panel suggests that he is not OK. He has a lot to complain about including lower body swelling and dyspnea. To get a rough idea of Mr. Johnson’s condition, advance the solution 1 day at a time for a couple of days. Check Mr. Johnson’s blood pressure, heart rate, temperature and respiration using the Monitor
panel. Variable Day 1 Day 2 Day 3 Systolic Blood Pressure (mmHg)
Diastolic Blood Pressure (mmHg)
Heart Rate (/Min) Temperature (deg F)
Respiration Rate (/Min)
Click main menu selection Restart to restart the solution. Attend to Mr. Johnson. Be prepared to discuss the following points. • What is the matter with Mr. Johnson?

Mr. Johnson
QCP Laboratory Manual
• What interventions are possible? Which do you recommend? Can you describe a beneficial course of action?
• What physiological and pathophysiological
mechanisms are causing Mr. Johnson’s condition? • What physiological mechanisms are actually
beneficial to Mr. Johnson’s condition? • What is Starling’s law of the capillary and how
might this apply to Mr. Johnson? • What are the determinants of lymph flow and how
might this apply to Mr. Johnson? • What are some causes of abnormal amounts and
distributions of body fluids and how might this apply to Mr. Johnson?

QCP Laboratory Manual
Mr. Johnson – Instructors Notes
Mr. Johnson has nephrotic syndrome. It’s severe. If you advance the solution for 1 week without intervention, Mr. Johnson develops a fatal case of pulmonary edema. The clinical buttons toolbar group has several useful interventions.
- Dietary salt. - Diuretics - IV drip including protein
Note that steroids are not available. Select View | Basic Physiology to put the basic physiology group of panels on the toolbar.
- Pressures and flows. - Volumes. - Pulmonary edema.
Select View | Orthostasis to put the orthostasis group of panels on the toolbar. These panels show regional interstitial fluid volume, protein concentration and lymph flow. Select View | Nephron Details to put the nephron group of panels on the toolbar. The click on Glomerulus to view the cause to the nephrotic syndrome. Click Urine to see what is being excreted.
Mr. Johnson – Instructor’s Notes
QCP Laboratory Manual
Sodium Retention In Nephrotic Syndrome
Here is the classic picture of nephrotic syndrome. Albumin is lost into the urine. Plasma colloid pressure falls and water shifts from the plasma to the interstitium. Sodium retaining mechanisms are activated by the decreased plasma volume and sodium is retained. The retained sodium leaks into the interstitium and edema forms. But Dorhout Mees noted in 1979 that the typical nephrotic syndrome patient does not show signs of plasma volume contraction and activation of sodium retaining mechanisms. In fact, the opposite is seen. The best evidence comes from serial studies in patients that have episodes of nephrotic syndrome followed by spontaneous remission or favorable response to steroids. In the new picture of nephrotic syndrome, plasma volume and blood volume are expanded, plasma renin activity and aldosterone concentration are normal or decreased (Dorhout Mees et.al., Shapiro et.al.). Glomerular filtration is decreased. Dorhout Mees reported one patient that had a creatinine clearance of 34 mL/Min during nephrotic syndrome and 127 mL/Min during recovery. A water load is excreted slowly during nephrotic syndrome (Shapiro et.al.). Arterial pressure tends to be elevated. The glomerular membrane is a complex tissue, but it appears that protein permeability is increased in nephrotic syndrome while sodium permeability is decreased. Note that albumin is an anion while

Mr. Johnson – Instructor’s Notes
QCP Laboratory Manual
sodium is a cation and the glomerular membrane is normally loaded with negative charges.
Experimental Nephrotic Syndrome. In rats. Puromycin aminonucleoside (PAN) will produce a very good model of nephrotic syndrome in rats following close or systemic infusion. These rats dump albumin and other small proteins as expected. These animals also retain sodium. The whole kidney and single nephron glomerular filtration rates are decreased (Ichikawa et.al.). Sodium excretion as a function of renal perfusion pressure is greatly reduced (Firth et.al.). Firth has a great graph. There is also some evidence for increased distal sodium reabsorption, although the reason is not clear. I need to look into this a bit more.
COP And Na+ Excretion In Normal Kidneys Christine Bayliss, Thomas Maack and other have investigated the effect of colloid osmotic pressure on sodium excretion in normal kidneys. Usually using rats. Decreased colloid osmotic pressure increases glomerular filtration and decreases tubular reabsorption. This two factors combine to net a big increase in sodium excretion, which is basically the opposite of what is seen in nephrotic syndrome.

Mr. Johnson – Instructor’s Notes
QCP Laboratory Manual
Bayliss Amer. J. Physiol. 232:F58-F64, 1977 has some nice data. Some other potentially useful references are: AJP 226:426-430, 1974. AJP 226:512-517, 1974. Pflugers 301:7-15, 1968. Circ. Res. 61:531-538, 1987. Pfluger 306:92-102, 1969. JCI 82:1757-1768, 1988. Kid. Int. 34:220-223, 1988.
Physiological Compensations There may be many important physiological compensations that help to keep the nephrotic syndrome patient alive. I don’t have a big list at this time. Falling plasma protein concentration slows the flux of protein from plasma to interstitium and this helps to keep available protein in the plasma. Falling plasma protein concentration increases the Starling pressure gradient across the capillary wall. This increases the flux of water from plasma to interstitium. Interstitial pressure increases (Noddeland et.al.). Lymph flow increases and washes interstitial protein back into the plasma. Interstitial protein concentration can fall to a very low level (Noddeland et.al., Koomans et.al.) Koomans has a very nice graph..

Mr. Johnson – Instructor’s Notes
QCP Laboratory Manual
These responses in total keep as much of the available protein as possible in the plasma (where it is needed) and not in the interstitium.
References Dorhout Mees, E.J., J.C. Roos, R. Boer, O.H. Yoe and T.A. Simatupang. Observations on edema formation in the nephrotic syndrome in adults with minimal lesions. Amer. J. Med. 67:378-384, 1979, Firth, J.D., A.E.G. Raine and J.G.G. Leddingham. Abnormal sodium handling occurs in the isolated perfused kidney of the nephrotic rat. Clin. Sci. 76:387-395, 1989. Ichikawa, I., H.G. Renke, J.R. Hoyer, K.F. Badr, N. Schor, J.L. Troy, C.P. Lechene and B.M Brenner. Role for intrarenal mechanisms in the impaired salt excretion of experimental nephrotic syndrome. J. Clin. Invest. 71:91-103, 1983. Koomans, H.A., W. Kortlandt, A.B. Geers and E.J. Dorhout Mees. Lowered protein content of tissue fluid in patients with nephrotic syndrome: observations during disease and recovery. Nephron 40:391-395, 1985. Joles, J.A., T.J. Rabelink, B. Braam and H.A. Koomans. Plasma volume regulation: Defences against edema formation (with special emphasis on hypoproteinemia). Am. J. Nephrol. 13:399-412, 1993. Noddeland, H., S.M. Riisnes and H.O. Fadnes. Interstitial fluid colloid osmotic and hydrostatic
Mr. Johnson – Instructor’s Notes
QCP Laboratory Manual
pressures in subcutaneous tissue of patents with nephrotic syndrome. Scand. J. Clin. Lab. Invest. 42:139-146, 1982. Shapiro, M.D., K.M. Nicholls, B.M. Groves and R.W. Schrier. Role of glomerular filtration rate in the impaired sodium and water excretion of patients with the nephrotic syndrome. Amer. J. Kid. Dis. 8:81-87, 1986.

QCP Laboratory Manual
Mr. Johnson – Notes
Mr. Johnson has nephrotic syndrome. It’s severe. If you advance the solution for a couple of days with no intervention, Mr. Johnson develops a fatal case of pulmonary edema.
Creating Mr. Johnson Mr. Johnson was created simply by increasing glomerular membrane protein permeability and letting a suitable amount of time go by. The variable “Glomerulus, Protein Permeability” was increased from 0 (Normal) to 0.5 (Severe) and the solution was advanced 2 weeks. Then permeability was increased to 1.0 (Very Severe) and the solution was advanced 2 more weeks. Finally, permeability was set to 2.0 (Extreme) with 2 more weeks. At this point, Mr. Johnson is starting to develop pulmonary edema. I could have added some impaired sodium excretion (see discussion below) but, as you can see, it really isn’t necessary.
Useful Displays The clinical buttons toolbar group has several useful interventions.
- Dietary salt. - Diuretics - IV drip including protein

Mr. Johnson – Notes
QCP Laboratory Manual
Note that steroids are not available. Select View | Basic Physiology to put the basic physiology group of panels on the toolbar.
- Pressures and flows. - Volumes. - Pulmonary edema.
Select View | Orthostasis to put the orthostasis group of panels on the toolbar. These panels show regional interstitial fluid volume, protein concentration and lymph flow. Select View | Nephron Details to put the nephron group of panels on the toolbar. The click on Glomerulus to view the cause to the nephrotic syndrome. Click Urine to see what is being excreted.
Edema Formation Edema can be severe in nephrotic syndrome, with extracellular fluid volume increasing to two or more times normal (Koomans et.al. 1986). Check Mr. Johnson’s body weight at the Charts panel. It takes a lot of renal salt and water retention to generate the large amounts of edema fluid filling the interstitium.
Mr. Johnson – Notes
QCP Laboratory Manual
Sodium Retention In Nephrotic Syndrome Here is the classic picture of nephrotic syndrome. Albumin is lost into the urine. Plasma colloid pressure falls and water shifts from the plasma to the interstitium. Sodium retaining mechanisms are activated by the decreased plasma volume and sodium is retained. The retained sodium leaks into the interstitium and edema forms. But Dorhout Mees noted in 1979 that the typical nephrotic syndrome patient does not show signs of plasma volume contraction and activation of sodium retaining mechanisms. In fact, the opposite is seen. The best evidence comes from serial studies in patients that have episodes of nephrotic syndrome followed by spontaneous remission or favorable response to steroids. In the new picture of nephrotic syndrome, plasma volume and blood volume are expanded, plasma renin activity and aldosterone concentration are normal or decreased (Dorhout Mees et.al., Shapiro et.al.). Glomerular filtration is decreased. Dorhout Mees reported one patient that had a creatinine clearance of 34 mL/Min during nephrotic syndrome and 127 mL/Min during recovery. A water load is excreted slowly during nephrotic syndrome (Shapiro et.al.). Arterial pressure tends to be elevated. The glomerular membrane is a complex tissue, but it appears that protein permeability is increased in nephrotic syndrome while sodium permeability is decreased. Note that albumin is an anion while

Mr. Johnson – Notes
QCP Laboratory Manual
sodium is a cation and the glomerular membrane is normally loaded with negative charges.
Experimental Nephrotic Syndrome. In rats. Puromycin aminonucleoside (PAN) will produce a very good model of nephrotic syndrome in rats following close or systemic infusion. These rats dump albumin and other small proteins as expected. These animals also retain sodium. The whole kidney and single nephron glomerular filtration rates are decreased (Ichikawa et.al.). Sodium excretion as a function of renal perfusion pressure is greatly reduced (Firth et.al.). Firth has a great graph. There is also some evidence for increased distal sodium reabsorption, although the reason is not clear. I need to look into this a bit more.
COP And Na+ Excretion In Normal Kidneys Christine Bayliss, Thomas Maack and other have investigated the effect of colloid osmotic pressure on sodium excretion in normal kidneys. Usually using rats. Decreased colloid osmotic pressure increases glomerular filtration and decreases tubular reabsorption. This two factors combine to net a big increase in sodium excretion, which is basically the opposite of what is seen in nephrotic syndrome.

Mr. Johnson – Notes
QCP Laboratory Manual
Bayliss Amer. J. Physiol. 232:F58-F64, 1977 has some nice data. Some other potentially useful references are: AJP 226:426-430, 1974. AJP 226:512-517, 1974. Pflugers 301:7-15, 1968. Circ. Res. 61:531-538, 1987. Pfluger 306:92-102, 1969. JCI 82:1757-1768, 1988. Kid. Int. 34:220-223, 1988.
Physiological Compensations There are many important physiological compensations that help to keep the nephrotic syndrome patient alive. Blood volume tends to be elevated slightly and in proportion to the extracellular fluid volume expansion. Decreased plasma colloid pressure leads to increased capillary ultrafiltration. But falling plasma protein concentration slows the flux of protein from plasma to interstitium and this helps to keep available protein in the plasma. Falling plasma protein concentration increases the Starling pressure gradient across the capillary wall. This increases the flux of water from plasma to interstitium. Interstitial fluid pressure increases (Noddeland et.al. 1982). Lymph flow increases and washes interstitial protein back into the plasma. Interstitial protein concentration can fall to a very low

Mr. Johnson – Notes
QCP Laboratory Manual
level (Noddeland et.al. 1982, Koomans et.al. 1985) Koomans has a very nice graph.. Protein washout moves the available protein to the plasma where it is needed. But also, protein washout and the resultant decrease in interstitial colloid pressure (Koomans et.al. 1985) modifies the capillary Starling forces, opposing the increased capillary ultrafiltration. These responses in total keep as much of the available protein as possible in the plasma and not in the interstitium, but the price, of course, is that severe edema develops.
References Dorhout Mees, E.J., J.C. Roos, R. Boer, O.H. Yoe and T.A. Simatupang. Observations on edema formation in the nephrotic syndrome in adults with minimal lesions. Amer. J. Med. 67:378-384, 1979, Firth, J.D., A.E.G. Raine and J.G.G. Leddingham. Abnormal sodium handling occurs in the isolated perfused kidney of the nephrotic rat. Clin. Sci. 76:387-395, 1989. Ichikawa, I., H.G. Renke, J.R. Hoyer, K.F. Badr, N. Schor, J.L. Troy, C.P. Lechene and B.M Brenner. Role for intrarenal mechanisms in the impaired salt excretion of experimental nephrotic syndrome. J. Clin. Invest. 71:91-103, 1983. Koomans, H.A., B. Braam, A.B. Geers, J.C. Roos, and E.J. Dorhout Mees. The importance of plasma

Mr. Johnson – Notes
QCP Laboratory Manual
protein for blood volume and blood pressure homeostasis. Kid. Int. 30:730-735, 1986. Koomans, H.A., W. Kortlandt, A.B. Geers and E.J. Dorhout Mees. Lowered protein content of tissue fluid in patients with nephrotic syndrome: observations during disease and recovery. Nephron 40:391-395, 1985. Joles, J.A., T.J. Rabelink, B. Braam and H.A. Koomans. Plasma volume regulation: Defenses against edema formation (with special emphasis on hypoproteinemia). Am. J. Nephrol. 13:399-412, 1993. Noddeland, H., S.M. Riisnes and H.O. Fadnes. Interstitial fluid colloid osmotic and hydrostatic pressures in subcutaneous tissue of patents with nephrotic syndrome. Scand. J. Clin. Lab. Invest. 42:139-146, 1982. Shapiro, M.D., K.M. Nicholls, B.M. Groves and R.W. Schrier. Role of glomerular filtration rate in the impaired sodium and water excretion of patients with the nephrotic syndrome. Amer. J. Kid. Dis. 8:81-87, 1986.

QCP Laboratory Manual
Ms. Lake
Load Ms. Lake (MS_LAKE.ICS) using the File / Load Initial Conditions main menu selection. Is Ms. Lake OK? In her thumbnail sketch on the Charts panel, she complains of headaches, but that is not very informative. Check Ms. Lake’s blood pressure, heart rate, temperature and respiration using the Monitor panel. Normal values were taken from Norm Subject. Variable Ms. Lake N. Subject Units Blood Pressure
120 / 81 mmHg
Heart Rate 73 Beats / Min Temperature 98.8 degree F Respiration Rate
12 Breaths / Min
Ms. Lake is presenting with a fairly high blood pressure.
Blood Chemistry Its time for some blood chemistry. Go to the Blood And Urine Samples panel. Get venous blood gases. Click Take Sample Now in the Venous Blood Gases box. Is there evidence of an acid/base disturbance? Variable Ms. Lake N. Subject Units

Ms. Lake
QCP Laboratory Manual
pCO2 42 mmHg pH 7.40 pH Units [H+] 40 pMol/L [HCO3-] 28 mEq/L
Check blood electrolytes. Click Take Sample Now in the Venous Blood Sample box. Are the blood electrolytes normal? Variable Ms. Lake N. Subject Units [Na+] 145 mEq/L [K+] 4.4 mEq/L [Cl-] 108 mEq/L [BUN] 13 mG/dL [Protein] 6.9 G/dL Osmolarity 292 mOsm/LHematocrit 44 %
The plasma [K+] value is a bit worrisome. We may return to this matter later.
Invasive Studies Use the View / Basic Physiology and Nephron Details main menu selections to install the basic physiology and nephron toolbar buttons. Several clinical studies indicate that most patients with hypertension present with elevated arterial pressure and elevated vascular resistance but normal cardiac output. Go to Pressure and record mean arterial pressure. Then go to Flow and record cardiac

Ms. Lake
QCP Laboratory Manual
output. Finally, go to Conductance and record total peripheral resistance. Variable Ms. Lake N. Subject Units Mean Arterial Pressure
97 mmHg
Cardiac Output 5360 mL/Min Peripheral Resistance
0.018 mmHg/ (mL/Min)
What are the percent changes in pressure, flow and resistance? Pressure change is ______ %. Cardiac output change is ______ %. Peripheral resistance change is ______ %. Ms. Lake seems pretty typical.
Sodium Balance We may learn something from Ms. Lake's sodium balance. Go to the Diet panel and note Ms. Lake's daily sodium intake. Then go to the Urine panel and note Ms. Lake's rate of Na+ excretion. Na+ ______ mEq/Min x 1440 = ______ mEq/Day Variable Ms. Lake N. Subject Units Na+ Intake 180 mEq/Day Na+ Output 180 mEq/Day
Two questions must be answered.

Ms. Lake
QCP Laboratory Manual
• Is Ms. Lake in sodium balance? • Is Ms. Lake on a high, normal or low sodium diet? Increased extracellular Na+ mass may be contributing to Ms. Lake's hypertension. Go to Na+ and note the Na+ mass. Variable Ms. Lake N. Subject Units ECFV Na+ Mass
2150 mEq
What is a reasonable diagnosis at this point?
Hormones In The Blood An examination of some blood hormones may be beneficial. Go to Blood Chemistry and examine the relevant concentrations. Variable Ms. Lake N. Subject Units [AII] 20 mEq/Day Renin 2.0 GU [Aldo] 330 pMol/L [ADH] 2.0 pG/mL [ANP] 20 pMol/L
Considering that Ms. Lake is taking a fairly salt rich diet, her concentrations for renin and angiotensin are very, very high. What is a reasonable diagnosis now?

Ms. Lake
QCP Laboratory Manual
Renin vs. Salt A decreased salt intake stimulates renal renin secretion. This increases plasma renin and angiotensin levels. Increased angiotensin decreases renal blood flow and increases sodium reabsorption, helping to conserve sodium and maintain sodium balance. Increased angiotensin also produces peripheral vasoconstriction which helps to maintain arterial pressure. An increased sodium intake inhibits renin secretion which promotes renal sodium excretion and peripheral vasodilation. This reciprocal relationship between sodium intake and renin is plotted below for Norm Subject. It is roughly a hyperbola.
PlasmaReninActivity
(GU/mL)
Sodium Intake (mEq/Day)
0
2
4
6
0 100 200 300
Plot Ms. Lake's data on this graph. Thus, Ms. Lake's plasma renin activity is inappropriately high for the amount of sodium in her diet.

Ms. Lake
QCP Laboratory Manual
Therapy
To lower Ms. Lake's blood pressure, we might consider decreased sodium intake, blocking the formation of angiotensin or both. First, lowered sodium intake. Go to Diet and slide table salt down to 40 mMol/Day. Go to Monitor to monitor blood pressure changes. Advance the solution 1 week. Variable Day 1 Day 8 Units Blood Pressure mmHg
In addition to blood pressure, check on changes in plasma renin activity, plasma angiotensin concentration and extracellular sodium mass. It appears that decreased sodium intake decreased extracellular sodium mass while also stimulating more renin secretion. The net result was little change in blood pressure. Note the narrowing of pulse pressure. What caused that? Next we'll block angiotensin formation. Click Restart to reestablish Ms. Lake's initial conditions. Then go to
Blockers and slide AII converting enzyme inhibition up to 70%. Again, go to Monitor to monitor blood pressure changes. Advance the solution 1 week. Variable Day 1 Day 8 Units Blood Pressure mmHg
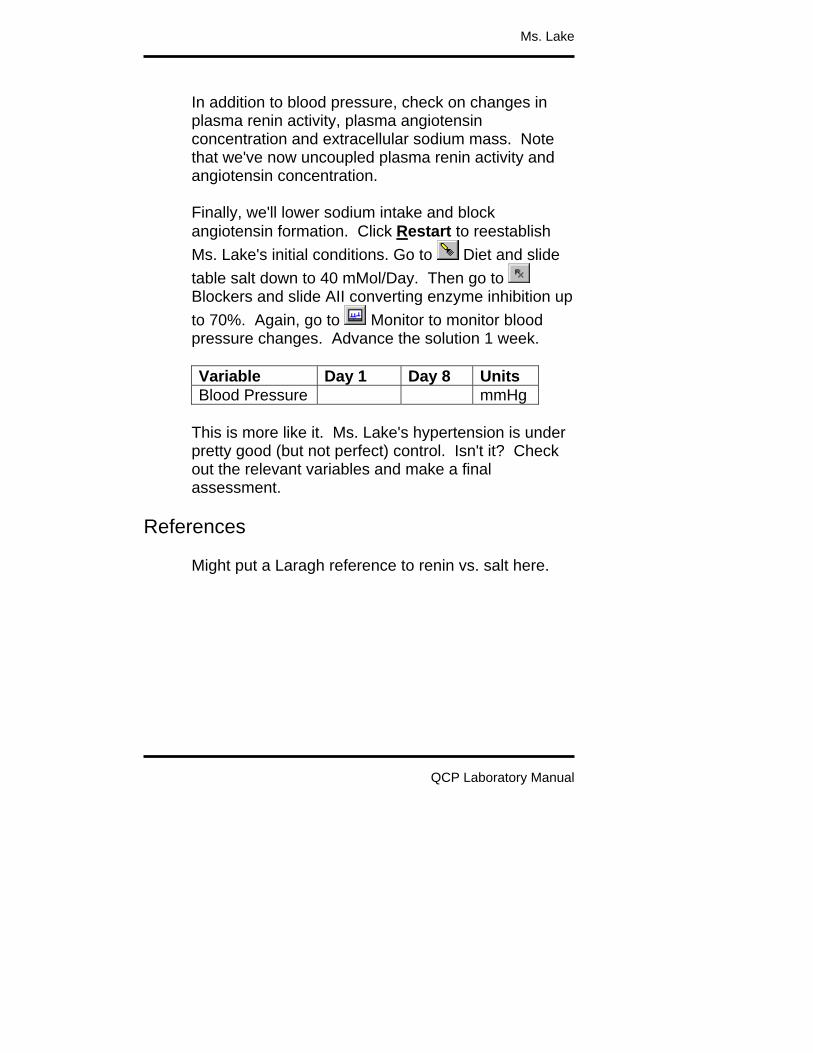
Ms. Lake
QCP Laboratory Manual
In addition to blood pressure, check on changes in plasma renin activity, plasma angiotensin concentration and extracellular sodium mass. Note that we've now uncoupled plasma renin activity and angiotensin concentration. Finally, we'll lower sodium intake and block angiotensin formation. Click Restart to reestablish Ms. Lake's initial conditions. Go to Diet and slide table salt down to 40 mMol/Day. Then go to Blockers and slide AII converting enzyme inhibition up to 70%. Again, go to Monitor to monitor blood pressure changes. Advance the solution 1 week. Variable Day 1 Day 8 Units Blood Pressure mmHg
This is more like it. Ms. Lake's hypertension is under pretty good (but not perfect) control. Isn't it? Check out the relevant variables and make a final assessment.
References Might put a Laragh reference to renin vs. salt here.

QCP Laboratory Manual
Ms. Lake - Notes
Ms. Lake’s thumbnail sketch notes that she claims to be in good health but gets too many headaches. In fact, Ms. Lake has severe hypertension caused by a renin secreting tumor and elevated table salt intake.
Creating Ms. Lake The renin secreting tumor is turned on and intake of table salt is increased. The new parameter values are:
“Renin Secretion, Tumor Secretion” = 1000.0 “Diet Goal, Table Salt (mMol/Day)” = 260.0
The units for tumor renin secretion are GU (Goldblatt Units)/Min. Tumor secretion is displayed at the bottom of the Angiotensin panel. Then the solution was advanced for 1 month (43200 minutes). Ms. Lake is ready.
Recap This is a case of high blood pressure with elevated total peripheral resistance. The subject was in sodium balance on a moderately high sodium diet with extracellular sodium mass normal to slightly expanded. In such a setting, we
Ms. Lake
QCP Laboratory Manual
would expect plasma renin and angiotensin concentrations to be significantly lower than normal. But renin and angiotensin were markedly above normal. Blocking angiotensin formation in combination with decreased sodium intake created a natriuresis and brought blood pressure down to close to normal.
Postscript What was really wrong with Ms. Lake? Go to Angiotensin and scroll to the bottom of the panel.

QCP Laboratory Manual
Ms. Lake Wrap-up Summary
This is a case of high blood pressure with elevated total peripheral resistance. The subject was in sodium balance on a moderately high sodium diet with extracellular sodium mass normal to slightly expanded. In such a setting, we would expect plasma renin and angiotensin concentrations to be significantly lower than normal. But renin and angiotensin were markedly above normal. Blocking angiotensin formation in combination with decreased sodium intake created a natriuresis and brought blood pressure down to close to normal.
Postscript What was really wrong with Ms. Lake? Go to Angiotensin and scroll to the bottom of the panel.
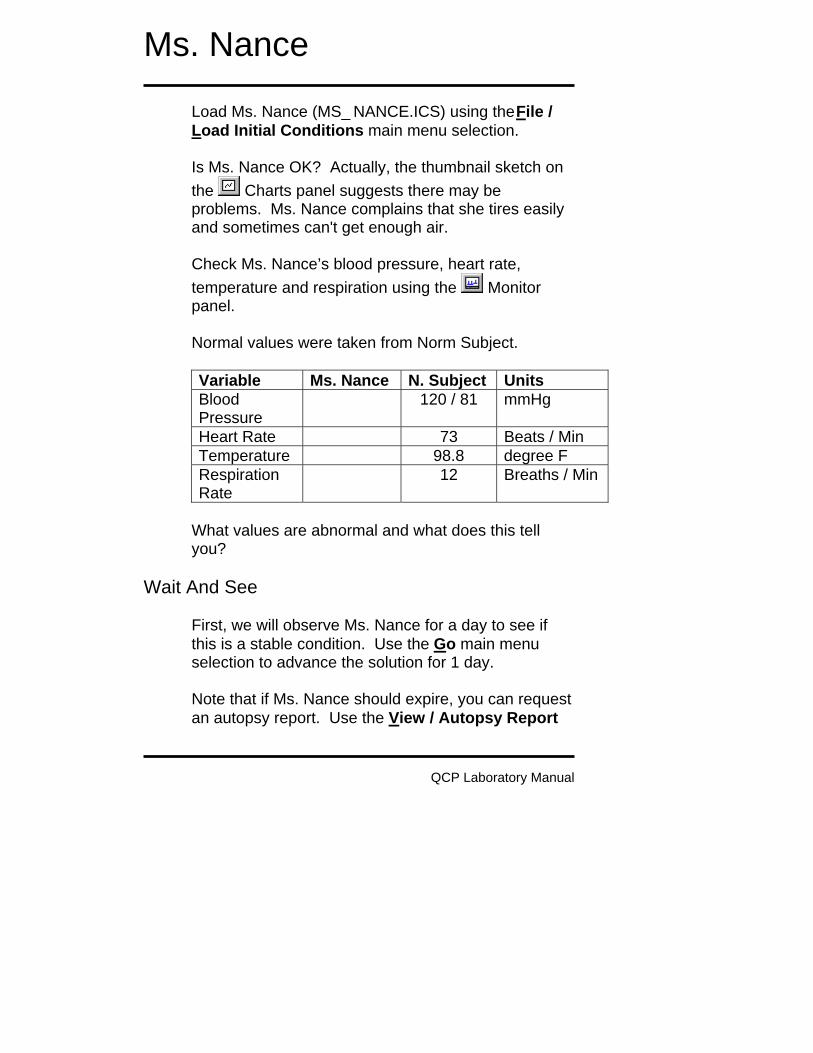
QCP Laboratory Manual
Ms. Nance
Load Ms. Nance (MS_NANCE.ICS) using the File / Load Initial Conditions main menu selection. Is Ms. Nance OK? Actually, the thumbnail sketch on the Charts panel suggests there may be problems. Ms. Nance complains that she tires easily and sometimes can't get enough air. Check Ms. Nance’s blood pressure, heart rate, temperature and respiration using the Monitor panel. Normal values were taken from Norm Subject. Variable Ms. Nance N. Subject Units Blood Pressure
120 / 81 mmHg
Heart Rate 73 Beats / Min Temperature 98.8 degree F Respiration Rate
12 Breaths / Min
What values are abnormal and what does this tell you?
Wait And See First, we will observe Ms. Nance for a day to see if this is a stable condition. Use the Go main menu selection to advance the solution for 1 day. Note that if Ms. Nance should expire, you can request an autopsy report. Use the View / Autopsy Report

Ms. Nance
QCP Laboratory Manual
main menu selection to install the autopsy report toolbar button. Then click Autopsy Report.
Blood Chemistry It appears the Ms. Nance has a serious problem. We'll start over. Click the Restart main menu selection to restart Ms. Nance. Blood chemistry may be helpful. Go to the Blood And Urine Samples panel. Check blood electrolytes. Click Take Sample Now in the Venous Blood Sample box. Are the blood electrolytes normal? Variable Ms. Nance N. Subject Units [Na+] 145 mEq/L [K+] 4.4 mEq/L [Cl-] 108 mEq/L [BUN] 13 mG/dL [Protein] 6.9 G/dL Osmolarity 292 mOsm/LHematocrit 44 %
Get arterial blood gases. Click Take Sample Now in the Arterial Blood Gases box. Are there abnormal values here? Variable Ms. Nance N. Subject Units pO2 94 mmHg [O2] 0.20 mL/mL Saturation 98 % pCO2 38 mmHg

Ms. Nance
QCP Laboratory Manual
pH 7.44 pH Units [H+] 36 pMol/L [HCO3-] 26 mEq/L
What is a possible connection between the arterial blood values observed above and our initial observation of respiratory rate? Get venous blood gases. Click Take Sample Now in the Venous Blood Gases box. Are there abnormal values here? Variable Ms. Nance N. Subject Units pO2 39 mmHg [O2] 0.15 mL/mL Saturation 73 % pCO2 43 mmHg pH 7.39 pH Units [H+] 41 pMol/L [HCO3-] 27 mEq/L
Exercise Tolerance
Next we will evaluate Ms. Nance's tolerance to exercise. We'll use the treadmill and gradually increase the slope or grade of the belt.

Ms. Nance
QCP Laboratory Manual
Time (Min)
TreadmillGrade(%)
8
6
42
00 21 3 4 5
The protocol (shown above) is to advance the solution for 1 minute at each treadmill grade and to record heart rate at the end of the minute. Then increase the treadmill grade and repeat until either the protocol is complete or Ms. Nance stops exercising. Record Ms. Nance's initial, or resting, heart rate in the table below (at 0’). Then go to Exercise. Set exercise type to treadmill. Set treadmill speed to 6 MPH. Initially set treadmill grade to 0%. Advance the solution for 1 minute. Record heart rate. Increase the treadmill grade and repeat. Norm S. = Heart rate data for Norm Subject. X = Could not complete the protocol. Time 0’ 1’ 2’ 3’ 4’ 5’
Speed 0 6 6 6 6 6
Grade 0% 0% 2% 4% 6% 8%
Norm S. 73 124 137 142 X X
Heart Rate

Ms. Nance
QCP Laboratory Manual
Invasive Studies
Use the View / Basic Physiology and Nephron Details main menu selections to install the basic physiology and nephron toolbar buttons. Click the Restart main menu selection to restart Ms. Nance. Go to Flow and record cardiac output, stroke volume and heart rate. This is clearly a low flow condition caused by a diminished stroke volume. Variable Ms. Nance N. Subject Units Cardiac Output 5360 mL/Min Stroke Volume 73 mL Heart Rate 73 /Min
Various Blood Pressures
Go to Pressure and record the blood pressures at various locations in the circulation. Variable Ms. Nance N. Subject Units Syst. Arteries. 97 mmHg Perph. Veins 7.3 mmHg Portal Vein 8 mmHg Right Atrium 0.3 mmHg Pulm. Artery 13 mmHg Pulm. Caps 9 mmHg Pulm. Vein. 5.7 mmHg Left Atrium 3.7 mmHg

Ms. Nance
QCP Laboratory Manual
Pressures in the systemic circulation and right atrium are not entirely normal, but seem to be OK. In contrast, pressures in the pulmonary circulation and left atrium are markedly elevated. There are 2 stories developing here:
• There is something seriously wrong with Ms. Nance's left heart.
• There is a threat that pulmonary edema might develop.
Pressure And Volume In The Left Heart
Go to Pumping and note the end-diastolic (ED) and end-systolic (ES) pressures and volumes. Calculate or observe Ms. Nance's ejection fraction. Variable Ms. Nance N. Subject Units EDP 3.2 mmHg EDV 121 mL ESP 123 mmHg ESV 48 mL Stroke Volume 73 mL Ejection Fraction 61 %
What is your diagnosis at this point? Have you considered stenosis of the aortic valve? Why.
Left Heart Contractility And Coronary Flow Go to Muscle and note myocardial contractility and the effect of pH on contractility.

Ms. Nance
QCP Laboratory Manual
Variable Ms. Nance N. Subject Units Contractility 0.018 mmHg/mL pH Effect 1.0 x Normal
We're getting close to an explanation. Use the View / Organ Details main menu selection to install the organ details toolbar buttons. Go to (yellow heart) Circulation and note the blood flow to the left heart. Go to Metabolism and note the metabolic rate, tissue pH and tissue lactate concentration. Variable Ms. Nance N. Subject Units Blood Flow 180 mL/Min Metabolic Rate 129 Cal/Min pH 6.98 mmHg [Lac-] 2.0 mEq/L
We are looking at a failing, acidotic, somewhat anaerobic left heart.
Salt And Water Balance Salt and water retention is often an integral part of heart failure. We'll check on Ms. Nance. Go to Diet and note daily sodium intake. Then go to Urine and note sodium excretion rate. Na+ Output ____ mEq/Min x 1440 = ____ mEq/Day

Ms. Nance
QCP Laboratory Manual
Variable Ms. Nance N. Subject Units Na+ Intake 180 mEq/DayNa+ Output 180 mEq/Day
There is a major sodium imbalance here. Where is that sodium going?
Body Fluids The sodium picture above suggests that one or more volumes in the body are abnormal. Go to Blood Volume and note the volume and composition of the blood.
Variable Ms. Nance N. Subject Units Blood Volume 5400 mL Red Cells 2400 mL Plasma Volume 3000 mL
Go to Water and record the volumes of important body fluid compartments.
Variable Ms. Nance N. Subject Units Total Body H2O 43.2 L ECFV 15.0 L Plasma 3.0 L Interstitium 12.0 L Excess Lung 0.0 L Ascites 0.0 L Cell H2O 28.2 L
The picture is now getting clearer. It appears that Ms. Nance's kidney is avidly retaining salt and water and

Ms. Nance
QCP Laboratory Manual
much of this salt and water, in turn, is spilling into the lungs. Our last stop will be the pulmonary capillaries.
Pulmonary Capillaries Go to Lung Fluids and note the hydrostatic pressure in the capillaries and the colloid osmotic pressure.
Variable Ms. Nance N. Subject Units Hydrostatic Pressure
9 mmHg
Plasma COP 28 mmHg Filtration 0 mL/Min
The long-term problem then is heart failure, while the acute problem is the formation of pulmonary edema.
Treatment Create a treatment strategy that stabilizes (or possibly improves) Ms. Nance's condition over 1 month. Diuretics, digitalis and other treatments are available at and . Gas can be administered at Air Supply. Changes in environment and diet might also be considered.

QCP Laboratory Manual
Ms. Nance - Notes
Ms. Nance’s thumbnail sketch notes that she’s tired and can’t get enough air. In fact, Ms. Nance is in heart failure.
Creating Ms. Nance This is a new look Ms. Nance who shows weight gain, peripheral edema, and the start of pulmonary edema. She has bilateral dysfunction that has both systolic and diastolic components. The new parameter values are:
“Right Heart Contractility, Basic (%)” = 50.0 “Right Heart Pumping, Stiffness” = 0.0132 “Left Heart Contractility, Basic (%)” = 50.0 “Left Heart Pumping, Stiffness” = 0.0227
Advance the solution 2 weeks (20160 minutes). Ms. Nance is ready.
Recap Chronic bilateral heart failure impaired diastolic filling and impaired systolic ejection. This lowers stroke volume, cardiac output and arterial pressure. The kidneys retain salt and water, expanding blood and interstitial volume. Expanded blood volume and redistribution of blood volume enhance left ventricular filling. This, in turn,

Ms. Nance - Notes
QCP Laboratory Manual
increases stroke volume, which is small but otherwise would be even smaller. The left and right ventricles operate at increased end-diastolic and end-systolic volumes and a reduced ejection fraction. Increased left and right heart filling pressure is possible only when blood pressure is increased in all of the pulmonary circulation and in the peripheral veins. When blood pressure in the pulmonary capillaries exceeds colloid osmotic pressure in the blood, fluid rapidly ultrafilters into the lungs. This pulmonary edema impairs the diffusion of O2 and CO2 in the lungs and also decreases tidal volume. Blood pO2 falls and deterioration is rapid. Increased pressure in the peripheral veins leads to the formation of ascites.
QCP Laboratory Manual
Ms. Nance Wrap-up Summary
Chronic (left side) heart failure lowers stroke volume, cardiac output and arterial pressure. The kidneys retain salt and water, expanding blood volume. Expanded blood volume and redistribution of blood volume enhance left ventricular filling. This, in turn, increases stroke volume, which is small but otherwise would be even smaller. The left ventricle operates at increased end-diastolic and end-systolic volumes and a reduced ejection fraction. Increased left heart filling pressure is possible only when blood pressure is increased in all of the pulmonary circulation. When blood pressure in the pulmonary capillaries exceeds colloid osmotic pressure in the blood, fluid rapidly ultrafilters into the lungs. This pulmonary edema impairs the diffusion of O2 and CO2 in the lungs and also decreases tidal volume. Blood pO2 falls and deterioration is rapid.
Postscript Ms. Nance's condition was caused by atherosclerosis in the coronary vessels feeding her left heart. Go to (yellow heart) Circulation and note the value of large vessel conductance. A normal value is 20.

QCP Laboratory Manual
Mr. Parks
Load Mr. Parks (MR_PARKS.ICS) using the File / Load Initial Conditions main menu selection. Is Mr. Parks OK? Actually, the thumbnail sketch on the Charts panel suggests that he is not OK. Check Mr. Parks’ blood pressure, heart rate, temperature and respiration using the Monitor panel. Normal values were taken from Norm Subject. Variable Mr. Parks N. Subject Units Blood Pressure
120 / 81 mmHg
Heart Rate 73 Beats / Min Temperature 98.8 degree F Respiration Rate
12 Breaths / Min
Estimating Cardiac Output
We'll use some basic hemodynamic concepts in this section to make an estimate of Mr. Park's cardiac output (See G&H, pp. 152 - 156). Variable Symbol Units Cardiac Output CO mL/Min Heart Rate HR /Min Stroke Volume SV mL Pulse Pressure PP mmHg Proportionality K mL/mmHg

Mr. Parks
QCP Laboratory Manual
Cardiac output is equal to heart rate multiplied by stroke volume. CO = HR * SV (1) We can observe heart rate at this point but not stroke volume. But, pulse pressure is proportional to stroke volume for each cardiac ejection -- and we can observe pulse pressure. Equation (1) is modified to get CO = HR * K * PP (2) The proportionality constant K is currently unknown. We will take data from Norm Subject to apply to Mr. Parks, hoping that these two have roughly the same arterial compliance. Symbol Value Units CO 5368 mL/Min HR 73 /Min PP 39 mmHg K 1.9 mL/mmHg
Solving Equation (2) for K using Norm Subject's data yields a value for K of 1.9. Use this value of K and Mr. Parks hemodynamic data to estimate his cardiac output. Variable Value Units Pulse Pressure mmHg Proportionality 1.9 mL/mmHg Heart Rate /Min Cardiac Output mL/Min

Mr. Parks
QCP Laboratory Manual
At this point, what is your preliminary diagnosis? Why?
Invasive Hemodynamics Use the View / Basic Physiology main menu selection to install the basic physiology toolbar buttons. Select the Blood Flow panel and read Mr. Parks' true stroke volume and cardiac output. Variable Value N. Subject Units Stroke Volume
73 mL
Cardiac Output
5368 mL/Min
Select the Blood Volume panel and read Mr. Parks' blood volume. Variable Mr. Parks N. Subject Units Blood Volume
5400 mL
Red Cell Volume
2400 mL
Plasma Volume
3000 mL
Hematocrit 44 %
Acute Compensations

Mr. Parks
QCP Laboratory Manual
Hemorrhage elicits a variety of compensations that help to maintain blood flow to vital organs by supporting blood pressure and redistributing flow toward vital organs (See G&H, Chapter 24). We'll consider two here: increased autonomic nerve activity and increased plasma angiotensin concentration. Select the Autonomic Efferents panel and read general and kidney autonomic firing rates. Select the Angiotensin panel and read the plasma angiotensin concentration. Variable Mr. Parks N. Subject Units General Autonomic Firing Rate
1.5 Hz
Renal Autonomic Firing Rate
1.5 Hz
Plasma [AII] 20 pG/mL Time permitting, you might try blocking the increase in autonomic activity and increase in plasma angiotensin to obtain an indication of their effect on arterial pressure. To block (alpha) autonomic activity, go to Blockers and set alpha receptors % block to 100%. Then go to
Monitor to observe the effects of this blockade. To block the formation of plasma angiotensin conversion, go to Blockers and set AII converting enzyme inhibition to 100%. Again, go to Monitor to observe the effects of this inhibition.

Mr. Parks
QCP Laboratory Manual
The vasoconstrictor effect of the sympathetic nervous system and angiotensin during hemorrhage is beneficial only if the vasoconstriction is selective. Namely, we hope that brain and heart blood flow (vital organs) is maintained at the expense of flow in other organs, as show below (data from Kaihara).
0 50 100
Arterial PressureCardiac OutputBrain FlowHeart FlowKidney FlowVisceral Flow
% of Control Select the Blood Flow panel and estimate Mr. Parks' brain and hepatic vein blood flow from the graph. Or, select View / Organ Details to make the organ details toolbar buttons visible. Then select the
Brain Circulation and Gut panels to get numerical values for blood flow. Variable Mr. Parks N. Subject Units Brain Blood Flow 706 mL/Min Hepatic Vein Blood Flow
1217 mL/Min
Severity Of Hemorrhage
Compensation can almost completely hide the hemodynamic consequences of a mild hemorrhage, such as giving a unit of blood at a blood bank. More severe hemorrhage produces obvious signs even with

Mr. Parks
QCP Laboratory Manual
the strong support of the compensations. With very severe hemorrhage, the compensations are maximum and cannot contribute further; cardiovascular collapse is a real possibility. It would be instructive to know the severity of Mr. Parks' hemorrhage. Observe Mr. Parks for 10 minutes. Use the main menu Go command to advance the solution by 10 minutes.
Interventions Intervention is advised. Lost blood volume is usually replaced by one of three types of solutions. • Saline. It is readily available and safe, but it tends
to leak out of the circulation where it is of no or negative value. Saline dilutes the available hemoglobin.
• Saline With Colloid Pressure. Colloid pressure keeps the replacement fluid in the circulation where it boosts cardiac output, but it also dilutes available hemoglobin.
• Whole Or Artificial Blood. Blood is often not readily available (see G&H, Chapter 24). When it is available, it offers colloid pressure to keep the replacement fluid in the circulation and hemoglobin or a functional equivalent to carry oxygen.
We'll try each of these interventions. Note that the fundamental goal of intervention is to maintain or

Mr. Parks
QCP Laboratory Manual
improve oxygen delivery to the tissues. We'll keep an eye on O2 movement in the simulations that follow. In each case, begin by clicking Restart to take Mr. Parks back to his initial condition. Use the arrow buttons on the toolbar to move among the needed panels. Saline. Select the IV Drip panel. Set the volume to 1000 mL, the timespan to 10 Min, [NaCl] to 140 mMol and click switch to on. Go back to Monitor, advance the solution for 1 hour and record data in the table below. Plasma. Select the Transfusion panel. Set the volume to 1000 mL, the timespan to 10 Min, the hematocrit to 0 % and click switch to on. Go back to
Monitor, advance the solution for 1 hour and record data in the table below. Whole Blood. Select the Transfusion panel. Set the volume to 1000 mL, the timespan to 10 Min, the hematocrit to 44 % and click switch to on. Go back to
Monitor, advance the solution for 1 hour and record 1-hour data in the table below. Select the Oxygen panel for blood oxygen data. Variable Initial Saline Plasma Blood Blood Pressure Heart Rate Blood Volume Red Cell Volume

Mr. Parks
QCP Laboratory Manual
Plasma Volume Hematocrit Cardiac Output Arterial O2 Content Venous O2 Content
Discussion point: What are the good and bad attributes of the three replacement fluids used above, as indicated by the data collected? Discussion point: What is the volume replacement strategy when a patient intraoperatively bleed more than his/her total blood volume?
The Natural Time Course The physiological response to hemorrhage is a three-part process, over time. The principal features are: • Rapidly responding neural and humoral
mechanisms direct available blood flow toward vital organs, as described above.
• More slowly evolving salt and water retention by the kidneys replaces the lost plasma.
• Erythropoiesis gradually replaces the lost red blood cells.
In this section, we'll produce a moderate hemorrhage and observe the body's response over the following month.

Mr. Parks
QCP Laboratory Manual
Use the Options / Reset main menu selection to get Norm Subject back. The thumbnail sketch in Charts should now introduce Norm Subject. To create a hemorrhage, select the Blood Volume panel. In the arterial hemorrhage box, set volume to 1000 and timespan to 10. Click the hemorrhage switch on and advance the solution 30 minutes. You can verify the neural and hormonal response to hemorrhage, as previously seen above. But, there is also a renal component to be considered. Use the View / Nephron Details main menu selection to add the nephron details button to the toolbar. Select the Urine panel and read the rate of sodium and water excretion. Variable 30 Min Control Units Sodium Excretion
0.114 mEq/Min
Water Excretion
0.76 mL/Min
Salt and water retention should expand plasma volume and blood volume. But the lost red cells will not be acutely replaced and hematocrit will fall as shown below (data from Ebert, Adamson).

Mr. Parks
QCP Laboratory Manual
Hematocrit
35
40
45
(%)
PlasmaVolume
(L)
Time (Days)
2.0
2.5
3.0
-1 0 31
Hemorrhage
2
Advance the solution to 2 days and note the amount and composition of blood volume. Select the Erythropoietin panel to see if EPO secretion has been stimulated. Select the Blood Volume panel to see if red cell production is increased. Advance the solution to 30 days, following changes in blood volume and particularly red cell volume. Note the final amount and composition of the blood. Variable 30 Days Control Units Blood Volume
5400 mL
Red Cell Volume
2400 mL

Mr. Parks
QCP Laboratory Manual
Plasma Volume
3000 mL
Hematocrit 44 %
References Adamson, J. and R. S. Hillman. Blood volume and plasma protein replacement following acute blood loss in normal man. J. Amer. Med. Assn. 205:609-612, 1968. Ebert, R. V., E. A. Stead, Jr. and J. G. Gibson, II. Response of normal subjects to acute blood loss. Arch. Int. Med. 68:578-590, 1941. Kaihara, S., R. B. Rutherford, E. P. Schwentker and H. N. Wagner, Jr. Distribution of cardiac output in experimental hemorrhage in dogs. J. Appl. Physiol. 27:218-222, 1969.

QCP Laboratory Manual
Mr. Parks - Notes
Mr. Parks’ thumbnail sketch notes that he was found in a pool of blood and was rushed to the ER. Mr. Parks has hemorrhaged and may expire if left untreated.
Creating Mr. Parks The first step in creating Mr. Parks is to create a large hemorrhage. The new parameter values are:
“Arterial Hemorrhage, Final Volume” = 1800.0 “Arterial Hemorrhage, Duration” = 30.0 “Arterial Hemorrhage, Switch” = 1.0 // On
Then the solution was advanced for 10 minutes and Mr. Parks was constrained to lying down (1.0).
“Posture Control, Restraint” = 1.0 // Lying Then the solution was advanced for another 20 minutes to complete the hemorrhage. Finally, a smaller continuing hemorrhage was defined to create a dynamic setting. The new parameter values are:
“Arterial Hemorrhage, Final Volume” = 500.0 “Arterial Hemorrhage, Duration” = 10.0 “Arterial Hemorrhage, Switch” = 1.0 // On
Mr. Parks is now ready for observation and intervention.

Mr. Parks
QCP Laboratory Manual
Recap The immediate physiological response to hemorrhage is neural and humoral vasoconstriction that directs available blood flow toward vital organs. Then, renal salt and water retention expands plasma and blood volume. The slowest part of the response is replacement of lost red cells by increased red cell production. The effectiveness of volume replacement depends on • The replacement fluid's tendency to stay in the
circulation.
• The replacement fluid's net effect on oxygen delivery to the tissues.

QCP Laboratory Manual
Mr. Parks Wrap-up Summary
The immediate physiological response to hemorrhage is neural and humoral vasoconstriction that directs available blood flow toward vital organs. Then, renal salt and water retention expands plasma and blood volume. The slowest part of the response is replacement of lost red cells by increased red cell production. The effectiveness of volume replacement depends on • The replacement fluid's tendency to stay in the
circulation.
• The replacement fluid's net effect on oxygen delivery to the tissues.

QCP Laboratory Manual
Mr. Stone
Load Mr. Stone (MR_STONE.ICS) using the File / Load Initial Conditions main menu selection. Is Mr. Stone OK? We don't know, but he is in the ER. Check his blood pressure, heart rate, temperature and respiration using the Monitor panel. Normal values were taken from Norm Subject. Variable Mr. Stone N. Subject Units Blood Pressure
120 / 81 mmHg
Heart Rate 73 Beats / Min Temperature 98.8 degree F Respiration Rate
12 Breaths / Min
These values seem quite normal, but there are some slight worries. Pulse pressure seems a little narrow and heart rate is a little high. And, respiration rate is up a little bit.
Blood Chemistry Blood chemistry might be useful. Go to the Blood And Urine Samples panel. Click Take Sample Now in the Venous Blood Sample box. Are the blood electrolytes normal? Variable Mr. Stone N. Subject Units [Na+] 145 mEq/L [K+] 4.4 mEq/L [Cl-] 108 mEq/L

Mr. Stone
QCP Laboratory Manual
[BUN] 13 mG/dL [Protein] 6.9 G/dL Osmolarity 292 mOsm/LHematocrit 44 %
Several values are not quite normal. Plasma [Na+], osmolarity and hematocrit are all elevated a little bit. What does this suggest? We might consider a drip later on. A bigger worry is the elevated plasma [Cl-]. What does this suggest? We'll investigate further. Check Mr. Stone's acid/base status. Click Take Sample Now in the Arterial Blood Gases box. Is there evidence of an acid/base disturbance? Variable Mr. Stone N. Subject Units pCO2 37 mmHg pH 7.45 pH Units [H+] 35 pMol/L [HCO3-] 26 mEq/L
These values definitely suggest that Mr. Stone has an acid/base disturbance of some sort. Would you expect the pH in a venous blood sample to be higher or lower than in this arterial sample? Why?
pH Or [H+]? The definition of pH (see Guyton and Hall, p. 347) is pH = -log [H+]
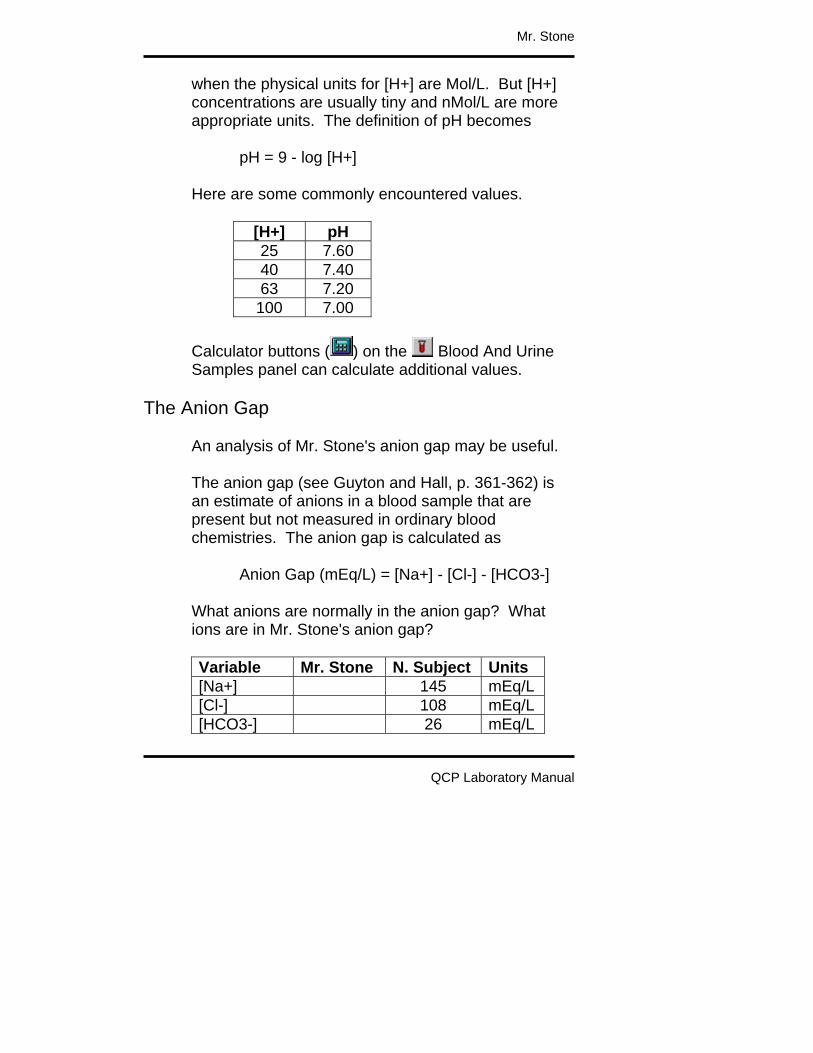
Mr. Stone
QCP Laboratory Manual
when the physical units for [H+] are Mol/L. But [H+] concentrations are usually tiny and nMol/L are more appropriate units. The definition of pH becomes pH = 9 - log [H+] Here are some commonly encountered values.
[H+] pH 25 7.60 40 7.40 63 7.20
100 7.00 Calculator buttons ( ) on the Blood And Urine Samples panel can calculate additional values.
The Anion Gap An analysis of Mr. Stone's anion gap may be useful. The anion gap (see Guyton and Hall, p. 361-362) is an estimate of anions in a blood sample that are present but not measured in ordinary blood chemistries. The anion gap is calculated as Anion Gap (mEq/L) = [Na+] - [Cl-] - [HCO3-] What anions are normally in the anion gap? What ions are in Mr. Stone's anion gap? Variable Mr. Stone N. Subject Units [Na+] 145 mEq/L [Cl-] 108 mEq/L [HCO3-] 26 mEq/L

Mr. Stone
QCP Laboratory Manual
Anion Gap 11 mEq/L
This Shoe Didn't Fit If we encounter a blood sample with a low [HCO3-] concentration (we did) and a normal or decreased [Cl-] concentration (we didn't), there will probably be a large anion gap. Likely candidates to fill this gap are ketoacids (diabetic ketoacidosis) and lactate (anaerobic organ failure). Mr. Stone is not showing us this profile at all, so its time to move along.
Respiratory Function And pH Respiratory function is always involved in acid/base status. First, consider the physiological loop that helps to stabilize blood pCO2. This loop operates as follows: if blood pCO2 increases, pH falls; decreased pH stimulates ventilation; increased ventilation increases exhaled CO2; increased CO2 blow off decreases blood pCO2. Thus, stability.
pCO2 pH Ventilation
ExhaledCO2
Other RespiratoryFactors
MetabolicFactors

Mr. Stone
QCP Laboratory Manual
Now suppose metabolic factors lower pH. Decreased pH stimulates ventilation and increased ventilation increases exhaled CO2, lowering blood pCO2. The decreased blood pCO2 tends to increase pH, buffering the original metabolic event. This is metabolic acidosis with respiratory compensation. Suppose a respiratory factor, such as pulmonary membrane damage, decreases exhaled CO2. This increases blood pCO2 and lowers pH. This is respiratory acidosis. But decreased pH again stimulates ventilation and this increases exhaled CO2, which tends to buffer the initial insult. In simplest terms, acidosis with decreased blood pCO2 is probably caused by metabolic factors. Acidosis with increased blood pCO2 is probably caused by respiratory factors. With this background, we can analyze Mr. Stone’s venous blood. Variable Mr. Stone N. Subject Units pH 7.45 pH Units pCO2 37 mmHg
What is your diagnosis at this point?
Mr. Stone's Kidney It's time to look at Mr. Stone's kidney.

Mr. Stone
QCP Laboratory Manual
Use the View / Basic Physiology and Nephron Details main menu selections to install the basic physiology and nephron toolbar buttons. It might be useful to see what Mr. Stone's kidney is excreting. Go to Urine and record excretion rates for water and important electrolytes. Variable Mr. Stone N. Subject Units
H2O Rate 0.76 mL/Min Na+ Rate 0.114 mEq/Min K+ Rate 0.056 mEq/Min Cl- Rate 0.125 mEq/Min HCO3-Rate 0.010 mEq/Min NH4+ Rate 0.024 mEq/Min
Review G&H Chapter 30 and complete your diagnosis. Focus particularly on the excretion rates for Na+, HCO3- and NH4+.
Body Fluids We've also had some hints that Mr. Stone may be a little dehydrated. What were those hints? Go to Water and record the volumes of important body fluid compartments.
Variable Mr. Stone N. Subject Units Total Body H2O 43.2 L ECFV 15.0 L Plasma 3.0 L Interstitium 12.0 L Cell H2O 28.2 L

Mr. Stone
QCP Laboratory Manual
Use this information below in prescribing a drip for Mr. Stone.
Interventions The proper intervention is to remove the primary cause of the acid/base disturbance, but a drip may temporarily improve Mr. Stone's acid/base status. Go to IV Drip. Create a plan for infusing sodium bicarbonate. Set the bicarbonate concentration, infusion volume and infusion timespan. Click the drip switch to on. Advance time to complete the drip. If you don't like the results, click the Restart main menu selection and try a different strategy. Record the final results below and show your instructor. Variable Control Now Units [Na+] mEq/L [K+] mEq/L [Cl-] mEq/L [BUN] mG/dL [Protein] G/dL Osmolarity mOsm/L Hematocrit % pCO2 mmHg pH pH Units [H+] pMol/L [HCO3-] mEq/L
Show these results to your instructor.

Mr. Stone
QCP Laboratory Manual

QCP Laboratory Manual
Mr. Stone - Notes
Mr. Stone’s thumbnail sketch notes only that he speaks Estonian and so there is no history at the outset. Mr. Stone has had prolonged diarrhea, producing hyperchloremic metabolic acidosis.
Creating Mr. Stone Mr. Stone looses 100 mEq of Na+ (along with bicarbonate) a minute and 1 mL of water per minute in his feces. We anticipate not only metabolic acidosis but also dehydration. The new parameter values are:
“GI Lumen Diarrhea, [Na+] Target” = 100.0 “GI Lumen Diarrhea, H2O Target” = 1.0
Then the solution was advanced for 3 days (3800 minutes). Mr. Stone is ready.
Recap Metabolic acidosis presents with decreased blood pH and bicarbonate concentration. If ketoacids or lactate are the cause of the acidosis, their blood concentrations will be hiding in a widened anion gap. Otherwise the anion gap will be smaller than normal and blood chloride concentration will be increased.

Mr. Stone
QCP Laboratory Manual
Ventilation has a role in metabolic acidosis. Decreased pH stimulates ventilation which, in turn, blows down blood pCO2. This decrease in pCO2 decreases the severity of the acidosis. The proper treatment of metabolic acidosis is to remove its primary cause, but sodium bicarbonate administration should provide temporary benefit.
Postscript An Estonian translator was located. It turns out that Mr. Stone has had a severe, continuing diarrhea for several days. Treatment of lower bowel inflammation is planned. To see the cause of Mr. Stone's distress, go to Miscellaneous and scroll to the bottom of the panel.

QCP Laboratory Manual
Mr. Stone Wrap-up Summary
Metabolic acidosis presents with decreased blood pH and bicarbonate concentration. If ketoacids or lactate are the cause of the acidosis, their blood concentrations will be hiding in a widened anion gap. Otherwise the anion gap will be smaller than normal and blood chloride concentration will be increased. Ventilation has a role in metabolic acidosis. Decreased pH stimulates ventilation which, in turn, blows down blood pCO2. This decrease in pCO2 decreases the severity of the acidosis. The proper treatment of metabolic acidosis is to remove its primary cause, but sodium bicarbonate administration should provide temporary benefit.
Postscript An Estonian translator was located. It turns out that Mr. Stone has had a severe, continuing diarrhea for several days. Treatment of lower bowel inflammation is planned. To see the cause of Mr. Stone's distress, go to Miscellaneous and scroll to the bottom of the panel.

QCP Laboratory Manual
Ms. Thomas
Load Ms. Thomas (Ms Thomas.ICS) using the File / Load Initial Conditions main menu selection. Is Ms. Thomas OK? Actually, the thumbnail sketch on the Charts panel suggests that she is not OK. She is confused – maybe worse. To get a rough idea of Ms. Thomas’s condition, advance the solution in 1 hour intervals for a total of 3 hours, collecting data at the start and at the end of each interval. Check Ms. Thomas’s blood pressure, heart rate, temperature and respiration using the Monitor panel. Variable 12:00 1:00 2:00 3:00 Systolic Blood Pressure (mmHg)
Diastolic Blood Pressure (mmHg)
Heart Rate (/Min) Temperature (deg F)
Respiration Rate (/Min)
The initial values look pretty good, but trouble soon develops. What does the pulse pressure and heart rate data suggest? Click main menu selection Restart to restart the solution.

Ms. Thomas
QCP Laboratory Manual
Attend to Ms. Thomas. Be prepared to discuss the following points. • What is the matter with Ms. Thomas? • What interventions are possible? Which do you
recommend? Can you describe a beneficial course of action?
• What physiological and pathophysiological
mechanisms are causing Ms. Thomas’s condition? • What physiological mechanisms, if any, are
actually beneficial to Ms. Thomas condition? • Summarize Ms. Thomas’s acid/base status? • What is Ms. Thomas’s fluid volume status? • What is Ms. Thomas’s renal excretory status? • Specifically, what are the neurological, endocrine
and metabolic components of Ms. Thomas’s condition?

QCP Laboratory Manual
Ms. Thomas – Instructors Notes
Ms. Thomas has Type I diabetes mellitus (IDDM). She has had little or no insulin therapy and is at extreme risk of falling into a coma caused either by hyperglycemia or ketoacidosis. The clinical buttons toolbar group has several useful interventions.
- Dietary salt. - Diuretics - IV drip including protein
Note that steroids are not available. Select View | Basic Physiology to put the basic physiology group of panels on the toolbar.
- Pressures and flows. - Volumes. - Pulmonary edema.
Select View | Orthostasis to put the orthostasis group of panels on the toolbar. These panels show regional interstitial fluid volume, protein concentration and lymph flow. Select View | Nephron Details to put the nephron group of panels on the toolbar. The click on Glomerulus to view the cause to the nephrotic syndrome. Click Urine to see what is being excreted.

Mr. Johnson – Instructor’s Notes
QCP Laboratory Manual
Sodium Retention In Nephrotic Syndrome
Here is the classic picture of nephrotic syndrome. Albumin is lost into the urine. Plasma colloid pressure falls and water shifts from the plasma to the interstitium. Sodium retaining mechanisms are activated by the decreased plasma volume and sodium is retained. The retained sodium leaks into the interstitium and edema forms. But Dorhout Mees noted in 1979 that the typical nephrotic syndrome patient does not show signs of plasma volume contraction and activation of sodium retaining mechanisms. In fact, the opposite is seen. The best evidence comes from serial studies in patients that have episodes of nephrotic syndrome followed by spontaneous remission or favorable response to steroids. In the new picture of nephrotic syndrome, plasma volume and blood volume are expanded, plasma renin activity and aldosterone concentration are normal or decreased (Dorhout Mees et.al., Shapiro et.al.). Glomerular filtration is decreased. Dorhout Mees reported one patient that had a creatinine clearance of 34 mL/Min during nephrotic syndrome and 127 mL/Min during recovery. A water load is excreted slowly during nephrotic syndrome (Shapiro et.al.). Arterial pressure tends to be elevated. The glomerular membrane is a complex tissue, but it appears that protein permeability is increased in nephrotic syndrome while sodium permeability is decreased. Note that albumin is an anion while

Mr. Johnson – Instructor’s Notes
QCP Laboratory Manual
sodium is a cation and the glomerular membrane is normally loaded with negative charges.
Experimental Nephrotic Syndrome. In rats. Puromycin aminonucleoside (PAN) will produce a very good model of nephrotic syndrome in rats following close or systemic infusion. These rats dump albumin and other small proteins as expected. These animals also retain sodium. The whole kidney and single nephron glomerular filtration rates are decreased (Ichikawa et.al.). Sodium excretion as a function of renal perfusion pressure is greatly reduced (Firth et.al.). Firth has a great graph. There is also some evidence for increased distal sodium reabsorption, although the reason is not clear. I need to look into this a bit more.
COP And Na+ Excretion In Normal Kidneys Christine Bayliss, Thomas Maack and other have investigated the effect of colloid osmotic pressure on sodium excretion in normal kidneys. Usually using rats. Decreased colloid osmotic pressure increases glomerular filtration and decreases tubular reabsorption. This two factors combine to net a big increase in sodium excretion, which is basically the opposite of what is seen in nephrotic syndrome.

Mr. Johnson – Instructor’s Notes
QCP Laboratory Manual
Bayliss Amer. J. Physiol. 232:F58-F64, 1977 has some nice data. Some other potentially useful references are: AJP 226:426-430, 1974. AJP 226:512-517, 1974. Pflugers 301:7-15, 1968. Circ. Res. 61:531-538, 1987. Pfluger 306:92-102, 1969. JCI 82:1757-1768, 1988. Kid. Int. 34:220-223, 1988.
Physiological Compensations There may be many important physiological compensations that help to keep the nephrotic syndrome patient alive. I don’t have a big list at this time. Falling plasma protein concentration slows the flux of protein from plasma to interstitium and this helps to keep available protein in the plasma. Falling plasma protein concentration increases the Starling pressure gradient across the capillary wall. This increases the flux of water from plasma to interstitium. Interstitial pressure increases (Noddeland et.al.). Lymph flow increases and washes interstitial protein back into the plasma. Interstitial protein concentration can fall to a very low level (Noddeland et.al., Koomans et.al.) Koomans has a very nice graph..

Mr. Johnson – Instructor’s Notes
QCP Laboratory Manual
These responses in total keep as much of the available protein as possible in the plasma (where it is needed) and not in the interstitium.
References Dorhout Mees, E.J., J.C. Roos, R. Boer, O.H. Yoe and T.A. Simatupang. Observations on edema formation in the nephrotic syndrome in adults with minimal lesions. Amer. J. Med. 67:378-384, 1979, Firth, J.D., A.E.G. Raine and J.G.G. Leddingham. Abnormal sodium handling occurs in the isolated perfused kidney of the nephrotic rat. Clin. Sci. 76:387-395, 1989. Ichikawa, I., H.G. Renke, J.R. Hoyer, K.F. Badr, N. Schor, J.L. Troy, C.P. Lechene and B.M Brenner. Role for intrarenal mechanisms in the impaired salt excretion of experimental nephrotic syndrome. J. Clin. Invest. 71:91-103, 1983. Koomans, H.A., W. Kortlandt, A.B. Geers and E.J. Dorhout Mees. Lowered protein content of tissue fluid in patients with nephrotic syndrome: observations during disease and recovery. Nephron 40:391-395, 1985. Joles, J.A., T.J. Rabelink, B. Braam and H.A. Koomans. Plasma volume regulation: Defences against edema formation (with special emphasis on hypoproteinemia). Am. J. Nephrol. 13:399-412, 1993. Noddeland, H., S.M. Riisnes and H.O. Fadnes. Interstitial fluid colloid osmotic and hydrostatic

Mr. Johnson – Instructor’s Notes
QCP Laboratory Manual
pressures in subcutaneous tissue of patents with nephrotic syndrome. Scand. J. Clin. Lab. Invest. 42:139-146, 1982. Shapiro, M.D., K.M. Nicholls, B.M. Groves and R.W. Schrier. Role of glomerular filtration rate in the impaired sodium and water excretion of patients with the nephrotic syndrome. Amer. J. Kid. Dis. 8:81-87, 1986.

QCP Laboratory Manual
Ms. Thomas – Notes
Ms. Thomas has untreated Type I diabetes mellitus or insulin dependent diabetes mellitus (IDDM). The key word here is untreated. Ms. Thomas has had little or no insulin therapy and is at extreme risk of falling into a coma caused either by hyperglycemia or ketoacidosis.
Creating Ms. Thomas Ms. Thomas was created by simulating nearly complete loss of pancreatic beta cells. Specifically, pancreatic insulin secretion was clamped at 1 mU/Min compared to a typical secretion of 10 mU/Min. The new parameters values are:
“Insulin Secretion, Clamp Level” = 1.0 “Insulin Secretion, Clamp Switch” = 1.0 // On
Then the solution was advanced for 18 hours (1080 minutes). Hyperglycemia and ketoacidosis quickly developed.
Interventions Ms. Thomas’s condition is initially not very clear. So go to the Blood Chemistry panel. Several values jump out. Ms. Thomas has a blood glucose concentration of 1200 mG/dL compared to a normal of around 100 mG/dL. This increase is enough to produce a hyperglycemic coma.

Mr. Thomas – Notes
QCP Laboratory Manual
There is also a severe acidosis. It is metabolic since blood pCO2 values are normal to low. Blood ketoacids concentration is very high, causing a large anion gap and a small strong ion difference. This looks like IDDM with inadequate insulin replacement. You could check the plasma insulin levels just to make sure. The proper intervention is to inject insulin to bring the blood glucose concentrations down. I injected 20 U, but ended up with ventricular fibrillation due to hypokalemia. So there are some additional issues during treatment that I should look into. Ms. Thomas is excreting 11 mL/Min urine vs. a normal flow of 1 mL/Min. She has become dehydrated and the dehydration is intracellular, with a cell water of 23 L vs. a normal volume of 28 L. Plasma [K+] is increased and this has stimulated aldosterone secretion. I’ll look into this further. With a shot of insulin, the osmolarity falls and water rushes into the cells. Apparently K+ rushes in also, lowering plasma [K+] to lethal levels. Apparently, an aggressive drip must accompany the insulin. At minimum, careful management is needed. Some useful panels are
Glucose Insulin

Mr. Thomas – Notes
QCP Laboratory Manual
Glucagon pH
References
I’m looking for some suitable references now.

QCP Laboratory Manual
Mr. White
Load Mr. White (MR_WHITE.ICS) using the File / Load Initial Conditions main menu selection. Is Mr. White OK? In his thumbnail sketch on the Charts panel, he says the he feels OK. Check his blood pressure, heart rate, temperature and respiration using the Monitor panel. Normal values were taken from Norm Subject. Variable Mr. White N. Subject Units Blood Pressure
120 / 80 mmHg
Heart Rate 72 Beats / Min Temperature 98.6 degree F Respiration Rate
12 Breaths / Min
Do No Harm
We might first observe Mr. White for awhile. Use the Go main menu selection to advance the solution for 1 week.
Blood Chemistry Maybe Mr. White needs more aggressive treatment. Click the Restart main menu selection to restart Mr. White. Its time for some blood chemistry. Go to the Blood And Urine Samples panel. Get venous blood

Mr. White
QCP Laboratory Manual
gases. Click Take Sample Now in the Venous Blood Gases box. Is there evidence of an acid/base disturbance? Variable Mr. White N. Subject Units pCO2 45 mmHg pH 7.39 pH Units [H+] 41 pMol/L [HCO3-] 26 mEq/L
Check blood electrolytes. Click Take Sample Now in the Venous Blood Sample box. Are the blood electrolytes normal? Variable Mr. White N. Subject Units [Na+] 144 mEq/L [K+] 4.4 mEq/L [Cl-] 108 mEq/L [BUN] 12 mG/dL [Protein] 7.0 G/dL Osmolality 292 mOsm/LHematocrit 45 %
Invasive Studies
Use the View / Basic Physiology and Nephron Details main menu selections to install the basic physiology and nephron toolbar buttons. The blood samples taken above suggest that something is abnormal in Mr. White's electrolyte balance. We will now get numbers for Na+ and K+ excretion.

Mr. White
QCP Laboratory Manual
Go to the Urine panel and note the rate of Na+ and K+ excretion. Na+ ______ mEq/Min x 1440 = ______ mEq/Day K+ ______ mEq/Min x 1440 = ______ mEq/Day If Mr. White is in balance, these excretion values will be nearly the same as Mr. White's dietary intake values. But, Mr. White may not be in balance. We better check it out. Go to the Diet panel and note daily electrolyte intake. Variable Mr. White N. Subject Units Na+ Intake 180 mEq/Day Na+ Output 180 mEq/Day K+ Intake 70 mEq/Day K+ Output 70 mEq/Day
Mr. White appears to be a big salt user. We will look at his extracellular Na+ mass. Go to Na+ and note the extracellular Na+ mass. Variable Mr. White N. Subject Units ECFV Na+ Mass
2150 mEq
Expanded extracellular Na+ may be contributing to Mr. White's hypertension. A low salt diet may be beneficial. We'll return to this idea later. But for now, the electrolyte balance data suggests a bigger problem. It appears that Mr. White is excreting considerably more K+ than he is taking in. If this has

Mr. White
QCP Laboratory Manual
persisted for awhile, Mr. White could be severely K+ depleted. Go to K+ and note the extracellular and intracellular K+ mass and concentration. Variable Mr. White N. Subject Units ECFV K+ Mass 66 mEq ECFV [K+] 4.4 mEq/L Cell K+ Mass 3960 mEq Cell [K+] 141 mEq/L
Note that hypokalemia increases the risk of cardiac dysrhythmias.
Hormones In The Blood We're getting close to an explanation. Go to Blood Chemistry and examine the hormones in the blood. Variable Mr. White N. Subject Units [AII] 20 pG/mL Renin (PRA) 2.0 GU/mL [Aldo] 330 pMol/L [ADH] 2.0 pG/mL [ANP] 20 pMol/L
Examine the values above, remembering that Mr. White is on a high-salt diet, and explain any unusual values. What is your diagnosis at this point? Note the forces influencing hormone secretion.

Mr. White
QCP Laboratory Manual
Mr. White's Kidneys Three nephron segments will be examined: the distal tubule, the glomerulus and the proximal tubule. Go to Distal Tubule and note the status of sodium reabsorption. Variable Mr. White N. Subject Units Na+ Inflow 1.8 mEq/Min Na+ Reabsorption
1.4 mEq/Min
Na+ Outflow 0.4 mEq/Min Fractional Na+ Reabsorption
78 %
Note also the status of potassium secretion. Effects on secretion can be estimated from the bar graph. Variable Mr. White N. Subject Units K+ Secretion 0.05 mEq/Min [Aldo] Effect 1.0 X Normal [K+] Effect 1.0 X Normal Na+ Load Effect 1.0 X Normal
Go to Glomerulus and note the glomerular filtration rate. Variable Mr. White N. Subject Units GFR 125 mL/Min
What factors are causing the change in glomerular filtration rate? What factors are opposing the change?

Mr. White
QCP Laboratory Manual
Go to Proximal Tubule and note the status of sodium reabsorption. Variable Mr. White N. Subject Units Na+ Inflow 17.3 mEq/Min Na+ Reabsorption
10.1 mEq/Min
Na+ Outflow 7.2 mEq/Min Fractional Reabsorption
58 %
Note the forces influencing potassium excretion. What effect will this reabsorption pattern have on downstream sodium movement?
Treatment Initial treatment should focus on correcting the abnormal potassium values and on lowering blood pressure. We'll work on the potassium first, administering a potassium supplement. Begin by recording initial values (Day 1). Note the time and date display in the upper, right-hand corner of most panels. Next, go to
Diet and slide potassium up to 130 and extra chloride up to 80. Go to the Monitor panel to track blood pressure. Advance the solution 1 week and record values at the end of the week (Day 8). Check on blood pressure and plasma [K+].

Mr. White
QCP Laboratory Manual
Variable Day 1 Day 8 Units Blood Pressure mmHg Plasma [K+] mEq/L
So far, so good. Next, we'll block the formation of angiotensin formation. Go to Blockers and slide converting enzyme inhibition up to 100%. Again, go to the Monitor panel to track blood pressure. Advance the solution 1 week and record values at the end of the week (Day 15) Check on blood pressure and plasma [K+]. Variable Day 8 Day 15 Units Blood Pressure mmHg Plasma [K+] mEq/L
Norm Subject's response to 100% converting enzyme over one week is shown below. Variable Day 1 Day 8 Units Blood Pressure 120/81 109/71 mmHg Plasma [K+] 4.4 4.6 mEq/L
Describe and explain the differences between Mr. White's response and Norm Subject's response to converting enzyme inhibition. Finally, let's reduce the amount of NaCl in Mr. White's diet. But first, we should remove the effects of converting enzyme inhibition. Record current (Day 15) data below. Then go to Blockers and slide

Mr. White
QCP Laboratory Manual
converting enzyme inhibition back down to 0%. Again, go to the Monitor panel to track blood pressure. Advance the solution 1 week and record values at the end of the week (Day 22). Variable Day 15 Day 22 Units Blood Pressure mmHg Plasma [K+] mEq/L
Mr. White is now ready for a reduction in salt intake. Record current (Day 22) data below. Then go to Diet and slide table salt (mMol/Day) down to 100. Again, go to the Charts panel to track blood pressure. Advance the solution 1 week and record values at the end of the week (Day 29). Variable Day 22 Day 29 Units Blood Pressure mmHg Plasma [K+] mEq/L
How can a change in sodium intake alter K+ balance? Go to Distal Tubule and note the status of sodium reabsorption. Variable Mr. White N. Subject Units Na+ Inflow 1.8 mEq/Min Na+ Reabsorption
1.4 mEq/Min
Na+ Outflow 0.4 mEq/Min Fractional Reabsorption
78 %

Mr. White
QCP Laboratory Manual
Note also the change in the forces influencing potassium excretion. Effects on secretion can be estimated from the bar graph. Variable Mr. White N. Subject Units K+ Secretion 0.05 mEq/Min [Aldo] Effect 1.0 X Normal [K+] Effect 1.0 X Normal Na+ Load Effect 1.0 X Normal
Wrap up by revisiting all important variables and then making a general assessment of Mr. White's condition. K+ is worth a look. What is your final diagnosis?

QCP Laboratory Manual
Mr. White - Notes
Mr. White’s thumbnail sketch notes only that he says that he feels pretty good. Of course, he is mistaken. Mr. White is suffering from the 1 – 2 punch of an aldosterone secreting tumor plus elevated dietary table salt intake. This combination will create a fatal hypokalemia (via ventricular fibrillation) if left untreated.
Creating Mr. White The tumor is turned on and intake of table salt is increased. The new parameter values are:
“Zona Glomerulosa, Tumor Secretion” = 2000.0 “Diet Goal, Table Salt (mMol/Day)” = 300.0
The units for tumor aldosterone secretion are pMol/Min. It appears that the tumor is not displayed in any panel, so it is a hidden variable. Then the solution was advanced for 10 days (10080 minutes). Mr. White is ready.
Recap Uncontrolled secretion of aldosterone by adrenal tissue produces inappropriately high potassium excretion that decreases both intracellular and extracellular potassium stores. Severe

Mr. White - Notes
QCP Laboratory Manual
hypokalemia can cause serious (and potentially fatal) dysrhythmias. Excessive aldosterone secretion also leads to sodium retention and hypertension. We would expect renin, angiotensin and aldosterone concentrations to be decreased with a high salt diet. Low renin with high aldosterone concentration on a high salt diet is abnormal; a defect in aldosterone synthesis or secretion is highly likely. The primary site of aldosterone's action for both potassium secretion and sodium reabsorption is the kidney's distal tubule. With regard to Mr. White's distal sodium reabsorption, aldosterone has caused a large increase in fractional reabsorption. The body's response has been to retain sodium, increase blood pressure, increase glomerular filtration rate and to increase sodium flow into the distal tubule. Sodium balance has been reestablished; the price is hypertension. With regard to Mr. White's distal potassium secretion, aldosterone has caused a large increase in secretion that has been made worse by increased distal tubule sodium flow. The body's response has been to lose potassium that in turn decreases the plasma potassium concentration. This hypokalemia works at the distal tubule to offset (partially) the effect of increased aldosterone and increased sodium flow; the price is the likelihood of a fatal dysrhythmia. High salt intake makes both the hypokalemia and hypertension worse.

Mr. White - Notes
QCP Laboratory Manual
Postscript
Mr. White has an aldosterone secreting tumor. Use the View / Organ Details main menu selection to install the organ details toolbar buttons. Then go to
Zona Glomerulosa to confirm the tumor secretion rate. You can simulate surgical excision of the tumor by decreasing tumor secretion to zero. But before doing surgery, note what Williams Textbook of Endocrinology, 9th Edition has to say: "All patients should receive medical treatment prior to surgery to control blood pressure and replete potassium stores." We have replaced Mr. White’s potassium loss and treated his hypertension, so he appears to be ready for surgery. Slide tumor secretion down to 0. Advance the solution for 1 week. Note additional changes in blood pressure and plasma [K+]. Variable At
Surgery 1 Week Post-OP
Units
Blood Pressure mmHg Plasma [K+] mEq/L
Wrap up by revisiting all important variables and then making a general assessment of Mr. White's condition.

QCP Laboratory Manual
Mr. White Wrap-up Summary
Uncontrolled secretion of aldosterone by adrenal tissue produces inappropriately high potassium excretion that decreases both intracellular and extracellular potassium stores. Severe hypokalemia can cause serious (and potentially fatal) dysrhythmias. Excessive aldosterone secretion also leads to sodium retention and hypertension. We would expect renin, angiotensin and aldosterone concentrations to be decreased with a high salt diet. Low renin with high aldosterone concentration on a high salt diet is abnormal; a defect in aldosterone synthesis or secretion is highly likely. The primary site of aldosterone's action for both potassium secretion and sodium reabsorption is the kidney's distal tubule. With regard to Mr. White's distal sodium reabsorption, aldosterone has caused a large increase in fractional reabsorption. The body's response has been to retain sodium, increase blood pressure, increase glomerular filtration rate and to increase sodium flow into the distal tubule. Sodium balance has been reestablished; the price is hypertension. With regard to Mr. White's distal potassium secretion, aldosterone has caused a large increase in secretion that has been made worse by increased distal tubule sodium flow. The body's response has been to lose

Mr. White Wrap-up
QCP Laboratory Manual
potassium that in turn decreases the plasma potassium concentration. This hypokalemia works at the distal tubule to offset (partially) the effect of increased aldosterone and increased sodium flow; the price is the likelihood of a fatal dysrhythmia. High salt intake makes both the hypokalemia and hypertension worse.
Postscript Mr. White has an aldosterone secreting tumor. Use the View / Organ Details main menu selection to install the organ details toolbar buttons. Then go to
Zona Glomerulosa to confirm the tumor secretion rate. You can simulate surgical excision of the tumor by decreasing tumor secretion to zero. But before doing surgery, note what Williams Textbook of Endocrinology, 9th Edition has to say: "All patients should receive medical treatment prior to surgery to control blood pressure and replete potassium stores." We have replaced Mr. White’s potassium loss and treated his hypertension, so he appears to be ready for surgery. Slide tumor secretion down to 0. Advance the solution for 1 week. Note additional changes in blood pressure and plasma [K+].

Mr. White Wrap-up
QCP Laboratory Manual
Variable At Surgery
1 Week Post-OP
Units
Blood Pressure mmHg Plasma [K+] mEq/L
Wrap up by revisiting all important variables and then making a general assessment of Mr. White's condition.

QCP Laboratory Manual
Mr. Wilson
Load Mr. Wilson (Mr Wilson.ICS) using the File | Load Initial Conditions main menu selection. Is Mr. Wilson OK? Actually, the thumbnail sketch on the Charts panel suggests that he is not OK. It indicates that he is having a seizure and this is verified by the neurological signs workup. To get a rough idea of Mr. Wilson’s condition, advance the solution in 5 minute intervals for a total 10 minutes, collecting data at the start and at the end of each interval. Check Mr. Wilson’s blood pressure, heart rate, temperature and respiration using the Monitor panel. Variable 12:00 12:05 12:10 Systolic Blood Pressure (mmHg)
Diastolic Blood Pressure (mmHg)
Heart Rate (/Min) Temperature (deg F)
Respiration Rate (/Min)
Which values are outside of the normal range? What does this data set, in total, suggest. Click main menu selection Restart to restart the solution.

Mr. Wilson
QCP Laboratory Manual
Attend to Mr. Wilson. Be prepared to discuss the following points. • What is the matter with Mr. Wilson? • What interventions are possible? Which do you
recommend? Can you describe a beneficial course of action?
• What physiological and pathophysiological
mechanisms are causing Mr. Wilson’s condition? • Specifically, what are the neurological, endocrine,
and metabolic components of Mr. Wilson’s condition?
QCP Laboratory Manual
Mr. Wilson – Instructors Notes
Mr. Wilson has Type I diabetes mellitus (IDDM). Unfortunately Mr. Wilson has been given too much insulin and has fallen into a diabetic coma. Need to revive him. Glucose drip. It’s severe. If you advance the solution for 1 week without intervention, Mr. Johnson develops a fatal case of pulmonary edema. The clinical buttons toolbar group has several useful interventions.
- Dietary salt. - Diuretics - IV drip including protein
Note that steroids are not available. Select View | Basic Physiology to put the basic physiology group of panels on the toolbar.
- Pressures and flows. - Volumes. - Pulmonary edema.
Select View | Orthostasis to put the orthostasis group of panels on the toolbar. These panels show regional interstitial fluid volume, protein concentration and lymph flow.

Mr. Johnson – Instructor’s Notes
QCP Laboratory Manual
Select View | Nephron Details to put the nephron group of panels on the toolbar. The click on Glomerulus to view the cause to the nephrotic syndrome. Click Urine to see what is being excreted.
Sodium Retention In Nephrotic Syndrome Here is the classic picture of nephrotic syndrome. Albumin is lost into the urine. Plasma colloid pressure falls and water shifts from the plasma to the interstitium. Sodium retaining mechanisms are activated by the decreased plasma volume and sodium is retained. The retained sodium leaks into the interstitium and edema forms. But Dorhout Mees noted in 1979 that the typical nephrotic syndrome patient does not show signs of plasma volume contraction and activation of sodium retaining mechanisms. In fact, the opposite is seen. The best evidence comes from serial studies in patients that have episodes of nephrotic syndrome followed by spontaneous remission or favorable response to steroids. In the new picture of nephrotic syndrome, plasma volume and blood volume are expanded, plasma renin activity and aldosterone concentration are normal or decreased (Dorhout Mees et.al., Shapiro et.al.). Glomerular filtration is decreased. Dorhout Mees reported one patient that had a creatinine clearance of 34 mL/Min during nephrotic syndrome and 127 mL/Min during recovery. A water load is

Mr. Johnson – Instructor’s Notes
QCP Laboratory Manual
excreted slowly during nephrotic syndrome (Shapiro et.al.). Arterial pressure tends to be elevated. The glomerular membrane is a complex tissue, but it appears that protein permeability is increased in nephrotic syndrome while sodium permeability is decreased. Note that albumin is an anion while sodium is a cation and the glomerular membrane is normally loaded with negative charges.
Experimental Nephrotic Syndrome. In rats. Puromycin aminonucleoside (PAN) will produce a very good model of nephrotic syndrome in rats following close or systemic infusion. These rats dump albumin and other small proteins as expected. These animals also retain sodium. The whole kidney and single nephron glomerular filtration rates are decreased (Ichikawa et.al.). Sodium excretion as a function of renal perfusion pressure is greatly reduced (Firth et.al.). Firth has a great graph. There is also some evidence for increased distal sodium reabsorption, although the reason is not clear. I need to look into this a bit more.
COP And Na+ Excretion In Normal Kidneys Christine Bayliss, Thomas Maack and other have investigated the effect of colloid osmotic pressure on sodium excretion in normal kidneys. Usually using rats.

Mr. Johnson – Instructor’s Notes
QCP Laboratory Manual
Decreased colloid osmotic pressure increases glomerular filtration and decreases tubular reabsorption. This two factors combine to net a big increase in sodium excretion, which is basically the opposite of what is seen in nephrotic syndrome. Bayliss Amer. J. Physiol. 232:F58-F64, 1977 has some nice data. Some other potentially useful references are: AJP 226:426-430, 1974. AJP 226:512-517, 1974. Pflugers 301:7-15, 1968. Circ. Res. 61:531-538, 1987. Pfluger 306:92-102, 1969. JCI 82:1757-1768, 1988. Kid. Int. 34:220-223, 1988.
Physiological Compensations There may be many important physiological compensations that help to keep the nephrotic syndrome patient alive. I don’t have a big list at this time. Falling plasma protein concentration slows the flux of protein from plasma to interstitium and this helps to keep available protein in the plasma. Falling plasma protein concentration increases the Starling pressure gradient across the capillary wall. This increases the flux of water from plasma to interstitium. Interstitial pressure increases (Noddeland et.al.). Lymph flow increases and

Mr. Johnson – Instructor’s Notes
QCP Laboratory Manual
washes interstitial protein back into the plasma. Interstitial protein concentration can fall to a very low level (Noddeland et.al., Koomans et.al.) Koomans has a very nice graph.. These responses in total keep as much of the available protein as possible in the plasma (where it is needed) and not in the interstitium.
References Dorhout Mees, E.J., J.C. Roos, R. Boer, O.H. Yoe and T.A. Simatupang. Observations on edema formation in the nephrotic syndrome in adults with minimal lesions. Amer. J. Med. 67:378-384, 1979, Firth, J.D., A.E.G. Raine and J.G.G. Leddingham. Abnormal sodium handling occurs in the isolated perfused kidney of the nephrotic rat. Clin. Sci. 76:387-395, 1989. Ichikawa, I., H.G. Renke, J.R. Hoyer, K.F. Badr, N. Schor, J.L. Troy, C.P. Lechene and B.M Brenner. Role for intrarenal mechanisms in the impaired salt excretion of experimental nephrotic syndrome. J. Clin. Invest. 71:91-103, 1983. Koomans, H.A., W. Kortlandt, A.B. Geers and E.J. Dorhout Mees. Lowered protein content of tissue fluid in patients with nephrotic syndrome: observations during disease and recovery. Nephron 40:391-395, 1985. Joles, J.A., T.J. Rabelink, B. Braam and H.A. Koomans. Plasma volume regulation: Defences against edema formation (with special emphasis on

Mr. Johnson – Instructor’s Notes
QCP Laboratory Manual
hypoproteinemia). Am. J. Nephrol. 13:399-412, 1993. Noddeland, H., S.M. Riisnes and H.O. Fadnes. Interstitial fluid colloid osmotic and hydrostatic pressures in subcutaneous tissue of patents with nephrotic syndrome. Scand. J. Clin. Lab. Invest. 42:139-146, 1982. Shapiro, M.D., K.M. Nicholls, B.M. Groves and R.W. Schrier. Role of glomerular filtration rate in the impaired sodium and water excretion of patients with the nephrotic syndrome. Amer. J. Kid. Dis. 8:81-87, 1986.

QCP Laboratory Manual
Mr. Wilson – Notes
Mr. Wilson was seen in the Emergency Room as his thumbnail sketch indicates. An injection thought to be an analgesic turned out instead to be a rather large dose of insulin. Mr. Wilson’s blood glucose dropped rapidly, he had a seizure with very a significant activation of the sympathetic nervous system. He will soon fall into a hypoglycemic coma.
Creating Mr. Wilson Mr. Wilson was created by injecting 40 units of regular insulin. In addition, dietary goals were set to zero, although this probably is not necessary. The following parameter changes were made: “Diet Goal, Carbo’s (kCal/Day)” = 0.0 “Diet Goal, Fat (kCal/Day)” = 0.0 “Diet Goal, Protein (kCal/Day)” = 0.0 “Insulin Inject, Amount Injected” = 40.0 Then a function named “INS_INJECT” was fired and the solution was advanced 40 minutes. Blood glucose fell steadily during this period while blood insulin was increasing.
Interventions The severe hypertension with tachycardia (not bradycardia) suggest a primary CNS lesion such as a stroke. But the low blood glucose level is fully diagnostic.

Mr. Wilson – Notes
QCP Laboratory Manual
The value for blood glucose concentration can be obtained at the Blood Chemistry panel. The toolbar button group named Basic Physiology must be visible – use the View main menu selection to make it visible. The proper intervention for insulin overdose is glucose infusion. A glucose infusion pump is available at the
Infusion Pumps panel. The question then is how much glucose is needed. Dump it in and do a follow up blood sample. I used 1000 mG/Min with a good outcome. Some useful panels are
Glucose Insulin Glucagon
References
I’m looking for some suitable references now.

QCP Laboratory Manual
Misc Notes
Mr. Parks’ thumbnail sketch notes that he was found in a pool of blood and was rushed to the ER. Mr. Parks has hemorrhaged and may expire if left untreated.
Creating Mr. Parks The first step in creating Mr. Parks is to create a large hemorrhage. The new parameter values are:
“Arterial Hemorrhage, Final Volume” = 1800.0 “Arterial Hemorrhage, Duration” = 30.0 “Arterial Hemorrhage, Switch” = 1.0 // On
Then the solution was advanced for 10 minutes and Mr. Parks was constrained to lying down (1.0).
“Posture Control, Restraint” = 1.0 // Lying Then the solution was advanced for another 20 minutes to complete the hemorrhage. Finally, a smaller continuing hemorrhage was defined to create a dynamic setting. The new parameter values are:
“Arterial Hemorrhage, Final Volume” = 500.0 “Arterial Hemorrhage, Duration” = 10.0 “Arterial Hemorrhage, Switch” = 1.0 // On
Mr. Parks is now ready for observation and intervention.

Notes
QCP Laboratory Manual
Mr. Stone’s thumbnail sketch notes only that he speaks Estonian and so there is no history at the outset. Mr. Stone has had prolonged diarrhea, producing hyperchloremic metabolic acidosis.
Creating Mr. Stone Mr. Stone looses 100 mEq of Na+ (along with bicarbonate) a minute and 1 mL of water per minute in his feces. We anticipate not only metabolic acidosis but also dehydration. The new parameter values are:
“GI Lumen Diarrhea, [Na+] Target” = 100.0 “GI Lumen Diarrhea, H2O Target” = 1.0
Then the solution was advanced for 3 days (3800 minutes). Mr. Stone is ready. Mr. White’s thumbnail sketch notes only that he says that he feels pretty good. Of course, he is mistaken. Mr. White is suffering from the 1 – 2 punch of an aldosterone secreting tumor plus elevated dietary

Notes
QCP Laboratory Manual
table salt intake. This combination will create a fatal hypokalemia (via ventricular fibrillation) if left untreated.
Creating Mr. White The tumor is turned on and intake of table salt is increased. The new parameter values are:
“Zona Glomerulosa, Tumor Secretion” = 2000.0 “Diet Goal, Table Salt (mMol/Day)” = 300.0
The units for tumor aldosterone secretion are pMol/Min. It appears that the tumor is not displayed in any panel, so it is a hidden variable. Then the solution was advanced for 10 days (10080 minutes). Mr. White is ready. Ms. Lake’s thumbnail sketch notes that she claims to be in good health but gets too many headaches. In fact, Ms. Lake has severe hypertension caused by a renin secreting tumor and elevated table salt intake.
Creating Ms. Lake The renin secreting tumor is turned on and intake of table salt is increased. The new parameter values are:
“Renin Secretion, Tumor Secretion” = 1000.0

Notes
QCP Laboratory Manual
“Diet Goal, Table Salt (mMol/Day)” = 260.0 The units for tumor renin secretion are GU (Goldblatt Units)/Min. Tumor secretion is displayed at the bottom of the Angiotensin panel. Then the solution was advanced for 1 month (43200 minutes). Ms. Lake is ready. Ms. Nance’s thumbnail sketch notes that she’s tired and can’t get enough air. In fact, Ms. Nance is in heart failure.
Creating Ms. Nance This is a new look Ms. Nance who shows weight gain, peripheral edema, and the start of pulmonary edema. She has bilateral dysfunction that has both systolic and diastolic components. The new parameter values are:
“Right Heart Contractility, Basic (%)” = 50.0 “Right Heart Pumping, Stiffness” = 0.0132 “Left Heart Contractility, Basic (%)” = 50.0 “Left Heart Pumping, Stiffness” = 0.0227
Advance the solution 2 weeks (20160 minutes). Ms. Nance is ready.

Notes
QCP Laboratory Manual
Interventions Some useful panels are
Glucose Insulin Glucagon pH
References
I’m looking for some suitable references now.