Embed Size (px)
Citation preview

Quantitative Analysis: Statistical Testing using SPSS
Geof Staniford
Room 731
Email: [email protected]
Telephone: 0151 231 2642
Statistical Testing Topics
• Inferential Statistics• Classification of Statistical Tests• Choosing a Statistical Test• Statistical Test Example• Correlation and Regression• Multivariate Analysis

Inferential Statistics• To infer means to draw conclusions
– Mathematical inference starts from a hypothesis and uses logical arguments to prove, beyond all doubt, that the conclusions follow
– Mathematical inference is based on deductive argument from hypothesis to consequences
– Empirical sciences argue in the reverse using an inductive argument approach that works from consequences back to hypothesis
– Deductive argument produce proofs, inductive arguments do not
– Inference statistics uses probability-based statistical tests to test a hypothesis and say how strong an inductive argument is

Inferential Statistics• Testing a hypothesis using probability
– It proves easier to test the null hypothesis, which is a statement of no effect, relationship or association between variables
– Tests generate a probability factor p (between 0 and 1)
– Statistical testing convention
– p > 0.05 indicate the null hypothesis is true (i.e. there is no effect, relationship or association)
– p <= 0.05 indicates the test results are significant (i.e. there is a significant effect with 95% confidence)
– In SPSS p is given in a column headed “Sig. (2-tailed)”, Statisticians use “2-tailed” to indicate a non-directional hypothesis (i.e. 2 groups differ significantly but the direction of difference is not stated)

Inferential Statistics• Descriptive statistics vs. inferential statistics
– Last week we considered basic descriptive statistics
– Descriptive statistics allow us to draw conclusions about a sample using visual charts and basic measures
– Recall: bar charts, boxplots, histograms etc
– Mean, variance / standard deviation measures
– Inferential statistics attempts to go a stage further by using the descriptive statistics information about a sample to infer conclusions that apply to the population
– Because inferential statistics relies on information about a sample large samples and random sampling are preferred
– Inferential statistics is about saying: “Based on the sample tests I am 95% confident that repeating the experiment many times over with different samples will give the same results”

Classification of Statistical TestsThree main categories of test
1. Parametric tests
2. Non-parametric tests
3. Correlation and regression tests
1. Parametric tests– “Parameter” refers to a measure that describes a frequency
distribution (mean, variance / standard deviation)
– Tests performed on mean value or variance of measurements assumed to follow a normal distribution (or an approximation)
– Examples are t-tests and Analysis of Variance (ANOVA)
– Available in SPSS by selecting menu item– Analyze | Compare Means (simple tests), or,– Analyze | General Linear Model (complex tests)
Classification of Statistical Tests2. Non-parametric tests
– So-called “distribution-free” tests because they do not depend on an assumption that measurements follow a normal distribution
– Tests performed on measures other than mean or variance (e.g. the median or comparison of the number of negative and positive differences between members of two or more matched samples)
– Examples are Mann Whitney U test, Chi-Square test
– Available in SPSS by selecting menu item– Analyze | Nonparametric Tests
3. Correlation and regression tests– To find relationships between independent and dependent
variables measured on an interval scale (more later)

Choosing a Statistical Test• Choosing a test in not easy
– It gets easier with experience and practice
– There is no harm in choosing more than one test provided that the tests are appropriate to the experiment
• Main factors influencing choice of test1. The experiment or survey sampling strategy
– Number of samples (groups) and size of sample
– Inter-dependence of samples (related samples)
2. The parametric / non-parametric question?
3. The number of independent (cause) and dependent (effect) variables and their inter-relationships
4. The measurement scales for your variables (nominal, ordinal, interval)
Choosing a Statistical Test1. Experiment / survey sample strategy
– Single sample, single variable is easy
– For nominal and ordinal data: binomial test
– For interval data: one-sample t-test
– More than one sample is not so easy
– Are the samples independent or related?
– Samples are independent if there is no pairing of subjects
– Related samples occur when same subject (e.g. a person) is measured more than once
2. The parametric / non-parametric question– If you are unsure about this question guides on statistical
testing suggest you use parametric first and if result is significant then use non-parametric to confirm significance

Choosing a Statistical Test3. Number of independent and dependent variables
– More than one independent variable: ANOVA test (more later)
– More than one related dependent variable: multivariate tests
4. Measurement scale guidelines– Interval dependent variables: parametric
– Ordinal and nominal dependent variables: non-parametric
– Interval independent and dependent variables: correlation and regression
• Help is available– Statistics and SPSS text bookS provide tables and decision
trees to help you choose a test – Web links: http://members.aol.com/johnp71/javastat.html

Statistical Test Example
“A computerized records system has been recently introduced into all of the out-patient departments in hospital A. A researcher administers a questionnaire to departmental receptionists regarding the ease of locating and updating patients records. Total scores can range from 50 (most positive response) to zero (most negative response). The researcher administers the same questionnaire to staff doing similar duties in nearby hospital B, which does not yet have the new system”
The scores are listed on the next slide along with boxplots to visualize the scores recorded at hospital A and hospital B

Hospital A Hospital B
23 15 41 36 17 25 38 28 16 31 37 26 33 12 40 29 38 33 36 35 22 20
Inspection of the boxplots suggests that Hospital A (with the new computerized system) does improve the ease of locating and updating patients records

Statistical Test Example• The experimental hypothesis
– Hypothesis: The new computerized records system significantly improves the ease of locating and updating patients records
– Null hypothesis: The new computerized record system makes no significant difference to the ease of locating and updating patients records
– Descriptive statistical analysis (i.e. the boxplots) suggests hypothesis is true, but only for the sample
– We now need to perform a test to examine the hypothesis and determine if sample results are of sufficient significance to apply to a population (i.e. all hospitals) and also determine with what level of confidence (probability) that the results apply

What test do we use for “computerized hospital records system” study?
–Our boxplots show frequency distributions with well defined mean values so we select a parametric test (although strictly speaking the scores for Hospital A are skewed and not normal)
–We use a decision tree to help in choosing a test
–The same participants are not being tested more than once
–We are dealing with two groups (hospital A receptionists and hospital B receptionists)
–So we choose “t-test for independent samples”
Statistical Test Example
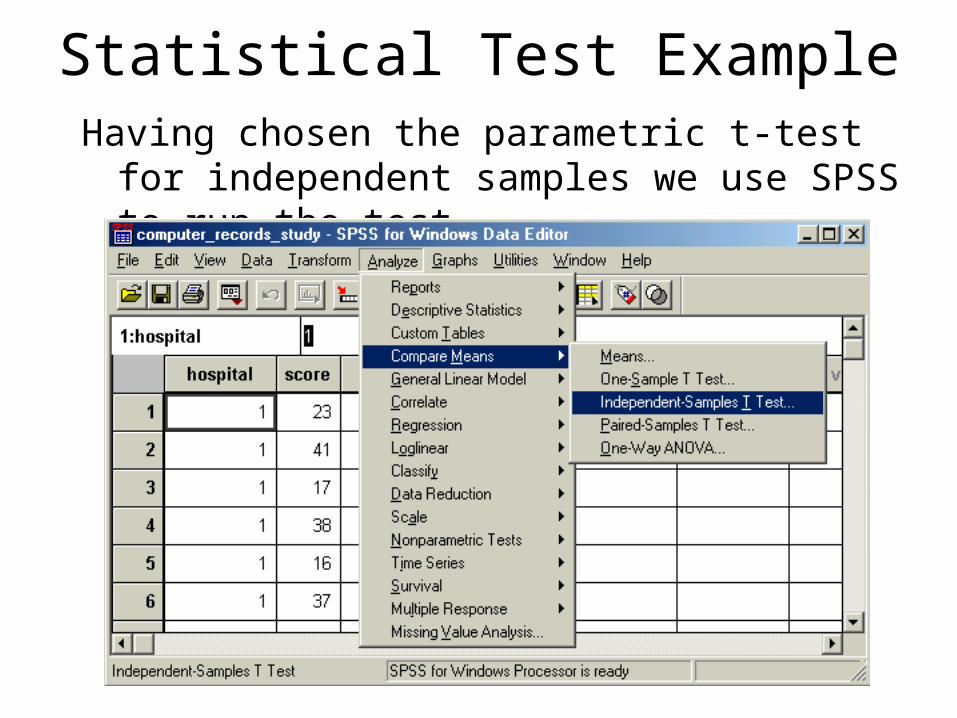
Statistical Test ExampleHaving chosen the parametric t-test for independent
samples we use SPSS to run the test
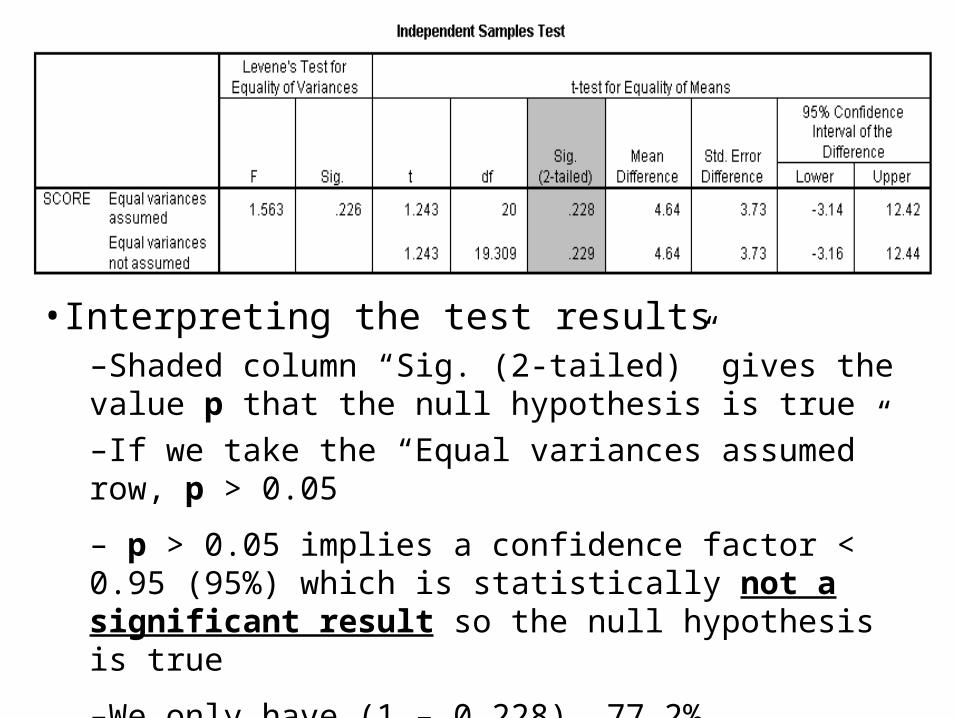
•Interpreting the test results–Shaded column “Sig. (2-tailed)” gives the value p that the null hypothesis is true
–If we take the “Equal variances assumed” row, p > 0.05
– p > 0.05 implies a confidence factor < 0.95 (95%) which is statistically not a significant result so the null hypothesis is true
–We only have (1 – 0.228) 77.2% confidence that the sample
results apply to the population

Statistical Test Example• Supporting your test results
– If you publish your results you must state the assumptions underlying your choice of test (this will impress the examiner and cover your back!)
• Assumptions for “computerized hospital record system” study test– The scores recorded for hospitals A and B have been
approximated as normal distributions with well defined mean and variance values so a parametric test was chosen
– We did not get a significant result, but, if we did, the assumption that hospital A scores were normal may raise doubt
– We could then run a non-parametric test (Mann Whitney U test) to eliminate any doubt
Correlation and RegressionCorrelation and regression
– Used to look for relationships between independent and dependent variables measured on an interval scale
– Such relationships are visualized in descriptive statistics using scatter plots
– We are not interested in mean or variance, but we are interested in finding a straight line relationship between the points on a scatter plot
– Is cholesterol in the blood related to age?
– A correlation factor p < 0.05 indicates that the correlation is significant
– Regression analysis goes a stage further to compute the parameters m and c for an equation y = mx + c from which predictions of y can be made for values of x

Multivariate Analysis
We have only considered univariate statistical analysisStudy the effect of one or more independent variables on a
single dependent variable
Many experiments require multivariate analysisStudy of the effect of one or more independent variables on
two or more dependent variables which are related to one another
Multivariate analysis is beyond the scope of this short course
Can avoid multivariate analysis using assumption that dependent variables are not related in any way at all

Summary• Choosing the appropriate test(s) is the hardest part
of statistical testing– SPSS makes running the tests and interpreting the
results easy
• Use the factors considered previously to help you choose an appropriate test– Refer to a decision tree or table in a text book or on the
Internet if you need help
– Parametric tests use mean and variance measures
– Non-parametric tests do not (they use other measures)
• When you publish your work state the assumptions underlying your choice of test

Sections of the StatPages.net web site
InteractiveStats
FreeSoftwa
re
Books &
Manuals
Demo's &
Tutorials
Other
Links
About this
Website
What's
New
My HomePage
Web Pages that Perform Statistical Calculations!( StatPages.net )
Over 600 Links (including 380 Calculating Pages) -- And Growing! (Updated 11/30/2004 -- check out What's New, and the Awards and Recognition
this site has received.)
http://members.aol.com/johnp71/javastat.html