Embed Size (px)
Citation preview

Quantitative analysis of the mixture of gases resultingfrom the pyrolysis of methyl chlorocarbonate
Item Type text; Thesis-Reproduction (electronic)
Authors Keller, Roy A., 1928-
Publisher The University of Arizona.
Rights Copyright © is held by the author. Digital access to this materialis made possible by the University Libraries, University of Arizona.Further transmission, reproduction or presentation (such aspublic display or performance) of protected items is prohibitedexcept with permission of the author.
Download date 02/06/2018 22:41:55
Link to Item http://hdl.handle.net/10150/319540

QUANTITATIVE ANALYSIS OF THE MIXTURE OF GASES RESULTING FROM THE PYROLYSIS OF METHYL CHLOROCARBONATE
by
Roy A; Keller
A Thesis submitted to the faculty of the
Department of Chemistry
in partial fulfillment of the requirements for the degree of
Master of Science
in the Graduate College University of Arizona
1952
Approvedx 2-Director of Thesis T p k te


ACKNOWLEDGMENT
- , The author wishes to express his most sincere appreciationfor the atihti.ce and aasistanee of Srv Lathrop E0 -RobertSj, under whose direetion this investigation was aa.deo

CONTESTS - : /
IMTROdJC-TIOM. a :» o o 6 . a « e . o o. . 9 ■ a q o ' o ■ -o o o o o o. ■ o • o ' o o' o_ ,-L;
’ QllHTITATiTE DETERMIBTIOE OP METHYL CHLORIDE.; y : ; - . ;■ '. S3- OH : b - b b o o q. o . o o o :o b o' o o o o 0 o. o o ,© o o ^C oinE"u.s t>3.oTi MsiyH o cl 0 o © © © © ©. © o © © © © © © © © © © © © © ■ ST
: QUANTITATIVE DETERMIMTIOH OF CABBOH DIOXIDE o - © © • « . © © © •„ ©\© -28ANALYSIS OF SYNTHETIC MIXTURES OF METHYL CHLORIDE AND CARBON DIOXIDE 35
’ SUMMARY. AND CONCLUSIONS© © , '© © © ©. © ■©•-. ©©'©-© © © © © . © © .'© 3&BIBLIOGRAPHY © © : © / © © © . © © © © © © © ©. © ©. i © © ©■ v. © ..© © . © .©.•© © ©" © % A-0

INTRODUCTION:
In the investigations carried out at the University of Arizona concerning, the thermal Decomposition of chlorinated organic esters, one of the more difficult problems has proven to be the - quantitative analysis of the respiting mixture of gases6 Hardy /l/5 in his investigation of the thermal decomposition of methyl chlorocarbonate, found that the ester decomposed: into methyl chloride, and carbon dioxide: in the temperature range of 320 to 390oCo He i analyzed for methyl chloride by burning the'gas mixture resulting - 'from the pyrolysis in a eombusion pipet and measured the shrinkage in Volume after absorption of the combustion products in potassium ; hydroxide solution He then titrated the chloride ion in the absorbent0 This method assumes that the sample analyzed consists only of methyl chloride and carbon dioxide0 By this method the carbon dioxide was determined by difference and not directly« Such a procedure is always open to question* It w s found tlis-t s, direct determination of the carbon dioxide gravimetri'cslly by absorption on Ascarite could not be made since methyl chloride ims also- Sbsnrbede Yet, Yates /%/ successfully analyzed a mixbure containing carbon dioxide and ethyl chloride by absorbing the former on Ascarite and later determining the ethyl chloride by a method as yet unreported in the literature* The difference in behavior of methyl chloride and ethyl chloride toward Ascarite is soffievrhat surprising* Curry /3/ determined carbon dioxide by the modified Winkler method as

described by KBster / V and Lindner /5/o The results of the analysis when, applied to the decomposition products were not very consistent and cast some doubt on the procedure.o Lashbrook /6/ determined carbon dioxide in a mixture of carbon dioxide and.hydrogen chloride by taking both products up in barium hydroxide, back titrating the excess base with standard acid to determine the amount of both, acidifying the mixture and determining the chloride gravimetriGalIy» The difference between the gravimetric determination and the titration gave the amount of carbon dioxide** The accuracy of this method is very doubtful- because of the low concentration of barium ion,, The literature dealing with the determination of carbon dioxide by absorption with barium - hydroxide and the titration of the excess base to the phenolphthalein end point consistently shows that the titration must be carried out in the presence;of excess barium ion0 This excess cannot be supplied- by the barium hydroxide as this requires too high a concentration of the ■ base to permit an accurate determination of the base consumed in the
absorption of carbon dioxide* Gurry found that the addition of barium--. : chloride gave better results but this makes the determination of chloride in the absorbent impossible* She also found that barium nitrate did not meet the requirements set forth in the literature* BothLashbrook and Curry determined the amount of ethyl chloride by difference* . -' , . ' - .
In summary. Hardy determined, the amount of alkyl halide present directly and the carbon dioxide by difference while lashbrook
and Curry determined the carbon dioxide directly and the alkyl.halide by difference* The method employed by lashbrook is questionable and
that employed by Gurry did not give very good resuifSo - ; : i • .

lates determLneci ^ti^l chlorlcie it th the ‘ :stoichiometric ratio of oxygen, exploding the mixture by passing a spark through it, absorbing the hydrogen chloride produced in sodium hydroxide and titrating the chloride ion0 This method appeared very promising' as it is mch simpler and quicker than anything reported in the literatureo However, the amount of experimental work done on known mixtures using this method was far from sufficient to adopt it ; without further careful investigation^ £ part of this thesis reports s study of the accuracy of the determination of methyl chloride by this method, with the object of determining the best procedure to be followed in the analysis» In addition, the accuracy of the determination of carbon dioxide by absorption in barium hydroxide was investigated, and a method sought for the determination of methyl chloride and carbon dioxide in a mixture without resorting to a determination by difference^

'' . V - D E fE M MITHTL G SO R ID E:; : ' -
v; : \;-ib5 osion'Hetbod':'-.".; :;
Escperimentalt \ ; " , .' .: _• Methyl chloride m s found to be combustible in air0 It
could be ignited with s Bunsen flame and burned in air: giving a selfsustairiing flame of several seconds duration. The reaction for the combustion is e^ressed by the following equation? ;
G%E1^ 3/2. Og ?,m31 f The: explosion method first described by Tates fzf for the
determination of ethyl chloride consisted of'mixing a measured volume of ethyl chloride with three times' its volume of oxygen and exploding the mixture by passing a spark through It, In applying this method to methyl chloride a volume of oxygen one and one-half that of methyl chloride was used. The hydrogen chloride produced was then absorbed in an excess of sodium'hydroxide, neutralised^ and the solution titrated for chloride ion, Yates gives no directions for the construction of the sparking device he used so it. is not known how the one used in this work compares with his, After some experimentation the device adopted was the one shown,in Figure I, Two holes were burned through
a solid rubber stopper with a hot wire and depressions burned with a glass rod at the entrance and exit of these holes (points A and it?’5,
Appropriate lengths of-Ghromel-fi- wire, size 189 were then forced through the holes. Sealing wax was carefully worked around the wires ,; .

5Figure 1
Spark-plug
Chromel wire
Rubber stopper
Sealing wax Tbckiwax
Glass tube
K K

Tsri.th a, hot spatula to fill the depressions and form a tight sPal* An excess of the wax was built up around the wires on the under side of the stopper (points A !)0 The ends of appropriate lengths of small diameter glass tubing were heated until the hole remaining just permitted the -wire, to pass through it0 This portion of the tubes was filled with
small piedes of sealing wax to, a depth of one-half inchl The wires were heated along with the open ends of the glass tubing and the 'tubing slipped over the wires and firmly embedded in the wax at the base of the stoppero The wax was worked with a hot spatula until a tight seal was formed» The ends of the wires were bent to form a spark gapof about three millimeters» Both upper and lower surfaces of thestopper were coated with Genco Softseal Tackiwax* This arrangement, was found to be completely air tight and washings of the lower surface - pf the stopper were shown to be chloride free. The lengths of the wire and of the tubing were chosen so that the electrodes extended about one inch into the.body of a one liter, three heck. Byrex flask when placed in the center neck0 The spark was produced by attaching
one of the wires to the ground and touching a Tesla boil to the other 'wireo One of the other necks waS fitted with a rubber stopper -holding a capillary stopcock tied in with a rubber saddle /7/e The remaining .neck was sealed with a solid ;rubber stopper0 The fla.sk m s evacuated andthe gas samples and sodium hydroxide solution introduced through this / stopcock® 10.1 three stoppers were sealed,by coating the joints with denco Softseal Tackiwax 1 1 ; ’ -tl: V ,: ; Gas samples were measured out by means of a 100 ml0 gas buret ■-calibrated to read 0®2 ml® The outlet tube of the gas buret was connected to a T-tube by means .of a short length of rubber ttibihgo The side arm ,
•of the T~tube lead to a glass stopcock and then to the cylinder of methyl chloride or to the oxygen tank depending upon which gas was being used0 The stopcock was:added to guard against any leakage of the valve on the cylinder of gas -or around the tubing connections to the cylinder<> The other arm of the T-tube lead to the explosion flask*
The tubing connections between the explosion flask/ the cylinder of gas 3 and the gas buret were evacuated by using the gas buret as a Topler pump* The connections and buret were rinsed out several times with small portions of the gas to be added to the flask*The gas buret was then filled with the gas to be added and the : 'stopcock between the gas cylinder and the T-tube closed* During the operation of filling the gas buret a slight pressure was always • ; maintained on the gas so that any leakage would be outward and not inward to prevent contamination of the Sample* The barometric pressure and temperature were recorded, along with thevolume reading * The sample was drawn, into the previously evacuated explosion flask by .opening the stopcock of the explosion flask*' "The volume of the gas
remaining in the buret was recorded* The difference in volumes gave. the size of the sample*
The mixture of gases was exploded and 25 ml* of approximately Ool M sodium hydroxide solution was then draxm into the flask through t the capillary stopcock* Tates exploded samples of about 0*45 millimoles . of ethyl chloride and absorbed the products with 50 ml. of approximately
0.15 B sodium hydroxide solution whioh corresponds to 7*5 millimoles . -of base. In the work with methyl chloride the largest. Sample of 'methyl chloride taken was 2.35 millimoles and the base used contained :at the very least 2.5 millimoles of spdium hydroxide. . In all cases the _

resulting solution m s found'to be basic0 lates gives no reason for using such an excess of sodium hydroxide,, The amount of base was purposely kept low in the work with methyl chloride to avoid introducing any chloride ion from the sodium hydroxide and from the nitric acid used in the subsequent neutralization, ilsop the amount of salt present has a very marked effect upon the end point of the" titration.The higher the concentration of electrolytes in the solution to be titrated the less precise the results. The small quantity of sodium hydroxide reduced the amount of sodium nitrate formed.
The sodium hydroxide was shaken in the flask3 care being taken to coat the sides of the flask and the electrodes with the solution. The minimum period of contact of the base with the products was twenty minutes. Air was admitted to the flask, the seal about the solid rubber stopper broken, theTackiwaxcarefully wiped away, and the contents, added fo a 250 ml. Erlenmeyer flask. The explosion flask, was rinsed out four times with distilled water and the washings added to the flask ,to give a; final volume of 100 to 130 ml. The pH of the solution was adjusted to 4 to e by adding 0.2 ET nitric acid and following the neutralization with Fischer Alkaeid test paper. The solution was titrated with 0.05 N silver nitrate solution using a
50 ml. buret. Six to eight drops of a 0.1 per cent solution of dichiorofluorescein in 70 per cent ethyl aieohol were used as the indicator. The5 end point is the formation: of a salmon pink color in the solution and precipitate. ' ; , y , \
' The silver nitrate m s standardized againstijMerbkPEesgent Grade sodium chloride dried at 110°0 for two hours and cooled for one hour. The sodium chloride v/as weighed, into a 250 ml. volumetric flask

wiiclx had previously been calibrated against a 50 ml0 pipet for aliquot portionso From three to four titrations were made for each weighings Table 1 gives the average deviation from the mean for the various
standardizations of the two solutions of silver nitrate used in the course of the investigation» It is of interest as it indicates the precision of the titration. However5 it must be remembered that the •'solution titrated was neutral and had no excess electrolyte.present„
ih b le 1
Average Deviation from the: Eean in the StandardizatioR- . of the Silver Nitrate Solution
. - ■■ " " ™->-■: - ■ ■■ •Solution . Trial Number of Average Deviation from
titrations the mean in; parts perthousand y y...
: :i : '' ' 1 4 - Go 92' :/y2.. r' a/' .y :I :©»6? V.v .
ii i ■' ' B i -"- 2- • 4 '-t- ;V y ^
3 ; y ' ■' 3 • . y;. yi - A ' - ■ % 6 l
: ^ ; 4 " r.Gtrr..
' . , ■ ' /%These standardizations were carried out mth 5 ml0 of a ■- _ y" y 2 per cent descfcrin solution added:0 ' . ' : t
The weighted deviation from the mean is 0«71 parts per thousand & Thisindicates a high degree of precision for the titration. The standardizationswere carried out at different times during the investigation„ The' . •normalities obtained showed no significant variation indicating: that the.end point was reproducible and that no chldride was introduced by the i :addition of dextrin, .The reason for this addition will be stated later,
Koithoff j Latter,, and Sunde /S/ state that for satisfactory

results it Is sufficient to adjust the acidits'- before titration so that the solution is slightly acid to phenolphthalein0 . The pH should not be less than 4o Preliminary work showed that phenolphthalein is not a; suitable indicator as the carbon dioxide causes the color to fade and' the acidity cannot be adjusted with any degree of accuracy. The - •dichlorofluorescein indleator is a weak acid and its action depends upon the presence of diehlorofluoresceinate ionse At a pH less than 4 the ionization of the indicator is suppressed to such; an extent that it no longer functions0 The Alkacid test paper is far more reliable in adjusting the acidity» •• ;
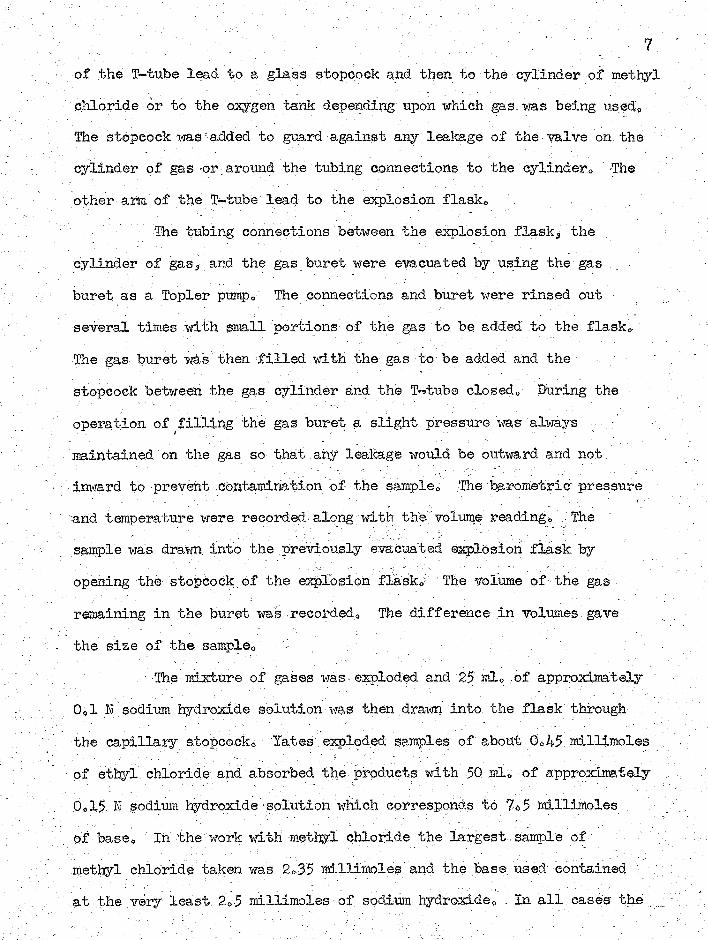
The dieMorofluqresceinate ions are adsorbed on the surface of the precipitate in the presence of excess silver to form a pink Color* Because of this adsorption* coagulation of the precipitate must be avoided because the coagulated precipitate remotes the.indicatot and makes the end point difficult:to detect* Coagulation is increased , by the presence of ions of other electrolytes and such, a situation exists when the excess;base is neutralized with nitric acid* Hurihg- the preliminary investigation blanks were run on the reagents by first titrating;a:definite volume of a Solution of sodium chloride and then titrating a solution containing, the same volume of sodium chloride but with a definite amount of the 0ol N sodium hydroxide solution added to. it and neutralized to. be slightly acid to phenolphthalein with 0o2 Z nitric acid* The end point became yeiy poor and the .deviation from the mes;n increased as greater amounts of sodium hydroxide were used* To prevent coagulation ■ 5 m L of a 2 per cent solution of .dextrin were . added* Table 2 summarizes the results of the effect of the dextrinon the precisions To prevent coagulation* five milliliters of dextrin
IIv . : ; ,, ' : ; ■ 2:
The Effect, of Dextrin on the Precision of the Titration of SbSiain Chloride in the Presence of Varying--Amounts
. of. Sodinm Hitrate. ,. ... / , . ;: .
Amount of 0ol 1: laQE .:- Average deviation from the mean in partssolution added and : neutralized with HNOq
- ■ - . per. thousand . .. _, , . . . ;...
: - (rflio) -Without dextrin , .With .dextrin,.. i.
: - . 20 ' ; • 5o00 • ; 1.18 ,
.>d:.. M :
solution were added to the solution containing the products of the eo#»Ustion in the actual analyses <, . ' .:
■ The end point for the titration is very sensitive to lightand changes from a. salmon pink to a dark reddish purple in a matter of minutes even in diffuse light0 In order to obtain satisfactory - results_ the titration should be carried to completion as rapidly as possible
once the end point is; approached^iEfh thes® precautions in tmindy 2© mlo of approxinstely
0»Q9 BT sodium chloride solution and 2$ mU of 0ol Ixf sodium hydr03d.de. solution were mixed, diluted to 100 ml., two drops of:phenolphthalein indicator added, and the solution:neutralized with nitric acid until slightly acid to phenolphthalein^‘ Fischer Alkacid f est paper showed.the pE to he from 5 to 60 Five milliliters of the dextrin solution were . added and the solution titrated using six drops of dichlorofluorescein .
: indicatoro The results of five trials are shown in Table % -The. quantity of chloride found when the same quantity of sodium chloride - was titrated with dextrin present but without the addition of any ..

12T ab le J '
Utmtion bf the Eeagents Using Besrfcrin Solution With a Constant Quantity of Sodium Chloride Present
Trial- . - • . ..
ffillimoles of chloride found
deviation from the mean in. parts per
thousand
. i: 1*863 1*082 1*863 1*08
1*860 0*55: : lo859 . 1*08 '
5 1 1*862 . ©*55Beam. , .' 1*861 fo.8T. ; .
sodium hydroxide or nitric acid was 10862 millimoles on the basis of four titrationso This indicates that the chloride introduced by the . reagents was negligible0 The standardizations showed the. dextrin to be chloride free,,
When actual analyses of methyl chloride samples were undertaken it was found more convenient to run a. series of explosions and save the solutions to be titrated as a group» The results are divided into Series on this basis-* The last series. Series E, was made in such a mnner that the .temperature of the. gases at the time of explosion was varied in order to determine whether the explosion would be affected by the temperature* After the gases were added to the explosion flask,. the flask was damped in' a crock filled with water* . The water was stirred, by . means of an air stirrer an# the temperature measured by a thermometer calibrated to 0*1°0* The mter was either cooled by adding ice of heated by bubbling Steam through it* A rubber stopper holding a similar' thermometer was substituted for the solid rubber stopper in ;■

-the explosion £2a;sk0 &s soon as the -temperature of the thermostat and the gases in the flask were x-d.thin a few tenths of a degree of one another, the explosion was initiated, : v : : '■ y . :
Baring the eourse of the investigation it was found that y several of the gas mixtures did not explodeo It was thought that this laight he because the pressure of the gases in the flask was too lorn In order to test this a gas storage bulb containing a mixture of methyl chloride and oxygen was connected.to one neck of the explosion flask and a manometer to the other© The flask was evacuated and small samples of the mixture added to the flask, pressure readings being taken direetly0 After' each addition, the manometer was cut off from the flask by means of a stopcock and a spark passed through the mixturee On the basis of two trials with" two different mixtures, the minimum
• pressure for an explosion was found to be 52 mim of mercury total i i pressure in the' flask© ‘ Since all of the 'explosions that failed were y-. above this pressure the failure was not because of insufficient ■’
pressure© • - : ., r-'v ; - " VyA calculation of the number of millimoles of gas in a 50 ml©
sample was carried out by the. van der Waals equation, the ideal -gas ' equation, and the Berthelot equation: -assuming the pressure to be;700 rnm0 and the temperature to be 25°Co The Berthelot equation and the van der Waals equation were solved for. the volume of one mole of the gas at t these 'condltiohsa The number of millimoles in the sample .was then . found by dividing, the, actual volume taken by the volume of one mole©- ' The van der Waals equation'gave,'loB^W Milimoies,. the-Berthelot. equation gave 1,9099"millimoles and the ideal gas equation gave 10 8819 millimoles© Assuming fhe van der Waals equation to be correct.

the Berthelot equation gives results that are OV53 per cent high while the ideal gap equation gives results that 0e.94 per cent low0 Since the van der Waals equation is too difficult to solve for practical- purposes because it is a cubic: equation in terms of volume, the Berthelot equation was used to calculate the number of millimoles in the sample because it gave a smaller error than the ideal gas equation^
Results? / : "yt:.: : : ; v ' : i-:"
ihe results of; analyses by the explosion method are given in ‘Fable 4o The explosions are arranged in the order in which they were; mdey a. Series being a group of consecutive , titrations of the produetso The various column headings give the following informations Klliml GH^Cl taken — the number of millimoles of methyl chloride in ■V; y the sample-.as calculated from the Berthelot equation0
Tole Og/tblo GIT Gl ”■ the ratio of the volume of oxygen to that of the;q. .methyl cfalofidet.', ■ i;:. f " : "
Pressure- the total pressure, in the flask;at the time of explosion in millimeters of mercury, that is, the sum of the partial
■; pressure of residual, air due. to incomplete evacuation (at the most this was three millimeters) and the partial pressure of
...t v; .the.mixture added, as computed by Boyle’s and Gharles’ laws® ' ;
Period of contact - the period of contact of the sodium hydroxide , solution with the products .of the explosion in minutes^
Tempo - the temperature of the gases at the time of explosion in degrees '
■ Gentigradeo : y - v l - : : • V% error - the percentage error which was computed by taking the difference
between the number of millimoles of chloride found and the

nmtber' of millimoles of gas calculated, dividing by the latter, and multiplying by 100o If the results were high* the percentage error is preceded by a plus sign and if they were lowa the error is preceded by a mnus signe , V'- :
IE denotes that no explosion took place and denotes thatthe electrodes were found to be coated or corroded and the failure of . the explosion is thought to be due to the poor spark produced because , of,this coating* : ;.
Kble 4.Results of Analyses
■ Trial : Mllimo ■ ; GHoGl
. taken. ■: ¥oIo 0g Pressure
"v #1,Periodof contact
.:. . miHo. . . .
Temp, ^ error
Series A■' ■ 1 1=893. 1,63 - 84,37 20 25,1 * 2, 58' t 1=979 1,53 .85,5 20 27,9 0 ,153 1,968 1,48 83,0 30 27,2 - 3,354 2=007 1,39 81,3 . 2# 24,7 “ 3,44
; 5 . 2=186 i,5i •; ■' 91,9 3# 23 ,6 ■ “ 5,2.6Series B , - : - j -
6 lo97© 1,54 85,1 2C6 : ■ - 5,037 1,53 . 80,2 23,1 ' : w m .S 1=906 1,54 81,9 25,8 3,889 1,949 - 1,52 . . 82,9 - y - 24,6 “ 5,9510 1,96# 1,61 85,5 21,2 “ 4,84'11 2,034 i,a . 86,1 22,5 - 6,24 ' '12 1,960 l,5i-.-: 83,9. 26,7 — 4,8013 2,3^ 1,53 100,7 26,3 — 6,18
Series € ' .
14 2,353 1,55 101,2 27^9 ^ 3,9115 2,058 1,57 100 4 29,1 “ 4,1316 1=827 " 1,52 : 79,4 —^ - 29,4 - 5,1517 eoeeewseeee, • 1,52: ' v 72,7. :: - 28,2 W
, IS 1,763 1,54 77,3 29,4 ™ 3,97: 1o52 72,5 . .2 9=8 .... .... .#*7.... . . .

16'Table 4 continued
■ Trial Mllim0 - ' CHoGl.. taken
:,i vbi, 0g Pressure : mm.
Period of contact mitt, .
Temp. error■ Tolo CH3GI
Series D20 2o329 ■ . ' 1,54 100,8 :: 3 5 29.0 13,65
7 2o229 '7 1,53. ; ._ 97,1 ■ 30 31.3 -3.7322 2 0201 : 1 ,5s - 96.6 4 . 35 2876 ”■ 3. 68
- 23 2,200 1,55 96,2 50 30.6 - 3.5024 2o00g 1,52 87.1 45 30.2 . -1,54
. ; 25 2,321 1,53 37 99,8 ■ " 60 . . 28,5 —• 2,83'26 2,350 1,52 101,6 6# 313 -4,4727 2,176 1,61 97.6 ' : 70 30c;8 - 2.8528. 1,941 1,53 84.3 . 60 29.6 —- 2,16
Series B '29 2,216 1,58 93.4 40 . ,15.1: =r 1,0830 : ' 2 ,199 I 1,6© . 93.4 40 - 15.2 : " 2 ,18 ' :31 2,021 1,54 84.3 •" •15.1 - 2 , 52 :32 2,136 1,52 89.1 60 18.0 1 2 . 6 233 2,057 1,54 87.2 •77,3 5 - 2 0 , 0 ;.7^:5,01734 : 2,247 - ■ 1,5© 94,0 2 1 . 9 ' 1 2.4535 .‘ 2,046 1,56 88.9 45 25.0 - 2.3536 2,113 1,64 :- 7 95.2 40 28.0 — 2,9837 1,936 . -1, 54 ' , - 85.7 45 3%0 . - 2,51 ■.38 2,092 •1,53 92.6 ’ ' 45 35,0 -2.8739 2,210 1,50 96.6 7 65 35.07 - 2.0440 2,060 1,55 93.5 V # 40,1 — 2.6741 2,19# 7 1,55': 98,9 m 40,0 7-5.1142 2,288 1,57 #5.8 80 44.9 0 2,1443 2,022 1,54 91.0 ■ 4© 45,0 -2.52744 .2,061 1,52 95.4 195 50,5 — 0.58
.45.: 1373. . 1,54 . : 96.4 145 ; 50.1 7. ■=> 2,38. _
Treatment of Results ?. , : ■The mrious Statistical measures referred to in this section
are taken from Hoel /9/o, The mean and standard deviation cannot be computed from the
absolute values of the error because of the positive and negative values involved3 that is, if the absolute value were used, the error of .-p 20J $
per cent would have the same significance as an error of - 2»5'8 per-cent

: \ ,:/ ,:. /,,.;/- v . r: : ^ ; - * -.;: .,:.,,:. - : : v • ^and any conclnsions reached would be false0 Therefore a - 3 was added to each percentage error and the results multiplied by --1,10 The result of the computation of the mean wsp.then changed back by subtracting three • from the restilt and multiplying this value by - 10 Using this method the .mean; error", m, for the forty-tv/o successful explosions is - 3ol5 per cent and the standard deviation, s, is 116$ per cento If tt is ; .assumed that the sample investigated comes from a- normal population. " -then m + 2s ineludes.' the values from * 0o15 per cent to - 6045 per cento This may be interpreted as meaning that 95 per cent of the data may be expected to lie between this limitso Similarly, 99e'| per cent of : ^the data may be expected to lie in the range of m 3s or between I*SO per cent and SQ10 per cento Explosion 1 shows an error of * 205S' per cent which lies well, .outside the m 3s limits® s Therefore, ,the probability of attaining such a result from a random sample is less than one chance in 20p® This, indicates that the error is more likely to be due to a definite cause instead of resulting from randomness of sampling and and may be discarded with some degree of safety® If this result is
omitted the new mean becomes - 3®29 per cent arid the new standard deviation 1041 per cent® The new limits for m +, 2s become - 0®47 per cent and - 6®11 per cent; the new limits for m + 3s become f 0®94 per cent and - 7®52 per cent® Some of the remaining results lie outside the m + 2s range but not outside the m +_ 3s range® Therefore they were not discarded as five per cent of the data may be expected to do this® Therefore, in this method of analysis, the mean error is - 3®29 per cent and 95 per cent of the results may be expected to fall in the range of - O®#? per cent to - 6® 11 per cent® This would indicate that :• the method is neither yeiy accurate nor precise® .

: y • -: . y- / ; . ; ;■ : , ' yj-./y'.,y • ■■■ : :.y : y .. m
' : ' Tlie next, statistical measure applied x<as the linear correlationcoefficient^ r0 :It -was used in preference to the curvilinear correlation, coefficient as the scatter diagrams of the percentage error plotted against the various variables considered, namely, the nd.llimoles of methyl chloride taken, the ratio of the volume of oxygen to methyl :ehloride, the pressure in" the flask at the time of explosion, the period- of contact‘of the base with the products, and the temperature at the time of explosion did not show any particular trend towards a curve0 The correlation Coefficient may be interpreted as follows r If a least-squares line or regression line is fitted to the data considered and the line passes through all points plot ted., then is unity and" ; the fit., is 100 per cent (= r^ x l00)b However, if the data are such that if a plot of one "variable against the other" gives" merely a cloud of points such that a regression line drawn in'any positioh-fita: the " data equally well, then r^ approadies zero = Theresults of computing . the linear' correlation coefficient for unclassified data considering the percentage error as a function of the various variables are as t
. follows: y't - • .Millimoles ..of methyl chloride taken: V ;
r- = 060033 dr 0*33 per cent* This"indicates no significantrelationship of the percentage error to the size of the sample takenin the range of 1*76 to 2»36 millimoles, this is to be expected as the percentage error should be independent of the size of the sample except for a wide range of sample sizes, qEatio of the volume of oxygen to that of methyl chloride:
yr2 = 0o0385 or 3,85 per cent* This indicates no significant =relationship of the percentage error to the ratio of the f.oiumes of the
" : V V:: -- ; V i / ■gases in the range of le39 tolo64o thus the ratio of the volumes does not appear to be a. critical factor0 However^ if the ratio drops too • ■/:.■ . low, incomplete combustion may be expected and a much greater error ..should result. This apparently was not encountered in this investigation* Pressure in the flask at the time of explosion?:
' r - = 0,0253 or 2,53 per cent. There is no significant r relationship of the percentage errorto the pressure.in the flask in the range of 77o3 to 101,6 millimeters, It m s thought at one time that the pressure might determine the propagation of the explosion .
through the flask, , -1 I ; 1 - ,The time of contact of the 0ol N, sodium hydroxide solution with the - -
..v products of the explosion? 1= @^1165 or lie, 65 per cent. The relationship is somewhat
; stronger but is still quite small. In order to investigate this more V pr . fully5 the percentage error was arranged with regard to the period of , contacto The results are shown in Table 5, This indicated that the error is almost constant with varying periods of contact in the range of 20 to 195 minutes, . o . ' ^The temperature of the gases in the flask at the time of explosions
..-./ r = 0,3682 or 36,02 per cent. This is the .highest value . TOf the cofrelation coefficient yet obtained. However5 Series E ■was made with temperature as the specific variable and it shows the error to be independent of the temperature in the range of 150C to 50°C9 \ ,
: The last statistical measure was a test for the randomness' Of sequence. If the errors having a algebraic value greater than the mean error are assigned a value A and those with an algebraic value
less than the.mean error- the letter B then the sequence is? . :

. mia e 5 V ' ' ; "The- Percentage Error for Various Periods of Contact
of the Base mth the Products of Combustion .
Period of contact Trial . ; . Pereentsge error .
36 '3 '■ 5 •
i. . s m :
.'.'4' - 3.35 5.26
v - 3.73 - f - 2.45 ;
—' 3 ®7©
v. ■ ' 20 , 22 33
• MWn...
. ' - 3.65 . - 3 .68 . -i ” 3.01
^3.454;%'29.30 ; ;
#4041 43
Mean
-1.08 . - 2018 . . ^ 2.52 " — 2.98
/ . ; ■ 4 2.67 '. - 3,11
, - » 2.52■'■■■•■ f'
~ 2.44
45 f : / 24353738.Mean-.
- -1.54' - 4 - 2.35
- 2.51 .- 2.87 - :
” 2.32:V ;: 25
26 28 32Mean,
2.80 - 4.47
2 .16- 3 . 0 1 ;
27 - 2.8542 -2.14
4:.. :„.45.;;. -,2q3S. „

There are three' runs of A ,:s .and two rmas of BS:s or a total of five runs* There are twenty-two £ 's and nineteen Brs0 If it is assumed that the number of £ ‘5 equals the number of Bss (=20) then aeeording to the table in Hoel, the total number of runs at the 2*5 per cent significance level has a miniiaum value of fourteen* The conclusion is that - the probability of obtaining this sequence is much less than 2*5 chances out of 100* This indicates that the sequence is not at all random*Table S gives the mean value of the error for the various series &
Table 6 .Bean Error for the Various Series
;iSeries . . .Bean Percentage,Error
r A ' f'/v i.B ■
' ' P :■■ ^ 5*27 ; 'V ' ■'I, mQ . ..
B^ J$q<c7
, - 3*15 V -E
The results within any series appear to be random but there is a marked trend towards:a decreasing-error from series to series0 Ho explanation for this is.offered at this time* The standardizations of the silver' nitrate were carried-.but at different times and: were in close agreement so that it does not appear to be a matter of the ,.. . ■ standard solution changing in concentration nor a matter of indicator erroro If the titrations had been carried out in such a way that the Various Series were titrated tS' a- different color, this shbuld;:have : also been the case in the standardizations„ The standards were also arranged so that the concentration of chloride ion in the standard .
was of the same mgnitude as the concentration in the solutions resulting fi*om the; explosions : ' V '
- - ■ C&Austidn v" .1;' : . 'v
Ko final conclusioii about the accnracy of the explosion method could be made until the purity of the methyl :-chloride used could be ; established by some independent method -of analysis o. The combustion method of Ibrtinek and larti /1G/ was modified to fit the apparatus , amilable and adapted to a semi-micro scale rather than a micro scalev Experimental % . ■ r ;'1 - A gas pipet was constructed consisting of a capillary tube .
sealed to each end of tube i« 6 cm» in outside diameter and. 1 1 - emo long0 Calibration marks xfere placed oh the capillaiy tubing and the volume between the marks found from the weight of water that could be held, between, the two calibrations and the density of the water at the - temperature at which the calibration v?as mde 0 Three independent
calibrations gave a mean volume of 1 6 075 + #@01 ml0 £ 'two-way stopcock was attached to the top of the pipet so that the gas samples could be drawn, into the pipet through one. tube and then admitted to the stream of air going to the combustion tube through the Othero M r was drawn through the furnace by means of a :water .pump. It was first passed over calcium chloride .and. soda lime and then drawn'into a bulb attached to the outlet tube of the gas pipet where the methyl chloride
was mixed with it. The methyl chloride was. driven into this bulb by regulating the flow of mercury into the pipet by means of a screw clamp fastehed to the rubber tubing leading from the mercury leveling

: ■ . - ■ . : . ; ? -= ' ' 23
: bulb to the pipeto The mixture of;methyl chloride and air was passed into a Vycoor combustion tube 55 cm. in length"v/ith an inside diameter • of ■ 1 03 , CHio nfhe’ tubevmbs heated by'; means of an electric resistance furnace of 33 cm0: outside lengths• This gave a. somewhat shorter arrangement than used by lartinek and Martia The products of the combustion were . then passed into two gas absorption tubes in series through sintered- glass bubbler tubes* The absorption tubes were about 11 cm0 high0 The last tube was connected to a safety bottle and another bottle filled
with water which ms- attached to the■ mter-pumpo The bottle of water. m s used to estimate the rate of flow of gas through the system byobserving the rate at which air, after passing through the combustion. " train, bubbled through it0 Martinek atti Marti took one hour to burn r,5 mlo of gas at a temperature of 1000°G with a rate of flow of 0o5 . cubic feet per hour0 The furnace used in -this-work attained s. tempenature of 950°(J in one and one-half hours With no resistance on a variable ' resistor in series with it* This m s considered to be about the maximum temperature possible* K rate of flow of 0,5 cubic feet perhour m s found to be much too fast, as the gases were not heated -
sufficiently because of the shorter furnace and the lower temperatureo Therefore the rate of flow was arbitrarily adjusted so that the rate' of bubbling'through the bottle filled with water ms just past the point where the individual bubbles could be counted* /
Three hours were taken to burn the sample*‘ The hydrogen chloride formed by the combustion was taken up
in 40 ml* of a one per cent solution of. sodium carbonate saturated with srsenious oxide which had been filtered to remove the excess of the oxide*, After the combustion this solution m s carefully washed into-a

1 0 0 r.olD volumetric flask previously calibrated against a 25 ml0 pipeto Three washings of the absorption apparatus were made using no more than 3 0 mlo .of water for the operation and the washings added to the flask* it the same time^ 40 ml* of the absorbent were placed in another 100 ml0 volumetric flask calibrated against the same pipet* This second solution served as a blank* Five milliliters of three to one nitric acid solution were added to each flask to neutralise the carbonate,, exactly 25 ml0 of approximately 0 o026 Z silver nitrate solution, added to each ;flask and the solution diluted to the calibration on fhe flask® This : volume of silver nitrate solution furnished an excess of silver ibn*The solutions were then filtered through dry.sintered-glass filtering crucibles into perfectly dry filtering flasks to remove the silver Shloride* The filtering apparatus was all glass* The pipet used in the calibration of the volumetric flasks was used to withdraw three samples from. the determination and from the blank for titration® The solutions were titrated for the excess silver ion in 100 ml® Erlenmeyer flasks with a 10 ml® micro buret calibrated to read 0*05 ml® with 0*021 I potassium thioeyanate solution using 10 drops of a 50 per cent saturated solution of ferric ammonium sulfate solution as the indicator®In the analyses the sample was titrated and a blank titrated immediately afterward to the same color® The difference in volumes used for the determination and for the blank multiplied by the normality of the thioeyanate solution gave the millimoles of chloride ion in the
■ determination® This procedure has advantages in that the exact concentration
of the silver nitrated solution was not needed, the indicator error was reduced to a minimum, and no error was introduced by chloride in the
reagents®

• : In this and all other titrations following the volumes of theV titrating soltttions were/eohrected to 20^^ ' . ' ; r:
toe. pbtasslw tMoeyamte-ms : standaiTdlaed against silver ' nitrate as a primary standard* ',The silver nitrate was- purified by .
dissolving it in 3,:# nitric acid and filtering it in an all glass system to /remo ve - dhst and - lint« ' toe solution m s concentrated to - the saturation point on a steam hath; the silver nitrate allowed to crystallize and the crystals collected on a sintered-glass filtering crucible,, ' The ;erys'bals were dried at 110 0; for one houry placed in a porcelaincrucible and heated in a sand bath to above the melting point for ten ‘minutes o On cooling the silver nitrate was broken up and placed in ;
- a weighing bottle0 The product m s perfectly clear and showed no" - o 'd
discoloration^ The silver nitrate m s weighed into a 100 ml, volumetric flask previously calibrated against, a 20 ml, pipet, • * Samples were taken - ' ,v. . ..
: with tliis pipets acidified mth, 5 ml, of 6 H nitric acid and titrated "in a 100 mlo Erlenmeyer flask with the pdtassium thiocyanate solution using a 50 ml, buret. Ten drops of indicator were used. An indicator' blank of distilled water and 5 ml, of acid was run nvith each titration.Barium sulfate m s added to serve as a background in observing the color!Two separate .weighings were made and three titrations made of each sample weighed. The deviation from the overall mean was 0,83 parts per thousand showing a good degree of precision,Results: ' : ; ' %
. -. Two cylinders pf mehhyl chloride were available, Oylinder 2'was the one from which the methyl chloride was taken for the work onthe explosions, : The results of the analyses are shown in Table; 7, As ; ; before, the size of the sample was calculated from the Berthelot equation.

' v''v v ' ' ; - - 2gfeKLe. 7 ; : v : ■
Eesults of the Combustion of Methyl Chloride
Combustion Mllimo GHoGl taken;
Millim, found (mean •value)
Number oftitrations■ - ’ ^
Aver, Demation . . from the mean (parts/1 0 0 0)
% error
Eds cylinder 1 .i : - ©o6l9a • 0,6187 .- . ' 2 : 4,5 0,18
©0624a 0,6160 3 : ; : 4,2 : .-»■ 1,413 ©,623© 0,6233 ' %/:-3 , 2,1 — 0,054 ©06202 " 0,6172 .3. 1,6 w 0, 48
©as cylinder 2 . / ' - . -
1 . ©,6266 0,6198 3 5,7 - 1,09. 2 . ■; -0,6295 0,6312 ■ 3 . . 4,0 ■f 0 ,27"
3 0,6297 0,6323 ■ 3 ; . ,■ &7 + 0,41- 4 0,6297 : 0,6298 . 3 4,1 + 0,02
0,6288 0,6344 . 3 -/t: 5,7 + 0,89
— Treatment of Results: . : ' ' .: For gas cylinder 15 combustion 2 shows an error somewhat larger
than usualo The method is subject to loss of chloride in poor washing technique so that the omission of results showing a large error seems justified especially if the error is negative. . On the'basis of combustions 1, and 4 the mean error is — 0o24 per cent. For gas' ‘cylinder 23 combttstion 1 may be omitted for the same reason making the
■ mean error > @o40 per cento:' ' 1:- ’ :’: , . fhe.precision is much poorer than in' the .standardization0
: This is probably indicator erroro Thequantity of precipitate formedin the blank is quite a,bit more than in the -determination which ■ changes' the background against which the colors are matched and this may be the
: source of errore f j . ' --f; - . x - \ v " ■ ■ 1. -; : ... ; ' These analyses indicate that the methyl chloride is within-: :;

0o5 per cent of being pure and. the deviations resulting from the explosion technique cannot be explained by the impurity of the methyl chloride.
L: A search of the literature showed that one of the more successful
volumetric; determinations of carbon, dioxide is the absorption of • the' gas in stamdard barium hydroxide solution with M r i m ehloride added and the >■
titration of this solution with standard %rdrochloric' acid to a veiy feint pink using phenolphthalein as the indicator0 This is a modifieatibn of the original Winkler method / V /5/» Kolthoff and Stenger /ll/.reoommend a barium Ion concentration of ©oi l at the end point9 Tfuog /Is/ used four drops of" atone per cent solution of phenolphthalein ' in 95 per cent.ethyl alcohol fpr a titration where the final volume was 200 ml. ■ ' ... . ' -.I " . ; '
Carbonate free distilled water was siphoned into a carboy . ;‘ that had been rinsed with ethyl alcohol and dried by passing- carbon ■ f dioxide free air. through it. The carbon.dioxide free air was produced by"forcing compressed air through a concentrated solution of sodium hydroxidej, a tower containing; soda lime5 and finally through,a calcium chloride tube containing Ascarite. An 0.04 K. solution of hydrochloric acid m s prepared from some of this water and stored in a stock bottle r previously rinsed with alcohol vapors. The stock bottle was attached by means of glass tubing to a. 5© hlL buret equipped with-a two-way stopcock which permitted the buret fo be filled from the bottom. The
a.eld m s pumped into the buret by means of a rubber hand bulb; the latter being attached to a drying tube containing Ascarite so that

. carbon dioxide was removed from the air ptmped into the stock bottle* ■ The. top..of :the;&ret was-ai;so. equipped mth a drying; tnbe of is"carite»In this way5 the solution was completely protected from the carbon
dioxide in-tbe-aira : . - . , ' : f i - ^A solution of barinra hsrdroxide containing- barirmi was prepared,
so that the concentration of the base was 0*05 Stand the Concentration of the barium chloride was such that if 50 mlL of: the.solution were taken and diluted to 200 ml 0 the final concentration.'of bariugi chloride m s Gol So This would be 0o4 H with respect to barium chloride in the stock solution0 The reagents were mixed in a six liter flask protected ' Sj a ibda’' lime tube and the barium •Carbonate allowed to preeipitate0 The amount of barium carbonate was appreciable as the solid barium • ......hydroxide was quite old and contaminated.with earbonate0 This was filtered directly into a paraffin coated stock bottle by means of a Buchner funnel using a double layer of filter papero During the filtration the funnel was never allowed to emptyl completely,-- to prevent air from entering the bottle0 The stock bottle containing the base was:• connected to the same type of buret as that used for the aeid0 Whennot in use, the tip of the buret containing the base was. protectedfrom the carbon d%ud-de in the air by immersing it in a test tube of distilled wafer0
The acid was sta/ndardized- against Merck Eeagent Grade sodium earbohate dried at 110®d for two hours© A- few drops of a Oil per cent solution of methyl red in 95 per cent ethyl alcohol, were used as the :
indicator© Oh nearing the end point, the carbon dioxide was boiled outof the solution and the titration continued with the solution hot© On the basis of three weighings and four titrations for each weighing, -
the average deviation from the mean was 0*96 parts per thousand0Samples of the barium hydroxide solution diluted to 150 mL0
were titrated with the acid "to a very faint pink using 4 drops of phenolphthalein indicator in the presence of added barium sulfate which gave a white suspension similar to that encountered in the titration, of carbonate samples0 The titration was carried out in a 500 ml*
flask equipped with a two-hole rubber stopper* 1 glass tube projected through one hole to a point just above the-surface of the liquid and carbon dioxide free air was forced through this tube. The tip of the acid buret projected into the flask through the other hole* Before addition of the base to the flasks the flask was rinsed out with alcohol and dried by forcing carbon dioxide free air through it0 The flask was kept stoppered as much as possible0 On the basis of.eleven titrations the mean normality was found to be O»05O43 and the average deviation from the mean was 1032 parts per thousands The greater . deviation is to be expected due to the inability to split drops using •the rather cumbersome arrangement to protect against carbon dioxide
Samples of sodium carbonate were weighed into a 250 mli - volumetric flask, dissolved in carbonate free water, and one-fifth taken and pipeted into a flask.rinsed out with alcohol vapors« • The pipet was protected from .the breath by means of a drying tube filled with Ascarite* . A measured volume of the barium hydroxide solution was added to this, the solution diluted to 150 mLe and titrated with the'add* Since this did not involve the addition of any base or acid to the solution
and all. the carbonate was precipitated before the titration, the same amount of acid should have been required'to neutralize' the base as in the standardisation of the barium hydrojd.de solution* Table 8

' 31indicates that more acid was required than calculated from, the volume
/ of the base taken. The last column indicates the number of millimoles . of carbon dioxide corresponding to this difference in the volumes of acido This is interpreted as indicating that some of the barium carbonate
• . Thble 8 ' -
■ Results of Titrating Barium Hydroxide in the Presence of Sodium Carbonate
Trial Tolo- of acid Fbl, of acid Difference calculated used in volumes v -(tei,-)' (ml,) (mLo)
milim, of G02 corresponding to this difference
Go8274 millimoles of sodium carbonate present in the solutiontitrated, •;i C D 52018 5Z0M ' Go 64 0.012892/ (1} 43.47 43.98 0,51 @*0102?'3 (D 37.19 _ . 37.75 0.56 •'@.011280o8096 millimoles of sodium carbonate present in the solution titratedo1 (2) 34.87 35=73 0,86 0.017322 (2) 35.62 36.43 • 0.81 • 0.016323 (2) 36.89 37.89 1.00 0.020154 (2) 34.42 /, 35.40 . 0.98 -• @.©1974
millimoles of sodium, carbonate present in the solution . titrated,, . .. "r; ;1 (1) 36.46 36.96 Go 50 Go 010072 (!) 38.58 39.16 Go 58 = 0*01168.3 (2) 35.56 . 36.62 1.06 7 0*021354. (2):, 35.11 35.99 . . ,0.88 ; . . O.01773......
(1) Acid added slowly with vigorous agitatiorio (!$ Acid added slowly with mild agitatiohb
reacts during the titration. In an actual analysis? more acid would be used than theoretically called for indicating that less base had been consumed than should be* This would lead to low results for carbon dioxideo It was noticed that the end. point was less distinct than when, the base was titrated alone. Table 8 indicates that better results

v '■ : ' • :. - v \.:y .S-..;:are obtained id.th vigoroias shaking o£ the solution and that the error is about 0o01 mllimoles of carbon, dioxide and is. independent- of the amount of carbonat e pres ent a ' • ; : : ' .
Ihe analysis of measured samples of carbon dioxide was under-* taken* A nitrometer bulb was fitted with a rubber stopper at the base ■ that fitted the 500 mlo titration flask* The cup on top of the nitrometer bulb was fitted with another rubber stopper which held a drying..tube \ filled with Asearite- and had a larger hole bored in it that would accomodate the buret tipa A cork was.placed .in this hole.to prevent air from entering the cup0 The nitrometer tube was evacuated. by means -of the; vacuum pump and attached to the gas buret by means of nitrometer 'tubingo 1 cylinder of commercial grade carbon dioxide m s connected to the side arm of.the T-tubeo All coruaections-were held by hose ’’clamps» Fifteen milliliter samples of carbon dioxide were added to the "nitrometer: bulb in the same W#ier as that in which the methyl ; v . i : •chloride was added to theexplosion flask0 The cup at the top of the : :bulb was rinsed•out with carbon dioxide free air'and.about A5 ml* of .the barium hydroxide-barium chloride solution added to the nitrometer v ;. % bulb through the:cup.directly from the buret0 During this Operation .and the operations of washing a. little of the-liquid-was. retained in •the cup " to prevent air from entering the bulb* The cup was then.-r-rlnsed several times with carbonate free distilled water and the washings added to the .nitrometer bulbo ' Finally the pork was; placed in .the , \ - stopper and the last of the wafer and air admitted to the bulb* - In .
so doing, the air was first, passed over the Iscarite to. remove any : carbon dioxide6 This solution was shaken well .and allowed to be in
contact with the .gases’ in the bulb - for about forty minutes’ The . - d : iy

L: A search of the literature showed that one of the more successful
volumetric; determinations of carbon, dioxide is the absorption of • the' gas in stamdard barium hydroxide solution with M r i m ehloride added and the >■
titration of this solution with standard %rdrochloric' acid to a veiy feint pink using phenolphthalein as the indicator0 This is a modifieatibn of the original Winkler method / V /5/» Kolthoff and Stenger /ll/.reoommend a barium Ion concentration of ©oi l at the end point9Tfuog /Is/ used four drops of" atone per cent solution of phenolphthalein 'in 95 per cent. ethyl alcohol fpr a titration where the final volume was200 mi. ; ■ ' .... / ' - " . '
‘ :j‘ Carbonate free distilled water was. siphoned into a carboy that had been rinsed with ethyl alcohol and dried by passing: carbon ■ f dioxide free air. through it. The carbon.dioxide free air was produced by"forcing compressed air through a concentrated solution of sodium hydroxidej, a tower containing; soda lime5 and finally through,a calcium chloride tube containing Ascarite. An 0.04 K. solution of hydrochloric acid was prepared from some of this water and stored in a stock bottle r previously rinsed with alcohol vapors. The stock bottle was attached by means of glass tubing to a. 5© hlL buret equipped with-a two-way stopcock which permitted the buret fo be filled from the bottom. The
a.eld was pumped into the buret by means of a rubber hand bulb; the latter being attached to a drying tube containing Ascarite so that

aitroraettr bulb was then placed oh top of the 500 ml0 |lask previously v rinsed out with alcohol xtapors and the solution drained Into the flaskZ 'The sides of the bulb were carefully washed with carbonate free distilled
‘ -water , by placing the entire apparatus un@er the carboy containing thewater ahd . adding- the water 'directly to the nitrometer' bulb through the ' • cup<> The water ran down the sides of the bulb directly into the titrationflaske Washing" was continued until the rolume of the solution reached150 ml6 The nitrometer bulb was removed from the titration flasks the latter was quickly stoppered, and titrated with acid as before^■ , . _ Before being used again* the nitrometer bulb was cleaned with
• concentrated hydrochloric acid* cleaning solution? rinsed well with ;: distilled water and driedo V •
: The volume of the acid'used in. the back titration was ‘ -
' : - subtracted from the volume ofthe acid calculated to be necessary to :, .neutralize the base added and the. diff erence in volumes multiplied' by -a factor that gave the millimoles of carbon: dioxide in the sample., The ideal gas equation was used to calculate the size of the sample because
’ • the titration of the base in the presence of sodium carbonate indicatedan error that would be larger than any error introduced in the •
: v Calculatietio The results of eight analyses are" given in Table 9c, . ; ;■ • . Trial 3 shows an unusually large deviation from the othersoBince the analysis is subject to errors introduced in measuiihgy out the gas' sample, this. result may be disregarded with some degree of. ' y , • ; safety® Qn;this tasis/the mean error is ©oQ(I91 millimoles or 1052 - .1 . •per c ent which agrees fairly well with what was predicted - from the ■ v
■ . titration of the base with sodium carbonate addedo . . .. .In brder to determine if the concentration of the base had

■ ;; ' • • - : V M>
Table 9 '
Results ef Analyses of Measured Quantities of Carbon Dioxide .
Trial ' milimo of # - ■ taken
, Mllim» of GO2 found
E r ro r (Hillimo) _
Percentage error ,
' 1 0o5S43. 0=5798 - 0=0047 - 0=80- 2 - 0=6750 0=6656 0=0094 -1=393 0,5755 .. 0*5762 * 0=0007 + 0=124 Oo 5601 0*5488'.. ■= 0=0113 - 2=025 0*5BS6 0=5764 - 0=0122 . - 2=07
, :S:; -y - 0,5960 0=5552 - 0=0108 ■= 1= 81'7 0*6133 0=6086 . - 0=0047 -0=77
- S. ; 0=6o56 . 20*5949 - o=oio7. , -.1=77.
changed; by some accident-' during the investigation, samples were titrated with the acid as before0 On the basis of three titrations the mean normality was found to be 0o05044= The normality from the original standardization was 0o05Q4-3 which indicates no change0.

.AMLTSIS OF SYNTHETIC HOTmES OF METHIL CHLORIDE ■,&m;. mmM. DioxiBB-
BExtures of kHoim composition were prepared by measnring . samples of methyl chloride and carbon dioxide with the gas buret and adding them to previously evacuated gas storage bulbs0 The ratio of
the quantities of gases was approximately the same as would be encountered in the. products of pyrolysis of methyl chlorocarbonaleo The methyl chloride was determined by the combustion method as'described . previously using 0fl(5082 H potassium thiocyanate and approximately 0*012 S silver nitrate solutions* The thiocyanate was standardised • against silver nitrate, and on the basis"of three different weighings with four titrations for each weighing the average deviation from the mean was 1*37 parts per thousand* Thirty milliliters of:the mixture was taken for the carbon dioxide determination which was made in the manner previously deseribedo Tables 10 and 11 show the results of two combustions and two carbon dioxide determinations made on each sample* The ideal gas equation was used to calculate the composition of the gas mixtures and the size of the samples taken for analysis*
.The precision in the determination of the chloride in the titration of the products of combustion was much poorer than expected* Table 12 gives the deviation from the mean for the various combustions in parts per thousand* The amount of precipitate in the titration of the products of combustion was quite small compared to the amount

Table 10of Sas Hixture 1
Composition of the mixtnre,by synthesis%Methyl chloride Carbon dioxide
Percentage methyl chloride from combustionsCombustion 1 Combustion 2 lean.Error
47o06 $0o66 % Low
Percentage carbon dioxideSample 1 51=61 Sample 2 ' $1.1$ %Mean 51^38 .Error , ' Ge 90 % Low ;
d ^ e 11 Analysis of Gas Mxture 2'
Combustion 1 52ol5 Combustion 2 52026 % ;Mean . 52o 21 ..Error 0^13 low;
Sample 1 - 46,51 % '. Sample 2 kU<, 8h %.lean t , ; 45=6C K-Error . Jl0.98 % loir
Composition of the mixture by synthesis' t'd - ' Methyl chloride
.'-yh--'. - Carbon dioxide.Percentage methyl chloride from combustions
Percentage carbon dioxide:
formed in the'titration of -blank which made the color comparison;quite difficulto Better results were-obtained when' a little barium -sulfate
was added to the determihatlon as was done with the
Mixture.2a

.. Y'; ■ .: ' . ; . y :;,■ _ Average Deviation from the;Mean for the OKLoride Determination ': \ : ‘ in the, Ana.lysis of. Synthetic Gas l&xtures' , - ;
vO; : -: V Y , •Combustion : Ifumber of '
titrations ;iverage Deviation from
'tnt ’; the mean' : ;• (parts per thousand).
Mixture 1 v-■ "'.I-'- J t-S:.v;:2; i 1&060
Mixture 2: 3 k o ik;r: / 7o46 ; r-l.:,;. ,

s m m m k m oomoimiom
flie analysis of eormnercial methyl chloride by exploding a sample of the gas with the stoichiometric ratio of oxygens the absorption of the products in sodium hydroxide and.the titration of the chloride ion in the latter mth silver nitrate solution using dichlorofluorescein indimtor gives a mean error of 3o29 per cent low and a standard" deviation of io jl per . cent on the basis of forty-one . trials c The error was found to be independent of the size.of the sample'taken, the ratio of the. volume of oxygen to that of methyl chloride,, the pressure . in the flask at the time of explosionthe time of contact of the absorbent with the products of the combustion and the temperature of the gases, at the time of explosion,, within the limits investigated*This error cannot be explained By impurities in the. sample as a combustion analysis, of the methyl chloride used gave an error of G040 per cent high* The explosion method may find some application
in the estimation of the quantity of methyl chloride but is certainly not quantitative*
. .The modified.Winkler determination of carbon dioxide based . .. on absorbing the gas in barium.hydroxide solution and titrating the '■ excess base to a faint pink with standard hydrochloric acid in the presence of excess barium ion using phenolphthalein as the indicator shows an. almost constant loss of 0o01 millimoles of carbon dioxide0 This error, seems to depend upon the manner in which the titration '

was carried out and independent 'of the amount • of barium, carbonate " :"presento This error was attributed to some of the precipitated .
carbonate, reacting with the hydrochloric acid0 ,When mixtures •: of methyl chloride and carbon dioxide were
analyzed for methyl chloride by the combustion methpd and for carbon dioxide by the modified Winkler method5 the mean error. for the methyl chloride wg,s 0o40 per cent low and for the carbon dioxide was 1^50 per cent low, The analysis for methyl claloride appears satisfactory but the analysis for carbon dioxide leaves much-to"be desired.
2 351: IS

V.; ' v'-v' /l/ Hardyj Thoms v . ' : ' ;.;vv-' ■ . Th® ThermI ■ Beodmpogitjon of Methyl Ghlorocarbonate ; ,:
. . : teesdni 'University; of Iri^om;-to , v
/2/ Iates# millarn Si ; - 'o n:"-V.XVjaeties'. of the thermal- Decomposition of Ethyl:Ghlorocarbonate
: ! : Tucsont. University of .Arizona thesis5 ,1949 / ' : '' . ' /3/ Ghr^ & r y # / ' ; ■ V- '■.v ; ' ' ' t-- :
■ ' ■ • the Thermal Decomposition of Ethyl Ghlorocarbonate. . Tucsont Dniversity of Arizona thesis, 1942 oG -
. A / . Kftsters. Fo ¥ 0 A AA.i:';;. : ,t- i: ; .'G‘ -;Z0 anorgo Ohem,, 13, 127 (1897) • 'i
,/5/ Lindner, Jo • • . ; d - . ddHo analo Ghem0, 66, 305 (1925) v: • :
rv : /6/ lashbrook, Robert 7o ; t: •• the Pyrolysis of Ethyl Clilorocarbonate ",_
' ; ■ : Tucson s Unlversity of Arizona Thesis, 1941 ; ". /?/ Hancock, G, K. .
27, 613 (1950)- - - ' : -'' /8/ Kolthoff, to: &, Abbr, STo IC, and' Sunde, Go; Jo ‘ -'Gt''
ip Amer, Chem, Soc*, _gl, 3273 (1929) . .Hoel, Paul So ; '• ' ' , ,
' Introduction to Mathemtical-Statistics • I dJ -J ' >-T ._ ' John Wiley and Sonsy Inco,. l'Ie York, 1947 ■ _ , - J G
; - J m f '-tiahtinek,; Jo.and larti^ Wo G„ jAS' P''; A- ' ' ; P "j. Ind0 -Engo Chemo 0 Analo 'Edo > 408 (1931)
P P -" P /ll/ Kolthoff,- lo Mo and Stenger, Vo' A. P ' ; P: 4 P p’. - ^ ; 'P: : ' Volumetric Analysis y 2 . P ^ - • -
t I n t e r s c i e n c e Publishers, Nevj lork, 1947 ' P
P d ' P /12/ m b g f BoP: . : - Pp : ; G "P;-/^ - " V ^ P < T i " v ’rPPIndp Engo 'Ghemo 4 7, 1045 (1915) > - - - ;
4 4:0 - ,