Embed Size (px)
Citation preview

Quantitative Analysis Quantitative Analysis of Situational Awareness of Situational Awareness
(QUASA)(QUASA)
Applying Signal Detection Theory
to True/False Probes and Self-Ratings
Barry McGuinnessPrincipal Scientist
Human Factors DeptAdvanced Technology Centre
BAE SystemsBristol, UK
Advanced Technology Centre
2004 CCRTS, San Diego

2004 CCRTS, San Diego
Overview
1. Situational Awareness (SA)
2. Assessing SA
3. QUASA Approach
4. Signal Detection Theory
5. Calibration of SA
6. Example: LOE 2 data
7. Further Developments
2004 CCRTS, San Diego
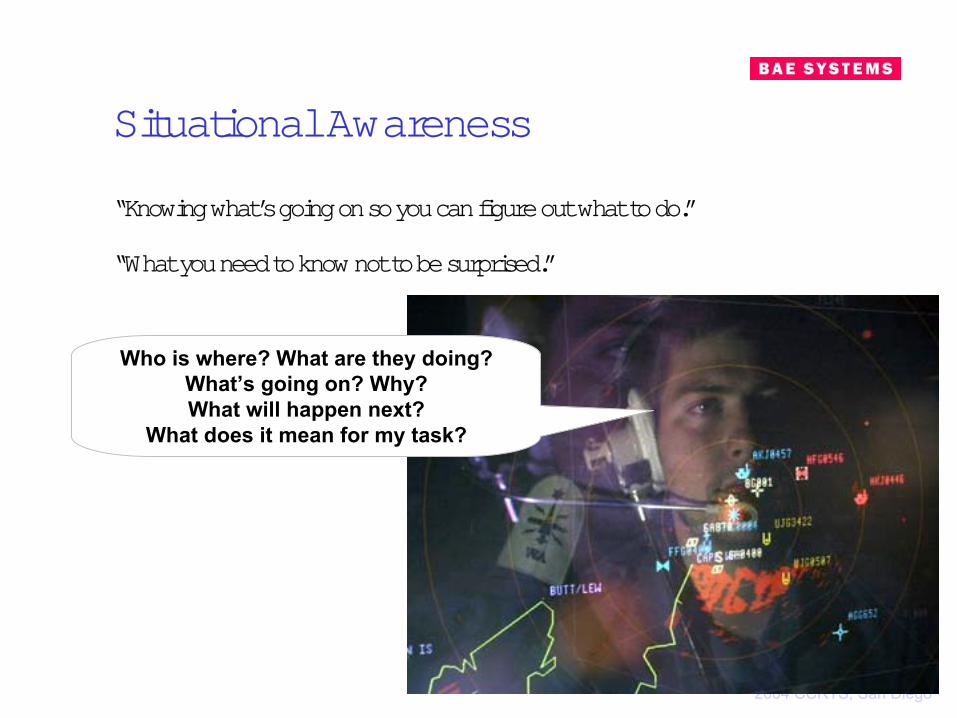
Situational Awareness
“Knowing what’s going on so you can figure out what to do.”
“What you need to know not to be surprised.”
Who is where? What are they doing? What’s going on? Why?What will happen next?
What does it mean for my task?

2004 CCRTS, San Diego
Situational Awareness
Situational UnderstandingGlobal characteristics of the situation
Objective AwarenessConstituent elements of the situation
Operational AppreciationImplications of the situation for one’s goals/tasks
Course of ActionDecisions/actions informed by operational understanding
Decision-making, Response selection
SituationEntities, events, states,
actions, environment Perception
Comprehension
Projection + Assessment

2004 CCRTS, San Diego
Situational Awareness
Situational UnderstandingGlobal characteristics of the situation
Objective AwarenessConstituent elements of the situation
Operational AppreciationImplications of the situation for one’s goals/tasks
Comprehension
Projection + Assessment
MetacognitionCognitive contents, states and processes,
including uncertainties, gaps, conflicts

2004 CCRTS, San Diego
Situational Awareness
COGNITION
• Fighting in the city has mostly ceased
• Column of red tanks is leaving south of the city
• Enemy is beginning retreat
METACOGNITION
• This is certain. Current info, very reliable.
• Not sure about this. Reports may not be from reliable source. Need to check.
• Confidence in this -- 50-60%Need to look for evidence.
“Actual SA” “Perceived SA”

2004 CCRTS, San Diego
Situational Awareness
– Hence, SA is not just about having positive knowledge of actual events
– It’s also about
Being aware of what is not the caseBeing aware of what we don’t know and may need to find outBeing aware of what others are aware of and unaware of
– So, SA is a complex, multi-faceted phenomenon

2004 CCRTS, San Diego
Situational Awareness
warsituation
streetsituation
strategy
next action
Tactical
Strategic

2004 CCRTS, San Diego
Assessment of Situational Awareness
•OBJECTIVE INDICES / CORRELATES
PerformanceBehavioursPhysiology
•SELF-RATINGS
UnidimensionalMultidimensional
•DIRECT PROBES / QUERIES
Situation reportsMulti-choice questionsTrue / false probes
SALIENTSABARS
SARS PSAQ
SART CARS
SAGAT
QUASA

2004 CCRTS, San Diego
QUASA
•Quantitative Analysis of SA
– Combination of direct probes and simultaneous self-ratings– True/false probes – Responses analysed using Signal detection Theory – Extension of CALIBRATION theory to SA
•Probes andratings
– True/false probe = a statement about the situation [a ‘report’] which may or may not be true.
– Self-rating = indication of confidence in one’s probe response
A column of enemy tanks is now leaving the city.A column of enemy tanks is now leaving the city. True
FalseTrueFalse
Very HighHighModerateLowVery Low
Very HighHighModerateLowVery Low
Probe Statement Assessment Confidence

2004 CCRTS, San Diego
QUASA
SA Requirements Analysis
– A form of Cognitive Task Analysis with SMEs to capture SA contents– Generic for the role/task – Specific to the scenario
Probe construction
– Formulate equal numbers of true & false probes – Ensure that probes are
– relevant to the subject’s task – plausible as potentially ‘true’ descriptions when in fact false
– Process of checks & iterations:– independent ‘blind’ assessment of true/false likelihood – assessment of intelligibility– assessment of plausability w.r.t. the scenario– assessment of relevance to the subject’s task

2004 CCRTS, San Diego
QUASA in use
MN LOE 2 experiment
– 5 nations + NATO– US lead (JF COM)
– Collaborative planning – distributed teams – network – information sharing agreements– ONA process
– 46 subjects in 2 roles – Analysts vs Planners
– 2 conditions (methods of online collaboration), each lasting 1 week
– 50 T/F probes per subject per condition– 5 at a time every few hours

2004 CCRTS, San Diego
QUASA in use
LOE 2 SA data collection
– True / false probe– Subjective confidence level– Perception of other teams’ SA
Probe 1
Explosive materials have been found in a storage container at Xxxxxx(a) True or false?
TRUEFALSE
(b) Level of confidence
Very Low Low Moderate High Very High
(c) Which teams will mostly answer this probe correctly?
A B C D E

2004 CCRTS, San Diego
Analysis of probes data
Contingency table
Subject’s response
Probe type
[ T ] [ F ]
True
False
HIT MISS
FALSEALARM
CORRECTREJECTION
Enemy forces have captured bridge Charlie. [ T ] [ F ]Enemy forces have captured bridge Charlie. [ T ] [ F ]

2004 CCRTS, San Diego
Signal Detection Theory

2004 CCRTS, San Diego
Signal Detection Theory
Goal– Detect presence of “signals” (target objects or situations)– Discriminate signals from “noise” (non-signals, distractors)
Task– Observe source of information– Assess evidence for/against presence of targets– Make a judgement if uncertain– Make overt responses -- Yes or No
Processes– Perceptual detection & discrimination– Decision-making when uncertain
… We’re treating T/F SA probe response as a signal detection task

2004 CCRTS, San Diego
low high
Non-signals(Noise) Signals
Signal Detection Theory
Internal response strength
REJECT ACCEPT

2004 CCRTS, San Diego
low high
Noise Signals + noise
Signal Detection Theory
Internal response strength

2004 CCRTS, San Diego
Noise
low high
Signal Detection Theory
Signal + noise
REJECT ACCEPT(uncertain)

2004 CCRTS, San Diego
Signal Detection Theory
•Contingency table --4 possible outcomes
STIMULUS
Signal
Non-signal
HIT
RESPONSEAccept Reject
MISS
FALSEALARM
CORRECTREJECTION

2004 CCRTS, San Diego
Signal Detection Theory
•Contingency table --4 possible outcomes
STIMULUS
Signal
Non-signal
80
RESPONSEAccept Reject
20
12 88
100
100
Hit rate = 0.80 Miss rate = 0.20
False Alarm rate = 0.12 Correct Rejection rate = 0.88

2004 CCRTS, San Diego
REJECT ACCEPT
low high
Signal + noiseNoise
Signal Detection Theory
CORRECTREJECTIONSP(CR) = 0.55
FALSE ALARMS
P(FA) = 0.45HITS
P(H) = 1.00
Low criterion (liberal, inclusive)Letting no true signal slip through the netMaximum hits, no missesProne to false alarms

2004 CCRTS, San Diego
REJECT ACCEPT
low high
Noise Signal + noise
Signal Detection Theory
CORRECTREJECTIONSP(CR) = 1.00
MISSESP(M) = 0.40 HITS
P(H) = 0.60
High criterion (conservative, exclusive)Accepting nothing but definite true signalsMaximum correct rejections, no false alarmsProne to misses

2004 CCRTS, San Diego
REJECT ACCEPT
low high
Signal + noiseNoise
Signal Detection Theory
CORRECTREJECTIONSP(CR) = 0.85
FALSE ALARMS
P(FA) = 0.15
HITSP(H) = 0.85
MISSESP(M) = 0.15
Central criterion (neutral, balanced)Threshold set at the mid-point of uncertaintyEqual numbers of misses and false alarmsProne to equal numbers of misses and false alarms

2004 CCRTS, San Diego
low high
Noise Signal + noise
Signal Detection Theory

2004 CCRTS, San Diego
low high
Noise Signal + noise
-2 0 2 4
d’ = 4.00
Sensitivity
d’ = Z(H)-Z(FA)
Signal Detection Theory
SensitivityDifference between noise and signal distributions, relative to their spread (variance)

2004 CCRTS, San Diego
low high
Noise Signal + noise
Signal Detection Theory

2004 CCRTS, San Diego
low high
Noise Signal + noise
k = –Z(FA)
k = 2.16
Criterion
-2 0 2 4
Signal Detection Theory
CriterionThreshold for “accept” response,measured by distance from middle of noise distribution
REJECT ACCEPT

2004 CCRTS, San Diego
low high
Noise Signal + noise
C = k – d’/2C = 2.16 – 2.00
= 0.16
Bias
-2 0 2 4
Signal Detection Theory
Bias (1)Distance of actual criterion from neutral or central criterion
REJECT ACCEPT

2004 CCRTS, San Diego
low high
Noise Signal + noise
ß = fS(k)/fN(k)ß = expd’C
ß = 1.38
-2 0 2 4
Signal Detection Theory
log ß = ½(Z2(FA)–Z2(H))log ß = d’Clog ß = 0.32
Bias (2) and (3)Likelihood ratio of probability densities of the two distributions at the criterion
Bias
REJECT ACCEPT

2004 CCRTS, San Diego
Signal Detection Theory
Basic findings
– Perceptual performance depends uponSTIMULUS DISCRIMINABILITY
Stimulus qualityActual signal-noise ratio
OBSERVER SENSITIVITYAbility to detect signalsAbility to discriminate signals from noise (distractors)
OBSERVER RESPONSE STRATEGY IN UNCERTAINTY (CRITERION / BIAS)Perceived signal probabilityMotivation to maximise hits or minimise false alarms
– SDT has established that individuals are not just mechanical information processors but also make conscious judgements in conditions of uncertainty

2004 CCRTS, San Diego
Signal Detection Theory
•SDT in the real world
– Early studies of radar observer performance
– More recently:Recognition memory
– eyewitness memory– remember / know paradigm
Diagnostic tasks– medical tests– weather forecasting– psychometric tests– polygraph lie detectors– forensic tests
– In principle, any situation that calls for judgement in uncertainty

2004 CCRTS, San Diego
SDT and Situational Awareness
•Assessing SA with T/F probes
– Why use them?
– Output of T/F probes = contingency tableHITS / MISSESFALSE ALARMS / CORRECT REJECTIONS
– Traditionally, we have assessed SA using % correct responses to questions about the situation
– This tells us little or nothing about– What the subject knows is not the case– What the subject wrongly believes is the case
– SDT provides separate measures of SENSITIVITY and CRITERION / BIAS

2004 CCRTS, San Diego
Results
– Compare two subjects (LOE 2)
Responses
Prob
e ty
pe
“True” “False”
True
Fals
e
HITS0.80 MISSES
FALSEALARMS
0.10CORRECT
REJECTIONS
Responses
Prob
e ty
pe
“True” “False”
True
Fals
e
HITS0.90 MISSES
FALSEALARMS
0.75CORRECT
REJECTIONS
SUBJECT A SUBJECT B
2004 CCRTS, San Diego
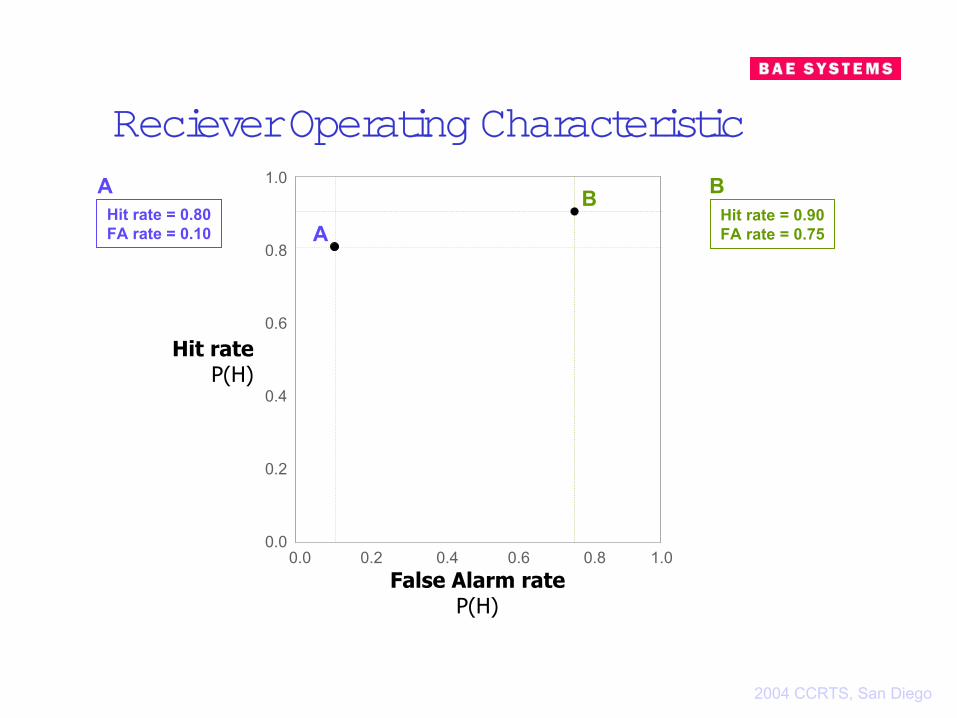
Reciever Operating Characteristic1.0
0.8
0.6
0.4
0.2
0.00.0 0.2 0.4 0.6 0.8 1.0
Hit rateP(H)
False Alarm rateP(H)
Hit rate = 0.80FA rate = 0.10
Hit rate = 0.90FA rate = 0.75
A B
AB
2004 CCRTS, San Diego
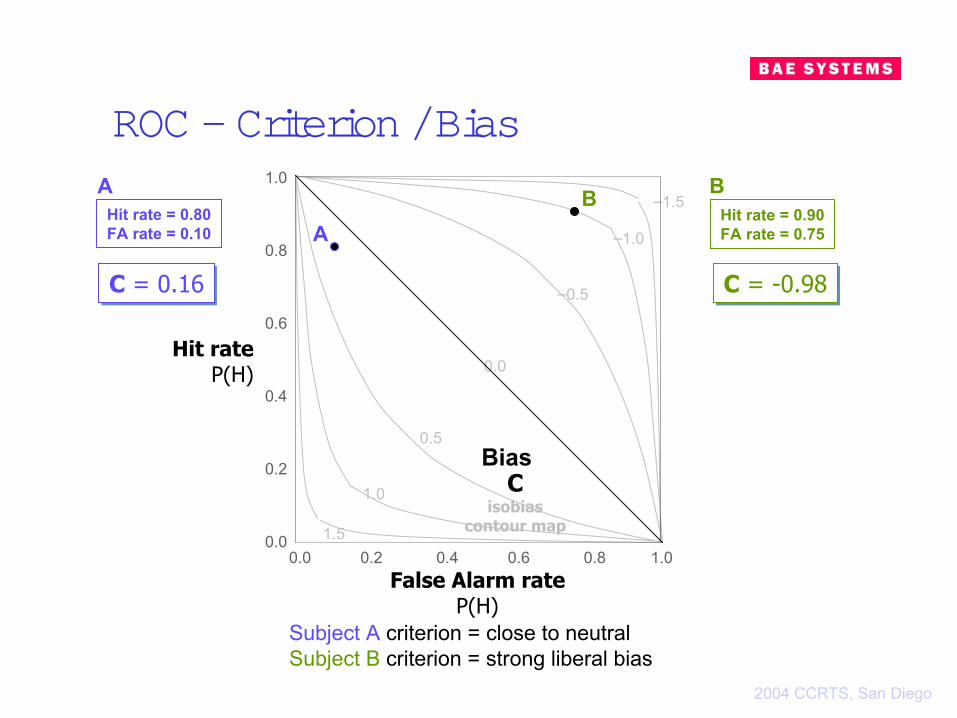
ROC —Criterion / Bias1.0
0.8
0.6
0.4
0.2
0.00.0 0.2 0.4 0.6 0.8 1.0
Hit rateP(H)
False Alarm rateP(H)
0.0
–0.5
–1.0
–1.5
0.5
1.0
1.5
Cisobias
contour map
C = 0.16C = 0.16
Hit rate = 0.80FA rate = 0.10
Hit rate = 0.90FA rate = 0.75
C = -0.98C = -0.98
Bias
A B
Subject A criterion = close to neutralSubject B criterion = strong liberal bias
AB

2004 CCRTS, San Diego
ROC —Sensitivity1.0
0.8
0.6
0.4
0.2
0.00.0 0.2 0.4 0.6 0.8 1.0
Hit rateP(H)
False Alarm rateP(H)
0.0
0.51.0
1.52.0
3.0
d’isosensitivitycontour map
d’ = 2.00d’ = 2.00
Sensitivity
Hit rate = 0.80FA rate = 0.10
Hit rate = 0.90FA rate = 0.75
d’ = 0.60d’ = 0.60
A B
d’ d’
λ λ
AB

2004 CCRTS, San Diego
QUASA data -LOE 2
SA probe hit rates
Hit rate
1.0
0.9
0.8
0.7
0.6
0.5A B C D E
Team (nation)
Team A has highest hit rate ...
2004 CCRTS, San Diego
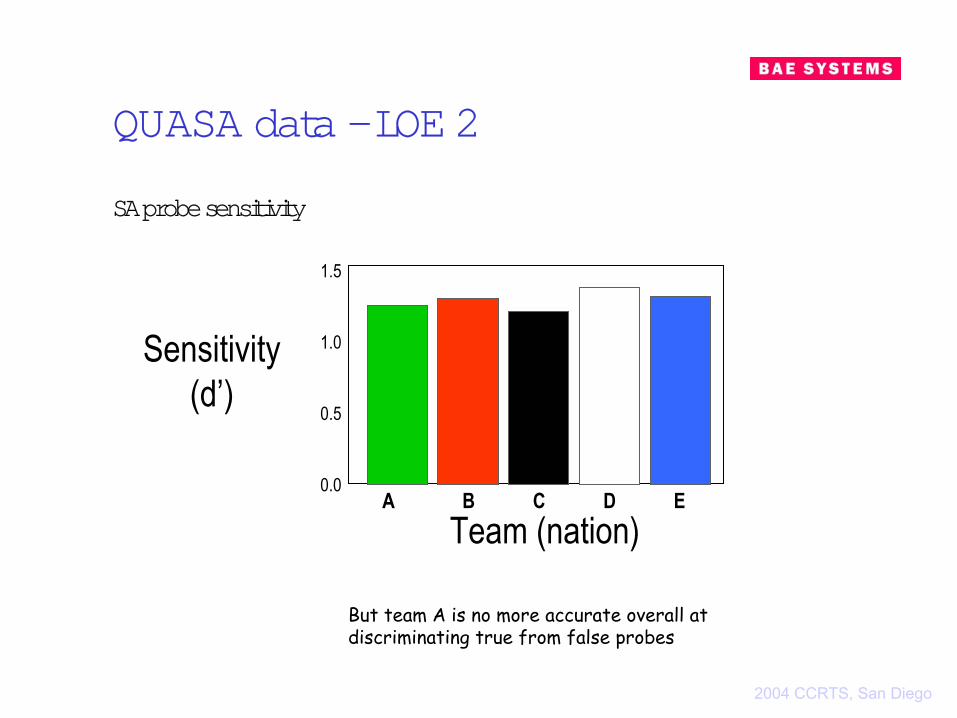
QUASA data -LOE 2
SA probe sensitivity
Sensitivity (d’)
A B C D ETeam (nation)
But team A is no more accurate overall at discriminating true from false probes
1.5
1.0
0.5
0.0

2004 CCRTS, San Diego
QUASA data -LOE 2
SA probe response bias
A B C D ETeam (nation)
Team A is very liberal when uncertain (inclined to accept probes as true) -- hence the high hit rate
Response bias (C)
+0.5
0.0
–0.5
liber
alco
nser
vativ
e

2004 CCRTS, San Diego
LOE 2 teamsTeam ATeam BTeam CTeam DTeam E
QUASA data -LOE 2
1.0
0.8
0.6
0.4
0.2
0.00.0 0.2 0.4 0.6 0.8 1.0
Hit rateP(H)
False Alarm rateP(H)
ROC curve : grouped by teams

2004 CCRTS, San Diego
QUASA data -LOE 2
Summary so far
– Team A has highest hit rate on SA probes
– But SDT analysis shows all teams are only moderately accurate
– Team A’s hit rate due to very liberal response bias when uncertain
– Other teams are neutral or slightly conservative

2004 CCRTS, San Diego
Calibration
Concept
– Overconfidence / underconfidence – The extent to which people are able to judge the correctness of their
own observations or decisions
Method
– Obtain a judgement, then obtain self-rating of confidence in that judgement
– binary ratings | continuous scales | ordinal ratings
– A well-calibrated person gives low ratings on incorrect / chance-level judgements (i.e. when uncertain) and high ratings on correct judgements (when certain)
– Calibration analysis quantifies this relationship in some way
2004 CCRTS, San Diego
Calibration
Findings
– Overconfidence common for cognitive tasks– Underconfidence common for sensory tasks– (May be an artefact of experimental methods)
Applications
– Eyewitness reports– Juries and police tend to be persuaded by highly confident witness reports, but these
don’t always correlkate with actual accuracy.
– Intelligence analysis– Don’t want overconfident intelligence reports based on dubious data
– Situational awareness– Accidents attributed to over onfidence in poor/inaccurate SA

2004 CCRTS, San Diego
Calibration
50 60 70 80 90 100
Perceived accuracy (%)
100
90
80
70
60
50
Actual accuracy
(%)
Calibration curve
Over-Confident
Under-Confident
Well-ca
librat
ed

2004 CCRTS, San Diego
Calibration
50 60 70 80 90 100
Perceived SA accuracy (%)
100
90
80
70
60
50
Act
ual S
A
accu
racy
(%)
Younger drivers
Older drivers
Calibration curve
SA of car drivers presented with safety-related electronic messages by an Advanced Traveller Information System (ATIS).
SA measured using a 2AFC version of SAGAT.
Confidence in each probe response rated on a continuous scale (50%-100
SA of car drivers presented with safety-related electronic messages by an Advanced Traveller Information System (ATIS).
SA measured using a 2AFC version of SAGAT.
Confidence in each probe response rated on a continuous scale (50%-100
Source
Lee, J.D., Stone, S., Gore, B.F., Colton, C., Macauley, J.,Kinghorn, R., Campbell, J.L., Finch, M. & Jamieson, G. (1997).
Advanced Traveller Information Systems and Commercial Vehicle Operations Componments of the Intelligent Transportation Systems: Design Alternatives for In-Vehicle Information Displays.
U.S. Federal Highway Administration technical report FHWA-RD-96-147. McLean, Virginia.

2004 CCRTS, San Diego
QUASA data -LOE 2
SA response confidence ratings
A B C D ETeam (nation)
Mean SA probe response confidence ratings per team in LOE 2.
Confidence ratings (1-5)
Very high 5
4
3
2
Very low 1
Perceivedaccuracy
1.0
0.9
0.8
0.7
0.6
0.5
2004 CCRTS, San Diego
0.0
0.51.0
1.52.0
3.0
QUASA data -LOE 2
1.0
0.8
0.6
0.4
0.2
0.00.0 0.2 0.4 0.6 0.8 1.0
Hit rateP(H)
False Alarm rateP(H)
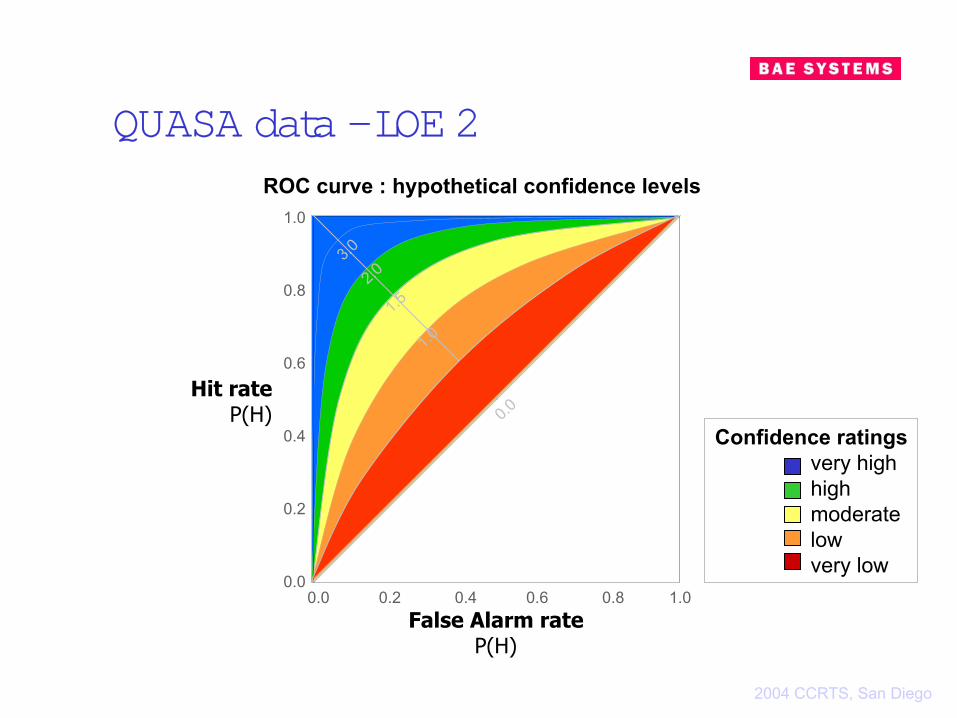
Confidence ratingsvery highhighmoderatelowvery low
ROC curve : hypothetical confidence levels

2004 CCRTS, San Diego
0.0
0.51.0
1.52.0
3.0
QUASA data -LOE 2
1.0
0.8
0.6
0.4
0.2
0.00.0 0.2 0.4 0.6 0.8 1.0
Hit rateP(H)
False Alarm rateP(H)
Confidence ratingsvery highhighmoderatelowvery low
ROC curve : hypothetical confidence levels
Suggestive of overconfidence when guessing Suggestive of overconfidence when guessing

2004 CCRTS, San Diego
QUASA data -LOE 2
Calibration scores
– using hit + correct rejection rates as actual accuracy
A B C D ETeam (nation)
SA accuracy (correct responses)
Perceivedaccuracy
0.691 0.656 0.706 0.6920.647
0.716 0.795 0.803 0.832 0.774
+0.07Calibration bias +0.11 +0.15 +0.13 +0.08
To assess SA calibration, average confidence ratings were transformed (0.5-1.0) and probe accuracy scores (proportion of hits plus correct rejections) were subtracted from the result to provide a calibration bias statistic.

2004 CCRTS, San Diego
QUASA data -LOE 2
Calibration scores
Calibration bias
+0.20
+0.10
0.00
-0.10
-0.20
A B C D ETeam (nation)
Mean SA probe hit rates per team in LOE 2.

2004 CCRTS, San Diego
QUASA data -LOE 2
0.5 0.6 0.7 0.8 0.9 1.0
Perceived SA(confidence ratings)
1.0
0.9
0.8
0.7
0.6
0.5
Actual SA( P[correct] )
Calibration curve
Over-Confident
Under-Confident
LOE 2 teamsTeam ATeam BTeam CTeam DTeam E

2004 CCRTS, San Diego
QUASA data -LOE 2
Summary
– Team A had lowest overall confidence ratings in their SA responses
– Confidence ratings were transformed into “perceived SA” scores and calibrated with actual SA scores
– Calibration analysis revealed general overconfidence
– Team A was actually best calibrated
2004 CCRTS, San Diego
Summary & conclusions
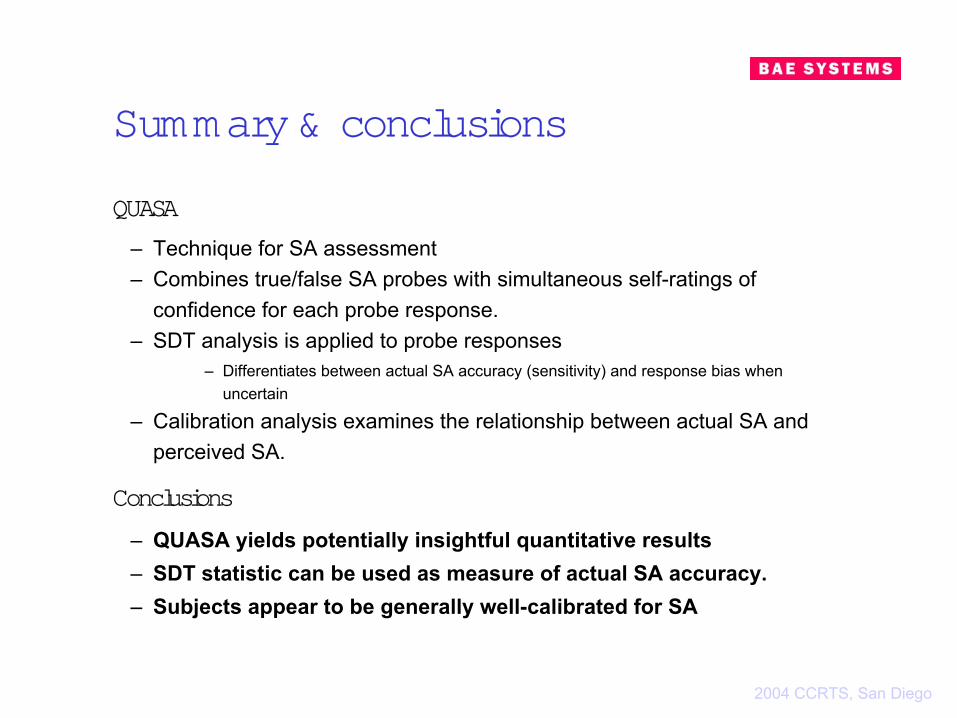
QUASA
– Technique for SA assessment – Combines true/false SA probes with simultaneous self-ratings of
confidence for each probe response.– SDT analysis is applied to probe responses
– Differentiates between actual SA accuracy (sensitivity) and response bias when uncertain
– Calibration analysis examines the relationship between actual SA and perceived SA.
Conclusions
– QUASA yields potentially insightful quantitative results – SDT statistic can be used as measure of actual SA accuracy. – Subjects appear to be generally well-calibrated for SA

2004 CCRTS, San Diego
Lessons learned
– T/F probes need objective referent (‘groud truth’)Can be used to assess awareness of empirical information (objective environment & features, type of situation, actions)
Cannot be used to assess awareness of non-empirical information (future possibilities, intentions)
– T/F probes need very careful construction & pre-testingAvoid ambiguity in languageAvoid bias in likelihood
– In a dynamic situation, T/F probes may need to be constructed on the fly
2004 CCRTS, San Diego
Outstanding issues
– Does response criterion/bias obtained with probes reflect a similar criterion/bias of the subject in assessing the real situation?
– How many probes / responses needed?
– How does this compare with other metrics?
– What about time to respond to probe? (= distance from criterion?)

2004 CCRTS, San Diego
Research directions
– Perform calibration analysis with Fuzzy SDT and/or Type 2 SDT
– Address team / shared SA

2004 CCRTS, San Diego
barry.mcguinness @ baesystems.com
Quantitative Analysis of Situational Awareness
(QUASA)Applying Signal Detection Theory to True/False Probes and Self-Ratings
Barry McGuinness Principal Scientist
Human Factors DeptAdvanced Technology Centre
BAE SystemsBristol, UK

2004 CCRTS, San Diego
BACKUPSLIDES

2004 CCRTS, San Diego
Characteristics of SA
– Mode of cognition that facilitates effective action– Critical in situations that are potentially complex, demanding, high-tempo, uncertain and/or
unpredictable.– Consists of mental representations of a situation and its implications:
OBJECTIVE AWARENESS :The operational environment and the constellation of elements within it – terrain, weather, buildings, platforms, people; locations, movements, actions, states– derived from observations or data in context
SITUATIONAL UNDERSTANDING :The global characteristics of the situation -- type and status– Hijack situation? Hostage situation? Safe? Problematic? Critical?– inferred from current awareness in context
OPERATIONAL APPRECIATION :The implications of the situation w.r.t. one’s operational goals / plans / tasks– Getting better or worse? Critical points ahead? Need a new course of action? – inferred from situational understanding in context

2004 CCRTS, San Diego
LOE 2 information sharing agreements
3XXXRegional
4XXXXE
4XXXXD
4XXX
XB
4XXXXC
4XXXXA
TotalPrivateCoalitionBL2BL1TLMLCountry

2004 CCRTS, San Diego
LOE 2 information sharing agreements
D
E C
B
A

2004 CCRTS, San Diego
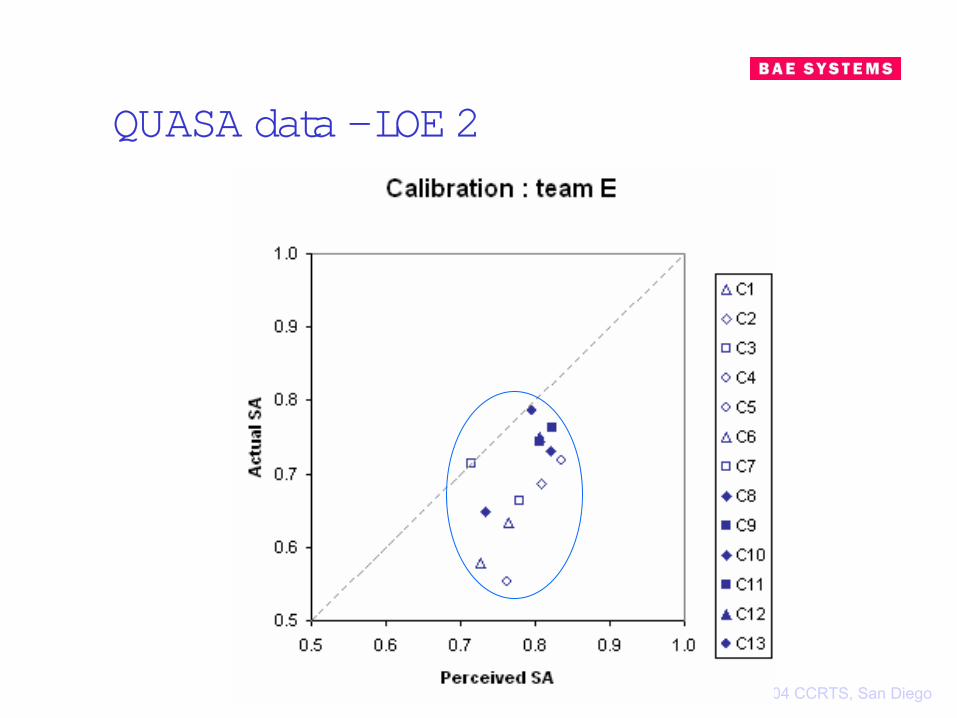
QUASA data -LOE 2

2004 CCRTS, San Diego
QUASA data -LOE 2

2004 CCRTS, San Diego
QUASA data -LOE 2
2004 CCRTS, San Diego
QUASA data -LOE 2
2004 CCRTS, San Diego
QUASA data -LOE 2
2004 CCRTS, San Diego
QUASA data -LOE 2
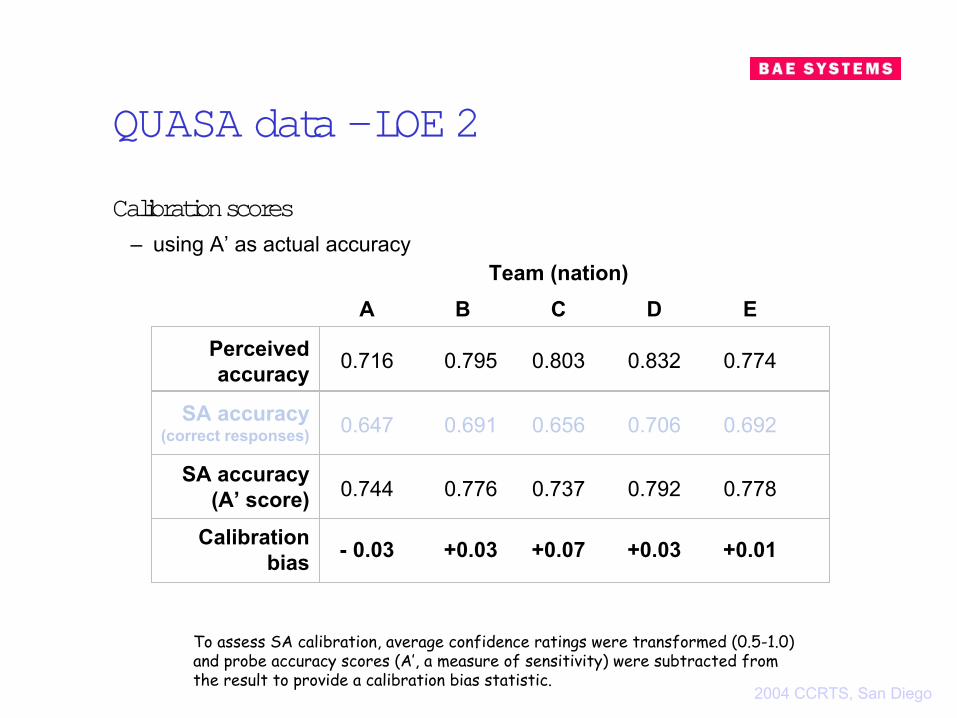
Calibration scores
– using A’ as actual accuracy
A B C D ETeam (nation)
SA accuracy (correct responses)
Perceivedaccuracy
0.691 0.656 0.706 0.6920.647
0.716 0.795 0.803 0.832 0.774
- 0.03Calibration bias +0.03 +0.07 +0.03 +0.01
To assess SA calibration, average confidence ratings were transformed (0.5-1.0) and probe accuracy scores (A’, a measure of sensitivity) were subtracted from the result to provide a calibration bias statistic.
SA accuracy(A’ score) 0.776 0.737 0.792 0.7780.744

2004 CCRTS, San Diego
QUASA data -LOE 2
Calibration scores
– using A’ as actual accuracy
Calibration bias
+0.20
+0.10
0.00
-0.10
-0.20
A B C D ETeam (nation)
Mean SA probe hit rates per team in LOE 2.

2004 CCRTS, San Diego
QUASA data -LOE 2
0.5 0.6 0.7 0.8 0.9 1.0
Perceived SA
1.0
0.9
0.8
0.7
0.6
0.5
Actual SA(A')
Calibration curve
Over-Confident
Under-Confident
LOE 2 teamsTeam ATeam BTeam CTeam DTeam E