In the SEM community, EDS is commonly used for quantitative analysis.
3 Proprietary & Confidential
Options for Quantitative Analysis
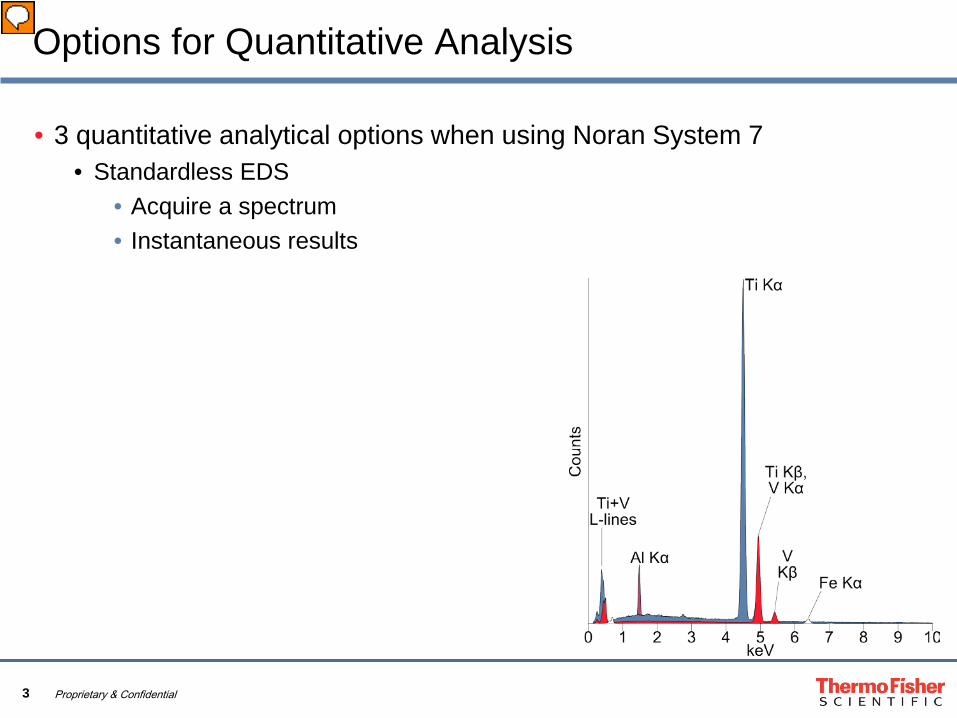
• 3 quantitative analytical options when using Noran System 7 • Standardless EDS
• Acquire a spectrum • Instantaneous results
Presenter
Presentation Notes
In Noran System 7, there are 3 quantitative analytical options. Using standardless EDS, one can simply acquire a spectrum from a sample of unknown composition, and then calculate the composition with the click of a button. It is super quick and simple to do. Behind the scenes, Peak deconvolution calculations are performed using peak shapes stored in the software. And although, the calculation always results in a compositional total of 100%, giving microanalysts warm, fuzzy feelings, the veracity of the result is strongly dependant on the correct identification of the inventory of elements in the sample. Additionally, standardless EDS requires the analyst to not only trust that the underlying algorithms used in the software are correct, but also that the ideal analytical conditions assumed by software are true. This would not be the case if, for example, a thin film of oil had accumulated on the detector window or if there were preferential absorption on the window grid. In short, although standardless EDS produces results with 100% compositional totals, The results may be 100% incorrect.
4 Proprietary & Confidential
Options for Quantitative Analysis
• 3 quantitative analytical options when using Noran System 7 • Standardless EDS
• Acquire a spectrum • Instantaneous results
• EDS with standards • Determine inventory of elements in sample • Acquire EDS of appropriate standards • Acquire EDS of unknown • Ensure homogenous analytical conditions
for standards and unknowns • Choose correction method
Presenter
Presentation Notes
Quantitative analysis using standards-based EDS combines the ease of standardless EDS with the rigor of standards-based analysis. First, the inventory of elements in the unknown must be identified in order to select the appropriate standards. Spectra of the standards and the unknown must be acquired using a uniform accelerating voltage. Lastly, a correction method must be chosen, and I will address this on a later slide. Standards-based EDS uses peak deconvolution methods but relies on the spectra acquired from standards for peak shapes and K-ratios.
5 Proprietary & Confidential
Options for Quantitative Analysis
• 3 quantitative analytical options when using Noran System 7 • Standardless EDS
• Acquire a spectrum • Instantaneous results
• EDS with standards • Determine inventory of elements in sample • Acquire EDS of appropriate standards • Acquire EDS of unknown • Ensure homogenous analytical conditions
for standards and unknowns • Choose correction method
• WDS with standards • Using MagnaRayTM is more automated than traditional WDS • Similar procedure as using EDS with standards • Must be mindful of interferences on- and off-peak which cause over or
under estimates without interference corrections.
Presenter
Presentation Notes
NSS also allows for WDS quantitative analysis. Using the MagnaRay is more automated than traditional WDS and allows the SEM user to produce results more akin to those of a microprobe. The quantitative analytical procedure is similar to that which I described for standards-based EDS. However, WDS quantitative analysis doesn’t involve peak deconvolution and requires measurement of X-rays on- and off-peak to determine peak intensity. It is essential that the off-peak positions are truly representative of the background and that the on-peak positions do not fall on an interfering element unless your software includes an interference correction.
6 Proprietary & Confidential
Introduction
• EDS and WDS quantitative analysis is not always straightforward • Choosing appropriate standards • Choosing appropriate on- and off-peak positions • Identifying and addressing interferences • How correct is the result?
Presenter
Presentation Notes
When doing quantitative analysis, whether done using EDS or WDS, there are several factors that if not addressed properly, result in confusing or incorrect results. Some of these factors include: choosing appropriate standards for standards-based analysis, choosing appropriate on- and off-peak positions for WDS quantitative analysis, and not only identifying, but also addressing, interfering characteristic X-ray lines. Moreover, are the results accurate? Life would be wonderful if we could simply acquire a single spectrum, click a button, and have accurate results to the 5th decimal place. But… Is this reality?
7 Proprietary & Confidential
Introduction
• EDS and WDS quantitative analysis is not always straightforward • Choosing appropriate standards • Choosing appropriate on- and off-peak positions • Identifying and addressing interferences • How correct is the result?
How should one deal with interferences when doing quantitative analysis?
Presenter
Presentation Notes
In this topical presentation, I will address options for dealing with interfering characteristic X-ray lines when doing standards-based analysis using the analysis of a Ti-Al-V-Fe alloy as an example. Here is an energy-dispersive spectrum acquired from the alloy featuring strong Ti and Al peaks and a weak Fe peak. The presence of V is difficult to determine by inspection because of the low concentration of V and the interference of V Kα and Ti Kβ. This spectrum would look extremely similar to that of a Ti-Al-Fe Cr alloy because of the interference of V Kβ and Cr Kα.
8 Proprietary & Confidential
Quantitative Analysis
• Options for WDS quantitative analysis of interfering elements • If available, apply an interference correction
Presenter
Presentation Notes
Occasionally, elements with X-ray lines that interfere in EDS also interfere in WDS. There are a few options that enable such quantitative analysis. Some software include the ability to apply interference corrections. However, such corrections are typically not available to the SEM community.
9 Proprietary & Confidential
Quantitative Analysis
• Options for WDS quantitative analysis of interfering elements • If available, apply an interference correction • Measure on an alternative peak, e.g., V Kβ instead of Kα
Presenter
Presentation Notes
When no interference correction is available, the most accurate result is typically achieved by measuring on an alternative characteristic X-ray line so long as it is free of interferences. However, the count times required to achieve meaningful statistics will be much greater, perhaps prohibitively so if the element is at low concentration.
10 Proprietary & Confidential
Quantitative Analysis
• Options for WDS quantitative analysis of interfering elements • If available, apply an interference correction • Measure on an alternative peak, e.g., V Kβ instead of Kα • Measure elements with no interferences (Ti, Al, Fe); calculate element with
interference (V) as the remainder
Presenter
Presentation Notes
Lastly, the interference-free elements can be measured, and the concentration of the element bearing the interference may be calculated as the difference between 100 and the sum of the measured elements. I will elaborate more on this “Difference Method” later.
11 Proprietary & Confidential
Ti-Al-V Alloy
SE Image BSE Image
Presenter
Presentation Notes
Now… let’s take a look at the sample.� Here are secondary and backscattered electron images of an area of the alloy. Both imaging techniques reveal areas with 3 different shades of gray representing 2 distinct phases. The bright, small grains are V-rich. The darker, larger grains are both V-poor grains of the same composition but presumably differences in grain orientations have resulted in differing electron channeling efficiencies.
12 Proprietary & Confidential
V Al Ti
V map has contributions from V Kα and Ti Kβ in both phases. EDS X-ray maps merged into a single RGB image.
Presenter
Presentation Notes
X-ray mapping by EDS reveals the areas of differing composition. The V map has contributions from both V Kα and Ti Kβ in both phases. I have selected the V, Al, and Ti maps and merged them into a single RGB image.
13 Proprietary & Confidential
V Al Ti
• The sample contains 2 phases • X-ray maps simply guide the eye • Does not generate unique phases
Presenter
Presentation Notes
This is a common practice in the absence of a more elegant phase mapping method. However, the result is somewhat subjective. In this case, a purple, third phase seems to be present, but given the small grain sizes, this is likely a result of electron probe interaction volume overlap.
14 Proprietary & Confidential
Principal Component Analysis
• COMPASSTM identifies 2 phases
• V-rich (red) • V-poor (blue)
• Aligns well with BSE image
Presenter
Presentation Notes
A true phase map can be generated using principal component analysis of an EDS image cube, which is available in NSS using the COMPASS feature. Using principal component analysis, the V-rich and -poor phases are readily distinguished and align well with the backscattered electron image.
15 Proprietary & Confidential
V-poor
V-rich
Principal Component Analysis
Presenter
Presentation Notes
The EDS of the two phases are quite similar. The most notable differences between the two phases are the small Fe Kα and V Kβ peaks.
16 Proprietary & Confidential
Is a low concentration of V present? WDS provides clarity!
V-rich Phase
Presenter
Presentation Notes
Strong interferences exist between Ti and V in both the L-
17 Proprietary & Confidential
Is a low concentration of V present? WDS provides clarity!
V-rich Phase
Presenter
Presentation Notes
and K-
18 Proprietary & Confidential
Is a low concentration of V present? WDS provides clarity!
V-rich Phase
Presenter
Presentation Notes
lines making it difficult to determine if a small concentration of V is present. However, WDS can provide clarity!
19 Proprietary & Confidential
WDS of Ti and V L-lines
Presenter
Presentation Notes
Here, I have overlaid a blue WDS energy scan of the Ti and V L-line region of the spectrum on an EDS of a similar region. Although WDS can separate some of the peaks unresolved by EDS, it cannot fully resolve all of the satellite peaks in the region, and there is not a convenient place to measure V. Although, it is evident that V is present.
20 Proprietary & Confidential
WDS of Ti Kβ and V Kα
Presenter
Presentation Notes
Now, Let’s investigate the potential of measuring V using V Kα. I’ve overlaid a blue WDS energy scan of the V-poor phase, a white WDS energy scan of the V-rich phase, and an EDS of the V-poor phase. Unfortunately, WDS is unable to resolve V Kα and Ti Kβ. The result of varying V concentration is an apparent shifting of the position of the unresolved V Kα and Ti Kβ peak not yielding an ideal position to measure V.
21 Proprietary & Confidential
EDS
No Standards
V-ric
h G
rain
s Al 3.46 Ti 81.2 V 13.8 Fe 1.61 Total 100.0
V-po
or G
rain
s Al 6.42 Ti 90.7 V 2.87 Fe 0.07 Total 100.0
Results
Presenter
Presentation Notes
I did quantitative analysis of the alloy using 4 methods in order to compare the results. For all methods, I applied a Φ(ρz) correction. Using standardless EDS, the V-rich grains contain 13.8 wt% V, and the V-poor grains contain 2.9 wt% V.
22 Proprietary & Confidential
EDS
No Standards Standards
V-ric
h G
rain
s Al 3.46 3.63 Ti 81.2 83.4 V 13.8 13.2 Fe 1.61 1.55 Total 100.0 101.8
V-po
or G
rain
s Al 6.42 6.77 Ti 90.7 93.4 V 2.87 2.75 Fe 0.07 0.06 Total 100.0 103.0
Results
Presenter
Presentation Notes
Standards-based EDS yielded 13.2 wt% V for the V-rich grains and 2.8 wt% V for the V-poor grains.
23 Proprietary & Confidential
EDS WDS
No Standards Standards
Standards VMeas.
V-ric
h G
rain
s Al 3.46 3.63 3.29 Ti 81.2 83.4 78.3 V 13.8 13.2 15.8 Fe 1.61 1.55 1.54 Total 100.0 101.8 98.9
V-po
or G
rain
s Al 6.42 6.77 5.23 Ti 90.7 93.4 90.0 V 2.87 2.75 6.49 Fe 0.07 0.06 0.26 Total 100.0 103.0 102.0
Results
Presenter
Presentation Notes
Using WDS and measuring V on V Kα, yielded 15.8 wt% V for the V-rich grains and 6.5 wt% V for the V-poor grains. Because of contributions from Ti Kβ, V is overestimated in both phases. Given that there is relatively more Ti in the V-poor grains, the Ti contribution to V is relatively more in the V-poor grains.
24 Proprietary & Confidential
Difference Method
• Measure Ti, Al, and Fe • The V concentration is the difference between 100 and the sum of the Ti, Al,
and Fe concentrations • Requirements
• Only one element can be confounded by interference • Ti, Al, and Fe must be measured with perfect accuracy
Presenter
Presentation Notes
Lastly, I used the difference method to estimate the V concentration. Ti, Al, and Fe were measured using WDS. The V concentration is the difference between 100 and the sum of the concentrations of the other three elements. This method requires that only one element is confounded by an interference. Additionally, for this method to be meaningful, There is the small caveat that all measured elements must be measured with perfect accuracy.
25 Proprietary & Confidential
EDS WDS
No Standards Standards
Standards VMeas. VDiff.
V-ric
h G
rain
s Al 3.46 3.63 3.29 3.29 Ti 81.2 83.4 78.3 78.3 V 13.8 13.2 15.8 16.9 Fe 1.61 1.55 1.54 1.54 Total 100.0 101.8 98.9 100.0
V-po
or G
rain
s Al 6.42 6.77 5.23 5.22 Ti 90.7 93.4 90.0 90.0 V 2.87 2.75 6.49 4.49 Fe 0.07 0.06 0.26 0.26 Total 100.0 103.0 102.0 100.0
Results
Presenter
Presentation Notes
Now, I would like to say that such perfection was achieved in my measurements, but realistically, the difference method can only provide an approximation of the actual concentration. The point of this exercise is to demonstrate that a lot of things can go wrong. There are several techniques available for quantitative analysis. I used 4 methods to analyze the same sample and got 4 answers. Then you can figure out what provides the best answer. In this case, the most reliable, and rigorous method is standards-based EDS. And in conclusion…
26 Proprietary & Confidential
Conclusions
• Rigorous quantitative analysis is hard!
Presenter
Presentation Notes
There are those who would say that doing quantitative analysis is simple and easy. However, it can be difficult to address all factors in order to produce good results, Regardless of what equipment you use, quantitative analysis requires a systematic approach. There are many things that will lead you to an incorrect result. You must plan to overcome the obstacles.
27 Proprietary & Confidential
Conclusions
• Rigorous quantitative analysis is hard! • Noran System 7 provides many options for good quantitative analysis
Presenter
Presentation Notes
I’ve discussed 4 methods of quantitative analysis, all of which can be done using Noran System 7.
28 Proprietary & Confidential
Conclusions
• Rigorous quantitative analysis is hard! • Noran System 7 provides many options for good quantitative analysis • Typically, WDS is the most rigorous method
Presenter
Presentation Notes
Typically, WDS is the most rigorous method because of its unmatched signal to noise ratio and energy resolution. However, when analyzing samples that produce interfering X-ray lines,
29 Proprietary & Confidential
Conclusions
• Rigorous quantitative analysis is hard! • Noran System 7 provides many options for good quantitative analysis • Typically, WDS is the most rigorous method • EDS quantitative analysis can likely provide more accurate results
compared to WDS done using interfering peaks
Presenter
Presentation Notes
The peak deconvolution methods involved in standards-based EDS quantitative analysis can likely provide more accurate results compared to WDS.
30 Proprietary & Confidential
Conclusions
• Rigorous quantitative analysis is hard! • Noran System 7 provides many options for good quantitative analysis • Typically, WDS is the most rigorous method • EDS quantitative analysis can likely provide more accurate results
compared to WDS done using interfering peaks • When analyzing V by WDS in the presence of Ti, the measurement
should be made using V Kβ • Requires longer count times • Requires V concentrations high enough for V Kβ to be above background • Cr must be absent because Cr Kα interferes with V Kβ!
Presenter
Presentation Notes
When analyzing V in the presence of Ti, the measurement should be made using V Kβ.�This measurement requires extended count times because the V Kβ line is about 8 times less intense than V Kα. Moreover, the V concentration in the sample must be high enough so that V Kβ is above background. To further complicate the issue, Cr must be absent from the sample be cause Cr Kα interferes with V Kβ.
31 Proprietary & Confidential
32 Proprietary & Confidential
33 Proprietary & Confidential
Correction Methods
• 2 matrix correction options in Noran System 7 on an SEM • ZAF
• X-ray intensity: integral along electron trajectory • Φ(ρz)
• X-ray intensity: integral as function of mass depth
Presenter
Presentation Notes
In NSS, there are two sets of matrix correction factors that may be applied to the analytical calculation: ZAF and Φ(ρz). Both of these corrections account for the atomic numbers (Z), the ability to absorb X-rays (A), and the ability to fluoresce secondary X-rays (F) of the elements being analyzed. When using ZAF, X-ray intensities are determined as an integral along the electron trajectory in the sample. When using Φ(ρz), X-ray intensities are determined as an integral as a function of mass depth.