Embed Size (px)
Citation preview

QUANTIFYING SYNERGY VALUE IN MERGERS AND ACQUISITIONS
by
ALBERT DE GRAAF
submitted in accordance with the requirements
for the degree of
MASTER OF COMMERCE
in the subject
ACCOUNTING
at the
UNIVERSITY OF SOUTH AFRICA
SUPERVISOR: PROF. A.J. PIENAAR
JUNE 2010

ii
ABSTRACT
Mergers and acquisitions have been demonstrated to create synergies, but not in all cases.
Current research reveals that where synergies exist, these seem to accrue to the shareholders
of the selling companies. Given the limitations of our qualitative research design, we find that it
is important to quantify synergy before the acquisition, preferably by applying certain best
practices. In an attempt to enhance understanding of the phenomenon, we find that several
types of synergy exist and that their origins include efficiencies, such as economies of scale
and economies in innovative activity. We further find that the bid price is an important indicator
of success and that its maximum should not exceed the intrinsic value of the target, plus the
value of synergies between the bidder and target. We further find that best practices exist in
quantifying cost and revenue synergies and describe these separately per origin.
Key terms: Synergy; Mergers and acquisitions; Best practices; Quantifying value; Efficiencies; Economies
of scale; Innovative activity; Technology; Fair market value; Intrinsic value; Monte Carlo
simulation; Real-options.

iii
TABLE OF CONTENTS
LIST OF FIGURES ..................................................................................................................... IV
LIST OF TABLES....................................................................................................................... IV
LIST OF APPENDICES.............................................................................................................. IV
1. INTRODUCTION ....................................................................................................................1
2. LITERATURE REVIEW OF RESEARCH ISSUES AND UNDERLYING CONCEPTS..........7
2.1 Introduction ....................................................................................................................7 2.2 Process of selecting literature for review .......................................................................7 2.3 Selection of literature .....................................................................................................9 2.4 Research issues ..........................................................................................................13 2.5 Key concepts ...............................................................................................................15 2.6 Quantifying value: distinct concepts of value...............................................................20 2.7 Quantifying value: valuation approaches and available valuation models ..................32 2.8 Quantifying the fair market value from the perspective of market participants ............34 2.9 Discount rates..............................................................................................................35 2.10 Synergy valuation within the context of best practices to be applied in the overall transaction process ....................................................................................................40 2.11 Quantifying synergy value: key elements ...................................................................43
3. RESEARCH DESIGN AND METHODOLOGY ....................................................................53
3.1 Introduction ..................................................................................................................53 3.2 Research design..........................................................................................................53 3.3 Research methodology................................................................................................53
4. RESEARCH PROBLEM AND METHODS...........................................................................56
4.1 Research problem .......................................................................................................56 4.2 Methods ......................................................................................................................57
5. DISCUSSION OF RESEARCH QUESTIONS AND RESULTS ...........................................58
5.1 What are the various types of synergy that could exist in mergers and acquisitions? 58 5.2 What are the origins of synergy in mergers and acquisitions? ....................................61 5.3 Why does synergy exist for some mergers and acquisitions and not for others? .......76 5.4 What is the maximum amount that a specific bidder can offer for a target company in order not to destroy shareholder value? .....................................................................84 5.5 What are the best practices used to quantify the value of different types of synergy ex ante? ......................................................................................................................88 5.5.1 Quantifying synergy value: cost synergies .................................................................89 5.5.2 Quantifying synergy value: revenue synergies ...........................................................99 5.5.3 Synergy value: cost of implementation .....................................................................120 5.5.4 Confirming the reasonability of the quantified synergy value ...................................120 5.6 Negotiating the final amount to be paid for synergy .................................................121
6. CONCLUSIONS AND AREAS FOR FUTURE RESEARCH .............................................122
APPENDICES...........................................................................................................................126
LIST OF REFERENCES...........................................................................................................134

iv
LIST OF FIGURES
1. Figure 2-1 ISI Web of knowledge, listed papers published in each year for search criteria described in Table 2-1 (Thomson Reuters, 2010)…………………………………………….. 10
2. Figure 2-2 ISI Web of knowledge, number of citations in each year for search criteria described in Table 2-1 (Thomson Reuters, 2010) …...………………………………………. 11
3. Figure 2-3 Simplified visualisation of elements included in the purchase price from the perspective of future cash flows (adapted from staff papers prepared for the IASB education session, October 2007) ..…………………………………………………………… 30
4. Figure 2-4 Model of best practice in creating shareholder value within the M&A transaction process (KPMG, 2001) ………………………………………………………………………….. 41
5. Figure 2-5 Probability distributions (Hubbard, 2007) ……………………………………….. 46 6. Figure 2-6 The relation between option value and stock price (Black and Scholes, 1973) 49 7. Figure 5-1 Long run and short run cost curves, and minimum efficient scale (McAuliffe,
2010b) …………………………………………………………………………………………… 64 8. Figure 5-2 Matrix of market access / capabilities and the associated expected synergy mix
(Sirower and Sahni, 2006) …………………………………………………………………….. 81 9. Figure 5-3 Overall concept of the Technology Balance Methodology (Schuh et al., 2008) 111 10. Figure 5-4 Determination of the Technology Readiness Factor (Schuh et al., 2008) …… 112 11. Figure 5-5 Example curve progressions of the various components of Technology Value in
Use (Schuh et al., 2008) ……………………………………………………………………… 112 12. Figure 5-6 Considering the probability of success for a technology using Monte Carlo
analysis (Boer, 1999) …………………………………………………………………………. 117
LIST OF TABLES
1. Table 2-1 ISI Web of knowledge, search criteria and results – 12 January 2010 (Thomson Reuters, 2010) ………………………………………………………………………………….. 10
2. Table 2-2 Premier journals in finance and accounting according to Ryan, et al., in alphabetical order (2002) ……………………………………………………………………… 12
3. Table 2-3 Models of valuation based on discounted cash flow (McKinsey, 2005) ……….. 34 4. Table 2-4 Meaning of credit rating opinions (Standard & Poor’s, 2010a) …………………. 39 5. Table 2-5 Yield spread over U.S. Treasuries by Bond rating, March 2006 (Thomson
Reuters, 2006) ………………………………………………………………………………….. 40 6. Table 2-6 Methods to improve calibrated estimates of probability (Hubbard, 2007) …...… 47 7. Table 2-7 Calculating the value of a call option using the Black-Sholes formula
(Boer, 1999) ……………………………………………………………………………………… 51 8. Table 5-1 Summary of the types of synergy and the linkages between them ……………. 61 9. Table 5-2 Potential for synergy between industry groups (Ansoff, 1965) …………………. 80 10. Table 5-3 Different types of mergers and the associated synergies (Chatterjee, 1986) …. 80 11. Table 5-4 Calculation of the net present value for a single technology throughout its life
cycle (illustrative values per Boer, 1999) …………………………………………………… 115 12. Table 5-5 Calculation of the weighted net present value of a single technology using the
Risk-Weighted Enterprise Model (illustrative values per Boer, 1999) …………………… 116 13. Table 5-6 Valuation of technology using the real-options approach (Illustrative values per
Boer, 1999) ……………………………………………………………………………………… 116
LIST OF APPENDICES
1. Appendix A – Literature network ………………………………………………………………. 126 2. Appendix B – The true value of an acquisition ………………………………………………. 127 3. Appendix C – The link between synergies increasing shareholder value, efficiencies
considered in merger control and other reasons for a merger ……………………………… 128 4. Appendix D – Economies of scale available to an entity (Pratten, 1988) …………………. 133

1
1. INTRODUCTION
Conventional wisdom suggests that it is very difficult to create something from nothing. Possibly
as a result, any phenomenon resulting in a combined effect greater than the sum of its parts
seems to generate great interest. Over time, a few of these phenomena have been identified,
normally following a lot of experimentation. An example from the natural sciences – reinforced
concrete – involves the correct combination of concrete and steel in its fabrication. This process
combines most of the compressive strength of concrete with the tensile strength of steel in a
single superior product, thereby opening construction possibilities that would have been very
difficult to achieve using each component on its own. A word has been coined to encapsulate a
phenomenon resulting in a combined effect greater than the sum of its parts: synergy – its origin
from the Greek word sunergos, combining sun and ergo, with the broad meaning of “working
together” (New Oxford American Dictionary, 2005: no page number1).
In a business sense, this phenomenon raises the question: is it possible to work together
through a merger or acquisition of business entities to create an effect greater than the sum of
their parts? In other words, do mergers and acquisitions (M&As2) result in synergy? If not, the
next logical question would then be: why do M&As still occur? The answers to these questions
have significant ramifications, for they should influence the volume of these transactions and
could justify the payment of an acquisition price-premium.
In his book Corporate Strategy, Ansoff (1965) proposed a practical guide for analysing principle
strategic problems. This guide encourages the use of factors that are unique to individual firms.
With this insight, Ansoff was the first to provide a meaningful framework for the evaluation of
merger and acquisition synergy, describing synergy as the:
”2 + 2 = 5” effect (1965:72).
This was an interesting choice of expression, for even if Ansoff did not know this, it also had a
political connotation. The expression obviously does not make sense from a purely
mathematical point of view – it implies a certain mysterious quality. Something mysterious,
which is not understood, could lead one to passively accept certain events – even to believe in
1 There is no page number as this is from the electronic version. 2 Apologia: due to their frequent appearance in this dissertation and to ease readability, use is made of the informal acronyms “M&A” for “merger and acquisition” and “M&As” for “mergers and acquisitions”. Furthermore, when referring to “merger” (including the plural) it is meant to include the term “acquisition” (or its plural) and vice versa.

2
propaganda. In 1949, George Orwell wrote the political satire, Nineteen Eighty-Four. In this
widely read book, Orwell refers to an actual Stalinist slogan and explores the effects of
communist propaganda:
In the end the Party would announce that two and two made five, and you would have to
believe it. It was inevitable that they should make that claim sooner or later: the logic of
their position demanded it...what was terrifying was…that they might be right. For, after
all, how do we know that two and two make four?…If…the external world exist only in the
mind, and if the mind itself is controllable – what then? (1949: 225, emphasis added.3)
The mysterious element very often promoted as the driving force of many M&As is synergy
(Devine, 2002). If synergy is merely an empty shell, used to rationalise management’s decision
to acquire another company, it could represent a dangerous form of propaganda. Although this
form of propaganda is arguably less damaging than the effects of a tyrannical political ideology,
it could nonetheless serve as a disguise for other transaction motives. These could include
hubris, where managers’ excessive pride leads them to unconsciously overpay for a target
company; or managerialism, where managers purposefully overpay for a target company in
order to extend their own reach at the expense of the shareholders (Seth, Song & Pettit, 2000).
In contrast, proper engineering of merger deals could be ensured by a detailed appraisal before
buying, and by replacing “fuzzy notions of synergy” with “hard-nosed concrete descriptions”
(Devine, 2002:9). Sirower (1997) further emphasises that if synergy is not quantified in detail
before a merger takes place, it could lead to costly failures; the tool of this shareholder
deception: a “synergy trap” (Sirower and Sahni, 2006:83).
How then do we quantify a mysterious phenomenon? Firstly, greater understanding and
knowledge could demystify the phenomenon. This would require not only knowledge of the
various types of synergy, but an understanding of its origins and a consideration of the interplay
of all these factors in a specific merger. Secondly, use should be made of appropriate valuation
methods. Copeland and Weston (1983) suggested a valuation method based on discounted
cash flow. As such, they proposed that synergy would exist when the net present value of the
cash flow of the combination of two assets is greater than the sum of the net present values of
the cash flows of the assets independently. Chatterjee, in his 1986 paper, described three types
of M&A synergy and touched on their origins:
3 Page reference from the 1984 reprint with a critical introduction and annotations by Bernard Crick. Oxford: Clarendon Press.

3
Acquisitions, in general, have been demonstrated to create economic value….[In our
study we] compare three broad classes of resources that contribute to the creation of
value…these resources are classified as cost of capital related (resulting in financial
synergy), cost of production related (resulting in operational synergy), and price related
(resulting in collusive synergy). (119)
Various authors further credit the existence of certain types of synergy to the effect of
efficiencies (Ansoff, 1965; Gaughan, 2007; Chatterjee, 1986). Efficiencies could therefore
represent the origin of M&A synergy and should be evaluated further. Entities responsible for
merger control often consider efficiencies where these could serve as a rebuttal against an
otherwise anti-competitive merger. As such, the wealth of literature available on merger control
offers the opportunity to study the synergy phenomenon across different disciplines and has
been incorporated into this dissertation. Here it is important, however, to consider the underlying
motivation of each discipline. Moreover, in the modern economy, increasing emphasis is placed
on innovative activity and technology. In M&As, efficiencies from economies in innovative
activity, including technology, could be a significant source of synergies on the one hand, but on
the other, benefits could prove to be highly elusive (Camesasca, 2000). This dissertation
includes a critical review of recent trends in quantifying synergy from economies in innovative
activities, specifically from the acquisition of external technology.
Studies by Bradley, Desai & Kim (1988), and KPMG (2001) demonstrated that M&As could lead
to a combined value greater than the sum of their parts. These studies therefore support the
notion that M&A synergy could exist, but importantly, they find that it only exists some of the
time. Here we should consider if certain types of M&A increase the chances of success. In
1980, Porter described a concept similar to synergy in his description of conditions that could
generate above-average returns in acquisitions. According to Porter (1980), these conditions
include a distinctive ability by the buyer to improve the operations of the seller. In line with this,
entities responsible for merger control often consider only merger-specific efficiencies. Here,
Farrel and Shapiro’s “no-synergy theorem” (1990, 2001) is starting to assume greater
importance with its focus on efficiencies resulting from a close integration of specific and scarce
assets. The existence of synergy therefore seems to require a proper match between the
merging entities. A further important requirement is financial discipline in setting the bid price for
a target entity. Here we should consider the forces that affect market prices, including the
valuation concept of fair market value. Turning our focus to the acquisition price, most scholars
agree that M&As generate value for the shareholders of the selling companies. The consensus
here is that M&As generally add value for the sellers as a direct result of the payment of large
acquisition premiums – often up to 40 percent (Sirower and Sahni, 2006). However, the
4
evidence does not always paint such a joyful picture for acquiring companies. The reality of this
finding is given far greater weight if one considers the amounts involved. Although the recent
international financial crisis seemed to have stemmed activity in this regard, a record year for
M&As preceded it in 2006, with global bids for this year alone exceeding US$3.4 trillion (Forbes,
2006). Given the significant amounts involved in M&A activity and the high occurrence of
failures (from a shareholder-value perspective), it is important to consider the maximum amount
that a bidder entity could pay in order not to destroy value for its shareholders. It should
furthermore be beneficial to consider the best practices applied in quantifying synergy value
before the acquisition takes place. Here, best practice suggests that there is a method that is
more effective at delivering a particular outcome than any other.
Research problem and objectives
The research problem considered in this dissertation is the high occurrence of M&A failures
from a shareholder-value perspective, and its link to the notion of synergy and the way its value
is quantified. The main objective of the research presented here is to identify, describe and
critically review the best practices used to quantify synergy value – before buying – and to make
some recommendations in this regard. Secondary research objectives are to critically review
and describe the various types of synergy that could exist in M&As; to critically review and
explore the origins of synergy in M&As; to critically review and analyse why synergy exists for
some M&As and not for others; to critically examine and formulate a maximum amount that a
specific bidder can offer a target company, in order not to destroy shareholder value; and finally,
to offer a limited review of matters that are to be considered in negotiating the final amount paid
for synergy.
Research design, methodology and chapter overview
The research presented here is designed in order to answer certain research questions. This is
achieved by either following a methodology of formulating propositions and testing them within
and by the literature, or by critically reviewing the literature to identify the most probable answer
to the question posed. The research presented here is therefore necessarily qualitative in
nature. In this research we further aim to provide a unique interpretation, collection and
consolidation of thoughts, thereby making an original contribution to the body of literature. The
research could be of interest from both a strategy point of view – for an individual or team
seeking to choose the best target for a potential merger – and a valuation-practice point of view
– for an appraiser active in the M&A field. Our aim is to create an international perspective, not
just one that would be relevant to South African conditions. This research dissertation is

5
structured in a logical fashion, with succeeding chapters addressing the following: Chapter 2
presents a literature review of the research issues and presents underlying concepts; Chapter 3
describes the research design and methodology; Chapter 4 explores the research problem and
methods applied; in Chapter 5 we offer a discussion of the research questions and present the
results; and in Chapter 6 we offer a conclusion and present areas for future research.
Overview of results, conclusions and recommendations
This research dissertation reached certain conclusions, but these are necessarily subject to the
limitations of our research design. Given these limitations, we find that it is possible for synergy
to exist in M&As, but that it is not universal. In cases where synergy does exist, we find that it
mostly accrues to the shareholders of the selling companies. We find that various types of
synergy could exist and that their origins include efficiencies and other more controversial
origins, including savings in taxation and benefits from market power. We could not identify a
clear link between value creation and the level of relatedness of merging entities, but we could
indentify that relatedness of entities could influence the potential for synergy to exist. We find
that synergy could exist in cases where an acquirer does not overpay. This all too common
practice, in turn, could be prevented in part by quantifying synergy value ex ante4 (preferably by
following certain best practices). We further find that the maximum bid price should be less than
the sum of the target company’s intrinsic value and the value of available synergies between the
bidder and target entities. Moreover, the final price paid for synergy would be the result of
negotiations, but factors to be considered here include the bargaining power afforded by the
contribution of resources by each party and the direction of dominance.
Given the limitations of our research design, we further describe best practices to quantify
synergy value ex ante. These include: the application of the income approach to valuations and
using a valuation model based on discounted cash flow; the application of an overall structured
approach; an engineering approach to quantify economies of scale; a Monte Carlo simulation in
conjunction with other best practices in order to indicate the likelihood of success and its impact
on synergy value; and further, a Risk-Weighted Enterprise Model as described by Boer (1999)
and the real-options approach that could be applied in quantifying the value of synergy from
economies in innovative activities. Finally, as part of best practices in quantifying synergy value,
we find that it is important to consider the cost of implementation, and to confirm the
reasonability of the quantified synergy value, before committing the funds.
4 Ex ante, from the Latin ex from, “out of” and ante from “before” (New Oxford American Dictionary, 2005: no page number), implying here that it is based on forecasts rather than actual results.

6
Certain practices for quantifying synergy value ex ante do not represent best practices due to
limited proof of practical implementation, but these were evaluated and are recommended here,
where they were found to be sensible. Approaches deserving qualified recommendation include
those by Damodaran (to quantify synergy value in general, 2005) and the Technology Balance
Methodology as developed by the Fraunhofer Institute for Production Technology (to quantify
the value of synergy from innovative activity, as described by Schuh, Klapper & Haag in 2008).
In cases where no best practices or other practices could be identified in the literature, we
formulated suggested approaches. These include: the use of a specialist to quantify the value of
taxation benefits; a collective consideration of several factors, including the effect of merger-
control regulations and the effects of market power on selling prices, to help quantify revenue
synergy from market power. In addition, we identify certain practices that are best avoided in
quantifying synergy value.
In the next chapter we provide a literature review of the relevant research issues and underlying
concepts.

7
2. LITERATURE REVIEW OF RESEARCH ISSUES AND UNDERLYING
CONCEPTS
2.1 Introduction
The aim of this section is to create an effective, structured and comprehensive literature review
of the relevant research issues and underlying concepts. In order to achieve this, it is imperative
that appropriate literature be selected – representing a proper cross-section of highly credible
and influential writings. It is important that literature providing pro and contra views of the
subject be investigated. A critical review of the literature also implies an analysis of the merits
and faults of a work of literature. We describe the process applied in selecting the literature for
review next.
2.2 Process of selecting literature for review
The importance of selecting and including appropriate literature in this critical literature review
was honoured through a specific emphasis on selecting credible papers published in reputable
journals. Our aim was to include the principal authors and papers on this subject. We also
considered other sources, including:
• Books;
• Surveys and publications by global accounting and consulting firms offering M&A
transactional advisory services;
• Writings included in periodicals;
• Company reports; and
• Publications in merger control.
In selecting the literature for this review, all popular approaches to measuring the reputation of
papers and journals, as described by Ryan, Scapens & Theobald (2002), were considered.
Firstly, we considered the bibliometric method, which considers the number of citations to a
paper or journal. Secondly, we considered the rating of journals according to scholars working
in the field. Sufficient evidence exists proving that citations are an indicator of the importance of
an author or paper (Ryan et al., 2002). This should, however, be read in light of several
arguments that indicate that the number of citations is not the principal indicator of importance.
For example, citations are normally only retrievable under the principal author, self-citations are
not eliminated, and citation does not distinguish between high and low quality in publication
(Ryan et al., 2002).
8
Ryan et al. (2002) named the most important source of citation data in accounting and finance
as the Social Sciences Citation Index. This index was used as one of the tools in the selection
of literature for review here. Editorial staff of Thomson Reuters, the group responsible for the
compilation of various indexes, including the Social Sciences Citation Index, review journals for
inclusion in the various compiled indexes based on criteria, including reputation. Ryan et al.
(2002) also documented the reputational rating of journals according to scholars in the field.
These reputational ratings were considered in the selection of literature for review here.
Selecting appropriate writings is an important first step, but a literature review should also be
effective, structured and comprehensive. To this end we employed the network theory of
models developed by Hesse (1974, 1980). The network theory of models facilitates the creation
of a literature network, providing structure and assistance in demarcating relevant from
irrelevant elements within the literature. The literature network for this literature review appears
in the next section.
For this research dissertation, papers published in research journals formed the primary source
of information. Books were considered as secondary sources of information as these often
address work already published in research journals, albeit in a form addressing a larger theme.
Books were still considered for inclusion as they often contain a useful grouping of ideas and
arguably require the same level of commitment as a research paper. Tertiary sources of
information were considered where these provided additional information on best practices.
They included: surveys, writings included in periodicals, company reports and documents filed
with the Securities and Exchange Commission of the United States of America.
This research made some reference across disciplines. References to the financial accounting
field (specifically to accounting statements) were made where these distinctively contributed to
the research question in hand and where the concepts contained in the statements were
considered to have real world relevance. Reference was made to the legal field where it
provided additional evidence on best practices in quantifying synergy values. In some countries,
if it could be proven that M&A efficiency gains outweigh the anti-competitive nature of the
transaction, antitrust legislation and the governmental bodies tasked with this portfolio often
approve the transaction. We considered published guidelines and reports where these provided
additional evidence on the quantification of synergy.

9
2.3 Selection of literature
In selecting literature for review we based our selection on: firstly, a bibliometric method where
we utilised the ISI Web of Knowledge offering searches of citation databases (including the
Social Sciences Citation Index); secondly, based on the rating of the reputation of journals; and
thirdly, a literature network, which was compiled using the network theory of models.
Furthermore, an Internet search was performed to identify relevant publications by global
accounting firms and consulting firms offering M&A transactional advisory services, such as
surveys and publications by Deloitte, Ernst & Young, KPMG, McKinsey & Company, Inc. and
PricewaterhouseCoopers.
Selection of literature using the ISI Web of Knowledge
We utilised the ISI Web of Knowledge as a research platform to perform relevant searches of
databases containing useful citation data, including the Social Sciences Citation Index. A search
of relevant articles was performed in July 2008 and again on 12 January 2010. (Only the results
of the latter search are discussed further.) In selecting the search criteria our aim was to narrow
the search field in order to obtain articles with a specific focus on the research topic. (The other
approaches were designed to obtain a wider base.) Detail of the relevant ISI Web of Knowledge
search criteria and results are contained in Table 2-1. The 74 articles identified in the search
were specifically investigated further for possible inclusion in the literature review.
The search results indicate that the majority of relevant publications are dated post-1999 (2006
being the year with the most relevant publications). On the other hand, the majority of citations
occur post-2001 (2009 being the year with the most relevant publications being cited in other
publications). Refer to Figures 2-1 and 2-2, in this regard. (Notice that in Figure 2-2, the low
number of citations in the 2010-year is due to the observation date and should be ignored.) It is
to be expected that the number of citations increases with a larger body of publication. Although
the increased publications and citations might be indicative of an improved indexing process,
the databases included in the ISI Web of Knowledge focus on indexing publications from major
journals only (Thomson Reuters, 2008). The criterion used for inclusion of a journal by ISI Web
of Knowledge, is discussed infra in this section under the heading “rating of the reputation of
journals”. There thus seems to be a growing number of publications in major journals in this
area, which in turn supports the notion that this subject is far from a mature research topic.

10
Table 2-1 ISI Web of Knowledge, search criteria and results – 12 January 2010
(Thomson Reuters, 2010)
Search criteria:
• Topics containing the words: “synergy” and “value”;
• Time span of articles: all years (this potentially included listed
articles published between 1972 and 2010);
• Databases searched: Science Citation Index Expanded, Social
Sciences Citation Index, and Arts & Humanities Citation Index;
• Refined by subject areas: “management”, “business” or
“economics”.
Search results:
• Results found: 74 articles;
• Articles cited more than once: 51;
• Sum of the times cited: 864;
• Top article: cited 132 times;
• Number of articles cited 20 times or more: 14;
• Average citations per article: 11.68;
• H-index (as described by Hirsch, 2005)5: 16
Figure 2-1 ISI Web of Knowledge, listed papers published in each year for search criteria
described in Table 2-1 (Thomson Reuters, 2010)
5 The h-index is an index that quantifies both the actual productivity and the apparent impact of a scholar. The index is based on the set of the scholar’s most cited papers and the number of citations that they have received in other scholars’ publications. For example, an h-index of 16 means that there are 16 published papers that have 16 citations or more. (ISI Web of Knowledge [available online].)

11
Figure 2-2 ISI Web of Knowledge, number of citations in each year for search criteria described
in Table 2-1 (Thomson Reuters, 2010)
Rating of the reputation of journals
To ensure that papers are of a high standard, we considered the rating of the journals in which
they were published, in terms of their reputation as judged by scholars in the field.
Ryan et al. (2002) documented the reputational rating of finance and accounting journals, as
rated by scholars in these fields. Their list of the premier journals in these fields appears in
Table 2-2. In compiling this list, Ryan et al. confirmed that a number of studies were consulted.
Due to a lack of information provided by Ryan et al. (2002), it was not possible to confirm the
appropriateness of the methodologies followed by these studies. This list was therefore not
seen as an exhaustive listing, but was nonetheless considered as an indicator of reputational
rating for journals in this field. Papers in economic journals and journals other than those
identified in Table 2-2 were also considered in this dissertation.
Editorial staff of Thomson Reuters, the group responsible for the ISI Web of Knowledge, review
journals for inclusion in the various compiled indexes, including the Social Sciences Citation
Index and Science Citation Index Expanded. In this process the editorial staff review over 2 000
journal titles per year, selecting only roughly 10 percent of the journals evaluated for inclusion in
the databases (Thomson Reuters, 2008). Publishing standards, editorial content, international
diversity, and citation data are all considered in evaluating journals for inclusion. Furthermore,
journals included in the databases are monitored to ensure that they are maintaining high
standards and a clear relevance to the products in which they are covered (Thomson Reuters,

12
2008). Merits of the journal reputational review performed by the editors of Thomson Reuters
are the thorough and continuous process followed. A limitation of their journal reputational
review is that the editorial staff may not qualify as scholars in the relevant fields. It may be
argued that it could not be expected of the editorial staff to be distinguished academics in all the
subject areas covered by their databases. The reputational review performed by the editors of
Thomson Reuters therefore probably only provides additional certainty as to the relevance of
the citation data published in the Social Sciences Citation Index.
The compilation of a literature network, using the network theory of models (discussed next),
considers the work of important scholars in the field as well as the papers cited by them. It
therefore provides additional evidence on the reputational rating of papers and journals.
Table 2-2 Premier journals in finance and accounting according to Ryan et al., in alphabetical order (2002)
Journal title Abacus Accounting and Business Research Accounting and Management Accounting Research Accounting Auditing and Accountability Journal British Accounting Review Critical Perspectives in Accounting Journal of Business Finance Journal of Derivatives Journal of Finance Journal of Financial Economics Journal of Financial Markets Journal of Future Markets Mathematical Finance Pacific Basin Finance Journal Review of Financial Studies
Literature network using the network theory of models
The network theory of models as developed by Hesse (1974, 1980) facilitates the creation of a
literature network, which, in turn, provides structure and assistance in demarcating relevant
from irrelevant elements within the literature. A literature network supports the creation of an
effective, structured and comprehensive literature review. It is of great use as it complements
the other two methods applied in the selection of appropriate literature, which were: the
bibliometric method and the method of considering the reputational rating of journals by
scholars in the field.

13
A literature network assumes that there is a series of pathways in the literature that intersect at
specific nodes. The nodes represent specific theoretical developments made by a specific piece
of literature. Certain writings will contain significant theoretical developments and will be at the
core of the literature. These articles are normally referred to as “grandmothers”, whereas other
articles, which are still important in developing significant strands within the literature, are
normally described as “mothers” and the remainder as “daughters” (Ryan et al. 2002:187).
For the literature network compiled here (see Appendix A), the “grandmothers” are encircled,
while the remainder of the contributors appear in a rectangular block. Nodes are separated
vertically based on time and horizontally based on a basic grouping of theoretical concepts. A
heading provides a brief description of the theoretical concept grouping.
2.4 Research issues
Our aim here is to identify research issues and other problems for discussion, from a review of
the literature.
There is a wealth of literature on M&As in general, but limited writings specifically on synergy in
M&As. From our search, a comprehensive text on practices to be used in quantifying the
different types of synergy in M&As does not exist. Thus as a starting point, there seems to be a
need for such a comprehensive description and a consolidation of ideas.
A critical review of the literature revealed several research issues. Several principal authors
argued that M&As could add economic value: Chatterjee (1986, 1992), the author most cited
according to the ISI Web of Knowledge search for this topic (refer to Table 2-1), concluded that
economic value could be added in M&As through synergy or restructuring, but that it more often
resulted from the latter. Porter published his influential work “Competitive Strategy” in 1980.
Here he does not specifically use the term “synergy”, but semantically describes a similar
concept in the form of conditions that could generate above-average returns in M&As. Ansoff
published a seminal work of literature titled “Corporate Strategy” in 1965. In this book, Ansoff
presents a practical guide for analysing principal strategic problems, including one of the first
descriptions of the concept of synergy in a business context and a description of circumstances
in which it could exist. However, he also describes circumstances in which negative synergy
could occur in M&As. Other authors also described the destruction of economic value in M&As,
or between business units within a company. Linn and Rozeff (1985) formulated the anergy
hypothesis and thereby suggest certain circumstances that could produce the destruction of
value. Prahalad and Bettis also described negative synergy in their 1986 paper. Here they

14
argue that it could occur when resources are removed from the areas of operation that
management knows best. A research issue therefore seems to be a question of why synergy
exists for some M&As, but not for others. This could be approached from a strategy point of
view: which target to choose? Alternatively, we can view it from a valuation practice point of
view: a target has been identified – what is the expected value of synergy for this type of
merger?
A study by Sirower and Sahni (2006) showed that the average acquisition premium paid for
targets in the US, between 1995 and 2001, was nearly 36 percent – in some cases as high as
40.5 percent. Porter (1980) argued that the conditions that could generate above-average
returns could justify the payment of an acquisition price above that offered by other buyers. In
contrast, Sirower and Sahni (2006) highlighted the fact that most of the mergers for which these
premiums were paid actually destroyed value. Here the price that is paid for a merger seems to
be an important determinant of success. The concept of a maximum price could thus be
investigated further.
A purchase price or acquisition bid could be analysed in terms of its components and it could be
argued that, in cases where an acquisition premium is offered, it could include a component for
proposed synergy. Sirower (1997) and Devine (2002) are strong proponents that synergy value
should be quantified in detail before making an acquisition. If there are indeed better ways of
quantifying this value, then it could add value to describe them – especially as there does not
seem to be a single comprehensive source of information on these best practices.
Different authors have described various types of synergy. Ansoff (1965) provided one of the
earliest classifications when he described the different forms as: sales synergy, operating
synergy and investment synergy. Here sales synergy refers to increased revenue, operating
synergy refers to decreased operating cost and investment synergy refers to decreased
investment requirements. A few years later in 1986, Chatterjee described the various types as:
collusive synergy, operational synergy and financial synergy. In this context, collusive and
operational synergy refer to a concept very close to the definitions used by Ansoff (1965) for
sales and operating synergy, respectively. According to Chatterjee (1986), however, financial
synergy is the result of a reduction in the cost of capital. McKinsey & Company, in their
insightful guide to valuations (2005), differentiate between only two types of synergy, providing
the broadest classification in the literature: cost synergies and revenue synergies. The different
terminology used and various types of synergy described could, however, lead to confusion.
Value could thus be added by further investigating the various types of synergy as described,
and by indentifying and describing the linkages between them.

15
In an attempt to provide a comprehensive and consolidated account of the underlying concepts
involved in quantifying synergy value in M&As, next we will provide a literature review of these
concepts – including the relevant definitions.
2.5 Key concepts
Here we provide definitions of the relevant concepts from the literature in order to impart the
necessary background information and to serve as a point of departure.
Best practice
Marek Szwejczewski promotes the study of “best-in-class” organisations to identify best
practices, which he defines as: “a practice that has been shown to produce superior
performance” (2008: no page number).
Our aim in this literature review is to critically assess the literature, in order to identify the best
practices used to quantify M&A synergy value. Our hope is that this will serve as a mechanism
for improving companies’ disappointing track record in this regard.
Efficiencies
The New Oxford American Dictionary defines “efficiency” as “the state or quality of being
efficient”; the term “efficient”, in turn, is defined as “achieving maximum productivity with
minimum wasted effort…[in combination] preventing the wasteful use of a particular resource”
(2005: no page number). Various authors credit the existence of operational synergy to the
effect of efficiencies, including the efficiencies resulting from: economies of scale (Ansoff, 1965;
Gaughan, 2007), economies of scope (Gaughan, 2007) and various other efficiencies
(Chatterjee, 1986). As a result, this topic is included here for discussion.
In 2002, De la Mano authored an insightful enterprise paper on efficiencies in European merger
control. (The Office for Official Publication of the European Communities published this paper.)
Amongst other things, this paper summarises the economic theory of efficiencies. Two main
types of efficiencies are identified (De la Mano, 2002:8-9):
• Static efficiencies – these are efficiencies that are achieved at a given point in time, with
existing resource prices, existing technologies and the current level of knowledge. Two
different types of static efficiencies could further be identified:

16
o Allocative efficiencies – these are said to be achieved when the existing inventory of
goods is allocated to the buyers who value them the most, by means of a pricing
system.
o Productive efficiencies – these are said to be achieved when a firm or industry
produces a certain level of output at its lowest cost, or if the given inputs produce the
maximum possible output. (These are also known as technical efficiencies).
• Dynamic efficiencies – these are efficiencies that lead to improvements in the available
technology or the discovery of new products or processes, that will expand the frontiers
of production. (These are also known as innovation efficiencies.)
De la Mano (2002) further differentiates between real and pecuniary efficiencies, a classification
made largely based on the ideas contained in the “no-synergy theorem”, formulated by Farrel
and Shapiro. (This theorem is discussed in more detail infra, in this section, under the heading
“synergy”.) De la Mano describes real efficiencies as allowing an entity to produce greater
output (or output with higher quality) from the same amount of inputs. Real efficiencies
represent cost savings resulting from savings in real resources, for example procurement
savings following a merger, as a result of the optimisation of logistical operations. He further
argues that pecuniary efficiencies merely entail the transfer of wealth from one party to another
and are not a saving in real resources. For pecuniary efficiencies he provides the example of
merger tax gains, which represent a transfer of wealth from the government to the merged
entity.
Normally each country (or group of countries as in the case of the United States of America and
the European Union) has a governmental body tasked with merger control. These governmental
bodies usually evaluate proposed M&As from an antitrust perspective, in order to promote the
welfare of a certain group.6 The evaluation of efficiencies could occur as part of this process,
where it is included in their criteria. Based on current standards in the European Union, a
consumer welfare standard is adopted. This standard includes the consideration of benefits to
consumers, including the effect of a proposed merger on prices, quality, choice and innovation.
Where a merger might impede competition, efficiencies are considered as a rebuttal.
Notice that an essential and significant part of several M&As is to successfully negotiate the
requirements of the relevant antitrust legislation. This is a specialised area and the purpose of
this dissertation is not to comprehensively address this matter. Instead, in this dissertation we
attempt to provide a cross-link between efficiencies considered for European merger control
6 Usually weighted between the welfare of certain market participants, who could include the merging firms, the competitors and consumers.

17
(with its effects on prices et al.) and synergies in M&As (with its effect on shareholder value).
From this viewpoint, we will focus mainly on productive and innovation efficiencies, whether
they represent real or pecuniary efficiencies.
Mergers and acquisitions (M&As)
A publication by The Economist clearly differentiates between the two terms:
Mergers refer to deals where two or more companies take virtually equal stakes in each
other’s businesses, whereas an acquisition is the straightforward purchase of a ‘target’
company. (Devine, 2002:1)
As mentioned, in this dissertation when referring to “merger” (including the plural) it is meant to
include the term “acquisition” (or its plural) and vice versa. Furthermore, when referring to M&As
here, it is meant to include the term “business combinations”, a term often used in the financial
accounting field. As an authority in the field, the International Accounting Standards Board
(IASB) defines a business combination as:
The bringing together of separate entities or businesses into one reporting entity. The
result of nearly all business combinations is that one entity, the acquirer, obtains control
of one or more other businesses, the acquiree. (2009d, paragraph 4, emphasis in the
original.)
Relatedness
According to the New Oxford American Dictionary, relatedness is a term used to identify people,
places or things that belong “to the same family, group, or type” (2005: electronic version). In
other words, they are connected.
According to Rumelt, when considering the relatedness of firms in the context of a possible
merger, they may be related, “when a common skill, resource, market or purpose applies to
each” (1974:29). Seth added to this by refining relatedness to exist when “they employ similar
production techniques, serve similar markets and (sic) [or] use similar distribution systems”
(1990:100).
Lubatkin, in a 1987 article, re-examined the performance issues of M&As, investigating the
relatedness aspect. Here, relatedness between merging firms is classified on various levels:

18
product-concentric mergers, horizontal mergers, market-concentric mergers, vertical mergers
and conglomerate mergers. Product-concentric mergers could be said to involve entities with a
large overlap in products; horizontal mergers involve entities that operate in the same industry,
producing substitute goods; market-concentric mergers could be said to involve entities with a
large overlap in their markets; vertical mergers involve combining entities higher up and lower
down on the supply chain (e.g. closer to raw materials or the customer); and conglomerate
mergers are said to involve the combination of entities operating in different markets (involving
either complementary or unrelated products).
It should be noted that certain scholars use the term “relatedness” as a synonym for “synergy”.
Refer to our comments in this regard under the section following next.
Synergy
The New Oxford American Dictionary defines synergy in a broad sense as:
The interaction or cooperation of two or more organizations, substances, or other agents
to produce a combined effect greater than the sum of their separate effects (2005: no
page number).
Ansoff described synergy as “the ‘2 + 2 = 5’ effect” (1965:72). Copeland and Weston provided a
more formal definition of synergy when they proposed that synergy exists when the net present
value of the cash flow of the combination of two assets is greater than the sum of the net
present values of the cash flows of the assets independently (1983). Albo and Henderson
provided a similar definition; although not expanding on the present value concept, they
described synergy as the net incremental discretionary cash flows, which are a direct result of
an acquisition (1989). A definition in a publication by The Economist suggests “the combination
of various physical, financial and intellectual assets such that their value is greater than the sum
of their individual worth” (Devine, 2002:9). Sirower emphasises that synergy represents the
value of additional performance requirements, by defining it as “increases in competitiveness
and resulting cash flows beyond what the two companies are expected to accomplish
independently” (1997:6). Synergy was also defined more freely as “a mysterious chemistry
between combining companies” (Devine, 2002:9).
In 1980 Porter described a concept similar to synergy in his description of conditions that can
generate above-average returns in acquisitions. These conditions occur where the buyer has a
distinctive ability to improve the operations of the seller, or where the buyer buys into an

19
industry that meets the criteria for internal development and the acquisition will uniquely help a
buyer’s position in its existing businesses. Porter argues that these conditions justify the
payment of an acquisition price above that of other buyers. When we apply the definition of
synergy according to Copeland and Weston (1983), the aforementioned conditions leading to
above-average returns would lead to a net present value of the cash flow of the combination of
two assets, which is greater than the sum of the net present values of the cash flows of the
assets independently. Here, the conditions that could generate above-average returns thus
meet Copeland and Weston’s definition of synergy. Notice that in this instance, synergy refers
to a benefit in excess of those synergies that could exist for other market participants.
A related concept is one of negative synergy. Ansoff (1965) described circumstances in which
negative synergy could occur, such as in an M&A where the industry of the target has
drastically different organisational forms, cost controls and specialised skills. In addition, Linn
and Rozeff formulated the “anergy hypothesis” in 1985. Although the New Oxford American
Dictionary describes anergy only in a medicinal context as “the lack of an immune response to a
particular antigen or allergen” (2005: no page number), these authors applied it in a business
sense in their postulation that there might be circumstances that produce diseconomies when a
certain business unit is run in conjunction with other units of the company. In this case, the cost
and other disadvantages outweigh the benefits of diversification. Prahalad and Bettis (1986)
also described the concept of negative synergy, as occurring when additional businesses may
take resources away from the areas of operation that management knows best.
Farrel and Shapiro formulated the “no-synergy theorem” in 1990 and provided further
explanation in a paper of 2001. Here they refer to synergy as “efficiencies based upon the close
integration of specific hard-to-trade assets owned by the merging parties”. In this context, De la
Mano adds that these synergies “allow output/cost configurations that would not be possible to
be achieved by one firm unilaterally without the merger” (2002:45). De la Mano (2002) further
emphasises the importance of this theorem, in that it is starting to assume greater application in
European merger control, with their greater focus on merger-specific efficiencies. According to
the theorem, efficiencies such as rationalisation of production and economies of scale are often
classified as “non-synergy efficiencies” as it could often be argued that each firm could have
achieved these efficiencies unilaterally through its own expansion (De la Mano, 2002:45). This
theorem makes a few fundamental assumptions about the market, competitors and products –
assumptions that will not be applicable in cases of M&As occurring in small economies, or
where the time taken for the firm to implement the measures on its own is too long (De la Mano,
2002). The reason why this theorem finds favour with European Community Merger Regulation
is probably due to its impact on prices and the welfare of consumers. (It is argued that an M&A

20
lacking in synergies, as defined in Farrel and Shapiro’s theorem (1990), will result in increased
prices.) For the purposes of this dissertation, the impact on prices has little relevance. Farrel
and Shapiro’s theorem (1990, 2001) does, however, raise an important question: if the
synergies are not merger-specific (unique to the bidder and target) and could be achieved by
other potential bidders as well, will these synergies not already be factored into the asking price
for the entity, with the result that no synergies will remain for the bidder?7 The matter of a
maximum bid price is considered infra, at section 5.4.
For the purposes of this research dissertation we follow the definition proposed by Copeland
and Weston (1983), in their proposal that synergy exists when the net present value of the cash
flow of the combination of two assets is greater than the sum of the net present values of the
cash flows of the assets independently. Because the net present value of an asset on its own
will already incorporate assumptions about future growth and related cash flows (when applying
valuation models based on discounted cash flow as described infra, at section 2.7), we
emphasise Sirower’s qualification, in that synergy should represent “increases in…cash
flows…beyond what…[were already]… expected” (1997:60). Farrel and Shapiro’s theorem
(1990, 2001) will represent a reasonability test, in that it should point to specific synergies that
are unique to the bidder and target that might justify the payment of a premium.
Note that certain authors have used the terms “relatedness” (Barney, 1988)8 or “strategic fit”
(Shannon, n.d.9) as synonyms for “synergy”. We argue that this is semantically incorrect, but
acknowledge that the concepts of relatedness and strategic fit between firms can in certain
cases lead to synergy.
2.6 Quantifying value: distinct concepts of value
Throughout the literature several concepts of value emerged. In an attempt to provide a
comprehensive and consolidated account of the relevant underlying concepts, and to create a
bridge between the distinct valuation concepts and the synergy concept, here we specifically
describe and analyse the different types of value. We also attempt to describe the reasons for
the differences in value.
7 It raises other questions as well, which are beyond the scope of this dissertation, such as: if the synergies are not merger-specific, is there not a better way of achieving them, for example through a contract or a joint venture? 8 Barney, J.B. 1988. ‘Returns to Bidding Firms in Mergers and Acquisitions: Reconsidering the Relatedness Hypothesis’, Strategic Management Journal. Vol. 9: 71-78. 9 Shannon, D.F. Not dated. Synergy. [Online.] New York: Wiley-Blackwell. Available on a subscription basis from: <http://www.blackwellreference.com> [Accessed 18 November 2009].

21
Concepts of value applied in pricing a company include: historical cost, market capitalisation,
intrinsic value and fair market value (Eccles, Lanes & Wilson, 1999; King, 2006). Appendix B
highlights the various different concepts of value as applied to the acquisition process of
AirTouch Communications Inc., which occurred during 1998 and 1999. This figure is adapted
from a graph prepared by Eccles et al. (1999) and percentages were calculated based on the
prices per share in United States dollars as they appeared in this paper. Subsequent
investigation revealed that prices per share in this paper differed from the actual figures
published by the acquirer (Vodafone, 2009). As the purpose here is to encapsulate the different
concepts of value as it applies to an acquisition process, the percentages as they appear in
Appendix B are still relevant for illustrative purposes – the factual accuracy notwithstanding. The
figure describes several of the aforementioned concepts of value, including intrinsic value,
market capitalisation, fair market value and specific value. It also shows that each valuation
concept could have a wide-ranging effect on the quantified value. For this reason, when a target
company is identified as a candidate for merger, it is important to determine which of the distinct
valuation concepts should best be applied to quantify the offer price and the synergy value.
Appendix B also introduces a few other concepts such as value accruing to shareholders of the
target and to those of the acquirer.
Historical cost
In financial accounting, historical cost is the “original monetary value” of an economic item
(International Accounting Standards Board, 1989).
Normally, the original monetary value (and therefore also the historical cost) will equal the
original purchase price. However, the original amount paid by an acquirer implies a value at a
certain point in time. When a target company is identified as a candidate for merger by a new
acquirer, the point in time has moved on. As a result, the original monetary value (and therefore
historical cost) has reduced relevance to the new acquirer. Recognising this, the financial
accounting field is also moving away from historical cost accounting: following many years of
consistent application, both the Financial Accounting Standards Board (FASB) in the United
States and the International Accounting Standards Board (IASB), have been moving away from
the historical cost basis towards one of fair value reporting (King, 2006).
Intrinsic value
Eccles et al. (1999) described a target company’s intrinsic value as its most basic value,
recounting its quantification as principally based on the net present value of expected future
22
cash flows. Importantly, they qualify their definition with the following statement: intrinsic value
should be viewed independently from any M&A. Intrinsic value thus assumes that the target
company continues under current management with future expectations as originally anticipated
by the market. McKinsey & Company (2005), support the notion that intrinsic value is
fundamentally determined using a discounted cash flow model. They further support the notion
that intrinsic value should equal fair market value over long periods, and vice versa, but mention
that temporary differences could exist. Appendix B shows that synergies are not included in the
intrinsic value.
Fair market value
For many years appraisers have used and applied the distinct valuation concept of fair market
value. There is, however, no single, universally accepted term for this concept in the literature –
several other variations exist in its exact nomenclature, such as “market value” and “fair value”.
The financial accounting field also seems to be moving to a reporting structure based on
fair market value. The Financial Accounting Standards Board (FASB) specifically includes a
reference to market participants in its nomenclature, defining “fair value” as:
The price that would be received for an asset, or paid to transfer a liability, in a current
transaction between marketplace participants in the reference market for the asset or
liability (King, 2006:29).
The International Accounting Standards Board (IASB) defines “fair value” as:
The amount for which an asset could be exchanged, or a liability settled, between
knowledgeable, willing parties in an arm’s length transaction (International Financial
Reporting Standard 3: 2009d, Appendix A).
The International Valuations Standards Committee (IVSC), uses the term “market value” and
provides a comprehensive description when defining it as:
The estimated amount for which a property should exchange on the date of valuation
between a willing buyer and a willing seller in an arm’s-length transaction after proper
marketing wherein the parties had each acted knowledgeably, prudently, and without
compulsion (2007:3).

23
In the International Valuation Standards, published by the IVSC in 2007, property types include
real property, personal property, businesses and financial interests. In a study the IVSC
reviewed the annual reports of a number of leading European property investment companies to
identify the impact of the introduction of International Financial Reporting Standards (IFRS). In
its findings the IVSC calls for greater consistency in the use of valuation practices and valuation
bases, specifically the basis of fair value. Some of the more significant differences identified in
the companies’ financial reporting were the use of terms other than “fair value”, such as “open
market value” and “reasonable value”. “Market value for existing use” was used on one
occasion for the valuation of the operating properties of one company in the United Kingdom.
“Open market value” was defined in a financial report as “the price at which an asset or property
right can be sold at any given time under normal market conditions” (IVSC, 2007:3-4). The
Internal Revenue Service of the United States of America further emphasises the willingness
component, when they define fair market value as:
The price for which property would exchange between a willing buyer and a willing
seller, each having reasonable knowledge of all relevant facts, neither under compulsion
to buy or sell, and with equity to both (King, 2006: 29).
Regardless of the different wordings contained in the Internal Revenue Service and the FASB’s
definitions – including the reference to “property” in the former, and “asset” and “liability” in the
latter – they are very similar, according to King (2006). He argues that the asset or liability
classes could probably be stretched to encompass each other.
The various definitions of “fair market value”, “market value” and “fair value” thus seem to
overlap, with most definitions touching on the following elements: firstly, it is the amount for
which an asset could be exchanged; secondly, it involves a willing buyer and willing seller;
thirdly, the parties have reasonable knowledge of the relevant facts; fourth, it represents an
arm’s-length transaction; and fifth, it should be performed from the perspective of market
participants and not a specific acquirer. (This element is specifically stated in some definitions,
but many definitions merely infer that the valuation should include this element.)
For purposes of this research dissertation, we will refer to the term “fair market value”, implying
that it encompasses all five elements mentioned above.
24
Market capitalisation
Much has been written on the efficiency of markets to accurately value an asset, specifically by
Jensen (1988). Our aim here is not to argue this point; instead we will attempt to provide an
expected correlation between certain concepts of value and market capitalisation, given a
reasonably efficient market. We further aim to shed light on the effect of the pricing of a
controlling or non-controlling shareholding on market capitalisation, at different points in the
acquisition process.
The Economist defines market capitalisation as “the quoted share price multiplied by the total
number of shares that the company has issued” (2008). They describe it as an indicator of the
value of a company’s shares. It is important to note that quoted share prices will only be
available for listed entities and by implication, that market capitalisation could only be calculated
for these type of entities. It should be noted further that market capitalisation applies the value
of recent trade in a share, to a share base. It thus extrapolates a proxy of value (that of a single
share) to the share base, thereby providing some indicator of total shareholding value.
Market capitalisation’s first constituent, the quoted price per share, represents the amount at
which a freely available share could be traded, at a specific point in time. The quoted price per
share is, in other words, connected to a type of share: freely available shares (also known as
free-float shares). Free-float shares reflect the market for public investment and normally
exclude certain shareholdings that are not available to the public, including: trade investments
by a group company; significant long-term holdings by founders, their families or directors; and
government holdings.10 The market for public investment, in turn, is served by several indices,
with a primary purpose to reflect the aggregate movement of the market it represents. Many
worldwide indices, including those by the Financial Times Stock Exchange (FTSE), do not base
their indices on full market capitalisation anymore, opting instead to base their indices on free-
float market capitalisations.11 Free-float market capitalisations provide a better indicator of the
market available for public investment and will result in a smaller market capitalisation than that
calculated using the full market capitalisation method.
In valuation practice, the size of the shareholding (specifically whether it is a controlling or non-
controlling interest) is intricately connected to the quantified value. A valuation methodology 10 These specific exclusions are part of the 2008 FTSE index rules (FTSE International Limited [available online]). 11 According to 2008 FTSE index rules (FTSE International Limited [available online]), free-float market capitalisation is normally calculated as follows: market price per share x (total shares outstanding – locked-in shares), or market price per share x shares outstanding x free-float weighting.
25
survey by PricewaterhouseCoopers (2008) revealed that a minority discount is usually applied
in determining the value of a non-controlling interest, in cases where an appraiser applied a
valuation model designed to appraise a controlling shareholding, such as a discounted cash
flow approach.12 What is significant to recognise here is that in valuation practice, the price of a
share and the type of share are connected. In this trend, a free-float market capitalisation more
closely marries the two constituents of market capitalisation: the price for a free-float share and
the number of free-float shares. Full market capitalisation is an odd combination of the price of a
free-float share applied to all issued shares. If a target company has a sufficiently small amount
of free-float shares available (with control residing in its shares that are not free-float), its free-
float market capitalisation could represent the value of a minority shareholding, whereas its full
market capitalisation could represent an illogical combination of the price for a non-controlling
share extrapolated to all issued shares.
A target company’s full market capitalisation, a few days before a bid is announced (refer to
Appendix B), often does not compare to its intrinsic or fair market values. The reason for this,
except for the effect of market efficiency, could be that full market capitalisation is sometimes
based on a price per non-controlling share, whereas the intrinsic and fair market values are
based on a 100 percent controlling interest. This comparison refers to values at a certain point
in time. If full market capitalisation is calculated during the bid period, or at a time that a bid is
expected by the public, the market would probably react to the information and might
incorporate a premium into the price per share for the likelihood that an offer has been made, or
that an offer will be made, or even that a higher offer will probably be tendered (Eccles et al.,
1999). The information-content of an actual or expected bid thus creates an expectation in the
market. The result is often that a single non-controlling share at this point in time is priced close
to an actual or expected bid-price for a single share, belonging to a controlling shareholding.
Even if the bidder is not of the intent to purchase 100 percent of the shareholding in the target, a
full market capitalisation nevertheless applies the proxy principle to extrapolate the price to all
issued shares. During the bid period, or at a time that a bid is expected by the public, the full
market capitalisation thus often closely compares to the fair market value of the target company.
As discussed in the next section, a few circumstances exist where the price offered by
competitor bidders would far exceed the fair market value. The market’s reaction to this bid
could also result in a likely full market capitalisation that far exceeds the fair market value.
12 The PricewaterhouseCoopers valuation methodology survey revealed that the majority of respondents to the 2007 survey applied a minority discount when using the income approach (this includes valuation based on discounted cash flow) to value an entity. Here, discounts are usually applied to the market value of equity, with discounts averaging 20% for interests lower than 25% and 15% for interests above 25% (2008:46-48).

26
The concept of market capitalisation and its relation to company value is thus fraught with
complications. Large sways in value could be expected depending on the method of calculation
(full market capitalisation or when based on free-float) and the timing of the calculation relative
to a bid for a target company.
Reasons for differences in value
From Appendix B, the illustrative fair market value equals the market capitalisation of the target
company (measured on the day of the bid), but is in excess of the intrinsic value. The exact
point in time in which the market capitalisation (or fair market value) is measured will make a
difference as this is based on market perceptions, which change over the acquisition process.
On the date that the press reported on the bid for AirTouch Communications, the market added
a premium to the intrinsic value, which Eccles et al. (1999) credit to the market’s estimation of
the likelihood that an offer will be made that will be in excess of the intrinsic value.
McKinsey & Company (2005) indicate that market values revert to intrinsic values over the long
term, but that fair market values could be lower than intrinsic values in certain circumstances,
such as:
• Markets overreacting to negative publicity, e.g. a criminal investigation of an executive or
the failure of a specific product, where a company still has a range of other strong
products; and
• Undervalued companies, in the bottom of a cycle, where they operate in a cyclical
industry.
Conversely, they note that fair market values could be higher than intrinsic values following
periods of strong market performance, such as during the stock-market bubble in the late
1990s.
From Appendix B, the illustrative final offer price is in excess of the intrinsic value. According to
Eccles et al. (1999), this will nearly always be the case, as the existing shareholders will
normally refuse to sell in the absence of a premium. The final offer price is also in excess of the
fair market value. In this regard, the writings by Porter (1980) and King (2006) highlight a few
circumstances where the price offered by competitor bidders would far exceed the fair market
value:
• Irrational bidders (seeking growth or following non-economic motives. A careful analysis
of the motives and factors entering into this bidder’s price is recommended).

27
• Bidding wars (driving up the price to unreasonable levels just to prevent the competitor
from winning).
• The bidder expecting a high amount of synergies that are not available to other bidders
and difficult for competitors to know about. (Here an appraiser could not easily quantify
these synergies and it might therefore not be incorporated into the fair market value
calculated from the other bidder’s perspective.)
The reasons for the difference in value between the concepts of “value in use” and “intrinsic
value” are discussed in the next section.
In summary, a final bid price often does not equal the fair market value of an entity, which in
turn often does not equal its intrinsic value. In the context of quantifying synergy value, the
valuation concepts of intrinsic value and fair market value are the most relevant, but as for all
valuation concepts, the exact time at which a value is determined could have a significant effect
on its outcome. The value of synergy, available to any market participant, will be incorporated in
the fair market value of an entity. The value of synergy between the target and bidder entities in
question should be considered in the final bid price.
Accounting concepts: Goodwill, “fair value less costs to sell”, “value in use” and net
asset value
Related to synergy is an asset called “goodwill”. According to the New Oxford American
Dictionary, goodwill can be described as “the established reputation of a business regarded as
a quantifiable asset” (2005: no page number). Goodwill is a notion that is closely associated
with the financial accounting field, where it was subject to a wide range of treatments throughout
the years. The concepts of “fair value less costs to sell” and “value in use” appear in the
accounting literature and are mainly used in testing for the impairment of goodwill.
In this research dissertation we do not consider financial accounting implications, unless they
have a real-world implication or are able to illuminate the facts. It is beyond the scope of this
dissertation to provide a detailed account of the accounting treatment of goodwill, but as its
accounting treatment can provide further insight, we provide a brief synopsis.
Initial recognition of goodwill
The financial accounting field is moving towards fair value accounting in keeping book of
transactions, assets and liabilities. Fair value accounting is applied specifically upon the

28
acquisition13 of an entity. As will be described in more detail infra, in this section, the accounting
treatment of goodwill at present requires that the value of goodwill be determined as a residual
figure, following the quantification of the purchase consideration and the value of other assets.
Per this treatment, goodwill is thus not quantified directly.
The Financial Accounting Standards Board (FASB) in its Statement of Financial Accounting
Standard 141 Business Combinations (SFAS 141, 2001) describes goodwill as the difference
between the purchase price and the sum of the fair market values14 of identifiable assets.
Through a process of what is known in the field as a “purchase price allocation”, what remains
of the purchase price after allocation to identifiable assets is recognised as goodwill. In
accounting for goodwill, according to International Financial Reporting Standard 3 Business
Combinations (IFRS 3, IASB, 2009d), the International Accounting Standards Board (IASB)
follows an approach similar to that of the FASB, in accounting for goodwill as a residual figure.
The IASB describes goodwill as “future economic benefits arising from assets that are not
capable of being individually identified” (2009d). It is relatively simple to identify the tangible
assets (such as property, plant and equipment, and working capital), but the intangible assets
often provide more of a challenge. International Accounting Standard 38 Intangible Assets (IAS
38, IASB, 2009c), describes how these assets are identified: according to IAS 38.12 “an asset is
identifiable if it either: (a) is separable, i.e. is capable of being…divided from the entity and sold
[or] transferred…either individually or together with a related contract…asset...or liability…; or
(b) arises from contractual or other legal rights”. This standard also specifies that an intangible
asset can only be recognised if it meets additional criteria, which include: it must represent a
resource controlled by the entity, it must be possible to measure its cost reliably and it must be
probable that associated future economic benefits will flow to the acquirer. Certain intangible
assets are often identified and recognised separately upon the acquisition of a target company,
for example (IASB, 2009d:IE16-43):
• Those intangible assets based on a contractual right, including: trademarks, Internet
domain names, non-competition agreements, contractual customer relationships,15
books, musical works, photographs, motion pictures, lease agreements, patents, and
trade secrets.
13 As previously remarked, the accounting field makes use of the term “business combination” in this context. 14 As previously remarked, the accounting field makes use of the term “fair value”, instead of “fair market value”, but essentially refers to the same concept. 15 These include a customer contract, or in the case of an order backlog, a purchase order (IASB, 2009d:IE16-43).

29
• Those intangible assets that are separable, including: customer lists,16 non-contractual
customer relationships,17 unpatented technology, and databases.18
Notice that certain intangible assets are separable, but are not recognised separately as a result
of not meeting one of the other recognition or identification criteria. An example is an assembled
workforce, where employment contracts are taken over by the acquirer. Given that employees
are able to leave within a very short notice-period, an entity normally has insufficient control
over the expected future economic benefits arising from a team of skilled staff. As such, an
assembled workforce is not recognised as an intangible asset, but is often included in the
residual goodwill figure.
Link between goodwill and net asset value at the acquisition date
As part of the initial recognition of goodwill, it is a common practice to perform a reasonability
test by calculating the fair market value of equity on the acquisition date, using a discounted
cash flow model (part of the income approach), in cases where a market-comparable approach
is not practical. (Note that the income and market-comparable approaches are discussed infra,
at section 2.7.) Such a reasonability test can be visualised with the help of Figure 2-3. (Note that
this figure provides a simplified oversight only.) In applying the discounted cash flow model
here, buyer-specific synergies are eliminated and projections are adjusted such that
assumptions are consistent with those of market participants. (In line with the arguments supra,
in this section under “reasons for differences in value”.) The fair market value of equity
calculated in this way is then compared to the net asset value of the assets (including intangible
assets) recognised separately using fair value accounting. In cases where the fair market value
of equity calculated here is higher, it could be due to the value of several components included
in goodwill, including those reflected in Figure 2-3: the value of future customer relationships,
the value of future intellectual property, the value of assets that did not meet the recognition or
identification criteria (e.g. assembled workforce), or value attached to “other excess cash flow”.
Per Figure 2-3, the portion of goodwill in excess of these components, that which is implied by
the purchase price, is included in the initial recognition of goodwill, but this (and the other
components) will be tested for impairment later, as discussed next.
16 Customer lists are separable in many cases as they are often leased or exchanged (IASB, 2009d:IE16-43). 17 Where the relationship is separable with evidence that other entities have sold or transferred a similar item (IASB, 2009d:IE16-43). 18 Databases are separable in many cases (even if not subject to copyright) as they are often leased or exchanged (IASB, 2009d:IE16-43).
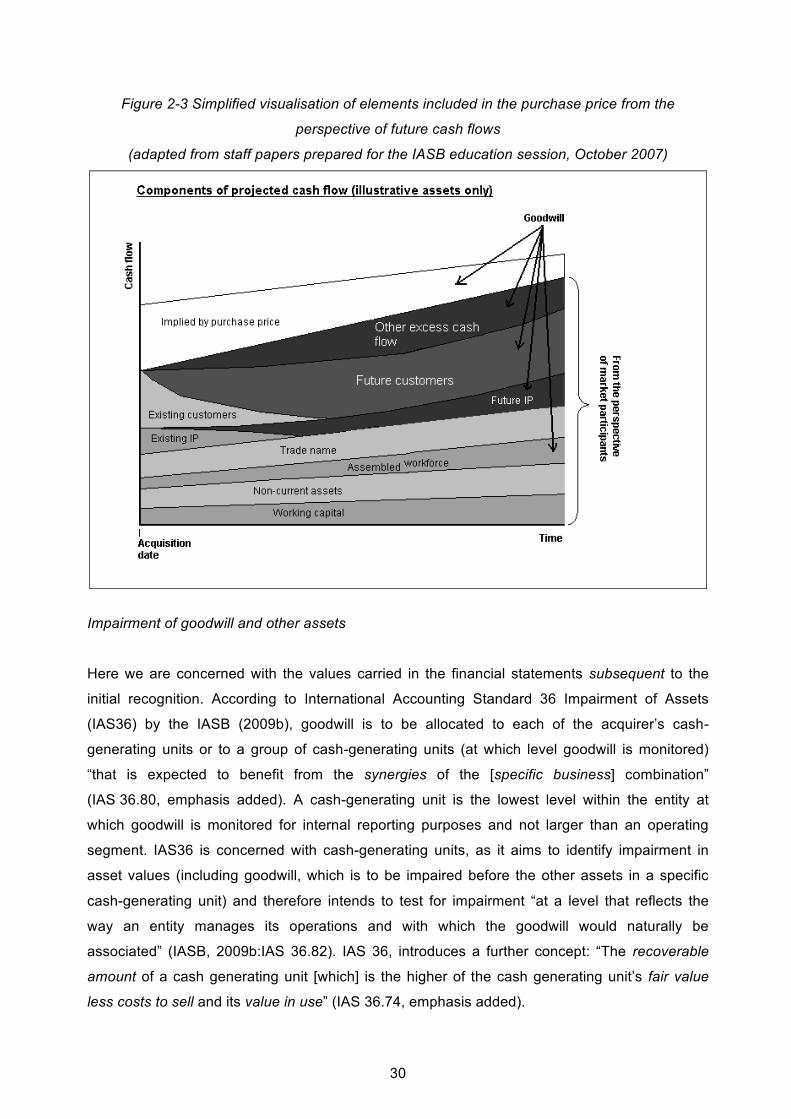
30
Figure 2-3 Simplified visualisation of elements included in the purchase price from the
perspective of future cash flows
(adapted from staff papers prepared for the IASB education session, October 2007)
Impairment of goodwill and other assets
Here we are concerned with the values carried in the financial statements subsequent to the
initial recognition. According to International Accounting Standard 36 Impairment of Assets
(IAS36) by the IASB (2009b), goodwill is to be allocated to each of the acquirer’s cash-
generating units or to a group of cash-generating units (at which level goodwill is monitored)
“that is expected to benefit from the synergies of the [specific business] combination”
(IAS 36.80, emphasis added). A cash-generating unit is the lowest level within the entity at
which goodwill is monitored for internal reporting purposes and not larger than an operating
segment. IAS36 is concerned with cash-generating units, as it aims to identify impairment in
asset values (including goodwill, which is to be impaired before the other assets in a specific
cash-generating unit) and therefore intends to test for impairment “at a level that reflects the
way an entity manages its operations and with which the goodwill would naturally be
associated” (IASB, 2009b:IAS 36.82). IAS 36, introduces a further concept: “The recoverable
amount of a cash generating unit [which] is the higher of the cash generating unit’s fair value
less costs to sell and its value in use” (IAS 36.74, emphasis added).

31
The “fair value” portion included in “fair value less costs to sell” is essentially the concept
discussed supra, in this section under the heading “fair market value”. From this value the costs
to realise the asset are deducted, to obtain the fair value less costs to sell19.
“Value in use” is a concept of value that refers to the value of an entity that is created by a
specific owner from its continuing use and its ultimate disposal. “Value in use” is comparable to
intrinsic value, as intrinsic value is viewed independently from any M&A (i.e. for an existing
owner) and “value in use” is often used to quantify the value of an entity after a merger took
place (i.e. for the then-existing owner). But for a few exceptions, “value in use” is normally used
for a different purpose than intrinsic value – that of impairment testing. As such, IAS 36
specifies that “value in use” should be estimated for every cash-generating unit of the entity
using a discounted cash flow model (IASB, 2009b). In applying a discounted cash flow model,
the information should reflect the specific entity’s estimates, including the effects of factors
specific to the entity (including owner-specific synergies), but not those applicable to other
market participants.
After goodwill and other assets are allocated to cash-generating units (or groups of cash-
generating units), they are tested for impairment by comparing their carrying values (recognised
based on fair value accounting) to their recoverable amounts. Where sufficient buyer-specific
synergies are available to the acquirer and its value is included in the “value in use”, goodwill
will normally not be impaired. On the other hand, where an acquirer overpaid for a target, the
goodwill initially recognised as a residual figure will be impaired and thus reduced to a level that
takes cognisance of the level of synergies applicable then.
The link between goodwill and synergy
In essence, the FASB and IASB distinguish between two forms of synergy in accounting for
goodwill:
• Synergies available to any market participant – where possible, in its accounting
treatment, this has to be classified and recognised as an identifiable intangible asset;
and
19 Here we should consider the interplay between “costs to sell” and a “marketability discount”. The latter is often applied to the fair market value of equity in a privately held company, as these holdings could not be converted into cash as easily as for a holding in a listed company (PricewaterhouseCoopers, 2008). The marketability discount could therefore overlap with the costs to sell, as the former could incorporate the transaction and administrative costs to sell, the cost to prepare for and execute the sale, and the uncertainty around the time it will take to complete the transaction.

32
• Residual synergy classified as goodwill – if an acquirer pays more than another market
participant, but an amount that is reasonable to its synergies, then the excess is carried
here as goodwill (King, 2006).
Final remarks
In summary, the main accounting bodies incorporate synergy to an extent into the goodwill
figure and they further require that the value of goodwill not be quantified directly, but rather
require it to be determined as a residual figure. These factors support the notion that it is difficult
to quantify synergy.
Accounting for goodwill, as for financial accounting in general, occurs after-the-fact. In the case
of accounting for goodwill as a residual figure, it assumes a known purchase price. However,
the purchase price is not known before a transaction takes place; the purchase price is not the
starting point, but represent the end result of a process: a process which should ideally include
a thorough valuation process, lest an acquisition be sought at any cost and the purchase price
rationalised using any in-vogue concept, including vague notions of synergy (Sirower and
Sahni, 2006; King, 2006.) As part of this valuation concept, the goal of this research dissertation
is, in part, to fill in one of the most difficult parts of the constituents of this purchase price, the
portion relating to synergy. The goodwill concept will therefore not be considered in much detail
further.
2.7 Quantifying value: valuation approaches and available valuation models
Due to the existence of several valuation approaches available to the appraiser, it is important
to determine which approach and, in turn, which model belonging to that approach is the most
appropriate in quantifying value. A valuation approach will then be applied, using a specific
valuation model, to quantify e.g. the intrinsic value of an entity, the fair market value of an entity
(incorporating the synergy available to any market participant), or the value of synergy between
the bidder and target entities.
Basic valuation approaches include the replacement-cost approach, market-comparable
approach and the income approach (King, 2006). The replacement-cost approach asks what it
would cost today to acquire a similar asset. The market-comparable approach asks what a
similar asset is actually selling for in the market. Finally, the income approach asks what a
buyer is willing to pay for an asset in today’s monetary terms, with a given income (or cash flow)
stream in the future, adjusted for perceived risks (often utilising a discounted cash flow model).

33
Depending on circumstances and the appraiser’s judgement of appropriateness, it is possible to
use any of the three approaches above to determine the fair market value of an asset (King,
2006).
Miller and Modigliani (1958, 1961), in their papers classified as “grandmothers” in the literature
network presented in Appendix A, formulated a theory for the valuation of companies with a
corresponding (revised) definition of the cost of capital. These high-impact papers represented
a major literary antecedent to modern thinking in corporate finance and valuation theory. Jensen
(1983) built on the intellectual capital of Miller and Modigliani when he put forth his ideas on the
free cash flow valuation model, incorporating it into a free cash flow theory on takeovers. The
free cash flow model of valuation moved beyond various other models of valuation, including
accounting models and earnings-based models (using price-earnings multiples). The free cash
flow model values the firm as a whole using an operational focus, with the principles of
discounted cash flow forming the basis of the valuation model (Jensen 1986, 1988).
McKinsey & Company (2005) described five models of valuation based on a discounted cash
flow framework, which are described in Table 2-3.20 McKinsey & Company, when performing
valuations in practice, focus on only two models: the enterprise discounted cash flow and the
economic profit model (2005). These models are preferred as they both discount future cash
flow streams at the weighted average cost of capital. They do, however, work best when an
entity maintains a fairly stable debt-to-equity ratio (McKinsey & Company, 2005).
The market-comparable approach puts forth the argument that the market sets the price for an
item. As a result, within this approach, many models exist that compare the entity to a
comparable entity in the market. The main problem here is the lack of directly comparable
entities, with the result that a significant amount of adjustment is necessary – thereby
compromising the purity of the approach. Many of the models that compare the entity to a
comparable entity make use of multiples. McKinsey & Company (2005) described certain best
practices for using multiples in valuation. As expected, they provide a warning on making
exclusive use of multiples to perform a valuation, emphasising that it should rather be used in
support of valuation models based on discounted cash flow. In this way, multiples can help test
the reasonability of cash flow forecasts. The best practices to apply multiples properly, as
identified by McKinsey, are: first, choose comparables with similar prospects for growth and
return on invested capital; second, use multiples based on forward-looking estimates; third, use
enterprise-value multiples based on earnings before interest, tax and amortisation, this in order
20 In formulating these models, McKinsey & Company credit their intellectual foundations to not only Miller & Modigliani (1961), but also to Professor A. Rappaport and J. Stern.

34
to prevent difficulty with capital structure and other short-term gains and losses; fourth, adjust
the enterprise-value multiple for non-operating items, such as excess cash.
Table 2-3 Models of valuation based on discounted cash flow (McKinsey, 2005)
Model Measure Discount factor Assessment Enterprise discounted cash flow
Free cash flow Weighted average cost of capital (WACC)
Works best for projects, business units, and companies that manage their capital structure to a target level.
Economic profit Economic profit Weighted average cost of capital
Explicitly highlights when a company creates value.
Adjusted present value
Free cash flow Unlevered cost of equity
Highlights changing capital structure more easily than WACC-based models.
Capital cash flow Capital cash flow Unlevered cost of equity
Compresses free cash flow and the interest tax-shield in one number, making it difficult to compare performance among companies and over time.
Equity cash flow Cash flow to equity
Levered cost of equity
Difficult to implement correctly because capital structure is embedded within cash flow. Best used when valuing financial institutions.
Due to the nature of synergies and the common lack of directly comparable transactions, the
valuation approach used to quantify its value will be based principally on the income approach,
using a model based on discounted cash flow.
2.8 Quantifying the fair market value from the perspective of market participants
As described supra, one of the elements of fair market value is that it should be measured from
the perspective of market participants and not a specific acquirer. In this context, it is thus
important to discern exactly whom a market participant represents.
When the FASB describes the process of determining the fair market value21 from the
perspective of market participants, the first step is to identify the relevant market and the
second, to do enough research to determine how much these participants are paying for the
subject assets. The FASB chose to use the concept of market participants in the broadest
sense, including prospective buyers not already in the industry (King, 2006). (Here we discuss
the accounting effects due to their possible real-world implications.) King added that the
appraiser would have to consider who the market participants would be, as the fair market value
21 In section 2.6, under the heading “fair market value”.

35
is a function of both the user and the purpose. In a recent exposure draft on fair value
measurement, the IASB (2009a) aims to provide additional guidance on how to measure fair
market value, specifically addressing the “market participant” component. Here they expand on
the definition of market participants, explaining that they represent buyers and sellers in the
most advantageous market. In addition, the IASB (2009a) describes market participants as
participants who are independent of each other, willing to enter into the transaction and
knowledgeable about the asset (perfect knowledge is not required, but efforts to become
knowledgeable, including due diligence efforts, are presumed). They add that fair market value
should reflect the market participant’s “highest and best use”, which is the use that maximises
the value of an asset, considering uses that are “legally permissible, financially feasible” and do
not consider the actual intended use by the acquirer (IASB: 2009a:17).
A research survey into best practices followed in M&A transactions revealed that the value to
other prospective bidders in the market place, not just any market participants, should be
considered in the pre-bid value assessment stage (KPMG, 2001). In quantifying the fair market
value of a target entity in practice, the focus should thus be on identifying and analysing
prospective bidders. Here the recommendations of the accounting bodies could have relevance,
namely the requirements of “highest and best use”, willing buyer and the criteria of being
knowledgeable. This process will require the appraiser to allocate the necessary time resources
in order to familiarise himself with the relevant local (and sometimes international) market and
role-players. Due to the time pressures sometimes involved in deal making, it could be
beneficial for the appraiser to have sufficient prior knowledge of the industry.
As demonstrated, synergies available to market participants (or indeed, prospective bidders),
but not those only available to the bidder in question, should be incorporated in the fair market
value of the entity.
2.9 Discount rates
Models based on discounted cash flow (forming part of the income approach) require not only
projected cash flows, but also an appropriate discount rate. This rate is represented by the
weighted average cost of capital (WACC22). In this section we discuss the WACC and its main
constituents, the cost of equity and the cost of debt.
22 Apologia: in this dissertation use is made of this informal acronym in order to improve readability.
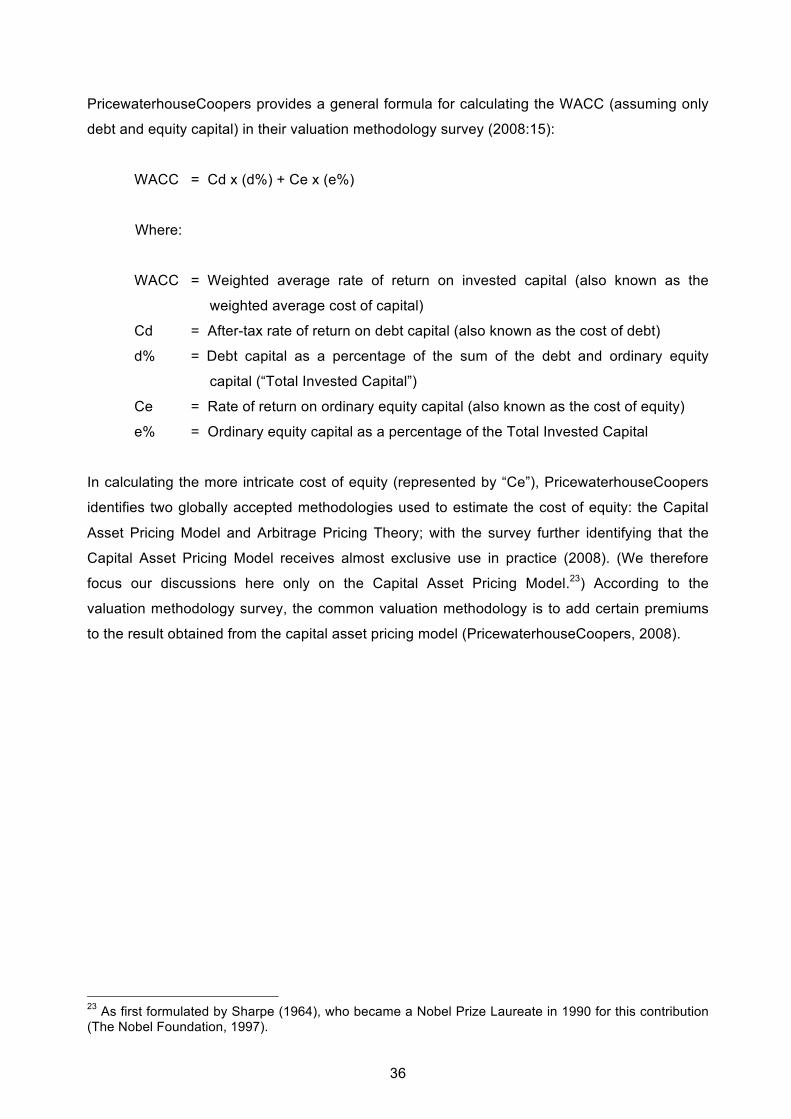
36
PricewaterhouseCoopers provides a general formula for calculating the WACC (assuming only
debt and equity capital) in their valuation methodology survey (2008:15):
WACC = Cd x (d%) + Ce x (e%)
Where:
WACC = Weighted average rate of return on invested capital (also known as the
weighted average cost of capital)
Cd = After-tax rate of return on debt capital (also known as the cost of debt)
d% = Debt capital as a percentage of the sum of the debt and ordinary equity
capital (“Total Invested Capital”)
Ce = Rate of return on ordinary equity capital (also known as the cost of equity)
e% = Ordinary equity capital as a percentage of the Total Invested Capital
In calculating the more intricate cost of equity (represented by “Ce”), PricewaterhouseCoopers
identifies two globally accepted methodologies used to estimate the cost of equity: the Capital
Asset Pricing Model and Arbitrage Pricing Theory; with the survey further identifying that the
Capital Asset Pricing Model receives almost exclusive use in practice (2008). (We therefore
focus our discussions here only on the Capital Asset Pricing Model.23) According to the
valuation methodology survey, the common valuation methodology is to add certain premiums
to the result obtained from the capital asset pricing model (PricewaterhouseCoopers, 2008).
23 As first formulated by Sharpe (1964), who became a Nobel Prize Laureate in 1990 for this contribution (The Nobel Foundation, 1997).

37
In a South African context, it could be summarised as follows (PricewaterhouseCoopers,
2008:21-38):24
Ce = Rf + β x E(Rp) + Ssp + Srp
Where:
Ce = Rate of return on ordinary equity capital (also known as the cost of equity)
Rf = The risk-free rate (in South Africa in 2007 the majority of participating
appraisers used the pre-tax marked-to-market rate on the South African
domestic government R157 bond25)
β = Beta-coefficient – indicator of systematic risk (in South Africa in 2007 the
majority of participating appraisers used the historical Beta of the entity being
valued relative to the JSE Securities Exchange All Share Index (ALSI); if the
entity is not listed then the historical re-levered Beta of a benchmark entity
relative to the ALSI26)
E(Rp) = Expected market risk premium (in South Africa in 2007 the majority of
participating appraisers used a percentage between 5% and 6%27)
Ssp = Small-stock premium (in South Africa in 2007 the majority of participating
appraisers added an average percentage of between 0.4% and 5.2%, as
detailed directly below)
Srp = Specific risk premium for unique risks not modelled in the forecasted cash
flows (in South Africa in 2007 the majority of participating appraisers
sometimes added a percentage here; if added, an average of between 1.9%
and 6.4%)28
24 Elements per the original Capital Asset Pricing Model are indicated in plain text, and adjustments and practices according to valuation methodology, in italics. 25 As the R157 bond fully matures on 15 September 2016, it is probable that appraisers will in 2010 make use of another domestic government bond with a longer term to maturity as detailed by the National Treasury (South African National Treasury, 2010), such as the R207 (maturity date 15 Jan 2020), or the R208 (maturity date 31 March 2021). According to McKinsey & Company (2005), for a valuation of an entity in the United States, the most common proxy for the risk-free rate is a 10-year default-free United States government bond, rather than a bond with a longer date to maturity (even if this represents a superior match to the cash flow stream) as their illiquidity could result in yield premiums and stale prices. 26 Here the majority of appraisers entrusted this calculation to a service provider and assumed this provider to make the necessary Bayesian and illiquidity adjustments. (An adjustment to the ALSI for its resources bias is also considered necessary.) 27 Refer to global investment returns yearbooks as published by numerous banks, including ABN-AMRO and Credit Suisse, for international historical risk premiums. Here, premiums are normally listed for several countries and normally include an average for the world. 28 For matters such as: dependence on key management, a single key customer or supplier, lack of track record, significant growth expectations and legal risk.

38
Small business entities have additional risk characteristics that are not fully captured by
the standard estimates of the Beta coefficient. The small-stock premium (“Ssp”) is
directly linked to the value of the entity’s equity, as follows:
• For equity values up to ZAR250 million: 5.2% premium;
• For equity values between ZAR251 million and ZAR500 million: 4% premium;
• For equity values between ZAR501 million and ZAR1 000 million: 2.7% premium;
• For equity values between ZAR1 001 million and ZAR1 500 million: 1.7% premium;
• For equity values between ZAR1 501 million and ZAR2 000 million: 1.3% premium;
and
• For equity values above ZAR2 001 million: 0.4% premium.
The cost of debt (“Cd”) is often linked to a credit rating. Commercial, investment and other
banks normally determine credit ratings before issuing debt finance. Professional rating
agencies also exist that issue credit ratings for the debt of public and private corporations,
including Standard and Poor’s, Moody’s and Fitch Ratings. Despite the severe criticism
bestowed on these agencies in the wake of the recent international financial crisis, they
continue to provide credit rating services, albeit with certain changes to their criteria.
Credit rating opinions, e.g. those of Standard & Poor’s, range from “AAA” (highest investment
grade), to “BB+” (highest speculative grade), through to a “D”-rating in case an entity defaulted
on its commitments (2010a). Here a description of the meanings is provided in Table 2-4. Credit
ratings provided by the rating agencies for an entity can differ, but are normally identical, or very
close, due to the application of similar evaluation processes (McKinsey & Company, 2005). In
these processes the rating agencies consider both business and financial risk in determining a
credit rating (Standard & Poor’s, 2010b). When considering business risk the factors analysed
include: industry characteristics, competitive position and management (Standard & Poor’s,
2010b). Next, when considering financial risk, the factors analysed include: financial
characteristics, financial policy, profitability, capital structure, cash flow protection (including
cash flow ratios) and financial flexibility (Standard & Poor’s, 2010b).
A credit rating will not give a direct indication of the cost of debt, but the yield on debt (or bond)
with a certain credit rating often demonstrates a certain premium (or spread) to that of a risk-
free debt bond. Table 2-5 presents the yield-spread over U.S. Treasuries for different credit
ratings and times to maturity, in March 2006 (Thomson Reuters, 2006). (We do not provide a
more recent representation as U.S. corporate bond spreads in recent times approached their
widest on record due to the international financial crisis, making later figures less
representative.) Notice that 100 basis points are equal to 1 percent in Table 2-5 and that e.g. in

39
March 2006 the 10-year yield to maturity for an “AA”-rated corporate bond was 80 basis points
(0.8 percent) higher than the risk-free rate of 4.59 percent, thus equalling 5.39 percent.
Table 2-4 Meaning of credit rating opinions (Standard & Poor’s, 2010a)
The general meaning of credit rating opinions is summarised below:
AAA Extremely strong capacity to meet financial commitments. Highest Rating.
AA Very strong capacity to meet financial commitments.
A Strong capacity to meet financial commitments, but somewhat susceptible to adverse
economic conditions and changes in circumstances.
BBB Adequate capacity to meet financial commitments, but more subject to adverse economic
conditions.
BBB- Considered lowest investment grade by market participants.
BB+ Considered highest speculative grade by market participants.
BB Less vulnerable in the near term but faces major ongoing uncertainties to adverse
business, financial and economic conditions.
B
More vulnerable to adverse business, financial and economic conditions but currently has
the capacity to meet financial commitments.
CCC
Currently vulnerable and dependent on favourable business, financial and economic
conditions to meet financial commitments.
CC Currently highly vulnerable.
C Currently highly vulnerable obligations and other defined circumstances.
D Payment default on financial commitments.
Additional “+” or “-“ ratings are sometimes indicated for finer classification.
Finally, the interest tax shield is incorporated in the cost of debt using the following formula
recommended by McKinsey & Company (2005:328):
After-tax cost of debt (“Cd”) = Before-tax cost of debt x (1 – Tm)
Where: Tm represents a figure between the marginal tax rate and 5 percent below the
marginal tax rate (to account for the effect of tax-losses et al.).

40
Table 2-5 Yield spread over U.S. Treasuries by Bond rating, March 2006
(Thomson Reuters, 2006)
2.10 Synergy valuation within the context of best practices to be applied in the
overall transaction process
In determining the best practice to follow in the synergy valuation process, below we consider
two aspects of the M&A transaction process that could determine if shareholder value is
increased based on the transaction, thereby directly affecting the value of synergy. These two
aspects are:
• The timing of the M&A transaction process; and
• Specific best practices followed in the M&A transaction process.
Timing of the M&A transaction process
In their survey on world-class transactions creating shareholder value, KPMG (2001:6)
developed a model of best practice within the M&A transaction process (see Figure 2-4).

41
Figure 2-4 Model of best practice in creating shareholder value within the
M&A transaction process (KPMG, 2001)
Within this model of best practice, the importance of the timing of activities between target
identification and deal implementation was examined. KPMG found that companies that added
shareholder value undertook all of the following activities earlier than those that failed to create
value:
1. Appointment of a process manager;
2. Risk identification and assessment;
3. Valuation;
4. Synergy identification and valuation;
5. Due diligence;
6. Formal review of risks and issues, and approval; and
7. Planning the post-acquisition implementation
Specific best practices to be followed in the M&A transaction process
KPMG’s survey (2001) further indicated the following seven key best practices in the M&A
transaction process that have been illustrated to have a significant bearing on the outcome of
the transaction:
1. Early action – process management and other key activities tackled at an early stage in the
transaction;
2. Main-board leadership – a main board member should be responsible for M&A policy and
activity, resulting in leadership and buy-in to achieve transaction goals;

42
3. Pre-bid value assessment – rigorous assessment of the target company and the deal,
including understanding the drivers of value and the price range, which will enable the
purchaser to create value;
4. A formal transaction process plan – a formal transaction process plan setting out clear roles
and responsibilities, prepared before the detailed investigation into the target. This is to be
formally reviewed and approved, addressing any variations to the original assumptions
arising during the process;
5. Process manager involved throughout – appointment of a dedicated process manager with
appropriate skills, involved from an early stage;
6. Process manager empowered with a wide-ranging role – process manager with
responsibility for key activities, including risk and issue management, deal assessment,
negotiations and implementation; and
7. Independent assessment of post deal implementation – the use of external advisers to
provide independent evaluation of the implementation process and measurement after
completion.
The survey found that individual practices do not significantly add to the likelihood of increasing
shareholder value. Instead, it found that there is a direct correlation between the number of
these practices followed and a higher probability of increased shareholder value. The specific
findings are:
• 1 to 4 best practices followed: 18% of these companies added shareholder value;
• 5 to 6 best practices followed: 36% of these companies added shareholder value;
• 7 best practices followed: 67% of these companies added shareholder value.
Kode, Ford & Sutherland, in their critical review of the literature of 20 authors on the topic of
synergy evaluation, found that certain techniques increase the chances of “paper synergies”29
leading to “productive synergies”,30 thereby creating actual value and justifying the calculated
“paper synergy” paid for (2003:36). These techniques could be described as best practices in
the M&A transaction process and could have a significant bearing on the outcome of the
transaction. These best practices should occur in a certain chronological order and when
classified accordingly, they are (Kode et al., 2003):
1. Acquire and retain superior merger management and executive leadership.
2. Learn from past mistakes and communicate effectively.
3. Focus on shareholder value creation and don’t do the deal if the numbers don’t add up.
29 Implying, synergies calculated before the deal is concluded and paid for in the purchase price. 30 Implying, the actual realisation of the synergy.

43
4. Perform a comprehensive due diligence in advance.
5. Relate the proposed purchase premium to the expected synergies.
6. Formulate and implement a post-merger integration plan.
7. Perform advanced planning and provide for substantial management of the integration
process.
8. Apply a broad base of ordinary management principles.
9. Establish efficient rewards and incentives.
Results
As described, a best practice is supposed to achieve superior performance. In the context of a
practice used to quantify synergy value ex ante – superior performance implies that these
practices should lead to a better conformation with actual results, i.e. achieving the quantified
synergy value ex post.31 The underlying limitation of the results described here, is the limited
amount of available literature describing synergy valuation-process best practices. Within this
caveat, we could reach the following conclusion: as both the timing of the M&A transaction
process and the number of specific best practices followed in the M&A transaction process were
demonstrated to influence the actual results, we argue that the presence of these factors should
be considered in quantifying the synergy value ex ante. The latter will probably be incorporated
indirectly, by affecting an appraiser’s level of confidence in quantifying the cost and revenue
synergies, which are described in more detail infra, at section 5.5.
2.11 Quantifying synergy value: key elements
Evans and Bishop, in their book exploring ways to build value in companies through M&As
(2001), described three key variables that drive synergy value. With a more substantial
discussion to follow, these variables are: first, the size of the synergy benefit; second, the timing
of the benefits; and, third, the likelihood that it will be achieved. Closely related is the value of an
option, which is also discussed infra, under the heading “real-options approach”.
2.11.1 Size of the synergy benefits
Evans and Bishop (2001) recommend that the size of the benefits should be quantified using a
discounted cash flow framework, employing a conservative attitude by incorporating a rigorous
questioning of the benefits. Evans and Bishop (2001) further recommend that a discounted cash
flow model should include forecast estimates of income, expenditure, financing and tax cost, as 31 Ex post, from the Latin ex “from” and post “after” (New Oxford American Dictionary, 2005: no page number), implying here that it is based on actual results rather than forecasts.

44
well as cash investments in working capital and non-current assets. Notice that modern
valuation theory based on discounted cash flow, as described by the key scholars Miller and
Modigliani (1958, 1961), and Jensen (1986, 1988), prescribes that financing cost be excluded
from the projected cash flows, as the net resultant cash flows should represent those cash flows
that are free for distribution to all providers of capital (whether debt or equity providers), hence
the term “free cash flows”. In the projection we should include the relevant cash outflow relating
to the cost of realisation and integration, if it is directly associated with the specific synergy
being quantified. However, if these are not directly associated, the present cost of the total
realisation and integration cost should be quantified separately and included in the overall
valuation of synergies.
2.11.2 Timing of the synergy benefits
The timing of benefits will be associated with the period in which the various projected cash
flows are included. Evans and Bishop (2001) once again advocate the application of a
conservative attitude and they further stress the importance of meeting the (ex ante) projected
timetable in order to achieve the (ex post) synergy value. Observation by McKinsey & Company
(2005) indicates that synergies not realised within the first full budget year, following the merger,
are often not realised at all.
2.11.3 Likelihood of success
The likelihood of success should be incorporated in the projected cash flows or in the discount
rate, but not in both, as this will duplicate the effect. Evans and Bishop propose that it be
incorporated in the projected cash flows by calculating the probability of different outcomes such
as “optimistic”, “expected” and “pessimistic”, or by performing a Monte Carlo simulation
(2001:80-81). Another method that considers the likelihood of success in the context of
business decisions is the real-options approach. Next, we discuss a Monte Carlo simulation.
Monte Carlo simulation
Monte Carlo simulation was developed out of the need to solve complex problems incorporating
a fair degree of uncertainty. Nuclear physicists, in recognising the limitation of conventional
calculus in dealing with multitude sources of uncertainty, were the first to use Monte Carlo
methods to provide answers to their intricate research questions. A Monte Carlo simulation

45
normally utilises a computer32 to generate a large number of scenarios given probabilities for
inputs. For each of the uncertainties (formulated as a variable) a random number is generated
that, in turn, is input into a formula to generate an outcome for a single scenario. This is then
repeated for a large number of scenarios. Hubbard, an author in applied information economics,
provided an introduction to the Monte Carlo simulation (2007) and credits Ulam as the person
who denominated the technique. According to Hubbard, Ulam was a mathematician working on
the Manhattan Project during the Second World War and, although not the first person to use
such a simulation, was the one to name it after this infamous gambling destination in Monaco, in
honour of his uncle – a gambler. The playfulness of its name notwithstanding, Monte Carlo
simulation has a proven track record, with main benefits in the areas of measuring the impact of
risk and the probability of an outcome.
Apart from Evans and Bishop (2001), other scholars have not made the link between a Monte
Carlo simulation and the process of quantifying synergy value. Such simulations have, however,
been used successfully in the field of finance, according to Hertz (1964), who described their
use in the making of capital investment decisions. Hertz emphasises that only limited
improvements have been made in making capital investment decisions through techniques such
as three-level estimates, selected probabilities and game-theory (1964), as these merely
incorporate uncertainty to a limited extent. In his 1964 publication, Hertz further describes a
Monte Carlo simulation as a preferred method used to make a capital investment decision that
is subject to various uncertainties, as it addresses all variables (or at least the variables chosen
for review). There are many similarities between the uncertainties faced in making a capital
investment decision and quantifying certain types of synergy value. For instance, the value of
cost synergies resulting from economies of scale in production could be subject to the same
uncertainties as a capital investment decision, such as market size, share of the market, selling
prices, investment required, operating costs and the useful life of facilities. It could further be
argued that Monte Carlo simulations have not been used extensively in quantifying synergy
value, due to the added complexity. These arguments therefore support the use of a Monte
Carlo simulation in quantifying synergy value. Due to its mentioned intricacy, the use of this
simulation should probably be reserved for only those synergy calculations incorporating many
sources of uncertainty. Next, we describe the simulation technique in more detail.
According to Hubbard (2007), the process of performing a Monte Carlo simulation is, firstly, to
quantify each uncertainty with a specific confidence interval. He specifies that it could be
performed with the help of sophisticated statistical inference tools, or with the use of calibrated
32 These simulations are presently often performed using a spreadsheet, although various dedicated software tools have been developed.

46
estimates made by experienced individuals (this, in turn, could be improved with the help of
calibration training – refer to Table 2-6 for specific methods to improve calibrated estimates).
Hertz (1964) was a proponent of calibrated estimates as part of the simulation performed in
capital investment. The second step per Hubbard (2007) is to determine the appropriate shape
of the outcome distribution. Of the many types of distribution, he describes the uniform
distribution and provides guidelines for how to calculate it using a spreadsheet (refer to Figure
2-5). A uniform distribution is also the recommended distribution used by Hertz (1964) as part of
the simulation performed in capital investment. The third step specified by Hubbard (2007) is to
calculate the result using a random factor for each of the variables. Finally, Hubbard (2007)
specifies the calculation of several scenarios (many thousands), performed by merely repeating
step three and then plotting the results in a histogram.
A Monte Carlo simulation is able to provide an expected value of a synergy benefit over the
calculated range of possible outcomes, but more beneficially, will provide insight into the risks
involved and the probability of success.
Figure 2-5 Probability distributions (Hubbard, 2007)
The normal distribution A normal distribution:
Characteristics:
• Values near the middle (mean) are more likely than values farther away; • The distribution is symmetrical, not lopsided – the mean is halfway between the upper or lower
bounds of e.g. a 90% confidence interval (“CI”); and • The ends trail off indefinitely to ever more unlikely values; a value far outside e.g. a 90% CI is
possible but unlikely.
How to make a random distribution with this shape in Excel® with 90% CI estimates: =norminv(rand(),A,B) A = mean = (90% CI upper bound + 90% CI lower bound)/2; and B = standard deviation = (90% CI upper bound - 90% CI lower bound)/3.29

47
Table 2-6 Methods to improve calibrated estimates of probability (Hubbard, 2007)
1. Repetition and reflection. Specific calibration test to be repeated in succession with feedback.
2. Equivalent bets. For every estimate set up an equivalent-bet to test if you are impartial to both.
3. Consider pro and contra arguments. Consider at least two reasons why you should be optimistic in
your estimate and two reasons why you should be pessimistic.
4. Do not anchor your estimate. Do not decide on a value and adjust upwards and downwards for an
estimated range.
2.11.4 Real-options approach
An option provides the right but not the obligation to buy or sell an asset and could have a value
of its own (Van Putten and MacMillan, 2004). The valuation of financial options proved difficult,
before the advances brought by the economists Fischer Black, Robert Merton and Myron
Scholes (The Nobel Foundation, 1997). In 1973, Black and Scholes published a formula
intended to put a price on financial options and corporate liabilities (Black and Scholes, 1973).
This became known as the Black-Scholes formula and became widely used throughout the
world to price derivatives (The Nobel Foundation, 1997). Merton devised an alternative method
to derive the formula that resulted in greater application possibilities (The Nobel Foundation,
1997). In 1997 the then-living contributors, Merton and Scholes, became Nobel Prize
laureates33 for their work in this field (The Nobel Foundation, 1997).
A real-options approach is based on these ideas but is applied to complex business decisions,
instead of well-defined financial options (Van Putten and MacMillan, 2004). In this lies the basis
of its criticism. Here, authors Hubbard (2007), and Van Putten and MacMillan (2004) describe
that the real-options approach is often abused in executing business decisions, specifically
where it is inconsistently applied when the variables of the Black-Scholes formula cannot be
literally translated to a specific business decision. In contrast, the Black-Scholes formula was
demonstrated to be general enough to be applied to a wide range of business decisions where
flexibility is a key factor, including the flexibility of physical capital investment (The Nobel
Foundation, 1997) and the pricing of technology options (Boer, 1999). The important
qualification to its use here is that it should only be applied to projects that can be abandoned
before significant financial investment is required (Van Putten and MacMillan, 2004).
The argument could be made that, in many cases, an acquisition is made in order to obtain
synergy. A real-options approach should therefore prove less valuable in the context of
33 From 1974, the Statutes of The Nobel Foundation have stipulated that the Nobel Prize cannot be awarded posthumously (The Nobel Foundation, no date).

48
quantifying the value of most types of M&A synergy under these circumstances, as a significant
financial investment is then made in advance – not only the amount included in the purchase
price for synergy, but the full acquisition price. In the context of the valuation of technology,
however, the acquisition price for a technology (or the company owning the technology) could
represent a small proportion of the total cost to commercialise the technology. (Capital
investment, marketing and other expenditure to enable the commercialisation of the technology
could prove to be the dominant component and would only be expended later, should the
technology show promise.) Throughout history there are numerous examples of how technology
created extensive wealth (Boer, 1999). Discounted cash flow models often downplay technology
value, due to the high inherent risk attached to technology and by ignoring the value of the
opportunities created (Boer, 1999). We therefore have to consider the value of technology
options and the techniques that could be used to quantify it – specifically the real-options
approach. We will further demonstrate the link between M&A synergy value and technology
infra, at section 5.2.1.6. Further notice that the real-options approach could also be used in
quantifying the value of synergy extracted through means other than M&As, such as joint
ventures and contracts (but this falls outside the scope of this dissertation).
The nature of options
In their groundbreaking paper, authors Black and Scholes (1973) also provided a basic
introduction to the value of an option. Here they discuss the basic concepts, using Figure 2-6 as
a guide (Black and Scholes, 1973: 637-639):
• An option supplies the right to buy or sell an asset (or stock), as mentioned.
• The “exercise price” is the price that is paid for a stock when the option is exercised.
• The “expiration date” is the final day on which the option can be exercised.
• Line A in Figure 2-6 represents the maximum value of an option (even when the current
value of the exercise price is close to zero due to the effects of the time-value of money, the
value of the option cannot exceed the value of the stock).
• Line B in Figure 2-6 represents the minimum value of the option (its value cannot be negative
and cannot be worth less than the stock price minus the exercise price).
• Lines T1 to T3 in Figure 2-6 represent the value of an option at different times – T1 has a long
time to maturity, T2 an intermediate time and T3 a very short time to maturity.
• The value of an option would be approximately equal to the price of a share “minus the price
of a pure discount bond that matures on the same date as the option, with a face value equal
to the…[exercise] price of the option” (the price of the bond reflecting the present value of the
exercise price discounted at a risk-free rate).

49
• When the stock price is far greater than the exercise price, the option is far more certain to
be exercised and its value will be high.
• When the price of a stock is far lower than the exercise price, the option is almost certain to
expire without being exercised, so the value of the option will be close to zero.
• With a long time to maturity, the price of the aforementioned bond (representing the current
value of the exercise price) will be very low and the option value will be close to the stock
price (e.g. as represented by line T1).
• With a short time to maturity, the value of the option will approximate the value of the stock
less the exercise price, but cannot be worth less than zero (e.g. as represented by line T3).
• The value of the option will be more volatile than the stock price.
Figure 2-6 The relation between the value of an option and stock price
(Black and Scholes, 1973)
Black-Scholes formula
The Black-Scholes formula captures the effects of the principal variables on the value of an
option. Boer (1999) provided a practical step-by-step guide for a calculation using the formula
defined by Black and Scholes in 1973 for a call option34 and this is summarised in Table 2-7.
34 A call option is the right to buy a share of common stock (Black and Scholes, 1973).

50
Based on the information in this table and as described by the Nobel Foundation (1997), the
value of the call option is positively correlated to the following:
• The current share (stock) price (“P”).
• The volatility of the share (as measured by its standard deviation “σ”).
• The level of the risk-free interest rate (“r”).
• The length of time to maturity (“t”).
• The probability that the option will be exercised (this probability, in turn, is gauged by the
standard normal distribution function “N”).
In contrast, the value of the call option is negatively correlated to the exercise price (“X” in Table
2-7).
When used to price financial options, the limitations of the Black-Scholes formula lie principally
in its assumptions of “ideal market conditions”, which include the following (Black and Scholes,
1973):
• The option can only be exercised at maturity (this is known as a “European option”35).
• The share price performs a random walk about its mean value and the distribution of values
around this mean value is represented by a normal distribution (a simplified description
provided by Boer, 1999).
• The share pays no dividends.
35 This in contrast to an “American option” that can be exercised at any time before the expiration date (Black and Scholes, 1973).

51
Table 2-7 Calculating the value of a call option using the Black-Sholes formula (Boer, 1999) Step 1: Calculate parameter Y, where: Y = P / PV(X)
Where: • P represents the current stock price; • X represents the exercise price • t represents the remaining time before the option has to be exercised • r represents the risk free rate (observed from a pure discount bond that matures on the same date as
the option) • PV(X) represents the present value of the exercise price, discounted at rate “r” over the period “t”
Step 2: Calculate parameter Z, where: Z = σ√t
Where: • σ represents the relative standard deviation of the stock – this has to be observed from market data
Step 3: Calculate parameter W, where:
W = N(D1) – N(D2)/y
D1 = ln (Y)/Z + 1/2Z
D2 = D1 - Z
Where: • N represents the standard cumulative distribution for a value with a specified mean and standard
deviation (this could be calculated using the function <NORMSDIST> in Excel®; syntax: <NORMDIST(x,mean,standard deviation,cumulative true)>.
• ln represents the natural logarithm Step 4: Calculate the value of the option = W x P
Adjusting the Black-Scholes formula to price technology options
The parallel of a call option, in a technology context, is an investment in technology that
facilitates market entry to an auspicious field, where the option is only exercised if the
technology is deemed to be competitive.
When applying the Black-Scholes formula in quantifying the value of technology options, the
direct inputs as specified in the formula would not be available. Instead, other inputs have to be
used as proxies. In this lies the limitation of this approach, for the proxies seldom represent
perfect substitutes. Regardless, companies such as Merck & Co., Inc. – one of the largest
pharmaceutical companies in the world – have obtained successful results using this approach
(Boer, 1999). Boer (1999) describes the proxies used by Merck & Co. in the formula described
in Table 2-7, as follows:
• For the exercise price (“X”) – the capital investment to be made at the maturity date of the
option. (This is subsequently discounted to a present value in parameter PV(X).)
• For the current stock price (“P”) – the present value of project cash flows.
• For the volatility of the share – the standard deviation (“σ”) of biotechnology shares (normally
estimated between 0.4 and 0.6).

52
• For the length of time to maturity (“t”) – the period in which the technology is be deemed to
be competitive.
In the next chapter we describe how the research presented here was designed and the
methodology that was employed.

53
3. RESEARCH DESIGN AND METHODOLOGY
3.1 Introduction
Research should be designed in such a way that the methodology followed provides an
effective method of answering the research questions. Research methodology, in turn, refers to
not only a system of methods applied in research, but also involves a higher sphere of thought,
including the reasons for the research and its philosophical underpinnings.
Here we explain the design of this research dissertation, and provide a description and
evaluation of the methodology employed.
3.2 Research design The research presented here was designed in order to answer certain research questions. This
was achieved by either following a methodology of formulating propositions and testing them
within and by the literature, or by critically reviewing the literature to identify the most probable
answer to the question posed. The research presented here is therefore necessarily qualitative
in nature.
Qualitative research is normally concerned with identifying concepts in the data and developing
a theory that incorporates them (Walker, 1985). The body of literature reviewed here provided
the qualitative data for the research.
3.3 Research methodology The methodology applied in this research dissertation is intended as an effective method of
answering the research questions. The system of methods applied here is the formulation of
propositions and testing them within and by the literature, or by critically reviewing the literature
to identify the most probable answer to the question posed.
This research dissertation is motivated firstly, by the importance of synergy in rationalising
M&As – specifically when considering the significant amounts involved in M&A activity (Forbes,
2006) and the high occurrence of M&A failures from a shareholder-value perspective (Sirower
and Sahni, 2006). Secondly, synergy is often not properly quantified ex ante (Sirower, 1997;
Devine, 2002). Lastly, this research dissertation was motivated by the lack of existing literature

54
offering a comprehensive and consolidated view on best practices to be used in quantifying
M&A synergy value.
This research is grounded in the tradition of neo-classical theory, with the concept of economic
rationality at its heart. It does, however, make use of more recent developments including the
tradition of practice-oriented research (i.e. what is being done in practice). This research builds
on the significant work in the development of finance, including the treatment of risk using the
portfolio theory developed by Markowitz (1952), capital structure analysis by Miller and
Modigliani (1958), and the Capital Asset Pricing Model by Sharpe (1964), Lintner (1965) and
Mossin (1966). As we intend to incorporate practice-oriented research, the literature necessarily
also includes literature published by global accounting firms and consulting firms offering M&A
transactional advisory services.
Research could be placed in context more easily if it is classified under a known type of
research. A methodology of testing propositions by means of a critical literature review could be
classified in terms of Hopper and Powell’s taxonomy of accounting research (1995), and Chua’s
classification of accounting research (1986), as follows:
• It forms part of critical accounting research to a major extent. This type of research implies
that theories are to be judged within their relevant context and that the study of historical
development provides understanding. Here reality is characterised by objective relations, but
is transformed through subjective interpretation. Human intention has to be critically analysed
in order to steer clear of false perceptions.
• It forms part of interpretative accounting research. This type of research implies that theory is
used to explain human intentions. It utilises subjective and sensible interpretations to analyse
the adequacy of knowledge.
• It is not typical of mainstream accounting research, which favours quantitative methods of
data collection.
A critical literature review is intended to build on the work that has gone before. In order to make
a contribution to the body of research, however, it is imperative that appropriate literature is
selected – representing a proper cross-section of highly credible and influential writings. It is
important that literature providing both pro and contra views of the subject be investigated. A
critical review of the literature also implies an analysis of the merits and faults of a work of
literature. As part of the literature review performed in this research dissertation, an attempt was
made to create a link across the disciplines as well. In this regard, we refer to publications in
financial accounting where these further our understanding of the synergy concept. We
furthermore attempt to create a cross-link between efficiencies considered in merger control

55
(with its effects on prices et al.) and synergies in M&As (with its effect on shareholder value).
We chose to focus mainly on European merger control due to the availability of high quality
literature.
It is important to note that this research dissertation is subject to certain weaknesses and
limitations. A weakness is that the body of research addressing the topic in general is vast, but
that the literature addressing the specific research questions, which provided the data for the
research, is limited. Furthermore, as with most qualitative research, the results presented here
are more susceptible to any possible predisposition or idiosyncrasies of the researcher. A
limitation of the approach followed here is that it was not tested empirically, but this also creates
an opportunity for further research.
The originality of the research performed here is ensured through a critical commentary on the
literature, and a proper interpretation and consolidation of the literature, which has not been
advanced before.
56
4. RESEARCH PROBLEM AND METHODS
In this chapter we describe the research problem considered in this dissertation and the
methods applied to explore the problem further.
4.1 Research problem
If capital were repeatedly invested in investments that destroy value, it would constitute a
significant problem. The studies that demonstrated that M&As could lead to a combined value
greater than the sum of their parts include those by Bradley, Desai & Kim (1988), and KPMG
(2001). These studies therefore support the notion that M&A synergy exists for some M&As.
However, these studies also show that many M&As actually destroy value. The reality of this
finding is given far greater weight if one considers the amounts involved. Forbes (2006)
described the year 2006 as a record year for M&As with global bids exceeding US$3.4 trillion –
up from the previous record set in the year 2000. A publication by The Economist estimated36
global bids announced in the year 2000 at US$3.5 trillion (Devine, 2002). Although the latter
figure does not directly support Forbes’ rating of the record year, they are nevertheless both in
excess of US$3.4 trillion – a significant amount. A study by Sirower and Sahni (2006) showed
that the average acquisition premium paid for targets in the United States, between 1995 and
2001, was nearly 36 percent – in some cases as high as 40.5 percent. They highlighted the fact
that most of the mergers for which these premiums were paid actually destroyed value. Capital,
it seems, is repeatedly invested in M&As that destroy value – constituting a significant problem.
Why then do M&As occur? According to Seth et al. (2000), motives underlying a merger include
hubris, managerialism and synergy. They explain that a hubris motive exists where managers’
excessive pride leads them to unconsciously overpay for a target company. Next, a
managerialism motive exists where managers purposefully overpay for a target company in
order to extend their own reach, even at the expense of the shareholders. The synergy motive,
however, is often the core driving-force of a merger (Devine, 2002). As a result, if synergy is not
accurately quantified, it could be a major contributing factor to the destruction of value (Sirower,
1997). The research problem considered in this dissertation is the high occurrence of M&A
failures from a shareholder-value perspective, and its link to the notion of synergy and the way
its value is quantified.
36 This estimation was based on a report entitled M&A Review, published by the research firm, Dealogic.

57
4.2 Methods
The following research questions and proposition are formulated in an attempt to explore the
research problem further:
Research question 1:
What are the various types of synergy that could exist in M&As?
Research question 2:
What are the origins of M&A synergy?
Research question 3:
Why does synergy exist for some M&As and not for others?
Research question 4:
What is the maximum amount that a specific bidder can offer for a target company in order not
to destroy value for its shareholders?
In order to answer this research question, we further formulate the following proposition, which
is to be tested within and by the literature.
Proposition A:
In order not to destroy shareholder value the following equation must hold true:
∑(MVt , P) ≤ ∑(IVt , SV)
Where:
MVt = Fair market value of the target entity on the offer date
P = Premium paid by the bidder
IVt = Intrinsic value of the target entity on the offer date
SV = The value on the offer date of synergies available in a merger or acquisition
between the target and bidder entities in question
Research question 5:
What are the best practices used to quantify the different types of synergy ex ante?
58
5. DISCUSSION OF RESEARCH QUESTIONS AND RESULTS
In this chapter we will discuss the results of the critical literature review in answering the
research questions. We organise the chapter around the key research questions as formulated
supra, in Chapter 4.
5.1 What are the various types of synergy that could exist in mergers and
acquisitions?
Synergy in M&As can in all likelihood be analysed more effectively and in greater detail, if the
broad concept of synergy is classified into its various types. As described (supra), the various
types of synergy as chronicled in the literature can lead to confusion. To address this, here we
attempt to answer the following research question:
Research question 1:
What are the various types of synergy that could exist in M&As?
Discussion and results
Several different classifications of synergy types appear throughout the literature. In 1965,
Ansoff used a well-known financial performance measure as a base when he classified synergy
in terms of the components of the return-on-investment formula37 (75–76):
• Sales synergy. This can result from increased sales such as tie-in sales offered by a
complete range of related products, or from reduced costs such as common distribution
channels, common marketing, common sales administration, or common warehousing.
• Operating synergy. This can result from reduced costs obtained through higher
utilisation of facilities and personnel, spreading of overheads and other economies of
scale.
• Investment synergy. This can result from a reduced investment required as a result of
the joint use of a plant, common manufacturing equipment and common research and
development.
37 Per Ansoff: ROI = (S – O) / I. ROI = return on investment; S1 = operating revenues from product1 during a period; O = operating costs from product1 during a period; I = average investment required to support the product1. Note that “I” refers to the investment made by shareholders and lenders. (S – O) should therefore reflect the incomes of both shareholders and lenders, often resulting in the use of the figure: profit before interest and tax.
59
• Management synergy. If management competencies could be used in the new
acquisition it could lead to the enhancement of overall return on investment.
Ansoff (1965) later presented a framework for the evaluation of synergy and therein he
identified the following simplified mapping of synergy:
• Sales synergy – synergy from increased revenue.
• Operating synergy – synergy from decreased operating costs.
• Investment synergy – synergy from decreased investment requirements.
Ansoff (1965) emphasised that all three types should be considered in terms of the time taken
to realise, as a reduction in the time to realise will increase their value. (It should be noted that
the time variable would be incorporated automatically if we employ a discounted cash flow
approach in quantifying the values.) Notably absent from his classification is the concept later
identified by several other scholars, namely financial synergy. Its absence is probably as a
result of the usage of the return on investment formula as a base, for it uses a before-interest
figure as the numerator in its formula.
In 1986, Chatterjee investigated the expected values from the different forms of synergy in his
paper. He recognised that existing literature classified synergy using wide-ranging descriptions.
Chatterjee therefore purposely tried to simplify the classification of synergy by using only the
following three broad categories (1986:119-121):
• Collusive synergy – the class of scarce resources leading to market power (price-
related);
• Operational synergy – the class of scarce resources leading to production and
administrative efficiencies (production-related); and
• Financial synergy – the class of scarce resources leading to reductions in the cost of
capital (cost of capital related).
Eccles et al. asked in their 1999 article if acquirers are paying too much for an acquisition and
described a few best practices applied by companies to ensure that they are not. In this paper,
Eccles et al. (1999) identified five types of synergies, which could be interpreted rather as a
description of the benefits of various synergies. Nonetheless, their classification of synergies is
(1999:141-143):
• Cost savings. This could occur if duplication can be eliminated or from purchasing in
volume. It is also known as “hard synergies”. They describe this as the most common
type of synergy;

60
• Revenue enhancements. This could occur if an acquirer and target combine different
strengths to achieve a higher level of sales growth together that either could on its own.
It is also known as “soft synergies”. They mention that this type is notoriously difficult to
quantify;
• Process improvements. This could occur if managers transfer best practices and core
competencies from one company to the other, resulting in cost savings and revenue
enhancements;
• Financial engineering. This could occur if the combined company achieves a lower
combined weighted average cost of capital, which is possible when the acquirer is able
to refinance the target’s debt at a more favourable rate, without affecting its credit rating.
Moreover, this could occur if the working capital finance requirements and surplus cash
of the two companies could be pooled, and if foreign currency positions could be netted;
• Tax benefits. This could come from tax engineering, which ensures that the combined
company’s overall tax rate is lower than the blended tax rates of the two companies
before the deal. Eccles et al. mentioned that this is very difficult to assess and that it
should be distinguished from tax structuring, the goal of which is to avoid as many direct
tax-related costs of the deal as possible. Tax structuring only minimises the cost of the
deal.
McKinsey & Company, in their guide to valuations (2005) provided practical guidance on
assessing possible synergies. In this guide they differentiate between only two types of synergy,
providing the broadest classification in the literature. (Sirower and Sahni in their 2006 article
utilised the same classification.) They identify:
• Cost synergies; and
• Revenue synergies.
Summary
In an attempt to summarise the various types of synergy that could exist in M&As, we found the
basic classification provided by McKinsey & Company (2005) to be the most logical starting-
point. We therefore utilised it as the main classification in our summary and in later discussions.
The next step was to create a cross-link between this main classification and the various
alternatives provided by the diverse scholars. The results of our efforts are presented in
Table 5-1.

61
Table 5-1 Summary of the types of synergy and the linkages between them
McKinsey & Company (2005) Cost
synergies Revenue synergies
Ansoff (1965)38 Sales synergy ✓ Operating synergy ✓ Investment synergy ✓39 Chatterjee (1986) Collusive synergy40 ✓ Operational synergy41 ✓ ✓ Financial synergy ✓ Eccles et al. (1999) Cost savings ✓ Revenue enhancements ✓ Process improvements ✓ ✓ Financial engineering ✓ Tax benefits ✓
5.2 What are the origins of synergy in mergers and acquisitions?
The origin is “the beginning of something’s existence” (New Oxford American Dictionary, 2005:
no page number). As described, synergy is a combined effect, but has some other cause. For
instance, operating synergy can result from reduced costs. Reduced costs, in turn, can result
from economies of scale, which in turn can be the result of some other cause. In order to
improve our understanding of synergy, we will have to analyse the various origins of its
existence. We therefore ask the logical question: what are the origins of M&A synergy?
(Research question 2.)
We previously highlighted that cost synergy can be the result of the effects of efficiencies
(Ansoff, 1965; Chatterjee, 1986; Gaughan, 2007), and that revenue synergy can be the result of
the effects of collusion and market power (Chatterjee, 1986).
The effects of market power have long been of interest to entities responsible for merger
control, due to its direct effect on prices and the cascading effect on the welfare of the protected
group. Furthermore, as mentioned before, merger control is also focussing more on efficiencies
as a defence against anti-competitive mergers. Due to these focus areas, the entities
38 Using Ansoff’s simplified mapping of synergies. 39 Here we argue that investment synergy should indirectly affect cost synergies if viewed from an income
and expense perspective, as reduced investment should decrease the depreciation expense. Alternatively, if viewed from a cash flow perspective, investment synergy could reduce capital expenditure requirements.
40 Chatterjee explained that collusive synergy could exist as a result of obtaining greater market power, but specifically stated that his intention here is to capture price-related synergies. Here we respected Chatterjee’s intention and therefore linked collusive synergy only to revenue synergies.
41 Could represent cost or revenue synergy, but mainly cost synergy from savings in operational costs.

62
responsible for merger control required answers to the same question asked in this section of
the dissertation. Notice however that merger control required answers for a different purpose.
This different purpose also possibly led to a different emphasis and to a different definition of
synergy. As discussed, in this dissertation we follow the definition of synergy as described by
Copeland and Weston in their 1983 publication, where they propose that synergy exists when
the net present value of the cash flow of the combination of two assets is greater than the sum
of the net present values of the cash flows of the assets independently. Because the net
present value of an asset on its own will already incorporate assumptions about future growth
and related cash flows when applying discounted cash flow models, we again emphasise the
qualification by Sirower (1997) – synergy should represent increases in cash flows beyond
those which were originally expected. In contrast, the definition of synergy per Farrel and
Shapiro is starting to receive greater application in European merger control (De la Mano,
2002). As a reminder, Farrel and Shapiro’s theorem focuses on the hard-to-trade assets that
are merger-specific (De la Mano, 2002). Here, efficiencies such as economies of scale are often
classified as “non-synergy efficiencies”, as it could often be argued that each firm could have
achieved these efficiencies unilaterally through its own expansion (De la Mano, 2002:45).
Notice that in cases where a merger could lead to a shortening in the timeframe to obtain
certain economies of scale, this will in fact qualify as a synergy per Farrel and Shapiro (De la
Mano, 2002). Due to the different emphases, in Appendix C we contrast European merger
control’s treatment of a claimed efficiency against its meeting the definition of synergy per
Copeland and Weston (1983). Where merger control treats an efficiency differently, we should
ask an important question: if the synergies are not unique and could be achieved by other
potential bidders as well, will these synergies not already be factored into the asking price for
the entity, with the result that no synergies will remain for the bidder? This question is
addressed when considering the maximum amount that a specific bidder could offer for a target
company (infra, at section 5.4).
In the immediately succeeding section we review the relevant literature, including publications
on merger control. As part of this review, we discuss a selection of the most common types of
efficiencies, including: economies of scale in production; economies of scale in areas other than
production; economies of scope; managerial efficiencies; economies of the capital market; and
economies in innovative activity. (Notice that even though we discuss each type under its own
heading, it is sometimes difficult to draw a clear distinction between the types due to overlap.
The purpose here is not to classify the types exactly, but instead to provide a structure for
discussion.)

63
In a larger sense, we strongly prescribe only the pursuit of synergy with origins that are ethically
responsible, legal and in compliance with the relevant regulations. Certain potential origins of
synergy could be privately profitable, but do not represent economic efficiencies as they merely
result in the redistribution of wealth between entities. These potential origins are discussed here
for the sake of completeness, as the laws and regulations of countries differ. They include:
savings in taxation, integration in order to circumvent government regulation, market power and
political power. Note that it is beyond the scope of this dissertation to consider the worldwide
legislative and ethical facets of these origins.
5.2.1 Efficiencies
5.2.1.1 Economies of scale in production
Camesasca, a scholar in law and economics, provided a comprehensive overview of literature
on the origins of merger efficiencies (2000). Here Camesasca defines economies of scale in an
economic sense: “economies of scale are reductions in average unit costs attributable to
increases in scale of output at the plant level”, or more generally, “[it exists] when the production
cost of a single product decreases with the number of units produced” (2000:136).
Ansoff (1965) linked this concept to cost accounting when he described that economies of scale
include a higher utilisation of facilities and personnel, and the spreading of overhead. According
to Gaughan (2007), economies of scale are especially relevant to capital-intensive
manufacturing firms, with the continued growth of large multi-national companies, such as
General Electric, cited as proof. M&As can generate economies of scale where an entity moves
from a low level of output to a higher level of output (and demand). However, as demonstrated
infra, in this section, economies of scale do not increase linearly with an increase in scale; there
is a level of scale where the economies are maximised, above which a firm starts to realise
diseconomies of scale. Camesasca (2000) emphasises that the value of economies of scale
that are achieved will depend on the slope of the average cost curve for outputs that are below
the optimum scale. The minimum efficient scale represents the minimum scale of a plant where
all economies of scale are fully utilised and if the scale is increased beyond this point, the long
run average cost curve will move upwards due to diseconomies of scale, or will remain flat
where returns to scale provide a more constant benefit. We describe returns to scale, infra in
this section. We furthermore describe the origins of economies of scale and diseconomies infra,
at section 5.2.1.2.

64
The minimum efficient scale can be determined from a graph depicting both long run and short
run cost-curves of an entity. McAuliffe (2010b) described this process for a hypothetical entity,
using a figure to illustrate (refer to Figure 5-1). As explained infra, in this section, for this
example the minimum efficient scale is represented by the lowest point on the long run average
cost per unit (LRAC42) curve, which is at an output of 1.5 million units, where the unit cost is
equal to PL. In Figure 5-1, the following curves are plotted in addition to the mentioned LRAC
curve: short run average cost per unit for a plant with a lower capacity (SRAC1), short run
average cost per unit for a plant with a higher capacity (SRAC2), short run marginal cost for the
plant with a lower capacity (SRMC1), short run marginal cost for the plant with a higher capacity
(SRMC2) and long run marginal cost (LRMC). (Here we will not explain the interaction of all
these curves as it is beyond the scope of this dissertation.)
Notice that long run refers to the length of time required so that all production inputs are variable
(i.e. there are no fixed costs). Long run will differ between entities, but will represent the
planning horizon whereby the entity will determine its capacity level. Here the LRAC curve will
represent the planning curve for an entity as it reflects the minimum average cost of production
using plants of varying capacities.
Figure 5-1 Long run and short run cost curves, and minimum efficient scale (McAuliffe, 2010b)
For the example in Figure 5-1, the plant with the higher capacity, producing at 1.5 million units,
will be operating at the minimum efficient scale, as at this point both the SRAC and LRAC
curves are at their minimum. (Here the LRMC curve also intersects the SRAC2 curve.). An entity
often does not operate at its optimum scale and for this example, the plant with the lower
42 Apologia: in order to ease readability, in this section we will refer to the informal acronyms: LRAC, SRAC1, SRAC2, SRMC1, SRMC2 and LRMC.

65
capacity will have the lowest average unit cost when producing 1 million units, but the average
cost (as represented by the SRAC1 curve) will still be higher as it is producing below the level of
the minimum efficient scale.
Economies of scale in production realised through a merger
Due to its nature, economies of scale in production will generally only be possible in a merger
between product-concentric or horizontally related entities.
When analysing economies of scale in production realised through a merger, we should
differentiate between benefits realised in the short term and those realised over a longer term.
According to De la Mano (2002), the most convincing case for short-term benefits is in the case
of declining markets where the market has over-capacity. Here a merger will allow the
combined entity to close one plant and operate the other at a level allowing for scale
economies. De la Mano (2002) adds that, in order to achieve short-term economies of scale, the
products will have to be similar so that they could be produced in a single plant. If not, it is
generally too costly to merge existing plants that are set up to produce different products.
Furthermore, De la Mano (2000) argues that long-term benefits are realised through the
coordination of the combined entity’s future capital investments, not through the merging of
existing facilities, for the aforementioned reason also applies here: it is generally too costly to
merge existing, separate plants. Thus, the combined entity could invest in new plant and
equipment that will facilitate production at closer to the minimum efficient scale, or by utilising
returns to scale. Returns to scale, in turn, are closely associated with the underlying production
technology. Generally, more efficient technology can be used at higher levels of output,
according to De la Mano (2002).
Short-term economies of scale could be illustrated with the same example from Figure 5-1.
Assume an entity operates a plant with its average costs represented by SRAC1. Should this
entity produce below a level of 1 million units due to current demand before an acquisition and
then expand through a horizontal acquisition of a competitor, the entity could realise short-term
economies of scale if the demand (and production) of similarities allowed the combined entity to
move closer to the level of 1 million units (where SRAC1 is at its minimum). Notice that in
practice many factors could be relevant, e.g. except for the fact that the plant will need to have
spare capacity, the products of the acquirer and acquiree have to be identical or perfect
substitutes; there might be significant costs involved should the plant have to be adjusted or
adapted; and a company often produces more than one product, which will complicate the
analysis.

66
Long-term economies of scale could also be illustrated with the same example from Figure 5-1.
Assume that an entity performs a horizontal acquisition of a competitor and that the combined
entity will then have a demand level close to a level of 1.5 million units. Further assume that the
existing separate plants’ capacities are far below the minimum efficient scale. The combined
entity can therefore invest in a new plant with a capacity close to the minimum efficient scale
(assume its average unit cost is represented by SRAC2). Should production at this level involve
high returns to scale due to a more efficient technology, the SRAC2 curve (and correspondingly
the LRAC curve) will not increase as steeply but will probably increase at a slower rate.
Economies of scale are therefore realised here due to the reduction in the average unit costs.
Result
Economies of scale in production, realised through a merger, could therefore result in a net
present value of cash flow from the combined entity, greater than the sum of the net present
values of the cash flows of the entities independently. Economies of scale in production realised
here could therefore meet Copeland and Weston’s definition of synergy (published in 1983). In
Appendix C we provide further clarity on the relation between this concept and synergy.
5.2.1.2 Economies of scale in areas other than production
It is possible for economies of scale to exist in areas other than production, such as in
management, distribution, marketing, and research and development. Here we can argue that
economies of scale will exist where the cost of these activities could be spread over a greater
level of output, thereby reducing the average total cost per unit of production (as opposed to
average production cost per unit).
Economies of scale in areas other than production could be realised in several ways, e.g.
through: creating a single brand in order to save on advertising expenditures; obtaining greater
advertising-media discounts;43 combining the sales forces or distribution networks; and making
better use of an unsaturated distribution channel (De la Mano, 2002). Another benefit could be
that a combined firm could avoid duplication in non-production expenses, such as office rent,
personnel services, accounting and auditing services. The remaining expenditure will then be
spread over the greater combined output, resulting in a lower average production cost per unit.
43 The benefits here will be limited where the target audience has a different culture and/or language (Camesasca, 2000).

67
Result
Economies of scale in areas other than production, realised through a merger, could therefore
result in a net present value of cash flow from the combined entity, greater than the sum of the
net present values of the cash flows of the entities independently. Economies of scale in areas
other than production, realised here, could therefore meet Copeland and Weston’s definition of
synergy (published in 1983). In Appendix C we provide further clarity on the relation between
this concept and synergy.
Origins of economies of scale achieved through a merger
As mentioned (supra), a general prerequisite for economies of scale to be achieved through a
merger, is that the entities should be related horizontally, or offer concentric products. A
sensible further prerequisite for the expected existence of economies of scale, according to
Ghemawat (1985), is an aggressive pursuit of market share where competitors are not expected
to make an equivalent investment in large, efficient facilities. If this condition is satisfied, next we
can compare the intended combined entity to each entity unilaterally. Here the following
conditions could, inter alia, serve as the origin of economies of scale where their benefits could
either be achieved over a shorter period of time due to the merger, or where the benefits could
not have been achieved unilaterally:
• High initial fixed costs, when spread over a larger output, will reduce the average unit costs
(in this context, Pratten refers to “indivisibilities”, 1988:9). Examples of such initial fixed costs
include the design and development costs of a new automobile; capital equipment and its
initial set-up cost; the first-copy cost of a book; and the cost of producing an advertisement
(Camesasca, 2000). Where there is the need for rapid expansion by a firm with high initial
fixed costs, a firm could decide on a merger instead of internal growth, which will again allow
the fixed costs to be spread over a larger output, thereby reducing the average unit cost.
Rapid expansion might be required in cases such as when there is an opportunity in the
market, but the firm is exposed to bottlenecks in production (Camesasca, 2000).
• An increase in dimension, with the benefit of operating costs increasing at a proportionately
lower rate. For many types of capital equipment the initial and operating costs increase at a
proportionately lower rate with increase in dimension (Camesasca, 2000).
• Economies of specialisation. With higher output a firm can afford to specialise, which could
lead to certain economies, such as purchasing a specialised piece of equipment with lower
operating costs (Camesasca, 2000).

68
• Economies of massed reserves accruing to a larger firm, e.g. when operating a line of
identical machines, fewer spare parts need to be kept due to the unlikelihood of all machines
experiencing the same failure at the same time (Camesasca, 2000).
• Superior methods of organising production, e.g. where a firm used to apply manual labour,
an increase in scale can allow mass production and automation leading to a lower average
cost per unit (Camesasca, 2000).
• The learning effect, whereby a firm learns to reduce production costs through actual
production experience (Camesasca, 2000). Notice that this could refer to either a learning
curve (dictating that the cumulative average labour time decreases by a certain percentage
as cumulative production doubles), or an experience curve (dictating that cumulative average
production cost decline by a certain percentage as cumulative output doubles).44 It could be
argued that these concepts are (to an extent) related to economies of scale, as increased
scale should allow an entity to achieve more rapidly, a doubling in output. An experience
curve is clearly a wider concept – one that considers more than just labour time. Here
Ghemawat (1985) highlights that for most industries, experience curves range between
70 percent and 90 percent, but warns that this is not always achieved. According to
Ghemawat (1985), circumstances leading to a greater probability of achieving an expected
experience curve include, inter alia: a young product (as cumulated output doubles swiftly at
this stage) and products with high price sensitivity (as a reduction in prices for such an
industry will drastically increase demand, which in turn, will hasten the doubling in cumulated
output). For a young product exposed to high technological risk, an entity could opt for a
higher risk (and potentially higher return) strategy by making large upfront investments and
attempting to make the technology dominant (Ghemawat, 1985).
Origins of diseconomies of scale obtained through a merger
The following conditions could, inter alia, serve as the origin of certain diseconomies of scale for
a merged entity:
• Diminishing returns. This empirical law was first formulated in the 18th century by R.J. Turgot
for agricultural production, where it was observed that applying additional labour to a fixed
surface area of land offered diminishing returns (Hutchison, 2010). This law was later
restated more precisely and became known by other names, including diminishing marginal
returns and the law of variable proportions. These essentially refer to the following
44 The following simplified example will serve to illustrate an experience curve: assume the actual cost of the first production batch of a product is $1000 and the actual cost of the second batch (double the cumulative production) is equal to $600. This implies a cumulative average cost of production equal to $800 per batch (the sum of $1000 plus $600, divided by two). This, in turn, implies an 80% experience curve ($1000 times 80 percent, equals $800).

69
phenomenon: adding one additional unit of an input, holding all other inputs constant
(including technology), will at some point cause the marginal product of that input to decline
(McAuliffe, 2010a).
• Greater scale could lead to factor limitations (Pratten, 1988). For instance, the limitation in
physical surface-area available to a factory on a site, or the limited supply of labour available
to an entity from the surrounding area (Camesasca, 2000).
• Greater scale could lead to a decline in the efficient use of a factor. For example, as the
capacity of a process is increased, technical forces could lead to stresses, resulting in a
reduction in efficiency (Camesasca, 2000).
• Larger organisations could lead to decreased performance by employees. For instance, a
larger firm could result in greater separation between management and employees, leading
to greater challenges in motivating staff; and a larger firm could lead to greater repetition in
tasks, leading to boredom (Camesasca, 2000).
• Greater scale could lead to a longer chain of management, which could make it difficult to
keep management incentivised (Camesasca, 2000).
• Greater scale could lead to increases in selling and distribution costs (Camesasca, 2000).
For example, a large-scale factory in China might have to incur greater transport cost to
serve all its markets.
5.2.1.3 Economies of scope
“Economies of scope imply that it is efficient to produce two or more products together; they do
not necessarily imply that these products should be produced in a single plant”, according to
Camesasca (2000:141).
Origins of economies of scope achieved through a merger
In cases where entities participate in different but complementary pursuits, economies of scope
could be generated where it is less expensive for a single entity to perform two activities, than
for two specialised firms to perform them individually (Camesasca, 2000). In such cases,
entities thus become vertically integrated as they might control (to various degrees) the raw
materials, the manufacturing and the retailers. Often a single entity produces all the products for
which economies of scope exist (Camesasca, 2000).
Here the following conditions could serve, inter alia, as the origin of economies of scope where
their benefits are achieved through a merger (Camesasca, 2000):

70
• Higher transaction costs when the activities are not performed by a single entity. Transaction
costs include the cost of closing an agreement and the cost of ensuring compliance.
Unrelated parties could participate in opportunistic behaviour, necessitating changes in the
contracts, which could further increase the transaction costs. Camesasca (2000) further
highlights circumstances where high transaction costs could be expected, motivating a firm
to perform activities within a single entity: first, where there is a very specialised product
(here the buyer will not have an alternative supplier in the short term and the seller will not
easily sell the product to another buyer and probably had to invest in specialised equipment
for its manufacture), which usually leads to it being performed by a single entity or to long-
term contracts; second, changing market conditions, which makes it more difficult to
incorporate all contingencies in a contract; and lastly, product and engineering development,
which are difficult to enforce through a contract.
• Sensitivity to externalities, where it is beneficial to control quality, e.g. for an international
hotel chain, where a negative experience by a patron at a single hotel could affect their
opinion of the rest of the chain as well.
• Sensitivity to the timing of supplies, e.g. when operating a just-in-time inventory system.
• Opportunities for non-competitive behaviour, such as an opportunity to obtain market power,
e.g. where a sole supplier of a vital input monopolises the final market, by vertically
integrating forward (this may be against merger-control regulations in most instances).
• High taxes or governmental price control could motivate a firm to vertically integrate in order
to avoid these (this may be against laws and regulations in certain instances).
Result
Economies of scope, realised through a merger, could therefore result in a net present value of
cash flow from the combined entity, greater than the sum of the net present values of the cash
flows of the entities independently. Economies of scope realised here could therefore meet
Copeland and Weston’s definition of synergy (published in 1983). In Appendix C we summarise
the link between this concept and synergy as defined for the purposes of this dissertation.
5.2.1.4 Managerial efficiencies
M&As could lead to the replacement of underperforming managers with more successful
managers, leading to improved efficiency (De la Mano, 2002). Replacing the management team
could furthermore lead to a reduction in an internal inefficiency, commonly known as “X-
inefficiency”, which could be the result of the existing management’s sub-optimal decisions
(Camesasca, 2000:144).

71
Notice that the management team may underperform due to a multitude of reasons and that
new management will not always improve this. In fact, a merger could exacerbate some causes
of inefficiency, such as further increasing organisational complexity (Camesasca, 2000).
Result
Managerial efficiencies, realised through a merger, could therefore result in a net present value
of cash flow from the combined entity, greater than the sum of the net present values of the
cash flows of the entities independently. (The literature stresses, however, that it is seldom
achieved.) Managerial efficiencies realised here could therefore in some cases meet Copeland
and Weston’s definition of synergy (published in 1983). In Appendix C we summarise the link
between this concept and synergy as defined for the purposes of this dissertation.
5.2.1.5 Economies of the capital market
According to Camesasca (2000), a merger could lead to increased corporate size, which, in
turn, could lead to economies when raising capital through common stock issue or borrowing.
De la Mano (2002) further describes that investors demand higher returns from small
corporations mainly due to a difference in perceived risk, which is mainly as a result of more
variation in earnings over time (and its resulting ability to spread its risks over time). In turn,
Camesasca (2000) describes that a greater variation in earnings will result in a lower survival
rate for small entities in the case of a price war, or the loss of a significant customer.
Directly linked to the size of an entity is the small-stock premium, which is incorporated into the
discount rate when applying a valuation model based on discounted cash flow. Small stock
premiums were described in a South African context supra, at section 2.9. Here it was
described that an average percentage of 5.2 percent, or less, is added to the cost of equity,
depending on the entity’s equity value (PricewaterhouseCoopers, 2008:33-35).
Result
Economies of the capital market, realised through a merger, could therefore result in a net
present value of cash flow from the combined entity, greater than the sum of the net present
values of the cash flows of the entities independently, principally due to a lower discount rate.
Economies of the capital market, realised here, could therefore meet Copeland and Weston’s

72
definition of synergy (published in 1983). In Appendix C we summarise the link between this
concept and synergy as defined for the purposes of this dissertation.
5.2.1.6 Economies in innovative activity
Innovative activity features “new methods”, it is “original” and often “advanced” (New Oxford
American Dictionary, 2005: no page number). Substantial cost savings can result from joining
innovative activity, including research and development activities (Camesasca, 2000). Closely
related is the concept of technology, which is defined as “the application of scientific knowledge
for practical purposes” (New Oxford American Dictionary, 2005: no page number). An insightful
paper on technology valuation by Schuh, Klapper & Haag, published in 2008, described the
increasing importance of technology. In the early 1980s, up to 75 percent of the market values
of most business entities comprised tangible assets, whereas this figure plummeted to nearly 25
percent in 2005 (Schuh et al., 2008). Intangible assets, including technology and other products
of innovative activity, fill the balance. In M&As, synergies from innovative activity could thus be
substantial, especially where competition is mainly in the field of innovation rather than price
(De la Mano, 2002). On the other hand, realising the benefits of innovative activity often proves
to be highly elusive (Camesasca, 2000).
The origins of economies in innovative activity achieved through a merger
Here the following conditions could serve, inter alia, as the origin of economies in innovative
activity, where their benefits are realised through a merger:
• Accessing external technology, whereby a research and development portfolio could be
diversified and technology options could be extended (Boer, 1999). In line with investment
theory, unique risks45 are normally not rewarded as they could be reduced through
diversification. A diversified portfolio could therefore maximise returns for a given level of
total risk. Technology options include the right but not the obligation to terminate a project,
the possibility of pairing technologies, the possibility to create a next-generation product and
the possibility to accelerate a project (Boer, 1999).
• Spreading research and development costs and risks more easily. Research and
development costs are often costly, and normally risky due to reasons such as: the unverified
nature of technologies, uncertain demand and the short life expectancy of high-technology
products. Following a merger, the combined firm could be larger, affording it the possibility of
more easily spreading the costs and risk, and obtaining the necessary financing
(Camesasca, 2000). 45 These are also known as non-systematic risks.

73
• Combining complementary assets. For instance, an entity may hold private information about
research and development opportunities (often from different industries or niches of an
industry) and when combined with another firm’s ability to execute the development,
economies could be achieved. Where research and development is subject to a high amount
of secrecy, a merger might be the only cost-effective way to transfer the complementary
assets (Camesasca, 2000).
• Elimination of redundant research and development. As a result, costs could be reduced and
the coordination of future research could increase productivity (Camesasca, 2000). However,
De la Mano (2002) warns that research that might appear to be redundant might hold the key
to an alternative path of discovery, which might be lost in the process.
• The free-riding problem in the innovation field, where inadequate protection of intellectual
property rights and reverse engineering could result in knowledge easily flowing to
competitors. A merger that includes most potential free-riders could prevent the free-riding
problem to a large extent and promote further innovative activity (Camesasca, 2000).
Result
Economies in innovative activity, realised through a merger, could therefore result in a net
present value of cash flow from the combined entity, greater than the sum of the net present
values of the cash flows of the entities independently. Economies in innovative activity, realised
here, could therefore meet Copeland and Weston’s definition of synergy (published in 1983). In
Appendix C we summarise the link between this concept and synergy as defined for the
purposes of this dissertation.
5.2.2 Other origins of synergy
The areas discussed in the immediately succeeding section do not increase economic efficiency
as they normally involve the redistribution of wealth. (As such they are not considered as an
efficiency rebuttal in European merger control.) In cases where shareholders of the merged
entity gain wealth,46 however, these could form the origin of synergy.
5.2.2.1 Savings in taxation
Savings in taxation as a result of a merger will depend on the tax legislation of the relevant
countries involved. Tax legislation often prevents the utilisation of these benefits, but they could
include: the utilisation (or faster utilisation) of taxation losses by offsetting the taxable income of 46 In cases where the net present value of the combined firm is above that of the firms independently.

74
one entity with the assessed loss of the other47, or a saving in tax by increasing the values of
the assets of the acquired firm without paying capital gains taxes (Camesasca, 2000).
Result
Even though savings in taxation do not represent an economic efficiency, if realised through a
merger, they could therefore still result in a net present value of cash flow from the combined
entity, greater than the sum of the net present values of the cash flows of the entities
independently. Savings in taxation realised here could therefore meet Copeland and Weston’s
definition of synergy (published in 1983). In Appendix C we summarise the link between this
concept and synergy as defined for the purposes of this dissertation.
5.2.2.2 Integration in order to circumvent government regulation
In cases where the profits of one division of an entity are subject to government regulation
(including price control), that entity will be motivated to integrate vertically or horizontally, as the
combined entity will, in such cases, not sell externally and therefore could possibly circumvent
the regulation (Camesasca, 2000). This possibility will depend on the relevant legislation and
regulations of the countries involved.
Result
Even though integration in order to circumvent government regulation does not represent an
economic efficiency, if realised through a merger it could therefore result in a net present value
of cash flow from the combined entity, greater than the sum of the net present values of the
cash flows of the entities independently. The benefits of integration in order to circumvent
government regulation, realised here, could therefore meet Copeland and Weston’s definition of
synergy (published in 1983). As mentioned, the legality as well as the ethical facets of this origin
of synergy should be considered in detail. In Appendix C we summarise the link between this
concept and synergy as defined for the purposes of this dissertation.
5.2.2.3 Market or political power
Market or political power is a contentious motivation for a merger for it may increase the wealth
of the merging entities, but will likely decrease the welfare of many others. According to De la
Mano (2002), market power is the ability to maintain prices above competitive levels for a 47 Notice that South African tax law, for example, limits the utilisation of assessed losses.

75
significant period of time. De la Mano (2002) further highlights that mergers could lead to
political power, through which they could influence legislation to their own benefit.
Throughout history, market power has led to several monopolies, syndicates and cartels, in
many markets including those of salt, coal and steel. In the twentieth century, however, anti-
trust legislation curtailed, to a large extent, those mergers motivated mainly by market power
(Camesasca, 2000). Regardless, certain cartels remain such as the Organization of the
Petroleum Exporting Countries (OPEC). Furthermore, certain companies such as Microsoft are
still repeatedly fined for their anti-competitive behaviour.
Camesasca (2000) describes that a vertical merger may increase monopoly profits, e.g. in a
case where a supplier of a key industry production input merges with another entity further
forward in the supply chain and then discriminates in its pricing of the input. Camesasca (2000)
further describes the following situations that are conducive to the pursuit of market power
through a horizontal merger:
• A fall in demand resulting in excess capacity with the risk of a reduction in prices;
• Increased risk of foreign competitors penetrating a local market; and
• New legislation outlawing existing bonds between firms.
In European merger control, a practical measure based on the available information is to infer
market power based on two sets of information: the market shares of the merging entities and
the overall market concentration (De la Mano, 2000). Mergers motivated by market power could
be classified as anti-competitive, especially where market share will exceed 25 percent (De la
Mano, 2002:28). Here, efficiencies (as described in the previous section) could serve as a
rebuttal against such an anti-competitive merger. If successful, the merger may still be allowed.
Result
Increased market power will normally result in synergy for the merged entity, as it should
increase prices, resulting in a net present value of cash flow from the combined entity, greater
than the sum of the net present values of the cash flows of the entities independently. In the
previous section we considered the circumstances where a merger could increase efficiencies
(even if anti-competitive or where it would lead to an increase in market power). Against this, De
la Mano (2000) describes that increased market power could also result in a decrease in certain
efficiencies, for example:
• Allocative efficiency is reduced when excessive prices lead to a transfer of wealth from
consumers to the holder of market power and a “dead-weight loss” from trade foregone (11-

76
12). As a merged entity moves closer to its maximum profit when there is an increase in
market power, the reduction in allocative efficiency should therefore not reduce synergy for
this entity.
• Productive efficiency is often reduced as incentives to lower cost decrease and X-
inefficiencies48 increase. This could decrease synergy for the merged entity.
• Innovation efficiency could be reduced when the merged entity’s incentive to innovate
decreases. This could occur, e.g. in technology-driven industries, where there is a “winner
takes all race” (13). Here, a merged entity with increased market power could have lower
incentive to innovate, as further innovation could help destroy the old, dominant industry and
help in the creation of a new one. On the other hand, a dominant position in a technology-
driven industry is likely to be temporary.
In Appendix C we summarise the link between this concept and synergy as defined for the
purposes of this dissertation.
5.3 Why does synergy exist for some mergers and acquisitions and not for others?
Here we attempt to answer the following research question:
Research question 3:
Why does synergy exist for some M&As and not for others?
As previously remarked, the answer to this question is important from a strategy point of view:
which target to choose? Or alternatively, from a valuation practice point of view: a target has
been identified – what is the expected value of synergy for this type of merger? In the literature,
the most recurrent line of reasoning is to analyse the effect of relatedness on value creation in
M&As, but a few alternative arguments also exist. Our discussion relates to all of these, but first
we discuss the effect of relatedness.
5.3.1 The effect of relatedness on value creation in M&As
There is vast literature on the effects of the type of M&A on economic value. The objective of
most of the literature is mainly to classify M&As into categories of relatedness, and then to
compare the average performance in order to determine which type added the greater
economic value. Most of these studies make use of an event-study methodology, in which the
48 Described supra, under the heading “managerial efficiencies” (section 5.2.1.4).

77
reaction in the capital market (at or around the merger announcement day) is empirically tested
and viewed as a proxy of value creation or destruction. This view of value is in line with financial
economists’ view of economic value. In contrast, studies directly investigating the effect of
relatedness on value creation defined as “intrinsic value” could not be identified. In the first
context, that of economic value, the literature supplied a range of conflicting findings: certain
papers found that related M&As created more value, but other papers found that relatedness
could not be demonstrated to be the cause of value creation.
In this context, papers that found a positive correlation between relatedness and value creation
included those by Singh and Montgomery (1987), and Shelton (1988). Singh and Montgomery
measured the risk-adjusted cumulative abnormal returns (CAR) on the stock of bidders and
targets, before and after an acquisition (1987). In this study, the data included 105 acquisitions
that occurred between 1975 and 1980, with a market capitalisation in excess of US$100 million.
Here, Singh and Montgomery find that acquisitions between entities that are related in terms of
market, product or technology, create more value than mergers not so related. Using a different
methodology, Shelton (1988) used multivariate regression analysis on a random sample of 218
mergers that occurred between 1962 and 1983, to study the effect of relatedness (in terms of
strategic fit) on value creation. Here, Shelton refers to strategic fit between a bidder and target
firm in terms of four categories developed by Salter and Weinhold (1979), which, in turn are
closely linked to Ansoff’s earlier Product-Market Growth Matrix (1957). The four categories of
strategic fit used by Shelton (1988) are: first, a related complementary fit (new products for
similar customers); second, an identical fit (similar products for similar customers); third, a
related supplementary fit (similar products for new customers); and lastly, an unrelated fit (new
products for new customers). In this study, Shelton finds that acquisitions that permit the bidder
firm access to new, but related markets, create the most value. In a 1986 paper, Chatterjee
specifically mentioned that horizontal mergers49 might create more value than unrelated
mergers (137) and that his study might have proved this, were this type of merger incorporated
into his study. Some authors erroneously include this paper amongst the grouping of papers
finding the opposite. Granted, Chatterjee (1986) found that unrelated targets significantly
outperformed related non-horizontal targets, in terms of cumulative abnormal stock returns. It is
important to notice, however, that Chatterjee designed his study in order to identify the link
between the type of synergy and its effect on economic value, not to identify the effect of
relatedness on value creation. As such, the methodology followed here specifically excluded
horizontal mergers from the grouping of related mergers.
49 As previously discussed, horizontal mergers involve related entities that operate in the same industry and produce substitute goods.

78
Meanwhile, other papers including those by Lubatkin (1987) and Seth (1990) demonstrated that
there are no observable correlations between relatedness and value creation. Lubatkin (1987)
investigated the cumulative abnormal returns of 439 acquiring firms and 340 acquired firms, for
large acquisitions that occurred between 1949 and 1979. Here, Lubatkin classifies relatedness
between merging firms on the following levels: product-concentric mergers, horizontal mergers,
market-concentric mergers, vertical mergers and conglomerate mergers. His findings show that
mergers lead to permanent gains in value for both acquiring and acquired firms’ shareholders,
but find that this gain in value cannot be correlated to relatedness (so defined) between the
entities. A further study by Seth (1990) investigated the cumulative abnormal returns of 104
tender offers between 1962 and 1979. Here, Seth considers entities to be related when they
“employ similar production techniques, serve similar markets and (sic) [or] use similar
distribution systems” (1990:100). His findings indicate, akin to those of Lubatkin (1987), that
value is created in both related and unrelated mergers, but that the data does not indicate that
related mergers (as defined) create more value than unrelated mergers, on average.
Many of these scholars put forth arguments as to why their study should give superior results,
e.g. for reasons of superior research design, more accurate definitions of “relatedness”, etc.
Regardless of this, inconsistent findings exist in the literature. For this same reason, relatedness
remains an area of heated debate amongst scholars.
The link between synergy and value creation
Here we will attempt to illustrate the link between the concept of synergy and that of value
creation.
First we will take the definition of synergy, as presented by Copeland and Weston (1983), as the
starting point. They proposed that synergy exists when the net present value of the cash flow of
the combination of two assets is greater than the sum of the net present values of the cash
flows of the assets independently. Next, considering modern valuation theory, based on the
concepts of discounted cash flow as described by Miller and Modigliani (1961), Jensen (1986,
1988) and others, value is increased as the net present value of cash flows is increased. This
holds true for value defined as “intrinsic value”, but due to the effects of market inefficiencies
and other imperfections, this should not always hold true for value defined as “market
capitalisation” or “fair market value”. From this we can deduce that an increase in synergy
should lead to an increase in intrinsic value, but not always an increase in market capitalisation
or fair market value.

79
The aforementioned studies, which studied the effect of relatedness on value creation in M&As,
indicated the effect of value creation on the share price. This, in turn, should have an effect on
market capitalisation. We demonstrated here that an increase in synergy will not always result
in an increase in this concept of value, so even had these studies shown a consistent result, this
result would not directly imply an increase in synergy.
Result
Due to the lack of literature and further due to conflicting findings in the available literature,
sufficient evidence could therefore not be gathered to prove that mergers between related
entities will lead to synergy.
Nevertheless, as persuasive theoretical arguments exist on the effects of relatedness on the
existence of certain synergies, next we will provide a review of the literature on the effects of
relatedness on the potential for certain types of synergies to exist.
Effects of relatedness on the potential for certain types of synergy to exist
Ansoff (1965) was the first to provide a link between expected synergy and the type of M&A.
Presented here in Table 5-2, Ansoff describes the potential for both synergy and negative
synergy, when a company diversifies through M&As with companies in the same or different
industries, based on the degree of relatedness in functional capabilities. This table provides a
matrix based on three different industries: defence space,50 producers and consumers.
Moreover, this table indicates relatedness between these industries in terms of the following
four functional capabilities: general management (indicated in the table as “GM”), research and
development (“R&D”), manufacturing (“Mfg”) and marketing (“Mkt”). To illustrate the use of this
table, we provide the following two examples: a company operating in the defence space
industry, diversifying through a merger with a company also operating in this industry, could
expect high levels of synergy in all four functional capabilities due to the high levels of expected
relatedness. In contrast, a company operating in a producer industry, diversifying through a
merger with a company in the consumer industry, could expect moderate levels of synergy in
general management (due to some relatedness in this functional area), but low levels of
synergy in research and development, manufacturing, and marketing (due to the low levels of
expected relatedness here).
50 Arguably, Ansoff specifically included the defence space industry here due to the prominence of this industry at the time of publication. (At this time, defence space industry spending was inflated due to the effects of the Cold War between the Soviet bloc countries and the US-led Western powers, and the contemporary US space program for landing astronauts on the moon.)
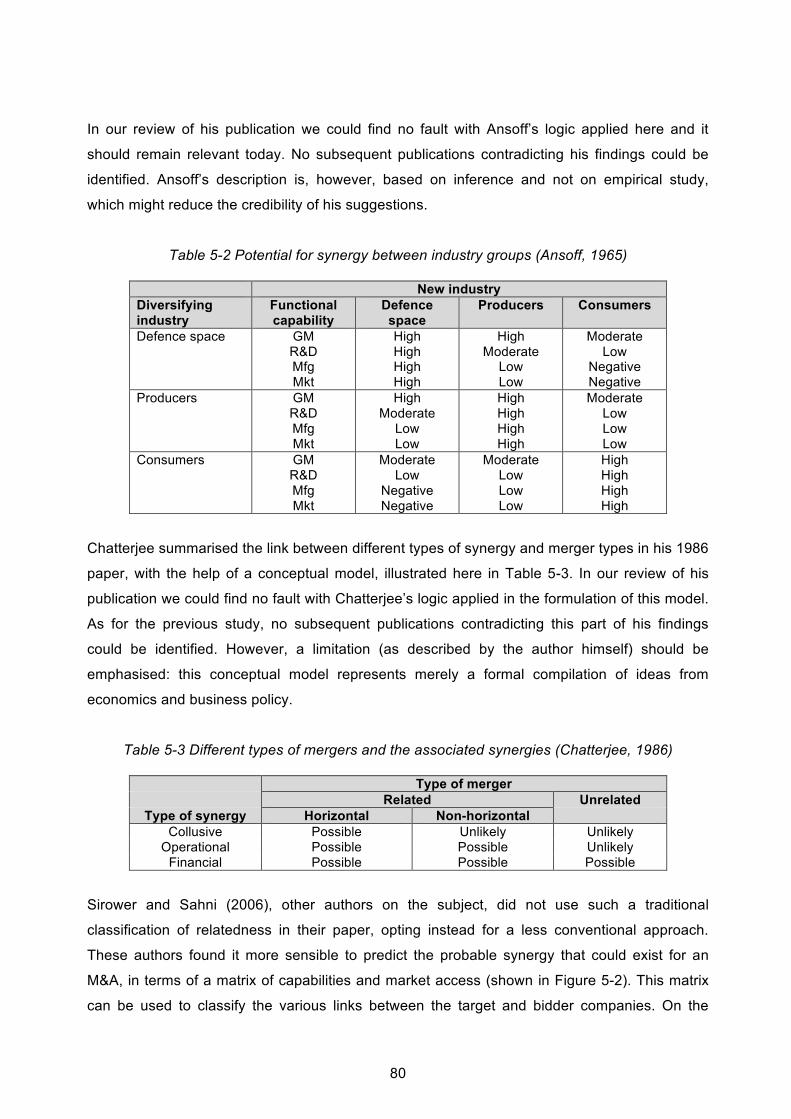
80
In our review of his publication we could find no fault with Ansoff’s logic applied here and it
should remain relevant today. No subsequent publications contradicting his findings could be
identified. Ansoff’s description is, however, based on inference and not on empirical study,
which might reduce the credibility of his suggestions.
Table 5-2 Potential for synergy between industry groups (Ansoff, 1965)
New industry Diversifying industry
Functional capability
Defence space
Producers Consumers
Defence space GM R&D Mfg Mkt
High High High High
High Moderate
Low Low
Moderate Low
Negative Negative
Producers GM R&D Mfg Mkt
High Moderate
Low Low
High High High High
Moderate Low Low Low
Consumers GM R&D Mfg Mkt
Moderate Low
Negative Negative
Moderate Low Low Low
High High High High
Chatterjee summarised the link between different types of synergy and merger types in his 1986
paper, with the help of a conceptual model, illustrated here in Table 5-3. In our review of his
publication we could find no fault with Chatterjee’s logic applied in the formulation of this model.
As for the previous study, no subsequent publications contradicting this part of his findings
could be identified. However, a limitation (as described by the author himself) should be
emphasised: this conceptual model represents merely a formal compilation of ideas from
economics and business policy.
Table 5-3 Different types of mergers and the associated synergies (Chatterjee, 1986)
Type of merger Related Unrelated
Type of synergy Horizontal Non-horizontal Collusive Possible Unlikely Unlikely
Operational Possible Possible Unlikely Financial Possible Possible Possible
Sirower and Sahni (2006), other authors on the subject, did not use such a traditional
classification of relatedness in their paper, opting instead for a less conventional approach.
These authors found it more sensible to predict the probable synergy that could exist for an
M&A, in terms of a matrix of capabilities and market access (shown in Figure 5-2). This matrix
can be used to classify the various links between the target and bidder companies. On the

81
horizontal axis we can find the capabilities of the companies and on the vertical axis we can find
the market access of the companies – in both cases classified as the same, one better than the
other, or new (this does not exist in the other company). The colour tone is an indication of the
expected source of synergy – a greater proportion of cost synergies (“%SynC”), or revenue
synergies (“%SynR”). The various zones in the matrix have a greater possibility to yield a
specific source or mix of synergy. For example, if both companies have the same capabilities
and market access, it could yield mainly cost synergies as a result of what is termed “efficiency”;
if the companies have some overlap, but one has either better capabilities or market access, it
could yield both cost and revenue synergies, due to “enhancement”; with companies with little
overlap, but where one has new capabilities or market access, it could yield mostly revenue
synergies through “expansion”; and in companies with no overlap, but where one has new
capabilities or market access, it could yield a limited amount of revenue synergies through what
is termed “expedition” (2006:91-92).
According to Sirower and Sahni (2006), most notable M&As will result in a combination of many
of the nine zones contained in the matrix. The authors highlight PepsiCo’s acquisition of Quaker
Oats in the year 2000 as a good example of a transaction that gave investors defendable
synergy forecasts: A total of US$230 million of probable synergies were identified along with the
exact sources, and they included: US$45 million from increased beverage revenues (same
capability, but with better market access); US$65 million from cost savings in selling, general,
administrative and manufacturing expenditure (efficiencies resulting from the same capability
and market access); and US$26 million from reducing duplicated corporate personnel
(efficiencies resulting from the same capability and market access).
Figure 5-2 Matrix of market access / capabilities and the associated expected synergy mix (Sirower and Sahni, 2006)

82
At odds with this example, Sirower and Sahni (2006) highlight America Online LLC’s acquisition
of Time Warner. This transaction created a conglomerate between very different partners: an
Internet company, and a media and entertainment company. At the bidder’s investor
presentation they projected US$1 billion in pre-tax cost synergies, without providing any more
details on the potential source. Sirower and Sahni point out that according to the matrix, this
acquisition will be classified as an “expedition” and does not justify the projection of large cost
synergies. It should be kept in mind, however, that Sirower and Sahni might have chosen these
examples with the benefit of hindsight in order to better emphasise the success of their
approach.
Result
Meaningful guidelines exist on the effect of relatedness on the potential for M&A synergies to
exist. These guidelines reflect relatedness in terms of: functional capability (Ansoff, 1965);
horizontal, non-horizontal and unrelated mergers (Chatterjee, 1986); and a matrix of capabilities
and market access (Sirower and Sahni, 2006).
Alternative arguments, not considering the effects of relatedness, are evaluated next.
5.3.2. Other factors affecting M&A synergy Various scholars highlight factors, other than relatedness, which could affect the existence of
synergy in a merger. Most of these factors affect one of two things: first, the value that could be
extracted from the target company; and second, that the acquisition price should not be too
high.
Porter (1980) described conditions that can increase the chances of an advantageous
acquisition, such as: first, a low floor-price (this is set by the target’s alternative of continuing to
operate the business); second, an imperfect market (including a low number of bidders and
unfavourable economic conditions); and third, the bidder has a distinctive ability to operate the
bidder company (this ability must not be shared by other bidders, otherwise the eventual bid
price will be too high). This last condition correlates closely with Farrel and Shapiro’s “no-
synergy theorem” as discussed supra, at section 2.5 under the heading “synergy”. As a
reminder, here synergy is defined as “efficiencies based upon the close integration of specific
hard-to-trade assets owned by the merging parties” (De la Mano, 2002). Furthermore, as
discussed, this theorem is starting to assume greater application in European merger control,
with their greater focus on merger-specific efficiencies (De la Mano, 2002).

83
As there is a strong link between a distinctive operating ability and merger-specific efficiencies,
at this point we can postulate that the efficiencies accepted in European merger control as a
rebuttal ex ante, will probably ensure that synergy, as defined in this dissertation, will exist for
the merger in question. The matters considered by European merger control could thus also be
relevant when evaluating if synergy will exist for a particular M&A.
McKinsey & Company (2005) further highlight three factors that could help to create value: first,
strong bidders are more successful (measured as those with superior earnings and share price
growth, or market-to-book ratios,51 before the bid); second, low transaction premiums; third,
being the only bidder is better (this should result in a lower acquisition price). In contrast,
Capron (1999), in his article rated number 2 in terms of overall times cited according to the
Social Sciences Citation Index (refer to Table 2-1), found that there is a significant risk of
negative merger performance in the case of the target’s assets being divested or redeployed.
Results
In the literature we identified several factors, other than relatedness, that could affect M&A
synergy. The dominant factor, increasing the chances of M&A synergy, is that the bid price
should not be too high. Furthermore, in cases where the bidder has a distinctive ability to
operate the target, this will probably be assured.
5.3.3 Why synergy exists for some M&As and not for others: overall results
In this section we attempted to answer the research question: why does synergy exist for some
M&As and not for others? We first focussed our attention on the effect of relatedness on value
creation. Here, the literature that used the effect on share prices as a proxy for value, offered
inconsistent findings: certain papers found that related M&As created more value, but other
papers found that relatedness could not be demonstrated to be the cause of value creation.
Furthermore, we could not identify any literature that investigated the effect of relatedness on
value creation defined as “intrinsic value”. We could therefore not establish a direct link between
relatedness and M&A synergy. We subsequently explored articles that indicate the effect of
relatedness on the potential for M&A synergies to exist. Here we identified meaningful
guidelines, these reflecting the potential for synergy to exist, based on the following measures
51 Normally expressed in a ratio named Tobin’s Q, as described by James Tobin (1969). ‘A general equilibrium approach to monetary theory’. Journal of Money Credit and Banking, Vol. 1.
Tobin’s Q = (Equity market value + liabilities book value) (Equity book value + liabilities book value)

84
of relatedness: functional capability (Ansoff, 1965); horizontal, non-horizontal and unrelated
mergers (Chatterjee, 1986); and a matrix of capabilities and market access (Sirower and Sahni,
2006). These guidelines could provide only an indication of expected M&A synergies. Based on
these findings, we can infer that each M&A should rather be evaluated on a case-by-case basis
and not in general. Further studies might cast further light on this controversial issue and
recommendations for further research in this regard are formulated as part of the conclusions
reached in this dissertation.
From the critical literature review performed above, we further identified several factors, other
than relatedness, that could affect M&A synergy. The dominant factor, increasing the chances
of M&A synergy, is that the bid price should not be too high. Furthermore, we identified that a
distinctive ability to operate the target will often assure an appropriate price.
In the following section we further explore the matter of a proper bid price.
5.4 What is the maximum amount that a specific bidder can offer for a target
company in order not to destroy shareholder value?
Here we attempt to answer the following research question:
Research question 4:
What is the maximum amount that a specific bidder can offer for a target company in order not
to destroy value for its shareholders?
In order to answer this research question, the following proposition was formulated, which we
will test here by means of a critical review of the literature.
Proposition A:
In order not to destroy shareholder value the following equation must hold true:
∑(MVt , P) ≤ ∑(IVt , SV)

85
Where:
MVt = Fair market value of the target entity on the offer date
P = Premium paid by the bidder
IVt = Intrinsic value of the target entity on the offer date
SV = The value on the offer date of synergies available in a merger or acquisition
between the target and bidder entities in question.
Notice that in proposition A, the sum of the fair market value of the target company on the offer
date (MVt) and the premium to be paid (P) will equal the offer price for the target company.
Evidence from the literature
Porter (1980) stated that the market for companies sets an acquisition price. By inference, we
could argue that Porter supported the notion that an acquisition price should incorporate the
distinct valuation concept of fair market value, as the valuation should be performed from the
perspective of market participants.
McKinsey & Company (2005) described a simple framework for creating value through M&As.
Here they contrast the gross value acquired (“what you get”) with the acquisition price (“what
you pay”). Per their framework, the gross value acquired consists of the intrinsic value of the
target (IVt per proposition A) plus the net present value of the created M&A synergies (if we
apply a discounted cash flow model to determine the specific synergy value then this should
equal SV in proposition A). This publication therefore verifies proposition A.
Albo and Henderson (1989) supported the notion of calculating two values for M&A synergy: A
value using the fair market value concept (MVt in proposition A) and a value for the bidder in
question (incorporating the value of synergy relevant to the bidder company in question – SV in
proposition A). Albo and Henderson (1989) argue that, to the extent that the target company
provides a good fit with several potential buyers, these buyers make up the market and
therefore determine the price that will be paid. They added that activity dictates the price, as
when a market is very active in making business combinations, synergy is virtually fully paid for.
They support the notion of calculating a value for synergy between the bidder and target
entities, for they argue that each purchaser can be presumed capable of enjoying synergies in
differing degrees. Furthermore, Albo and Henderson (1989) confirm that the price including
synergies between the bidder and target entities will provide the upper end of the pricing range.
Other authors on the subject, Gupta and Gerchak (2002), put forth a similar argument. They
argue that if operational synergies are calculated from a specific bidder’s perspective, it will
86
represent an upper bound on the value of this type of synergy and thus a maximum price. By
the same logic, one could argue that if this applies to operational synergies then it could apply
to other synergies (should they exist for a particular merger). If we then assume that a target
company’s intrinsic value represents the fundamental value (based on the net present value of
cash flows) and that this value excludes the value of any synergies with external parties, by
inference we can conclude that Albo and Henderson as well as Gupta and Gerchak support the
notion that an offer should not exceed the intrinsic value (IVt in proposition A) plus the value of
synergy (SV in proposition A). These papers therefore provide further verification of
proposition A.
King (2006) is very clear on the point that both valuation theory and the Financial Accounting
Standards Board (FASB) in the United States support the concept that fair market value is to be
determined without regard for the synergies that are unavailable to any market participant. The
fair market value of a target company should therefore include only the value of the synergy that
is available to any market participant – thus not the value of synergy unique to the bidder in
question (this unique value is similar to that proposed by Farrel and Shapiro (1990), as
discussed supra, at section 2.5 under the heading “synergy”). Keeping in mind the
aforementioned five elements of fair market value, one could argue that the purchase price
should not exceed the fair market value of a target company. Upon further scrutiny, however,
one realises that the fair market value represents the price that another market participant
would be willing to pay, so in order to “win” the bid, the purchaser will often have to offer an
amount higher than this. If a bidder company therefore intends to offer a premium (P in
proposition A) in excess of the fair market value of the target (MVt in proposition A), which
already includes the value of synergy that is available to any market participant, then in order
not to destroy economic value, the bidder will have to obtain in return an intrinsic value (IVt in
proposition A) plus value of synergy (SV in proposition A) in excess of this.
Sirower (1997) supported a thorough valuation processes to determine the purchase price. As
part of this process, he suggests that synergy value should be determined up-front, before the
merger takes place. He suggests that in setting a purchase price, an analysis of exactly what
the acquisition price represents should be performed – with specific focus on the detail. He
added that if this process does not take place, it could lead to costly failures. Albo and
Henderson (1989) suggested that the argument that the quantification of synergy is fraught with
speculation and uncertainty is not a valid reason for not quantifying it. They added that the level
of certainty (i.e. risks) should be factored into the calculation. Mercer Delta, a consultancy
specialising in the architecture of M&As said, “fuzzy notions of synergy should be replaced by

87
hard-nosed concrete descriptions” (Devine, 2002:9). In effect, these arguments all support the
notion that synergy value should be quantified before the M&A take place.
In the words of Jack and Suzy Welch (2006), in describing what they term a “sin” of M&As:
“…don't pay too much. We're not talking about a 5% premium; that will be lost in the rounding if
the deal works. We mean 20% or 30%, which happens too often. The culprit is ‘deal heat’ – the
negotiating frenzy fanned by competing bidders and investment bankers. Remember, there is
no last best deal, only overheated desire that makes it feel that way.”
Based on an extensive review of the literature, no publications could be identified that
contradicted proposition A.
Results
A critical review of the literature provided sufficient verification of proposition A:
In order not to destroy shareholder value the following equation must hold true:
∑(MVt , P) ≤ ∑(IVt , SV)
Considering the limitations of this approach, we can therefore tentatively conclude that, in order
not to destroy shareholder value, the maximum price that could be paid for a target entity is its
intrinsic value plus the value of synergies available in a merger between the target and bidder
entities in question).
A simple reasonability test could be formulated by using certain assumptions and by referring to
Farrel and Shapiro’s theorem on synergy (1990, 2001). We previously explained in section 2.8
that, in cases where there are other potential bidders, synergies available to them will probably
already be incorporated into the fair market value of the target. If we apply the following
simplified assumptions: first, the fair market value is higher than the intrinsic value, due to
synergies available to potential bidders; and second, synergies available to potential bidders are
also available to the bidder in question, then a premium (as per proposition A) will be warranted
only where synergies in excess of these are available. These excess synergies should conform
closely to Farrell and Shapiro’s theorem (1990, 2001), which described synergies that exist due
to hard-to-trade efficiencies that are unique to a merger between a specific bidder and target.
Thus in terms of this simplified guideline, a premium above fair market value should be
considered only where unique synergies are expected ex ante.

88
5.5 What are the best practices used to quantify the value of different types of
synergy ex ante?
Introduction
Most scholars, whether proponents or opponents of the concept that synergy normally adds
value in an M&A, seem to agree that synergy value should be quantified (Chatterjee, 1986;
Sirower, 1997).
One should differentiate as to whether the synergy value is quantified before or after the merger
event takes place. To quantify synergy value before an offer is made should be of interest to
several individuals, including the appraiser tasked with determining the value of the target
company. Such a valuation will be performed ex ante. However, if we quantify a figure based on
actual results rather than forecasts, it is performed ex post. The focus of this dissertation is on
quantifying synergy value ex ante.
Recall that we verified proposition A: In order not to destroy shareholder value the following
equation must hold true:
∑(MVt , P) ≤ ∑(IVt , SV)
Where:
MVt = Fair market value of the target entity on the offer date
P = Premium paid by the bidder
IVt = Intrinsic value of the target entity on the offer date
SV = The value on the offer date of synergies available in a merger or acquisition
between the target and bidder entities in question.
In this section we address the portion “SV” from proposition A and therefore attempt to answer
the following research question:
Research question 5:
What are the best practices used to quantify the different types of synergy ex ante?
Notice that the time constraints often encountered while quantifying synergy value ex ante will
ultimately limit the extent and exhaustiveness of the best practices applied. In the immediately
89
succeeding section we appraise the best practices based on a critical review of the literature,
which is organised under the following sub-headings:
• Quantifying synergy value: cost synergies; and
• Quantifying synergy value: revenue synergies.
Recall that the valuation approach to be employed will be based principally on the income
approach, using a valuation model based on discounted cash flow (as discussed supra, at
section 2.7). Furthermore, when the appraiser makes use of a model based on discounted cash
flow, the confidence level should be linked to the number of best practices employed in the
overall M&A transaction process (as discussed supra, at section 2.10).
5.5.1 Quantifying synergy value: cost synergies
In this section we appraise the best practices to be used in quantifying cost synergies, based on
a critical review of the literature (including publications in merger control). We highlight both
approaches and methods, but notice that these methods seldom directly quantify a specific form
of cost synergy (or efficiency for that matter); rather, these methods normally form part of a
toolkit used to measure the various types of cost synergies.
A prerequisite for an appraiser to effectively use these approaches and methods is a good
knowledge of the industry and the entities involved. Furthermore, these techniques are best
used on a case-by-case basis (Camesasca, 2000). An important limitation here is the relative
degree of imprecision inherent to all methods, including the best practices (as emphasised by
Camesasca, 2000). However, an imprecise measurement is often more beneficial than no
measurement at all.
The literature emphasises that, in cases where synergies exist, cost synergies are the most
common type and are easier to realise ex post (Eccles et al., 1999; McKinsey & Company,
2005; Sirower and Sahni, 2006), thereby underlining the importance of this section within the
overall process. In Appendix C we further explore the link between the following: synergies
increasing shareholder value, efficiencies considered in merger control, other reasons for a
merger, and the best practices used to quantify synergy value. Next we discuss best practices
and other suggested methods, including: an overall approach (outside-in approach), the
engineering approach to estimating economies of scale, Monte Carlo simulation, the effect of
financial synergy on the combined entity’s WACC, and the use of a specialist to quantify the
value of taxation benefits. Moreover, we review other non-recommended methods, which are
subject to a number of limitations, but could in certain instances be used to supplement the
other methods.

90
5.5.1.1 Outside-in approach
The “outside-in” approach, as described by McKinsey & Company (2005), could be used as a
best practice to quantify all forms of cost synergy. It initiates with an external picture of the
larger industry within which the companies operate and then moves inward, analysing the
possible cost synergies in detail, with most of the insider information provided by the target
company’s management team through a due diligence request.
This approach is structured using four steps (McKinsey & Company, 2005:447):
1. Develop an industry-specific business system;
2. Develop a baseline for costs as if the two companies remained independent. Make sure the
baseline cost is consistent with the intrinsic valuations;
3. Estimate the synergies for each cost category based on the expertise of experienced line
managers;
4. Compare aggregate improvements with margin and capital efficiency benchmarks to judge
whether the estimates are realistic given industry economics.
In estimating the synergies for each cost category (step 3 above), McKinsey & Company (2005)
do not provide detailed guidance on a methodology to be followed, but nonetheless recommend
that the financial savings be clearly linked to operational activities. For instance, relate expected
cost synergy savings in selling, general and administration expenditure, to the equivalent
headcount deduction. (Here use is to be made of experienced line managers, as they should
possess important information in this regard and furthermore often know important details of the
target company.)
As part of steps 2 and 3 of the outside-in approach, it is possible to follow Gupta and Gerchak’s
suggestion of including synergistic benefits in the cash flows in a spreadsheet-based discounted
cash flow model (200252). Such a spreadsheet model could indeed be employed, but certain
practices should be avoided, as described infra, at section 5.5.1.6.
52 In their article rated number 23 in terms of overall number of times cited according to the Social Sciences Citation Index (refer to Table 2-1).

91
Moreover, as part of the outside-in approach, it is possible to follow the suggested guidelines of
Damodaran (2005), whereby the value of synergy is quantified by applying the following steps
(2005:6-8):
1. Quantify the intrinsic value of the entities involved in the merger independently, by
discounting expected cash flows of each firm, using the WACC for that firm.
2. Estimate the value of the combined firm, without synergy, by adding the two separate
values obtained in step 1.
3. Estimate the value of the combined firm with synergy, by applying further steps:
3.1 Incorporate the effects of synergy into the expected cash flows of the combined
entity, by incorporating inter alia:
a. A higher growth rate in revenues [this is further discussed infra, at section 5.5.2].
b. Higher margins, because of economies of sale [this is further discussed infra, at
section 5.5.1.2].
c. Lower taxes, because of tax benefits [this is further discussed infra, at section
5.5.1.5].
3.2 Incorporate the effects of financial synergy into the discount rate of the combined
entity and calculate an adjusted WACC for the combined entity [this calculation and
important provisos are discussed infra, at section 5.5.1.4].
3.3 Calculate the present value of the combined expected cash flows (including synergy)
by discounting at the adjusted WACC.
4. Subtract the value determined in step 2 from the value determined in step 3, to obtain the
value of synergy (as part of the maximum bid price).
We support the suggested guidelines of Damodaran (2005) to be applied as part of the outside-
in approach, as these seem sensible and as these are based on acceptable modern valuation
theory, incorporating discounted cash flows. However, in this process, we have to re-emphasise
the consideration of the further guidelines and provisos mentioned supra in this section.
5.5.1.2 Engineering approach to estimating economies of scale
As discussed, economies of scale, in simplified terms, relate to a decrease in unit cost as the
scale of operations increases. Economies of scale could be estimated using an engineering
approach, where not only engineers, but also economists, accountants and managers provide
estimates of costs at different scales of production. A research paper on quantitative techniques
in competition analysis highlighted that more reliable results could be obtained through the

92
engineering approach when estimates are prepared using econometric techniques53 (Hochn,
Langenfeld, Meschi & Waverman, 1999). Pratten (1988) identified the engineering approach as
a best practice to estimate economies of scale due to its ability to generate reliable results.
Camesasca (2000) described the advantages of this approach as including the ability to
estimate scale economies, whilst keeping the other conditions constant (such as quality and
price of inputs, and the current state of adroitness). However, Camesasca (2000) highlighted
that this approach contains a margin of error and is not always exhaustive (especially in non-
technical areas such as when considering the effect of management, and research and
development).
For the engineering approach, knowledge is often assembled using questionnaires or studies.
As part of this approach, information is also collected on alternative plant design with its related
investment and operating costs (Camesasca, 2000). Pratten (1988) compiled an extensive
listing of engineering estimates of economies of scale for different European manufacturing
industries, which is included in Appendix D. This could be used as a reasonability test, when an
appraiser is evaluating the potential economies of scale from an engineering estimate prepared
for a proposed merger.
5.5.1.3 Monte Carlo simulation
A Monte Carlo simulation could be applied in conjunction with the other best practices
discussed in this section, to quantify synergy value. As previously explained, a Monte Carlo
simulation is able to provide an expected value of a synergy benefit over the calculated range of
possible outcomes, but more beneficially, will provide insight into the risks involved and the
probability of success. We further described that a Monte Carlo simulation, in general, provides
superior results to other methods54 when dealing with uncertainty (Hertz, 1964). As such, a
Monte Carlo simulation could be viewed as a best practice in quantifying synergy value.
However, due to its mentioned intricacy, its use is probably best reserved for those synergy
calculations incorporating many sources of uncertainty. Notice that a Monte Carlo simulation
could be used to quantify the value of cost and revenue synergies.
5.5.1.4 The effect of financial synergy on the combined entity’s WACC
As discussed supra, at section 5.1, financial synergy is a form of cost synergy that is the result
of reductions in the cost of capital (Chatterjee, 1986). An important caveat here is that financial
53 Applying quantitative or statistical methods. 54 Such as game-theory, selected probabilities and three-level estimates (e.g. as proposed by Evans and Bishop, 2001: one estimate for “optimistic”, one for “expected” and one for “pessimistic”).

93
synergy is a more questionable motive for M&As (Gaughan, 2007; McKinsey & Company,
2005). In this context it is argued that financial synergy will have a low value at best and that
reductions in the cost of capital are often mainly the result of a contribution made by the bidder
entity (including access to less expensive borrowing, a reduction in risks faced by equity
holders, etc.). Any payment by the bidder entity for this form of synergy will therefore accrue to
the benefit of equity holders of the target entity. The proportion of financial synergy actually
included in the final bid price should thus receive special attention and is further discussed infra,
at section 5.6. Furthermore, the impact of the acquisition on the credit rating of the acquirer
should be considered.
Best practices in quantifying the value of financial synergy are not specifically described in the
literature, but a suggested method could be inferred from documented practices in calculating
discount rates.
Financial synergy as a result of an improvement in the capital structure of an entity should have
a low expected value and would often be fully paid for in a bid. A low value is expected here as
most entities, in the long run, should aim towards a target capital structure that minimises the
cost of capital (thus an optimum capital structure).55 Furthermore, financial synergy from an
improvement in the capital structure, leading to a reduction in the cost of capital, is available to
any market participant. This is because any acquirer will have the option to correct a non-
optimal capital structure of an entity to the optimal (within limits) following a merger and will thus
often be fully paid for. This is further evident from valuation practice, where a target capital
structure is normally assumed in calculating the discount rate when applying a valuation model
based on discounted cash flow.56 Through this practice, the value of financial synergy from an
improvement in the capital structure is incorporated in the entity’s fair market value.
Closely related to financial synergy is the concept of economies of the capital market, with its
discussion supra, at section 5.2. To revisit, a merger could lead to increased corporate size,
which in turn, could lead to economies when raising capital through common stock issue or
borrowing (Camesasca, 2000). Here we demonstrated that economies of the capital market
55 A detailed discussion of optimal capital structure as well as its link to the target capital structure is beyond the scope of this dissertation. 56 According to a valuation methodology survey performed by PricewaterhouseCoopers (2008), the majority of appraisers utilise the theoretical target capital structure (indicative of the optimal capital structure) of an entity in determining the relative weights of debt and equity in the WACC, even if an entity utilises a different structure in practice. McKinsey & Company (2005) suggest that a target structure could be obtained through a combination of three approaches: first, estimate the entity’s current capital structure at market value; second, review the capital structure of comparable entities in the industry; and third, review management’s approach to financing the business.

94
could lead to synergy and that the small-stock premium, incorporated in the discount rate when
utilising a valuation model based on discounted cash flow, could be affected.
Due to the aforementioned caveat and limitations, we do not provide an exhaustive discussion
of all possible causes of financial synergy here; instead we highlight only the main sources that
could result in financial synergy (for the purposes of calculating a maximum bid price). These
are: a reduction in the small-stock premium incorporated in the cost of equity and a reduction in
the cost of debt due to access to less expensive debt capital. These should furthermore only be
considered where the credit rating of the acquirer would remain largely unchanged.
Reduction in the small-stock premium
As discussed supra, at section 2.9, the small-stock premium is a component of the cost of
equity, which in turn forms part of the WACC (PricewaterhouseCoopers, 2008). To revisit, we
described the calculation of the cost of equity (“Ce”) based on the capital asset pricing model,
as follows (PricewaterhouseCoopers, 2008):57
Ce = Rf + β x E(Rp) + Ssp + Srp
Where:
Rf = The risk-free rate
β = Beta-coefficient
E(Rp) = Expected market risk premium
Ssp = Small-stock premium
Srp = Specific risk premium for unique risks not modelled in the forecasted cash
flows
Appraisers apply the following average small-stock premiums (“Ssp”) in a South African
context:
• For equity values up to ZAR250 million: 5.2% premium;
• For equity values between ZAR251 million and ZAR500 million: 4% premium;
• For equity values between ZAR501 million and ZAR1 000 million: 2.7% premium;
• For equity values between ZAR1 001 million and ZAR1 500 million: 1.7% premium;
57 Elements per the original capital asset pricing model are indicated in plain text, and adjustments and practices according to valuation methodology, in italics.

95
• For equity values between ZAR1 501 million and ZAR2 000 million: 1.3% premium;
and
• For equity values above ZAR2 001 million: 0.4% premium.
Based on this criterion, in cases where a merged entity will increase in size, there should be a
reduction in the small-stock premium that used to form part of the cost of equity of the target
entity, before the merger. When calculating the cost of equity of the combined firm (to be
incorporated in the WACC of the combined entity), any previous small-stock premium could
thus be reduced as a result of the increase in size of the combined entity.
Reduction in the cost of debt
As discussed supra, at section 2.9, the cost of debt is often linked to a credit rating that is
determined by a bank or a professional rating agency. Here we presented the meaning of
professional credit rating opinions (in Table 2-4) and the typical premium (spread) over a risk-
free rate (in Table 2-5). To revisit, rating agencies consider both business and financial risk in
determining a credit rating (Standard & Poor’s, 2010b). When considering business risk the
factors analysed include: industry characteristics, competitive position and management
(Standard & Poor’s, 2010b). Standard & Poor’s further highlights that when evaluating the
competitive position, the size of an entity is not as important as a demonstrable competitive
position (2010b). However, they indicate that size is beneficial in many cases due to an element
of diversification, and significant resilience due to a large number of employees (which could
influence their fate in case of trouble), the extensive exposure of banks (which often promote
longer commitment) and more extensive ancillary assets (that can be sold).
It follows that the impact on the combined entity’s cost of debt will be determined by the effect of
the merger (including increased size) on the combined entity’s business and financial risk.
Result
As mentioned, best practices in quantifying the value of financial synergy are not specifically
described in the literature, but a suggested method could be inferred from documented
practices in calculating discount rates. From these we can suggest a method with the following
important caveats: financial synergy will have a low total value at best and the bidder should be
careful not to include too great a proportion in the bid price as the benefits are normally
contributed mainly by them.

96
Subject to these provisos, we could incorporate the value of financial synergy in the maximum
bid price, by applying the following suggested approach: As part of the best practice of applying
an outside-in approach as recommended by McKinsey & Company (2005), we can apply the
suggested guidelines of Damodaran (2005) to quantify synergy value. This, in turn, dictates the
calculation of an adjusted WACC for the combined entity to incorporate financial synergy (as
described supra, at section 5.5.1.1). In this calculation, we should incorporate mainly the effects
of the merger on the small-stock premium and cost of debt, as discussed in this section.
5.5.1.5 The use of a specialist to quantify the value of taxation benefits
As discussed supra, at section 5.2.2.1, savings in taxation as a result of a merger will depend
on the tax legislation of the relevant countries involved. Tax legislation often prevents the
utilisation of these benefits, but they could include: the utilisation (or faster utilisation) of taxation
losses by offsetting the taxable income of one entity with the assessed loss of the other, or a
saving in tax by increasing the values of the assets of the acquired firm without paying capital
gains taxes (Camesasca, 2000). Here the following two aspects mentioned by Eccles et al.
(1999) should be considered: tax engineering (this to ensure the merged entity’s combined tax
rate is lower than the blended tax rates of the unilateral companies) and tax structuring (this
resulting in a once-off benefit due to minimising the cost of the merger).
A best practice in quantifying the value of tax benefits is not described in the literature, but a
suggested approach could be formulated. As tax benefits would differ from merger to merger
and would depend on the laws of the different countries, we recommend that use is made of a
tax specialist to quantify the value of tax benefits separately for each specific merger.
5.5.1.6 Non-recommended methods
Other methods have been identified and are sometimes used in practice, but do not represent
best practices due to inherent limitations. These methods are therefore best not used to quantify
synergy value in isolation, but may supplement the aforementioned best practices where
necessary. These non-recommended methods include:
• A simplified method often employed in practice, whereby cost synergies are quantified
based on the assumption that superior performance will be duplicated. Here the
difference in financial performance between the bidder and target companies is
calculated. Next, the assumption is made that cost synergies will automatically result in
the weaker entity’s performance improving to a level approximate to that of the stronger
entity (as criticised by McKinsey, 2005). The weakness of this approach lies in the fact

97
that this does not imply that the weaker entity’s margin58 will automatically improve to a
level close to that of the stronger entity.
• To infer the size of synergy from the link between profitability and the size of an
organisation. This is closely linked to the aforementioned practice. Here, Camesasca
(2000) describes that the limitations of this approach include: the application of different
accounting standards (although this will be minimised due to the effects of increasing
internationalisation) and the variation in profits due to the effects of a business cycle.
• The news-vendor model framework as formulated by Gupta and Gerchak (2002), to be
used in quantifying operational synergies. In a positive sense, this model considers the
important relationships between operational synergy and the following: the excess
capacity of the target and bidder firms; the volatility of the target and bidder firms’
demand; the degree of demand correlation; and the degree of flexibility of the production
capabilities of the target and bidder firms. In a negative sense, this model is only
relevant to companies in the manufacturing industry and is subject to the following
limiting assumptions: no inventory is kept by the entities59 and the bidder will make long-
term use of the target company’s available capacity. Even though Gupta and Gerchak’s
propositions (2002) seem sensible and the no-inventory limitation is negated to an
extent by the increasing use of just-in-time inventory systems, the use of this model is
limited due to complexity in calculation and to not being tested empirically. This model
can, in relevant cases, supplement other best practices and may be used as an upper-
bound price as suggested by its authors.
• The use of statistical cost analysis, including multiple regression techniques, to
determine the economies of scale available in the case of a merger between entities.
Here, Camesasca (2000) describes that the limitations of this approach include: the
difficulty in obtaining comprehensive, dependable data and the problems associated with
analysing plants built at different points in time.
• The use of census production data to infer the efficiencies available in a merger.
Camesasca (2000) underlines that, even though these censuses often cover a large
number of organisations and actual data, they are limited in their use because
categories are grouped even though the included products vary significantly in their
complexity.
• The use of survivor tests to infer the efficiencies available in a merger. The argument is
that only entities with the most efficient plants (of a certain size) will survive and that
eventually all plants in the industry should approach the same size (Camesasca, 2000).
58 E.g. earnings before interest, tax, depreciation and amortisation divided by income (EBIDTA margin). 59 I.e. the output of the two companies is either perishable or cannot be stored.

98
In opposition, Camesasca (2000) further highlights the limitations: the criteria are subject
to the whims of the observer and the effect of time on survival patterns.
• Options pricing, specifically the real-options approach. As discussed supra, at section
2.11, a real-options approach can only be applied to projects that can be abandoned
before significant financial investment is required (Van Putten and MacMillan, 2004) and
as such is not recommended to quantify most types of M&A synergy, where the
investment is made upfront. It could, however, prove valuable in quantifying the value of
synergy extracted through economies in innovative efficiency – specifically from the
acquisition of technology.
5.5.1.7 Best practices in quantifying cost synergy value: overall results
Best practices in quantifying cost synergy value ex ante include the application of the income
approach to valuations by using a valuation model based on discounted cash flow (as
discussed supra, at section 2.7). Furthermore, when the appraiser makes use of a model based
on discounted cash flow, best practice dictates that the confidence level should be linked to the
number of best practices employed in the overall M&A transaction process (as discussed supra,
at section 2.10). Best practice in quantifying cost synergy value further includes the application
of an overall structured approach such as the “outside-in” approach, as described by McKinsey
& Company (2005) and as discussed supra, at section 5.5.1.1. This approach initiates with an
external picture of the larger industry within which the companies operate and then moves
inward, analysing the possible cost synergies in detail. Economies of scale could be quantified
using the best practice of an engineering approach (as discussed supra, at section 5.5.1.2). As
discussed supra, at section 5.5.1.3, a Monte Carlo simulation could be applied in conjunction
with the other best practices discussed in this section, to quantify synergy value.
A suggested approach60 that could be applied along with the aforementioned outside-in
approach is contained in the guidelines for quantifying synergy value, as formulated by
Damodaran (2005). These involve four steps: first, quantify the intrinsic value of the entities
involved in the merger independently, by discounting the expected cash flows of each firm,
using the WACC of that firm; second, estimate the value of the combined firm, without synergy,
by adding the two separate values obtained in the first step; third, estimate the value of the
combined firm with synergy, by discounting the expected cash flows of the combined entity
(including the effects of synergy) with the calculated adjusted WACC of the combined entity;
and fourth, subtract the value determined in the second step from the value determined in the
60 Suggested approaches are formulated where there are no best practices or methodologies identified in the literature, or in cases where the identified methodologies are not verified by practical application.

99
third step, to obtain the value of synergy (as part of the maximum bid price). Further suggested
approaches include the use of a specialist to quantify the value of taxation benefits (as
discussed supra, at section 5.5.1.5).
As described supra, at section 5.5.1.6, certain non-recommended practices are best avoided in
quantifying cost synergy, such as applying a simplified method, whereby cost synergies are
quantified based on the assumption that superior performance (achieved by an entity prior to
the merger) will be duplicated by the weaker merging entity. Some of the non-recommended
practices could, however, supplement the aforementioned best practices where necessary.
These include the news-vendor model framework as formulated by Gupta and Gerchak (2002),
to be used in quantifying operational synergies.
5.5.2 Quantifying synergy value: revenue synergies
In this section we appraise the best practices used to quantify revenue synergies, based on a
critical review of the literature (including publications in merger control). The introductory
comments made in the previous section on cost synergies are also applicable here. These
include the requirement that an appraiser has good industry knowledge and the degree of
imprecision applicable to all methods described here. In Appendix C we further explore the link
between the following: synergies increasing shareholder value, efficiencies considered in
merger control, other reasons for a merger and the best practices used to quantify synergy
value. Moreover, we review other non-recommended methods. These are subject to a number
of limitations, but could in certain instances be used to supplement the best practices.
The literature emphasises that revenue synergies are notoriously difficult to realise ex post
(Eccles et al., 1999; McKinsey & Company, 2005; Sirower and Sahni, 2006), a feature that
should be considered in quantifying its value. We consider next best practices and other
recommended methodologies in quantifying revenue synergies, including an overall structured
approach, a methodology to quantify revenue synergies from market power, and methodologies
in quantifying revenue synergies from economies in innovative activities.
5.5.2.1 A structured approach
McKinsey & Company (2005) described a structured approach that could be used as a best
practice to quantify all forms of revenue synergy. This process compares ex ante estimates to
realities in the marketplace. Here it is important that estimates of pricing power and market
share are formulated to be “consistent with market growth and competitive reality” (McKinsey &
Company, 2005:450). McKinsey & Company (2005) stress that revenue synergies are often the

100
result of the acquisition of a specific technology or product (this could lead to revenue synergy
from innovation efficiency) and that revenue synergy from increased selling prices through
reduced competition (revenue synergy from market power) is limited by merger regulation.
McKinsey & Company (2005) describe that revenue synergies will originate from amongst the
following sources (2005:450-451):
1. Increasing each product’s peak sales level;
2. Reaching the increased peak level earlier in time;
3. Extending each product’s life;
4. Adding new products and features through the unique abilities obtained through the
merger; and
5. Increasing each product’s sales price through market power and reduced competition (as
mentioned the benefit here is limited by merger regulation).
5.5.2.2 Methodology to quantify revenue synergy from market power
Chatterjee (1986) described that increased market power could lead to collusive (revenue)
synergy. Here it is argued that increased market power will supply a merged entity with the
ability to increase sales prices above competitive levels for a significant period of time (De la
Mano, 2002), which in turn would lead to revenue synergy. The amount of revenue synergies
extracted through the exercise of market power will be limited, in most cases, by competition
regulation. In this regard, recall the mention that anti-trust legislation has curtailed, to a large
extent, those mergers motivated mainly by market power61 (Camesasca, 2000).
In quantifying value here it is important to consider the dynamic interaction between the
following factors:
• The main motivation or strategy behind the merger. Is it revenue synergies from market
power? If so and if significant, it is unlikely to be approved by competition regulation in
most cases;62
• If the merger is not mainly motivated by this factor, but we nonetheless consider that
there will be an increase in market power, then the degree of market power should be
considered. Moreover, merger regulation will in some cases also consider an efficiency
defence against an otherwise anti-competitive merger;
61 Market power as a reason for a merger was discussed supra, at section 5.2.2.3. 62 As discussed supra, the purpose of this dissertation is not to provide a detailed account of the merger control regulations and considerations, as this is a separate and specialist area. We do, however, highlight a few merger control considerations here due to the dynamic interaction between these and the matter in hand – that of quantifying revenue synergy ex ante.

101
• An increase in revenue synergy from market power could lead to negative cost
synergies (from a decrease in managerial efficiency, as discussed supra, at section
5.2.1.4) and a reduction in innovative efficiency, as discussed supra, at section 5.2.1.6);
and
• The literature emphasises that revenue synergies are notoriously difficult to realise ex
post (Eccles et al., 1999). However, in cases where it does exist within the constraints of
merger control, it could nonetheless represent a significant amount (Chatterjee, 1986).
Our searches revealed that literature describing the best practices followed by companies in
quantifying revenue synergy (obtained through market power) is limited. In contrast, the body of
literature describing methods of measuring market power is vast, especially in the context of
merger control. Due to the dynamic interaction of said factors, we also discuss this literature
here. Notice that there is no direct measure estimating the expected increase in selling prices
from an increase in market power in the literature. (This is probably due to the differences
between industries and a number of other variables.)
An increase in market power could, however, indicate the possibility of increasing selling prices,
which, in turn, could result in revenue synergy. Out of necessity we therefore considered the
techniques available for the measurement of market power. Here we found the multitude of
techniques described in merger control literature to be the best source of information. Of these,
our emphasis on revenue synergy led to a further evaluation of only the most applicable
indicators of market power, which are: the Herfindahl-Hirschman Index, as applied inter alia in
U.S. merger control; and other indirect indicators applied in the European context.
Herfindahl-Hirschman Index
An increase in market power could indicate the possibility of increasing selling prices and this, in
turn, could lead to revenue synergy.
The United States Department of Justice (no date) describes the calculation of the Herfindahl-
Hirschman Index (also known as “HHI”) as follows: first, the market share of each firm63
competing in the market is identified; second, each of these market shares is squared; and
third, the resulting numbers are then summed. Market shares are typically calculated based on
the specific firm’s current share of the total market in terms of sales or capacity (Camesasca,
2000). According to Camesasca (2000), market share could range between 0.00 (only possible
63 For practical reasons, where there are a very large number of firms operating in a market, only the 50 largest firms are included here.

102
for a theoretical market composed of an infinite number of firms with equivalent market shares)
and 1.00 (for a pure monopoly) (Camesasca, 2000). For instance, a specific U.S. market
consists of five firms each with a current market share of 20 percent before a merger. In this
case the resulting Herfindahl-Hirschman Index would equal 200064 points. An ex ante projection
indicates that, following the merger of two of these firms, the market would consist of three
firms, each with a market share of 20 percent, and a single firm with a market share of 40
percent. In this case the resulting Herfindahl-Hirschman Index would equal 280065 points.
According to the U.S. Horizontal Merger Guidelines, key points on the Herfindahl-Hirschman
Index for a market are: between 1000 and 1800 points is indicative of a moderately
concentrated market; and points in excess of 1800 are indicative of a concentrated market (The
United States Department of Justice, no date). In cases where the market has an existing
Herfindahl-Hirschman Index above 1800 points, before a merger, it is already deemed to be
concentrated; should the Index then increase by more than 100 points following a merger, this
will trigger market power concerns and will likely be challenged by the entities responsible for
merger control (The United States Department of Justice, no date). According to Camesasca
(2000), mitigating circumstances would be considered in such a case, e.g. potential new
entrants and the barriers to entry. Furthermore, Camesasca (2000) describes that, in cases
where there is a merger in a market with an existing Herfindahl-Hirschman Index between 1000
and 1800 points, further analysis would normally be applied before it would be challenged. For
the aforementioned example, the Herfindahl-Hirschman Index of 2000 points indicates a
concentrated market before the merger. Following the merger the Index increased by 800
points, which is more than 100 and will therefore likely be challenged in a U.S. context.
The advantage of the Herfindahl-Hirschman Index is that it considers both the number of firms
in a market and market share, and, due to the nature of its calculation, a greater weight is
placed on concentrated market share. The Herfindahl-Hirschman Index is, of course, not a
perfect indicator of market power and is correspondingly not the sole indicator considered in
U.S. merger control (Camesasca, 2000), It is nonetheless an important indicator of market
power and could also be used to indicate the possibility of market power that could lead to an
increase in sales prices, and thus revenue synergy.
Indirect indicators of market power considered in European merger control
64 Percentages are treated as whole numbers in the calculation, which is calculated as follows: 202 + 202 + 202 + 202 + 202 = 2000 points. 65 Calculated as follows: 202 + 202 + 202 + 402 = 2800 points.
103
In the European context, market shares are considered one of the most important indicators of
dominance in terms of market power. In determining the ability to exercise market power here, a
range of criteria was considered throughout the years. In this regard, Camesasca highlights a
few key market share percentages considered in European merger control:
• Market shares of 25 percent and below are generally presumed to indicate non-
dominance (2000:96).
• Market shares of 40 percent and above are generally indicative of dominance (2000:98).
On the other hand, market shares are not considered the sole indicator of dominance. Here,
Camesasca (2000) describes that the characteristics and nature of competition in the market
also have to be considered, e.g. a large market share often indicates market power in a mature
market, but not in a high-growth market that is technology driven (due to its rapid changes). As
a result, it is recommended that market power be assessed on a case-by-case basis.
The importance of properly defining the market
The definition of a market will have a fundamental effect on calculated market shares. Thus,
when referring to market shares as an indicator of market power, albeit through a direct
measure or the Herfindahl-Hirschman Index, it is extremely important that the market be
properly defined.
In the European context, the “functionable interchangeability” of a product or service is of key
importance (Camesasca, 2000:89). In other words, a market should encompass all products
and services that are interchangeable according to its “price, usage and consumer preference”
to a sufficient degree (Camesasca, 2000:89). In extending the definition of the market to a
geographical area, the conditions of competition should be similar for all suppliers (Camesasca,
2000).
In defining a market, the U.S. Merger Guidelines also address the concept of substitution
between products, services and area. Here they prescribe that the market should be expanded
as long as a consumer would switch to a substitute product, or service, or geographical area, in
cases of a 5 to 10 percent permanent relative increase in selling prices. As soon as the
consumer would not switch to a substitute it should indicate the limit of the defined market as
price increases from this point would be profitable for the supplier.
An example of how a market was defined by competition authorities is evident in the merger
between Boeing Company and Hughes Electronics Corporation, which was announced in 2000.

104
At the time of the merger, Boeing Company was active in several industries, including defence,
space and commercial aircraft, whereas Hughes Electronics Corporation incorporated a
subsidiary that was a leading manufacturer of commercial geostationary-orbit satellites (with a
market share of roughly 40 percent). A report financed by the European Commission for the
European Communities and authored by RBB Economics (2005), describes that this merger
was investigated for potential anti-competitive effects, but was cleared by European and U.S.
merger control. According to RBB Economics (2005), the European Commission considered the
market for satellites not as a single market, but as separate markets. In this regard, Boeing
Company and Hughes Electronics Corporation operated in different satellite markets prior to the
merger; Hughes Electronics Corporation’s effective 40 percent market share in commercial
geostationary orbit satellites was therefore not a primary concern (RBB Economics, 2005). This
was corroborated by evidence that, in the market for satellites, alternative satellite products
existed, which led to strong buyer power (RBB Economics, 2005). A further concern for
competition authorities was the combination of the parties’ activities in satellite manufacturing
and launching, due to the nature of satellite delivery (RBB Economics, 2005). Satellite delivery
includes what is known as “DOG” or “delivery on the ground” and “DIO” or “delivery in orbit”.
Customers subscribing to the former delivery method normally purchase satellites separately
from launching services, whereas customers subscribing to the latter method normally purchase
a complete package. The market for satellite manufacturing therefore overlaps with the market
for satellite launching. Amongst the concerns raised for this merger was that Hughes
Electronics Corporation could divulge sensitive information on third party launchers to the
benefit of Boeing Company. In the U.S. context, the parties had to agree to a contentious safety
measure, in the form of an information technology firewall, in order to protect sensitive third
party information.
Results
A suggested methodology in quantifying the value of revenue synergy from market power ex
ante, is to collectively consider the following factors:
• The main motivation or strategy behind the merger. Is it revenue synergies from market
power? If so and if significant, it is unlikely to be approved by competition regulation in
most cases;
• If the merger is not mainly motivated by this factor, but we nonetheless consider that
there will be an increase in market power, then the degree of market power should be
determined using measures such as the Herfindahl-Hirschman Index and other indirect
indicators of market power. Moreover, merger regulation will in some cases also
consider an efficiency defence against an otherwise anti-competitive merger (in this
105
regard, the link between synergies increasing shareholder value and efficiencies
considered for merger control is described in Appendix C);
• The effect of an increase in market power on selling prices should be determined
(mainly by management of the bidder and target entities through a due diligence
request) and included in a valuation model based on discounted cash flow;
• Its effect on other synergies should be incorporated, specifically the lowering effect on
other synergies (e.g. from a decrease in managerial efficiency and a reduction in
innovative efficiency); and
• When the appraiser makes use of a model based on discounted cash flow, best practice
dictates that the confidence level should be linked to the number of best practices
employed in the overall M&A transaction process (as discussed supra, at section 2.10).
5.5.2.3 Methodologies to quantify revenue synergy from economies in innovative activities
De la Mano (2002) described that M&A synergies from innovative activity (including the effects
of technology) could be substantial, especially where competition is mainly in the field of
innovation rather than price. On the other hand, Camesasca (2000) warned that realising the
benefits of innovative activity often proves to be highly elusive. As a result, merger control
normally only considers economies in innovative activity as an efficiency rebuttal for otherwise
anti-competitive mergers, within industries with a short-lifespan, which involve a high level of
technology (De la Mano, 2002). Here the benefit is normally based on “an educated guess,
[offered] on a case-by-case basis” (De la Mano, 2002:17).
Developments were made in the valuation of technology furthering the science beyond a mere
educated guess. These include the Technology Balance Methodology, developed by the
Fraunhofer Institute for Production Technology, as described by members Schuh et al. in a
2008 paper; the Risk-Weighted Enterprise Model as described by Boer (1999); and the real-
options approach as applied by several companies in technology-driven industries, as also
described by Boer (1999). We elaborate on these works here as they lay the foundation for the
valuation of technology (intrinsic value per proposition A) and provide a stepping stone to
quantifying the value of M&A synergy obtained through technology (another component
contained in proposition A). It is important to notice that, when applying valuation methodologies
or models, the results will depend to a large extent on the quality of inputs. This is especially
true of innovation and technologies, which is a specialist area and subject to a large degree of
uncertainty. A proper understanding of the environment is therefore required. It is beyond the
scope of this dissertation to address the technology and innovation environments
comprehensively, but we will elaborate on a few key issues in this section. The origins of

106
synergy from innovative activity were already discussed supra, at section 5.2.1.6. These origins
include the acquisition of external technology, whereby a research and development portfolio
could be diversified and technology options could be extended (Boer, 1999). Next we elaborate
on some of the significant sources of synergy value in this context and provide additional
background information.
Synergy value from the acquisition of external technology
According to Boer (1999), the acquisition of external technology can create synergy value by:
firstly, providing inexpensive access to a technology; secondly by accelerating innovation;
thirdly, by diversifying the acquirer’s research and development portfolio; and fourthly, by
extending the value of technology options by enhancing flexibility. As such, it can create
synergy value where a single technology (in isolation) provides increased value to the acquirer.
Alternatively, it can create synergy value through interaction with an existing research and
development portfolio that is already owned by the acquirer.
Considerations here will depend on the stage of technology development and the provider of
the technology. The focus of this dissertation is synergies obtained through a merger or
acquisition, including in some cases, the acquisition of assets (and possibly liabilities) forming a
going-concern business instead of the specific legal entity. Its scope therefore excludes the
licensing of technology, joint ventures and industrial partnerships. These are nonetheless valid
avenues, but should form part of separate research. With this in mind and within the scope of
this dissertation, technology could be acquired through an outright purchase of a technology or
the company that developed it. Here, the purchase of early stage technology, or its provider,
might provide an opportunity to obtain technology inexpensively or to accelerate innovation
(Boer, 1999). (Early-stage technology is often expensive to develop in-house due to the large
proportion of projects that do not progress from concept to the development stages (Boer,
1999).) In contrast, the purchase of a later stage technology, or its provider, is normally
motivated by diversification of the acquirer’s research and development portfolio, and the option
to accelerate the commercialisation of a project (Boer, 1999).
Diversification
M&A synergy value obtained through diversification is closely linked to the principles
incorporated in the Capital Asset Pricing Model, including the components of the total risk faced
by an entity: unique and systematic risks. Unique risk is associated with the specific operations
of an entity and can be reduced through diversification, whereas systematic risk is the risk
107
associated with operating in a “system” and cannot be reduced through diversification without
moving to another “system” (Boer, 1999). In line with the concepts inherent to the Capital Asset
Pricing Model, unique risks are normally not rewarded as they could easily be reduced through
diversification. The discount rate determined using the Capital Asset Pricing Model therefore
only adds a premium to the risk-free rate for an entity’s exposure to systematic risks. As such,
Boer (1999) emphasises that a diversified research and development portfolio could maximise
value for a level of total risk (systematic and unique risk combined). When employing a
valuation model based on discounted cash flow, this increased value will be reflected in a
greater projected cash flow component (possibly from probability-weighted scenarios), rather
than a reduction in the discount rate. Note that diversification is enhanced if the acquired
technology is not highly correlated to the existing portfolio (Boer, 1999). Here a company in the
Information Technology industry could diversify into related products, which are not highly
correlated, e.g. Apple Inc. successfully diversified its hardware and software portfolio to include
personal entertainment products.
Technology options
As mentioned (supra), technology options include the right but not the obligation to perform
certain actions. These include: the option to terminate a project, the option of pairing
technologies, the option to create a next-generation product and the option to accelerate a
project (Boer, 1999). The option of pairing an acquired technology with an existing technology is
often enhanced through the use of technology platforms – the latter representing a set of sub-
systems that together form the basis for the development of further products (Boer, 1999).
Examples of technology platforms include automotive platforms,66 and software platforms used
in the manufacture of software programs and mobile phones. Note that a technology in isolation
could create certain options, but within the context of a research and development portfolio, an
acquired technology could also create new options through its interaction with the existing
portfolio.
We discussed the adjustment of the Black-Scholes formula to price technology options as part
of the real-options approach supra, at section 2.11.4. The weakness of this approach is its
sensitivity to changes in all variables, including the inputs relating to volatility of the share
(indicated by the standard deviation) and the length of time to maturity. Strengths of this
66 An automotive platform normally includes, inter alia: the under body; dashboard; exhaust system; heating, ventilating and cooling system; fuel storage; steering mechanism; brakes; engine and power train components; and the vehicle suspension. Based on the same platform, outwardly different products could be created.

108
approach include its recognition of the benefits of variability, which is normally downplayed in
discounted cash flow analysis (Boer, 1999).
Next we consider suggested valuation methodologies and best practices that could be used to
calculate the intrinsic value (per proposition A) of a technology. In some cases it would be more
practical to employ these models and methodologies directly to calculate the maximum price for
such an acquisition (per proposition A – consisting of the intrinsic value combined with the value
of M&A synergies).
Suggested methodology
The Technology Balance Methodology developed by the Fraunhofer Institute for Production
Technology
The Technology Balance Methodology facilitates the valuation of a single technology through an
estimation of its future cash flows over its entire lifecycle, incorporating the value of real-options
at key points in this cycle (Schuh et al., 2008).
The Technology Balance Methodology could be used to calculate the intrinsic value (per
proposition A) of a technology. It could furthermore be utilised to calculate the maximum price
for such a technology (per proposition A – consisting of the intrinsic value combined with the
synergy value). In the latter case, this methodology could incorporate the value of synergy from
various sources and is described infra, at the end of this section.
This methodology is labelled “suggested” and not “best practice”, as it is a relatively recent
development, without evidence of actual use. This methodology is based on the “expected cash
flow approach” that considers various scenarios with different outcome probabilities (Schuh et
al., 2008). The expected cash flow approach, in turn, forms part of the larger “value in use”
approach and was chosen by the Institute in order to comply with the approved valuation
categories of the IASB (Schuh et al., 2008). It is believed that this approach was chosen to
promote a wider application, but as the “value in use” approach is comparable to the concept of
intrinsic value (as discussed supra67), it should not reduce its worth or applicability in real-world
scenarios.
67 At section 2.6 under the heading: “Accounting concepts: Goodwill, ‘fair value less costs to sell’, ‘value in
use’ and net asset value”.

109
The overall concept of the Technology Balance Methodology is illustrated in Figure 5-3. This
methodology calculates the technology value in use (TVU) by considering three key
components and applies the following formula (Schuh et al., 2008:109):
TVU = TRF x ECF x PAF
Where:
TRF = Technology readiness factor
ECF = Expected cash flow
PAF = Prognosis adjustment factor
Schuh et al. (2008) describes this methodology: the methodology first specifies multiple
scenarios for the development and commercialisation phases of the technology, including an
allocated percentage probability for each scenario outcome. Within the development phase
there are normally several scenarios and these should incorporate the value of real-options that
are expected to be available. Scenarios for the commercialisation phase, in turn, are produced
taking cognisance of the following three aspects: technology utility, technology market size and
technology uniqueness. The various scenarios provide the necessary information about cash
inflows and outflows. These are weighted according to their probabilities and entered into an
expected cash flow model. In turn, the cash flows in the model are discounted to a present
value using a risk-adjusted discount rate calculated based on the Capital Asset Pricing Model
(this model was described supra, at section 2.9). Using these steps we determine a resulting
value, which is the expected cash flow (ECF). According to Schuh et al. (2008), the technology
readiness factor (TRF) varies between the figures of 0.1 and 1.0, and provides a weighting that
reflects the uncertainty inherent to the current stage of the technology’s lifecycle. Figure 5-4
illustrates this for a technology that is currently at the phase of lab testing. Accordingly, it
receives a factor of 0.4 for its technology readiness. Furthermore, Schuh et al. (2008) note that
the prognosis adjustment factor (PAF) is intended to incorporate the effects of previous
forecasting errors, where historical calculations of expected cash flow (ECF) did not realise as
projected. Schuh et al. (2008) add that the prognosis adjustment factor (PAF) should vary
around the figure of 1, but should reflect a figure below 1 where an over-estimation was made
before (Schuh et al., 2008). In reducing the factor below the figure of 1, a greater weight should
be allocated to estimations made in recent years. Finally, Schuh et al. (2008) describe how the
three factors could be combined and plotted in a graph. Schuh et al. (2008) illustrate in Figure
5-5 the typical curve progressions for calculations made yearly, for a technology that has
reached maturity. Figure 5-5 displays the following:

110
• The technology readiness factor (TRF) increases progressively towards technology
commercialisation (reporting period three) and then remains constant;
• The prognosis adjustment factor (PAF) increases progressively towards technology
commercialisation and then remains constant, as the estimations would be subject to
reduced uncertainties towards the later stages of the technology lifecycle;
• The expected cash flow (ECF) also increases towards the commercialisation phase of the
technology as this is where the financial benefits are first realised, but then starts its
gradual decline as the technology matures; and
• The technology value in use (TVU) reflects the product of the three components and, as
expected, closely matches the value of the expected cash flow after commercialisation. It
reflects a lower value in the earlier development phases, to reveal the effect of the greater
uncertainty then.
Note that Figure 5-5 shows three reporting periods (possibly years) between technology
principle and its early commercial phase. This time frame will in fact depend on the technology
in question and, in many cases, could be up to 6 years, or even 7 to 10 years as is often the
case in the pharmaceutical industry (Boer, 1999).
Although not specifically described by Schuh et al. (2008), in the case of an acquired
technology, the same methodology could be employed to quantify its intrinsic value (per
proposition A). Here the appraiser will have to look forward in time, relative to its existing phase
of development, to incorporate the components of technology readiness factor (TRF), expected
cash flow (ECF) and prognosis adjustment factor (PAF). The Technology Balance Methodology
could further be employed to determine the maximum price of acquiring an external technology
(per proposition A – consisting of the intrinsic value combined with the value of M&A synergies).
In this case, this methodology could be used in combination with other best and recommended
practices described supra, to incorporate the value of M&A synergy as follows:
• Incorporate the effect of the merger on expected cash flow (ECF) of the technology where
we expect:
o An increase in the expected cash inflow, or a reduction in expected cash outflow of each
scenario;
o A change in the probability outcome of each scenario;
o An increase in the value of real options available;
o A reduction in the discount rate (as described supra, at section 5.5.1.4).
• Incorporate the effect of the merger on the technology readiness factor (TRF). Here a
merger could decrease the time to commercialisation.

111
If an acquired technology will provide possible synergy benefits resulting from the diversification
of an acquirer’s existing research and development portfolio, these are best quantified using the
approach described infra, under the heading: The valuation of an acquired technology in the
context of an existing research and development portfolio, as described by Boer (1999).
Weaknesses of the Technology Balance Methodology include: highly subjective inputs,
sensitivity to changes in all variables, and the possibility of duplicating the risk probability
weightings in the expected cash flow and technology readiness factors. The effect of these
weaknesses could be limited, to an extent, through sensitivity analysis. Further technical
weakness include the assumption that the technology readiness factor could be estimated
simply by applying a linear scale to a more complex environment and the subjective estimation
of the prognosis adjustment factor for an entity with little prior experience (where it would be
estimated without basis). Its strengths lie in its ability to quantify an otherwise unknown asset by
merging several high-quality techniques.
Figure 5-3 Overall concept of the Technology Balance Methodology (Schuh et al., 2008)

112
Figure 5-4 Determination of the Technology Readiness Factor (Schuh et al., 2008)
Figure 5-5 Example curve progressions of the various components of Technology Value in Use
(Schuh et al., 2008)
Best practices
The valuation of a single technology utilising a Risk-Weighted Enterprise Model and the real-
options approach (incorporating Monte Carlo simulation), as described by Boer (1999)
Boer (1999) describes the valuation of a single technology being developed in-house, utilising
the following best practices: the Risk Weighted Enterprise Model and a real-options approach

113
(incorporating Monte Carlo simulation). These approaches could easily be adapted to determine
the value of a single acquired technology. As for the Technology Balance Methodology, the
appraiser will then have to look forward in time, relative to its existing phase of development, to
incorporate the necessary components. Likewise, as for the Technology Balance Methodology,
the Risk-Weighted Enterprise Model could be employed to quantify either a technology’s
intrinsic value (per proposition A), or the maximum price for such an acquisition (per proposition
A – consisting of the intrinsic value combined with the value of M&A synergies).
The Risk-Weighted Enterprise Model considers the development life cycle of a technology as
well as the possible results of successful commercialisation (Boer, 1999). Here the type of
technology has to be considered, including: product life cycles;68 technology substitution curves;
natural limits to the market size and market share; and declining growth rates due to saturation
in the market and declining competitive advantage (Boer, 1999). Taking cognisance of these
factors, the net present value of projected cash flows is determined using a discounted cash
flow approach. For this section we include an illustrative example compiled by Boer (1999) due
to its ability to expedite explanation of the elaborate process and because it neatly combines
many of the techniques mentioned throughout this dissertation. Table 5-4 shows the calculation
of possible net present values using illustrative figures (Boer, 1999:294). The bottom half of this
table displays the net present value of a single technology should it reach a specific stage in its
development, including three commercial scenarios (each with an increasing level of optimism).
According to the Risk-Weighted Enterprise Model, each scenario outcome is then weighted with
a probability (Boer, 1999). Table 5-5 shows such a calculation using an illustrative event tree
(Boer, 1999:295-296). Note that this table incorporates probabilities for the outcome of each
commercial scenario. Per Table 5-5, summing all the weighted net present values for all
scenarios (including the low, base and high commercial scenarios) provides a total figure of
$2.585 million,69 or $1.674 million for the base case scenario.
Boer (1999) underlines that high-quality results could be achieved by applying a real-options
approach. Here, Boer recommends the Black-Scholes theory as applied by Merck & Co. (this
was described supra, at section 2.11.4.). As a reminder, this approach implies the use of certain
proxies for the variables included in the Black-Scholes formula. Table 5-6 displays the
calculation of value using the real-options approach for the option to pursue this technology, for
68 According to Boer (1999), indicative life cycles for different products are: 2 years for software; 4 years for automobiles; 7 years for chemicals and aircraft; 10 years for pharmaceuticals; 12 years for communication systems; and 20 years for transport systems. 69 “Stage C” implies “conceptual”; “stage F” implies “feasibility”; “stage D” implies “development”; and “stage EC” implies “early development”.

114
the same illustrative figures contained in Tables 5-4 and 5-5 (assuming the base-case
scenario). Below we discuss some of the figures included in Table 5-6 (Boer, 1999:307-308):
• For the exercise price (“X”) – the investment to be made (in capital, working capital and
marketing) in order to enter the business at the end of year 8 (time “t”) equals $13.5 million;
plus the research and development cost incurred in-house (from conceptual project or from
the stage at which purchased70) throughout the period until year 8, equals $11.25 million (the
sum of negative outflows from Table 5-4);71 totalling $24.75 million in all;
• The present value of the exercise price, “PV(X)”, is calculated by discounting “X” to a present
value using a risk-free rate (in this case assumed to be 5.2 percent), to supply a present
value of $16.499 million.
• For the current stock price (“P”) – the present value of project cash flows equals $76.9 million
discounted at the company’s weighted average cost of capital (the base-case net present
value at year 8, per Table 5-4, rounded); plus the investment to be made equals $13.5 million
(to obtain the present value of the free cash flows from the project), totalling $90.376 million;
multiplied by the probability of success, equal to 10.4 percent (from Table 5-5, rounded);
totalling $9.402 million;
• For the volatility of the share – the standard deviation (“σ”) of biotechnology shares (normally
estimated between 0.4 and 0.6), in this example judged to be 0.5;
• For the length of time to maturity (“t”) – the period in which the technology is be deemed to
be competitive, judged for this example to be 8 years.
• N(D1) and N(D2) can be calculated using the NORMDIST function in Excel ®, as follows:
N(D1): <= NORMDIST(0.3095,0.3095/2,0.5,TRUE)>;
N(D2): <=NORMDIST(-1.1048,-1.1048/2,0.5,TRUE)>.
• The rest of the calculation is performed based on the guidelines supplied supra, at section
2.11.4., to supply a value of the option to develop a next-generation product equal to $3.622
million.
Note that the value using the real-options approach ($3.622 million per Table 5-6) is higher than
the value obtained using the Risk-Weighted Enterprise Model (equal to $1.674 million for the
base case per Table 5-5), as the real-option approach allocates more weight due to the effects
of variability (Boer, 1999). As discussed, the result of the real-options approach is sensitive to
inputs relating to volatility of the share (the standard deviation, “σ”) and the length of time to
70 The factor in italics would be for an acquired technology (not specific to this illustrative example). This factor is not discussed by Boer (1999), but deduced based on logical argument. 71 Here, Boer (1999) neglected to incorporate the time value of money for the research and development cost. (The future value of research and development cost at year 8 should have been calculated here for superior results.)

115
maturity (“t”). As such, Merck & Co. recommend sensitivity analysis, especially in these factors
(Boer, 1999).
An indication of the probability of success would be provided through Monte Carlo analysis, as
discussed supra, at section 2.11.3. Boer provides the output of such an analysis in Figure 5-6,
after calculating the internal rates of return for 30 000 trials by varying a few uncertain inputs.
Here the results indicate a high expected internal rate of return, with a mean of 26.7 percent,
but with a range of possible outcomes indicated by the standard deviation of 7.7 percent
(1999:297-298).
Table 5-4 Calculation of the net present value for a single technology throughout its life cycle
(illustrative values per Boer, 1999)

116
Table 5-5 Calculation of the weighted net present value of a single technology using the
Risk-Weighted Enterprise Model (illustrative values per Boer, 1999)
Probability Tree ($M) Kill after
Conceptual Stage (%)
Kill after Feasibility Stage (%)
Kill after Development
Stage (%)
Kill after Early Comm. Stage
(%)
Low Comm.
Case
Base Comm.
Case
High Comm.
Case
Total (%)
Probability Stage C 66.67 33.33 100 Stage F 66.67 16.67 16.67 100 Stage D 66.67 16.67 4.17 12.50 100 Stage EC 66.67 16.67 4.17 2.08 10.42 100 Commercial 66.67 16.67 4.17 2.08 2.60 5.21 2.60 100 NPV $(0.634) $(1.644) $(3.255) $(5.824) $3.218 $25.225 $82.204 Weighted NPV $(0.423) $(0.274) $(0.136) $(0.121) $0.084 $1.314 $2.141 $2.585
Memo: Base Case alone
$1.674
Table 5-6 Valuation of technology using the real-options approach
(Illustrative values per Boer, 1999)

117
Figure 5-6 Considering the probability of success for a technology using Monte Carlo analysis
(Boer, 1999)
The valuation of an acquired technology in the context of an existing research and development
portfolio, as described by Boer (1999)
The intrinsic value (per proposition A) of an acquired technology could best be quantified using
one of the techniques already described in this section. In the context of an existing research
and development portfolio, an acquired technology could lead to M&A synergy value (per
proposition A) due to the benefits of diversification and its effect on the new options created in
conjunction with the existing portfolio. New options could include the option of pairing
technologies and the option to accelerate another project thanks to the benefits of the newly
acquired technology. Diversification was already discussed supra, in this section.
118
Boer (1999) describes that the total portfolio value could be calculated as the sum of the net
present values of the following:
• New product projects. The value of these products is often determined by applying the
Risk-Weighted Enterprise Model (as described supra). The value of a portfolio will probably
consist of a large number of early-stage projects (with a relatively low net present value due
to the effects of time discounting and the lower probabilities of success) and a number of
later-stage projects with relatively higher net present values;
• Cost savings projects. Calculated based on a perpetuity formula if expected to recur
annually, or otherwise as a once-off benefit – appropriately discounted to a present value;
• Capital savings. Calculated based on a perpetuity formula if expected to recur annually, or
otherwise as a once-off benefit (such as a plant closure) – appropriately discounted to a
present value;
• Licensing activities. Calculated based on the present value of associated revenues and
costs (taking cognisance of licence expiration dates). Here we could include existing
developed technologies and patents that are not intended for commercialisation (due to
whatever reason). It would then be discounted to a present value and the probability of its
becoming a “licensable property” should be included here (352);
• Embedded options. Boer (1999) stresses that the value of the embedded options that exist
due to the interaction of all the research and development projects included in the portfolio
(and the interaction of an additional acquired technology) could have a significant value.
Results
Best practices in quantifying economies in innovative activities include the Risk-Weighted
Enterprise Model as described by Boer (1999) and the real-options approach (substituted by
Monte Carlo simulation). A further suggested methodology is the Technology Balance
Methodology as developed by the Fraunhofer Institute for Production Technology. These
practices are subject to several weaknesses, but the effect of these could be limited to an extent
through sensitivity analysis.
5.5.2.4 Non-recommended methods
Other methods have been identified and are sometimes used in practice, but do not represent
best practices due to inherent limitations. These methods are therefore best not used to quantify
synergy value in isolation, but may supplement the aforementioned best practices where
necessary.

119
These non-recommended methods include:
• To measure innovative output through patent counts, or the number of staff involved in
research and development, or even the amount of annual research and development
expenditure (Camesasca, 2000). Camesasca (2000) further explains that these methods
are limited since they assume a direct link between these factors and innovative outputs
(as opposed to only an indirect link), and they assume that the inputs are all
homogeneous in their effect.
• Eccles et al. (1999) recommends that revenue synergies should be quantified, but that it
should not be included in setting the maximum acquisition price. This was also the
actual practice followed by Morgan Stanley in quantifying the acquisition price for
AirTouch Communications (Vodafone, 2009). This approach could not be followed in all
cases, however, as an appraiser’s degree of certainty should determine if it is included
as part of the maximum bid price.
5.5.2.5 Overall Results
Best practices in quantifying revenue synergy value ex ante include the application of the
income approach to valuations, using a valuation model based on discounted cash flow (as
discussed supra, at section 2.7). Furthermore, when the appraiser makes use of a model based
on discounted cash flow, best practice dictates that the confidence level should be linked to the
number of best practices employed in the overall M&A transaction process (as discussed supra,
at section 2.10). As further described supra, in this section, the confidence level should further
be adjusted for the experience that revenue synergies are notoriously difficult to realise ex post
(Eccles et al., 1999).
Best practice in quantifying revenue synergy value further includes the application of an overall
structured approach that compares ex ante estimates to realities in the marketplace as
discussed supra, at 5.5.2.1. A suggested methodology in quantifying the value of revenue
synergy from market power ex ante, is to collectively consider the following factors:
• The main motivation or strategy behind the merger.
• If the merger is not mainly motivated by market power, but an impact is expected here,
then the degree of market power should be determined using measures such as the
Herfindahl-Hirschman Index and other indirect indicators of market power.
• The probability that merger control will allow the merger.
• The effect of an increase in market power on selling prices should be determined and
included in a valuation model based on discounted cash flow.

120
• Its effect on other synergies should be incorporated, specifically the lowering effect on
other synergies (e.g. managerial and innovative efficiency).
Best practices in quantifying economies in innovative activities include the Risk-Weighted
Enterprise Model as described by Boer (1999) and the real-options approach (substituted by
Monte Carlo simulation). A further suggested methodology is the Technology Balance
Methodology as developed by the Fraunhofer Institute for Production Technology. These
practices are subject to several weaknesses, but the effect of these could be limited to an extent
through sensitivity analysis.
5.5.3 Synergy value: cost of implementation
The literature provides examples of implementation costs. It further highlights that these costs
could be significant and warns that, in quantifying these ex ante, they are often understated
(McKinsey & Company, 2005). The cost of implementation is important, as it will reduce the
value of synergy.
McKinsey & Company (2005) highlight the following examples of implementation costs: the cost
to decommission a plant; severance cost of retrenched employees; the cost to retrain
employees; rebranding cost, when names are changed; integration cost of different information
technology systems; and the cost of integrating separate customer lists. Further costs could
include legal fees to comply with merger control regulations.
5.5.4 Confirming the reasonability of the quantified synergy value
The literature highlights the best practice, which is to confirm the reasonability of synergy value,
following its initial quantification ex ante, before committing any funds (McKinsey & Company,
2005; Sirower and Sahni, 2006).
Here, McKinsey & Company recommend the use of a “top-down approach” (2005:453).
(Sirower and Sahni recommend a similar approach in what is termed the “meet the premium
line” (2006:88-90).) The top-down approach represents a visual approach, which assumes a
discounted cash flow valuation model and implied perpetuity figures for growth and operating
margins to achieve certain values (McKinsey & Company, 2005). Based on these assumptions,
two graphs are prepared:
• First, a graph depicting the growth and margins implied in the fair market value and the
bid price (including the premium). On the one axis is indicated the growth and on the
other, the after-tax operating margin. Further indicated are plotted lines indicating the
121
combinations of growth and operating margins required to justify the fair market value
(the reference case) and next, the bid price (including premium); and
• Second, a graph depicting the required improvements over the reference case to justify
the bid premium. On the one axis is indicated the required increase in growth and on the
other, the required increase in margin.
The weakness of this approach is that it assumes that synergy value is the result of only
operating improvements. It also does not directly display the effect of implementation costs and
it assumes that the improvements will continue in perpetuity. These weaknesses could reduce
its usefulness in certain cases. However, in many cases, it should serve as a useful
reasonability test due to its simplicity and visual clarity.
5.6 Negotiating the final amount to be paid for synergy Negotiating the final amount to be paid for synergy treads the grey area between the economic
and human sciences. Within the restricted scope of this dissertation, we offer but limited
descriptions of the likely candidate for the role of negotiator and the main factors to be
considered in the negotiations. The impact of negotiation skills and related factors could have a
significant effect here, but should form part of separate research.
Relating to the candidate, KPMG (2001) recommends the appointment of a process manager
as the negotiator. According to KPMG’s description of the best practices to be applied in the
overall M&A transaction process, the process manager should not only be responsible for price
negotiation, but also be involved in the deal assessment (2001).
Factors to consider include Chatterjee’s call for the distribution of synergy gains according to
bargaining leverage afforded by each entity’s respective contribution of resources (1986). In a
technology context, Boer adds that when two technologies are brought together, the majority of
the value will “polarize” in the direction of dominance (1999:312). Here, dominance could be an
enabling technology or a dominant commercial position.

122
6. CONCLUSIONS AND AREAS FOR FUTURE RESEARCH
This research dissertation considered several research questions and reached conclusions that
are subject to the limitations of our research design. Given these limitations, we find that it is
possible for synergy to exist in M&As, but that it is a rare occurrence. Where synergy is
generated, we find that it mostly accrues to the shareholders of the selling companies,
principally due to the payment of large acquisition premiums by the buyer. We find that various
types of synergy could exist and that these could be grouped under the headings of cost and
revenue synergies. We find that the origins of synergy include efficiencies that, in turn, include:
economies of scale, economies of scope, managerial efficiencies, economies of the capital
market and economies in innovative activity. We find that other origins of synergy include:
savings in taxation benefits from integration to avoid governmental regulation, and benefits
obtained from market and political power. Here we urge the consideration of legislative and
ethical aspects separately, as these are beyond the scope of this dissertation. We further find
that there is no clear link between the relatedness of entities and value creation; merely that this
could indicate the potential for synergy to exist. We find that synergy could exist for entities
where an acquirer does not overpay for an acquisition, but that this would be probable only for
entities with a distinctive ability to operate the target entity due to the way in which the market
prices an asset. In turn, to prevent an acquirer from overpaying, we find that it is important that
synergy be quantified ex ante, preferably by following certain best practices. Related to the bid
price, we find sufficient verification for proposition A, which proposes that the bid price
(consisting of the fair market value of the target entity and a premium) should be less than the
sum of the target’s intrinsic value and the value of available synergies between the bidder and
target entities. The final price paid for synergy would be the result of negotiations, but factors to
be considered here include the bargaining power afforded by the contribution of resources by
each party and, in the case of technology, the direction of dominance – the latter indicated by
an enabling technology or a commanding commercial position.
Best practices used to quantify synergy value ex ante
Given the limitations of our research design, we identified separately the best practices to
quantify the value of cost synergy and revenue synergy ex ante.
Best practices to quantify the value of cost synergy ex ante, include the application of the
income approach to valuations and a valuation model based on discounted cash flow.
Furthermore, when the appraiser makes use of a model based on discounted cash flow, best

123
practice dictates that the confidence level should be linked to the number of best practices
employed in the overall M&A transaction process. Best practice here further includes the
application of an overall structured approach such as the “outside-in” approach, as described by
McKinsey & Company (2005), which initiates with an external picture of the larger industry
within which the companies operate and then moves inward, analysing the possible cost
synergies in detail. Economies of scale (an efficiency that could serve as the origin of cost
synergy) could be quantified using the best practice of an engineering approach. In many
cases, it is a best practice to perform a Monte Carlo simulation, in conjunction with the other
best practices, to indicate the likelihood of success and its impact on synergy value.
Furthermore, we find that best practices to quantify revenue synergies ex ante include similar
considerations to those of cost synergies, including the application of the income approach to
valuations, using a valuation model based on discounted cash flow. Likewise, when the
appraiser makes use of a model based on discounted cash flow, best practice dictates that the
confidence level should be linked to the number of best practices employed in the overall M&A
transaction process. For revenue synergies, the confidence level should specifically incorporate
the experience that revenue synergies are notoriously difficult to realise ex post. Best practice in
quantifying revenue synergy value further includes the application of an overall structured
approach that compares ex ante estimates to realities in the marketplace. Moreover, best
practices in quantifying economies in innovative activities include the Risk-Weighted Enterprise
Model as described by Boer (1999) and the real-options approach (supplemented by Monte
Carlo simulation).
Lastly, as part of best practices in quantifying synergy value, we find that it is important to
consider the cost of implementation, and to confirm the reasonability of the quantified synergy
value, before committing the funds.
Recommendations
Certain practices in quantifying synergy value ex ante do not represent best practices due to
limited proof of practical implementation, but these were evaluated and are recommended here,
where they were found to be sensible. Approaches that are recommended on this basis include
the guidelines formulated by Damodaran (2005) and the Fraunhofer Institute for Production
Technology (as described by Schuh et al., 2008). Damodaran (2005) described the
determination of synergy value through a two-step process: first, determine the intrinsic value of
the entities involved in the merger independently, by discounting the expected cash flows of
each firm using the WACC of that firm; and second, contrast it with the combined value of the

124
entities, by discounting the expected cash flows of the combined entity (including the effects of
synergy) with the adjusted WACC of the combined entity. Subject to the caveat below, we can
further recommend the Technology Balance Methodology as developed by the Fraunhofer
Institute for Production Technology, in quantifying the value of synergy from innovative activity
(as described by Schuh et al., 2008). This methodology is subject to a few weaknesses, but the
effect of these could be limited to an extent through the application of sensitivity analysis.
In cases where no best practices or other practices could be identified in the literature, we
formulated suggested approaches. A suggested approach to quantify the value of cost synergy
from taxation benefits ex ante is to make use of the services of a specialist in this field. A further
suggested approach, in this case to quantify the value of revenue synergy from market power
ex ante, is to include the increased selling prices in a discounted cash flow model, after
collectively considering several factors, including: whether the merger will be allowed by merger
control, the effects of market power (measured by the Herfindahl-Hirschman Index et al.) on
selling prices and the lowering effect of market power on other synergies.
Non-recommended practices
On the other hand, certain non-recommended practices are best avoided in quantifying synergy
value. These include: the application of a simplified method, whereby cost synergies are
quantified based on the assumption that superior performance (achieved by an entity prior to
the merger) will be duplicated by the weaker merging entity. Some of the non-recommended
practices could, however, supplement the aforementioned best practices where necessary.
Concluding remark
A questioning attitude by shareholders will prevent management from hiding unsound merger
proposals in a nebula labelled “synergy”. Synergy, quantified in detail before a merger takes
place, could be the key to a paradigm shift. This shift could change positions and the logic of
those positions: shareholders could then believe management’s promise of synergy, not
because of similitude to George Orwell’s political satire where they “would have to believe it”72,
but because they choose to.
We are therefore hopeful that the contribution made by the body of literature created in the past
45 years, including the small contribution made by this dissertation, would help cement the
“2 + 2 =5” effect [Ansoff, 1965:72]. 72 1949:225, page reference from the 1984 reprint – emphasis added.

125
Areas for future research
Because this dissertation is based on qualitative research, its limitations should again be
acknowledged before describing areas of fruitful future research. Future research could address
these limitations by testing empirically the best practices used in quantifying synergy value.
Here a comparison could be made between M&A synergy values realised ex post and values
quantified ex ante using either the best practices, recommended methods, or non-
recommended methods. A number of previous studies investigated the effect of relatedness in a
merger on market capitalisation, with inconsistent findings. Future research could add value by
investigating the effect of relatedness in a merger, specifically on intrinsic values.
A further research area that could be explored is best practices in quantifying synergy value ex
ante in the context of joint ventures, licensing agreements and contracts. Future research could
also add value through an explorative study of best practice parenting. Here investors are
increasingly demanding that companies demonstrate their superior parenting of subsidiaries.
Not only proper acquisitions, but also timely divestures, could ensure an appropriate parenting
portfolio, especially in cases where there is a change in strategy. Future research could
describe best practices in identifying the subsidiary to divest as well as guidelines on the
appropriate timing.
Future research could add further value by illustrating the best practices described in this
dissertation with the use of case studies or hypothetical examples.

126
APPENDICES
APPENDIX A – LITERATURE NETWORK
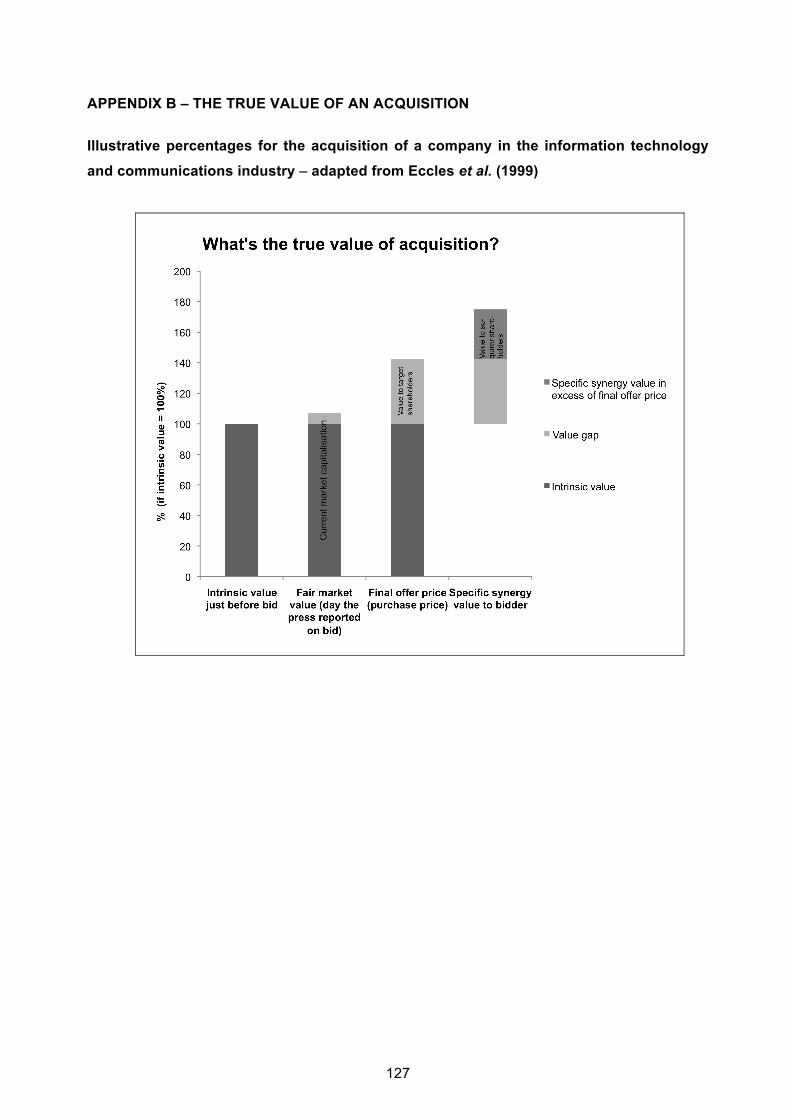
127
APPENDIX B – THE TRUE VALUE OF AN ACQUISITION
Illustrative percentages for the acquisition of a company in the information technology
and communications industry – adapted from Eccles et al. (1999)

128
APPENDIX C – THE LINK BETWEEN SYNERGIES INCREASING SHAREHOLDER VALUE, EFFICIENCIES CONSIDERED IN MERGER CONTROL AND OTHER REASONS FOR A MERGER Description of efficiency Considered as a rebuttal in
European merger regulation against an anti-competitive
merger? Reason?73
Can this
efficiency result in
synergy?74
Matters to consider in
quantifying synergy value ex
ante
Best practices and other
suggested methods to quantify synergy value ex ante (where
available)
1. Economies of scale in production,
resulting from:
• Elimination of duplicated fixed costs. Normally considered only where it
will result in a reduction in selling
prices75 (normally only when
attempting to prevent entry by
competitors). However, it tends to
be merger-specific, verifiable and
quantifiable.
Yes, mainly cost
synergy.
Consider the cost of integration.
Fairly easy to quantify.
Engineering estimate for the
proposed merger. (Discussed
supra, at 5.5.1.2).
• The merged entity moving closer to a
minimum efficient scale (MES76),
faster than the entities would have
achieved unilaterally.
Normally considered only where it
will result in a reduction in selling
prices. Only where the move to
MES will be achieved faster, will it
be merger-specific (a moderately
competitive firm is unlikely to
produce below MES for too long).
Yes, mainly cost
synergy.
Consider evidence on the MES of
the industry. Consider the cost of
integration. Consider the length of
time required to move to MES by
combined firm vs. the firms
unilaterally.
Engineering estimate for the
proposed merger; use Appendix D
as a reasonability test (as
discussed supra, at 5.5.1.2).
Supplement with evidence of
comparative performance of
different sized entities in the
industry. Consider a Monte Carlo
simulation to estimate value and /
or test the likelihood of success
73 According to De la Mano (2002) – unless stated otherwise. 74 As defined by Copeland and Weston (1983). 75 De la Mano (2002) argues that a reduction in variable cost will normally reduce selling prices in the short term, whereas a reduction in fixed costs will occasionally reduce selling prices but only in the long term. 76 Apologia: in order to ease readability, in this table we make use of the informal acronym “MES”.

129
Description of efficiency Considered as a rebuttal in
European merger regulation against an anti-competitive
merger? Reason?73
Can this
efficiency result in
synergy?74
Matters to consider in
quantifying synergy value ex
ante
Best practices and other
suggested methods to quantify synergy value ex ante (where
available)
(as discussed supra, at 5.5.1.3).
• Other causes. Normally not considered, as they
will normally not better the welfare
of consumers, or they are not
merger-specific, or not verifiable, or
not readily quantifiable.
Often not.
2. Economies of scale areas other than in
production, resulting from:
• Elimination of duplicated fixed costs Normally considered only where it
will result in a reduction in selling
prices (normally only when
attempting to prevent entry by
competitors). However, it tends to
be merger-specific, verifiable and
quantifiable.
Yes, mainly cost
synergy.
Consider the cost of integration.
• Management, distribution and
marketing expenses spread over a
greater output
Normally considered only where
substantial – normally difficult to
quantify. Savings that represent
merely a transfer of wealth
(pecuniary efficiencies) are not
considered e.g. as advertising
entities often have discriminatory
pricing there is a wealth transfer
from advertising entities to a larger
merged firm, with higher advertising
Yes, mainly cost
synergy.
(Pecuniary
efficiencies will
also represent
synergy here.)
Consider the implementation cost,
e.g. in cases of a name change,
the cost of rebranding.
When including these expenses in
a discounted cash flow model, the
projection of future revenues in
this model will pose the greatest
challenge.
Should be incorporated as part of
a discounted cash flow model, by
classifying these expenses as
either fixed or variable
expenditure.

130
Description of efficiency Considered as a rebuttal in
European merger regulation against an anti-competitive
merger? Reason?73
Can this
efficiency result in
synergy?74
Matters to consider in
quantifying synergy value ex
ante
Best practices and other
suggested methods to quantify synergy value ex ante (where
available)
volume (as it receives more
discount) (Camesasca, 2000).
3. Economies of scope Normally considered, unless when
motivated by market power or to
avoid taxes, etc. Tend to be merger-
specific and lower prices to the
benefit of consumers in the short
term. In cases where products are
technically complementary, it is
relatively easy to verify.
Yes, mainly cost
synergy. (Market
power will result
in revenue
synergy.)
Consider the costs of vertical
integration, such as greater legal
fees to comply with merger control
regulations.
4. Managerial efficiencies Often not, for the argument regularly
stands that managerial skill is
difficult to measure and is liberally
available through contract.
Yes, mainly cost
synergy (but
rare).
Compare to industry efficiency
benchmarks. Managerial
efficiency is often available to
other potential bidders and thus
often fully paid for, leaving no or a
small benefit to the acquirer.
Consider implementation cost
(e.g. severance cost for
retrenched employees, cost of
retraining staff and integration
cost of different information
technology systems).
5. Economies of the capital market Only in cases where a merger leads
to access to new, less costly
possibilities in raising capital and
Yes mainly cost
synergy
(financial
Financial synergy will have a low
total value at best and the bidder
should be careful not to include
A suggested method (by
Damodaran, 2005) as discussed
supra, at section 5.5.1.4) is to

131
Description of efficiency Considered as a rebuttal in
European merger regulation against an anti-competitive
merger? Reason?73
Can this
efficiency result in
synergy?74
Matters to consider in
quantifying synergy value ex
ante
Best practices and other
suggested methods to quantify synergy value ex ante (where
available)
the merged entity’s demand for
capital increases. If the demand
does not increase, it represents
merely a pecuniary transfer of
wealth from the creditors to the
merged entity.
synergy).
(Pecuniary
efficiencies will
also represent
synergy here.)
too great a proportion in the bid
price as they normally contribute
most of the benefits leading to
financial synergy. Consider the
impact of an acquisition also on
the acquirer’s credit risk.
calculate an adjusted WACC for
the combined entity to incorporate
the value of financial synergy, and
then to apply a valuation method
as described supra, at 5.5.1.1.
Here, the WACC could reduce
due to the effect of the merger on
inter alia the small-stock premium
and cost of debt.
6. Economies in innovative activity Considered normally in industries
with a short lifespan, high-
technology and a rapid expanding
demand, as these have the large
potential for economies here and
limit the danger of monopoly power.
Very difficult to verify, however, thus
evaluation normally based on “an
educated guess, [offered] on a
case-by-case basis” (De la Mano,
2002:17). Independent sources are
to confirm claims.
Yes, revenue
and cost
synergy.
Elimination of duplicated fixed
cost could be quantified easily;
other synergies here are subject
to a large degree of uncertainty.
Consider cost of integration.
Best practices include the Risk-
Weighted Enterprise Model as
described by Boer (1999) and the
real-options approach
(complimented by Monte Carlo
simulation) as discussed supra, at
5.5.2.3. A further suggested
methodology that could be applied
here is the Technology Balance
Methodology as developed by the
Fraunhofer Institute for Production
Technology.

132
Other reasons for a merger Considered as a rebuttal in
European merger regulation?
Reason?77
Can this result in synergy?78
Matters to consider in quantifying synergy value ex
ante
Suggested methods to quantify synergy value ex ante (where
available)
1. Savings in taxation Never considered. Even though it
could be privately profitable, it
merely redistributes gains.
Yes, mainly cost
synergy.
The legality and ethical facets of
this origin of synergy should be
considered in detail.
The use of a specialist to quantify
the value of taxation benefits.
2. Integration to avoid governmental
regulation
Never considered. Even though it
could be privately profitable, it
merely redistributes gains.
Yes, cost or
revenue
synergy.
The legality and ethical facets of
this origin of synergy should be
considered in detail.
3. Market or political power Never considered. Even though it
could be privately profitable, it
merely redistributes gains.
Yes, mainly
revenue
synergy.
The legality and ethical facets of
this origin of synergy should be
considered in detail. Further
consider the lowering effect on
other synergies (e.g. from a
decrease in managerial efficiency
and a reduction in innovative
efficiency).
As discussed supra, at 5.5.2.2,
consider if M&A will be allowed by
merger control. If so, consider the
effects of market power
(measured by the Herfindahl-
Hirschman Index et al.) on selling
prices. Incorporate in a discounted
cash flow model.
77 According to De la Mano (2002). 78 As defined by Copeland and Weston (1983).

133
APPENDIX D – ECONOMIES OF SCALE AVAILABLE TO AN ENTITY (PRATTEN, 1988) Summary of economies of scale available per branch of European manufacturing industry, indicated by the cost gradient at half the minimum efficient scale (“MES”)79
79 As intended by Pratten (1988), the percentage indicated under the cost gradient in the table is to be interpreted as the expected percentage savings in long-run average cost per unit as a firm moves from production at half the minimum efficient scale (MES) to full MES.

134
LIST OF REFERENCES
Albo, W.P. and Henderson, A.R. 1989. Mergers & acquisitions of privately-held businesses. Second edition. Ontario: Canadian Institute of Chartered Accountants.
Ansoff, I.H. 1957. ‘Strategies for Diversification’, Harvard Business Review, 35: 113-124. Ansoff, I.H. 1965. Corporate Strategy. New York: McGraw-Hill. Black, F. and Scholes, M. 1973. ‘The pricing of options and corporate liabilities’, The Journal
of Political Economy, 81(3): 637-654.
Boer, F.P. 1999. The valuation of technology: Business and financial issues in R&D. New York: John Wiley & Sons, Inc.
Bradley, M., Desai, A. & Kim E., H. 1988. ‘Synergistic gains from corporate acquisitions and their division between the stockholders of target and acquiring firms’, Journal of Financial Economics, 21(1): 3-40.
Camesasca, P.D. 2000. European merger control: getting the efficiencies right. Erasmus
University Rotterdam. Groningen: Intersentia – Hart.
Capron, L. 1999. 'The long-term performance of horizontal acquisitions', Strategic Management Journal, 20(11): 987-1018.
Chatterjee, S. 1986. ‘Types of synergy and economic value: The impact of acquisitions on
merging and rival firms’, Strategic Management Journal, 7(2): 119-139.
Chatterjee, S. 1992. ‘Sources of value in takeovers: Synergy or restructuring – implications for target and bidder firms’, Strategic Management Journal, 13(4): 267-286.
Chua, W.F. 1986. ‘Radical developments in accounting thought’, Accounting Review, 61: 601-632.
Copeland, T. and Weston, J.F. 1983. Financial theory and corporate policy. Reading:
Addison-Wesley. Damodaran, A. 2005. ‘The value of synergy’. Stern School of Business working paper.
Unpublished. De la Mano, M. 2002. Enterprise Papers No. 11 – For the customer’s sake: the competitive
effects of efficiencies in European merger control. Luxembourg: Office for Official Publications of the European Communities.
Devine, M. 2002. Successful mergers. St. Edmunds: The Economist. Eccles, G.E., Lanes, K.L. & Wilson, T.C. 1999. ‘Are you paying too much for that acquisition?’,
Harvard Business Review, 77: 136-146. Evans, F.C. and Bishop, D.M. 2001. Valuation for M&A: building value in private companies.
New York: John Wiley & Sons, Inc.

135
Farrell, J. and Shapiro, C. 1990. ‘Horizontal mergers: an equilibrium analysis’, American
Economic Review, 80: 107-126. Farrell, J. and Shapiro, C. 2001. ‘Scale economies and synergies in horizontal merger
analysis’, Antitrust Law Journal, 68(3): 685-710. Financial Accounting Standards Board (FASB). 2001. Statement of Financial Accounting
Standards 141 Business Combinations (SFAS 141). Norwalk: Financial Accounting Standards Board.
Forbes. 2006. Year of the deal. [Online.] United States: Forbes.com. Available from:
<http://www.forbes.com/2006/11/17/mergers-lbos-deals-biz_cx_lm_1117deals.html> [Accessed 4 November 2008].
FTSE International Limited. 2008. Index rules. [Online.] London: FTSE Group. Available from:
<http://www.ftse.com/Indices/FTSE_Japan_Index/Index_Rules/index.jsp> [Accessed 10 November 2008]. Gaughan, P.A. 2007. Mergers, acquisitions, and corporate restructurings. Fourth edition. New
Jersey: John Wiley & Sons, Inc. Ghemawat, P. 1985. ‘Building strategy on the experience curve’, Harvard Business Review,
63: 143-149. Gupta, D. and Gerchak, Y. 2002. ‘Quantifying operational synergies in a merger / acquisition’,
Management Science, 48(4): 517-533. Hertz, D.B. 1964. ‘Risk analysis in capital investment’, Harvard Business Review, 42(1): 95-
106. Hesse, M. 1974. Models and analogies in science. London: Sheed and Ward.
Hesse, M. 1980. Revolutions and reconstructions in the philosophy of science. Brighton: Harvester Press.
Hirsch, J. E. 2005. ‘An index to quantify an individual's scientific research output’, Proceedings
of the National Academy of Sciences, 102 (46): 16569–16572. Hochn, T., Langenfeld, J., Meschi, M. & Waverman, L. 1999. Research paper 17: Quantitative
techniques in competition analysis. London: Office of Fair Trading.
Hopper, T. and Powell, A. 1995. ‘Making sense of research into organisational and social aspects of management accounting: a review of its underlying assumptions’, Journal of Management Studies, 22(5): 429-465.
Hubbard, D.W. 2007. How to measure anything – finding the value of “intangibles” in
business. New York: John Wiley & Sons, Inc. Hutchison, T.W. 2010. Marginalist economics. [Online.] New York: Wiley-Blackwell. Available
on a subscription basis from: <http://www.blackwellreference.com> [Accessed 6 June 2010].

136
International Accounting Standards Board (IASB). 1989. Framework for the preparation and presentation of financial statements. London: International Accounting Standards Board.
International Accounting Standards Board (IASB). 2009a. Exposure Draft ED/2009/5 Fair value measurement. London: International Accounting Standards Board.
International Accounting Standards Board (IASB). 2009b. International Accounting Standard 36 Impairment of assets (IAS36). London: International Accounting Standards Board.
International Accounting Standards Board (IASB). 2009c. International Accounting Standard 38 Intangible assets (IAS38). London: International Accounting Standards Board.
International Accounting Standards Board (IASB). 2009d. International Financial Reporting Standard 3 Business Combinations (IFRS3). London: International Accounting Standards Board.
International Valuation Standards Committee (IVSC). 2007. Valuation under International Financial Reporting Standards. London: International Valuation Standards Committee.
Jensen, M.C. 1986. ‘Agency costs of free cash flow, corporate finance, and takeovers’, The American Economic Review, 76(2): 323-329.
Jensen, M.C. 1988. ‘Takeovers: their causes and consequences’, The Journal of Economic
Perspectives, 2(1): 21-48. King, A.M. 2006. Fair value for financial reporting: Meeting the new FASB requirements. New
Jersey: John Wiley and Sons, Inc. Kode, G., Ford, J. & Sutherland, M. 2003. ‘A conceptual model for evaluation of synergies in
mergers and acquisitions: A critical review of the literature’, South African Journal of Business Management, 34(1): 27-38.
KPMG. 2001. World class transactions – insights into creating shareholder value through mergers and acquisitions. London: KPMG International.
Linn, S. and Rozeff, M. 1985. ‘The effects of voluntary spinoffs on stock prices: The anergy
hypothesis’, Advances in Financial Planning and Forecasting, 1: 265-291.
Lintner, J. 1965. ‘Security prices, risk and maximal gains from diversification’, Journal of Finance, 20: 587-615.
Lubatkin, M. 1987. ‘Merger strategies and stockholder value’, Strategic Management Journal,
8(1): 39-53. Markowitz, H. 1952. ‘Portfolio selection’, Journal of Finance, 7(1): 77-91. McAuliffe, R. E. 2010a. Law of variable proportions. [Online.] New York: Wiley-Blackwell.
Available on a subscription basis from: <http://www.blackwellreference.com> [Accessed 6 June 2010].
McAuliffe, R. E. 2010b. Long run cost curves. [Online.] New York: Wiley-Blackwell. Available
on a subscription basis from: <http://www.blackwellreference.com> [Accessed 29 January 2010].

137
McKinsey & Company Inc. 2005. Valuation – measuring and managing the value of
companies. Fourth Edition. New Jersey: John Wiley & Sons, Inc. Miller, M. and Modigliani, F. 1958. ‘The cost of capital, corporation finance and the theory of
investment’, The American Economic Review, 48(3): 261-297.
Miller, M. and Modigliani, F. 1961. ‘Dividend policy, growth and the valuation of shares’, Journal of Business, 34(4): 411-433.
Mossin, J. 1966. ‘Equilibrium in capital asset markets’, Econometrica, 34(4): 468-783. New Oxford American Dictionary, Second Edition. 2005. Oxford University Press. Available
electronically through Apple Dictionary Software Version 2.0.1 (51.1). (Copyright Apple Inc.) Orwell G. 1949. Nineteen Eighty-Four. Oxford: Clarendon Press. Porter, M. 1980. Competitive strategy. New York: Free Press. PricewaterhouseCoopers. 2008. Valuation methodology survey 2007/08 edition.
Johannesburg: PricewaterhouseCoopers.
Prahalad, C.K. and Bettis, R.A. 1986. ‘The dominant logic: a new linkage between diversity and performance’, Strategic Management Journal, 7: 485-501.
Pratten, C.F. 1988. Economic Papers No. 67: A survey of the economies of scale. European Commission. Luxembourg: Office for Official Publications of the European Communities.
RBB Economics. 2005. The efficiency-enhancing effects of non-horizontal mergers.
Luxembourg: Office for Official Publications of the European Communities. Rumelt, R.P. 1974. Strategy, structure and economic performance. Cambridge: Harvard
University Press. Ryan, B. Scapens, R.W. & Theobald, M. 2002. Research method & methodology in finance
and accounting. Second edition. Cornwall: Thomson. Salter, M. S. and W. A. Weinhold. 1979. Diversification through acquisition: strategies for
creating economic Value. New York: Free Press. Schuh, G., Klapper, S. & Haag, C. 2008. Technology valuation according to IASB’s value in
use approach. Management of technology innovation and value creation – selected papers from the 16th International Conference on Management of Technology. London: World Scientific Publishing Co.
Seth, A. 1990. ‘Value creation in acquisitions: A re-examination of performance issues’,
Strategic Management Journal, 11(2): 99-115. Seth, A., Song, K.P. & Pettit, R. 2000. ‘Synergy, managerialism or hubris? An empirical
examination of motives for foreign acquisitions of U.S. firms’, Journal of International Business Studies, 31(3): 387-405.
138
Sharpe, W.F. 1964. ‘Capital asset prices: a theory of market equilibrium under conditions of risk’, Journal of Finance, 19(3): 425-442.
Shelton, L.M. 1988. ‘Strategic business fits and corporate acquisition: empirical evidence’,
Strategic Management Journal, 9(3): 279-287. Singh and Montgomery, 1987. ‘Corporate acquisition strategies and economic performance’,
Strategic Management Journal, 8(4): 377-386. Sirower, M.L. 1997. The synergy trap: how companies lose the acquisition game. New York:
The Free Press. Sirower, M.L and Sahni, S. 2006. ‘Avoiding the “synergy trap”: Practical guidance on M&A
decisions for CEOs and boards’, Journal of Applied Corporate Finance, 18(3): 83-95.
South African National Treasury. 2010. Schedule of domestic government bonds as at 31 December 2009. [Online.] Pretoria: South African National Treasury. Available from: <http://www.treasury.gov.za/divisions/alm/2009/default.aspx> [Accessed 10 March 2010].
Standard & Poor’s. 2010a. Meaning of credit rating opinions. [Online.] New York: Standard &
Poor’s. Available from: <http://www.standardandpoors.com/ratings/definitions-and-faqs/en/us> [Accessed 8 March 2010].
Standard & Poor’s. 2010b. Rating methodology: evaluating the issuer. [Online.] New York:
Standard & Poor’s. Available from: <http://www2.standardandpoors.com/spf/pdf/ fixedincome/methodology.pdf> [Accessed 8 March 2010]. Szwejczewski, M. 2008. Best practice. [Online.] New York: Wiley-Blackwell. Available on a
subscription basis from: <http://www.blackwellreference.com> [Accessed 13 November 2008].
The Economist, 2008. Economics A – Z. [Online.] London: The Economist. Available from:
<http://www.economist.com/research/economics/> [Accessed 10 November 2008].
The Nobel Foundation. 1997. Additional background material on the Bank of Sweden Prize in Economic Sciences in Memory of Alfred Nobel 1997. [Online.] Stockholm: The Nobel Foundation. Available from: <http://nobelprize.org/nobel_prizes/economics/laureates/
1997/back.html> [Accessed 30 March 2010]. The Nobel Foundation. No date. Nomination facts. [Online.] Stockholm: The Nobel
Foundation. Available from: <http://nobelprize.org/nomination/nomination_facts.html> [Accessed 30 March 2010].
The United States Department of Justice. No date. The Herfindahl-Hirschman Index. [Online.]
Washington: The United States Department of Justice. Available from: <http://justice.gov/ atr/public/testimony/hhi.htm> [Accessed 23 March 2010]. Thomson Reuters. 2006. Yield spread over U.S. Treasuries by Bond rating, March 2006.
[Online.] New York: Thomson Reuters. Available from: <http://www.bondsonline.com/Todays_Market/Corporate_Bond_Spreads.php> [Accessed 17 March 2010].
139
Thomson Reuters. 2008. Journal selection. [Online.] New York: Thomson Reuters. Available
from <http://thomsonreuters.com/business_units/scientific/free/essays/journalselection/> [Accessed 17 October 2008].
Thomson Reuters. 2010. ISI Web of Knowledge. [Online.] New York: Thomson Reuters.
Available on a subscription basis from: <http://www.isiwebofknowledge.com/> [Accessed 3 July 2008 and 12 January 2010].
Van Putten, A.B. and MacMillan, I.C. 2004. ‘Making real options really work’, Harvard
Business Review, 82(12): 134-141. Vodafone. 2009. AirTouch FAQs. [Online.] Berkshire: Vodafone Group. Available from:
<http://www.vodafone.com/start/investor_relations/shareholder_services/faq/airtouch.html> [Accessed 7 September 2009].
Walker, R. 1985. Applied qualitative research. Hants: Gower. Welch, J. and Welch, S. 2006. Six sins of M&A. [Online.] New York: Bloomberg. Available
from: <http://www.businessweek.com> [Accessed 23 October 2008].