Embed Size (px)
Citation preview

Quantifying lost sales from shelf out of stockQuantifying lost sales from shelf out-of-stock in fashion & apparel retail stores
L.Scarabotti, C.Battista, D. Falsini, M.M.Schiraldi
Department of Enterprise Engineering, «Tor Vergata» University of Rome, Italy
XVI Summer School “Francesco Turco” – 2011Padova, September 14-16, 2011

Quantifying lost sales from shelf Out-Of-Stock in fashion & apparel retail stores
• What’s Out-Of-Stock ? (OOS)• The OOS problem and consumers answer
ContextAnalysis pAnalysis
• Proposed approach and model hypotheses• A procedure for quantifying OOS in apparel retail stores
Model Proposal
• Validation on a industrial case: data analysisR lt i d f t h
Results and• Results, open issue and future researchConclusions
L.Scarabotti - "Tor Vergata” University of Rome Abano Terme (Padova, Italy) – 09/14-16/2011 2
Let’s analyse the OOS causes…
• OOS in fashion & apparel retail stores derives from somestores derives from some specific causes
• Only few expert can reallyOnly few expert can really understand the phenomenon…
• Women can ! Easily ☺
L.Scarabotti - "Tor Vergata” University of Rome Abano Terme (Padova, Italy) – 09/14-16/2011 3
What’s OOS ?
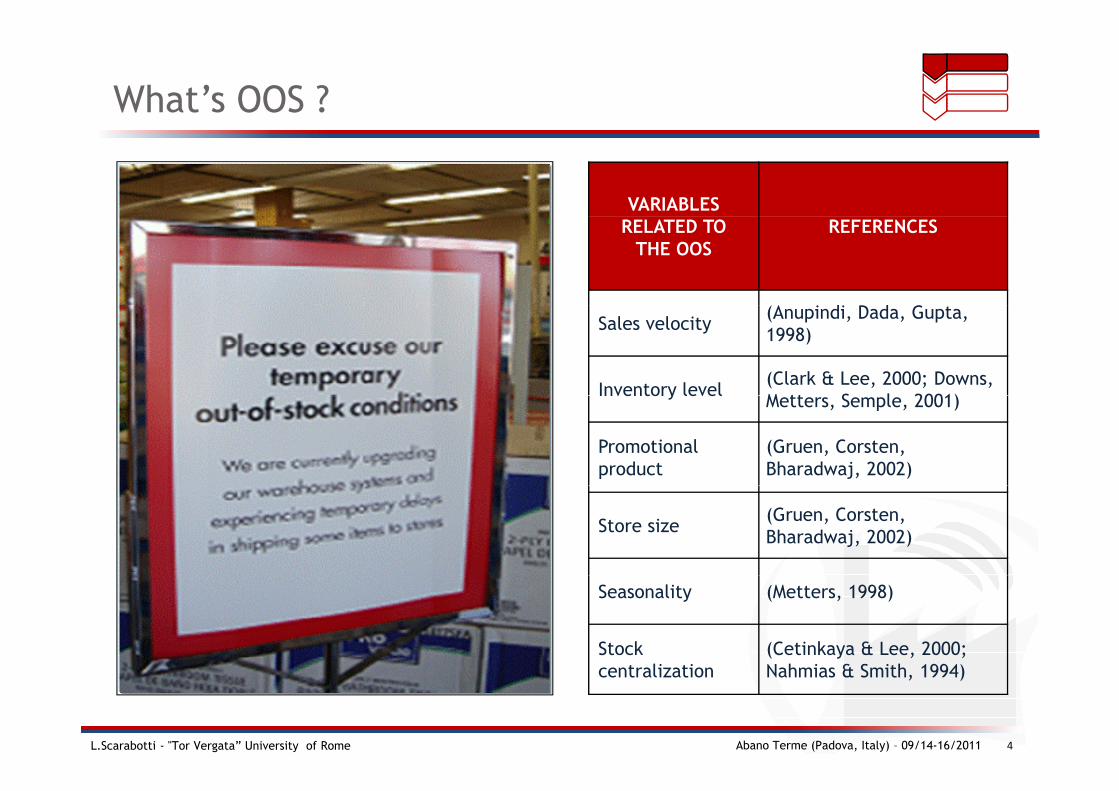
VARIABLES RELATED TO
THE OOSREFERENCES
(A i di D d GSales velocity (Anupindi, Dada, Gupta, 1998)
Inventory level (Clark & Lee, 2000; Downs, M tt S l 2001)Inventory level Metters, Semple, 2001)
Promotional product
(Gruen, Corsten, Bharadwaj, 2002)
Store size (Gruen, Corsten, Bharadwaj, 2002)
Seasonality (Metters, 1998)
Stock t li ti
(Cetinkaya & Lee, 2000; N h i & S ith 1994)
L.Scarabotti - "Tor Vergata” University of Rome Abano Terme (Padova, Italy) – 09/14-16/2011 4
centralization Nahmias & Smith, 1994)
The OOS problem and consumers answer
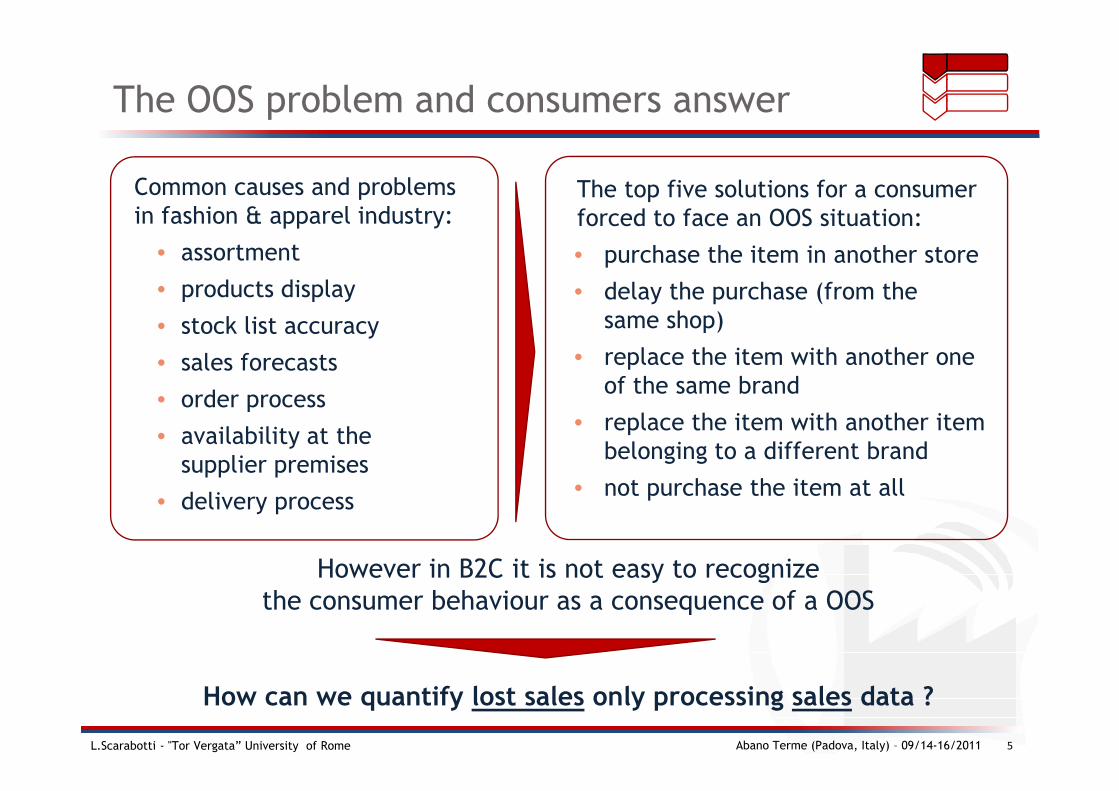
The top five solutions for a consumer forced to face an OOS situation:
Common causes and problemsin fashion & apparel industry: forced to face an OOS situation:
• purchase the item in another store
• delay the purchase (from the
in fashion & apparel industry:
• assortment
• products displaysame shop)
• replace the item with another one of the same brand
• stock list accuracy
• sales forecasts
order process• replace the item with another item
belonging to a different brand
• not purchase the item at all
• order process
• availability at the supplier premises
However in B2C it is not easy to recognize
• not purchase the item at all• delivery process
However in B2C it is not easy to recognizethe consumer behaviour as a consequence of a OOS
L.Scarabotti - "Tor Vergata” University of Rome Abano Terme (Padova, Italy) – 09/14-16/2011 5
How can we quantify lost sales only processing sales data ?

Quantifying lost sales from shelf Out-Of-Stock in fashion & apparel retail stores
• What’s Out-Of-Stock ? (OOS)• The OOS problem and consumers answer
ContextAnalysis pAnalysis
• Proposed approach and model hypotheses• A procedure for quantifying OOS in apparel retail stores
Model Proposal
• Validation on a industrial case: data analysisR lt i d f t h
Results and• Results, open issue and future researchConclusions
L.Scarabotti - "Tor Vergata” University of Rome Abano Terme (Padova, Italy) – 09/14-16/2011 6

The proposed approach
• It is easy to identify a lost sale for OOS if it occurred between two successive replenishmentssuccessive replenishments
ze 25INVENTORY BUILD-UP DIAGRAM FOR ITEM XXX
Stoc
k si
z
10
15
20
25
LOT SIZE
Time0
5
STOCKOUT(i i i )(in quantities)
STOCKOUT(in days)
ESTIMATED LOT COVERAGE
Considering just the OOS occurred between two successive reorders, the depletion of a product before the next replenishment cannot be
L.Scarabotti - "Tor Vergata” University of Rome Abano Terme (Padova, Italy) – 09/14-16/2011 7
p p pregarded as a strategic or a marketing choice, but as a mere logistics inefficiency
The proposed approach
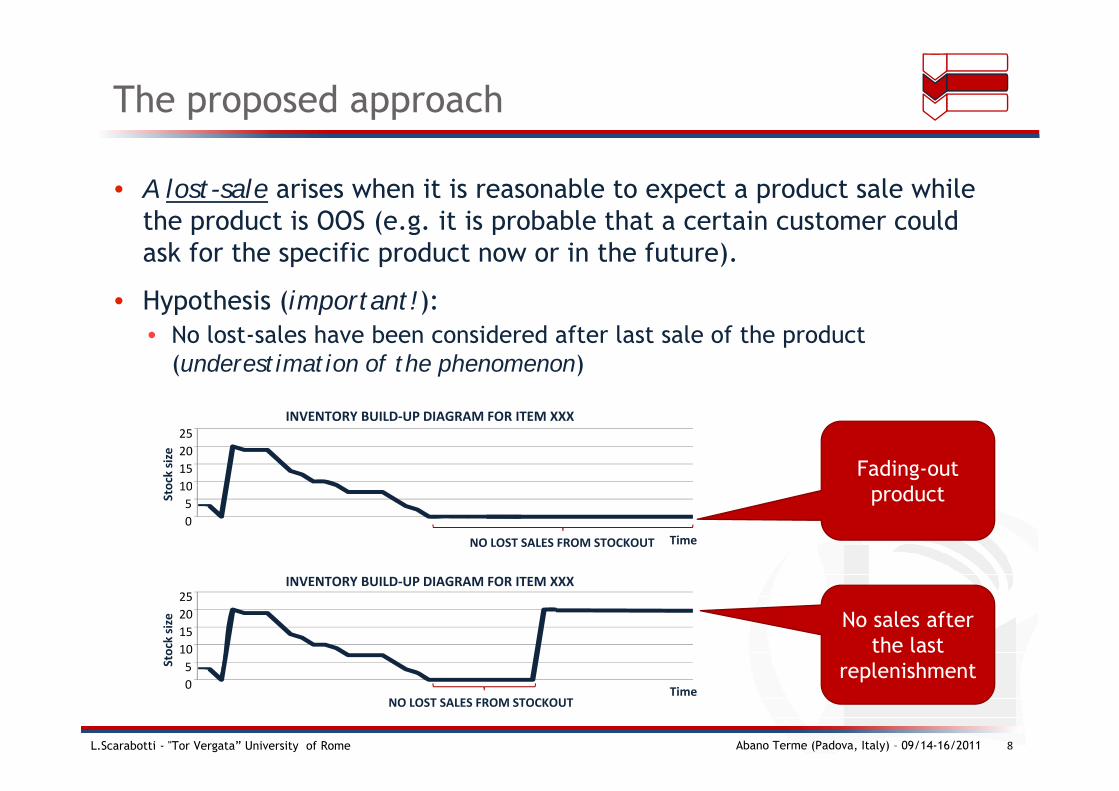
• A lost-sale arises when it is reasonable to expect a product sale while the product is OOS (e g it is probable that a certain customer couldthe product is OOS (e.g. it is probable that a certain customer could ask for the specific product now or in the future).
• Hypothesis (important!):Hypothesis (important!): • No lost-sales have been considered after last sale of the product
(underestimation of the phenomenon)
ock
size
10152025
INVENTORY BUILD-UP DIAGRAM FOR ITEM XXX
Fading-out
NO LOST SALES FROM STOCKOUT
0Time
Sto
510 product
Stoc
k si
ze
510152025
INVENTORY BUILD-UP DIAGRAM FOR ITEM XXX
No sales afterthe last l i h t
L.Scarabotti - "Tor Vergata” University of Rome Abano Terme (Padova, Italy) – 09/14-16/2011 8
NO LOST SALES FROM STOCKOUT0
S
Time
5 replenishment
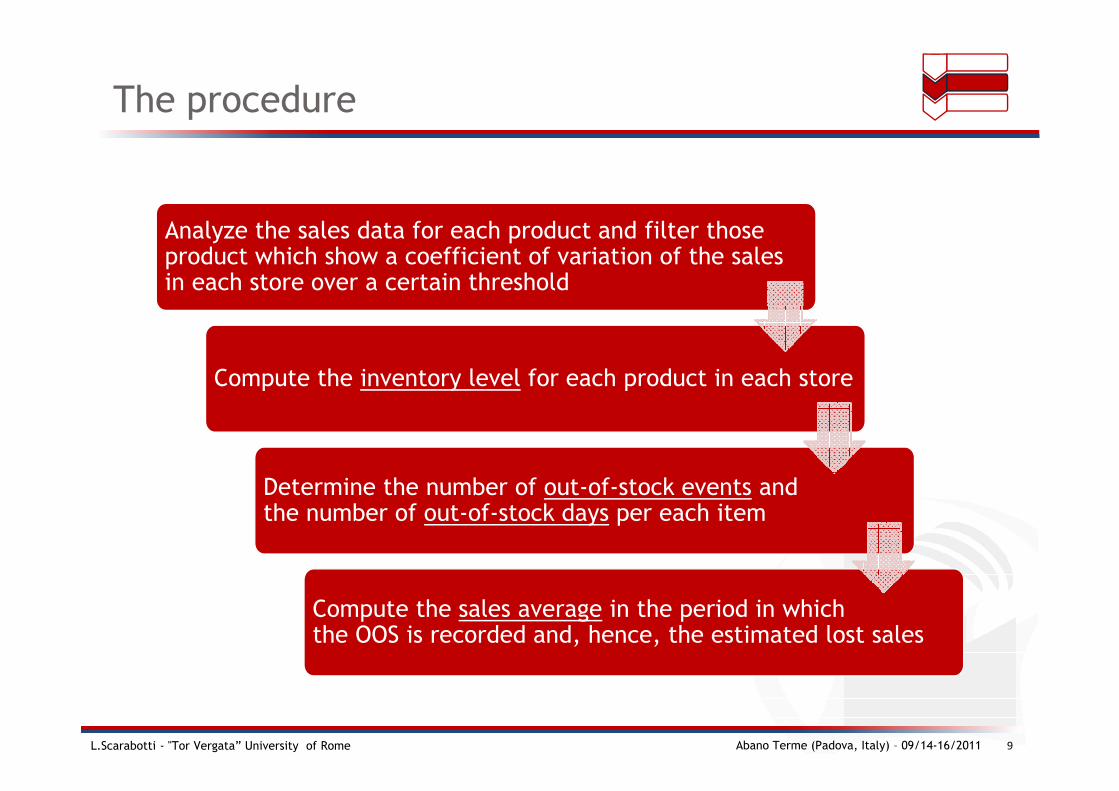
The procedure
Analyze the sales data for each product and filter those product which show a coefficient of variation of the sales in each store over a certain threshold
Compute the inventory level for each product in each store
Determine the number of out of stock events andDetermine the number of out-of-stock events and the number of out-of-stock days per each item
Compute the sales average in the period in which the OOS is recorded and, hence, the estimated lost sales
L.Scarabotti - "Tor Vergata” University of Rome Abano Terme (Padova, Italy) – 09/14-16/2011 9
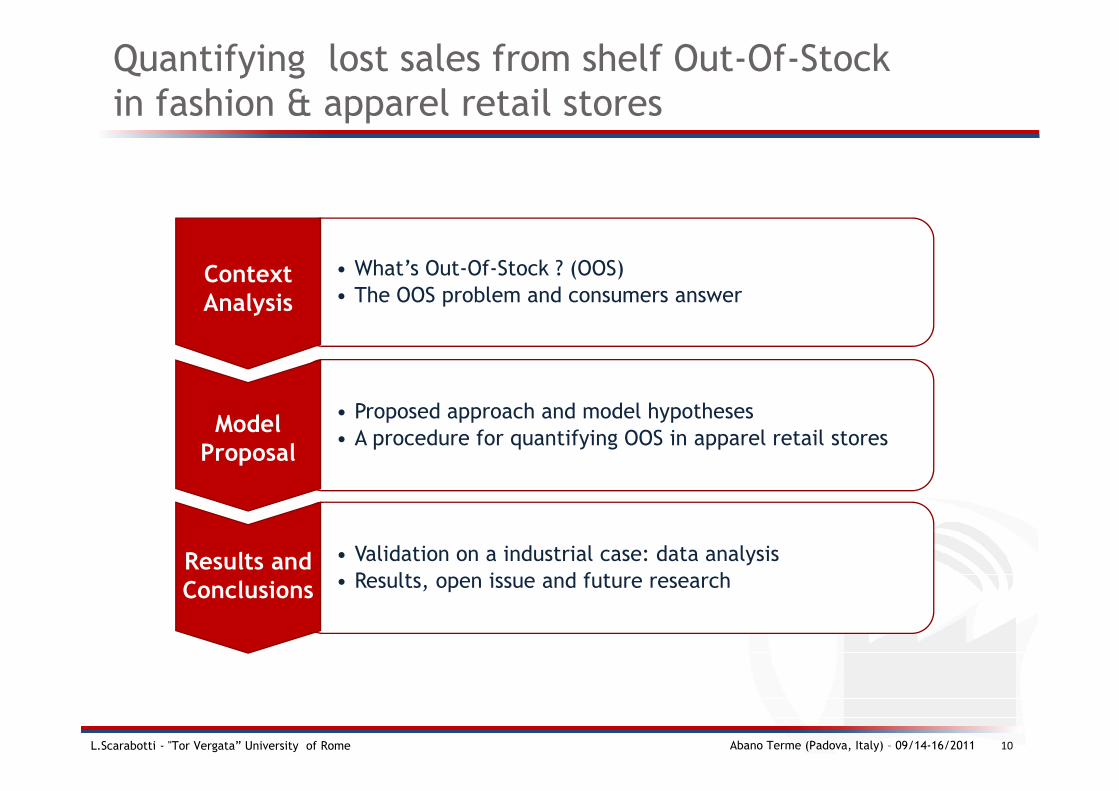
Quantifying lost sales from shelf Out-Of-Stock in fashion & apparel retail stores
• What’s Out-Of-Stock ? (OOS)• The OOS problem and consumers answer
ContextAnalysis pAnalysis
• Proposed approach and model hypotheses• A procedure for quantifying OOS in apparel retail stores
Model Proposal
• Validation on a industrial case: data analysisR lt i d f t h
Results and• Results, open issue and future researchConclusions
L.Scarabotti - "Tor Vergata” University of Rome Abano Terme (Padova, Italy) – 09/14-16/2011 10

Data analysis (1/3)
• The analyzed fashion company manages 200+ stores selling an assortment of 50’000+ product of women apparel and accessories in Italy with a total revenue50 000+ product of women apparel and accessories in Italy, with a total revenue of more than 60M€/Y
• The sales in 137 stores were analyzed from 01/09/2009 to 31/12/2009 and 877 different products were selected among those which registered out-of-stocks
L.Scarabotti - "Tor Vergata” University of Rome Abano Terme (Padova, Italy) – 09/14-16/2011 11

Data analysis (3/3)
• Two key factors need to be analyzed and compared per each product: mean (μ) and st dev (σ) of sales rate The proposed procedure should onlymean (μ) and st dev (σ) of sales rate. The proposed procedure should only be applied with products with low coefficient of variation cv = σ/|μ|.
25ize INVENTORY BUILD-UP DIAGRAM FOR ITEM XXX
10
15
20
Stoc
k si
c = σ/|μ|= 1,27
0
5
19/11/09
21/11/09
23/11/09
25/11/09
27/11/09
29/11/09
1/12
/09
3/12
/09
5/12
/09
7/12
/09
9/12
/09
11/12/09
13/12/09
15/12/09
17/12/09
19/12/09
21/12/09
23/12/09
25/12/09
27/12/09
29/12/09
31/12/09
cv σ/|μ| 1,27
Time
0,8
1
1,2
Stoc
k si
ze
INVENTORY BUILD-UP DIAGRAM FOR ITEM XXX
0
0,2
0,4
0,6
S
cv = σ/|μ|= 6,96
L.Scarabotti - "Tor Vergata” University of Rome Abano Terme (Padova, Italy) – 09/14-16/2011 12
Time
0
1/9/09
8/9/09
15/9/
09
22/9/
09
29/9/
09
6/10/0
9
13/10
/09
20/10
/09
27/10
/09
3/11/0
9
10/11
/09
17/11
/09
24/11
/09
1/12/0
9
8/12/0
9
15/12
/09
22/12
/09
29/12
/09
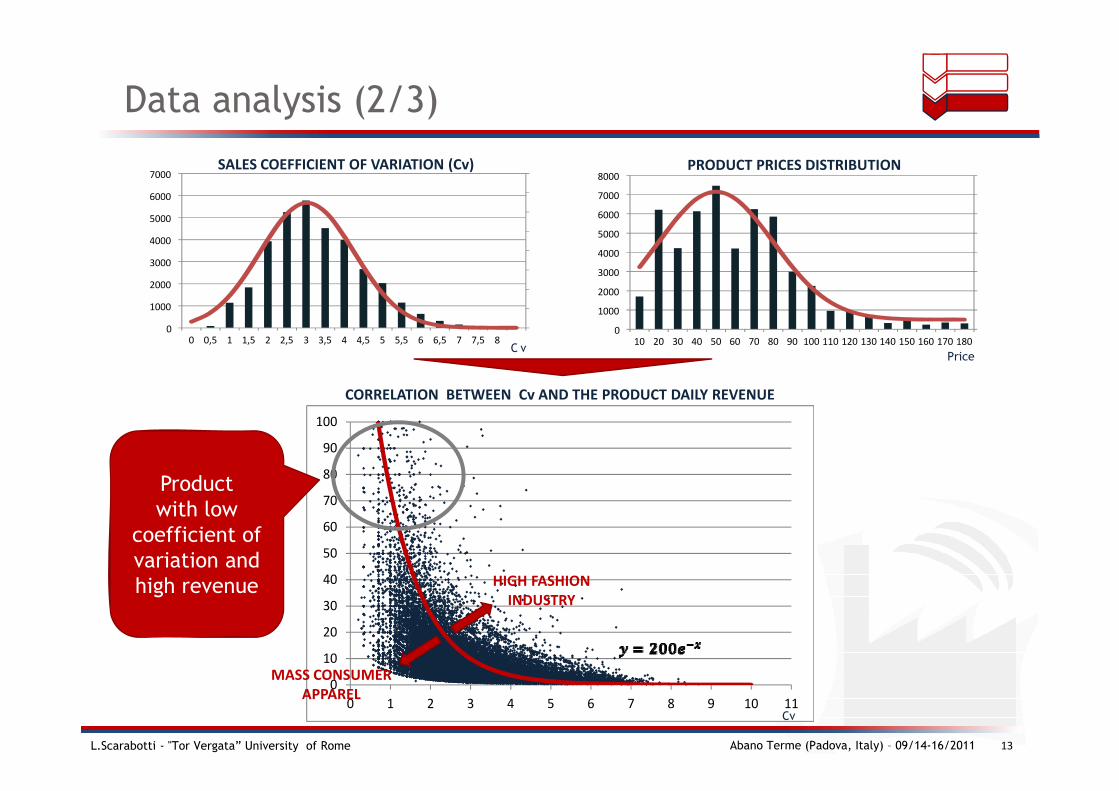
Data analysis (2/3)
SALES COEFFICIENT OF VARIATION (Cv)
5000
6000
7000PRODUCT PRICES DISTRIBUTION
6000
7000
8000
1000
2000
3000
4000
5000
2000
3000
4000
5000
6000
CORRELATION BETWEEN Cv AND THE PRODUCT DAILY REVENUE
C v
0
1000
0 0,5 1 1,5 2 2,5 3 3,5 4 4,5 5 5,5 6 6,5 7 7,5 80
1000
10 20 30 40 50 60 70 80 90 100 110 120 130 140 150 160 170 180Price
80
90
100
Product
CORRELATION BETWEEN Cv AND THE PRODUCT DAILY REVENUE
40
50
60
70Product with low
coefficient of variation and
10
20
30
40high revenue HIGH FASHIONINDUSTRY
L.Scarabotti - "Tor Vergata” University of Rome Abano Terme (Padova, Italy) – 09/14-16/2011 13
00 1 2 3 4 5 6 7 8 9 10 11
Cv
MASS CONSUMERAPPAREL

Results from the validation on a industrial case
ITEMS IN STOCK OUT AND LOST SALES
Number of days of the analyzed period 120Number of days of the analyzed period 120
Total analyzed stores 137
Total analyzed items 51′554Total analyzed items 51 554
Total analyzed items with OOS 877
Total sales of analyzed OOS items 7′227Total sales of analyzed OOS items 7 227
Lost sales of analyzed OOS items 2′075
Potential revenue growth rate (% of analyzed items revenues) 28,7%
202530
202530
g ( y ) ,
05
101520
05
101520
L.Scarabotti - "Tor Vergata” University of Rome Abano Terme (Padova, Italy) – 09/14-16/2011 14
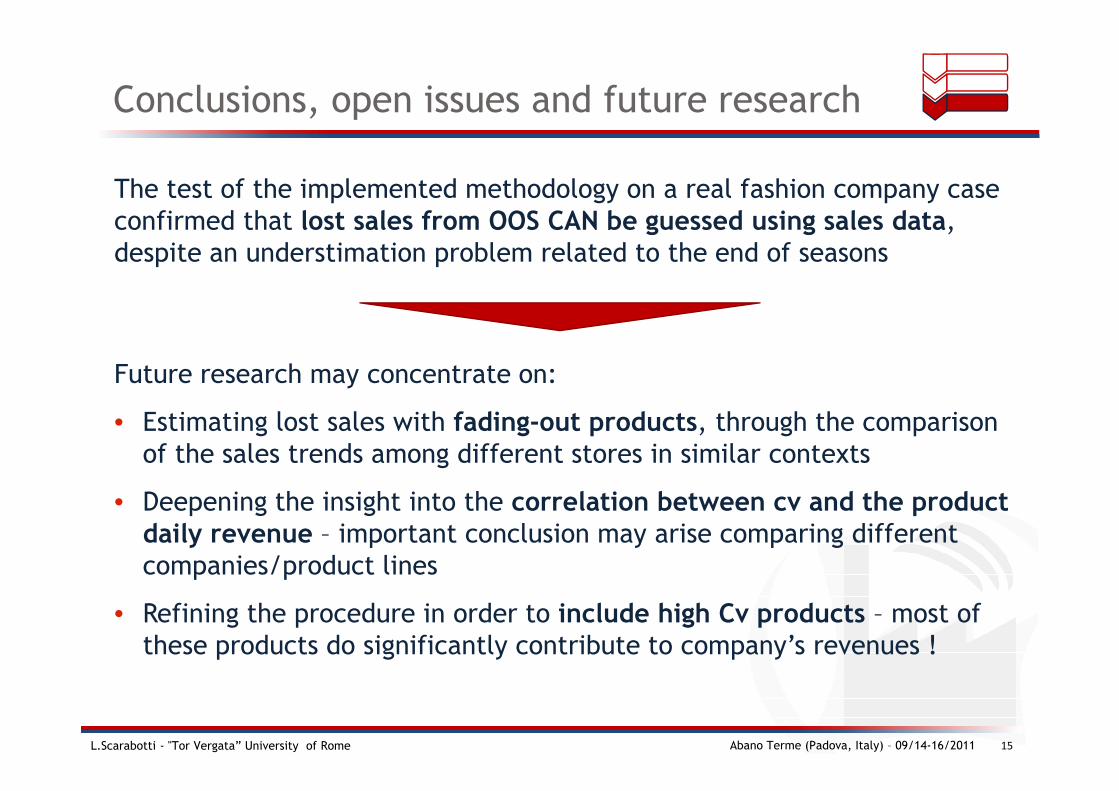
Conclusions, open issues and future research
The test of the implemented methodology on a real fashion company case confirmed that lost sales from OOS CAN be guessed using sales dataconfirmed that lost sales from OOS CAN be guessed using sales data, despite an understimation problem related to the end of seasons
Future research may concentrate on:
• Estimating lost sales with fading-out products, through the comparison of the sales trends among different stores in similar contexts
• Deepening the insight into the correlation between cv and the product daily revenue – important conclusion may arise comparing different companies/product linesp p
• Refining the procedure in order to include high Cv products – most of these products do significantly contribute to company’s revenues !
L.Scarabotti - "Tor Vergata” University of Rome Abano Terme (Padova, Italy) – 09/14-16/2011 15

THANKS FOR YOUR ATTENTION
Laura Scarabotti, Eng, PhD Candidate
Operations Management Research GroupDepartment of Enterprise Engineering
“Tor Vergata” University of RomeVia del Politecnico 1 – 00133 Rome (Italy)