Embed Size (px)
Citation preview

Quantifying Erodibility of Embankment Materials for the Modeling of Dam Breach Processes
To HET or to JET — On Which to Bet?
Tony L. Wahl – USBRGregory J. Hanson – USDA-ARSPierre-Louis Regazzoni – Ph.D. student, Université de Nantes

Background
• CEATI Dam Breach Erosion project is working to improve embankment dam breach models– Physically-based breach models now under
development use quantitative inputs of material erodibility
– Cohesive materials are the key to modeling the erosion and breach of most embankments
– We are evaluating alternative methods for obtaining required input data

Erodibility Testing – Why?
• Erodibility of cohesive soils is highly variable and depends on many factors:– Density, compaction moisture content, in situ
moisture, soil and water chemistry, etc.
• Predictions of erodibility as function of other soil properties carry high uncertainty
• Measurements of erodibility are best

Erodibility Testing Alternatives
• Alternative methods for measuring erodibility of cohesive embankment materials– Hole Erosion Test (HET) (piping erosion)– ARS submerged Jet Erosion Test (JET) (scour)– Flume-type tests (e.g., Erosion Function
Apparatus, SEDFLUME)– Rotating cylinder test– Many others
• Methods for measuring erodibility should be practical, robust, and applicable to dam breach flow situations

Shear stress
Rat
e o
f er
osi
on
(m
ass/
area
/tim
e, o
r vo
lum
e/ar
ea/t
ime)
)(
)(
ce
cd
Cm
k
c
1
C e or k d

Test specimen after HET
~15mm
HET test apparatus
Hole Erosion Test – Simulates Piping


Hole Erosion Test - History
• Constant-flow test was developed in 1980s by Lefebvre et al.
• Constant-head version (HET) by Wan and Fell (2004), with a companion Slot Erosion Test (SET) that used a much larger soil sample
• HET has best potential for practical application

Our HET facilities
Head tank
Test specimen
V-notch weir

Hole erosion test procedure
• Flow at constant head through 6-mm (¼”) hole• Head is increased incrementally until erosion occurs
– Wan and Fell (2004) used 50-1200 mm heads– Our facilities allow up to 5400 mm head
• When critical shear stress is exceeded, erosion starts and flow increases exponentially– Applied stress increases as hole enlarges– “Progressive” erosion
• Initial and final hole diameters are known/measured• Flow rate and head are recorded continuously and
used to compute hole diameters during test (by applying momentum equation to flow through hole)


Using the Results – The IHET index
• Wan and Fell (2004) proposed
• Note that index does not depend on c
• Primary initial purpose was to identify soils / dams that could pipe rapidly
eHET CI 10log

H e a dW a t e r S u r f a c e
O r i g i n a l B e d
J
JJ
p
ie
P o t e n t i a lC o r e
D i f f u s e dJ e t
S c o u r e dB e d J e t C e n t e r l i n e
d o
S t r e s s D i s t r i b u t i o n
2
i
poi J
J
f o r J i > J p
C Uf2
o oWhere:
Jet Erosion Test (JET)

Submergence Tank
Sample
Point Gage
Jet Tube
DeflectionPlate
Lid
Laboratory JET Apparatus

JET background
• Developed at USDA-ARS, Stillwater, Okla.• Applied to:
– Headcut erosion in earthen spillway channels– Headcut erosion during embankment overtopping
and breach

JET procedure
• Establish a fixed test head and initial jet distance to obtain desired stress
• Measure scour beneath jet over time (~2 hrs)– Measurements made manually by point gage at
increasing time intervals
• Applied stress and erosion rate decrease as scour occurs

JET Analysis
• Predict equilibrium scour depth by fitting measured scour data to hyperbolic function– Stress that would be applied
at that depth is c
• Fit dimensionless time and scour data to theoretical model by Blaisdell to determine kd
• Fitting is accomplished using Excel Solver utility

Research objective
• Compare JET and HET– Both tests determine a critical shear stress and
erosion rate coefficient– Are they the same?– If not, do they correlate?– Which has most potential to meet our needs?
• Secondary objective: Improve HET test procedures and data analysis
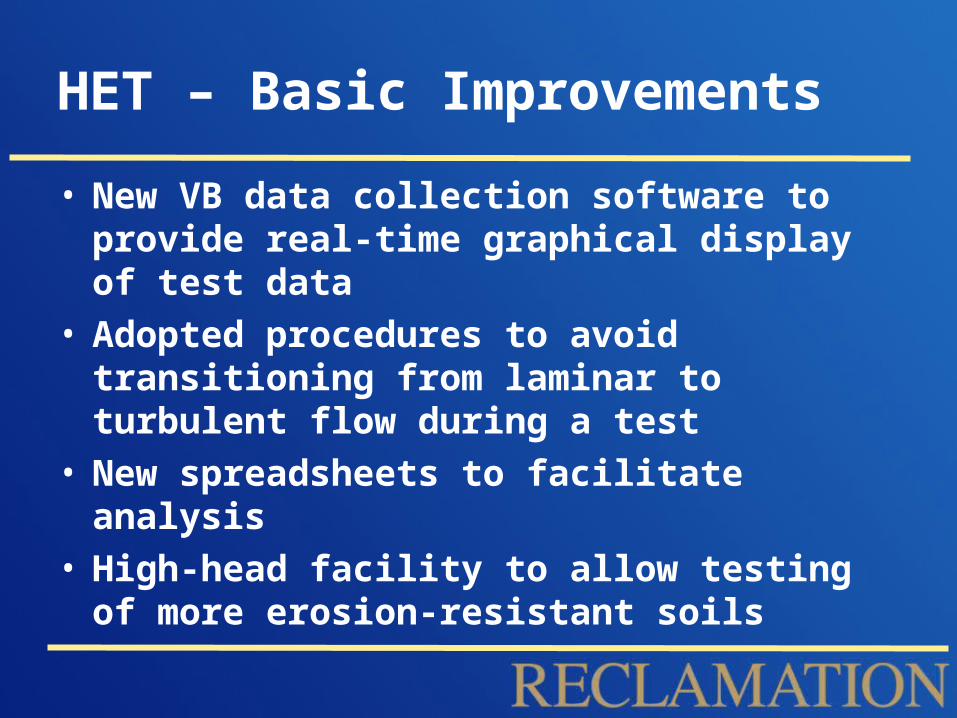
HET – Basic Improvements
• New VB data collection software to provide real-time graphical display of test data
• Adopted procedures to avoid transitioning from laminar to turbulent flow during a test
• New spreadsheets to facilitate analysis• High-head facility to allow testing of more
erosion-resistant soils

HET – Friction Factor
• Wan and Fell assumed friction factor varied linearly with test time
• This caused calculations to compute increase in hole diameter even when we knew there was no significant erosion– Artifact of presumed change in friction factor
5/1
2
2 64
t
t
w
tT h
L
g
Qfdt

HET – Friction Factor Tests
• Prepared multiple test specimens of a Sandy Lean Clay s(CL) soil
• Ran tests for varying lengths of time– End of each test represented one intermediate
state of a full-length test
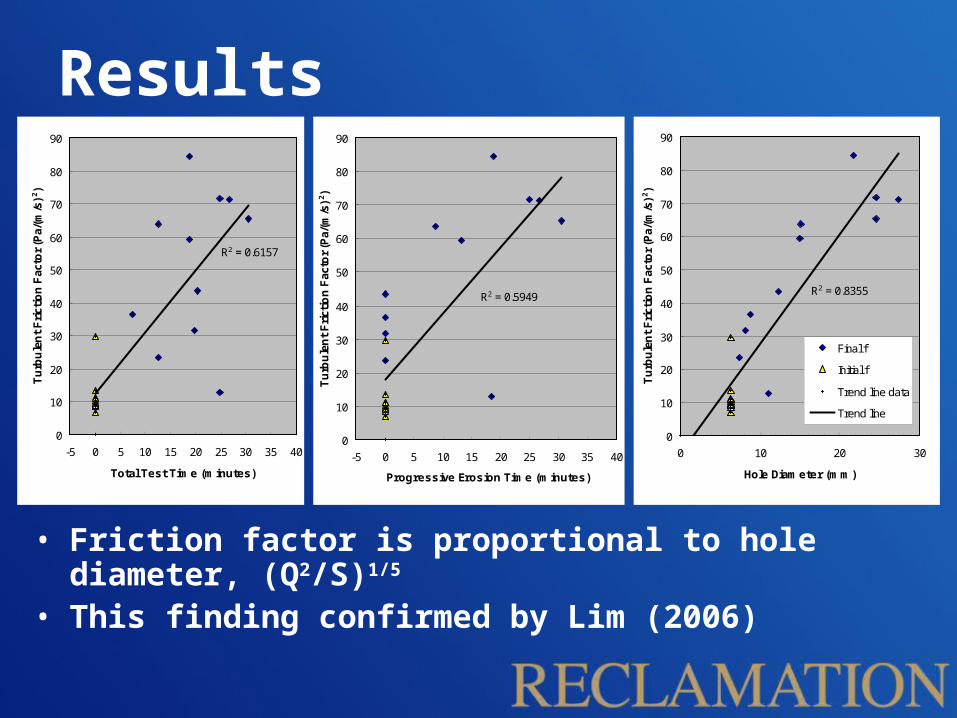
Results
• Friction factor is proportional to hole diameter, (Q2/S)1/5
• This finding confirmed by Lim (2006)
R2 = 0.6157
0
10
20
30
40
50
60
70
80
90
-5 0 5 10 15 20 25 30 35 40
Total Test Time (minutes)
Tu
rbu
len
t F
rict
ion
Fac
tor
(Pa/
(m/s
)2)
R2 = 0.5949
0
10
20
30
40
50
60
70
80
90
-5 0 5 10 15 20 25 30 35 40
Progressive Erosion Time (minutes)
Tu
rbu
len
t F
rict
ion
Fac
tor
(Pa/
(m/s
)2)
R2 = 0.8355
0
10
20
30
40
50
60
70
80
90
0 10 20 30
Hole Diameter (mm)
Tu
rbu
len
t F
rict
ion
Fac
tor
(Pa/
(m/s
)2)
Final f
Initial f
Trend line data
Trend line

HET – Alternative analysis method
• Piping erosion model developed by Bonelli et al. (2006) at CEMAGREF showed that dimensionless hole radius is an exponential function of dimensionless time, when the hole is progressively eroding
111)( /
00
erttc eR
tR
2/5
/
0
2/5
00
* 111)()(
erttc e
R
tR
Q
tQQ
hC
L
hk
Lt
we
d
wder
22

HET – Bonelli Analysis
• Use Excel Solver to determine value of c and ter that produces best fit…leads to value for kd
• This avoids the need to determine the final hole diameter
• Requires that progressive erosion begin immediately, or we must estimate the hole diameter and shear stress at the time at which progressive erosion begins


Summary of HET Improvements
• Better flow measurement and data collection• Improved real-time data collection software
– Operator gets better feedback about test progress
• Better modeling of friction factor• Alternative to use Bonelli analysis procedure
that does not require measurement of final hole diameter

HET / JET comparison
• Parallel tests on 7 different soils (some in multiple moisture/compaction conditions)CL-ML (Silty Clay)
s(CL), CL(s), CL (Lean Clays)
CH-CL, CH (Fat Clay)
• Paired specimens– One tested in JET– One tested in HET

2
3
4
5
6
IHET
IJET
HET
JET
TE 55T-160 MF P2ARS P295/owc P395/owc TF P3ARS MPCL-ML s(CL) CL s(CL) s(CL) (CL)s CH (CL)s CH/CL

0.01
0.1
1
10
100
1000
c,HET
c,JET
(Pa)
HET
JET
TE 55T-160 MF P2ARS P295/owc P395/owc TF P3ARS MPCL-ML s(CL) CL s(CL) s(CL) (CL)s CH (CL)s CH/CL

2
3
4
5
6
2 3 4 5 6
I JET, I RCT
I HE
T
Tested Soils
Line of agreement
Lim (2006) HET vs. RCT
0.01
0.1
1
10
100
1000
0.01 0.1 1 10 100 1000
c JET (Pa)
c H
ET
(Pa)
Tested Soils
Line of agreement

0.001
0.01
0.1
1
10
k d,
cm3 /(
N-s
)
P2 HET
P2 JET
P3 HET
P3 JETP2
J ET
HET
P3
HET
J ET
0.01
0.1
1
10
100
1000
10000
c, P
a
P2 HET
P2 JET
P3 HET
P3 JET
P3HET
J ET
P2
HET
J ET
1.7
1.8
1.9
2.0
6 8 10 12 14 16 18 20
Moisture Content, %
Dry
de
ns
ity
, g
/cm
3
P2
P3

JET vs HET Comparison
• HET produces much lower erosion rates and higher critical stress values
• Relative erodibility ranking of soils compares reasonably well
• Correlation between tests is adequate considering variable nature of erodibility
• What about robustness?

0.0001
0.001
0.01
0.1
1
10
100
1000
0.00001 0.0001 0.001 0.01 0.1 1 10 100 1000 10000
Critical Shear Stress, c (Pa)
Det
ach
me
nt
Ra
te C
oe
ffic
ien
t
kd
(cm
3 /N-s
)
Hanson and Simon (2001)
HETs
JETs
Erodibility classifications based on JET results
Very erodible
Erodible
Moderately resistant
Resistant
Very resistant

Range of Applicability
• JET – Spans 5.5 orders of magnitude• HET – Spans only 2.8 orders of magnitude
– The most erosion-resistant soils could not be eroded, even at 5+ meters of head
• No successful tests with IHET > 5.3
• Wan and Fell (2004) assigned class 6 to anything that did not erode at 1200 mm
• IHET class 6 “soils” may not exist
– Weak soils collapse or scour/slake at entrance and exit of hole…confounds analysis
• No successful tests yielding IHET < 2.5

{
HET Application Limits

Final Observations
• The HET and JET produce much different quantitative results– Probably due to simplifications of the stress
descriptions used in each analysis and inherent differences in erosion mechanisms
• It seems plausible to develop useful correlations between the two tests

Final Observations (continued)
• HET is much more difficult to perform successfully than the JET, especially with very weak soils (30-50% success)
• Judgment is often required to complete HET analysis– Proposed subjectivity index for rating test quality

Final Observations (continued)
• High-head HET facility has shown us that even soils with very high critical stresses are not in IHET class 6
IHET class 6 “soils” may not exist
• JET is more adaptable to broad range of soils and also can be used for in situ testing

Final Observations (continued)
• For future development of erosion models, JET has many advantages
• For applications in which HET is already being used, this research offers a means for relating JET to HET

Questions?

Why the Difference?• Simplified modeling of shear stresses in each test
environment– Entrance and exit turbulence and lack of fully developed
flow in HET– JET uses shear stress theory developed for impingement
against flat plate
• Different erosion mechanisms– JET has more opportunity to jack soil blocks out of the
exposed planar surface– In HET, soil blocks lining the small-diameter hole are
protected from jacking by interlocking with the surrounding soil mass
– Different sensitivity to variations in soil fabric or structure

Effect of soil fabric

Why the Difference (continued)?
• Different relative importance of different kinds of stress
• Briaud proposes that erosion may depend fundamentally on three different kinds of stress– Shear stress– Turbulent fluctuations of shear stress– Turbulent fluctuations of normal stress

Why the Difference (continued)?
• Correlating erosion with only the shear stress may be ok if the other two types of stress are also correlated with shear
• This correlation may exist for varying test heads in one testing environment, but in different environments, relative contributions of each type of stress may be different

Principal Types of Erosive Stress?
HET
JET
SheaShearr
Shear Stress Shear Stress TurbulenceTurbulence
Normal Stress Normal Stress TurbulenceTurbulence
ShearShear Shear Stress Shear Stress TurbulenceTurbulence
Normal Normal Stress Stress
TurbulenceTurbulence