Embed Size (px)
Citation preview

QUANTIFYING ENVIRONMENTAL CONTROLS ON SAP FLOW IN GREAT BASIN TREE SPECIES AND THEIR POSSIBLE SIGNIFICANCE FOR MOUNTAIN GROUNDWATER RECHARGE UNDER ANTHROPOGENIC CLIMATE CHANGE
Brittany Johnson1,2, Richard Jasoni1, and Jay Arnone III1
1Graduate Program of Hydrologic Sciences, University of Nevada, Reno2Department of Earth and Ecosystem Sciences, Desert Research Institute, Reno

Presentation Outline Introduction Research Questions Methods
Transects Sap flow
Results Spring Growing Season
Initial Conclusions Ongoing Research

Introduction Climate/global change is expected to alter the timing and
extremity of environmental factors that modulate transpiration of mountain trees such as:
• Vapor pressure deficit (VPD, air dryness)• Photosynthetically active radiation (PAR, light)• Soil water availability (VWC)• Air and soil temperature
Sap flow measurements allow for the continuous observation of transpiration patterns in response to natural fluctuations in the above variables

Research Questions What environmental drivers are responsible for initiating
sap flow in the spring?
How do known environmental drivers of transpiration modulate in situ sap flow in Great Basin tree species during the spring and growing season?

METHODS

Site Locations
Courtesy of Scotty Strachan
Snake Range Site Elevation (ft) Dominant Vegetation
Sage West 5,870 Sage, Greasewood
PJ West 7,220 Pinyon Pine, Juniper
Montane West 9,220 White Fir, Limber Pine
Subalpine West 11,010 Spruce, Bristlecone Pine
Subalpine East 10,070 Spruce, Aspen
Sage East 6,020 Sage
Salt Desert East 5,120 Greasewood, Shadscale
Sheep Range Site Elevation (ft) Dominant Vegetation
Desert Shrub 2,950 Creosote, Burroweed
Blackbrush 5,480 Joshua Tree, Saltbush
PJ 6,770 Pinyon Pine, Juniper
Montane 7,610 Ponderosa Pine, Juniper
Subalpine 10,190 Bristlecone, Currant
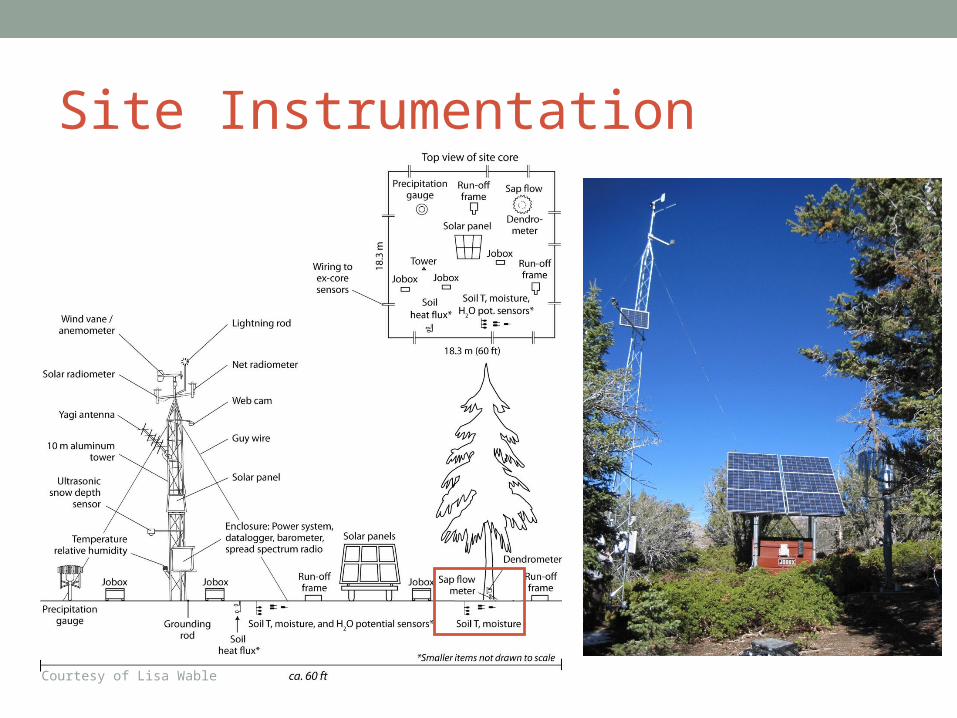
Site Instrumentation
Courtesy of Lisa Wable

Sap Flow Sensors Thermal Dissipation Probe (TDP)
Figure courtesy of Dynamax.com

Sap Flow Sensors TDPs report differential temperature (dT) To convert to sap velocity, V (cm s-1),
Where dTmax= Maximum pre-dawn dT
dT= Raw differential temperature
K= Dimensionless variable
Where V= Sap velocity (cm s-1)

TDP and TDR Installation TDPs were installed at the Montane West and Subalpine
West and East sites in the Snake Range
Tree Species Sample Size
White Fir 2
Limber Pine 2
Mountain Mahogany 2
Douglas Fir 2
Soil Time Domain Reflectometry (TDR) probes and thermocouples installed beside each tree to monitor soil moisture and soil temperature

RESULTS

SPRING

Date
4/11/11 4/25/11 5/9/11 5/23/11 6/6/11 6/20/11
Sap
Vel
ocity
(cm
s-1
)
0.000
0.002
0.004
0.006
0.008
0.010
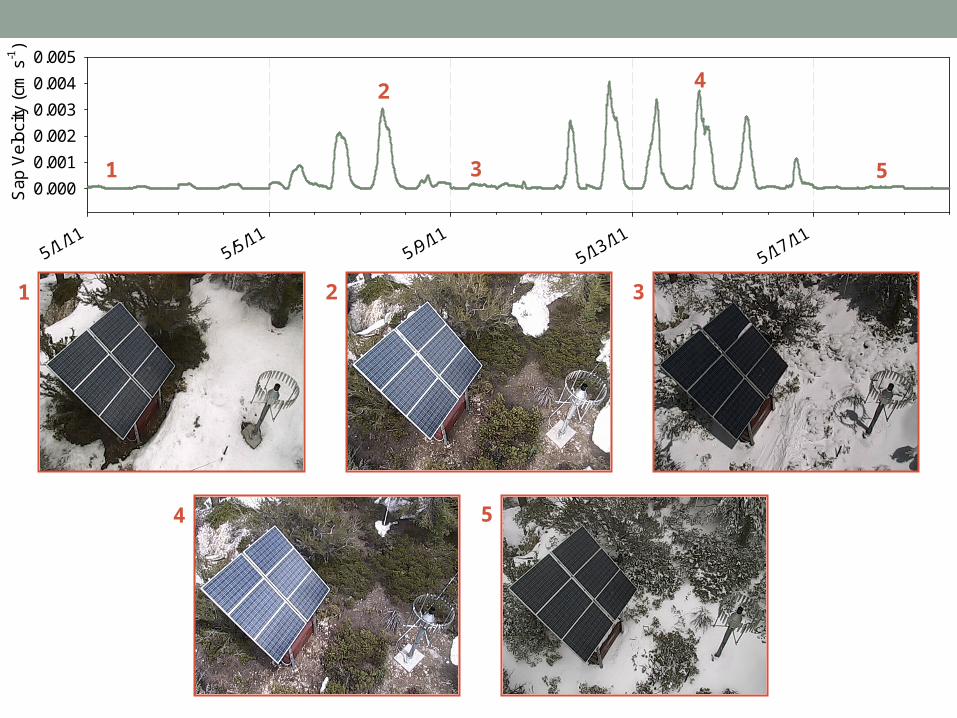
Spring Sap Flow

Sap
Vel
ocity
(cm
s-1
)
0.000
0.001
0.002
0.003
0.004
0.005
Date
5/1/11
5/5/11
5/9/11
5/13/11
5/17/11
PA
R ( m
ol m
-2 s
-1)
-2000
-1000
0
1000
2000
Precipitation (m
m)
0
10
20
30
40
50
60
PAR
Precip

Sap
Vel
ocity
(cm
s-1
)
0.000
0.001
0.002
0.003
0.004
0.005
Date
5/1/11
5/5/11
5/9/11
5/13/11
5/17/11
Air
Tem
pera
ture
(°C
)
-20
-10
0
10
20
Vapor P
ressure Deficit (kP
a)
0
1
2
3
4
Air T
VPD

Sap
Vel
ocity
(cm
s-1
)
0.000
0.001
0.002
0.003
0.004
0.005
Date
5/1/11
5/5/11
5/9/11
5/13/11
5/17/11
Soi
l Tem
pera
ture
(°C
)
-15
-10
-5
0
5
10
Soil M
oisture (VW
C)
0.15
0.20
0.25
0.30
0.35
0.40
0.45
Soil T
Soil VWC
4 5
5/1/11
5/5/11
5/9/11
5/13/11
5/17/11
Sap
Vel
ocity
(cm
s-1
)
0.000
0.001
0.002
0.003
0.004
0.005
1
2
3
4
5
1 32

Air Temperature (°C)
-10 -5 0 5 10 15 20
Day
time
Sap
Vel
ocity
(cm
s-1
)
-0.001
0.000
0.001
0.002
0.003
0.004
0.005
Regressions
Variable r2
Air Temp 0.412
Soil Temp 0.361
VPD 0.343
PAR 0.244
Soil VWC 4.18e-3
Precipitation 8.10e-4
Slope= 3.00e-4Y-int= 1.15e-4P<0.001
10-min values

GROWING SEASON

Sap
Vel
ocity
(cm
s-1
)
0.000
0.002
0.004
0.006
0.008
0.010
Date
5/2/11
5/16/11
5/30/11
6/13/11
6/27/11
7/11/11
7/25/11
PA
R ( m
ol m
-2 s
-1)
0
500
1000
1500
2000
2500
Precipitation (m
m)
0
20
40
60
80
100
120
Max PAR
Precip

Sap
Vel
ocity
(cm
s-1
)
0.000
0.002
0.004
0.006
0.008
0.010
Date
5/2/11
5/16/11
5/30/11
6/13/11
6/27/11
7/11/11
7/25/11
Air
Tem
pera
ture
(°C
)
-20
-10
0
10
20
30 Vapor P
ressure Deficit (kP
a)
0
2
4
6
8
Air T
VPD

Sap
Vel
ocity
(cm
s-1
)
0.000
0.002
0.004
0.006
0.008
0.010
Date
5/2/11
5/16/11
5/30/11
6/13/11
6/27/11
7/11/11
7/25/11
Soi
l Tem
pera
ture
(°C
)
-20
-10
0
10
20
Soil M
oisture (VW
C)
0.0
0.1
0.2
0.3
0.4
0.5
0.6
0.7
Soil T
Soil VWC

Maximum Soil Temperature (°C)
0 5 10 15 20 25
Max
imum
Sap
Vel
ocity
(cm
s-1
)
0.000
0.002
0.004
0.006
0.008
0.010
Regressions
Variable r2
Max Soil Temp 0.713
Max Air Temp 0.649
Max VPD 0.588
Min Soil Temp 0.576
Max Soil VWC 0.519
Min Soil VWC 0.493
Min Air Temp 0.469
Min VPD 0.228
Max PAR 0.169
Precipitation 6.02e-3
Slope= 3.00e-4Y-int= 1.15e-4P<0.001
Daily values
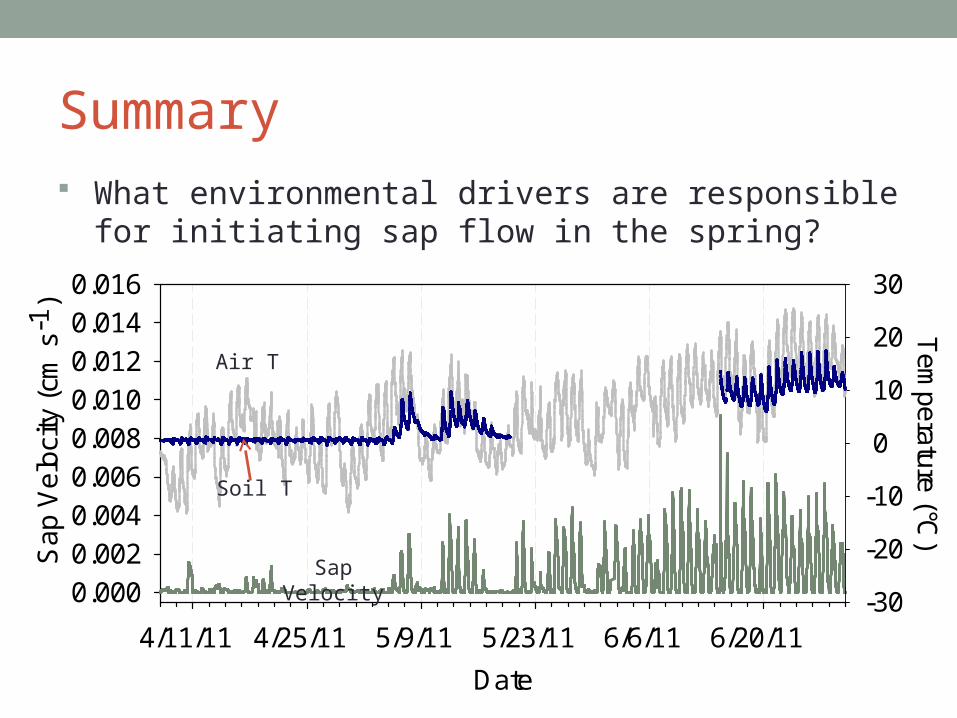
Summary What environmental drivers are responsible for initiating
sap flow in the spring?
Date
4/11/11 4/25/11 5/9/11 5/23/11 6/6/11 6/20/11
Sa
p V
elo
city
(cm
s-1
)
0.0000.0020.0040.0060.0080.0100.0120.0140.016
Tem
perature (°C)
-30
-20
-10
0
10
20
30
Air T
Soil T
Sap Velocity

Summary How do known environmental drivers of transpiration
modulate in situ sap flow in Great Basin tree species during the spring and growing season?
Spring Air temperature PAR VPD Soil temperature
Growing Season Soil temperature Air temperature

Conclusions Global climate change may cause a shift in the timing
and extremity of environmental factors that modulate transpiration
This could affect the start, stop, intensity, and duration ofsap flow especially if air and soil temperature patterns are significantly alteredChanges in transpiration will alter the amount of water available for groundwater recharge

Ongoing Research Analyze data from all instrumented trees at this and
other sites Determine if major drivers remain the same or are
different among Tree species Elevation/latitudes Weather patterns Soil type
Develop predictions in response to projected/ possible climate change scenarios

Questions???