Embed Size (px)
Citation preview

QUANTIFIED MOVING AVERAGE STRATEGY OF CRUDE
OIL FUTURES MARKET BASED ON FUZZY LOGIC RULES
Xiaojia Liu Haizhong An Lijun Wang
School of Humanities and Economic Management China University of Geosciences, Beijing 100083
The 5th IAEE Asian Conference 2016

OUTLINE
• 1 Introduction
• 2 Method
• Framework
• Moving average strategy
• Fuzzy logic rule
• Genetic algorithm
• Rate of return calculation
• 3 Result
• 4 Discussion
• 5 Conclusion
[email protected] China University of Geosciences, Beijing 2

INTRODUCTION
• The Moving Average Strategy (MAS) is one of the most popular technical
indicators. This strategy helps traders confirm the existing trend and to find the
upcoming reversal trend. The MAS generates a buying signal or a selling signal
by judging whether the difference between a long-term average and a short-
term average is positive or negative.
• Many scholars did improvement on MAS. However, no matter the MAS or
improved MAS solely provides signals. The trading volume is also very
important. In this paper, we use the fuzzy logic rule to describe the strength of
the moving average signals. The strength is integrated into the MAS as trading
volume to form a quantified moving average strategy. In this paper, we call this
integrated strategy the Fuzzy Moving Average Strategy (FMAS).
[email protected] China University of Geosciences, Beijing 3

INTRODUCTION
• In this paper, we use the moving average method, the length of two time periods, the
fuzzy extent of the as if part of a fuzzy logic rule; the then part is the recommend
value.
• Because every fuzzy logic rule contains several parameters, and each parameter has a
different feasible region, ultimately, there are countless rules. We choose certain of
these to form a fuzzy rule set; every set provides a rating level that decides the
trading volume. In the search for the optimal fuzzy rule set, genetic algorithms are
used.
• In this paper, a quantified moving average strategy of crude oil futures market is
proposed. This FMAS can provide both a trading signal and a volume. The moving
average strategy and the fuzzy logic rule are used to compose this trading strategy.
Genetic algorithms are used for better trading strategy optimization.
[email protected] China University of Geosciences, Beijing 4

DATA
• The data used in this paper are crude oil futures daily prices from New York
Mercantile Exchange (NYMEX). We downloaded the data from Energy Information
Administration (EIA) website. The experiment time period in this paper is from
2000 to 2014.
[email protected] China University of Geosciences, Beijing 5
• In this paper, 750 trading days are set aside. Train period contains 500 trading days. Select period and test period are both 250 trading days, which is approximately one year.
• Returns from 2000 to 2014 are calculated

METHOD-MOVING AVERAGE STRATEGY
[email protected] China University of Geosciences, Beijing 7
80
85
90
95
100
105
110
115
Jan 03, 2013 Feb 22, 2013 Apr 13, 2013 Jun 02, 2013 Jul 22, 2013 Sep 10, 2013 Oct 30, 2013 Dec 19, 2013
Price SMA of 100 days SMA of 10 days
The principle of moving average strategy is that it attempts to use the moving average line of prices to predict market trends and makes it possible for computers to generate buy and sell signals automatically. The signal to buy occurs when the average of a short-term period exceeds the average of a long-term period, and the signal to sell occurs when the average of a long-term period exceeds the average of a short-term period.

METHOD-MOVING AVERAGE STRATEGY
• Four moving average calculation methods are chosen
• Simple Moving Average (SMA)
• Adaptive Moving Average (AMA)
• Typical Price Moving Average (TPMA)
• Triangular Moving Average (TMA)
• The length of two time periods
• Long time period
• Short time period
[email protected] China University of Geosciences, Beijing 8

METHOD – FUZZY LOGIC RULE
[email protected] China University of Geosciences, Beijing 9
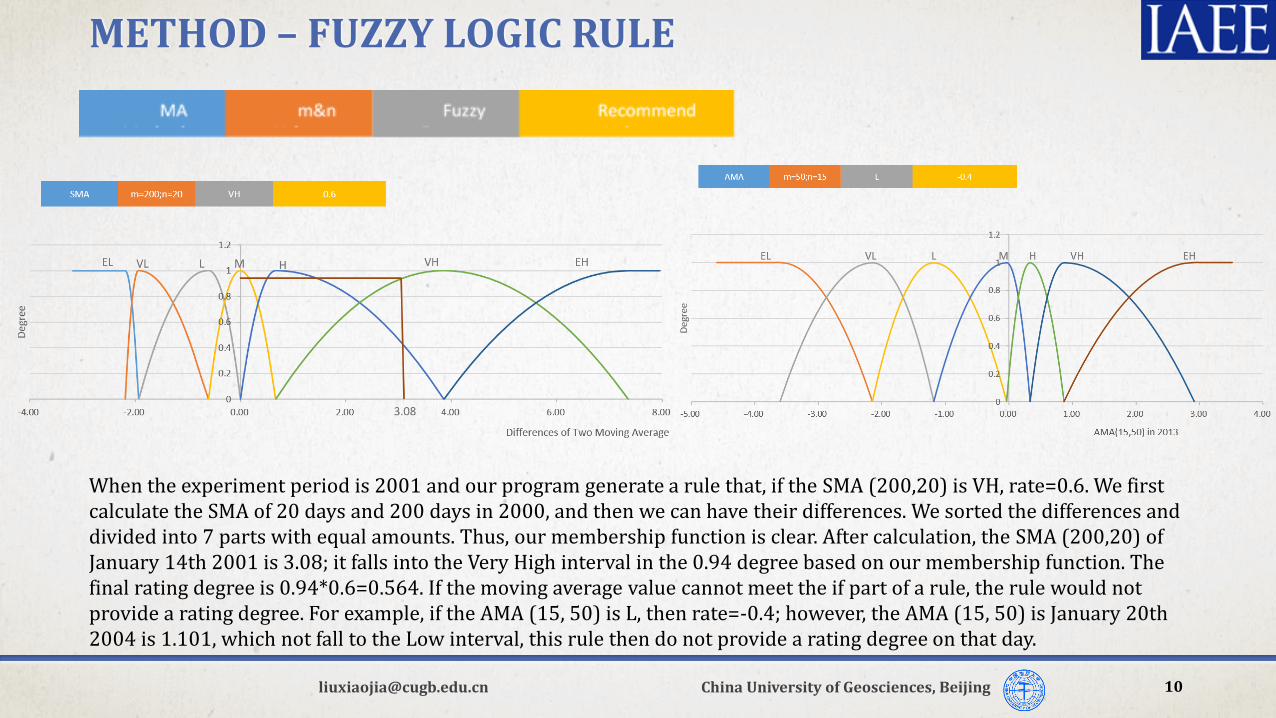
The difference between two moving averages is set to have 7 extents, Extremely Low (EL), Very Low (VL), Low (L), Middle (M), High (H), Very High (VH) and Extremely High (EH). If the difference and the fuzzy extent are given, the recommendation rate will be generated.
METHOD – FUZZY LOGIC RULE
[email protected] China University of Geosciences, Beijing 10
When the experiment period is 2001 and our program generate a rule that, if the SMA (200,20) is VH, rate=0.6. We first calculate the SMA of 20 days and 200 days in 2000, and then we can have their differences. We sorted the differences and divided into 7 parts with equal amounts. Thus, our membership function is clear. After calculation, the SMA (200,20) of January 14th 2001 is 3.08; it falls into the Very High interval in the 0.94 degree based on our membership function. The final rating degree is 0.94*0.6=0.564. If the moving average value cannot meet the if part of a rule, the rule would not provide a rating degree. For example, if the AMA (15, 50) is L, then rate=-0.4; however, the AMA (15, 50) is January 20th 2004 is 1.101, which not fall to the Low interval, this rule then do not provide a rating degree on that day.

METHOD – GENETIC ALGORITHMS
• In this paper, we have 11136 types of rules. We choose 10 of these as a set. There are approximately 8.05*1033 sets.
[email protected] China University of Geosciences, Beijing 12

RESULTS-RATE OF RETURN
Year 2000 2001 2002 2003 2004 2005 2006 2007
Rate of Return 0.055 -1.511 -0.555 -0.913 0.776 0.394 0.169 0.304 Year 2008 2009 2010 2011 2012 2013 2014 Rate of Return 2.225 0.045 0.005 -0.194 -0.284 -0.274 1.153
[email protected] China University of Geosciences, Beijing 15
The rate of return generated by FMAS
The average rate of return of all 15 groups are 0.093. The smallest rate of return is -1.511 (in 2001), and the largest one is 2.225 (in 2008). The range is 3.736, and the standard deviation is 0.872.
The rate of return generated by MAS
Year 2000 2001 2002 2003 2004 2005 2006 2007 Rate of Return -4.559 2.970 -2.737 -2.506 -4.148 5.698 0.490 1.089 Year 2008 2009 2010 2011 2012 2013 2014 Rate of Return 13.852 2.545 -3.145 1.631 -0.749 0.056 7.358
The average rate of return is 1.910, the range is 18.411 and the standard deviation is 4.920

RESULTS-RATE OF RETURN
[email protected] China University of Geosciences, Beijing 16
The boxplot of the two experiments describes the entire 300 (15 groups multiply 20 times) results. It is important to note that the Y-axis scales of the two boxplots are different because the ranges of the results are different. The boxplot not only shows the average but also the maximum, upper quartile, lower quartile, minimum and outliers. Compared with the results generated by the MAS, the results generated by FMAS are more concentrated with less outliers. The ranges of each group by FMAS are small, which means the FMAS method provides more stable results.

RESULT-HOLDING AMOUNT
[email protected] China University of Geosciences, Beijing 17
The increasing holding
amount indicates capital
inflows to the futures market.
In contrast, the decreasing
holding amount indicates
that capital is flowing out of
the futures market. Generally,
the FMAS provides a large
trading amount when fairly
certain regarding its own
judgment. If the FMAS has
doubts regarding the
present market situation, it
will tend to not hold.

RESULT-FUZZY LOGIC RULE
[email protected] China University of Geosciences, Beijing 18
The figure shows the distribution of the moving average methods. Generally, the four methods have a similar share of the entire amount. TPMA and TMA have slight superiority in certain periods. In contrast, AMA, which is most frequently used in MAS in our previous study (Wang, An et al. 2014, Liu, An et al. 2015, Wang, An et al. 2015), has the least share when using FMAS. This situation may be caused by the different decision mechanism. The FMAS is relatively complicated; therefore, the simple moving average methods such as TPMA and TMA are more popular. AMA concerns many parameters; therefore, it is more suitable in MAS.

RESULT-FUZZY LOGIC RULE
[email protected] China University of Geosciences, Beijing 19
The distribution of the 7 fuzzy extents is also calculated. It is obvious that the EL (Extremely Low) is the most frequently showed fuzzy extent in most of the test periods. This situation is suitable for the crude oil futures price decline; the difference of the short period moving average and the long period moving average is larger than the previous test period. The fuzzy extents H (High) and VH (Very High) also take a large part. This combination is the best selected by the genetic algorithms. This finding may be because this combination contains both a low extent and a high extent such that it considers many situations.

DISCUSSION
• In the rate of return results, it is worth noting that in most years, the FMAS
and MAS have the same gain or loss result, except for the different amounts. In
ten of the fifteen, they both gain or lose. In 5 test periods (2000, 2004, 2010,
2011 and 2013), the approaches have different opinions. FMAS gains in 3 (the
year of 2000, 2004 and 2010) of the 5 periods, whereas MAS losses. In this
aspect, FMAS is better than MAS. Although FMAS is basically the improved
MAS, they both have similar results. Although we previously used different
moving average methods dynamically, it is impossible to guarantee profits all
the time. Perhaps each type of investment strategy can only reflect one aspect
of the market, despite being improved.
[email protected] China University of Geosciences, Beijing 20

DISCUSSION
• The result of the holding amount is interesting; it generally fluctuates
synchronously with the price series. Although we set a fixed initial capital, if
the rating level is the same, the holding amount would increase when the
price decreases and decrease when the price increases. However, now the
opposite situation appears; it proves that the holding amount is very sensitive
to the price series. In reality, this situation also exists; however, usually the
price and trading volume have a lead-leg relation. In this paper, although the
price cannot be affected by other parameters, the price should be the lead;
this is the cause of other parameters. However, in Figure the holding amount
is obviously not lag. Perhaps this result proves FMAS has a certain prediction
ability; however, we need to perform a further analyze to explore the relation.
[email protected] China University of Geosciences, Beijing 21

CONCLUSION
• In this paper, we combine the fuzzy logic rule and the moving average strategy to form a fuzzy moving average strategy. This FMAS can generate both a trading signal and a trading volume. MAS is used to generate the trading signal, and the fuzzy logic rule dictates the signal degree and the trading volume decision. Genetic algorithms are used for better trading strategy optimization.
• We conclude that, compared with the MAS, the FMAS generates a low but stable rate of return, and the results of FMAS experiment are more concentrated with less outliers. The holding amount is highly sensitive to price series. When the prices increases, the holding amount rises; when the price decreases, the holding amount declines. The simple moving average such as TPMA and TMA are more efficient. EL H and VH are the most frequently showed fuzzy extents
[email protected] China University of Geosciences, Beijing 22

THANK YOU Questions and comments are welcomed
Xiaojia Liu [email protected]
School of Humanities and Economic Management China University of Geosciences, Beijing, 100083
The 5th IAEE Asian Conference 2016