Embed Size (px)
Citation preview

IAEA-TECDOC-1616
Quantification of RadionuclideTransfer in Terrestrial
and Freshwater Environmentsfor Radiological Assessments
May 2009

The originating Section of this publication in the IAEA was:
Chemistry Unit, Agency’s Laboratories, Seibersdorf International Atomic Energy Agency
Wagramer Strasse 5 P.O. Box 100
A-1400 Vienna, Austria
QUANTIFICATION OF RADIONUCLIDE TRANSFER IN TERRESTRIAL
AND FRESHWATER ENVIRONMENTS FOR RADIOLOGICAL ASSESSMENTS
IAEA, VIENNA, 2009
ISBN 978–92–0–104509–6
ISSN 1011–4289 © IAEA, 2009
Printed by the IAEA in Austria May 2009

FOREWORD
For more than thirty years, the IAEA has published a set of documents aimed at the limitation of the radiation exposure of the population from various nuclear activities. In particular, in 1994 the IAEA published Technical Reports Series No. 364, Handbook of Parameter Values for the Prediction of Radionuclide Transfer in Temperate Environments. Over the years, it has proved to be a valuable reference for radioecologists, modellers and authorities in Member States, and has been quoted in numerous impact assessments.
Technical Reports Series No. 364 was based on a review of available data up to the end of 1992. However, a number of high quality critical reviews have been produced in recent years for some of the transfer parameter values which merit consideration. Thus, it was assumed that there is sufficient new information available to warrant reconsideration of a significant proportion of the values given in Technical Reports Series No. 364 and to initiate an updating of Technical Reports Series No. 364 in the framework of the IAEA EMRAS (Environmental Modelling for RAdiation Safety) project. It is expected that the revision of Technical Reports Series No. 364 will initiate further updating of related IAEA publications, and international and national radiological models.
The present IAEA-TECDOC is intended to be a support to the update of Technical Reports Series No. 364, overcoming the limitations of the former, and comprises both revised transfer parameter values, as well as missing data, key transfer processes, concepts and models that were found to be important for radiation safety.
The publication was prepared by members of the EMRAS project Working Group 1, Theme 1 Revision of IAEA Technical Reports Series No. 364. The group was chaired initially by P. Santucci, followed by P. Calmon. The IAEA wishes to express its gratitude to M. Thorne, A.
Gondin da Fonseca and B.Varga for their kind assistance in editing and preparation of the document
for publishing, and.to all the contributors to the IAEA-TECDOC and those who assisted in its drafting and review. The IAEA officer responsible for this publication was S. Fesenko of the Department of Nuclear Sciences and Applications.

EDITORIAL NOTE
The papers in these proceedings are reproduced as submitted by the authors and have not undergone rigorous editorial review by the IAEA.
The views expressed do not necessarily reflect those of the IAEA, the governments of the nominating Member States or the nominating organizations.
The use of particular designations of countries or territories does not imply any judgement by the
publisher, the IAEA, as to the legal status of such countries or territories, of their authorities and institutions or of the delimitation of their boundaries.
The mention of names of specific companies or products (whether or not indicated as registered) does not imply any intention to infringe proprietary rights, nor should it be construed as an endorsement or recommendation on the part of the IAEA.
The authors are responsible for having obtained the necessary permission for the IAEA to reproduce, translate or use material from sources already protected by copyrights.
CONTENTS
INTRODUCTION
Quantification of radionuclide transfer in terrestrial and freshwater environments:
A summary.........................................................................................................................3
S. Fesenko, G. Voigt
Radioecological definitions, soil, plant classifications and reference ecological data for
radiological assessments ....................................................................................................7
S. Fesenko, N. Sanzharova, M. Vidal, H. Vandenhove, A. Shubina, Y.Thiry,
E. Reed, B. J. Howard, G. Pröhl, G. Zibold, B. Varga, A. Rantavara
AGRICULTURAL ECOSYSTEMS: FOLIAR UPTAKE
Interception ...........................................................................................................................29
G. Pröhl
Weathering ...........................................................................................................................45
E. Leclerc, Y. H. Choi
Translocation ...........................................................................................................................49
E. Leclerc, C. Colle, C. Madoz-Escande, Y. H. Choi
Resuspension ...........................................................................................................................63
F. Jourdain
AGRICULTURAL ECOSYSTEMS: RADIONUCLIDE MOBILITY IN SOIL
Soil-radionuclide interactions ...................................................................................................71
M. Vidal, A. Rigol, C. J. Gil-Garcia
Vertical migration of radionuclides in undisturbed soils ........................................................103
F. Strebl, M. Gerzabeck, G. Kirchner, S. Ehlken, P. Bossew
AGRICULTURAL ECOSYSTEMS: ROOT UPTAKE
Processes governing radionuclide transfer to plants ...............................................................123
N. Sanzharova, S. Fesenko, E. Reed
Root uptake: temperate environment ......................................................................................139
N. Sanzharova, O. Shubina, H. Vandenhove, G. Olyslaegers,
S. Fesenko, Z.R. Zang, E. Reed, H. Velasco
Root uptake: tropical and sub-tropical environments .............................................................207
H. Velasco, J. Juri Ayub
Transfer to rice ........................................................................................................................239
S. Uchida, K. Tagami, Z. R. Shang, Y. H. Choi
Root uptake following acute soil deposition during plant growth ..........................................253
Y. H. Choi
Evolution of plant contamination with time............................................................................259
S. Fesenko, N. Sanzharova, K. Tagami

AGRICULTURAL ECOSYSTEMS:TRANSFRE TO ANIMALS
Transfer to animals..................................................................................................................267
B. J. Howard, N. A. Beresford, C. L. Barnett, S. Fesenko
AGRICULTURAL ECOSYSTEMS: TRANFER TO FRUITS
Trransfer to fruits ....................................................................................................................311
F. Carini
NATURAL AND SEMI NATURAL ECOSYSTEMS
Radionuclide transfer in forest ecosystems.............................................................................333
P. Calmon, Y. Thiry, G. Zibold, A. Rantavaara, S. Fesenko, O. Orlov
Radionuclide transfer in arctic ecosystems .............................................................................381
S. E. Palsson, L. Skuterud, S. Fesenko, V. Golikov
Radionuclide transfer in alpine ecosystems ............................................................................397
F. Strebl, H. Lettner, A. K. Hubmer, P. Bossew
RADIONUCLIDE TRANSFERS IN FRESHWATER ECOSYSTEM
Transfer by wash-off from watersheds ...................................................................................405
L. Garcia-Sanchez
FRESHWATER ECOSYSTEMS
Physical processes in freshwater ecosystems..........................................................................419
L. Monte, R. Periañez, P. Boyer, J.T. Smith, J.E. Brittain
Adhesion of suspended matter to the external plant surface...................................................435
U. Sansone, M Belli
Distribution of radionuclides between solid and liquid phases in freshwaters .......................441
P. Ciffroy, G. Durrieu, J. M. Garnier
Transfers to freshwater biota...................................................................................................473
T. Yankovich
MISCELLANEOUS TOPICS
Specific activity models and parameter values for tritium, 14
C and 36
Cl ................................549
P.A. Davis, E. Leclerc, D.C. Galeriu, A. Melintescu, V. Kashparov,
S -R. Peterson, P.M. Ravi, F. Siclet, C. Tamponet
Food processing ......................................................................................................................577
V. Kashparov, S. Conney, S. Uchida, S. Fesenko, V. Krasnov,
Use of analogues .....................................................................................................................605
E. Leclerc, K. Tagami, S. Uchida, B. Varga
List of articipants...................................................................................................................615
.
.
P

INTRODUCTION


3
QUANTIFICATION OF RADIONUCLIDE TRANSFER IN TERRESTRIAL AND
FRESHWATER ENVIRONMENTS: A SUMMARY
S.FESENKO, G.VOIGT
International Atomic Energy Agency, Vienna
1. BACKGROUND
Exposure may occur as a result of incidental releases and discharges from all stages of the
nuclear fuel cycle [1]. This includes uranium mines, fuel fabrication facilities, reactors,
reprocessing plants and low, intermediate and high level radioactive waste repository sites.
Each of these releases involves mainly fission and neutron activation products as well as
actinides [2]. Uranium mining and fuel fabrication also involve radionuclides of the uranium,
actinium and thorium decay series. In addition, some industries such as mineral sands
production and processing, phosphate ore processing, coal burning and oil and gas production
can generate naturally occurring radioactive materials (NORMs) as waste. Other sources of
human exposure include nuclear weapon testing and radiation accidents or incidents [2].
Any radiological assessments are based on an analysis of radionuclide transport patterns and
processes governing radionuclide behaviour in the environment [3]. Therefore, it is an aim of
the IAEA to support Member States to enhance their capability for evaluating radionuclide
transport, geochemical and biochemical enrichment, and radiation effects on human beings
and other biota [1].
Radionuclides released during routine operations of nuclear installations are dispersed in the
environment and often difficult and expensive to measure directly because of very low
radionuclide concentrations in the Environment. As a consequence, environmental
radiological impacts usually are assessed by modelling both for operating nuclear facilities
and during licensing. Radioecological models also have to be used for predicting future
impacts, e.g. in consequence assessments of nuclear waste repositories or in emergency
response planning.
Thus, many radiation protection models need to predict transfers of a large number of
radionuclides. This requires information on transfer of many less mobile radionuclides, which
do not usually comprise an important component of discharges or dose. Over the years,
Technical Reports Series No. 364 provided an important source of such information, and is
one of the key cited sources for many models. It is thus essential that such information is kept
up-to-date and that any relevant recent literature is included, especially considering the
paucity of existing data sources. This, in itself, is a strong argument for revision if the
information given is now known to be incorrect, inadequate (given new information available
since its preparation) and incomplete.
A few years ago a revision of the IAEA Safety Series No. 57 [4] was undertaken by the IAEA
with the purpose of providing simple methods for calculating doses arising from radioactive
discharges into the environment for risk assessment evaluations (screening of radioactive
discharges). Within the revised document, some of the default parameter values, used in the
models for calculating the transfer of radionuclides in food chains to humans and contributing
to ingestion dose were those given in Technical Reports Series No. 364. In the new Safety
Reports Series No. 19 only conservative values are considered [5]. In contrast, in Technical
Reports Series No. 364 the expected values are based on different criteria and are not intended
to be conservative. Current contradictions between the two documents have been resolved in
the revision of these documents and updating Technical Reports Series No. 364.

4
The scope of Technical Reports Series No. 364 had three major limitations. First, the parameters given in the document were mainly limited to temperate environments. Second, it gave parameters mainly for equilibrium conditions, and, therefore, they often cannot be applied for environmental assessments in accidental situations or to situations with variable release of radionuclides into the environment. And finally, Technical Reports Series No. 364 did not provide information on transfers of some radionuclides that are of importance in waste management practice.
A specific task of the Technical Reports Series No. 364 revision was to provide reference values for the most commonly used transfer parameters in radiological assessment models. However, some important details and recommendations on how to use these parameters were often omitted that undermined the making of relevant choices of necessary parameters. This problem is being resolved by publishing of two separate but well-linked documents i.e. the Technical Reports Series document focused on the reference information intended for radiological assessment and the IAEA-TECDOC intended for justification of radioecological information used to derive reference values, radioecological concepts and models facilitating use of reference values in specific situations.
Thus, the present IAEA-TECDOC is intended to be a supportive document for the updated Technical Reports Series No. 364 overcoming the limitations of the former document, and comprises both revised transfer parameter values, as well as missing data, key transfer processes, concepts and models that were found to be important for radiation safety.
The scope of the current document covers both main radioecological concepts on mechanisms governing radionuclide behaviour in the environment and the parameters derived from numerous radioecological studies.
2. OBJECTIVES
The main objective of this document is to provide radioecological concepts, models, parameters and data for assessing site-specific past, present and potential future radiation exposures of humans and other biota in terrestrial and freshwater environments in different climate conditions.
3. SCOPE
The IAEA Technical Document is primarily intended to provide the Member States with an overview of radioecological concepts, models and parameters for radioecological assessment of both routine discharges of radionuclides to the environment and accidental releases.
The document is also intended for further updating and facilitating of use of the recently published IAEA documents related to the assessment of the radiological impact of radioactive discharges as described in IAEA Safety Report Series No. 19 Generic Models for Use in Assessing the Impact of Discharges of Radioactive Substances to the Environment [5], IAEA Safety Standards Series No. WS-G-2.3 Regulatory Control of Radioactive Discharges to the Environment and other related documents [6]. The document can be also used as background documentation for other relevant activities such as training in radioecology and radiation protection.
4. DATA COLLECTION AND ANALYSIS
International databases of bibliographical references (such as INIS, Scopus, JCR, SpringerLink and Academic Search Premier, INIST, Current Contents, etc.) and some national databases (such as IRSN bibliographical database) were consulted by using relevant

5
key words. Such a bibliographical study did not aim at exhaustiveness and was limited to published documents within the international scientific community and, depending on their accessibility, to reports from different scientific institutions. That inventory of existing knowledge was drawn upon with a view to consulting original publications in order to use all the information that they contained, rather than relying on summaries of such information.
During the second step, databases were elaborated, where necessary. These databases associated each value for a given transfer parameter with a number of descriptors. The bibliographical references accepted were also included in the database.
The data have been analysed with the objectives of (i) estimating a geometric mean and/or an arithmetic mean for a given parameter, and (ii) obtaining an indication of the extent of uncertainty about these estimates. The estimation of these values and the extent of uncertainty about every such value have been carried out by applying statistical analysis, when possible. In the ideal case, if adequate data were available, both a geometric (GM) and an arithmetic means (AM) were derived.
When the number of observations was 2, only the arithmetical mean (AM) was calculated, and the single observation is presented when number of data was equal to 1. The uncertainties assigned to geometric mean were estimated by the geometrical standard deviation (GSD), although the standard deviations (SD) are also calculated as the uncertainty assigned to arithmetic mean. Ranges with minimum and maximum values are also given as well as the number of data (N) and number of references (#ref) used for a value evaluation. In some cases, the expected values are given without a statement of uncertainty or a range because of the limited data available. The recommended values in such cases should be used with caution.
Geometric mean is a type of mean or average, which indicates the central tendency or typical or expected value of a set of numbers:
N
N
ixGM
/1
1
)(∏= (2)
Geometric standard deviation (GSD) is the exponent of the standard deviation of the natural logarithms of the individual values. GSD can also be calculated based on the expression:
)
))ln()(ln((
exp( 1
2
N
GMx
GSD
N
i∑ −
=
Arithmetic mean:
∑⋅=
N
ix
NAM
1
1 (3)
Standard deviation:
2/12
1
))(1
1( AMxN
SD
N
i∑ −⋅
−
=
Thus, standardized tables reporting transfer parameter values are provided where possible giving the following information for each radionuclide: number of entries (N); geometric mean (GM); geometric standard deviation (GSD); arithmetic mean (AM), standard deviation (SD), minimum (MIN) and maximum (MAX) values and number of references from which entries were extracted (# Ref).
6
5. SUMMARY OF THE DOCUMENT
The document consists of twentry seven papers unified in nine topics (sections) according to traditional presentation of radioecological data for environmental assessments. Some of radioecological concepts, definitions, units and some important references as well as classifications of soil and plants used in the document are described in the introductory section.
Four papers included into the second section are dedicated to data for, and models of, foliar uptake. The main aspects and processes governing radionuclide mobility in soil including the Kd radionuclide vertical migration concepts and data, are described in the next two papers, composing the section on radionuclide mobility in soil.
Data on root uptake for various environments: temperate, tropical and subtropical, transfer to rice and data for some time dependent contamination scenaries are presented and discussed in the section on root uptake in agricultural ecosystem while the next section is dedicated to radionuclide transfer to animals and animal products. The data on radionuclide transfer in agricultural ecosystems are being completed by the paper on radionuclide transfer to fruits.
Parameters for modelling radionuclide transfer, including data and evaluation of processes governing radionuclide transfer in forest ecosystems (trees, berries, mushrooms, game), Arctic and Alpine environment compose the section on natural and semi-natural ecosystems.
Section on freshwater ecosystems comprises five papers devoted to transport of radionuclides in freshwater ecosystems including contamination routes, physical processes and radionuclide accumulation by freshwater biota. Specific activity models for the relevant radionuclides (3H, 14C, 36Cl), food processing and use of analogue approach for radiological assessments are covered by the section on miscellanius topics. Most papers consist appendexis which provide references used for data evaluation and examples of data evaluation.
REFERENCES
[1] FOOD AND AGRICULTURE ORGANIZATION OF THE UNITED NATIONS,
INTERNATIONAL ATOMIC ENERGY AGENCY, INTERNATIONAL LABOUR ORGANISATION, OECD, NUCLEAR ENERGY AGENCY, PAN AMERICAN HEALTH ORGANIZATION, WORLD HEALTH ORGANIZATION, International Basic Safety
Standards for Protection against Ionizing Radiation and for the Safety of Radiation Sources, Safety Series No. 115, IAEA, Vienna (1996).
[2] INTERNATIONAL ATOMIC ENERGY AGENCY, Health and Environmental Aspects of Nuclear Fuel Cycle Facilities, IAEA-TECDOC-918, Vienna (1996).
[3] INTERNATIONAL ATOMIC ENERGY AGENCY, Handbook of Parameter Values for the Prediction of Radionuclide Transfer in Temperate Environments, Technical Reports Series No. 364, IAEA, Vienna (1994).
[4] INTERNATIONAL ATOMIC ENERGY AGENCY, Generic Models and Parameters for Assessing the Environmental Transfer of Radionuclides from Routine Releases: Exposures of
Critical Groups, Safety Series No. 57, IAEA, Vienna (1982).
[5] INTERNATIONAL ATOMIC ENERGY AGENCY, Generic Models for Use in Assessing the Impact of Discharges of Radioactive Substances, IAEA Safety Reports Series No. 19, Vienna
(2001).
[6] INTERNATIONAL ATOMIC ENERGY AGENCY, Regulatory Control of Radioactive Discharges to the Environment, IAEA Safety Standards Series No. WS-G-2.3, IAEA, Vienna
(2000).

7
RADIOECOLOGICAL DEFINITIONS, SOIL, PLANT CLASSIFICATIONS AND
REFERENCE ECOLOGICAL DATA FOR RADIOLOGICAL ASSESSMENTS
S. FESENKO International Atomic Energy Agency, Vienna
N. SANZHAROVA Russian Institute of Agricultural Radiology and Agroecology, Obninsk, Russian Federation
M. VIDAL Analytical Chemistry Department–Universitat de Barcelona, Barcelona, Spain
H. VANDENHOVE, Y.THIRY Belgium Nuclear Research Centre (SCK•CEN ), Mol, Belgium
E. REED SENES Oak Ridge Inc., Center for Risk Analysis, Oak Ridge, USA
B.J. HOWARD Centre for Ecology and Hydrology, Lancaster, United Kingdom
G. PRÖHL Helmholtz Zentrum München-Institute of Radiation Protection, Neuherberg, Germany
G. ZIBOLD Hochschule Ravensburg-Weingarten, Germany
B. VARGA Central Agricultural Office, Hungary
A. RANTAVAARA Radiation and Nuclear Safety Authority (STUK), Finland
Abstract
The paper gives an overveiew of radioecological concepts, reference information on plants and soils used in the
project. Main classification schemes applied to summarize the data on radionuclide transfer to plants are also
described. Generic quantities and units used in the current document are also given. They are mainly defined
according to the the ICRU 65 report.
1. DEFINITIONS, QUANTITIES AND UNITS
In 1997, a report committee was initiated and established by the International Commission on Radiation Units and Measurements (ICRU) to prepare a report on statistical aspects and sampling strategies when measuring radionuclides in the environment.
Two reports are being produced: one on the quantities and units used that is already available [1], and the second on statistical aspects and sampling strategies that is at the final stage of preparation.
The first report (ICRU report 65) contained a list of units and quantities frequently used in the field of radioecology, and tried to harmonise the units derived from various different disciplines such as ecology, chemistry, medicine or physics. First symbols, definitions and

8
descriptions, their dependencies and a list of previously used symbols are given. In addition, appendices give generic, helpful information for the ‘unexperienced in the specific field’ on soil chemistry, soil classifications, taxonomy of species in common and Latin names in terrestrial and aquatic environments.
The current document mainly follows the recommendations given in the above ICRU report [1]. However, the classification schemes for soils and plants deviate from the recommendations of the ICRU report in a few places, because of specific requirements from the data presentations and their use for radiological assessments. Generic quantities and units used across the entire document are given below (Table 1). As mentioned earlier, they are mainly (with some exceptions discussed below) defined as in the ICRU report 65 [1].
The definitions of specific terms are given in the introductions to the stand-alone papers. Only some of the generic quantities (transfer parameters) that are in wide use are covered by the ICRU report. Those generic parameters that were not defined by the ICRU are also specified in the papers where they are used.
Soil-to-plant transfer factors were defined on a dry weight basis, for both plants and soil to reduce uncertainty. In those cases in which the transfer factor (concentration ratio) values or the plant concentrations, the feed or to berries reported in the literature were expressed relative to fresh weight, the fresh weight/dry weight conversion factors given by Tables 2-4 were applied.
In some estimations given in the document the carcass weighs and meat fractions are in use (Table 5). These fractions were derived by subtraction of the weight of bones and other not edible parts from carcass weights (Table 5).
Thus, all transfer factor values were expressed on a dry weight plant and dry weight soil basis before further analysis and interpretation. It is emphasised that actual fresh weight to dry weight ratios are likely to have varied somewhat around the adopted values, so this is an additional source of uncertainty in the analysis. In some specific situations, fresh weight is used in assessment calculations and in these situations the fresh weight/dry weight conversion factors (see Appendix 1) can be applied to scale the dry weight based values given in this report.
The International Union of Radioecology (IUR) decided, in 1982, to standardize the depth of soil in defining transfer factor values [7, 8]. Instead of the real rooting depth, a standardized depth of soil was adopted. All roots and all activity present in the actual rooting zone are assumed to be present in the standardized zone. For grass, this value is 10 cm and for all other crops (fruit trees included) the value is 20 cm.Transfer factors are commonly used to quantify radionuclide uptake from soil by plants. However, the definition based on the ratio of the activity concentration in plants (Bq kg-1 dry weight) to that in soil within the layer of a standardized thickness (Bq kg-1 dry weight), is not appropriate for forests and some other natural and semi-natural ecosystems. The reasons are the multi-layered character of the soils and the high inhomogeneity of distribution of root systems (or mycelia) over the soil profile. Therefore, aggregated transfer factors (Tag) are used in the current document as an alternative to quantify radionuclide availability to various types of natural or semi-natural vegetation, animals or other products. Tag is defined as the ratio of the radionuclide activity concentration in plant or any other natural or semi-natural product (Bq kg-1 fresh or dry weight, depending on the product) divided by the total deposition on the soil (Bq m-2). The Tag concept is also used for assessments of radionuclide transfers to game.

9
TA
BL
E 1
. Q
UA
NT
ITIE
S A
ND
UN
ITS
US
ED
Sym
bo
l
use
d b
y t
he
ICR
U 6
5
Sym
bol
use
d
in I
AE
A
publi
cati
ons
Sym
bol
use
d i
n
the
curr
ent
docu
men
t
Nam
e D
efin
itio
n1
Unit
1
Spec
ific
atio
n1
Co
mm
ents
1.
ag
C
ag
T
ag
T
Aggre
gat
ed
tran
sfer
fac
tor
ag
Cis
the
mas
s
acti
vit
y d
ensi
ty
(Bq k
g-1
) in
a s
pec
ifie
d
obje
ct p
er u
nit
are
a ac
tivit
y d
ensi
ty,
Aa
(Bq
m-2
) in
the
soil
.
m2 k
g-1
T
ime,
loca
tion,
pat
hw
ay,
obje
ct,
wet
or
dry
mas
s
bas
is,
dep
osi
tion t
ype
etc.
Dev
eloped
to d
eal
wit
h n
atura
l an
d s
emi-
nat
ura
l tr
ansf
ers
fro
m s
oil
to b
iota
. C
an b
e so
il t
o a
nim
al, so
il t
o p
lant
etc.
It
wil
l
enco
mpas
s m
any p
roce
sses
incl
udin
g
food-c
hai
n t
ransf
ers,
root
upta
ke,
soil
adhes
ion, dir
ect
soil
inges
tion,
etc.
It
may
hav
e lo
wer
var
iati
on i
n t
he
case
of
tran
sfer
s fr
om
soil
bec
ause
it
may
over
com
e th
e ef
fect
s of
the
dif
fere
nce
s in
soil
bulk
den
sity
bet
wee
n o
rgan
ic a
nd
min
eral
soil
s. P
revio
us
sym
bo
ls T
AG
, T
F,
Tag
rC
v
B,
vF
, TF
v
F
Conce
ntr
atio
n
rati
o
rC
is
the
rati
o o
f th
e
acti
vit
y d
ensi
ty o
f
radio
nucl
ide
in t
he
rece
pto
r co
mpar
tmen
t
to t
hat
in t
he
donor
com
par
tmen
t.
Dim
en-
sionle
ss o
r
kg k
g 1
Dep
endin
g o
n
com
par
tmen
ts
spec
ifie
d,
radio
nucl
ide,
rece
pto
r an
d
sourc
e
com
par
tmen
t,
wet
or
dry
w
eight
of
for
each
com
par
tmen
t,
deg
ree
of
equil
ibri
um
etc
.
Most
oft
en u
sed t
o d
escr
ibe
pla
nt
upta
ke
fro
m t
he
soil
, or
acti
vit
y c
once
ntr
atio
ns
in
aquat
ic o
rgan
ism
s in
rel
atio
n t
o a
ctiv
ity
conce
ntr
atio
ns
in w
ater
. T
he
inte
nti
on
her
e is
to i
ncl
ude
such
rat
ios
as f
eed t
o
pla
nt
tiss
ue/
soil
, an
imal
tis
sue/
feed
, fi
sh
musc
le/w
ater
etc
. T
he
term
s
bio
acc
um
ula
tion
, bio
conce
ntr
ati
on a
nd
bio
magnif
icati
on
are
rel
ated
, but
are
use
d
wit
h v
ery s
pec
ific
connota
tions
that
should
be
care
full
y s
pec
ifie
d.
The
reco
mm
ended
sym
bol
Cr
is a
chan
ge
fro
m
pas
t usa
ge,
but
it a
cco
mpli
shes
the
des
ire
to h
ave
a si
ngle
pri
mar
y c
har
acte
r an
d t
o
achie
ve
com
pat
ibil
ity w
ith o
ther
sym
bols
in t
he
ICR
U 6
5 r
eport
. P
revio
us
sym
bols
CR
, T
F,
Bv,
CF
, B
CG
, Br

10
TA
BL
E 1
. Q
UA
NT
ITIE
S A
ND
UN
ITS
US
ED
(C
ont.
)
Sym
bo
l
use
d b
y t
he
ICR
U 6
5
Sym
bol
use
d
in I
AE
A
publi
cati
ons
Sym
bol
use
d i
n
the
curr
ent
docu
men
t
Nam
e D
efin
itio
n1
Unit
1
Spec
ific
atio
n1
Co
mm
ents
1.
frC
m
F,
fF
mF
,
fF
Fee
d
tran
sfer
co
effi
cien
t
Cfr i
s th
e m
ass
or
vo
lum
etri
c ac
tivit
y
den
sity
in
th
e
rece
pto
r ti
ssu
e o
r
pro
du
ct o
f an
an
imal
(Bq k
g-1
wet
mas
s or
Bq L
-1)
div
ided
by
the
tran
sfer
rat
e (i
n
Bq d
-1)
d k
g-1
or
d L
-1,
wher
e d i
s
the
tim
e in
days
Rad
ionu
clid
e,
anim
al, sp
ecif
ic
tiss
ues
or
anim
al
pro
duct
; fe
ed t
ype,
con
tam
inat
ion
sou
rce;
deg
ree
of
equ
ilib
riu
m
bet
wee
n a
ctiv
ity
den
sity
in
pro
du
ct
and
in
take
rate
Th
e co
effi
cien
t is
use
d t
o e
stim
ate
the
acti
vit
y
den
sity
in
an
an
imal
tis
sue
or
pro
du
ct t
hat
is
eate
n b
y h
um
ans
(i.e
. m
ilk, m
eat,
eggs)
. T
he
tiss
ue
or
pro
du
ct a
ctiv
ity d
ensi
ty i
s as
sum
ed
to b
e at
ste
ady s
tate
wit
h r
esp
ect
to t
he
inta
ke
rate
. T
he
inta
ke
rate
in
th
is c
ase
refe
rs s
tric
tly
to i
nta
ke
by i
nges
tio
n i
nto
mou
th t
o b
e
conti
nued
.
dK
d
K
dK
D
istr
ibuti
on
coef
fici
ent
Th
e d
istr
ibu
tio
n
coef
fici
ent
is t
he
rati
o o
f th
e m
ass
acti
vit
y d
ensi
ty (
Am
in B
q k
g–1)
on
th
e
spec
ifie
d s
oli
d p
has
e
(usu
ally
on
a d
ry
mas
s bas
is)
to t
he
vo
lum
etri
c ac
tivit
y
den
sity
(A
v i
n B
q L
-
1)
in t
he
spec
ifie
d
liquid
phas
e.
L k
g-1
R
adio
nu
clid
e; s
oli
d
and
liq
uid
med
ia;
adso
rpti
on
and
des
orp
tion b
asis
;
lab
ora
tory
or
fiel
d
con
dit
ion
s; l
inea
rity
of
soli
d v
ersu
s
liq
uid
con
cen
trat
ion
s;
atta
inm
ent
of
equ
ilib
riu
m;
rati
o o
f
soli
d t
o l
iquid
mas
s,
chem
ical
fo
rm o
f
rad
ion
ucl
ide.
Th
e st
rict
def
init
ion
is
at e
qu
ilib
riu
m (
stea
dy-
stat
e eq
uil
ibri
um
and
rev
ersi
ble
pro
cess
es),
bu
t th
e q
uan
tity
is
oft
en u
sed
wh
ere
com
ple
te
equ
ilib
riu
m c
anno
t b
e p
roven
. A
dd
itio
nal
sub
scri
pts
may b
e as
sign
ed t
o c
lari
fy t
he
condit
ions
spec
ifie
d, su
ch a
s w
het
her
sorp
tion
or
des
orp
tio
n i
s u
sed f
or
the
mea
sure
men
t o
f
the
Kd. S
orp
tion a
nd d
esorp
tion K
d v
alues
at
equ
ilib
riu
m w
ill
usu
ally
dif
fer.
Man
y
met
ho
ds
are
use
d t
o m
easu
re t
he
Kd, an
d
thes
e d
iffe
ren
ces
lead
to
var
iab
ilit
y a
nd
inte
rpre
tati
on
am
big
uit
ies.
It
is p
arti
cula
rly
imp
ort
ant
to d
escr
ibe
in d
etai
l th
e m
eth
od
of
sep
arat
ing t
he
soli
d f
rom
th
e so
luti
on
. If
filt
rati
on
is
use
d, th
e p
ore
siz
e of
the
filt
er
should
be
spec
ifie
d. A
n o
per
atio
nal
ly d
efin
ed
or
full
y e
mp
iric
al K
d, fo
r w
hic
h t
he
two
con
cen
trat
ion
s ar
e m
easu
red
in
fie
ld s
amp
les,
is o
ften
pre
ferr
ed t
o m
inim
ise
bia
s ca
use
d b
y
the
met
ho
d, b
ut
thes
e val
ues
oft
en i
ncl
ud
e
radio
nucl
ides
whic
h a
re n
ot
rever
sibly
bound,
and f
or
whic
h e
quil
ibri
um
is
not
nec
essa
rily
atta
ined
. K
d v
alu
es a
re s
ensi
tive
to t
he
com
posi
tion o
f th
e so
luti
on (
e.g. co
mpet
ing
ions,
ionic
str
ength
, te
mper
ature
, pH
, re
dox
pote
nti
al),
to p
roper
ties
of
soli
ds
(e.g
. cl
ay
con
ten
t an
d t
yp
e, p
arti
cle
size
, m
iner
alo
gy)
and
to t
he
chem
ical
fo
rm o
f th
e ra
dio
nu
clid
e.
Pre
vio
us
sym
bols
: Rd,
CR
11
TA
BL
E 1
. Q
UA
NT
ITIE
S A
ND
UN
ITS
US
ED
(C
ont.
)
Sym
bo
l
use
d b
y t
he
ICR
U 6
5
Sym
bol
use
d i
n
IAE
A
pu
bli
cati
on
s
Sym
bol
use
d i
n
the
curr
ent
do
cum
ent
Nam
e D
efin
itio
n1
Un
it1
Sp
ecif
icat
ion
1
Co
mm
ents
1.
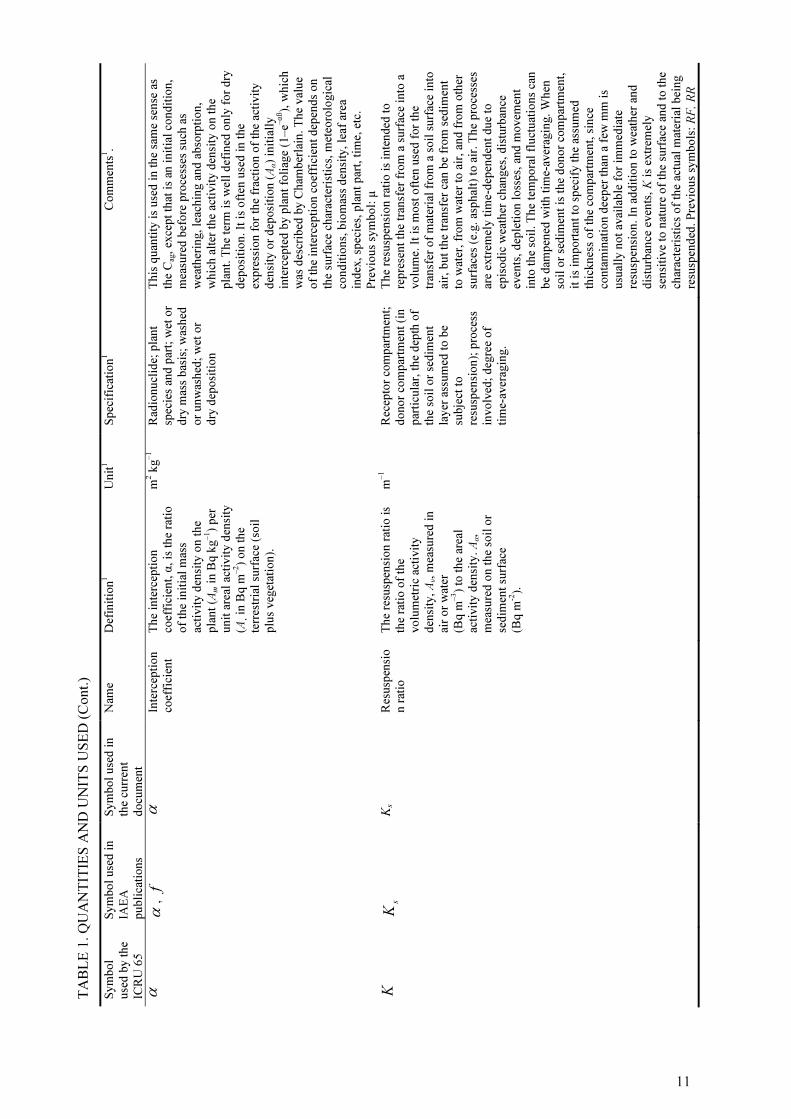
α
α, f
α
In
terc
epti
on
coef
fici
ent
Th
e in
terc
epti
on
coef
fici
ent,
α, is
the
rati
o
of
the
init
ial
mas
s
acti
vit
y d
ensi
ty o
n t
he
pla
nt
(Am i
n B
q k
g–1)
per
un
it a
real
act
ivit
y d
ensi
ty
(Ain
Bq m
–2)
on
th
e
terr
estr
ial
surf
ace
(so
il
plu
s veg
etat
ion).
m2 k
g–1
Rad
ionu
clid
e; p
lan
t
spec
ies
and
par
t; w
et o
r
dry
mas
s bas
is;
was
hed
or
unw
ashed
; w
et o
r
dry
dep
osi
tio
n
This
quan
tity
is
use
d i
n t
he
sam
e se
nse
as
the
Cag
, ex
cep
t th
at i
s an
in
itia
l co
nd
itio
n,
mea
sure
d b
efore
pro
cess
es s
uch
as
wea
ther
ing, le
ach
ing a
nd
ab
sorp
tio
n,
wh
ich
alt
er t
he
acti
vit
y d
ensi
ty o
n t
he
pla
nt.
Th
e te
rm i
s w
ell
def
ined
on
ly f
or
dry
dep
osi
tion. It
is
oft
en u
sed i
n t
he
exp
ress
ion
fo
r th
e fr
acti
on
of
the
acti
vit
y
den
sity
or
dep
osi
tion
(Aα)
init
iall
y
inte
rcep
ted
by p
lan
t fo
liag
e (1
–e–
αß),
whic
h
was
des
crib
ed b
y C
ham
ber
lain
. T
he
val
ue
of
the
inte
rcep
tion
co
effi
cien
t dep
end
s o
n
the
surf
ace
char
acte
rist
ics,
met
eoro
logic
al
con
dit
ion
s, b
iom
ass
den
sity
, le
af
area
index
, sp
ecie
s, p
lant
par
t, t
ime,
etc
.
Pre
vio
us
sym
bol:
μ
K
sK
K
s
Res
usp
ensi
o
n r
atio
The
resu
spen
sion r
atio
is
the
rati
o o
f th
e
vo
lum
etri
c ac
tivit
y
den
sity
, Av, m
easu
red i
n
air
or
wat
er
(Bq m
–3)
to t
he
area
l
acti
vit
y d
ensi
ty.
Aα,
mea
sure
d o
n t
he
soil
or
sed
imen
t su
rfac
e
(Bq m
-2).
m–1
Rec
epto
r co
mp
artm
ent;
do
no
r co
mp
artm
ent
(in
par
ticu
lar,
th
e d
epth
of
the
soil
or
sed
imen
t
layer
ass
um
ed t
o b
e
subje
ct t
o
resu
spen
sion);
pro
cess
invo
lved
; d
egre
e o
f
tim
e-aver
agin
g.
The
resu
spen
sion r
atio
is
inte
nded
to
rep
rese
nt
the
tran
sfer
fro
m a
su
rfac
e in
to a
volu
me.
It
is m
ost
oft
en u
sed f
or
the
tran
sfer
of
mat
eria
l fr
om
a s
oil
su
rfac
e in
to
air,
bu
t th
e tr
ansf
er c
an b
e fr
om
sed
imen
t
to w
ater
, fr
om
wat
er t
o a
ir, an
d f
rom
oth
er
surf
aces
(e.
g. as
phal
t) t
o a
ir. T
he
pro
cess
es
are
extr
emel
y t
ime-d
epen
den
t du
e to
epis
od
ic w
eath
er c
han
ges
, d
istu
rban
ce
even
ts, d
eple
tion
lo
sses
, an
d m
ovem
ent
into
th
e so
il. T
he
tem
po
ral
flu
ctu
atio
ns
can
be
dam
pen
ed w
ith t
ime-
avera
gin
g. W
hen
soil
or
sed
imen
t is
th
e d
on
or
com
par
tmen
t,
it i
s im
po
rtan
t to
sp
ecif
y t
he
assu
med
thic
kn
ess
of
the
com
par
tmen
t, s
ince
con
tam
inat
ion
dee
per
th
an a
few
mm
is
usu
ally
no
t av
aila
ble
fo
r im
med
iate
resu
spen
sion. In
addit
ion t
o w
eath
er a
nd
dis
turb
ance
even
ts, K
is
extr
emel
y
sen
siti
ve
to n
atu
re o
f th
e su
rfac
e an
d t
o t
he
char
acte
rist
ics
of
the
actu
al m
ater
ial
bei
ng
resu
spen
ded
. P
revio
us
sym
bols
: R
F, R
R

12
TA
BL
E 1
. Q
UA
NT
ITIE
S A
ND
UN
ITS
US
ED
(C
ont.
)
Sym
bo
l
use
d b
y t
he
ICR
U 6
5
Sym
bol
use
d i
n
IAE
A
publi
cati
ons
Sym
bol
use
d
in t
he
curr
ent
docu
men
t
Nam
e D
efin
itio
n1
Unit
1
Spec
ific
atio
n1
Co
mm
ents
1
trf
trf
trf
Tra
nsl
oca
tio
n
rati
o,
tran
slo
cati
on
fact
or,
tran
slo
cati
on
coef
fici
ent
Th
e tr
ansl
oca
tio
n r
atio
is
the
mas
s ac
tivit
y d
ensi
ty
(Am i
n B
q k
g–1)
in o
ne
tiss
ue,
typ
ical
ly a
n e
dib
le
tiss
ue,
div
ided
by t
he
mas
s ac
tivit
y d
ensi
ty (
Am
in B
q k
g–1)
in a
noth
er
tiss
ue
of
the
sam
e p
lan
t
or
crop. It
is
also
can
be
calc
ula
ted
as
the
mas
s
acti
vit
y d
ensi
ty i
n t
he
edib
le t
issu
e (B
q k
g–1)
in
ano
ther
tis
sue
of
the
sam
e pla
nt
or
crop. It
is
also
can
be
calc
ula
ted
as
the
mas
s ac
tivit
y d
ensi
ty
in t
he
edib
le t
issu
e
(Bq k
g–1)
div
ided
by t
he
acti
vit
y c
on
tain
ed o
n t
he
mas
s fo
liag
e co
ver
ing a
squ
are
met
re o
f la
nd
surf
ace
(Bq
m–2)
Dim
ensi
on-
less
, m
2 k
g–
1
Rad
ionu
clid
e; k
ind
of
pla
nt;
sp
ecif
ic
tiss
ues
; ty
pe
of
con
tam
inat
ion
;
con
tam
inat
ion
his
tory
; w
et o
r dry
mas
s.
Th
is q
uan
tity
is
oft
en u
sed
to
est
imat
e th
e
acti
vit
y d
ensi
ty i
n a
n u
nm
easu
red
tis
sue
fro
m a
no
ther
tis
sue
in t
he
sam
e p
lan
t
whic
h h
as b
een m
easu
red. T
he
quan
tity
may b
e use
d f
or
fruit
s, s
eeds,
spec
ific
edib
le v
eget
able
s o
r th
e b
ole
of
tree
s. I
t
var
ies
wit
h r
adio
nu
clid
e an
d c
hem
ical
form
, ti
me,
spec
ies,
gro
wth
sta
ge,
nutr
itio
n s
tatu
s, e
tc.
Pre
vio
us
sym
bols
: Ti, T
F, T
LF
, T
LFα
fpf
r
F
rF
F
ood
pro
cess
ing
rete
nti
on
fact
or
The
food p
roce
ssin
g
rete
nti
on
fac
tor
is t
he
rati
o o
f th
e m
ass
acti
vit
y
den
sity
(Am)
of
a giv
en
food
ite
m w
hen
rea
dy f
or
consu
mpti
on t
o t
he
acti
vit
y d
ensi
ty b
efo
re
pro
cess
ing a
nd
pre
par
atio
n.
Dim
ensi
on-
less
Rad
ionu
clid
e; f
oo
d;
typ
e an
d c
on
dit
ion
s
of
the
food
pro
cess
ing a
nd
pre
par
atio
n.
Exam
ple
s of
food p
roce
ssin
g a
nd
pre
par
atio
n i
ncl
ud
e ch
eese
mak
ing,
was
hin
g, sc
rubbin
g, pee
ling, boil
ing,
bak
ing a
nd f
ryin
g. C
ondit
ions
use
d t
o
det
erm
ine
sam
ple
mas
ses
bef
ore
an
d a
fter
pro
cess
ing a
nd p
repar
atio
n m
ust
be
spec
ifie
d f
or
pro
per
in
terp
reta
tio
n.
Th
is
qu
anti
ty v
arie
s ac
cord
ing t
o t
he
rad
ion
ucl
ide,
th
e w
ay i
t is
bo
und
to
th
e
food, th
e ty
pe
of
food, an
d t
he
var
ied
condit
ions
of
pre
par
atio
n (
e.g.
tem
per
ature
, ti
me,
etc
.).

13
T
AB
LE
1. Q
UA
NT
ITIE
S A
ND
UN
ITS
US
ED
(C
ont.
)
Sym
bo
l
use
d b
y t
he
ICR
U 6
5
Sym
bol
use
d i
n
IAE
A
publi
cati
ons
Sym
bol
use
d i
n
the
curr
ent
docu
men
t
Nam
e D
efin
itio
n1
Unit
1
Spec
ific
atio
n1
Co
mm
ents
1
2/
1T
2/
1T
2/
1T
H
alf
life
T
he
hal
f li
fe i
s (l
n2)/
λ,
wher
e λ i
s th
e dec
ay
const
ant
(s-1
)
s R
adio
nucl
ide
The
hal
f li
fe i
s sp
ecif
ic t
o e
ach
radio
nucl
ide
and c
an b
e vis
ual
ised
as
the
tim
e re
quir
ed f
or
the
acti
vit
y a
s a
conse
quen
ce o
f ra
dio
acti
ve
dec
ay.
af
1f
1f
Ab
sorb
ed
frac
tion
The
abso
rbed
fra
ctio
n i
s
the
frac
tio
n o
f th
e
inges
tio
n o
r in
hal
atio
n
inta
ke
by a
nim
al o
r a
hum
an t
hat
is
tran
sfer
red t
o a
spec
ifie
d r
ecep
tor
tiss
ue.
Dim
ensi
on-
less
Rad
ionucl
ide;
route
of
inta
ke
(pat
hw
ay),
re
cepto
r ti
ssue.
This
quan
tity
is
rela
ted t
o t
he
f 1 f
acto
r in
the
met
aboli
c m
odel
for
hum
an
dosi
met
ry,
wher
e th
e re
cepto
r ti
ssue
is
blo
od, an
d t
o b
lood-t
issu
e tr
ansf
er
frac
tions.
The
met
hod o
f det
erm
inat
ion
is v
ery i
mport
ant;
for
exam
ple
, an
`appar
ent`
f� i
s co
mp
ute
d f
rom
info
rmat
ion o
n t
he
whole
-body i
nta
ke
and e
xcr
etio
n o
f th
e ra
dio
nucl
ide.
A
`tru
e`f �
is
mea
sure
d i
n a
met
aboli
c st
ud
y
that
involv
es i
nje
ctio
n o
f a
trac
er,
and
allo
ws
for
the
det
erm
inat
ion o
f
endogen
ous
faec
al e
xcr
etio
n (
i.e.
dir
ect
tran
sfer
fro
m b
lood t
o t
he
inte
stin
e).
The
abso
rbed
fra
ctio
n d
epen
ds
on m
etab
oli
c
fact
ors
(e.
g. ag
e, l
acta
tio
n s
tate
,
physi
olo
gic
al c
ondit
ion),
chem
ical
and
physi
cal
spec
iati
on o
f th
e ra
dio
nucl
ide,
com
pet
ing i
ons,
gut
conte
nts
and
chem
ical
condit
ions,
etc
.
Pre
vio
us
sym
bols
: f 1
, α
, Aα,
At
1 A
ccord
ing t
o I
CR
U R
eport
65 [
1].
14
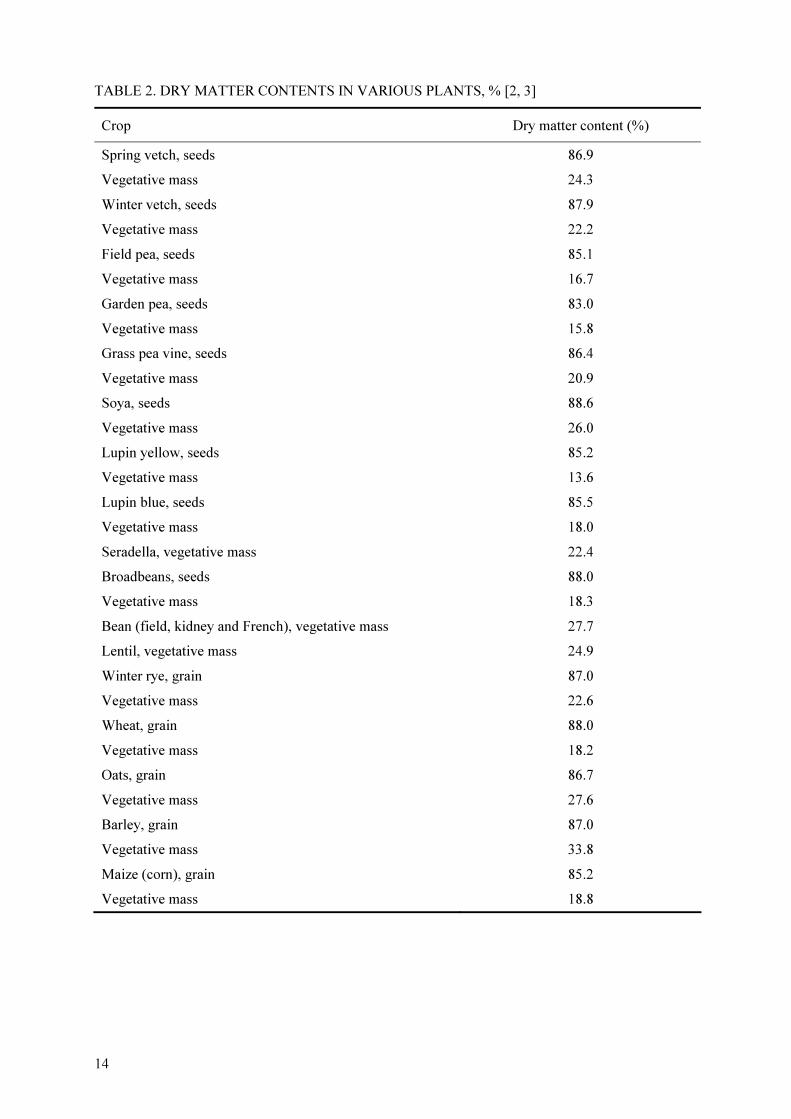
TABLE 2. DRY MATTER CONTENTS IN VARIOUS PLANTS, % [2, 3]
Crop Dry matter content (%)
Spring vetch, seeds 86.9
Vegetative mass 24.3
Winter vetch, seeds 87.9
Vegetative mass 22.2
Field pea, seeds 85.1
Vegetative mass 16.7
Garden pea, seeds 83.0
Vegetative mass 15.8
Grass pea vine, seeds 86.4
Vegetative mass 20.9
Soya, seeds 88.6
Vegetative mass 26.0
Lupin yellow, seeds 85.2
Vegetative mass 13.6
Lupin blue, seeds 85.5
Vegetative mass 18.0
Seradella, vegetative mass 22.4
Broadbeans, seeds 88.0
Vegetative mass 18.3
Bean (field, kidney and French), vegetative mass 27.7
Lentil, vegetative mass 24.9
Winter rye, grain 87.0
Vegetative mass 22.6
Wheat, grain 88.0
Vegetative mass 18.2
Oats, grain 86.7
Vegetative mass 27.6
Barley, grain 87.0
Vegetative mass 33.8
Maize (corn), grain 85.2
Vegetative mass 18.8
15
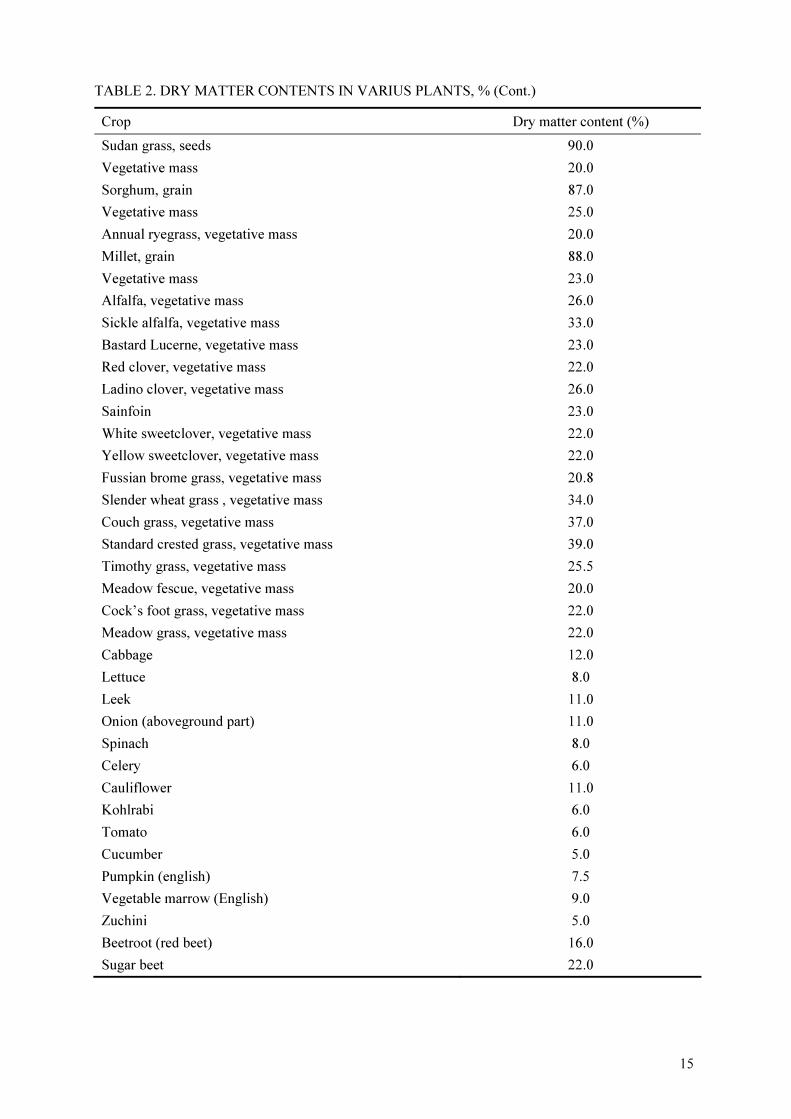
TABLE 2. DRY MATTER CONTENTS IN VARIUS PLANTS, % (Cont.)
Crop Dry matter content (%)
Sudan grass, seeds 90.0
Vegetative mass 20.0
Sorghum, grain 87.0
Vegetative mass 25.0
Annual ryegrass, vegetative mass 20.0
Millet, grain 88.0
Vegetative mass 23.0
Alfalfa, vegetative mass 26.0
Sickle alfalfa, vegetative mass 33.0
Bastard Lucerne, vegetative mass 23.0
Red clover, vegetative mass 22.0
Ladino clover, vegetative mass 26.0
Sainfoin 23.0
White sweetclover, vegetative mass 22.0
Yellow sweetclover, vegetative mass 22.0
Fussian brome grass, vegetative mass 20.8
Slender wheat grass , vegetative mass 34.0
Couch grass, vegetative mass 37.0
Standard crested grass, vegetative mass 39.0
Timothy grass, vegetative mass 25.5
Meadow fescue, vegetative mass 20.0
Cock’s foot grass, vegetative mass 22.0
Meadow grass, vegetative mass 22.0
Cabbage 12.0
Lettuce 8.0
Leek 11.0
Onion (aboveground part) 11.0
Spinach 8.0
Celery 6.0
Cauliflower 11.0
Kohlrabi 6.0
Tomato 6.0
Cucumber 5.0
Pumpkin (english) 7.5
Vegetable marrow (English) 9.0
Zuchini 5.0
Beetroot (red beet) 16.0
Sugar beet 22.0
16
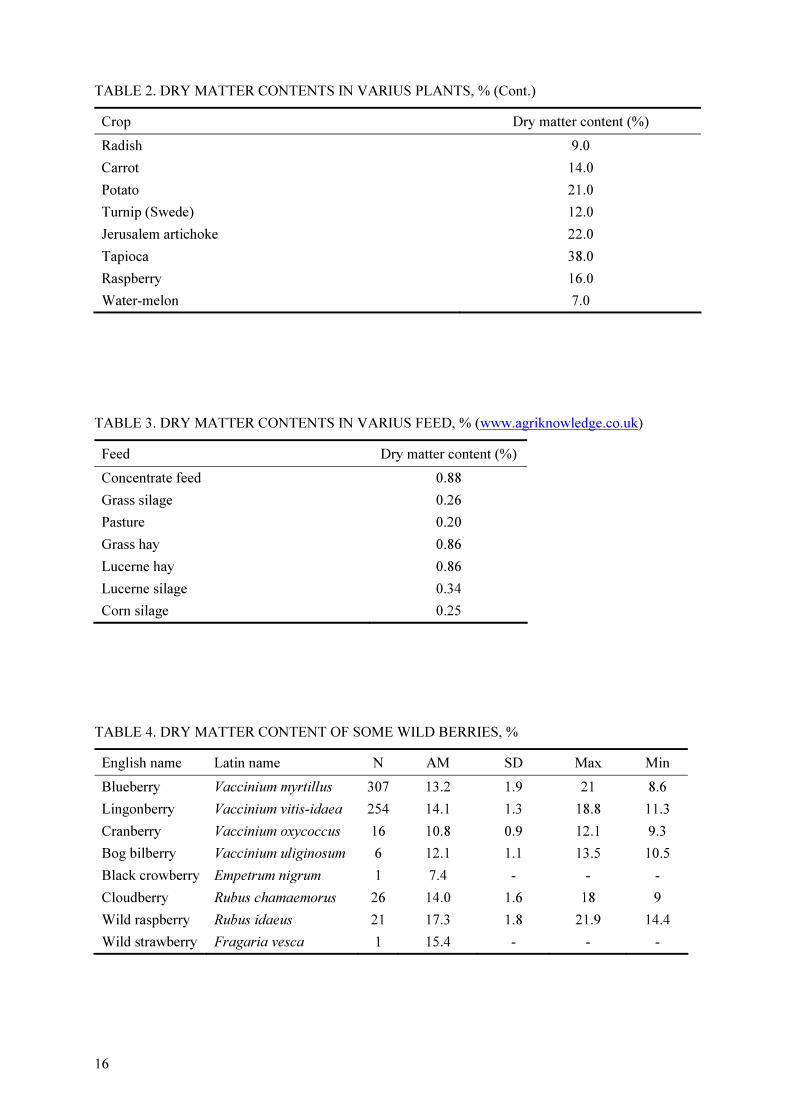
TABLE 2. DRY MATTER CONTENTS IN VARIUS PLANTS, % (Cont.)
Crop Dry matter content (%)
Radish 9.0
Carrot 14.0
Potato 21.0
Turnip (Swede) 12.0
Jerusalem artichoke 22.0
Tapioca 38.0
Raspberry 16.0
Water-melon 7.0
TABLE 3. DRY MATTER CONTENTS IN VARIUS FEED, % (www.agriknowledge.co.uk)
Feed Dry matter content (%)
Concentrate feed 0.88
Grass silage 0.26
Pasture 0.20
Grass hay 0.86
Lucerne hay 0.86
Lucerne silage 0.34
Corn silage 0.25
TABLE 4. DRY MATTER CONTENT OF SOME WILD BERRIES, %
English name Latin name N AM SD Max Min
Blueberry Vaccinium myrtillus 307 13.2 1.9 21 8.6
Lingonberry Vaccinium vitis-idaea 254 14.1 1.3 18.8 11.3
Cranberry Vaccinium oxycoccus 16 10.8 0.9 12.1 9.3
Bog bilberry Vaccinium uliginosum 6 12.1 1.1 13.5 10.5
Black crowberry Empetrum nigrum 1 7.4 - - -
Cloudberry Rubus chamaemorus 26 14.0 1.6 18 9
Wild raspberry Rubus idaeus 21 17.3 1.8 21.9 14.4
Wild strawberry Fragaria vesca 1 15.4 - - -
17
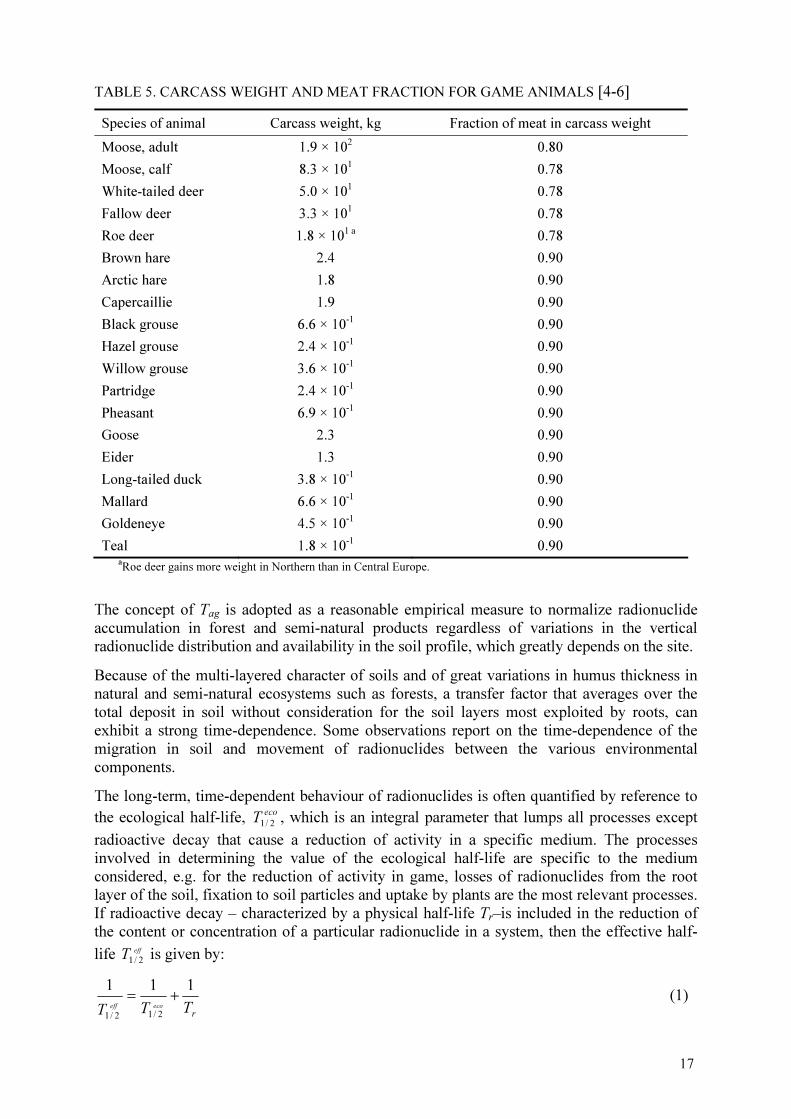
TABLE 5. CARCASS WEIGHT AND MEAT FRACTION FOR GAME ANIMALS [4-6]
Species of animal Carcass weight, kg Fraction of meat in carcass weight
Moose, adult 1.9 × 10² 0.80
Moose, calf 8.3 × 101 0.78
White-tailed deer 5.0 × 101 0.78
Fallow deer 3.3 × 101 0.78
Roe deer 1.8 × 101 a 0.78
Brown hare 2.4 0.90
Arctic hare 1.8 0.90
Capercaillie 1.9 0.90
Black grouse 6.6 × 10⁻¹ 0.90
Hazel grouse 2.4 × 10⁻¹ 0.90
Willow grouse 3.6 × 10⁻¹ 0.90
Partridge 2.4 × 10⁻¹ 0.90
Pheasant 6.9 × 10⁻¹ 0.90
Goose 2.3 0.90
Eider 1.3 0.90
Long-tailed duck 3.8 × 10⁻¹ 0.90
Mallard 6.6 × 10⁻¹ 0.90
Goldeneye 4.5 × 10⁻¹ 0.90
Teal 1.8 × 10⁻¹ 0.90 a
Roe deer gains more weight in Northern than in Central Europe.
The concept of Tag is adopted as a reasonable empirical measure to normalize radionuclide
accumulation in forest and semi-natural products regardless of variations in the vertical
radionuclide distribution and availability in the soil profile, which greatly depends on the site.
Because of the multi-layered character of soils and of great variations in humus thickness in
natural and semi-natural ecosystems such as forests, a transfer factor that averages over the
total deposit in soil without consideration for the soil layers most exploited by roots, can
exhibit a strong time-dependence. Some observations report on the time-dependence of the
migration in soil and movement of radionuclides between the various environmental
components.
The long-term, time-dependent behaviour of radionuclides is often quantified by reference to
the ecological half-life, eco
T2/1
, which is an integral parameter that lumps all processes except
radioactive decay that cause a reduction of activity in a specific medium. The processes
involved in determining the value of the ecological half-life are specific to the medium
considered, e.g. for the reduction of activity in game, losses of radionuclides from the root
layer of the soil, fixation to soil particles and uptake by plants are the most relevant processes.
If radioactive decay – characterized by a physical half-life Tr–is included in the reduction of
the content or concentration of a particular radionuclide in a system, then the effective half-
life effT
2/1 is given by:
rTTT
ecoeff
111
2/12/1
+= (1)

18
2. PLANT AND SOIL CLASSIFICATIONS
Based on the analyses of available information on radionuclide transfer to plants [7-10],
fourteen plant groups have been identified (Table 2). Assignment of individual plants to these
groups is given in Appendix 1 while plant compartments are shown in Table 3. The transfer
of radionuclides through the food chain varies considerably depending on soil properties. In
the FAO/UNESCO soil classification, there are 28 units and 125 sub-units [11]. Fv values are
not available for all units or sub-units, even for the most extensively studied radionuclides.
Therefore, a more broadly based classification is adopted here that permits some distinction
on the basis of texture and organic matter content, while ensuring that a reasonable amount of
data are available for each category.
TABLE 6. PLANT GROUPS AND COMPARTMENTS
Plant group Plant compartment
Cereals Grain, seeds and pods
Stems and shoots
Maize Grain, seeds and pods
Stems and shoots
Rice Grain, seeds and pods
Stems and shoots
Leafy Vegetables Leaves
Non-leafy Vegetables Fruits, heads, berries, buds
Leguminous-Vegetables Seeds and pods
Root Crops Roots
Tubers Tubers
Fruits Fruits, heads, berries, buds
Grasses (cultivated species) Stems and shoots
Fodder Leguminous (cultivated species)
Stems and shoots
Pasture (species mixture – natural or cultivated)
Stems and shoots
Herbs Leaves; grain, seeds and pods; fruits, heads, berries, buds
Other Crops Grain, seeds and pods; leaves; stems and shoots; fruits, heads, berries, buds; roots; tubers
For this document, four soil groups were defined: sand, loam, clay and organic. Soils were
grouped according to the sand and clay mineral percentages referred to the mineral matter,
and the organic matter (OM) content in the soil. This defined the ‘texture/OM’ criterion,
which is similar to the criterion followed in the former Technical Reports Series No. 364. For
the mineral soils, three groups were created according to the sand and clay percentages
referred to the mineral matter [6]: ‘Sand group’: sand fraction ≥65 %; clay fraction <18 %;
‘Clay group’: clay fraction ≥35 %; ‘Loam group’: rest of cases. A soil was included in the
‘Organic group’ if the organic matter content was ≥20 %. Finally, an ‘Unspecified soil group’
was created for soils without characterization data, or for mineral soils with unknown sand
and clay contents.

19
Unspecified group was created for soils without characterization data, or for mineral soils
with unknown sand and clay contents.
Average characteristics of the soils in the different groups are given in Table 7 and more
details of the typical textures of the mineral soil classes are given in Tables 8 and 9, based on
two different texture classification schemes. These general texture soil groups are presented
for different specific soil classifications [1, 11, 12].
REFERENCES
[1] INTERNATIONAL COMMISSION ON RADIATION UNITS AND MEASUREMENTS, ICRU Report 65. Quantities, Units and Terms in Radioecology. Journal of the ICRU 1 2 (2001).
[2] INTERNATIONAL ATOMIC ENERGY AGENCY, Handbook of parameter values for the prediction of radionuclide transfer in temperate environments. Technical Report Series, No. 364, International Atomic Energy Agency, Vienna, 1994
[3] Fodder crops. Handbook. Moscow, 1999 [4] RANTAVAARA, A., NYGRÉN, T., NYGRÉN, K., HYVÖNEN, T., Radioactivity of game
meat in Finland after the Chernobyl accident in 1986, Report STUK-A62. Radiation and Nuclear Safety Authority (Previous name: Finnish Centre for Radiation and Nuclear Safety), Helsinki (1987).
[5] HUNTERS ASSOCIATION, FINLAND, www. riista.fi (2006). [6] JOKELAINEN, A., PEKKARINEN, M., ROINE, P., MIETTINEN, J. K., The diet of Finnish
Lapps, Zeitschrift für Ernährungswissenschaft 3 (1962)110-117. [7] INTERNATIONAL UNION of RADIOECOLOGY, Sixth report of the working group soil-to-
plant transfer factors. European Community Contract B16-052-B, (1989). [8] INTERNATIONAL UNION of RADIOECOLOGY. Working group soil to plant transfer.
Protocol developed between 1982 and 1992. Contact address for protocol: e-mail [email protected]. Contact address for IUR secretariat e-mail: [email protected].
[9] INTERNATIONAL ATOMIC ENERGY AGENCY, Classification of soil systems on the basis of transfer factors of radionuclides from soil to reference plants, IAEA-TECDOC-1497, IAEA, Vienna (2006).
[10] NISBET, A.F., WOODMAN, R.F., HAYLOCK, R.G.E., Recommended soil-to-plant transfer factors for radiocaesium and radiostrontium for use in arable systems. NRPB, Chilton, Didcot, UK (1999).
[11] FOOD AND AGRICULTURE ORGANISATION, UNITED NATIONS EDUCATIONAL, SCIENTIFIC AND CULTURAL ORGANIZATION, Soil map of the world 1 : 5 000 000. UNESCO, Paris (1994).
[12] KOVDA, V.A., Basis of soil science. Moscow, Nauka, (1973) (in Russian).
TABLE 7. USUAL RANGES OF VALUES FOR VARIOUS SOIL PARAMETERS FOR THE SOIL GROUPS ADOPTED
Soil group pH % OM CEC cmolc/kg
Sand content in the mineral matter
fraction
Clay content in the mineral matter
fraction
Sand 3.5-6.5 0.5-3.0 3.0-15.0 ≥65 <18%
Loam 4.0-6.0 2.0-6.5 5.0-25.0 65-82 18-35
Clay 5.0-8.0 3.5-10.0 20.0-70.0 - ≥35
Organic 3.0-5.0 ≥20 20.0-200.0 - -

20
TA
BL
E 8
. F
AO
SO
IL C
LA
SS
IFIC
AT
ION
S B
AS
ED
ON
TE
XT
UR
E [
11]
SO
IL G
RO
UP
SA
ND
L
OA
M
CL
AY
Conte
nt
%
Conte
nt
%
conte
nt
%
Tex
ture
C
lay
(<0
.002
mm
)
San
d
(>0.5
mm
)
Tex
ture
C
lay
(<0.0
02m
m)
Sil
t
(0.0
2-
0.5
mm
)
San
d
(>0
.5m
m)
Tex
ture
C
lay
(<0
.002
mm
)
Sil
t
(0.0
02
-
0.5
mm
)
San
d
(>0
.5m
m)
CO
AR
SE
M
ED
IUM
F
INE
San
d
Loam
y s
and
San
dy l
oam
<1
8
>65
San
dy l
oam
Loam
San
dy
clay
loam
Sil
t lo
am
18-3
5
65
-82
C
lay
Sil
ty c
lay
San
dy c
lay
Cla
y l
oam
Sil
ty
clay
loam
>35
TA
BL
E 9
. R
US
SIA
N S
OIL
CL
AS
SIF
ICA
TIO
NS
BA
SE
D O
N T
EX
TU
RE
[12]
SO
IL G
RO
UP
SA
ND
L
OA
M
CL
AY
Tex
ture
Physi
cal
clay
(<0.0
1m
m)
Cla
y
(<0
.001
mm
) T
extu
re
Physi
cal
clay
(<0.0
1m
m)
Cla
y
(<0
.001
mm
) T
extu
re
Physi
cal
clay
(<0.0
1m
m)
Cla
y
(<0
.001
mm
)
Lig
ht
loam
s sa
nd
y
Lig
ht
loam
s co
arse
si
lty
Loam
y s
and s
and
y
Loam
y
sand
coar
se
silt
y
San
ds
sand
y
San
dy c
oar
se s
ilty
20
-30
2
0-3
0
10
-20
10
-20
0-1
0
0-1
0
<2
0
<1
0
Med
ium
loam
s sl
imy
Med
ium
loam
s si
lty
Med
ium
loam
s
coar
se s
ilty
30
-40
>20-3
5
Hea
vy c
lay s
lim
y
Hea
vy c
lay s
ilty
M
ediu
m &
lig
ht
clay
s sl
imy
Med
ium
& l
ight
clay
s si
lty
Med
ium
& l
ight
clay
s co
arse
sil
ty
Hea
vy l
oam
s sl
imy
Hea
vy l
oam
s si
lty
Hea
vy l
oam
s co
arse
sil
ty
>8
0
>8
0
60
-80
60
-80
60
-80
40
-60
40
-60
40
-60
>3
5
Physi
cal
sand >
0,0
1 m
m;
cl
ay <
0.0
01 m
m;
silt
0.0
01-0
,05 m
m;
sand 0
.5-1
.0 m
m.

21
APPENDIX
TABLE A1. PLANT GROUPS, WITH COMMON AND LATIN NAMES OF ASSOCIATED CROPS
Plant group Common name Latin name
Rye Secale cereale L. subsp. cereale
Wheat Triticum aestivum L. non. cons. Subsp.
aestivum
Oats Avena sativa L.
Barley Hordeum vulgare L.subsp. vulgare
Maize (corn) Zea mays L. subsp. mays
Sorghum Sorghum bicolor (L.) Moench
Millet Panicum L.
Buckwheat Fagopyrum esculentum
Cereals
Foxtail millet, Italian millet Setaria italica L.
Maize Maize (corn) Zea mays L. subsp. mays
Rice Rice Oryza sativa L.
Hiroshimana ( Pot herb, mustard)
Brassica rapa L..
Kikuna (chop suey green) Chrysanthemum coronarium L. var. Spatiosum L.H. Bailey
Mizuna (green) Brassica rapa L. subsp. nipposinica (L.H. Bailey) Hanelt ( Mizuna Group)
Burdock (great burdock) Arcitum lappa L.
Asparagus Asparagus officinalis L.
Purslane Portulaca oleracea L.
Cabbage, flowering Brassica rapa L. var. parachinensis (L.H. Bailey) Hanelt
Chinese spinach Amaranthus tricolor L.
Cauliflower Brassica oleracea L. var. botrytis L.
Cabbage Brassica oleracae L. var. capiatata L.
Leafy vegetables
Pak-choi, Chinese cabbage Brassica rapa L. chinensis (L.) Henelt).
Kale Brassica oleracea L. var. viridis L.
Kohlrabi Brassica oleracea L. var. gonylodes L.
Lettuce Lactuca sativa L.
Leafy vegetables
Leek Allium porrum L.
Swiss Chard Beta vulgaris L. Subsp cicla (L.) W.D.J. Koch var. flavescens (Lat). Lat&DC
Spinach Spinacia oleracea L.
Celery Apium graveiolus L. var. dulce (Mill.) Pers.
Chinese lettuce Lactuca sativa L. var. angustana L.H. Bailey
Sorrel

22
TABLE A1. PLANT GROUPS, WITH COMMON AND LATIN NAMES OF ASSOCIATED CROPS (Cont.)
Plant group Common name Latin name
Tomato Lycopersicon esculentum Mill.
Lady’s finger (gumbo, okra) Abelmoschus esculentus (L.) Moench
Eggplant, (brinjal) Solanum melongena L.
Bottle gourd Lagenaria siceraria (Molina) Standl.
Pepper, banana pepper Capsicum annuum L. var. annuum
Amaranthus (Cherra??) Amaranthus L. spp.
Red chili (pepper) Capsicum frutescens L.
Eggplant Solanum melongena L.
Cucumber Cucumis sativus L. var sativus
Squash (American) Cucurbita pepo L.
Pumpkin (English) Cucurbita pepo L.
Vegetable marrow Cucurbita pepo L.
Zuchini Cucurbita pepo L.
Onion Allium cepa L.
Garlic Allium sativum L.
American artichoke Helianthus tuberosus L.
Non-Leafy vegetables
Pepper Capsicum annuum L. var. annuum
Peas (garden pea, field pea) Pisum sativum L.
Chickpea, garbanzo Cider arietinum L.
Hyacinth-bean Lablab purpureus (L.) Sweet subsp. purpureus
Soybean; soya Glycine max (L.) Merr.
Soya (wild soybean) Glycine max (L.) Merr. (=Glycine hispida L.)
Bean (field, kidney, French, etc.) Phaseolus vulgaris L. cultivars
Lentil Lens culinaris Medik. subsp. culinaris (Ervum
lens L.)
Asiatic haricot bean (Mung-bean)
Phaseolus aurens Roxb. = Vigna radiate (L.) R. Wilczek
Leguminous-vegetables
Horse-beans Vicia faba L, var. equina Pers.
Beet, beetroot, red beet/ Mangold
Beta vulgaris L. subsp. vulgaris (Crassa
Group)
Sugarbeet Beta vulgaris L. subsp. vulgaris
Turnip (Swede) Brassica napus L. var. napobrassica (L.) Rchb.
Radish Raphanus sativus L.
Carrot Daucus carota L. subsp. Sativas (Hoffm.) Arcang.
Root crops
Manioc, manihot; cassava, yucca, tapioca
Manihot esculenta Crantz
Manihot ultissima

23
TABLE A1. PLANT GROUPS, WITH COMMON AND LATIN NAMES OF ASSOCIATED CROPS (Cont.)
Plant group Common name Latin name
Potato Solanum tuberosum L. subsp.tuberosum
Yam Dioscorea L. spp.
Arrowhead Sagittaria sagittifolia L. subsp. Leucopetala (Miq.) Hartog
Tubers
Sweet potato Ipomoea batatas L.
Apple Malus domestica Borkh.
Date palm Phoenix dactylifera L.
Banana Musa L. spp.
Papaya Carica papaya L.
Pear Pyrus L. spp.
Cherry Prunus L. spp.
Apricot Prunus armeniaca L.
Peach Prunus persica (L..) Batsch var. Persica
Prunes or plums Prunus domestica L.
Strawberry Fragaria xananassa Duchesne
Black currant Ribes nigrum L..
Red currant Ribes rubrum L.
Gooseberry Ribes uva-crispa L.
Raspberry Rubus ideaus L.
Blackberry Rubus L. spp.
Melon Cucumis melo L.
Water-melon Citrullus lanatus (Thunb.) Matsum. & Nakai
Lemon Citrus limon (L.) Burm.
Orange Citrus sinensis (L.) Osbeck
Grapefruit Citrus paradisi Macfad.
Mandarin Citrus reticulate Blanco
Avocado Persea Americana Mill. var. americana
Mango Mangifera indica L.
Grapes Vitis L. spp.
Olive Olea europaea L. subsp. europaea
Blueberry Vaccinium L. spp.
Pineapple Ananas comosus (L.) Merr.
Fruits
Pomegranate Punica granatum L.

24
TABLE A1. PLANT GROUPS, WITH COMMON AND LATIN NAMES OF ASSOCIATED CROPS (Cont.)
Plant group Common name Latin name
Sudan grass Sorghum sudanensis (Piper) Sterf.
Perennial Ryegrass Lolium perenne L.
Annual Ryegrass Lolium multiflorum Lam. Var. Westerwoldicum
Bromegrass (smooth brome) Bromus inermis (Leyss.) Holib.
Smooth bromegrass Bromus racemosus L.
Quack grass, couch grass Elytrigia repens (L.) Desv. Ex Nevski.
Siberian crested wheatgrass Agropyron fragile (Roth)P. Candargy subsp. sibircum (Willd.)Melderis
Standard crested wheatgrass Agropyrum desertorum Fisch. Ex Link) Schult.
Fairway crested wheatgrass Agropyrum cristatum (L.) Gaertn.
Timothy grass Phleum pratense L.
Meadow fescue Festuca pratensis Huds.
Red fescue Festuca rubra L.
Redtop (Am) creeping bent grass (Eur)
Agrostis gigantean Roth (American) or Agrostis stolonifera L. (European)
Orchard grass, cocksfoot Dactylis glomerata L.
Bluegrass, meadow grass Poa annua L.
Grasses (cultivated species)
Bluegrass, meadow grass Poa steppe (Kryl.) Roshev.
‘Grass’ Gramineae
Reed grass Calamagrostis Adans. Spp.
Sedge Carex L. spp.
Sheep fescue Festuca ovina L.
Spring vetch (common vetch) Vicia sativa L.
Leucaena Leucaena leucocephala (Lam.) de Wit
Desmodium Desmodium Desv. spp.
Winter vetch (hairy vetch) Vicia villosa Roth.
Peas (field pea) Pisum sativum L. subsp. sativum var. arvense (L.) Poir.
Grass peavine, grass pea Lathyrus sativus L.
Lupin yellow Lupinus luteus L.
Lupin (blue lupin) Lupinus angustifolius L.
Seradella Ornytorus sativus L. Ornithopus satious Brot.
Bean (faba-bean; broad-bean) Vicia faba L.
Clover (crimson clover) Trifolium incarnatum L..
Alfalfa Medicago lupulina L.
Alfalfa blue Medicago sativa L.
Fodder
Leguminous (cultivated
species)
Alfalfa yellow Medicago sativa L. falcate (L.)

25
TABLE A1. PLANT GROUPS, WITH COMMON AND LATIN NAMES OF ASSOCIATED CROPS (Cont.)
Plant group Common name Latin name
Alfalfa hybrid Medicago sativa L. varia (Martyn)
Clover red Trifolium pratense L.
Clover (hybrid clover) Trifolium hybridum L.
Clover white Trifolium repens L.
Esparsetter (animal forage) Onobrychis Mill.
Sweet-clover white Melilotus albus Medik.
Sweet-clover yellow Melilotus officinalis Lam.
Grass-leguminous mixture (festuca+ timothy-clover, oats-clover….)
Natural grasses mixture
Undefined mixture
Pasture (species mixture)
Canadian thistle Cirsium arvense (L.) Scop.
White mustard Sinapis alba L.
Basil, sweet basil Ocimum basilicum L.
Nigundi Vitex negundo L.
Coriander, cilantro Coriandrum salivum L.
Parsley Petroselinum crispum (Mill.) Nyman ex A.W. Hill
Spearmint Mentha spicata L.
Dill Anethum graveolens L.
African spider-flower Cleome gynadra L.
Milkweed, crownplant, (giant-milkweed)
Calotropis gigantea (L.) Dryand. ex W. T. Aiton
Cassia Cassia tora L.
Seaside clerodendrum, (tubbeflower, Turk’s-turban)
Clerodendrum indicum (L.) Kuntze
Wild indigo, fish poison Tephrosia purpurea (L.) Pers.
T. sinapou (Buc’hoz) A. Chev.
Hogweed (red hogweed, red spiderling)
Boerhavia L.
Indian and leaf mustard Brassica juncea L.
Tea Camella sinensis L.
Herbs
Thyme Thymus L.

26
TABLE A1. PLANT GROUPS, WITH COMMON AND LATIN NAMES OF ASSOCIATED CROPS (Cont.)
Plant group Common name Latin name
Rape (winter rape) Brassica napus L.
Margosa Azadirachta indica A. Juss.
Walnut Juglans regia L.
Canola, rape Brassica napus L. napus
Sunflower Helianthus annuus L.
Peanut Arachis hypogaea L.
Flax Linum usitatissiumum L.
Other crops
Tobacco Nicotiana tabacum L.
AGRICULTURAL ECOSYSTEMS: FOLIAR UPTAKE
Radionuclides may be released from nuclear facilities to the terrestrial environment as particulates or gases. The deposition of radionuclides on vegetation and soil represents the starting point for their transfer in the terrestrial environment and in food chains. There are two principal deposition processes for the removal of pollutants from the atmosphere: Dry deposition is the direct transfer to and absorption of gases and particles by natural surfaces such as vegetation, whereas wet deposition is the transport of a substance from the atmosphere to the ground within snow, hail or rain.
Interception is defined as the fraction of a radionuclide deposited by dry and wet deposition that is initially retained by the vegetation. Although the activity retained is subsequently removed by weathering to the soil and, the fraction that is initially intercepted is a very important quantity in any radioecological model. This is because direct deposition may cause relatively high activity concentrations in feed and foods.
Once deposited on vegetation, radionuclides are lost from plants due to removal by wind and rain, either through leaching or by cuticular abrasion. The increase of biomass during growth does not cause a loss of activity; but it does lead to a decrease in activity concentration due to effective dilution. Since growth is subject to seasonal variations, the post-deposition decrease of the activity concentration of plants depends on the season.
Translocation describes the systemic transport of radionuclides in the plant subsequent to foliar uptake. Translocation has no or very little influence on the long-term-fate of radioactivity in the environment, since it describes only the distribution of radionuclides within the plant subsequent to foliar deposition and absorption by the leaves. However, for estimating radionuclide concentrations in foods and for the assessment of doses to man, the systemic transport of radionuclides is a key issue. It is especially important for plants from which only specific parts are used as food or feed, such as cereals and potatoes. For plants that are used whole, such as leafy vegetables or maize silage, translocation is relevant only in that it may reduce the amount of activity that is lost by weathering processes.

29
INTERCEPTION
G. PRÖHL
Helmholtz Zentrum München-Institute of Radiation Protection, Neuherberg, Germany
Absract
The interception of dry and wet deposits represents the link between the atmospheric dispersion of radionuclides
released to the atmosphere and their transport in foodchains. In this section, the processes involved in
interception and their dependence on the characteristics of the deposit and the environmental conditions are
discussed. For dry deposition, the most important factor is the particle size spectrum which depends on the
characteristics of the release and the distance to the release point. Furthermore, the development of the
vegetation, whether the plants are dry or wetted, as well as the actual weather conditions have a considerable
impact on the dry deposition of radionuclides. For iodine isotopes the chemical form has a dominating influence
on the deposition. The interception of wet deposited is the result of a complex interaction of the vegetative
development of the plant canopy, the amount of rainfall, and the chemical form of radionuclides. Due to the
dependence on plant development, interception of both dry and wet deposits is subject to pronounced
seasonality.
1. INTRODUCTION
Interception defines the fraction of radioactivity deposited by wet and dry deposition processes that is initially retained by the plant. This section describes the factors that control interception and discusses existing approaches to estimating interception in radioecological models.
There are several possible ways to quantify the interception of deposited radionuclides. The simplest is the interception fraction f, which is defined as the ratio of the activity initially retained by the standing vegetation Ai immediately subsequent to the deposition event to the total activity deposited At:
t
i
A
Af = (1)
The interception fraction is dependent on the stage of development of the plant. To take account of this, in some experiments and models, the interception fraction is normalized to the standing biomass B (dry mass). This quantity is denoted as the mass interception fraction fB:
B
ffB= (2)
Since the leaf area represents the main interface between atmosphere and vegetation, the interception fraction f is sometimes normalised to the leaf area index (LAI), which is defined as the ratio of the (single-sided) leaf area to the soil area:
LAI
ffLAI
= (3)
2. WET DEPOSITION
Radionuclides in air may be washed out by precipitation. The vegetation retains a fraction of radionuclides deposited with rain, whereas the rest falls through the canopy to the ground. The activity retained is subsequently transferred to the soil by weathering and is only temporarily present on the surface of the vegetation. Nevertheless, the fraction that is initially intercepted is a very important quantity in radioecological models. This is because direct deposition can result in relatively high activity concentrations in feed and foods.

30
2.1. Factors governing interception of wet deposition
The interception of radionuclides is the result of the interaction of various factors, including
the stage of development of the plant, the capacity of the canopy to retain water, elemental
properties of the radionuclide, and the amount of rain during a rainfall event and the intensity
of the precipitation.
2.1.1. Stage of development of the plant
For a specific deposition event, the interception fraction increases with the degree of
development of the plant canopy, as this is associated with a larger contact surface between
the falling rain and the plant surface. There are two principal approaches to representing plant
development, the standing biomass per unit area and the leaf area per unit area (leaf area
index: LAI).
The advantage of the use of standing biomass is easy determination. The sample has simply to
be dried and the mass determined. However, the biomass does not really represent the key
characteristics of the rain/plant interface, which are better represented by the LAI. Whereas in
the early stages of growth, a good relationship between biomass and leaf area can be
observed, the correlation decreases towards the end of growth. Then, the biomass continues to
increase, due to growth of storage organs such as seeds or tubers, whereas the leaf area
decreases substantially, due to dying off of the foliage. So, interception as a function of LAI
may be reasonably consistent across a range of crop types, whereas interception as a function
of standing biomass is likely to be less consistent, requiring the use of crop-specific
parameterizations. The disadvantage of the use of LAI is a complicated determination that
requires specific optical devices, which are usually not available.
The relationship between interception fraction and LAI is shown in Fig. 1, where the
interception fraction for 137
Cs for various species of cereals is plotted against the LAI at the
time of application [1]. The activity was applied at different stages of development for an
artificial rainfall amount of 1 mm. The interception fraction increases in approximate
proportion to the leaf area index, though there is some indication of levelling off of the
intercepted fraction at large values of the LAI.
0.0
0.2
0.4
0.6
0.8
0 1 2 3 4 5 6 7
Leaf area index
Inte
rce
pti
on
fra
cti
on
FIG.1. Relationship between the interception fraction for 137
Cs by barley and the leaf area index for a
simulated rainfall amount of 1 mm [1].
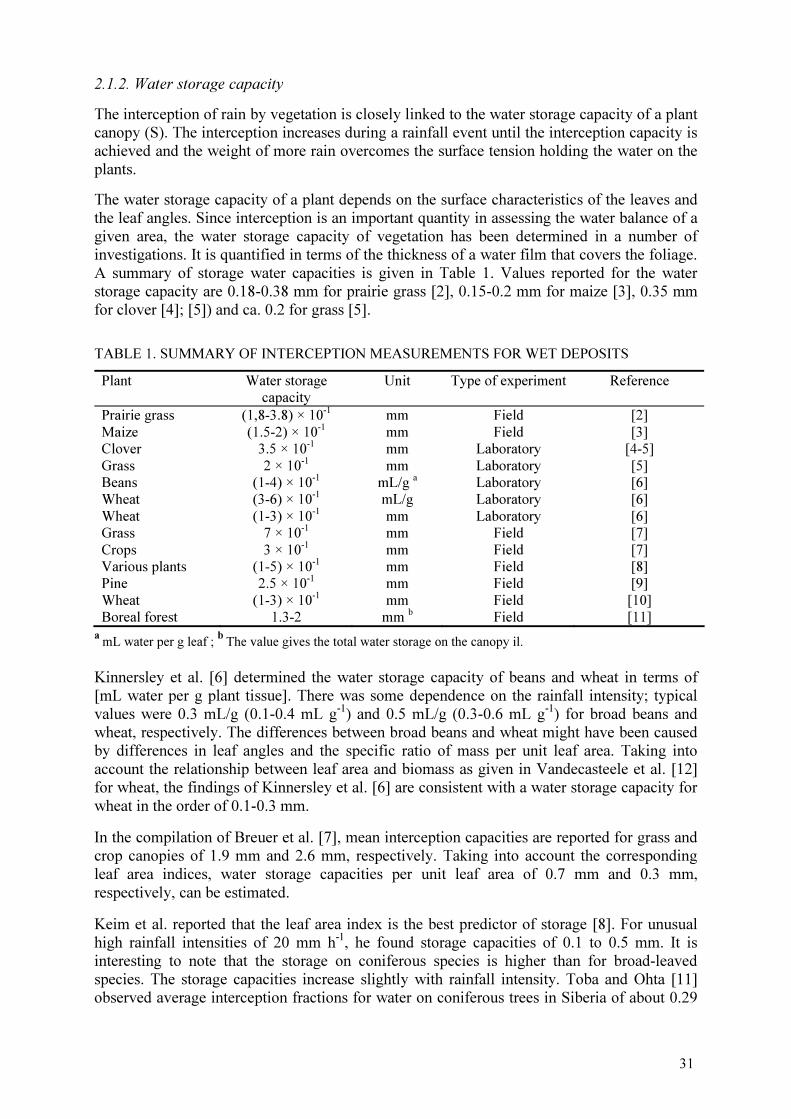
31
2.1.2. Water storage capacity
The interception of rain by vegetation is closely linked to the water storage capacity of a plant
canopy (S). The interception increases during a rainfall event until the interception capacity is
achieved and the weight of more rain overcomes the surface tension holding the water on the
plants.
The water storage capacity of a plant depends on the surface characteristics of the leaves and
the leaf angles. Since interception is an important quantity in assessing the water balance of a
given area, the water storage capacity of vegetation has been determined in a number of
investigations. It is quantified in terms of the thickness of a water film that covers the foliage.
A summary of storage water capacities is given in Table 1. Values reported for the water
storage capacity are 0.18-0.38 mm for prairie grass [2], 0.15-0.2 mm for maize [3], 0.35 mm
for clover [4]; [5]) and ca. 0.2 for grass [5].
TABLE 1. SUMMARY OF INTERCEPTION MEASUREMENTS FOR WET DEPOSITS
Plant Water storage capacity
Unit Type of experiment Reference
Prairie grass (1,8-3.8) × 10-1
mm Field [2]
Maize (1.5-2) × 10-1
mm Field [3] Clover 3.5 × 10⁻¹
mm Laboratory [4-5]
Grass 2 × 10⁻¹ mm Laboratory [5]
Beans (1-4) × 10-1 mL/g
a Laboratory [6]
Wheat (3-6) × 10-1 mL/g Laboratory [6]
Wheat (1-3) × 10-1 mm Laboratory [6]
Grass 7 × 10⁻¹ mm Field [7]
Crops 3 × 10⁻¹ mm Field [7]
Various plants (1-5) × 10-1 mm Field [8]
Pine 2.5 × 10⁻¹ mm Field [9]
Wheat (1-3) × 10-1 mm Field [10]
Boreal forest 1.3-2 mm b Field [11]
a mL water per g leaf ;
b The value gives the total water storage on the canopy il.
Kinnersley et al. [6] determined the water storage capacity of beans and wheat in terms of
[mL water per g plant tissue]. There was some dependence on the rainfall intensity; typical
values were 0.3 mL/g (0.1-0.4 mL g-1
) and 0.5 mL/g (0.3-0.6 mL g-1
) for broad beans and
wheat, respectively. The differences between broad beans and wheat might have been caused
by differences in leaf angles and the specific ratio of mass per unit leaf area. Taking into
account the relationship between leaf area and biomass as given in Vandecasteele et al. [12]
for wheat, the findings of Kinnersley et al. [6] are consistent with a water storage capacity for
wheat in the order of 0.1-0.3 mm.
In the compilation of Breuer et al. [7], mean interception capacities are reported for grass and
crop canopies of 1.9 mm and 2.6 mm, respectively. Taking into account the corresponding
leaf area indices, water storage capacities per unit leaf area of 0.7 mm and 0.3 mm,
respectively, can be estimated.
Keim et al. reported that the leaf area index is the best predictor of storage [8]. For unusual
high rainfall intensities of 20 mm h-1
, he found storage capacities of 0.1 to 0.5 mm. It is
interesting to note that the storage on coniferous species is higher than for broad-leaved
species. The storage capacities increase slightly with rainfall intensity. Toba and Ohta [11]
observed average interception fractions for water on coniferous trees in Siberia of about 0.29

32
and 0.36 for total amounts of rainfall of 59 and 49 mm that fell during 13 and 9 rainfall
events, respectively, at mean intensities of 0.6 mm h-1
. In the same study, interception
fractions for water were determined at Japanese sites of 0.13 to 0.24 with average amounts of
precipitation per rainfall event of 10-50 mm.
In measurements on Pinus Koraiensis Nakai, Anzhi et al. have determined water storage
capacities of about 0.25 mm for rainfall intensities of about 50 mm h-1
[9]. The capacity
dropped continuously to 0.15 mm, when the intensity increased to 150 mm h-1
. This intensity
is extraordinarily high for field conditions. Furthermore, Anzhi et al. [9] studied the
relationship between water storage capacity, LAI, and rainfall intensity. They found a linear
relationship between water storage capacity and LAI. The water storage capacity was much
less dependent on the rainfall intensity. For a given LAI, the storage capacity dropped by 20
%, when the rainfall intensity increased by a factor of 3.
Anzhi et al. [9] also investigated the water storage as a function of the wetness of the canopy.
Their experimental design is appropriate to estimation of the interception of intermittent rain.
It was found that the interception of water on wet canopies decreases as the wetness of the
canopy increases.
During sprinkler irrigation experiments with winter wheat in China, Kang et al. [10] found a
very good correlation between LAI and water storage. The estimated amounts of water stored
by the canopy were 0.2 mm, 0.6 mm, 0.9 mm, and 0.6 mm for LAI values of 2.3, 2.8, 6.6, and
6.7, respectively. A trend to lower water storage was observed when the wind speed
increased.
2.1.3. Element properties
The interception of a wet-deposited radionuclide is controlled by the storage capacity of water
and the interaction of the radionuclide with the leaf surface, which strongly depends on the
chemical form of the deposit. The differences in interception between different elements are
due to their different valencies. As plant surfaces are negatively charged, they have properties
of a cation exchanger [13]. Therefore, the initial retention of anions such as iodide is less than
for polyvalent cations, which seem to be very effectively retained on the plant surface. In
Table 2, the mass interception factor (Bf ) values, as measured in Neuherberg (Germany) and
corrected for radioactive decay, are given for the period of May 1-6, 1986, for 106
Ru, 131
I, 137
Cs and 140
Ba [14]. Since most of the deposition occurred during a heavy shower on April,
30 and May 1, dry deposition of 106
Ru, 137
Cs, and 140
Ba did not contribute significantly to the
total deposition [15] The mass interception factors increase in the order 106
Ru, 131
I, 137
Cs, 140
Ba, with these radionuclides having been deposited during the same rainfall event. The
highest values were observed for 140
Ba, which behaves similarly to strontium. Barium is a
bivalent cation, and seems to be more strongly retained on the negatively charged plant
surface than the monovalent caesium cation. The mass interception factor is smaller for
iodine, which was probably deposited as a monovalent anion on the plant surface.
The mass interception factors for 106
Ru are slightly lower than those for 131
I. However,
accounting for the contribution of dry deposition due to the presence of elemental iodine, this
may indicate that ruthenium behaved similarly to iodine in respect of the interception of a wet
deposit. However, since the information about the chemical form of ruthenium is very limited
and speculative, it cannot be determined whether this observation is typical for ruthenium or
specific for the Chernobyl accident. In the following days, the differences in the mass
interception factors were less than on the first day, due to the increasing contribution of dry
deposition in that period during which only small amounts of precipitation fell.

33
These observations agree very well with those reported by Hoffman et al. [16] who measured
the mass interception factors for a variety of anions and cations on the leaves of several tree
species (Fig. 2) during a simulated shower of 8.5 mm. The mass interception factors for
cations are approximately a factor of 3 to 5 higher than for anions such as iodide or sulphate.
Compared with the effects of valence, the data of [16] suggest that plant properties are of less
importance.
Mean of 5 plant species, 8.6 mm rain
0
0.5
1
1.5
2
Cd
-10
9
Be
-7
Cr-
51
Sr-
85
Ce
-14
1
S-3
5
I-1
31
Ma
ss
in
terc
ep
tio
n f
rac
tio
n
(m²/
kg
)
FIG. 2. Comparison of the mass interception fractions for radionuclides in cationic and anionic forms [16].
2.1.4. Amount of rain
Since the capacity of plant canopy to retain water is limited, the interception fraction
decreases in general with increasing amount of rainfall in a rainfall event.
The effect of the amount of rainfall applied on the mass interception factors is obvious from
Fig. 3, where the interception factor values for 137
Cs are plotted against the amounts of
rainfall for two rainfall intensities [6]. The data presented demonstrate that the interception
factor is inversely proportional to the amount of rainfall. Although the rainfall intensity varied
by a factor of 3, its impact on the interception was of minor importance.
2.2. Measured values for wet deposition
As discussed above, the interception fraction is the result of a complex interaction of plant
development, rainfall and radionuclide chemical properties. So, dependent on the
circumstances, the interception fraction varies from close to zero to almost one.
Experimentally determined interception fractions are summarized in Table 2 by element, crop,
stage of development and amount of rainfall. Unfortunately, there is no generally agreed
quantity to express interception. Often the interception fraction f is used, which is defined as
the fraction of the deposited material that is initially retained by vegetation.

34
TABLE 2. SUMMARY OF INTERCEPTION MEASUREMENTS FOR WET DEPOSITION
Element/ conditions
Crop Standing biomass
Amount of rainfall (mm)
Interception fraction
Mass interception fraction (m² kg-1)
Reference
Chernobyl
140Ba
Grass 1.7
137Cs
1.1
131I 7 × 10
-1
106Ru
5.6
4.8 × 10⁻¹
[11-14]
Simulated Rain
131I Grass 4.3
Clover
1
8.7
Grass 1.6
Clover
2
4.1
Grass 1.1
Clover
4
2.5 90
Sr Grass 7.6
Clover
1
8.2
Grass 5.1
Clover
2
8.0
Grass 4.8
Clover
4
8.2
[5-17]
137Cs Wheat n.a. 4 × 10
-1 b 3 × 10
-2 c 1.4 [6]
7 × 10⁻¹
7.4 × 10⁻²
3.5
1.5 2.9 × 10⁻²
1.4
4.4 2.4 × 10⁻²
1.2
8.9 1.4 × 10⁻²
5 × 10⁻¹
Beans n.a. 3.4 × 10⁻¹
5.9 × 10⁻²
2.1
6.8 × 10⁻¹
3.1 × 10⁻²
1.1
1.4 3.9 × 10⁻²
1.4
4.1 1 × 10⁻²
4 × 10⁻¹
8.2 1.3 × 10⁻²
5 × 10⁻¹
Grass n.a. 4.5 × 10⁻¹
1.8 × 10⁻¹
4.6
9 × 10⁻¹
2.1 × 10⁻¹
5.5
1.8 1.1 × 10⁻¹
2.8
5.4 3.6 × 10⁻²
9 × 10⁻¹
1.1 × 101 2.7 × 10
-2 7 × 10
-1
Pure watera Grass 1 6.2
Clover 1.1 × 101
Grass 2 4.3
Clover 5.9
Grass 4 1.8
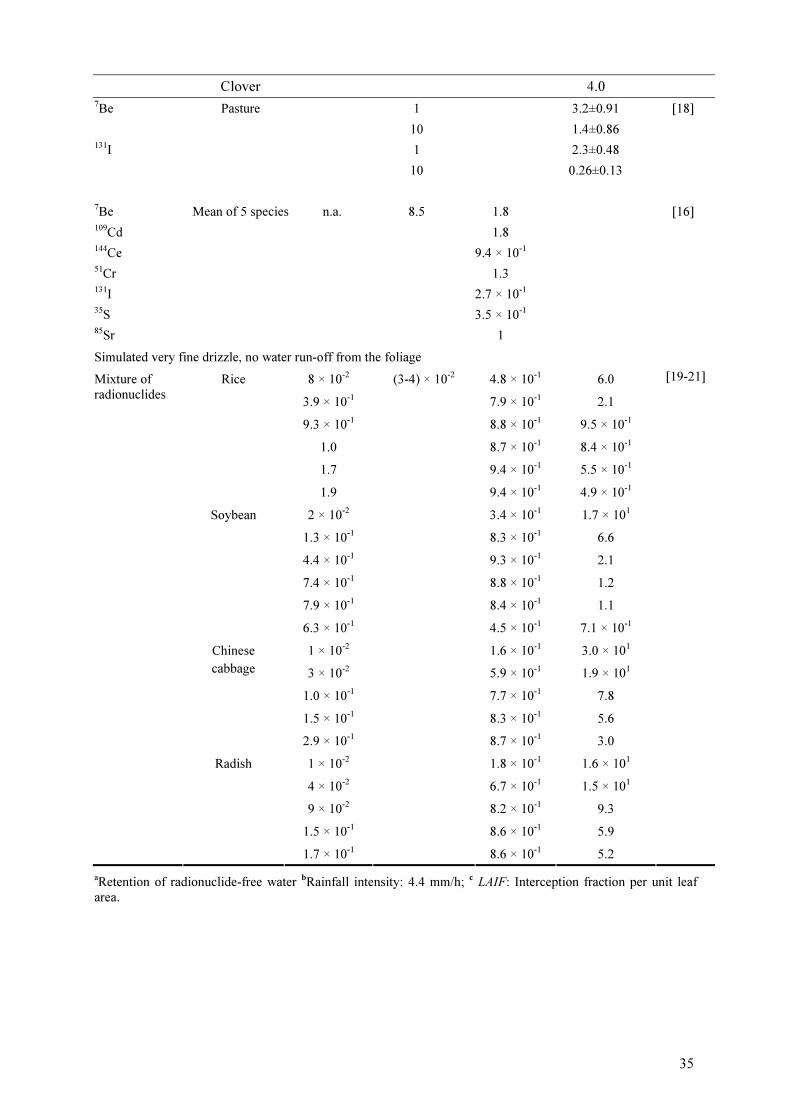
35
Clover 4.0
1 3.2±0.91 7Be
10 1.4±0.86
1 2.3±0.48 131I
Pasture
10 0.26±0.13
[18]
7Be Mean of 5 species n.a. 8.5 1.8 [16] 109Cd 1.8 144Ce 9.4 × 10⁻¹ 51Cr 1.3 131I 2.7 × 10⁻¹ 35S 3.5 × 10⁻¹ 85Sr 1
Simulated very fine drizzle, no water run-off from the foliage
8 × 10⁻² 4.8 × 10⁻¹ 6.0
3.9 × 10⁻¹ 7.9 × 10⁻¹ 2.1
9.3 × 10⁻¹ 8.8 × 10⁻¹ 9.5 × 10⁻¹
1.0 8.7 × 10⁻¹ 8.4 × 10⁻¹
1.7 9.4 × 10⁻¹ 5.5 × 10⁻¹
Rice
1.9 9.4 × 10⁻¹ 4.9 × 10⁻¹
2 × 10⁻² 3.4 × 10⁻¹ 1.7 × 101
1.3 × 10⁻¹ 8.3 × 10⁻¹ 6.6
4.4 × 10⁻¹ 9.3 × 10⁻¹ 2.1
7.4 × 10⁻¹ 8.8 × 10⁻¹ 1.2
7.9 × 10⁻¹ 8.4 × 10⁻¹ 1.1
Soybean
6.3 × 10⁻¹ 4.5 × 10⁻¹ 7.1 × 10⁻¹
1 × 10⁻² 1.6 × 10⁻¹ 3.0 × 101
3 × 10⁻² 5.9 × 10⁻¹ 1.9 × 101
1.0 × 10⁻¹ 7.7 × 10⁻¹ 7.8
1.5 × 10⁻¹ 8.3 × 10⁻¹ 5.6
Chinese
cabbage
2.9 × 10⁻¹ 8.7 × 10⁻¹ 3.0
1 × 10⁻² 1.8 × 10⁻¹ 1.6 × 101
4 × 10⁻² 6.7 × 10⁻¹ 1.5 × 101
9 × 10⁻² 8.2 × 10⁻¹ 9.3
1.5 × 10⁻¹ 8.6 × 10⁻¹ 5.9
Mixture of
radionuclides
Radish
1.7 × 10⁻¹
(3-4) × 10-2
8.6 × 10⁻¹ 5.2
[19-21]
aRetention of radionuclide-free water bRainfall intensity: 4.4 mm/h; c LAIF: Interception fraction per unit leaf
area.

36
0.01
0.1
1
0 5 10 15
Rainfall (mm)
Inte
rce
pti
on
fra
cti
on
Intensity=18.5 mm/h
Intensity=5,4 mm/h
FIG. 3. Interception of
137Cs by grass as function of the amount of rainfall and rainfall intensity [6].
To account for the plant development, in some experiments the interception fraction was normalized to the standing biomass B to obtain the mass interception factor Bf / (m² kg-1), which facilitates the comparison of experiments performed with different values of biomass. However, normalizing the interception fraction is only justified as long as the exposed leaf area increases in proportion to the standing biomass. This is only the case in the first part of the growth. In the second part of the growing period the biomass still increases, whereas the leaf area decreases [22]. Furthermore, in all estimations of f or fB, it should be carefully checked whether the deposition is dry or wet, since the deposition mode has a large influence on the interception fraction, as is discussed below. The values are therefore only warranted if the deposition scenario under which f or
Bf is to be applied is similar to the situation for
which these parameters were derived.
In Table 2, only measurements designed to determine interception fractions were included. There are a number of experiments in which radionuclides dissolved in water were sprayed on leafs of plants with the primary objective of determining post-deposition retention and systemic transport. In those experiments, the application technique is not consistent with natural rainfall, since very low amounts of water and very fine sprays were used to optimise the wetting of the plant. Also, the spray often was targeted to the plants to minimise initial losses of radionuclides.
3. DRY DEPOSITION
3.1. Definitions
Absolute rates of dry deposition and interception of dry deposits by vegetation need to be considered together. Dry deposition, quantified through use of a deposition velocity, is dependent on the characteristics of the surface, which is often parameterised by the surface roughness [23], which, in general, increases with the development of the plant canopy. This means that the deposition increases with the development of the canopy.
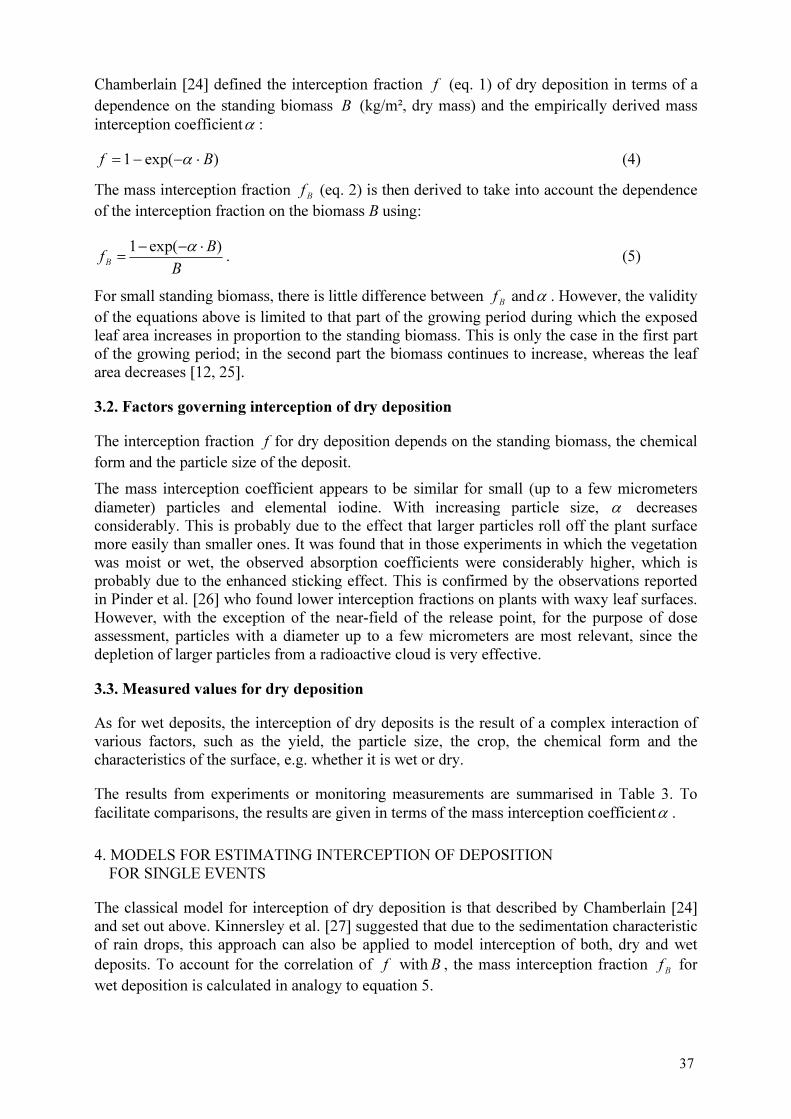
37
Chamberlain [24] defined the interception fraction f (eq. 1) of dry deposition in terms of a dependence on the standing biomass B (kg/m², dry mass) and the empirically derived mass interception coefficientα :
)exp(1 Bf ⋅−−= α (4)
The mass interception fraction Bf (eq. 2) is then derived to take into account the dependence
of the interception fraction on the biomass B using:
B
BfB
)exp(1 ⋅−−
=
α
. (5)
For small standing biomass, there is little difference between Bf andα . However, the validity
of the equations above is limited to that part of the growing period during which the exposed leaf area increases in proportion to the standing biomass. This is only the case in the first part of the growing period; in the second part the biomass continues to increase, whereas the leaf area decreases [12, 25].
3.2. Factors governing interception of dry deposition
The interception fraction f for dry deposition depends on the standing biomass, the chemical form and the particle size of the deposit.
The mass interception coefficient appears to be similar for small (up to a few micrometers diameter) particles and elemental iodine. With increasing particle size, α decreases considerably. This is probably due to the effect that larger particles roll off the plant surface more easily than smaller ones. It was found that in those experiments in which the vegetation was moist or wet, the observed absorption coefficients were considerably higher, which is probably due to the enhanced sticking effect. This is confirmed by the observations reported in Pinder et al. [26] who found lower interception fractions on plants with waxy leaf surfaces. However, with the exception of the near-field of the release point, for the purpose of dose assessment, particles with a diameter up to a few micrometers are most relevant, since the depletion of larger particles from a radioactive cloud is very effective.
3.3. Measured values for dry deposition
As for wet deposits, the interception of dry deposits is the result of a complex interaction of various factors, such as the yield, the particle size, the crop, the chemical form and the characteristics of the surface, e.g. whether it is wet or dry.
The results from experiments or monitoring measurements are summarised in Table 3. To facilitate comparisons, the results are given in terms of the mass interception coefficientα .
4. MODELS FOR ESTIMATING INTERCEPTION OF DEPOSITION FOR SINGLE EVENTS
The classical model for interception of dry deposition is that described by Chamberlain [24] and set out above. Kinnersley et al. [27] suggested that due to the sedimentation characteristic of rain drops, this approach can also be applied to model interception of both, dry and wet deposits. To account for the correlation of f withB , the mass interception fraction
Bf for
wet deposition is calculated in analogy to equation 5.

38
TABLE 3. SUMMARY OF INTERCEPTION MEASUREMENTS OBTAINED FROM FIELD EXPERIMENTS FOR DRY DEPOSITS
Deposited material Diameter
(µm) Crop
Interception fraction (f)
Interception coefficient [m² kg-1] (α) Reference
Mean±SD Grass 3.1±0.15 (α) [24]
Wheat, dry 3.2±0.5 (α) [24]
Lycodium spores 32
Wheat, moist 9.6±3.7 (α) [24]
Quartz particles 44-88 Grass 2.7±0.3 (α) [28]
Grass, dry 0.44±0.15 (α) 40-63
Grass, wet 0.88±0.13 (α)
Grass, dry 0.23±0.07 (α) 63-100
Grass, wet 0.69±0.16 (α)
Grass, dry 0.24±0.07 (α)
Sand particles
100-200
Grass, wet 0.46±0.11 (α)
[29] [29] [29] [29] [29] [29]
238Pu particles ≈1 Corn 3.6±0.05 (α) 131I vapour Grass 2.8±0.1 (α)
[30] [30]
212Pb vapour Artificial grass 13 (α) [31]
Beans 30 d a 1-1.2 (α)
45 d 1.1 (α)
85Sr, 133Ba, 137Cs
65 d 0.85-0.93 (α) 85Sr, 133Ba, 137Cs, 123Te
3.5
85 d 0.3 (α)
[32] [32] [32] [32] [32]
0.84±0.06 ( f ) 85Sr, 133Ba, 137Cs, 123Te
3.5 Grass
3.27±1.15 (α)
[32] [32]
137Cs, 85Sr Wheat )316.0exp(1 LAIf ⋅−−=
))1.13exp(1(85.0 Bf ⋅−−⋅=
b
[12] [12]
4 0.71±0.1 ( f ) [33]
10 0.88±0.07 ( f ) [33]
18 0.88±0.08 ( f ) [33]
22
Lettuce
0.81±0.23 ( f ) [33]
4 0.56±0.29 ( f ) [33]
Spherical porous silica particles
22
Wheat
0.65±0.13 ( f ) [33]
4 1.6 ( f ) [34] Spherical porous silica particles 22
Wheat
1.2 ( f ) [34]
Uranium particles (wind tunnel)
0.82 Spruce (LAI=3.1)
0.97 ( f ) [35]
Rice 0.04-0.12 ( LAIf / ), n=6
Wheat 0.05-0.09 ( LAIf / ), n=2
Carrot 0.1-0.3 ( LAIf / ), n=2
Cabbage 0.18-0.2 ( LAIf / ), n=2
90Sr,137Cs
Tomato 0.08-0.9 ( LAIf / ), n=2
[36] [36] [36] [36] [36] [36]
a Days after sowing, b B–Yield (kg m-2, dry mass).

39
Most of the work has been done for pasture grass and little for other crop types [27]. Vandecasteele et al. [12] concluded that the approach of Chamberlain [24] is only adequate for plants that are in the vegetative period, when a good correlation exists between biomass and leaf area.
However, when canopies switch from vegetative to generative development, biomass continues to increases, whereas the leaf area remains constant and subsequently declines. Therefore, Vandecasteele et al. [12] have proposed a modified model as:
LAIef ⋅−
−=
β1 (6)
and
LAI
ef
LAI
LAI
⋅−
−
=
β1 (7)
where β is the interception coefficient referred to LAI, and is dimensionless.
Figs. 4 and 5 compare the dependence of the interception fraction f of particles by wheat plants on the biomass (Fig. 5) and on the leaf area (Fíg. 6) [12]. In both cases, a good correlation has been found.
0
0.2
0.4
0.6
0.8
1
0 0.2 0.4 0.6 0.8 1 1.2
Biomass (kg/m²)
Inte
rce
pti
on
fra
cti
on
Cs
Sr
f=0.85*(1-exp(-13.09*B))
FIG. 4. Relationship between the interception fraction f of
137Cs and
90Sr particles on wheat
and the above-ground biomass (DW) [12].
FIG. 5. Relationship between the interception fraction f for 137
Cs and 90
Sr particles on wheat and the
leaf area index, LAI [12].

40
0.01
0.1
1
10
0 10 20 30
Rainfall (mm)
Mas
s i
nte
rce
pti
on
fra
cti
on
(m
²/k
g)
I-131 (Masurements)
I-131 (equation 8)
FIG. 6. Comparison of measured mass interception fractions for
131I on grass [16] and the model
approach represented [37].
Kinnersley et al. [27] stated that, for wet deposition, α varies with vegetation type, amount of rainfall and element. These dependencies are taken into account in the approach described in Müller and Pröhl [36] who modelled the interception fraction for wet deposits as a function of the leaf area index LAI, the storage capacity of the plant S, an element-dependent factor k that quantifies the ability of the element to be attached to the leaves and the total amount of rainfall R that falls during a single event:
)1;1min( 3
)2ln(
⎥⎦
⎤⎢⎣
⎡−
⋅⋅=
⋅
⋅⋅⋅
− RSke
R
SkLAIf (8)
For k, values of 0.5, 1 and 2 are assumed for anions (iodide, sulphate), monovalent cations (e.g. Cs) and polyvalent cations, respectively. For the water storage capacity, 0.2 mm is assumed for grass, cereals and corn, and 0.3 mm for all other crops.
The approach shown in equation 8 is consistent with the findings of Kinnersley et al. [6], who carried out interception experiments for grass, broad beans, and wheat. The interception decreased with increasing rainfall, since the plant surface approached a saturation level of contamination. For the interception fraction, the total amount of rainfall was more important than the rainfall intensity. The water storage capacity for beans and wheat was found to approach saturation as total rainfall increased in a manner similar to that of the measured contamination levels. The findings obtained confirmed that interception of wet deposits can be modelled appropriately by a water storage capacity term and a ‘chemical term’ derived from the affinity of a particular chemical form (or valence state) for a particular plant surface.
Good agreement of this approach (equation 8) is found with the interception of 131I (anions) measured by Hoffman et al. (1995) [16] in field experiments (Fig. 6). However, for rainfall events above 10 mm, equation 8 seems to under-predict the interception of the cationic 7Be (Fig. 7) that was used in the same experiments. Due to the negative charge of the plant surface, cations are apparently intercepted more effectively than would be expected from the retention of the water film.

41
0.01
0.1
1
10
0 10 20 30
Rainfall (mm)
Ma
ss
in
terc
ep
tio
n f
rac
tio
n (
m²/
kg
)
Be-7 (Measurements)
Be-7 (Equation 8)
FIG. 7. Comparison of measured mass interception fractions for
7Be on grass [16] and the model
approach represented [37].
5. CONCLUSIONS
For the interception of dry and wet deposits by vegetation, the development of the plant canopy is a key factor. The biomass density or the leaf area index may be used to quantify the development of the plant. During vegetative growth, both approaches are equally appropriate, whereas, during the generative phase, the leaf area index is a more adequate basis for interception modelling. In this phase, the biomass increases whereas the leaf area declines. Variations in the degree of interception of both dry and wet deposits are less if it is normalised to the standing biomass or to the leaf area index.
For dry deposition, the particle size is the other key parameter. Interception is more effective for small particles and reactive gases. Interception of wet-deposited radionuclides is a result of the complex interaction of the chemical form of the element, the development of the plant, and the amount of rainfall. It has been found that rainfall intensity appears to be of minor importance in determining interception.
The existing data show the interception of both dry and wet deposits depends on the chemical form of the deposit and its interaction with the plant surface and the canopy structure. A deeper knowledge about the processes involved would considerably improve the predictive power of the models applied so far.
Specific data for interception are available only for a few elements, such as caesium, strontium and iodine. Single estimates are available for a few other elements. This means, for the majority of elements, interception is derived from analogy based on the assumed chemical form and valence of the element.
In case of long-term precipitation and irrigation, there are indications that the interception of wet deposited polyvalent cationic radionuclides may be a factor 2 or 3 larger than given by the approach based on water storage capacity and leaf area index. Due to the negative charge of the plant surface, the radionuclide retention of cations by the leaf is enhanced. The existing data are not sufficient to provide a reliable quantification of such effects.

42
REFERENCES
[1] VOIGT, G., PRÖHL, G., MÜLLER, H., Experiments on the seasonality of the Caesium translocation in cereals, potatoes and vegetables, Radiation and Environmental Biophysics, 30 (1991) 295-303.
[2] CLARK, O.R., Interception of rainfall by prairie grasses, weeds and certain crop plants, Ecological Monographs 10 (1940) 243-277.
[3] STOLTENBERG, N., WILSON, T.V., Interception storage of rainfall by corn plants, Transactions – American Geophysical Union 31 (1950) 443-448.
[4] REINIGER, P., LEVI, E., COPPOLA, M., “Measurement of surface storage on rye-grass and clover by nuclear methods”, Isotope and radiation techniques in soil physics and irrigation studies, (Proc. Int. Conf., Vienna, 1-5 Oct 1973), IAEA-SM176/1 Vienna (1974) 327-334.
[5] ANGELETTI, L., LEVI, E.: Etude comparative des facteurs de transfert de l`eau, de l’iode et du strontium sur le ray-grass et le trèfle. Centre d’Etude Nucléaires, Fontenay-aux-Roses, France, Rapport CEA-R-4860, (1977)
[6] KINNERSLEY, R.P. GODDARD, A.J.M., MINSKI, M.J., SHAW, G., Interception of Caesium-contaminated rain by vegetation, Atmospheric Environment 31 (1997) 1137-1145.
[7] BREUER, L., ECKHARDT, K., FREDE, H.-G, Plant parameter values for models in temperate climates, Ecological Modelling 169 (2003) 237-293.
[8] KEIM, R.F., SKAUGET, A.E., WEILER, M., Storage water on vegetation under simulated rainfall of varying intensity, Advances in Water Resources (13 October 2005) http://www.sciencedirect.com
[9] ANZHI, W., JINZHONG, L., JIANMEI, L., TIEFAN, P., CHANGJIE, J., A semi –theoretical model of canopy rainfall interception for Pinus Koraiensis Nakai, Ecological Modelling 184 (2005) 355-361.
[10] KANG, Y., WANG, Q.-G., LIU, H.-J., Winter wheat canopy interception and its influence factors under sprinkler irrigation, Agricultural Water Management 74 (2005)189-199.
[11] TOBA, L., OHTA; T., An observational study of the factors that influence interception loss in boreal and temperate forests, Journal of Hydrology 313 (2005) 208-220.
[12] VANDECASTEELE, C.M., BAKER, S., FÖRSTEL, H., MUZINSKY, M., MILLAN, R., MADOZ-ESCANDE, C., TORMOS, J., SAURAS, T., SCHULTE, E., COLLE, C., Interception, retention, translocation under greenhouse conditions of radiocaesium and radiostrontium from a simulated accidental source, Science of the Total Environment 278 (2001) 199-214.
[13] ERTEL, J., PARETZKE, H.G., ZIEGLER, H., Cs-137 penetration by contact exchange through isolated plant cuticles: cuticles as asymmetric transport membranes, Plant Cell Environment 15 (1992) 211-219.
[14] JACOB, P., MÜLLER, H., PRÖHL, G., VOIGT, G:, BERG, D., PARETZKE, H.G., REGULLA, D., Environmental behaviour of radionuclides deposited after the reactor accident of Chernobyl and related exposures, Radiation and Environmental Biophysics 32 (1993) 193-207.
[15] HÖTZL, H., ROSNER, G., WINKLER, R., Ground depositions and air concentration of Chernobyl fallout radionuclides at Munich-Neuherberg, Radiochimica Acta 41 (1987) 181-190.
[16] HOFFMAN, F.O., THIESSEN, K.M., RAEL, R.M., Comparison of interception and initial retention of wet-deposited contaminants on leaves of different vegetation types, Atmospheric Environment 29 (1995) 1771-1775.
[17] ANGELETTI, L., La contamination des paturages par l'iode-131; CEA-R-5056, (1980). [18] HOFFMAN, F.O., THIESSEN, K.M., FRANK, M.L., BLAYLOCK, B.G. Quantification of the
interception and initial retention of radioactive contaminants deposited on pasture grass by simulated rain; Atmospheric Environment 26A (1992) 3313-3321.
[19] CHOI, Y.H., LIM, K.M., YU, D., PARK, H.G., CHOI, Y.G., LEE, C.M., Transfer pathways of 54Mn, 57Co, 85Sr, 103Ru and 134Cs in rice and radish plants directly contaminated at different growth stages, Annals of Nuclear Energy 29 (2002) 429-446
[20] CHOI, Y.H., LIM, K.M., PARK, H.G., LEE, W.Y., LEE, C.W., Contamination of Chinese cabbage with 85Sr, 103Ru and 134Cs related to time of foliar application, Journal of the Korean Association for Radiation Protection 23 (1998) 219-227 (in Korean).
43
[21] LIM, K.M., PARK, D.W., PARK, H.G., CHOI, Y.H., CHOI, S.D., LEE, C.M., Analysis of the direct contamination pathway of 85Sr, 103Ru and 134Cs in soybean (Proc. Korean Nuclear Society Spring Meeting, Cheju, Republic of Korea, May 24-25. 2001) (2001) (CD in Korean.
[22] PRÖHL, G., Modellierung der Radionuklidausbreitung in Nahrungsketten nach Deposition von Strontium-90, Cäsium-137 und Jod-131 auf landwirtschaftlich genutzte Flächen; München-Neuherberg, GSF-Bericht 29/90, (1990).
[23] HEINEMANN, K., VOGT, K.J., Measurements of deposition of iodine onto vegetation and of the biological half-life of iodine on vegetation, Health Physics 39 (1980) 463-474.
[24] CHAMBERLAIN, A.C, CHADWICK, R.C., Deposition of spores and other particles on vegetation and soil, Annals of Applied Biology 71 (1970), 141-158.
[25] PRÖHL, G., HOFFMAN, F.O., “Radionuclide, interception and loss processes in vegetation”, Modelling of radionuclide interception and loss processes in vegetation and of transfer in semi-natural ecosystems, IAEA-TECDOC-857, IAEA, Vienna (1996) 9-47.
[26] PINDER III, J.E., ADRIANO, D.C., CIRAVALO, T.G., DOSWELL, A.C., YEHLING, D.M., The interception and retention of Pu-238 deposition by orange trees, Health Physics 52 (1987) 707-715.
[27] KINNERSLEY, R.P., SCOTT, L.K., Aerial contamination of fruit through wet deposition and particulate dry deposition, Journal of Environmental Radioactivity 22 (2001) 191-213.
[28] PETERS, L.N., WITHERSPOON, J.P., Retention of 44-88 µm simulated fallout particles by grasses, Health Physics 22 (1972) 261-266.
[29] ERIKSSON, A., Direct uptake by vegetation of deposited materials, Agricultural College of Sweden, Uppsala, Report SLU-IRB-42 (1977).
[30] PINDER III, J.E., CIRAVALO, T.G., BOWLING, J.W., The interrelationships among plant biomass, plant surface area, and the interception of particulate deposition on grasses, Health Physics 55 (1988) 51-58.
[31] CHAMBERLAIN, A.C., Interception and retention of radioactive aerosols by vegetation, Atmospheric Environment 4 (1966) 57-58.
[32] MADOZ-ESCANDE, C., HENNER, P., BONHOMME, T., Foliar contamination of Phaseolus vulgaris with aerosols of 137Cs, 85Sr, 133Ba and 123mTe: influence of plant development stage upon contamination and rain, Journal of Environmental Radioactivity 73 (2004) 49-71.
[33] WATTERSON, J.D., NICHOLSON, K.W., Dry deposition and interception of 4-22µm diameter particles to a lettuce crop, Journal of Aerosol Science 5 (1996) 759-767.
[34] NICHOLSON, K.W., WATTERSON, J.D., “Dry deposition of particulate material onto wheat” Precipitation Scavenging and Atmosphere-Surface Exchange, Vol.2, (SCHWARTZ, S.E. and SLINN, Eds) W.G.N., 673-683, Hemisphere, Washington DC (1992).
[35] OULD-DADA, Z., Dry deposition profile of small particles within a model spruce canopy, Science of the Total Environment 286 (2002) 83-96.
[36] SHANG, Z., Radioecological parameters recommended for China; Prepared for EMRAS working group on Revision of Technical Reports Series No. 364, (2006).
[37] MÜLLER, H., PRÖHL, G., ECOSYS-87. A dynamic model for assessing radiological consequences of nuclear accidents, Health Physics 64 (1993) 232-252.


45
WEATHERING
E. LECLERC
Andra, Agency for Radioactive Waste Management, France
Y.H. CHOI
KAERI, Korea Atomic Energy Research Institute, Republic of Korea
Abstract
Weathering is a process of clearance of contamination from plants by rain or irrigation, surface abrasion, tissue ageing, leaf
fall and many other processes. Available data summarised for different elements and plant groups are given in the paper. It
was found that the magnitude of the weathering depends on many factors such as solubility of radionuclides, strength of
adsorption to the plant surface, degree of penetration into the inner flesh, leachability from the interior and biological factors.
The results have shown limited differences between cationic species (Mn, Co, Sr, Ru, Cs) for most plant species, but shown
that the weathering rate is strongly dependent on plant characteristics as well as plant growth stage at the time of deposition.
Weathering is a process of clearance of contamination from plants. Weathering includes
contributions from the wash-off of previously intercepted material by rain or irrigation,
surface abrasion and leaf bending from the action of the wind, resuspension, tissue ageing,
leaf fall or herbivore grazing, addition of new tissue (growth dilution), volatilization or
evaporation.
The magnitude of the weathering loss of a radionuclide depends on many factors including its
solubility, strength of adsorption to the plant surface, degree of penetration into the inner flesh
and leachability from the interior. Biological factors such as the structure of the epidermis,
plant senescence and defoliation, and shedding of old epicuticular wax also play a part in the
weathering process. It can be inferred that a very complex interaction of those factors may be
the cause of the observed difference in weathering loss among radionuclides, plant species
and their growth stages.
Weathering is normally described in radioecological models by a single exponential function
characterised by a first-order rate constant w
λ or a weathering half lifew
T .
w
w
T
Ln )2(=λ (1)
Results from numerous studies showed limited differences between cationic species (Mn, Co,
Sr, Ru, Cs) for most plant species, but showed w
T to be dependent on plant characteristics as
well as plant growth stage at the time of deposition [1]. Available data summarised for
differing elements and plant groups are given in Table 1 and 2.

46
TABLE 1. VARIATIONS IN WEATHERING RATE FOR DIFFERENT ELEMENTS AND
PLANTS1
Element Plant group Tw
(days) N Range (days) References
Cs Cereal 35 1 [2]
Cs Grass 10 4 7.9 to 11.1 [3-5]
I Grass 13 9 8.3 to 29 [3; 5-9]
I Rice 14 1 [8]
Mn-Ce Cereals 30 1 [2]
Pu Cereals 12 1 [11]
Pu Fruits 43 1 [12]
Sr Grass 24 4 12.9 to 49 [9; 10]
Sr Cereals 21 1 [2] 1 Including the effect of growth dilution.
TABLE 2. VARIATIONS IN WEATHERING RATE FOR DIFFERENT ELEMENTS, PLANTS AND PLANT GROWTH STAGES [1, 12, 13-15]
Element Plant group Tw (days) Days until harvest References
Co Rice 43.2
33.7
40.5
31.5
27.3
14.1
112
84
62
49
35
17
[14]
Co Roots crops (radish) 28.7
25.0
17.1
12.6
9.4
55
42
31
20
12
[14]
Co Leafy vegetables (Chinese cabbage) 15.6
15.3
14.9
12.9
10.0
51
39
28
17
7
[13]
Cs Rice 35.6
44.1
42.1
49.4
39.2
32.1
112
84
62
49
35
17
[14]
Cs Leguminous vegetables (Soybean) 31.5
58.9
52.6
28.0
14.5
6.2
105
84
66
49
34
17
[1]
Cs Leafy vegetables (Chinese cabbage) 32.0 34.5
31.1 22.4 11.5
51 39
28 17 7
[15]
Cs Root crops (radish) 36.7 34.3
25.1 21.1 16.0
55 42
31 20 12
[14]

47
TABLE 2. VARIATIONS IN WEATHERING RATE FOR DIFFERENT ELEMENTS, PLANTS
AND PLANT GROWTH STAGES [1, 12, 13-15] (Cont.)
Element Plant group Tw (days) Days until harvest References
I Rice 45.3 38.3
17.2 12.1 13.1
10.8 7.8
6.4 2.4
99 85
64 57 52
43 40
29 9
[13]
Mn-Ce Rice 47.2 44.5 42.3
32.8 27.9
15.8
112 84 62
49 35
17
[14]
Mn-Ce Leafy vegetables (Chinese cabbage) 16.5 19.9
18.9 15.0
9.3
51 39
28 17
7
[13]
Mn-Ce Root crops (radish) 19.9 25.2
19.2 14.9
11.2
55 42
31 20
12
[14]
Ru Rice 52.7 49.7
40.9 46.4
35.0 24.4
112 84
62 49
35 17
[14]
Ru Leafy vegetables (Chinese cabbage) 18.8 29.3 31.6
25.8 16.7
51 39 28
17 7
[15]
Ru Roots crops (radish) 20.1 20.7 22.8
21.6 26.1
55 42 31
20 12
[14]
Sr Root crops (Radish) 21.0 20.4
55 42
[14]
Sr Soybeen 15.6
10.6 8.6
31
20 12
[1]
Sr Rice 46.9 40.2 39.6
31.8 27.1
13.7
112 84 62
49 35
17
[14]

48
Sr Leguminous vegetables (Soybean) 12.5
11.4 9.7
6.5 5.3
4.4
105
84 66
49 34
17
[1]
Sr Leafy vegetables (Chinese cabbage) 19.1
22.1 16.7 14.4
9.0
51
39 28 17
7
[15]
REFERENCES
[1] LIM, K.M., PARK, D.W., PARK, H.G., CHOI, Y.H., CHOI, S.D., LEE, C.M., Analysis of the direct contamination pathway of 85Sr,
103Ru and
134Cs in soybean (Proc. Korean Nuclear Society
Spring Meeting, Cheju, Republic of Korea, May 24-25. 2001) (2001) (CD in Korean.
[2] AARKROG, A., On the direct contamination of rye, barley, wheat and oats with 85Sr, 134
Cs, 54
Mn and 141
Ce, Radiation Botany 9 (1969) 357-366.
[3] KIRCHNER, G., Transport of iodine and caesium via the grass-cow-milk pathway after the Chernobyl accident, Health Physics 66 (1994) 653-665.
[4] ISHIDA, J., N. MIYAGAWA, et al., Environmental radioactivity around Tokay-Works after the
reactor accident at Chernobyl, Journal of Environmental Radioactivity 7 (1988) 17-27. [5] MONTE, L., Analysis of radiocontamination data collected in Italy following the Chernobyl
accident for the evauation of transfer parameters of radionuclides in the deposition-vegetation-cow-milk pathway, Journal of Environmental Radioactivity 14 (1991) 317-329.
[6] ASSIMAKOPOULOS, P.A., IOANNIDES, K.G., et al., The environmental behavior of 131I in northwestern Greece following the nuclear reactor accident at Chernobyl, Health Physics 55 (1988) 783-91.
[7] MARTIN, W.E., Interception and retention of fallout by desert shrubs, Health Physics 11 (1965), 1341-1354.
[8] OHMOMO, Y., MURAMATSU, Y., UCHIDA, S., SUMAIYA, M., Food chain and radioactivity–migration of iodine-129 to rice plant, Global environment and nuclear energy, Proc. 3rd
International Symposium on Advanced Nuclear Energy Research, Vienna, 1991 (1991)
36-40. [9] CHADWICK, R.C. and CHAMBERLAIN, A.C., Field loss of radionuclides from grass,
Atmospheric Environment 4 (1970) 51-56. [10] MILBOURN, G.M. and TAYLOR, R., The contamination of grassland with radioactive
strontium, I: Initial retention and loss, Radiation Botany 5 (1965) 337-347.
[11] PINDER, J.E.III and Doswell, A.C., Retention of 238Pu-bearing particles by corn plants, Health Physics 49 (1985) 771-776.
[12] PINDER, III, J.E., ADRIANO, D.C., CIRAVALO, T.G., DOSWELL, A.C., YEHLING, D.M., The interception and retention of Pu-238 deposition by orange trees, Health Physics 52 (1987) 707-715.
[13] CHOI, Y.H., Parameters on the Radionuclide Transfer in Crop Plants for Korean Food Chain Dose Assessment, KAERI/TR-1993/2001, Korea Atomic Energy Research Institute (2001)
[14] CHOI, Y.H., LIM, K.M., YU, D., PARK, H.G., CHOI, Y.G., LEE, C.M., Transfer pathways of 54
Mn, 57
Co, 85
Sr, 103
Ru and 134
Cs in rice and radish plants directly contaminated at different
growth stages, Annals of Nuclear Energy 29 (2002) 429-446 [15] CHOI, Y.H., LIM, K.M., PARK, H.G., LEE, W.Y., LEE, C.W., Contamination of Chinese
cabbage with 85Sr, 103
Ru and 134
Cs related to time of foliar application, Journal of the Korean
Association for Radiation Protection 23 (1998) 219-227 (in Korean).

49
TRANSLOCATION
E. LECLERC
Andra, French National Agency for Radioactive Waste Management, France
C. COLLE, C. MADOZ-ESCANDE
Institut de Radioprotection et de Sûreté Nucléaire (IRSN),
Centre de Cadarache, Saint Paul-lez-Durance, France
Y. H. CHOI
Korea Atomic Energy Research Institute, Republic of Korea
Abstract
Translocation is the process leading to the redistribution of radionuclides from the contaminated aerial parts of a plant to the
other parts that have not been contaminated directly. Translocation factors presented in this paper were derived from 52
publications corresponding either to the original documents published by the data providers or to compilations. As a result of
statistical analysis of the raw data, the mean and ranges in variation of the translocation factors were eastimated for 19
radionuclides. Most information was for caesium and strontium. For cereals, data are given for different stages of the plants
development.
1. DEFINITIONS
Translocation is the phenomenon leading to the redistribution of a chemical substance, once it
has been deposited on the aerial parts of a plant, to the other parts that have not been
contaminated directly. The direct contamination of plants by radionuclides or toxic elements
and their transfer from the foliage to edible parts depends on many physical, chemical and
biological factors [1-3]. Physical factors include characteristics of the deposition regime and
of the contaminants (rain duration, size of particles) and of the plant (foliage layout, leaf size
and cuticular structure). Chemical factors include the speciation of the pollutant, water
composition and cuticle composition [4-6]. Biological factors are mainly associated with the
vegetative cycle at the time of the foliar deposit [7, 8-15]. Translocation partly reflects the
mobility of an element within the plant.
The translocation factor represents the ratio between the transferred activity in the organs of
the plant that were not contaminated directly and the deposited activity on the plant itself. Its
expression and, therefore its meaning, vary among authors. Three most widespread definitions
include:
1. 1tr
f is the ratio between the concentration in the edible part at harvest time (Bq·kg-1
)
and the concentration in the foliage or in the whole plant at harvest time (Bq·kg-1
), [3,
16, 17];
2. 2tr
f (dimensionless or m².kg-1
) is the ratio between the concentration in the edible part
at harvest time (Bq·kg-1
) and the concentration in the foliage (Bq·kg-1
) [17] or the
activity per square metre of foliage at the time of deposit (Bq·m-²) [18, 19];
3. 3tr
f is the ratio between the activity of the edible part within 1 m² of crops at harvest
time (Bq m-²) and the foliage activity of 1 m² of crops at the time of deposit (Bq m
-²)
[17 and 20]. The value may be expressed as a percentage (%) [7, 3, 8-10].

50
In this review, the translocation factor is expressed in accordance with the 3tr
f definition and
in the form of a percentage. When the percentage was not mentioned directly in a cited publication, it was calculated on the basis of available data (biomass at deposit time and crop yield at harvest time, interception factor, etc.).
In contrast with other transfer parameters, particularly with regard to soil-plant transfers, no experimental method has been standardised so far. Hence, there are as many experimental protocols as there are experiments, and results remain very heterogeneous. Variants concern mainly the contamination mode and the plant-growth stage of the crops at the time of foliar deposit. With regard to the contamination mode, the main variants include:
• simulations of sprinkling irrigation or contaminating rain at various timescales and intensities over the whole vegetation cover with or without soil protection, followed or not by non-contaminated rainfalls. That operating mode is the most realistic for investigation purposes;
• sprays of contaminated solution over the foliage, followed or not after drying by a non-contaminated rain deposit;
• foliar contamination by using a deposit of dry or wet aerosols, followed or not after drying by a non-contaminated rain deposit;
• deposit of droplets over part of or all the plant foliage with a view to detecting translocation and mobility mechanisms within the plant. However, the method is unable to determine a translocation factor, as defined in this study.
With respect to the plant-growth stage at the time of deposit, only a few authors have been able to describe it precisely. They often limited themselves to mentioning the time between sowing and contamination or between contamination and harvesting, rather than the indication of a specific physiological stage. Comparing the results of different authors becomes, therefore, all the more difficult.
Whatever the contamination mode, the translocation-factor values drawn from the literature have a dual origin: open-field experiments or greenhouse tests.
2. DATABASE FOR TRANSLOCATION FACTOR VALUES
Translocation-factor values were drawn from 48 publications corresponding either to the original documents published by the data providers or to compilations by Carini et al. [10, 11, 20] when it was impossible to consult the initial source publications, because they were unavailable (e.g. internal reports of some organisations).
The majority of collected and usable translocation-factor values for the purposes of this study come from relatively old documents published before the publication in 1994 of IAEA’s Handbook of Parameter Values for Radionuclide Transfers in Temperate Environment [21]. All later data originate from the following sources:
• three publications [22, 17, 24] dealing with cereal grains;
• three publications [22, 25, 26] dealing with root vegetables;
• one publication [26] dealing with leaf vegetables;
• eight publications [15, 25, 27-32] dealing with fruits.
The following descriptive parameters have been selected for the translocation-factor database:

51
TABLE 1. STRUCTURE OF THE DATABASE USED FOR THE ASSESSMENT OF TRANSLOCATION FACTOR VALUES
Item Information given
Plant species Cultivated plant species and, if appropriate, variety
Element Name of element under study, atomic number and, if possible,
chemical form of the element
Translocation factor Value obtained for the edible part in percentage and, if appropriate,
in m²·kg-1
Distribution at harvest time Percentage of the activity contained in the edible part in relation to
the whole plant
Transfer factor Ratio between the specific activity of edible organs at harvest time
(Bq·kg-1) and the initial surface activity (Bq.m-²) of the total deposit
(soil + plant) or the specific activity of the irrigation water (Bq·l-1)
Yield Yield of edible parts at harvest time (kg·m-² or kg·plant-1)
Type of contamination Deposit modality of the element on the vegetation cover, sprinkling
irrigation, rain, aerosols, spray
Time between foliar deposit
and harvesting
Number of days between contamination and harvesting of the edible
part of the plant
Duration of the plant cycle Number of days between sowing and harvesting
Type of test Open-field experimentation or greenhouse test
Species Cultivated plant species and, if appropriate, variety
Consideration given to the
value
Relevancy assessment of the value in relation to this study
Comments All additional useful information
Data supplier Original publication of the data supplier
Bibliographical reference of
data
Publication(s) from which data was drawn
The list of descriptive parameters relies in principle on acquired information concerning foliar-transfer mechanisms. Its purpose is to assess the best relevant data. Commonly, all parameters are rarely available.
After examining the entire set of 682 values included in the database, 537 were selected as source data. The appreciation criteria for selecting the translocation-factor values to be used as the basis to determining a reference value and a corresponding range of potential variations rely mostly on the contamination mode of the whole plant. The selected values are those of a deposit that closely simulates a sprinkling irrigation. Hence, all values resulting from specific contamination processes (drop deposit on leaves or fruit), which are very distant from conditions likely to occur in agricultural ecosystems, were discarded. Other values were rejected either because they did not seem to apply only to translocation (direct contamination of a large fraction on the edible part) or because they were expressed in inappropriate units that could not be converted due to a lack of information on intermediate quantities.
The translocation-factor values covered in this study, with all isotopes taken into account, are distributed as follows: 66% for grains, 19% for fruit and 15% for root vegetables.
The majority of experiments dealt with caesium and strontium (Fig. 1). Some other radionuclides, such as radioisotopes of manganese, cobalt, ruthenium and cerium, were addressed in a few investigations and provided between 20 and 40 translocation-factor values, with all plant types taken into account. With regard to the other elements, their processing is
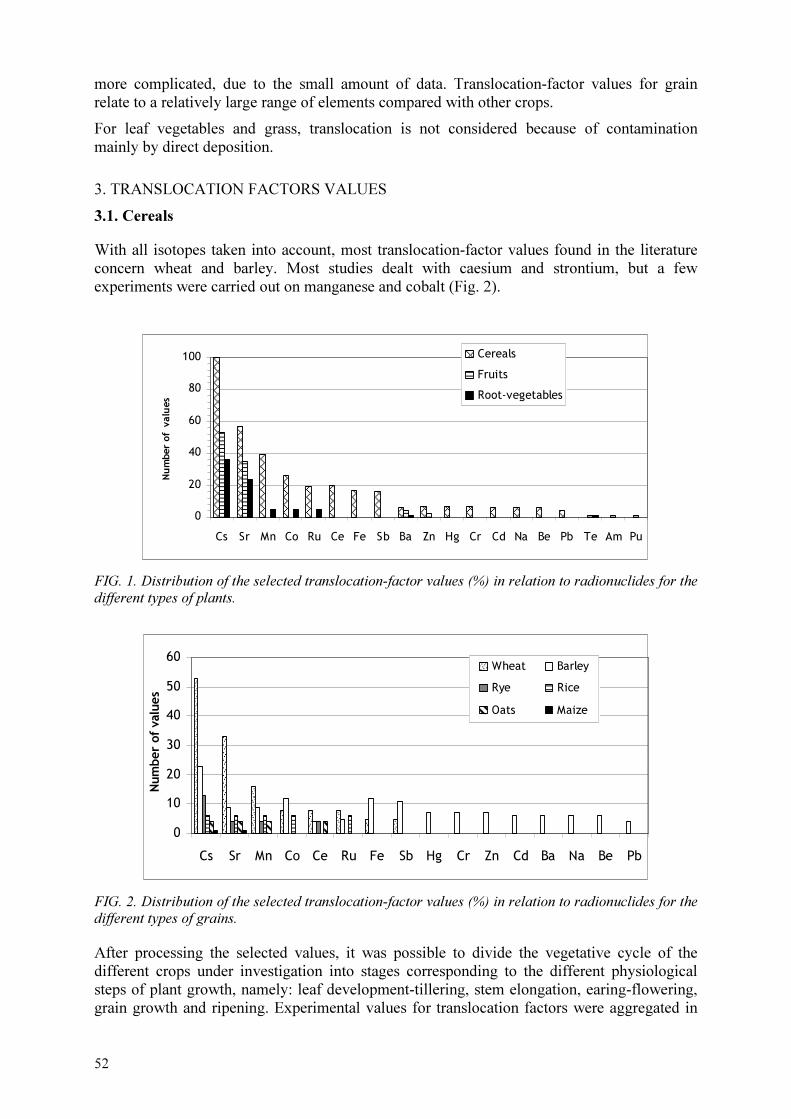
52
more complicated, due to the small amount of data. Translocation-factor values for grain relate to a relatively large range of elements compared with other crops.
For leaf vegetables and grass, translocation is not considered because of contamination mainly by direct deposition.
3. TRANSLOCATION FACTORS VALUES
3.1. Cereals
With all isotopes taken into account, most translocation-factor values found in the literature concern wheat and barley. Most studies dealt with caesium and strontium, but a few experiments were carried out on manganese and cobalt (Fig. 2).
0
20
40
60
80
100
Cs Sr Mn Co Ru Ce Fe Sb Ba Zn Hg Cr Cd Na Be Pb Te Am Pu
Nu
mber o
f v
alu
es
Cereals
Fruits
Root-vegetables
FIG. 1. Distribution of the selected translocation-factor values (%) in relation to radionuclides for the
different types of plants.
0
10
20
30
40
50
60
Cs Sr Mn Co Ce Ru Fe Sb Hg Cr Zn Cd Ba Na Be Pb
Num
ber o
f valu
es
Wheat Barley
Rye Rice
Oats Maize
FIG. 2. Distribution of the selected translocation-factor values (%) in relation to radionuclides for the different types of grains.
After processing the selected values, it was possible to divide the vegetative cycle of the different crops under investigation into stages corresponding to the different physiological steps of plant growth, namely: leaf development-tillering, stem elongation, earing-flowering, grain growth and ripening. Experimental values for translocation factors were aggregated in

53
relation to the vegetation stage corresponding to the state of the plant at the time of foliar contamination. The aggregation was applied to the associations of grain types, barley, wheat and rye on the one hand, and rice on the other.
The data were processed according to the following sequence:
• for every experiment, translocation-factor values were distributed in accordance with the five vegetative stages;
• data were plotted on a graph, with an abscissa representing the vegetative cycle and the ordinate showing the translocation factors expressed as percentages according to a logarithmic scale,
• statistical analysis was performed in order to determine the best estimation of the translocation factor for a vegetative stage (geometric mean of the data) and a 95% confidence range.
3.1.1. Caesium
The value-distribution diagrams show that the maximum translocation value is reached when foliar contamination occurs about 45 days before harvesting and therefore corresponds to the earing-flowering stage of the plants (Fig. 3).
As a result of statistical analysis of raw data, the recommended values (geometric mean for each plant growth stage) and the range of variation for the caesium translocation factors (whatever the vegetative stage) are given in Table 2.
0,01
0,1
1
10
100
Vegetative stage
Tra
nsl
oca
tion
(%
)
Aarkrog et al. (1969)
Aarkrog et al. (1972)
Aarkrog et al. (1975)
Gerdung (1999)
Middleton (1958)
Middleton (1959)
Shaw (1992)
Voigt (1991)
Best estimate
Centile 5%
Centile 95%
Leaf
development-
Tillering
Stem
elongation
Earing-
flowering
Grain
growth
Ripening
FIG. 3. Experimental values of caesium translocation factor for wheat, barley and rye in relation to
the plant-growth stage at the time of foliar contamination. The continuous line shows the best estimate
of translocation factor and the 95% confidence range is also shown (dotted lines).

54
TABLE 2. TRANSLOCATION FACTOR (ftr) VALUES OF CAESIUM FOR CEREALS, %
Elment N Plant growth stage GM Min Max References
Wheat, barley and rye (grains)
21 Leaf development-tillering 6 × 10⁻¹ 6 × 10⁻² 7.9
21 Stem elongation 4.6 4.5 ×
10-1 24
15 Earing-flowering 6.1 1.1 27
11 Grain growth 5.5 1.1 27
Cs
11 Ripening 2.7 1.1 7.7
[7, 3, 8, 9, 12, 14, 16, 33, 34]
Rice
2 Leaf development-tillering 2.3 1.2 3.4
1 Stem elongation 4.3
1 Earing-flowering 8.4
1 Grain growth 11
Cs
1 Ripening 2.2
[35, 36]
3.1.2. Strontium
The translocation-factor values of strontium to wheat, barley and rye are shown in Fig. 4. Depending on the time between foliar contamination and harvesting, the values range from 0.007% to 8.5%. The value-distribution diagram shows that the maximum translocation value is reached when foliar contamination occurs about 30 days before harvesting and, therefore, corresponds to the grain growth stage of the plants.
0,001
0,01
0,1
1
10
Vegetative stage
Tran
sloca
tion
(%
)
Aarkrog et al. (1969)
Aarkrog et al. (1975)
Middleton (1958)
Middleton (1959)
Best estimate
Centile 5%
Centile 95%
Leaf
development-
Stem
elongation
Earing-
flowering
Grain
growthRipening
FIG. 4. Experimental values of strontium translocation factor for wheat, barley and rye in relation to
the plant-growth stage at the time of foliar contamination. The continuous line is the best estimation of
the translocation factor and the 95% confidence range is also shown (dotted line).

55
As a result of statistical analysis of the raw data, the recommended values (geometric mean for each plant growth stage) and the range of variation for the strontium translocation factors (whatever the vegetative stage) are reported in Table 3.
3.1.2. Other elements
Due to the scarcity of data for the elements other than caesium and strontium, the available translocation factors values are given together in Table 4.
3.2 Root vegetables and tubers
Eighty-nine values of translocation factors taken from 12 publications have been used for assessing translocation factors for root-vegetables. Among them, 76 were selected to be used in this review. The greater majority of the experiments concerned caesium and strontium and essentially potatoes and radishes. Radioisotopes of some other elements (manganese, cobalt, ruthenium, tellurium and barium) have been investigated, but their analysis and interpretation is limited due to the small amount of data (Fig. 5).
TABLE 3. STRONTIUM TRANSLOCATION FACTOR (ftr) VALUES FOR CEREAL GRAINS, %.
Element Plant growth stage
N GM Min Max References
Wheat, barley and rye (grains)
Sr Leaf development-
tillering
2 01
Stem elongation 13 1 × 10⁻¹ 8 × 10⁻³ 1.6
Earing-flowering 5 4 × 10⁻¹ 1 × 10⁻¹ 1.3
Grain growth 6 2.0 6 × 10⁻¹ 8.5
Ripening 8 1.2 3 × 10⁻¹ 5.1
[7,9,12,13,37]
Rice
Sr Leaf development-
tillering
2 2 × 10⁻² 2.1 × 10⁻² 2.4 × 10⁻² [33,35]
Stem elongation 1 2 × 10⁻²
Earing –flowering 1 6 × 10⁻¹
Grain growth 1 1.3
Ripening 1 1
1Below the detection limits.
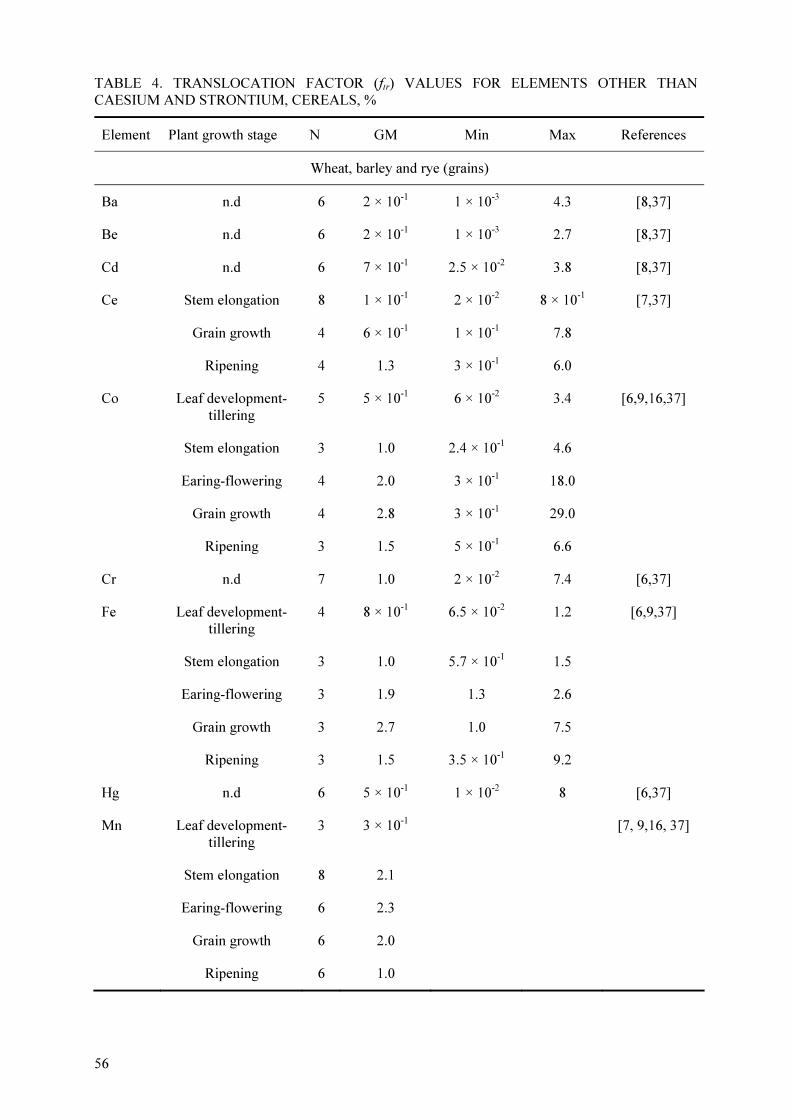
56
TABLE 4. TRANSLOCATION FACTOR (ftr) VALUES FOR ELEMENTS OTHER THAN
CAESIUM AND STRONTIUM, CEREALS, %
Element Plant growth stage N GM Min Max References
Wheat, barley and rye (grains)
Ba n.d 6 2 × 10⁻¹
1 × 10⁻³
4.3 [8,37]
Be n.d 6 2 × 10⁻¹
1 × 10⁻³
2.7 [8,37]
Cd n.d 6 7 × 10⁻¹ 2.5 × 10
-2 3.8 [8,37]
Ce Stem elongation 8 1 × 10⁻¹ 2 × 10
-2 8 × 10
-1 [7,37]
Grain growth 4 6 × 10⁻¹ 1 × 10
-1 7.8
Ripening 4 1.3 3 × 10⁻¹ 6.0
Co Leaf development-
tillering
5 5 × 10⁻¹ 6 × 10
-2 3.4 [6,9,16,37]
Stem elongation 3 1.0 2.4 × 10⁻¹ 4.6
Earing-flowering 4 2.0 3 × 10⁻¹ 18.0
Grain growth 4 2.8 3 × 10⁻¹ 29.0
Ripening 3 1.5 5 × 10⁻¹ 6.6
Cr n.d 7 1.0 2 × 10⁻² 7.4 [6,37]
Fe Leaf development-
tillering
4 8 × 10⁻¹ 6.5 × 10
-2 1.2 [6,9,37]
Stem elongation 3 1.0 5.7 × 10⁻¹ 1.5
Earing-flowering 3 1.9 1.3 2.6
Grain growth 3 2.7 1.0 7.5
Ripening 3 1.5 3.5 × 10⁻¹ 9.2
Hg n.d 6 5 × 10⁻¹ 1 × 10
-2 8 [6,37]
Mn Leaf development-
tillering
3 3 × 10⁻¹ [7, 9,16, 37]
Stem elongation 8 2.1
Earing-flowering 6 2.3
Grain growth 6 2.0
Ripening 6 1.0

57
TABLE 4. TRANSLOCATION FACTOR (ftr) VALUES FOR ELEMENTS OTHER THAN
CAESIUM AND STRONTIUM, CEREALS, % (cont)
Element Plant growth stage N GM Min Max References
Wheat, barley and rye (grains)
Na n.d 6 2.0 1.7 × 10⁻¹
7 [8,37]
Pb n.d 3 2.0 2 × 10⁻¹
8.2 [6,37]
Ru n.d 8 1.1 × 10⁻¹
4 × 10⁻²
1.2 [9,37]
Sb Leaf development-
tillering
5 2 × 10⁻²
2 × 10⁻³
6 × 10⁻¹
[8,9,37]
Stem elongation 3 1 × 10⁻¹
3.4 × 10⁻²
1.0
Sb Earing-flowering 3 1.2 3 × 10⁻¹
5.2
Grain growth 3 2.2 1.0 7.5
Ripening 2 6 × 10⁻¹
3 × 10⁻¹
1.3
Zn n.d.* 6 15.8 7.6 32 [6,37]
Rice
Co Leaf development-tillering
2 2 × 10⁻¹
6 × 10⁻²
2 × 10⁻¹
[35]
Stem elongation 1 1.6
Earing-flowering 1 4
Grain growth 1 6.6
Ripening 1 8 × 10⁻¹
Mn Leaf development-tillering
2 5 × 10⁻²
4 × 10⁻²
5.2 × 10⁻²
[35]
Stem elongation 1 3 × 10⁻²
Earing-flowering 1 6 × 10⁻¹
Grain growth 1 1.6
Ripening 1 7 × 10⁻¹
Ru Leaf development-tillering
2 5 × 10⁻³
5 × 10⁻³
6 × 10⁻³
[33,35]
Stem elongation 1 2 × 10⁻²
Earing-flowering 1 1.2 × 10⁻¹
Grain growth 1 3.8 × 10⁻¹
Ripening 1 3.5 × 10⁻¹
*Not defined.
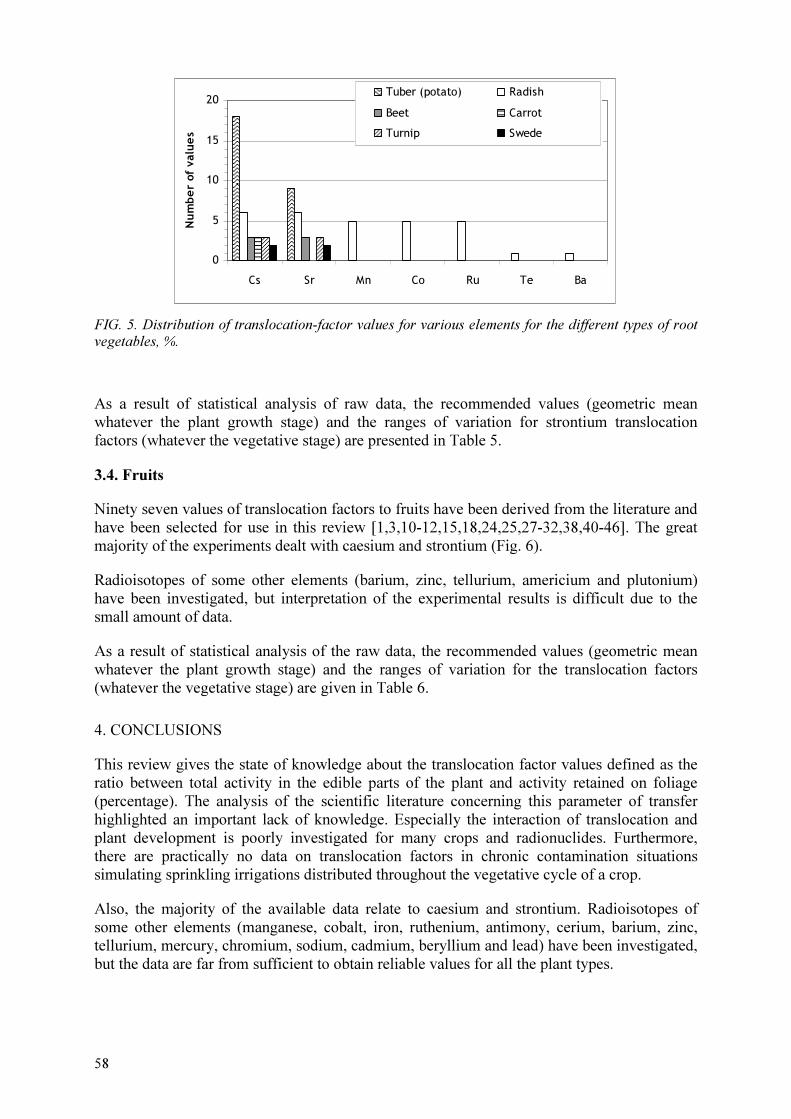
58
0
5
10
15
20
Cs Sr Mn Co Ru Te Ba
Num
ber o
f v
alu
es
Tuber (potato) Radish
Beet Carrot
Turnip Swede
FIG. 5. Distribution of translocation-factor values for various elements for the different types of root vegetables, %.
As a result of statistical analysis of raw data, the recommended values (geometric mean
whatever the plant growth stage) and the ranges of variation for strontium translocation
factors (whatever the vegetative stage) are presented in Table 5.
3.4. Fruits
Ninety seven values of translocation factors to fruits have been derived from the literature and
have been selected for use in this review [1,3,10-12,15,18,24,25,27-32,38,40-46]. The great
majority of the experiments dealt with caesium and strontium (Fig. 6).
Radioisotopes of some other elements (barium, zinc, tellurium, americium and plutonium)
have been investigated, but interpretation of the experimental results is difficult due to the
small amount of data.
As a result of statistical analysis of the raw data, the recommended values (geometric mean
whatever the plant growth stage) and the ranges of variation for the translocation factors
(whatever the vegetative stage) are given in Table 6.
4. CONCLUSIONS
This review gives the state of knowledge about the translocation factor values defined as the
ratio between total activity in the edible parts of the plant and activity retained on foliage
(percentage). The analysis of the scientific literature concerning this parameter of transfer
highlighted an important lack of knowledge. Especially the interaction of translocation and
plant development is poorly investigated for many crops and radionuclides. Furthermore,
there are practically no data on translocation factors in chronic contamination situations
simulating sprinkling irrigations distributed throughout the vegetative cycle of a crop.
Also, the majority of the available data relate to caesium and strontium. Radioisotopes of
some other elements (manganese, cobalt, iron, ruthenium, antimony, cerium, barium, zinc,
tellurium, mercury, chromium, sodium, cadmium, beryllium and lead) have been investigated,
but the data are far from sufficient to obtain reliable values for all the plant types.
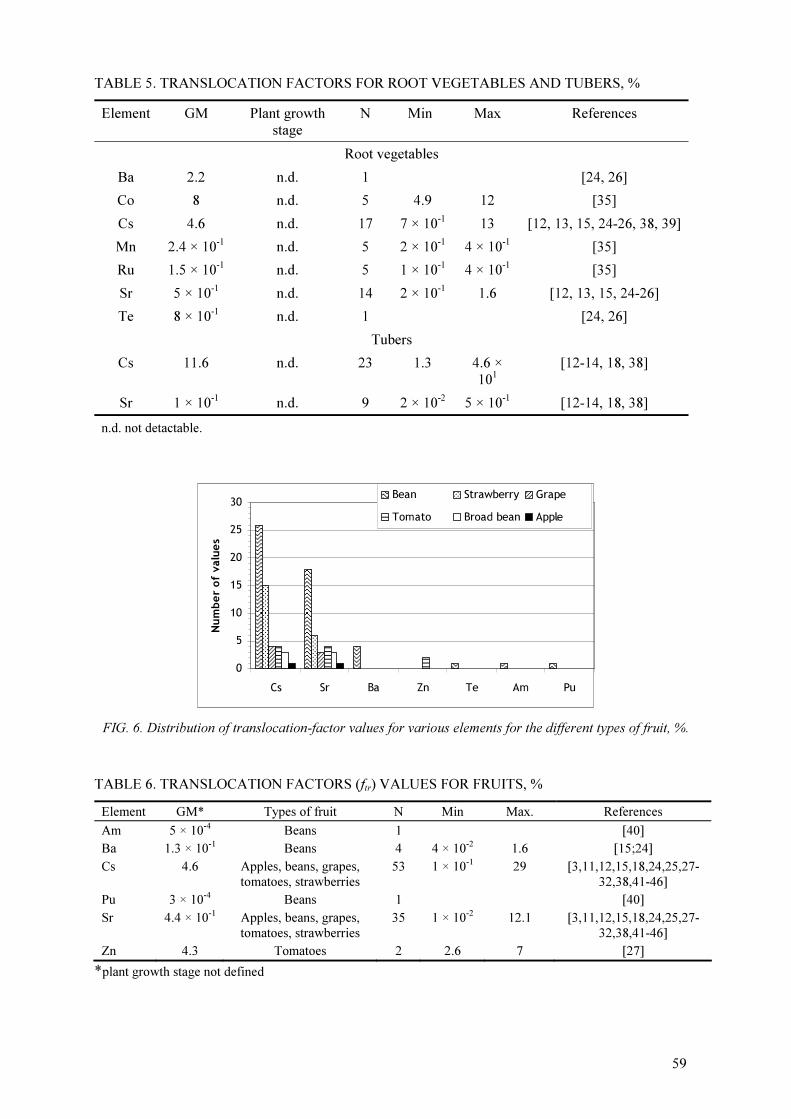
59
TABLE 5. TRANSLOCATION FACTORS FOR ROOT VEGETABLES AND TUBERS, %
Element GM Plant growth stage
N Min Max References
Root vegetables
Ba 2.2 n.d. 1 [24, 26]
Co 8 n.d. 5 4.9 12 [35]
Cs 4.6 n.d. 17 7 × 10⁻¹ 13 [12, 13, 15, 24-26, 38, 39]
Mn 2.4 × 10⁻¹ n.d. 5 2 × 10
-1 4 × 10
-1 [35]
Ru 1.5 × 10⁻¹ n.d. 5 1 × 10
-1 4 × 10
-1 [35]
Sr 5 × 10⁻¹
n.d. 14 2 × 10⁻¹
1.6 [12, 13, 15, 24-26]
Te 8 × 10⁻¹ n.d. 1 [24, 26]
Tubers
Cs 11.6 n.d. 23 1.3 4.6 × 101
[12-14, 18, 38]
Sr 1 × 10⁻¹
n.d. 9 2 × 10⁻²
5 × 10⁻¹
[12-14, 18, 38]
n.d. not detactable.
0
5
10
15
20
25
30
Cs Sr Ba Zn Te Am Pu
Nu
mber o
f v
alu
es
Bean Strawberry Grape
Tomato Broad bean Apple
FIG. 6. Distribution of translocation-factor values for various elements for the different types of fruit, %.
TABLE 6. TRANSLOCATION FACTORS (ftr) VALUES FOR FRUITS, %
Element GM* Types of fruit N Min Max. References
Am 5 × 10⁻⁴ Beans 1 [40]
Ba 1.3 × 10⁻¹ Beans 4 4 × 10⁻² 1.6 [15;24]
Cs 4.6 Apples, beans, grapes,
tomatoes, strawberries
53 1 × 10⁻¹ 29 [3,11,12,15,18,24,25,27-
32,38,41-46]
Pu 3 × 10⁻⁴ Beans 1 [40]
Sr 4.4 × 10⁻¹ Apples, beans, grapes,
tomatoes, strawberries
35 1 × 10⁻² 12.1 [3,11,12,15,18,24,25,27-
32,38,41-46]
Zn 4.3 Tomatoes 2 2.6 7 [27]
*plant growth stage not defined

60
Many radioecological models use values based on poorly justified extrapolations or chemical analogies. This method is arbitrary insofar as the concept of analogy refers only to the chemical properties of the elements e. g. chemical analogy does not necessarily imply the same behaviour inside the plant, as shown for Ca and Sr [47] and Cs, K and Rb [48]. Besides, it does not take into account the various physiological and physicochemical mechanisms inside the plant which govern the translocation processes.
Moreover, some authors do not make a distinction between plant types and recommend a single default value whatever the element and plant type. Data given without growth stage indication should be used with caution indicating the wide range of associated uncertainty. In order to supplement the current lack of knowledge on translocation, it seems essential to undertake further research through experimental investigations.
REFERENCES
[1] HOFFMAN, F.O., THIESSEN, K.M., RAEL, R.M., Comparison of interception and initial retention of wet-deposited contaminants on leaves of different vegetation types, Atmospheric Environment 29 (1995) 1771-1775.
[2] KINNERSLEY, R.P., SCOTT, L.K., Aerial contamination of fruit through wet deposition and particulate dry deposition, Journal of Environmental Radioactivity 22 (2001) 191-213.
[3] CHAMEL, A., GAILLARDON, P. et al., La pénétration foliaire des herbicides. Les herbicides: mode d'action et principes d'utilisation sous la direction de R. Scalla. INSTITUT NATIONAL DE LA RECHERCHE AGRONOMIQUE. 147, rue de l'Université, 75007 Paris (1991) 8-49.
[4] FRANKE, W., Mechanisms of foliar penetration of solutions, Annual Review of Plant Physiology 18 (1967) 281-300.
[5] AARKROG, A., LIPPERT, J., Direct contamination of barley with Cr-51, Fe-59, Co-58, Zn-65, Hg-203 and Pb-210, Radiation Botany 11 (1971) 463-472.
[6] AARKROG, A., Direct contamination of barley with Be-7, Na-22, Cd- 115, Sb-125, Cs- 134 and Ba- 133. RISOE report No. 256. Dannish Atomic Energy Commission (1972) 163-175.
[7] KIRCHNER, G., Transport of iodine and caesium via the grass-cow-milk pathway after the Chernobyl accident, Health Physics 66 (1994) 653-665.
[8] AARKROG, A., Radionuclide levels in mature grain related to radiostrontium content and time of direct contamination, Health Physics 28 (1975) 557-562.
[9] CARINI, F., Radionuclides in plants bearing fruit: an overview, Journal of Environmental Radioactivity 46(1) (1999) 77-97.
[10] CARINI, F., GREEN, N., et al., Radionuclides in fruit systems: A review of experimental studies. Science of the Total Environment 359(1-3) (2006) 188-193.
[11] MIDDLETON, L.J., Absorption and translocation of strontium and caesium by plants from foliar sprays, Nature 181 (1958) 1300-1303.
[12] MIDDLETON, L.J., Radioactive strontium and caesium in the edible parts of crop plants after foliar contamination, International Journal of Radiation Biology 4 (1959) 387-402.
[13] MIDDLETON, L.J., H. M. SQUIRE, Further studies of radioactive strontium and caesium in agricultural crops after direct contamination, International Journal of Radiation Biology 6(6) (1963) 549-558.
[14] MADOZ-ESCANDE, C., HENNER, P. et al., Foliar contamination of Phaseolus vulgaris with aerosols of 137Cs, 85Sr, 133Ba and 123mTe: influence of plant development stage upon contamination and rain, Journal of Environmental Radioactivity 73(1) (2004) 49-71.
[15] SHAW, G., MINSKI, M.J. et al., Retention, loss and translocation of radionuclides applied to foliar surfaces of wheat. Environmental and Experimental Botany 32(4) (1992) 391-404.
[16] VANDECASTEELE, C.M., BAKER, S. et al. Interception, retention and translocation under greenhouse conditions of radiocaesium and radiostrontium from a simulated accidental source, Science of the Total Environment 278(1-3) (2001) 199-214.

61
[17] DELMAS, J., DISDIER, R. et al., “Radiocontamination expérimentale de quelques espèces cultivées soumises à l'irrigation par aspersion”, Actes du Ie Symposium international de radioécologie, C.E.N. Cadarache, 8-12 Septembre 1969, 1192 (1969) 707-729.
[18] DELMAS, J., GRAUBY, A. et al. (1970). Transfert des radionucléides aux végétaux par l'eau d'irrigation. Bulletin d'Informations Scientifiques et Techniques, 151, Septembre (1970) 67-73.
[19] Delmas, J., R. Disdier, et al., Etude expérimentale de la contamination du maïs par le radiostrontium et le radiocésium apportés par l'eau d'arrosage. Radioprotection 6(4) (1971) 269-278.
[20] INTERNATIONAL ATOMIC ENERGY AGENCY, “Modelling the Transfer of Radionuclides to Fruit” Report on the Fruits Working Group of BIOMASS Theme 3. Report IAEA-BIOMASS-5, IAEA, Vienna (2003).
[21] INTERNATIONAL ATOMIC ENERGY AGENCY, Handbook of Parameter Values for the Prediction of Radionuclide Transfer in Temperate Environments, Technical Reports Series No. 364, IAEA, Vienna (1994).
[22] LIM, K.M., PARK, D.W., PARK, H.G., CHOI, Y.H., CHOI, S.D., LEE, C.M., Analysis of the direct contamination pathway of 85Sr, 103Ru and 134Cs in soybean (Proc. Korean Nuclear Society Spring Meeting, Cheju, Republic of Korea, May 24-25. 2001) (2001) (CD in Korean.
[23] MADOZ-ESCANDE, C. SANTUCCI, P., Weather-dependent change of Caesium, strontium, barium and tellurium contamination deposited as aerosols on various cultures. Journal of Environmental Radioactivity 84(3) (2005) 417-439.
[24] BAEZA, A., PANIAGUA, J.M. et al., Radiocaesium and radiostrontium uptake by turnips and broad beans via leaf and root absorption, Applied Radiation and Isotopes 50(3) (1999) 467-474.
[25] MADOZ-ESCANDE, BONHOMME, C.T. et al., Foliar contamination of plants with aerosols of 137Cs, 85Sr, 133Ba and 123mTe: Influence of rain, Radioprotection 40(Suppl.1) (2005) S421-S427.
[26] BRAMBILLA, M., FORTUNATI, P. et al., Foliar and root uptake of 134Cs, 85Sr and 65Zn in processing tomato plants (Lycopersicon esculentum Mill.), Journal of Environmental Radioactivity 60(3) (2002) 351-363.
[27] CARINI, F., SCOTTI, I.A. et al., “134Cs foliar contamination of vine: translocation to grapes and transfer to wine”, International Symposium of Radioecology ten years terrestrial radioecological research following the Chernobyl accident. Vienna, Austria: Austrian Soil Science Society and Federal Environment Agency, (1996) 163-169.
[28] CARINI, F. and LOMBI, E., Foliar and soil uptake of 134Cs and 85Sr by grape vines, Science of the Total Environment 207(2-3) (1997) 157-164.
[29] CARINI, F., BRAMBILLA, M. et al., Caesium-134 and Strontium-85 in Strawberry Plants following Wet Aerial Deposition. Journal of Environmental Quality 32(6) (2003) 2254-2264.
[30] MACACINI, J.F., DE NADAI FERNANDES, E.A.et al., Translocation studies of 137Cs and 90Sr in bean plants (Phaseolus vulgaris): simulation of fallout. Environmental Pollution 120(1) (2002) 151-155.
[31] ONCSIK, M. B., EGED, K. et al., A validation study for the transport of 134Cs to strawberry. Journal of Environmental Radioactivity 61(3) (2002) 319-329.
[32] GERDUNG, S., PÖLLOT, M. et al., Contamination of wheat, rye, and potatoes by foliar application of 134Cs. Journal of Radioanalytical and Nuclear Chemistry 240(2) (1999) 451-454.
[33] CHOI, Y.H., LIM, K.M. et al., Interception, loss and translocation of 85Sr, 103Ru and 134Cs in the rice plants sprayed with a mixed RI solution, Radioprotection-Colloques 37(C14) (2002) 439-444.
[34] BYSTRZEJEWSKA-PIOTROWSKA, G.,URBAN, P.L., Accumulation and translocation of Caesium-137 in onion plants (Allium cepa). Environmental and Experimental Botany 51(1) (2004) 3-7.
[35] CHOI, Y.H., LIM, K.M., YU, D., PARK, H.G., CHOI, Y.G., LEE, C.M., Transfer pathways of 54Mn, 57Co, 85Sr, 103Ru and 134Cs in rice and radish plants directly contaminated at different growth stages, Annals of Nuclear Energy 29 (2002) 429-446
62
[36] CHOI, Y.H., Parameters on the Radionuclide Transfer in Crop Plants for Korean Food Chain Dose Assessment, KAERI/TR-1993/2001, Korea Atomic Energy Research Institute (2001)
[37] BUKOVAC, M.J., WITTWER, S.H. et al., “Above ground plant parts as a pathway for entry of fission products into the food chain with special reference to 89-90Sr and 137Cs” Radioactive fallout, soils, plants, foods, man, (FLOWER, E., Ed.), Elsevier Press New York (1965) 82-109.
[38] VOIGT, G., PRÖHL, G., MÜLLER, H., Experiments on the seasonality of the Caesium translocation in cereals, potatoes and vegetables, Radiation and Environmental Biophysics, 30 (1991) 295-303.
[39] CATALDO, D.A., GARLAND, T.R. et al. Foliar absorption of transuranic elements: Influence of physicochemical form and environmental factors. Journal of Environmental Quality 9(3) (1980) 364-369.
[40] MADOZ-ESCANDE, C., COLLE C., ADAM, C., Evolution of Caesium and strontium contamination deposited on vines, Radioprotection 37 C1 (2002) 515-520.
[41] BRAMBILLA, M., STREBL, F. et al. Ventomod: a dynamic model for leaf to fruit transfer of radionuclides in processing tomato plants (Lycopersicon esculentum Mill.) following a direct contamination event, Journal of Environmental Radioactivity 65(3) (2003) 309-328.
[42] CARINI, F., BENGTSSON, G. Post-deposition transport of radionuclides in fruit, Journal of Environmental Radioactivity 52(2-3) (2001) 215-236.
[43] KORANDA, J. J., ROBISON W.L., Accumulation of radionuclides by plants as a monitor system, Environmental Health Perspectives 27 (1978) 165-179.
[44] OULD-DADA, Z., CARINI, F. et al. Radionuclides in fruit systems: Model prediction-experimental data intercomparison study, Science of the Total Environment 366 (2-3) (2006) 514-524.
[45] OULD-DADA, Z., CARINI, F. et al., A model testing study for the transfer of radioactivity to fruit, Journal of Environmental Radioactivity 70(3) (2003) 207-221.
[46] KOPP, P., GORLICH, W. et al., Foliar uptake of radionuclides and their distribution in the plant, Proc. of Environmental Contamination Following a Major Nuclear Accident 2 (1990) 37-46.
[47] LEVI, E., Penetration, retention and transport of foliar applied single salts of Na, K, Rb and Cs, Physiologia Plantarum 23 (1970) 811-819.
[48] US DEPARTMENT OF ENERGY, Airborne Release of fractions/rates and respirable fractions for non-reactor nuclear facilities, DOE-HDBK-3010-94, December 1994.

63
RESUSPENSION
F. JOURDAIN Commissariat á l'Energie Atomique (CEA), France
Abstract
The paper provides an extended review of the data on resuspension. Processes and definitions as well as factors governing an
extent of the resuspension were considered in details. Resuspension models for evaluation of this process in different (urban,
rural, arid) environmental conditions are considered. Data have been compiled to derive resuspension factors to update the
values given in Technical Reports Series No. 364. Most of this information is given for Cs (Chernobyl observation) and Pu,
however, some data were also derived for iodine, uranium and radium. In spite of the some improvements made after
publishing Technical Reports Series No. 364 it was found that the variability of measured resuspension factors and rates is
very high and a lot of gaps in resuspention modelling still remain.
1. PROCESSES AND FACTORS GOVERNING RESUSPENSION
Resuspension occurs when the wind exerts a force exceeding the adherence of particles to the surface material. The forces in action are the weight of the particle, the adherence, as well as the aerodynamic loads related to the flow of wind.
In general, three types of process are used to describe the spread of contaminants deposited on surface soil [1]: surface creep, saltation and suspension.
Surface creep relates to large, heavy particles (500 to 1000 µm diameter), which roll and slip on soil without air elevation. This process enables snow and sand migration.
Saltation relates to particles in the 100 to 500 µm diameter range. In this process, particles alternate periods with and without soil contact. The main process of transport takes place between 0.1 and 1 meter above the soil. When particles being transported by saltation impact the ground, they lift small particles: as in sandblasting [2]. The saltation process results in horizontal transport and the sandblasting process induces vertical transport.
Suspension relates to small particles (< 100 µm diameter), which are not subject to multiple contacts with the soil, as occurs in saltation. In this process, particles leave the ground and are entrained in the air flow. Chamberlain [2] considered that particles with sizes ranging from 5 to 30 µm are carried long distances in the atmosphere following resuspension.
Another process for resuspension is the mixed effect of wind and rain on particle detachment. Rain splash transport of soil particles in windless conditions has been studied in detail [3-10]. The overall result of these studies is that the contribution of rain splash transport is very small when compared with overland flow transport. Nevertheless, it is still a short distance process studied mainly in relation to horizontal dispersal. Vertical spread has received much less attention. Studies show that rain splash is not a predominant process for atmospheric dispersion of particles due to resuspension.
2. RESUSPENSION CHARACTERISATION
The suspension (or resuspension) of contaminated soil/sediment into the atmosphere is characterized following to two main approaches.
The resuspension factor approach is based on the ratio between the volumetric air concentration and the soil contamination. The resuspension factor has the dimension of reciprocal length; an expression of this parameter is:
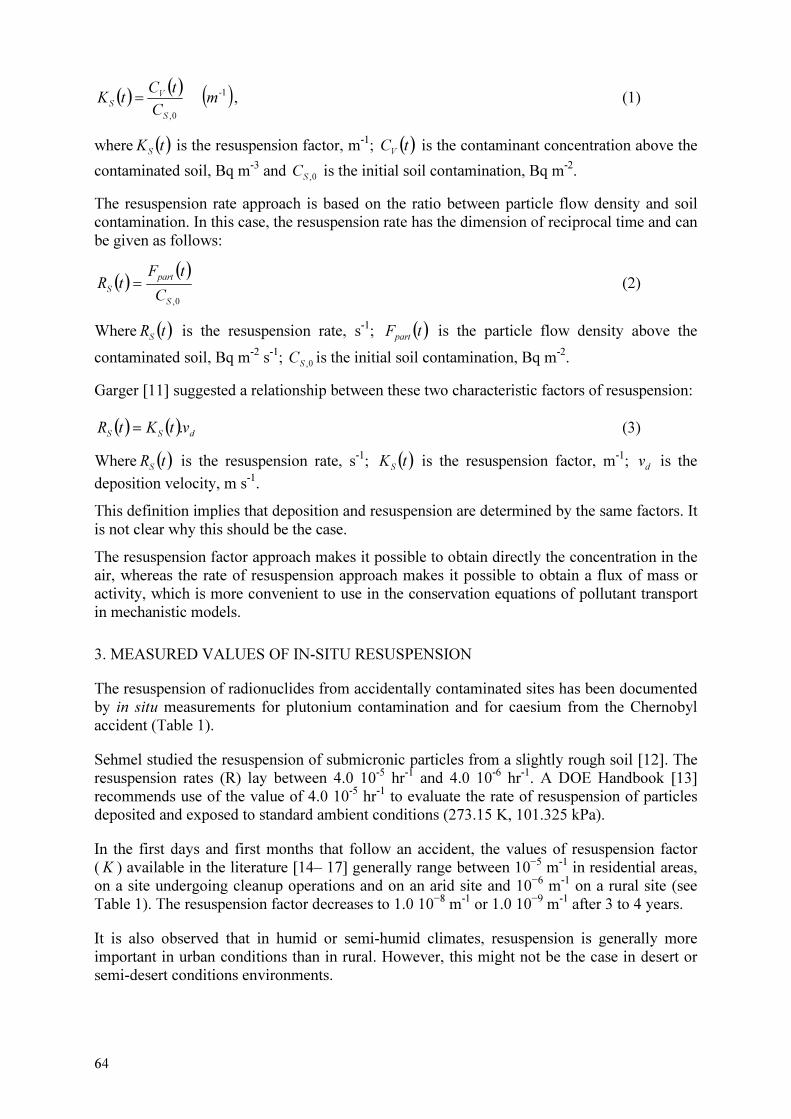
64
( )( ) ( )10,
-
S
V
Sm
C
tCtK = , (1)
where ( )tKS
is the resuspension factor, m-1; ( )tCV
is the contaminant concentration above the
contaminated soil, Bq m-3 and 0,SC is the initial soil contamination, Bq m-2.
The resuspension rate approach is based on the ratio between particle flow density and soil contamination. In this case, the resuspension rate has the dimension of reciprocal time and can be given as follows:
( )( )
0,S
part
SC
tFtR = (2)
Where ( )tRS
is the resuspension rate, s-1; ( )tFpart
is the particle flow density above the
contaminated soil, Bq m-2 s-1; 0,SC is the initial soil contamination, Bq m-2.
Garger [11] suggested a relationship between these two characteristic factors of resuspension:
( ) ( )dSSvtKtR .= (3)
Where ( )tRS
is the resuspension rate, s-1; ( )tKS
is the resuspension factor, m-1; dv is the
deposition velocity, m s-1.
This definition implies that deposition and resuspension are determined by the same factors. It is not clear why this should be the case.
The resuspension factor approach makes it possible to obtain directly the concentration in the air, whereas the rate of resuspension approach makes it possible to obtain a flux of mass or activity, which is more convenient to use in the conservation equations of pollutant transport in mechanistic models.
3. MEASURED VALUES OF IN-SITU RESUSPENSION
The resuspension of radionuclides from accidentally contaminated sites has been documented by in situ measurements for plutonium contamination and for caesium from the Chernobyl accident (Table 1).
Sehmel studied the resuspension of submicronic particles from a slightly rough soil [12]. The resuspension rates (R) lay between 4.0 10-5 hr-1 and 4.0 10-6 hr-1. A DOE Handbook [13] recommends use of the value of 4.0 10-5 hr-1 to evaluate the rate of resuspension of particles deposited and exposed to standard ambient conditions (273.15 K, 101.325 kPa).
In the first days and first months that follow an accident, the values of resuspension factor (K ) available in the literature [14– 17] generally range between 10−5 m-1 in residential areas, on a site undergoing cleanup operations and on an arid site and 10−6 m-1 on a rural site (see Table 1). The resuspension factor decreases to 1.0 10−8 m-1 or 1.0 10−9 m-1 after 3 to 4 years.
It is also observed that in humid or semi-humid climates, resuspension is generally more important in urban conditions than in rural. However, this might not be the case in desert or semi-desert conditions environments.
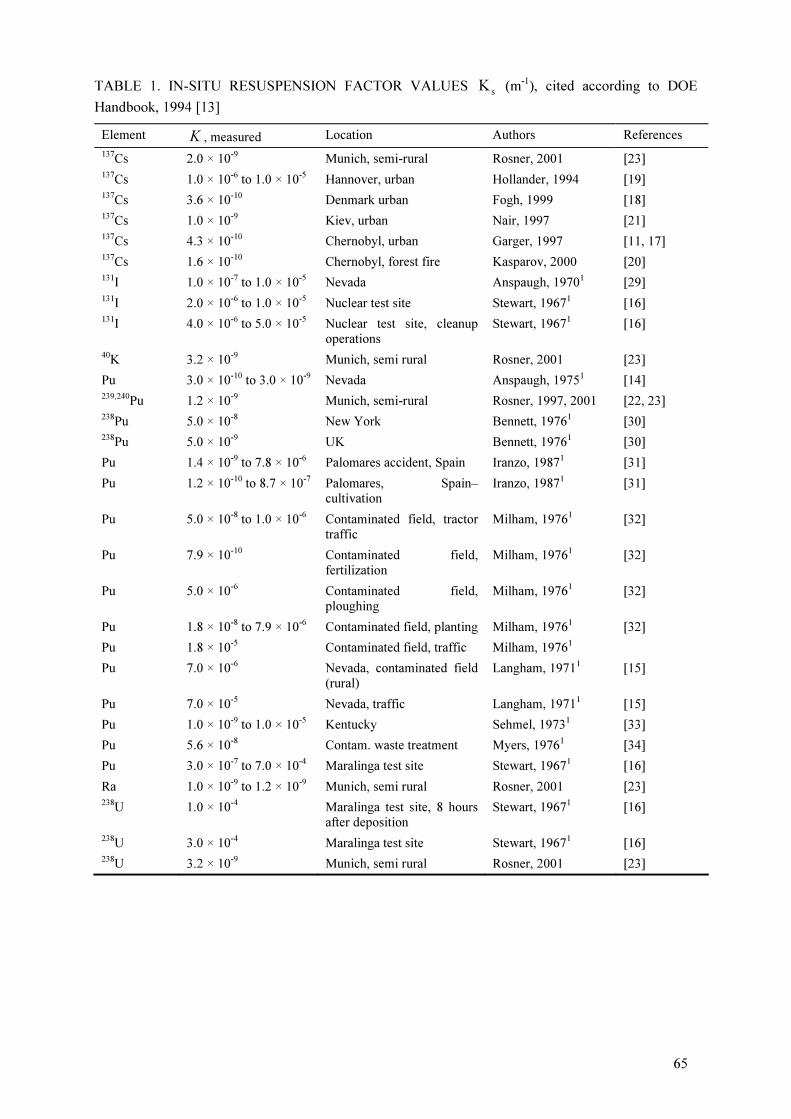
65
TABLE 1. IN-SITU RESUSPENSION FACTOR VALUES s
K (m-1
), cited according to DOE
Handbook, 1994 [13]
Element K , measured Location Authors References
137Cs 2.0 × 10⁻⁹ Munich, semi-rural Rosner, 2001 [23] 137Cs 1.0 × 10⁻⁶ to 1.0 × 10⁻⁵ Hannover, urban Hollander, 1994 [19] 137Cs 3.6 × 10⁻¹⁰ Denmark urban Fogh, 1999 [18] 137Cs 1.0 × 10⁻⁹ Kiev, urban Nair, 1997 [21] 137Cs 4.3 × 10⁻¹⁰ Chernobyl, urban Garger, 1997 [11, 17] 137Cs 1.6 × 10⁻¹⁰ Chernobyl, forest fire Kasparov, 2000 [20] 131I 1.0 × 10⁻⁷ to 1.0 × 10⁻⁵ Nevada Anspaugh, 19701 [29] 131I 2.0 × 10⁻⁶ to 1.0 × 10⁻⁵ Nuclear test site Stewart, 19671 [16] 131I 4.0 × 10⁻⁶ to 5.0 × 10⁻⁵ Nuclear test site, cleanup
operations
Stewart, 19671 [16]
40K 3.2 × 10⁻⁹ Munich, semi rural Rosner, 2001 [23]
Pu 3.0 × 10⁻¹⁰ to 3.0 × 10⁻⁹ Nevada Anspaugh, 19751 [14] 239,240Pu 1.2 × 10⁻⁹ Munich, semi-rural Rosner, 1997, 2001 [22, 23] 238Pu 5.0 × 10⁻⁸ New York Bennett, 19761 [30] 238Pu 5.0 × 10⁻⁹ UK Bennett, 19761 [30]
Pu 1.4 × 10⁻⁹ to 7.8 × 10⁻⁶ Palomares accident, Spain Iranzo, 19871 [31]
Pu 1.2 × 10⁻¹⁰ to 8.7 × 10⁻⁷ Palomares, Spain–
cultivation
Iranzo, 19871 [31]
Pu 5.0 × 10⁻⁸ to 1.0 × 10⁻⁶ Contaminated field, tractor
traffic
Milham, 19761 [32]
Pu 7.9 × 10⁻¹⁰ Contaminated field,
fertilization
Milham, 19761 [32]
Pu 5.0 × 10⁻⁶ Contaminated field,
ploughing
Milham, 19761 [32]
Pu 1.8 × 10⁻⁸ to 7.9 × 10⁻⁶ Contaminated field, planting Milham, 19761 [32]
Pu 1.8 × 10⁻⁵ Contaminated field, traffic Milham, 19761
Pu 7.0 × 10⁻⁶ Nevada, contaminated field
(rural)
Langham, 19711 [15]
Pu 7.0 × 10⁻⁵ Nevada, traffic Langham, 19711 [15]
Pu 1.0 × 10⁻⁹ to 1.0 × 10⁻⁵ Kentucky Sehmel, 19731 [33]
Pu 5.6 × 10⁻⁸ Contam. waste treatment Myers, 19761 [34]
Pu 3.0 × 10⁻⁷ to 7.0 × 10⁻⁴ Maralinga test site Stewart, 19671 [16]
Ra 1.0 × 10⁻⁹ to 1.2 × 10⁻⁹ Munich, semi rural Rosner, 2001 [23] 238U 1.0 × 10⁻⁴ Maralinga test site, 8 hours
after deposition
Stewart, 19671 [16]
238U 3.0 × 10⁻⁴ Maralinga test site Stewart, 19671 [16] 238U 3.2 × 10⁻⁹ Munich, semi rural Rosner, 2001 [23]
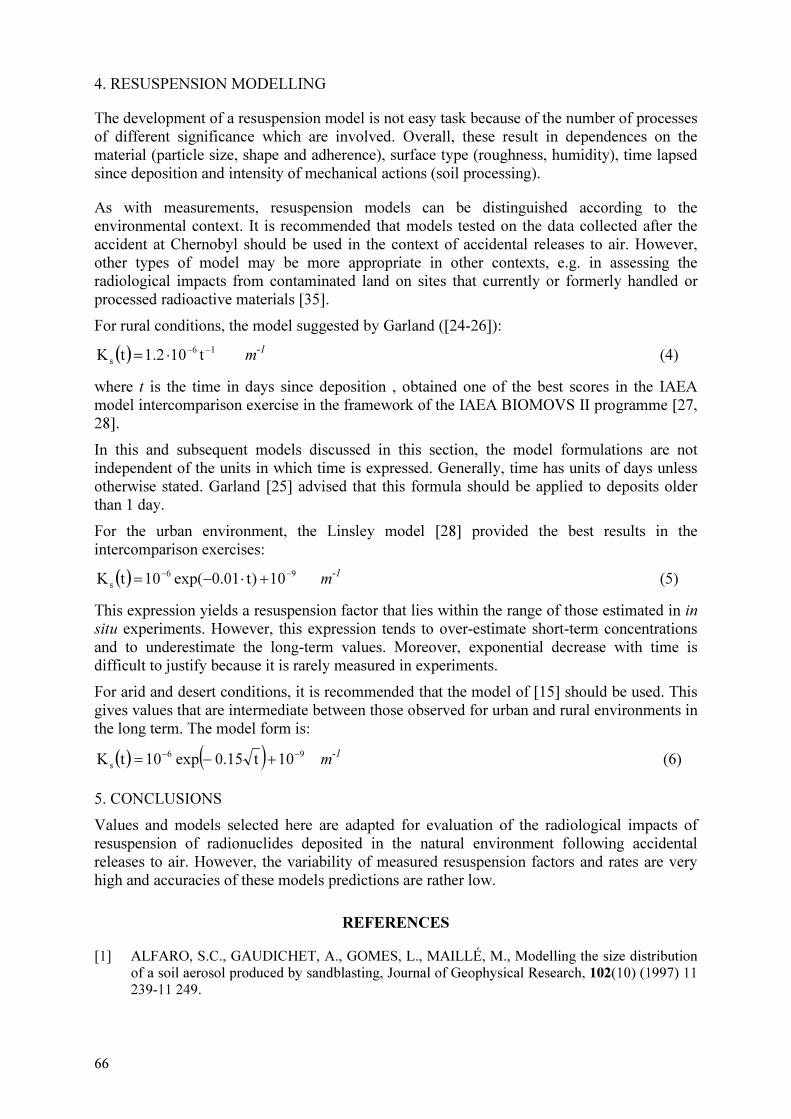
66
4. RESUSPENSION MODELLING
The development of a resuspension model is not easy task because of the number of processes of different significance which are involved. Overall, these result in dependences on the material (particle size, shape and adherence), surface type (roughness, humidity), time lapsed since deposition and intensity of mechanical actions (soil processing).
As with measurements, resuspension models can be distinguished according to the environmental context. It is recommended that models tested on the data collected after the accident at Chernobyl should be used in the context of accidental releases to air. However, other types of model may be more appropriate in other contexts, e.g. in assessing the radiological impacts from contaminated land on sites that currently or formerly handled or processed radioactive materials [35].
For rural conditions, the model suggested by Garland ([24-26]):
( ) 16
st102.1tK−−
⋅= m-1 (4)
where t is the time in days since deposition , obtained one of the best scores in the IAEA model intercomparison exercise in the framework of the IAEA BIOMOVS II programme [27, 28].
In this and subsequent models discussed in this section, the model formulations are not independent of the units in which time is expressed. Generally, time has units of days unless otherwise stated. Garland [25] advised that this formula should be applied to deposits older than 1 day.
For the urban environment, the Linsley model [28] provided the best results in the intercomparison exercises:
( ) 96
s10)t01.0exp(10tK
−−
+⋅−= m-1
(5)
This expression yields a resuspension factor that lies within the range of those estimated in in
situ experiments. However, this expression tends to over-estimate short-term concentrations and to underestimate the long-term values. Moreover, exponential decrease with time is difficult to justify because it is rarely measured in experiments.
For arid and desert conditions, it is recommended that the model of [15] should be used. This gives values that are intermediate between those observed for urban and rural environments in the long term. The model form is:
( ) ( ) 96
s10t15.0exp10tK
−−
+−= m-1 (6)
5. CONCLUSIONS
Values and models selected here are adapted for evaluation of the radiological impacts of resuspension of radionuclides deposited in the natural environment following accidental releases to air. However, the variability of measured resuspension factors and rates are very high and accuracies of these models predictions are rather low.
REFERENCES
[1] ALFARO, S.C., GAUDICHET, A., GOMES, L., MAILLÉ, M., Modelling the size distribution of a soil aerosol produced by sandblasting, Journal of Geophysical Research, 102(10) (1997) 11 239-11 249.
67
[2] CHAMBERLAIN, A.C., “Radioactive aerosols”, Cambridge Environmental Chemistry Series, ISBN 0-521-40121-6, Cambridge (1991).
[3] VAN HEERDEN, W.M., An analysis of soil transportation by raindrop splash, Trans. ASAE 10 (1967) 166– 169.
[4] MOEYERSONS, J., DE PLOEY, J., Quantitative data on splash erosion simulated on unvegetated slopes, Zeitschrift fuer Geomorphologie 25 (1976) 120– 131.
[5] MORGAN, R.P.C., Field studies of rainsplash erosion, Earth Surface Processes and Landforms 3 (1978) 295– 299
[6] POESEN, J., SAVAT, J., Detachment and transportation of loose sediments by raindrop splash: Part II. Detachability and transportability measurements, Catena 8 (1981) 19– 41.
[7] POESEN, J., An improved splash transport model, Zeitschrift fuer Geomorphologie 29 (1985) 193–221.
[8] POESEN, J., Field measurements of splash erosion to validate a splash transport model. Zeitschrift fuer Geomorphologie, Suppl. 58 (1986) 81– 91.
[9] WRIGHT, A.C., A physically based model of the dispersion of splash droplets ejected from a water drop impact, Earth Surface Processes and Landforms 11(4) (1987) 351–367.
[10] GARGER, E.K., HOFFMAN, F.O., THIESSEN, K.M., GALERIU, D., KRYSHEV, A.I. LEV, T., MILLER, C.W., NAIR, S.K., TALERKO, N., WATKINS, B., Test of existing models for atmospheric resuspension of radionuclides, Journal of Environmental Radioactivity 42 (1999) 157-175.
[11] GARGER, E.K., HOFFMAN, F.O., THIESSEN, K.M., Uncertainty of the long-term resuspension factor, Atmospheric Environment 31 (1997) 1647-1656.
[12] SEHMEL, G. A., “Transuranic and tracer stimulants resuspension”, Transuranic Elements in the Environment, (HANSON, W. C., Ed) U.S. Department of Energy, (1980) 236-287.
[13] US DEPARTMENT OF ENERGY, Airborne Release of fractions/rates and respirable fractions for non-reactor nuclear facilities, DOE-HDBK-3010-94, December 1994
[14] ANSPAUGH, L. R., SHINN, J. H., PHELPS, P. L., KENNEDY, N.C., Resuspension and redistribution of plutonium in soils, Health Physics 29 (1975) 571-582.
[15] LANGHAM, W.H., “Plutonium Distribution As a Problem in Environmental Science”, Proc. of Environmental Plutonium Symposium, (FOWLER, E.B., HENDERSON R.W., MILIGAN M.R., Eds.), Los Alamos National Laboratory, Los Alamos, NM, LA-1756 (1971) 3-11.
[16] STEWART, K., “The resuspension of particulate material from surfaces”, Proc. of the Surface Contamination Symposium (B.R. FISH, Ed.), Pergamon Press, New York (1967) 63-74.
[17] GARGER, E.K., KASHPUR, V., BELOV, G., DEMCHUK, V., TSCHIERSCH, J., WAGNEPFEIL, F., PARETZKE, H.G., BESNUS, F., HOLLANDER, W., MARTINEZ-SERRANO, J., VINTERSVED, I., Measurement of resuspended aerosol in the Chernobyl area–Part I: discussion of instrumentation and estimation of measurement uncertainty, Radiation and Environmental Biophysics, 36 (1997) 139-148.
[18] FOGH, C.L., ROED, J., ANDERSSON, K.G., Radionuclide resuspension and mixed deposition at different heights, Journal of Environmental Radioactivity 46 (1999) 67-75.
[19] HOLLANDER, W., Resuspension Factors of 137Cs in Hannover after the Chernobyl Accident, Journal of Aerosol Science 25 (1994) 789-792.
[20] KASPAROV, V.A., LUNDIN, S.M., KADYGRIB, A.M., PROTSAK, V.P., LEVTCHUK, S.E., YOSCHENKO, V.I., KASHPUR, V.A. AND TALERKO, N.M., Forest fires in the territory contaminated as a result of the Chernobyl accident: radioactive aerosol resuspension and exposure of fire-fighters, Journal of Environmental Radioactivity 51 (2000) 281–298.
[21] NAIR, S. K., MILLER, C.W., THIESSEN, K. M., GARGER, E. K., HOSSMAN, F. O., Modelling the resuspension of radionuclides in Ukrainian regions impacted by Chernobyl fallout, Health Physics 72 (1997) 77-85.
[22] ROSNER, G., HOTZL, H. AND WINKLER, R., Long-term behaviour of plutonium in air and deposition and the role of resuspension in a semi-rural environment in Germany, Science of the Total Environment 196 (1997) 255–261.

68
[23] ROSNER, G., WINKLER, R., Long-term variation (1986-1998) of post-Chernobyl 90Sr, 137
Cs, 238
Pu and 239,240
Pu concentrations in air, depositions to ground, resuspension factors and resuspension rates in South Germany, Science of the Total Environment 273 (2001) 11-25.
[24] GARLAND, J.A., Some Recent Studies of the Resuspension of Deposited Material From Soil
and Grass, Harwell, Oxon, England, Atomic Energy Research Establishment, (1982).
[25] GARLAND J.A., PATTENDEN N. J., PLAYFORD K., “Ressuspension following Chernobyl”, Modelling of resuspension, seasonality and loses during food processing. First report of the
VAMP Terrestrial Working Group. IAEA-TECDOC-647, IAEA, Vienna (1992).
[26] INTERNATIONAL ATOMIC ENERGY AGENCY, Modelling of resuspension, seasonality and losses during food processing. Report of the Terrestrial Working group. IAEA-TECDOC-
647, ISSN 1011-4289, IAEA, Vienna (1992).
[27] http://www.cdc.gov/nceh/radiation/brochure/pdf/Resuspension.pdf
[28] LINSLEY, G. S. “Resuspension of the Transuranium Elements: A Review of Existing Data”, National Radiological Protection Board., Harwell, United Kingdom, (1978).
[29] ANSPAUGH, L.R., PHELPS P.L., HOLLADAY G. and HAMBY K.O. "Distribution and of
Redistribution of Airborne Particulate from the Schooner Cratering Event", In Proceedings of the 5th Annual Health Physics Society Midyear Topical Symposium: Health Physics Aspects Nuclear Facility Siting, 2:pp 428-446, Eastern Idaho Health Physics Society, Idaho Falls, ID.
(1970)
[30] BENNETT, B.G. "Transuranic Element Pathways to Man", in Transuranium Nuclides in the Environment Symposium Proceedings, pp 376-383, U.S. Research and Development
Administration and International Atomic Energy Agency. (1976)
[31] IRANZO E., SALVADOR S. and IRANZO C.E, Air concentration of 239Pu and
240Pu and
potential radiation doses to persons living near Pu-contaminated areas in Palomares, Spain,
Health Physics 52, pp. 453–461. (1987)
[32] MILHAM, R.C., SCHUBERT J.F., WATTS J.F., BONI J.R. and COREY J.C. "Measured Plutonium Resuspension and Resulting Dose from Agricultural Operations on an Old Field at
the Savannah River Plant in the Southeastern United States of America.", Transuranium Nuclides in the Environment, pp 409-421, International Atomic Energy Agency, Vienna, Austria. (1976)
[33] SEHMEL G.A. "Particle Resuspension from an Asphalt Road Caused by Car and Truck
Traffic", Atmospheric Environment, 7:pp 291 – 301. (1973)
[34] MYERS D.S., SILVER W.J., COLES D.G., LAMSON K.C., MCINTYRE D.R. and MENDOZA B. "Evaluation of the Use of Sludge Containing Plutonium as a Soil Conditioner
for Food Crops, in Transuranium Nuclides in the Environment, pp. 311-323, International Atomic Energy Agency, Vienna. (1976)
[35] NCRP Report No. 129, Recommended Screening Limits for Contaminated Surface Soil and
Review of Factors Relevant to Site-Specific Studies. Issued January 29, 1999.

AGRICULTURAL ECOSYSTEMS:
RADIONUCLIDE MOBILITY IN SOIL


71
SOIL-RADIONUCLIDE INTERACTIONS
M. VIDAL, A. RIGOL C.J. GIL-GARCÍA. Analytical Chemistry Department–Universitat de Barcelona, Barcelona, Spain
Abstract
Radionuclide mobility in agricultural systems, and thus in the food chain, is strongly affected by the extension of its sorption
in soils, which can be estimated by the quantification of the solid-liquid distribution coefficient (Kd). This parameter may
vary within various orders of magnitude depending on the radionuclide and soil combination, but also on the experimental
method used for its determination. Here, a new Kd database was built up with around 2900 records of 67 elements, which
allows us to calculate the best estimates for the Kd values of a number of radionuclides for various soil types. Best estimates
are derived from geometric means calculated from grouping soils by texture and organic matter content and, when possible,
also using the main soil cofactors governing soil-radionuclide interaction, concretely for radiocaesium, radiostrontium,
uranium, radioiodine, and a few heavy-metal radionuclides. The use of the cofactor approach permits, in most cases,
decreasing the variability of the ranges of Kd values associated with a soil type. Additionally, some hints are given in this
section on the sorption dynamics of radiostrontium and radiocaesium, based on rate constants values and changes with time
in the reversibly sorbed fraction.
1. DISTRIBUTION OF RADIONUCLIDES BETWEEN SOLID AND LIQUID PHASES
1.1. The solid-liquid distribution coefficient concept
The chemical form and speciation of radionuclides strongly affects their movement through environmental media and uptake by biota. Specifically, the way that a radionuclide is bound to solids (soils in the terrestrial environment; sediments in aquatic systems) eventually controls the amount of radionuclide in solution, which directly influences the fraction of radionuclide that may be incorporated by organisms.
Dissolved radionuclide ions can bind to solid surfaces by a number of processes often classified under the broad term of sorption. Although significant progress has been made to describe sorption in heterogeneous solids as a weighted result of sorption on homogeneous surfaces, models for the description of radionuclide sorption are still mostly based on empirical solid-liquid distribution coefficient (Kd) values. This approach is the simplest sorption model available and is the ratio of the concentration of radionuclide sorbed on a specified solid to the radionuclide concentration in a specified liquid phase at equilibrium (Kd, L/kg). The Kd -based model does not assume any knowledge of sorption mechanisms, nor does it contain a term to quantify the capacity and selectivity of the sorption sites or the competition with other ions to fill the sorption sites. Such competitive effects can only be taken into account by the empirical selection of different Kd values applicable in different environmental contexts.
The simple Kd -based model relies on the hypothesis that the radionuclide on the solid phase is in equilibrium with the radionuclide in solution, and thus can exchange with it. However, the elapsed time since the incorporation of the radionuclide is known to affect the quantification of Kd, since a fraction of the incorporated radionuclide may become fixed by the solid phase (an aging effect related to sorption dynamics). Although in most cases no specific comments are made on this issue in published papers, consideration of this process has led to the definition and reporting of various types of Kd in the literature. Whereas the labile or exchangeable Kd refers to the initial sorption process where the radionuclide is reversibly sorbed, due to an ion-exchange based mechanism for most radionuclides, terms such as total Kd are used when there may be radionuclide irreversibly sorbed to the solid phase. Therefore, and as the radionuclide speciation in the solid phase may change with time, an estimation of the changes in the reversibility of the sorption in the short and medium term
,

72
is also required in any experimental approach designed to derive information on sorption dynamics.
Most laboratory tests are, in principle, designed to obtain the so-called exchangeable Kd
( exch
dK ). The additional advantage of using this approach is that the value of exch
dK can be easily
predicted on the basis of soil characteristics, such as binding capacity of the soil (number and selectivity of sorption sites), and the composition of the soil solution (concentration of sorption-competitive ions present in the solution). However, a Kd deduced from a laboratory test cannot be unequivocally considered to be a exch
dK , since the nature of the sorption process
for a given radionuclide may lead to a quasi instantaneous irreversible sorption, and, in other cases, long contact times, for instance, may result in a fraction of the radionuclide activity becoming irreversible sorbed, and thus no longer participating in the soil – soil solution equilibrium. Besides this, the large number of approaches used to quantify Kd values, and the contrasting experimental conditions applied in each case, lead to wide ranges of Kd values being obtained for similar soil and radionuclide combinations. The variation in approaches adopted often makes it difficult to compare among Kd values derived from laboratory experiments.
In this document, generally, the term Kd is utilized to describe the radionuclide distribution coefficient, although other terms are used, as required in specific cases.
1.2. Experimental methods used to estimate the Kd values
Most common approaches derive Kd values from field-contaminated soils, and from sorption and mass transport experiments at a laboratory scale with initially non-contaminated soils.
1.2.1. Kd values from field contaminated soils
The Kd values can be quantified from the radionuclide concentration in the soil solid phase divided by the concentration of the radionuclide in the soil solution obtained from the contaminated soil [1]. This approach is reliable when the level of contamination is high enough to disregard the uncertainty in obtaining and measuring a representative sample of the soil solution.
This approach may lead to Kd values higher than those resulting from a laboratory sorption test, because the radionuclide quantified in the solid phase of the contaminated soil may include sorbed radionuclide not available for exchange with the soil solution due to the time elapsed since the radionuclide incorporation. Therefore, this approach is not recommended for quantification of exch
dK .
1.2.2. Laboratory sorption experiments
Among the laboratory studies, the approach applied most often is to undertake sorption experiments on non-contaminated soils, mainly using batch methods. Experimental conditions may be extremely different from one experiment to another, since a harmonized procedure has not been established, although recommended methods are available from several organizations [2-3].
Sorption experiments are conducted at various radionuclide activity and (more pertinently) mass concentrations, in different hydro chemical and mineralogical contexts. Experimental conditions, such as the composition of the contact solution, contact (shaking) time,
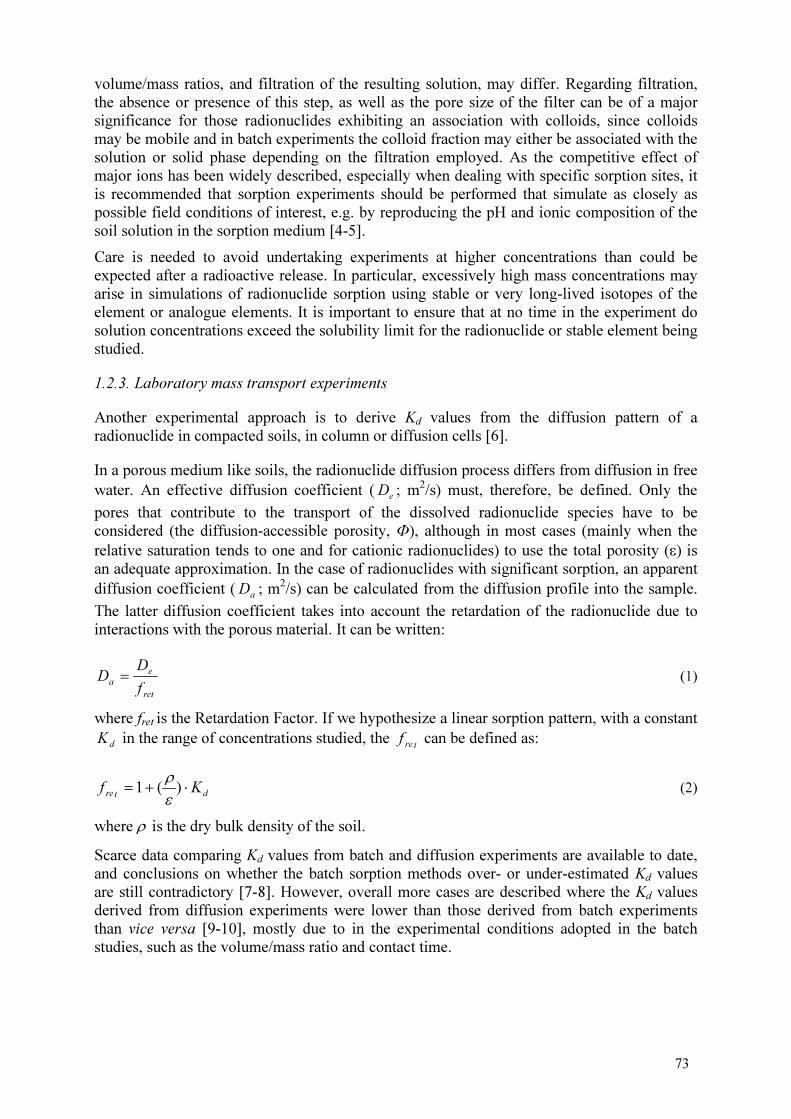
73
volume/mass ratios, and filtration of the resulting solution, may differ. Regarding filtration,
the absence or presence of this step, as well as the pore size of the filter can be of a major
significance for those radionuclides exhibiting an association with colloids, since colloids
may be mobile and in batch experiments the colloid fraction may either be associated with the
solution or solid phase depending on the filtration employed. As the competitive effect of
major ions has been widely described, especially when dealing with specific sorption sites, it
is recommended that sorption experiments should be performed that simulate as closely as
possible field conditions of interest, e.g. by reproducing the pH and ionic composition of the
soil solution in the sorption medium [4-5].
Care is needed to avoid undertaking experiments at higher concentrations than could be
expected after a radioactive release. In particular, excessively high mass concentrations may
arise in simulations of radionuclide sorption using stable or very long-lived isotopes of the
element or analogue elements. It is important to ensure that at no time in the experiment do
solution concentrations exceed the solubility limit for the radionuclide or stable element being
studied.
1.2.3. Laboratory mass transport experiments
Another experimental approach is to derive Kd values from the diffusion pattern of a
radionuclide in compacted soils, in column or diffusion cells [6].
In a porous medium like soils, the radionuclide diffusion process differs from diffusion in free
water. An effective diffusion coefficient (e
D ; m2/s) must, therefore, be defined. Only the
pores that contribute to the transport of the dissolved radionuclide species have to be
considered (the diffusion-accessible porosity, Ф), although in most cases (mainly when the
relative saturation tends to one and for cationic radionuclides) to use the total porosity (ε) is
an adequate approximation. In the case of radionuclides with significant sorption, an apparent
diffusion coefficient (a
D ; m2/s) can be calculated from the diffusion profile into the sample.
The latter diffusion coefficient takes into account the retardation of the radionuclide due to
interactions with the porous material. It can be written:
ret
e
a
f
DD =
(1)
where fret is the Retardation Factor. If we hypothesize a linear sorption pattern, with a constant
dK in the range of concentrations studied, the
tref can be defined as:
dtreKf ⋅+= )(1
ε
ρ
(2)
where ρ is the dry bulk density of the soil.
Scarce data comparing Kd values from batch and diffusion experiments are available to date,
and conclusions on whether the batch sorption methods over- or under-estimated Kd values
are still contradictory [7-8]. However, overall more cases are described where the Kd values
derived from diffusion experiments were lower than those derived from batch experiments
than vice versa [9-10], mostly due to in the experimental conditions adopted in the batch
studies, such as the volume/mass ratio and contact time.
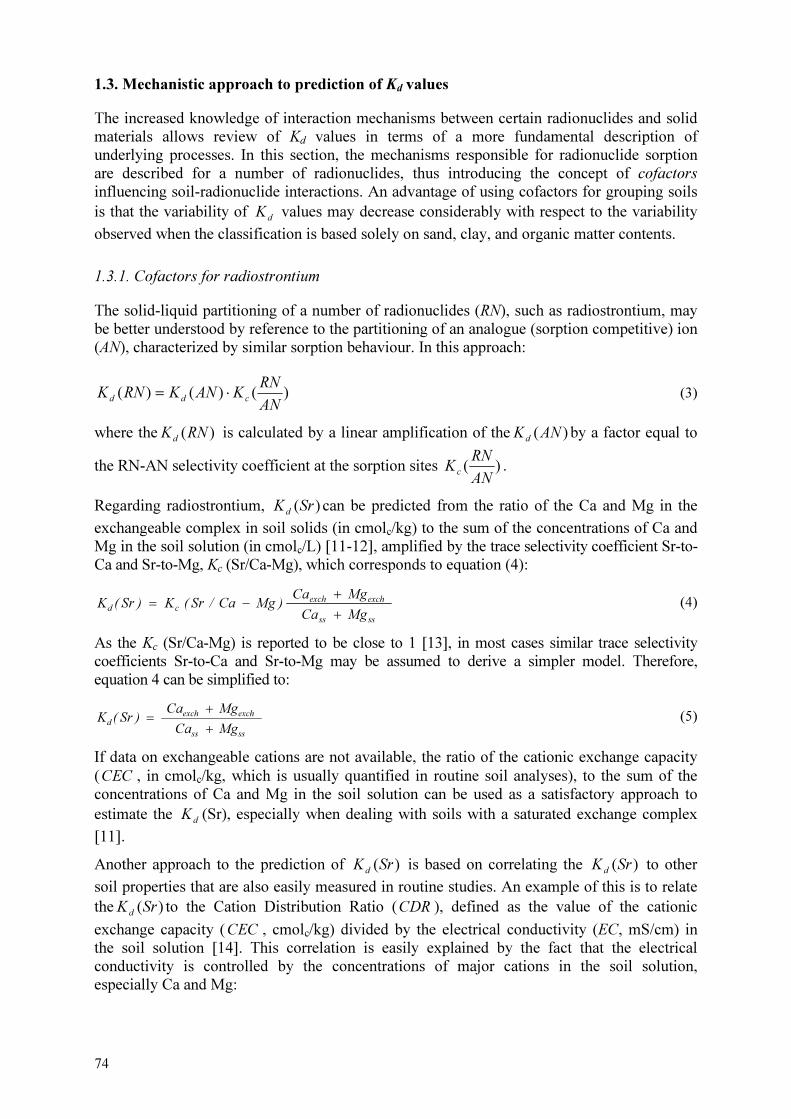
74
1.3. Mechanistic approach to prediction of Kd values
The increased knowledge of interaction mechanisms between certain radionuclides and solid materials allows review of Kd values in terms of a more fundamental description of underlying processes. In this section, the mechanisms responsible for radionuclide sorption are described for a number of radionuclides, thus introducing the concept of cofactors influencing soil-radionuclide interactions. An advantage of using cofactors for grouping soils is that the variability of
dK values may decrease considerably with respect to the variability
observed when the classification is based solely on sand, clay, and organic matter contents.
1.3.1. Cofactors for radiostrontium
The solid-liquid partitioning of a number of radionuclides (RN), such as radiostrontium, may be better understood by reference to the partitioning of an analogue (sorption competitive) ion (AN), characterized by similar sorption behaviour. In this approach:
)()()(AN
RNKANKRNK
cdd⋅= (3)
where the )(RNKd
is calculated by a linear amplification of the )(ANKd
by a factor equal to
the RN-AN selectivity coefficient at the sorption sites )(AN
RNK
c.
Regarding radiostrontium, )(SrKd
can be predicted from the ratio of the Ca and Mg in the
exchangeable complex in soil solids (in cmolc/kg) to the sum of the concentrations of Ca and Mg in the soil solution (in cmolc/L) [11-12], amplified by the trace selectivity coefficient Sr-to-Ca and Sr-to-Mg, Kc (Sr/Ca-Mg), which corresponds to equation (4):
ssss
exchexch
cdMgCa
MgCa)MgCa/Sr(K)Sr(K
+
+−= (4)
As the Kc (Sr/Ca-Mg) is reported to be close to 1 [13], in most cases similar trace selectivity coefficients Sr-to-Ca and Sr-to-Mg may be assumed to derive a simpler model. Therefore, equation 4 can be simplified to:
ssss
exchexch
d
MgCa
MgCa)Sr(K
+
+
= (5)
If data on exchangeable cations are not available, the ratio of the cationic exchange capacity (CEC , in cmolc/kg, which is usually quantified in routine soil analyses), to the sum of the concentrations of Ca and Mg in the soil solution can be used as a satisfactory approach to estimate the
dK (Sr), especially when dealing with soils with a saturated exchange complex
[11].
Another approach to the prediction of )(SrKd
is based on correlating the )(SrKd
to other
soil properties that are also easily measured in routine studies. An example of this is to relate the )(SrK
dto the Cation Distribution Ratio (CDR ), defined as the value of the cationic
exchange capacity (CEC , cmolc/kg) divided by the electrical conductivity (EC, mS/cm) in the soil solution [14]. This correlation is easily explained by the fact that the electrical conductivity is controlled by the concentrations of major cations in the soil solution, especially Ca and Mg:

75
EC (mS cm-1
) ≈ 1000 [Nass + Kss + NH4
+
ss
+ Mgss + Cass] (cmolc/L) (6)
The resultant regression equation for the set of soils examined is [14]:
dK (Sr) (L/ kg) = 2.1 CDR (L/ kg) (7)
1.3.2. Cofactors for radiocaesium
One approach to prediction of the value of )(CsKd
is based on the application of the
Radiocaesium Interception Potential (RIP ) concept. TheRIP value estimates the capacity of a given soil to specifically sorb Cs. The most common protocol to determine the RIP is based on pre-equilibrating the samples with a solution containing 100 mmol/L of Ca and 0.5 mmol/L of K (mK). After pre-equilibrating the samples, these are equilibrated with the same solution, but labelled with radiocaesium. The distribution coefficients ( )(CsK
d) are
obtained by measuring the radiocaesium activity in the supernatant, before and after the equilibration. The calculated product )(CsK
d × mK defines the RIP value (in mmol/kg).
Details can be found elsewhere [15].
The RIP value relates to the content and selectivity of expandable clays, especially illite and other 2:1 phyllosilicates, in which Frayed Edge Sites (FES ), which are specific sites for Cs sorption, are present [16]. Other exchange sites are of little relevance for Cs sorption [17-19], except when dealing with soils with extremely low clay content (e.g. organic matter content over 90%; highly sandy podzols), in which Cs may also be sorbed at other, less specific sites [20].
As Cs sorption is controlled by the specific FES , the Cs solid-liquid distribution coefficient at these sites ( )(CsK
FES
d) accounts for more than 80 % of the total sorption process [19]. The
)(CsKFES
dcan be predicted by dividing the RIP value by the sum of K and NH4
+
concentrations in the soil solution, the latter amplified by the NH4-to-K trace selectivity coefficient in the FES (Kc
FES (NH4 /K)) [16]. This parameter, which can be easily quantified by laboratory experiments, ranges from 4 to 8 for soils in which specific sites control Cs sorption quantitatively, and down to 2 in those soils where sorption at regular exchange sites may be significant [20-21].
For a more accurate prediction of the value of Kd (Cs), a second term must be added to account for Cs sorption at regular exchange sites ( )(CsK
RES
d) by dividing the sum of the
exchangeable K and NH4+ by the sum of K and NH4
+ concentrations in the soil solution (in mmol/L), assuming a selectivity coefficient NH4/K of approximately 1 at these sites. The equation derived may be written as follows:
+
+
+
+
+
+
+
=+=
ss4ss
exch4exch
ss44
FES
css
RES
d
FES
ddNHK
NHK
NH)·K/NH(KK
RIP)Cs(K)Cs(K)Cs(K (8)
For the case of highly saline soils, near to marshlands, with high Na concentrations in the soil solution, equation 8 may be slightly modified to include the potential competitive role of Na and its effect on the quantification of
dK
FES. The equation may be rewritten as follows:
76
=+= )Cs(K)Cs(K)Cs(K RES
d
FES
dd
+
+
+
+
+
+
++
=
ss4ss
exch4exch
ss
FES
css44
FES
cssNHK
NHK
Na·)K/Na(KNH)·K/NH(KK
RIP (9)
where the KcFES
(Na/K) term is the Na-to-K trace selectivity coefficient in the FES. As this coefficient takes values of around 0.02 [15], the role of Na will have a significant effect only in those contexts in which an unusually high Na concentration occurs.
Equations (8) and (9) may be simplified by considering that Na and NH4+ concentrations are
generally much lower than K concentrations, as is the case for most agricultural systems with mineral soils. As the value of Kd
FES (Cs) is much larger than the value of KdRES
(Cs), Kd (Cs) is reasonably well predicted by equation 10, except for those soil types (upland, peat soils; soils affected by flooding) in which NH4
+ss can be significant:
ss
dK
RIP)Cs(K = (10)
A major limitation of this approach to predicting the value of Kd (Cs) is the fact that a Kd value must be obtained to quantify the RIP value. To date, attempts to predict the RIP value from soil properties have been only partially successful. Waegeneers et al. showed that the RIP value depended not only on the clay content, but also on the type of clay and geological origin of the soil [22]. After performing a stepwise regression analysis, the clay content alone accounted for up to the 71% of the variance of the RIP in the most favourable set of soils, whereas for another set of soils it explained only 13% of the variance. Regarding the
dK
database compiled for this IAEA-TECDOC (see below), the RIP and the clay content had a correlation coefficient near to 0.7.
1.3.3. Cofactors for uranium and radium1
Uranium occurs in the valences +3, +4, +5 and +6. In soils, the valences +4 and +6 are the most important. U (IV) dominates at mV 200<
hE [23], which is typical for waterlogged to
wet soils. U (IV) tends to strongly bind to organic matter and to precipitate, and it is, therefore, immobile. The most oxidized state for U in nature is U (VI). At pH below 5, U (VI) is present as the uranyl ion, UO2
2+. At a higher pH, the uranyl ion hydrolyzes, forming a number of aqueous hydroxide complexes, according to the general hydrolysis reaction:
UO22+
+ yH20 ⇔ UO2(OH)y + yH+
The hydrolysed species (e.g. UO2OH+, UO2(OH)20 and (UO2)2(OH)2
2+) often dominate U(VI) speciation in the absence of dissolved inorganic ligands (carbonate, fluoride, sulphate and phosphate). In the presence of dissolved carbonates, U(VI) forms strong carbonate complexes, such as (UO2)2CO3(OH)3
-, UO2CO3, UO2(CO3)2-, UO2(CO3)3
4-. At the pH range of 6 to 10, uranium is largely partitioned into three stable complexes: the acid biphosphate, bicarbonate and tricarbonate [24]. The oxidized uranyl ion phosphate, sulphate and carbonate complexes are soluble and readily transported.
1 The section was written by H. VANDENHOVE, SCK-CEN, Belgian Nuclear Research Centre, Mol, Belgium.
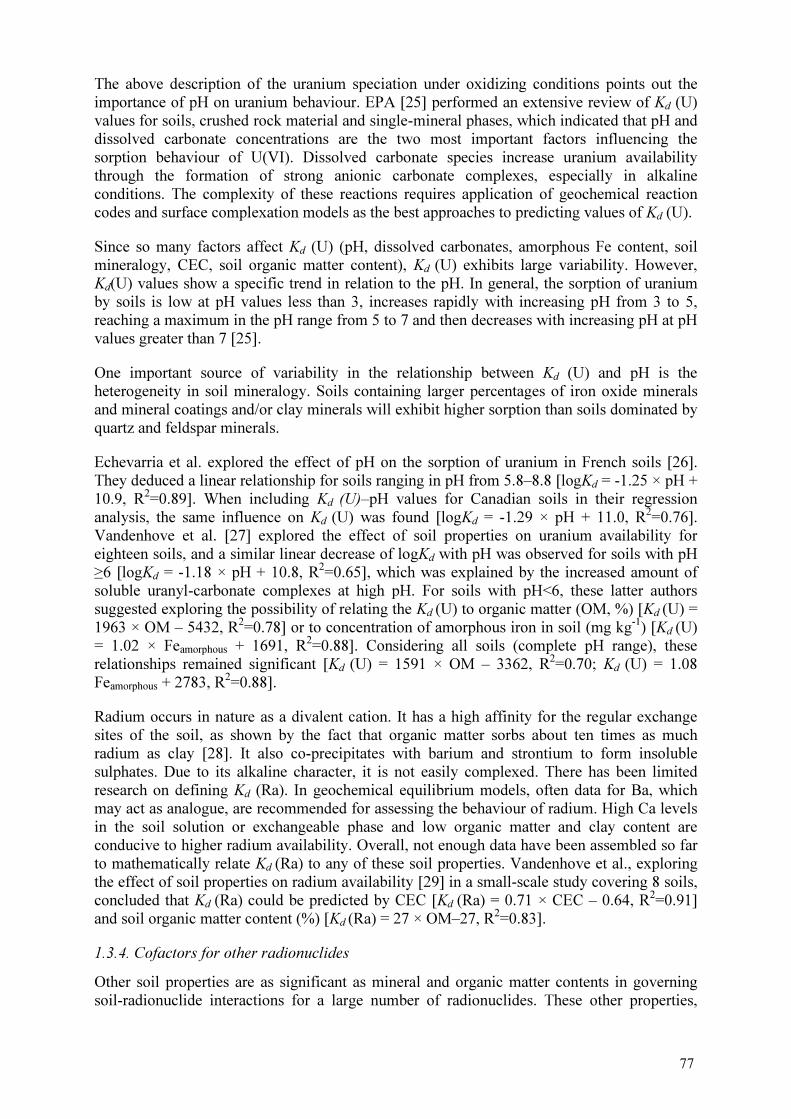
77
The above description of the uranium speciation under oxidizing conditions points out the importance of pH on uranium behaviour. EPA [25] performed an extensive review of Kd (U) values for soils, crushed rock material and single-mineral phases, which indicated that pH and dissolved carbonate concentrations are the two most important factors influencing the sorption behaviour of U(VI). Dissolved carbonate species increase uranium availability through the formation of strong anionic carbonate complexes, especially in alkaline conditions. The complexity of these reactions requires application of geochemical reaction codes and surface complexation models as the best approaches to predicting values of Kd (U).
Since so many factors affect Kd (U) (pH, dissolved carbonates, amorphous Fe content, soil mineralogy, CEC, soil organic matter content), Kd (U) exhibits large variability. However, Kd(U) values show a specific trend in relation to the pH. In general, the sorption of uranium by soils is low at pH values less than 3, increases rapidly with increasing pH from 3 to 5, reaching a maximum in the pH range from 5 to 7 and then decreases with increasing pH at pH values greater than 7 [25].
One important source of variability in the relationship between Kd (U) and pH is the heterogeneity in soil mineralogy. Soils containing larger percentages of iron oxide minerals and mineral coatings and/or clay minerals will exhibit higher sorption than soils dominated by quartz and feldspar minerals.
Echevarria et al. explored the effect of pH on the sorption of uranium in French soils [26]. They deduced a linear relationship for soils ranging in pH from 5.8–8.8 [logKd = -1.25 × pH + 10.9, R2=0.89]. When including Kd (U)–pH values for Canadian soils in their regression analysis, the same influence on Kd (U) was found [logKd = -1.29 × pH + 11.0, R2=0.76]. Vandenhove et al. [27] explored the effect of soil properties on uranium availability for eighteen soils, and a similar linear decrease of logKd with pH was observed for soils with pH ≥6 [logKd = -1.18 × pH + 10.8, R2=0.65], which was explained by the increased amount of soluble uranyl-carbonate complexes at high pH. For soils with pH<6, these latter authors suggested exploring the possibility of relating the Kd (U) to organic matter (OM, %) [Kd (U) = 1963 × OM – 5432, R2=0.78] or to concentration of amorphous iron in soil (mg kg-1) [Kd (U) = 1.02 × Feamorphous + 1691, R2=0.88]. Considering all soils (complete pH range), these relationships remained significant [Kd (U) = 1591 × OM – 3362, R2=0.70; Kd (U) = 1.08 Feamorphous + 2783, R2=0.88].
Radium occurs in nature as a divalent cation. It has a high affinity for the regular exchange sites of the soil, as shown by the fact that organic matter sorbs about ten times as much radium as clay [28]. It also co-precipitates with barium and strontium to form insoluble sulphates. Due to its alkaline character, it is not easily complexed. There has been limited research on defining Kd (Ra). In geochemical equilibrium models, often data for Ba, which may act as analogue, are recommended for assessing the behaviour of radium. High Ca levels in the soil solution or exchangeable phase and low organic matter and clay content are conducive to higher radium availability. Overall, not enough data have been assembled so far to mathematically relate Kd (Ra) to any of these soil properties. Vandenhove et al., exploring the effect of soil properties on radium availability [29] in a small-scale study covering 8 soils, concluded that Kd (Ra) could be predicted by CEC [Kd (Ra) = 0.71 × CEC – 0.64, R2=0.91] and soil organic matter content (%) [Kd (Ra) = 27 × OM–27, R2=0.83].
1.3.4. Cofactors for other radionuclides
Other soil properties are as significant as mineral and organic matter contents in governing soil-radionuclide interactions for a large number of radionuclides. These other properties,

78
alone or combined with textural information, can be used as cofactors for classification of soils in order to reduce the variability in the ranges of Kd values.
As for U, pH strongly affects the sorption of heavy metal radionuclides. Chemical speciation may also affect the Kd values of several radionuclides, since different species (e.g. oxidized-reduced species; oxyanions) may have contrasting sorption behaviour. As an example of this, a major effect of speciation on Kd values has been observed for selenium. Whereas selenate shows Kd values close to zero, for selenite they are up to a few thousand L kg-1 [30]. For iodine, the effect of the speciation (iodide and iodate) on the
dK should also be initially taken
into account, as well as the content of organic matter and Fe and Al oxides, microbial activity and the water regime of the soil [31].
1.4. Kd database and ranges of Kd values
Estimates of Kd values for soils grouped on the basis of the texture and organic matter content criterion as well as on cofactors are given in Tables 1-16 and in Figs. 1-3. Data come from field and laboratory experiments, with various contamination sources, considering mainly the scenario of soils contaminated by radionuclides, and from references mostly from 1990 onwards, including the former Technical Reports Series No. 364 and related reports [32-34], reviewed papers, and grey literature (PhD theses; reports). Around 80 references (see Appendix) have been finally accepted to elaborate the Kd database. In most cases, data from experiments using other materials (e.g. sediments; pure soil phases such as clays or Fe-Mn-Al oxides; rock materials) or stable elements have not been considered. Data from radioisotopes of the same radioelement have been pooled. From around 2900 records for 67 elements, caesium and strontium have the highest number of observations. A few elements have more than 100 entries each, such as iodine, uranium, cobalt, potassium, antimony and selenium.
Comparing the new database with the former Technical Reports Series No. 364, no new data are available for radionuclides of a few elements (Ac, Br, Ho, Pa, Rb, Si and Sm), and data presented in the tables originate from the former Technical Reports Series No. 364. For a number of elements (Ag, Be, Bi, Hf, Mo, P, Pd, Sn, and Ta) although some new data are available, most originate also from the former Technical Reports Series No. 364. In contrast, data on elements not covered in the former Technical Reports Series No. 364 (As, Ba, Cl, Cu, Dy, Ga, H, Hg, In, Ir, K, La, Lu, Mg, Na, Pm, Pt, Rh, Sc, Tb, Te, Tm, V, and Y) have been included. However, for a few cases, data come from a single reference.
The Kd values, expressed in L kg-1, have been grouped according to the organic matter content and sand and clay percentages of the mineral matter content (texture/OM criterion). This criterion for soil classification is described in earlier.1Besides presenting the Kd data according to the texture/OM criterion, the Kd values are also grouped for a limited number of radionuclides according to the cofactor approach, using specific soil properties (radiostrontium and radiocaesium), soil pH (uranium and heavy metal radionuclides with a sufficiently large number of observations) and speciation data and water regime (radioiodine).
Although AM and SD values are given, GM and GSD are preferred to describe Kd data, since the log-transformed
dK values are typically normally distributed. Exploratory analysis, based
on box-and-whisker plots, has been applied to exclude potential outliers and thus to decrease
1 See paper by Fesenko et al. ‘Radioecological Definitions, Soil, Plant Classifications and Reference Ecological
Data For Radiological Assessments’ in this publication.
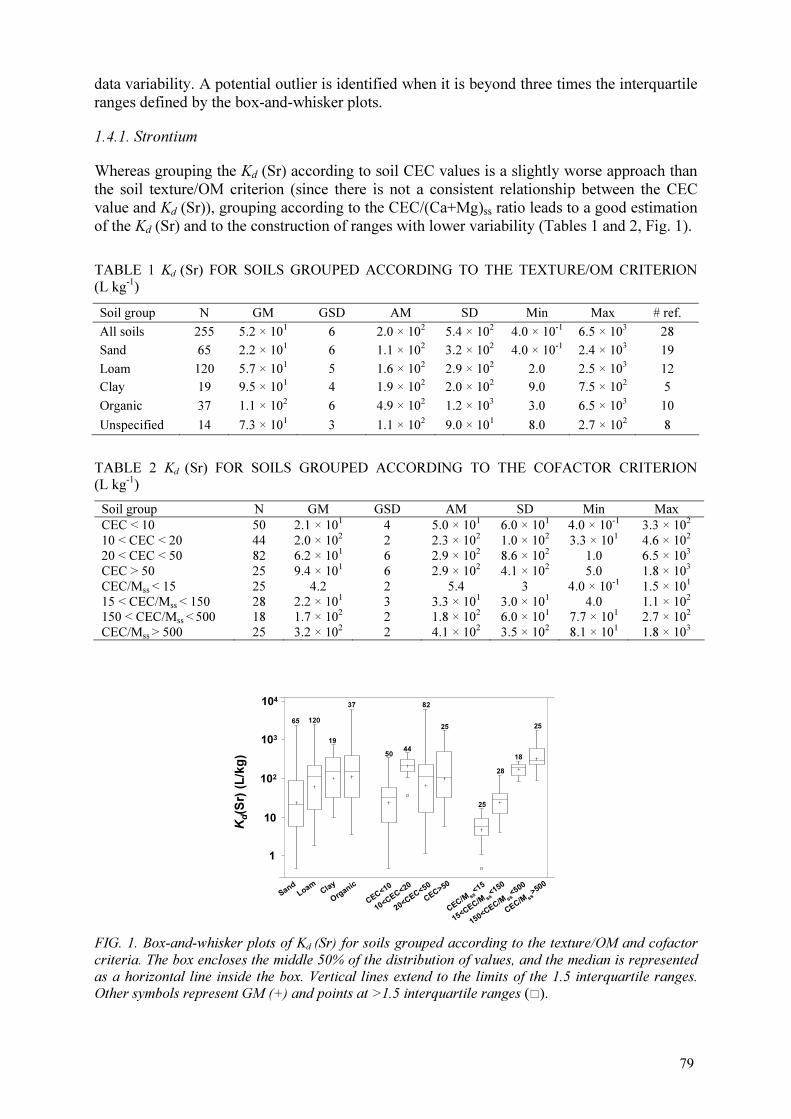
79
data variability. A potential outlier is identified when it is beyond three times the interquartile ranges defined by the box-and-whisker plots.
1.4.1. Strontium
Whereas grouping the Kd (Sr) according to soil CEC values is a slightly worse approach than the soil texture/OM criterion (since there is not a consistent relationship between the CEC value and Kd (Sr)), grouping according to the CEC/(Ca+Mg)ss ratio leads to a good estimation of the Kd (Sr) and to the construction of ranges with lower variability (Tables 1 and 2, Fig. 1).
TABLE 1 Kd (Sr) FOR SOILS GROUPED ACCORDING TO THE TEXTURE/OM CRITERION (L kg-1)
Soil group N GM GSD AM SD Min Max # ref.
All soils 255 5.2 × 101 6 2.0 × 10² 5.4 × 10² 4.0 × 10⁻¹ 6.5 × 10³ 28
Sand 65 2.2 × 101 6 1.1 × 10² 3.2 × 10² 4.0 × 10⁻¹ 2.4 × 10³ 19
Loam 120 5.7 × 101 5 1.6 × 10² 2.9 × 10² 2.0 2.5 × 10³ 12
Clay 19 9.5 × 101 4 1.9 × 10² 2.0 × 10² 9.0 7.5 × 10² 5
Organic 37 1.1 × 10² 6 4.9 × 10² 1.2 × 10³ 3.0 6.5 × 10³ 10
Unspecified 14 7.3 × 101 3 1.1 × 10² 9.0 × 101 8.0 2.7 × 10² 8
TABLE 2 Kd (Sr) FOR SOILS GROUPED ACCORDING TO THE COFACTOR CRITERION (L kg-1)
Soil group N GM GSD AM SD Min Max
CEC < 10 50 2.1 × 101 4 5.0 × 101 6.0 × 101 4.0 × 10⁻¹ 3.3 × 10²
10 < CEC < 20 44 2.0 × 10² 2 2.3 × 10² 1.0 × 10² 3.3 × 101 4.6 × 10²
20 < CEC < 50 82 6.2 × 101 6 2.9 × 10² 8.6 × 10² 1.0 6.5 × 10³
CEC > 50 25 9.4 × 101 6 2.9 × 10² 4.1 × 10² 5.0 1.8 × 10³
CEC/Mss < 15 25 4.2 2 5.4 3 4.0 × 10⁻¹ 1.5 × 101
15 < CEC/Mss < 150 28 2.2 × 101 3 3.3 × 101 3.0 × 101 4.0 1.1 × 10² 150 < CEC/Mss < 500 18 1.7 × 10² 2 1.8 × 10² 6.0 × 101 7.7 × 101 2.7 × 10²
CEC/Mss > 500 25 3.2 × 10² 2 4.1 × 10² 3.5 × 10² 8.1 × 101 1.8 × 10³
104
103
102
10
1
Kd(S
r) (
L/k
g)
120
19
37
5044
82
25
25
28
18
2565
Sand
Loam Cl
ay
Organic
CEC<
10
10<C
EC<20
20<C
EC<50
CEC>
50
CEC/M s
s<15
15<C
EC/M s
s<150
150<CE
C/M s
s<500
CEC/M s
s>500
FIG. 1. Box-and-whisker plots of Kd (Sr) for soils grouped according to the texture/OM and cofactor
criteria. The box encloses the middle 50% of the distribution of values, and the median is represented
as a horizontal line inside the box. Vertical lines extend to the limits of the 1.5 interquartile ranges.
Other symbols represent GM (+) and points at >1.5 interquartile ranges (�).

80
1.4.2. Caesium
As expected, the Kd (Cs) increases consistently with the clay content, and exhibits the lowest GM value in the organic soils. The Kd (Cs) can also be estimated for soils grouped according to their RIP values, and with respect to the ratio RIP/Kss, which leads to a good prediction of the Kd (Cs) and to ranges of values of Kd (Cs) with the lowest variability (Tables 3 and 4, Fig. 2).
TABLE 3 Kd (Cs) FOR SOILS GROUPED ACCORDING TO THE TEXTURE/OM CRITERION (L/kg)
Soil group N GM GSD AM SD Min Max # ref.
All soils 469 1.2 × 10³ 7 6.1 × 10³ 2.1 × 10⁴ 4.3 3.8 × 10⁵ 32
Sand 114 5.3 × 10² 6 2.2 × 10³ 5.0 × 10³ 1.0 × 101 3.5 × 10⁴ 19
Loam 191 3.5 × 10³ 4 7.2 × 10³ 9.9 × 10³ 3.9 × 101 5.5 × 10⁴ 17
Clay 36 5.5 × 10³ 4 2.2 × 10⁴ 6.7 × 10⁴ 5.7 × 10² 3.8 × 10⁵ 9
Organic 108 2.7 × 10² 7 3.0 × 10³ 1.2 × 10⁴ 4.3 9.5 × 10⁴ 14
Unspecified 20 1.7 × 10³ 5 6.7 × 10³ 1.5 × 10⁴ 4.0 × 101 5.5 × 10⁴ 8
TABLE 4 Kd (Cs) FOR SOILS GROUPED ACCORDING TO THE COFACTOR CRITERION (L/kg)
Soil group N GM GSD AM SD Min Max
RIP < 150 47 7.4 × 101 2 1.1 × 10² 1.3 × 10² 1.0 × 101 7.3 × 10²
150 < RIP < 1000 78 3.2 × 10² 6 1.8 × 10³ 5.2 × 10³ 1.0 × 101 3.4 × 10⁴
1000 < RIP < 2500 72 2.4 × 10³ 4 7.2 × 10³ 1.5 × 10⁴ 6.2 × 101 9.5 × 10⁴
RIP > 2500 60 7.2 × 10³ 4 2.1 × 10⁴ 5.2 × 10⁴ 2.2 × 10² 3.8 × 10⁵
RIP/Kss < 100 37 8.5 × 101 3 1.5 × 10² 1.6 × 10² 1.0 × 101 7.0 × 10²
100 < RIP/Kss < 1000 85 2.4 × 10² 5 7.9 × 10² 1.3 × 10³ 2.0 × 101 5.8 × 10³
1000 < RIP/Kss < 10000 78 2.0 × 10³ 4 4.5 × 10³ 6.7 × 10³ 6.2 × 101 3.4 × 10⁴
RIP/Kss > 10000 57 9.9 × 10³ 4 2.6 × 10⁴ 5.5 × 10⁴ 2.2 × 10² 3.8 × 10⁵
Sand
Loam
Clay
Organic
106
105
104
103
102
10
RIP<
150
150<RIP<
1000
1000<R
IP<2500
RIP>
2500
RIP/K s
s
<100
100<RIP/K s
s
<1000
1000<R
IP/K s
s
<10000
RIP/K s
s
>10000
Kd(C
s)
(L/k
g)
114
191
36
108
47
78
72
60
37
85
78
57
FIG. 2. Box-and-whisker plots of Kd (Cs) for soils grouped according to the texture/OM and cofactor criteria. The box encloses the middle 50% of the distribution of values, and the median is represented
as a horizontal line inside the box. Vertical lines extend to the limits of the 1.5 interquartile ranges. Other symbols represent GM (+) and points at >1.5 interquartile ranges (�).

81
1.4.3. Uranium
Estimates of Kd(U) values for soils grouped based on the texture/organic matter content cretarion and pH are given in Tables 5-6 and in Fig. 3.
Whereas values of Kd (U) do not show any correlation with soil texture, the values of Kd (U) can also be grouped according to the pH of the soil, which leads to ranges of Kd (U) with lower variability and confirms the Kd-pH dependence. A significant 10-fold higher
dK (U)
value is observed for the 5-7 pH range.
TABLE 5 Kd (U) FOR SOILS GROUPED ACCORDING TO THE TEXTURE/OM CRITERION (L/kg)
Soil group N GM GSD AM SD Min Max # ref.
All soils 178 2.0 × 10² 1.2 × 101 2.0 × 10² 6.7 × 10³ 7.0 × 10⁻¹ 6.7 × 10⁴ 22
Sand 50 1.1 × 10² 1.2 × 101 2.1 × 10³ 9.5 × 10³ 7.0 × 10⁻¹ 6.7 × 10⁴ 8
Loam 84 3.1 × 10² 1.2 × 101 2.5 × 10³ 6.3 × 10³ 9.0 × 10⁻¹ 3.9 × 10⁴ 12
Clay 12 2.8 × 101 7 1.2 × 10² 1.7 × 10² 2.6 4.8 × 10² 3
Organic 9 1.2 × 10³ 6 2.9 × 10³ 2.8 × 10³ 3.3 × 101 7.6 × 10³ 7
Unspecified 23 1.7 × 10² 6 8.6 × 10² 1.7 × 10³ 1.6 × 101 6.2 × 10³ 5
TABLE 6 Kd (U) FOR SOILS GROUPED ACCORDING TO THE pH (L/kg)
Soil group N GM GSD AM SD Min Max
pH < 5 36 7.1 × 101 1.1 × 101 5.4 × 10² 1.2 × 10³ 7.0 × 10⁻¹ 6.7 × 10³
5 ≤ pH < 7 78 7.4 × 10² 8 4.0 × 10³ 9.7 × 10³ 2.6 6.7 × 10⁴
pH ≥7 60 6.5 × 101 8 4.4 × 10² 1.1 × 10³ 9.0 × 10⁻¹ 6.2 × 10³
Kd
(U
) (L
/kg
)
105
104
103
102
10
1
SandLoam
Clay
Organic
pH < 5
5 ≤pH <
7
pH ≥7
36
78
60
50
84
12
9
FIG. 3. Box-and-whisker plots of Kd (U) for soils grouped according to the texture/OM and pH
criteria. The box encloses the middle 50%, and the median is represented as a horizontal line inside
the box. Vertical lines extend to the point within 1.5 interquartile ranges. Other symbols represent GM
(+) and points at > 1.5 interquartile ranges (�).

82
1.4.4. Iodine
Kd (I) values for soils grouped on the basis of the texture and organic matter content criterion as well as data on effect of watter content on Kd values for iodine are presented in Table 7.
The effect of organic matter and water regime can be more significant than the iodine species involved in the sorption, depending on the soil redox potential and factors such as drying temperature and sorption contact time. This indicates a complex dependency of Kd (I) on the organic matter and water content, microbial activity, and oxidizing-reducing conditions.
1.4.5. Heavy metals: Cd, Co, Ni, and Zn
Kd values for some heavy metals (Cd, Co, Ni, Zn) Kd values for soils grouped on the basis of the texture and organic matter content criterion as well as data on effect of pH (excluding organic soils) are given in Tables 8-15.
While there is not a straight relationship between the soil texture and thed
K value for the
selected heavy metals, thed
K values of these heavy metal radionuclides in mineral soils show
a clear dependence on pH.
2. CHANGES IN SOIL-RADIONUCLIDE INTERACTIONS WITH TIME: SORPTION DYNAMICS
Radionuclide-soil interactions exhibit changes with time. After an extended period since the contamination, radionuclides incorporated in the solid soil phase can occur in exchangeable and non-exchangeable forms. Whereas the exchangeable form includes radionuclide sorbed by the ion-exchange mechanism that is easily transferred to soil solution, the non-exchangeable form refers to radionuclide sorbed by irreversible mechanisms. The significance of the fixation process is controlled by the rate of transition between the mobile and fixed states.
TABLE 7 Kd (I) FOR SOILS GROUPED ACCORDING TO THE TEXTURE/OM CRITERION, SPECIATION, AND ORGANIC MATTER CONTENT (L/kg). ADDITIONAL EFFECT OF WATER CONTENT ON Kd (I)
Soil group N GM GSD AM1 SD Min Max # ref.
All data All soils 250 6.9 5 2.5 × 101 7.0 × 101 1.0 × 10⁻² 5.8 × 10² 9
Sand 48 4.1 7 1.3 × 101 2.0 × 101 1.0 × 10⁻² 1.3 × 10² 7
Loam 129 8.0 4 2.5 × 101 7.0 × 101 2.0 × 10⁻¹ 5.4 × 10² 6
Clay 19 1.1 × 101 5 3.1 × 101 4.0 × 101 1.0 1.8 × 10² 5
Organic 11 3.2 × 101 3 8.0 × 101 1.7 × 10² 8.5 5.8 × 10² 4
Unspecified 43 4.2 6 1.8 × 101 6.0 × 101 1.0 × 10⁻¹ 3.7 × 10² 2
I- All soils 157 5.4 6 2.5 × 101 7.0 × 101 1.0 × 10⁻² 5.8 × 10² 6
Sand 37 3.6 8 1.3 × 101 2.0 × 101 1.0 × 10⁻² 1.3 × 10² 5
Loam 74 6.5 5 2.4 × 101 7.0 × 101 2.0 × 10⁻¹ 5.3 × 10² 4
Clay 13 6.8 6 2.1 × 101 3.0 × 101 1.0 1.2 × 10² 2
Organic 9 3.6 × 101 4 9.3 × 101 1.8 × 10² 8.5 5.8 × 10² 3
Unspecified 24 2.6 6 2.0 × 101 7.0 × 101 1.0 × 10⁻¹ 3.7 × 10² 2
IO3
- All soils 67 7.9 4 2.3 × 101 7.0 × 101 4.0 × 10⁻¹ 5.4 × 10² 2
Sand 6 3.6 5 1.0 × 101 2.0 × 101 4.0 × 10⁻¹ 4.1 × 101 1
Loam 41 8.9 4 2.9 × 101 8.0 × 101 1.0 5.4 × 10² 2

83
Organic 1 - - 1.3 × 101 - - - 1
Unspecified 19 7.7 5 1.6 × 101 2.0 × 101 4.0 × 10⁻¹ 5.8 × 101 2
All data OM < 2 75 2.3 6 7.3 1.0 × 101 1.0 × 10⁻² 5.7 × 101
2 ≤ OM < 5 106 9.1 3 2.0 × 101 5.4 × 101 6.0 × 10⁻¹ 5.4 × 10²
5 ≤ OM < 10 27 1.8 × 101 4 3.8 × 101 5.5 × 101 2.0 2.6 × 10²
OM ≥ 10 19 3.4 × 101 3 8.7 × 101 1.7 × 10² 8.5 5.8 × 10²
Effect of water content on the Kd [30, 35-36] 3
I- Sand-dry 1 - - 2.8 × 101 - - -
Sand-wet 1 - - 3.2 × 101 - - -
Unspecified-dry 9 1.9 × 101 6 7.5 × 101 1.5 × 10² 8.0 × 10⁻¹ 4.7 × 10²
Unspecified-wet 9 5.5 × 10² 6 1.4 × 10³ 2.2 × 10³ 8.0 7.0 × 10³
IO3
- Sand-dry 1 - - 2.8 × 101 - - -
Sand-wet 1 - - 3.5 × 101 - - -
Unspecified-dry 9 1.5 × 101 7 8.5 × 101 1.8 × 10² 7.0 × 10⁻¹ 5.5 × 10²
Unspecified-wet 9 6.8 × 10² 7 1.8 × 10³ 2.3 × 10³ 8.0 7.5 × 10³
1Single value is given in this column if N=1.
TABLE 8 Kd (Cd) FOR SOILS GROUPED ACCORDING TO THE TEXTURE/OM CRITERION (L/kg)
Soil group N GM GSD AM SD Min Max # ref.
All soils 61 1.5 × 10² 9 7.7 × 10² 1.3 × 10³ 2.0 7.0 × 10³ 11
Sand 30 1.1 × 10² 8 4.2 × 10² 5.3 × 10² 2.0 1.8 × 10³ 5
Loam 5 1.0 × 10² 7 4.1 × 10² 7.3 × 10² 9.2 1.7 × 10³ 4
Clay 4 1.3 × 10² 1.5 × 101 8.2 × 10² 1.3 × 10³ 6.9 2.7 × 10³ 3
Organic 13 6.5 × 10² 6 1.7 × 10³ 2.2 × 10³ 9.6 7.0 × 10³ 6
Unspecified 9 6.8 × 101 1.5 × 101 7.3 × 10² 1.4 × 10³ 6.2 4.4 × 10³ 4
TABLE 9 Kd (Cd) FOR SOILS GROUPED ACCORDING TO THE pH (EXCLUDING ORGANIC SOILS; L/kg)
Soil group N GM GSD AM SD Min Max
pH < 5 8 1.1 × 101 3
1.9 × 101 2.0 × 101 2.0 6.4 × 101
5 ≤ pH < 6.5 11 1.8 × 101 4 5.4 × 101 9.0 × 101
6.2 2.5 × 10²
pH ≥ 6.5 24 3.8 × 10² 6 9.2 × 10² 1.0 × 10²
3.7 4.4 × 10³
TABLE 10 Kd (Co) FOR SOILS GROUPED ACCORDING TO THE TEXTURE/OM CRITERION (L/kg)
Soil group N GM GSD AM SD Min Max # ref.
All soils 118 4.8 × 10² 1.6 × 101 6.3 × 10³ 1.7 × 10⁴ 2.0 1.0 × 10⁵ 8
Sand 18 2.6 × 10² 1.8 × 101 4.8 × 10³ 1.1 × 10⁴ 5.0 3.7 × 10⁴ 4
Loam 71 8.1 × 10² 1.5 × 101 6.6 × 10³ 1.8 × 10⁴ 2.0 1.0 × 10⁵ 5
Clay 10 3.8 × 10³ 6 1.6 × 10⁴ 3.2 × 10⁴ 5.4 × 10² 9.9 × 10⁴ 3
Organic 17 8.7 × 101 9 7.0 × 10² 1.6 × 10³ 4.0 5.8 × 10³ 4
Unspecified 2 - - 7.5 × 10³ - 1.3 × 10² 1.5 × 10⁴ 2

84
TABLE 11 Kd (Co) FOR SOILS GROUPED ACCORDING TO THE pH (EXCLUDING ORGANIC SOILS; L/kg)
Soil group N GM GSD AM SD Min Max
pH < 5 21 1.2 × 101 5 3.5 × 101 5.0 × 101 2.0 1.5 × 10²
5 ≤ pH < 6.5 50 1.9 × 10³ 5 9.5 × 10
3 2.0 × 10⁴ 2.9 × 101 9.9 × 10⁴
pH ≥ 6.5 26 4.6 × 10³ 4 1.0 × 10
4 2.4 × 10⁴ 5.5 × 10² 1.0 × 10⁵
TABLE 12 Kd (Ni) FOR SOILS GROUPED ACCORDING TO THE TEXTURE/OM CRITERION (L/kg)
Soil group N GM GSD AM SD Min Max # ref.
All soils 64 2.8 × 10² 7 9.5 × 10² 1.4 × 10³ 3.0 7.2 × 10³ 12
Sand 26 1.3 × 10² 1.0 × 101 9.4 × 10² 1.8 × 10³ 3.0 7.2 × 10³ 4
Loam 14 1.8 × 10² 5 4.1 × 10² 4.1 × 10² 7.7 1.2 × 10³ 6
Clay 12 9.3 × 10² 2 1.2 × 10³ 9.4 × 10² 2.5 × 10² 3.2 × 10³ 5
Organic 8 1.1 × 10³ 2 1.4 × 10³ 1.5 × 10³ 4.1 × 10² 5.0 × 10³ 3
Unspecified 4 4.8 × 10² 8 1.1 × 10³ 9.6 × 10² 2.2 × 101 2.3 × 10³ 3
TABLE 13 Kd (Ni) FOR SOILS GROUPED ACCORDING TO THE pH (EXCLUDING ORGANIC SOILS; L/kg)
Soil group N GM GSD AM SD Min Max
pH < 5 10 1.4 × 101 2 1.8 × 101 1.0 × 101 3.0 4.8 × 101
5 ≤ pH < 6.5 11 5.8 × 101 4 1.6 × 10² 3.0 × 10² 7.0 1.1 × 10³
pH ≥ 6.5 30 8.2 × 10² 3 1.4 × 10³ 1.6 × 10³ 4.0 × 101 7.3 × 10³
TABLE 14 Kd (Zn) FOR SOILS GROUPED ACCORDING TO THE TEXTURE/OM CRITERION (L/kg)
Soil group N GM GSD AM SD Min Max # ref.
All soils 92 9.5 × 10² 1.1 × 101 5.2 × 10³ 1.6 × 10⁴ 9.0 × 10
-
1 1.5 × 10
5 11
Sand 17 1.1 × 10² 2.3 × 101 2.6 × 10³ 6.8 × 10³ 9.0 × 10
-
1 2.8 × 10
4 6
Loam 48 2.4 × 10³ 4 7.6 × 10³ 2.2 × 10⁴ 2.1 × 10² 1.5 × 10⁵ 4
Clay 8 2.4 × 10³ 2 3.2 × 10³ 2.4 × 10³ 4.8 × 10² 6.9 × 10³ 3
Organic 12 5.6 × 10² 8 1.9 × 10³ 2.5 × 10³ 9.7 7.6 × 10³ 6
Unspecified 7 2.4 × 10² 3.5 × 101 2.6 × 10³ 2.8 × 10³ 4.6 6.2 × 10³ 5
TABLE 15 Kd (Zn) FOR SOILS GROUPED ACCORDING TO THE pH (EXCLUDING ORGANIC SOILS; L/kg)
N GM GSD AM SD Min Max
pH < 5 9 8.2 8 6.0 × 101 1.1 × 10² 0.9 × 10⁻¹ 3.0 × 10²
5 ≤ pH < 6.5 49 1.6 × 10³ 6 4.2 × 10³ 6.0 × 10³ 6.2 3.0 × 10⁴
pH ≥ 6.5 17 4.3 × 10³ 4 1.4 × 10⁴ 3.6 × 10⁴ 4.4 × 10² 1.5 × 10⁵

85
1.4.6. Miscellany of elements
TABLE 16 Kd FOR SOILS GROUPED ACCORDING TO THE TEXTURE/OM CRITERION (L/kg)
Element Soil group N GM GSD AM/Value SD Min Max # ref.
Ac All soils 4 1.7 × 10³ 3 2.4 × 10³ 2.0 × 10³ 4.5 × 10² 5.4 × 10³ 1a
Sand 1 - - 4.5 × 10² - - - 1
Loam 1 - - 1.5 × 10³ - - - 1
Clay 1 - - 2.4 × 10³ - - - 1
Organic 1 - - 5.4 × 10³ - - - 1
Ag All soils 9 3.8 × 10² 7 2.3 × 10³ 5.0 × 10³ 3.6 × 101 1.5 × 10⁴ 5
Sand 3 1.3 × 10² 5 2.7 × 10² 3.7 × 10² 3.6 × 101 7.0 × 10² 3
Loam 1 - - 1.2 × 10² - - - 1a
Clay 1 - - 1.8 × 10² - - - 1a
Organic 2 - - 9.7 × 10³ - 4.4 × 10³ 1.5 × 10⁴ 2
Unspecified 2 - - 2.6 × 10² - 1.2 × 10² 4.0 × 10² 2
Am All soils 62 2.6 × 10³ 6 1.0 × 10⁴ 1.8 × 10⁴ 5.0 × 101 1.1 × 10⁵ 6
Sand 17 1.0 × 10³ 7 5.1 × 10³ 1.0 × 10⁴ 6.7 × 101 3.7 × 10⁴ 4
Loam 31 4.2 × 10³ 6 1.2 × 10⁴ 1.6 × 10⁴ 5.0 × 101 4.8 × 10⁴ 5
Clay 1 - - 8.1 × 10³ - - - 1a
Organic 13 2.5 × 10³ 5 1.1 × 10⁴ 3.0 × 10⁴ 2.1 × 10² 1.1 × 10⁵ 4
As All soils 7 5.5 × 10² 5 1.2 × 10³ 1.2 × 10³ 2.5 × 101 3.0 × 10³ 3
Sand 4 2.1 × 10² 5 4.7 × 10² 6.0 × 10² 2.5 × 101 1.4 × 10³ 2
Loam 1 - - 1.0 × 10³ - - - 1
Unspecified 2 - - 2.8 × 10³ - 2.5 × 10³ 3.0 × 10³ 2
Ba Loam 1 - - 4.0 × 10⁻¹ - - - 1
Be All soils 5 9.9 × 10² 2 1.3 × 10³ 1.0 × 10³ 2.4 × 10² 3.0 × 10³ 2
Sand 1 - - 2.4 × 10² - - - 1a
Loam 1 - - 8.1 × 10² - - - 1a
Clay 1 - - 1.3 × 10³ - - - 1a
Organic 1 - - 3.0 × 10³ - - - 1a
Unspecified 1 - - 1.3 × 10³ - - - 1
Bi All soils 6 4.8 × 10² 2 6.1 × 10² 4.7 × 10² 1.2 × 10² 1.5 × 10³ 2
Sand 2 - - 3.0 × 10² - 1.2 × 10² 4.9 × 10² 2a,b
Loam 1 - - 4.0 × 10² - - - 1a
Clay 1 - - 6.7 × 10² - - - 1a
Organic 1 - - 1.5 × 10³ - - - 1
a
Unspecified 1 - - 4.9 × 10² - - - 1b
Br All soils 4 5.5 × 101 3 8.0 × 101 7.0 × 101 1.5 × 101 1.8 × 10² 1a

86
Sand 1 - - 1.5 × 101 - - - 1
Loam 1 - - 4.9 × 101 - - - 1
Clay 1 - - 7.4 × 101 - - - 1
Organic 1 - - 1.8 × 10² - - - 1
Ca All soils 34 8.0 3 1.7 × 101 4.0 × 101 7.0 ×10⁻¹ 1.1 × 10² 2
Sand 7 3.0 4 6.6 1.0 × 101 7.0 ×10⁻¹ 2.8 × 101 2
Loam 21 8.3 3 1.4 × 101 2.0 × 101 2.0 8.9 × 101 2
Clay 5 1.6 × 101 3 2.3 × 101 2.0 × 101 6.0 4.9 × 101 2
Organic 1 - - 1.1 × 10² - - - 1
Ce All soils 11 1.2 × 10³ 5 3.7 × 10³ 5.9 × 10³ 1.2 × 10² 2.0 × 10⁴ 5
Sand 3 4.0 × 10² 1 4.0 × 10² 9.0 × 101 3.2 × 10² 4.9 × 10² 3
Loam 4 3.0 × 10³ 3 4.1 × 10³ 3.1 × 10³ 6.5 × 10² 8.1 × 10³ 4
Clay 3 9.1 × 10² 1.5×101 6.8 × 10³ 1.1 × 10⁴ 1.2 × 10² 2.0 × 10⁴ 2
Organic 1 - - 3.0 × 10³ - - - 1a
Cl All soils 22 3.0 × 10⁻¹ 3 5.0 × 10⁻¹ 4.0 ×10⁻¹ 4.0 ×10⁻² 1.2 4
Sand 3 5.0 × 10⁻¹ 4 7.0 × 10⁻¹ 5.0 ×10⁻¹ 1.0 ×10⁻¹ 1.1 2
Loam 10 4.0 × 10⁻¹ 3 5.0 × 10⁻¹ 3.0 ×10⁻¹ 4.0 ×10⁻² 9.0 ×10⁻¹ 3
Clay 5 2.0 × 10⁻¹ 3 4.0 × 10⁻¹ 4.0 ×10⁻¹ 6.0 ×10⁻² 9.0 ×10⁻¹ 4
Organic 2 - - 7.0 × 10⁻¹ - 1.0 ×10⁻¹ 1.2 2
Unspecified 2 - - 2.0 × 10⁻¹ - 1.0 ×10⁻¹ 2.0 ×10⁻¹ 1
Cm All soils 18 9.3 × 10³ 4 1.6 × 10⁴ 1.4 × 10⁴ 1.9 × 10² 5.2 × 10⁴ 2
Sand 5 3.4 × 10³ 1.4×101 1.0 × 10⁴ 1.3 × 10⁴ 1.9 × 10² 3.1 × 10⁴ 2
Loam 9 1.9 × 10⁴ 2 2.3 × 10⁴ 1.5 × 10⁴ 6.8 × 10³ 5.2 × 10⁴ 2
Clay 1 - - 5.4 × 10³ - - - 1a
Organic 3 7.4 × 10³ 2 7.9 × 10³ 3.6 × 10³ 5.1 × 10³ 1.2 × 10⁴ 2
Cr All soils 31 4.0 × 101 2.0×101 7.3 × 10² 1.7 × 10³ 1.0 7.9 × 10³ 6
Sand 9 8.4 8 3.5 × 101 4.0 × 101 1.2 1.0 × 10² 4
Loam 9 4.5 × 101 2.3×101 4.2 × 10² 5.7 × 10² 1.0 1.6 × 10³ 3
Clay 5 1.4 × 101 2.0×101 3.1 × 10² 6.7 × 10² 1.0 1.5 × 10³ 2
Organic 6 1.6 × 10² 1.0×101 7.2 × 10² 1.1 × 10³ 8.3 2.9 × 10³ 3
Unspecified 2 - - 6.4 × 10³ - 4.8 × 10³ 7.9 × 10³ 2
Cu All soils 11 5.3 × 10² 3 8.7 × 10² 8.7 × 10² 7.6 × 101 2.7 × 10³ 4
Sand 2 - - 2.3 × 10² - 1.3 × 10² 3.3 × 10² 1
Loam 1 - - 4.8 × 10² - - - 1
Clay 2 - - 2.1 × 10³ - 1.4 × 10³ 2.7 × 10³ 1
Organic 4 3.2 × 10² 3 4.6 × 10² 3.7 × 10² 7.6 × 101 8.8 × 10² 2
Unspecified 2 - - 1.3 × 10³ - 5.0 × 10² 2.1 × 10³ 2
Dy All soils 2 - - 1.5 × 10³ - 8.2 × 10² 2.1 × 10³ 1b
Sand 1 - - 8.2 × 10² - - - 1

87
Unspecified 1 - - 2.1 × 10³ - - - 1
Fe All soils 23 8.8 × 10² 2 1.2 × 10³ 1.1 × 10³ 2.2 × 10² 4.9 × 10³ 2
Sand 4 3.2 × 10² 1 3.3 × 10² 9.0 × 101 2.2 × 10² 4.2 × 10² 2
Loam 12 8.9 × 10² 2 1.1 × 10³ 7.2 × 10² 2.9 × 10² 2.2 × 10³ 2
Clay 4 1.6 × 10³ 1 1.7 × 10³ 5.5 × 10² 1.2 × 10³ 2.2 × 10³ 1
Organic 3 1.4 × 10³ 3 2.2 × 10³ 2.4 × 10³ 5.2 × 10² 4.9 × 10³ 2
Ga All soils 2 - - 3.0 × 10² - 2.8 × 10² 3.1 × 10² 1b
Sand 1 - - 3.1 × 10² - - - 1
Unspecified 1 - - 2.8 × 10² - - - 1
H Sand 1 - - 1.0 × 10⁻¹ - - - 1
Hf All soils 6 2.5 × 10³ 3 3.6 × 10³ 3.0 × 10³ 4.5 × 10² 8.5 × 10³ 2
Sand 2 - - 1.9 × 10³ - 4.5 × 10² 3.3 × 10³ 2a,b
Loam 1 - - 1.5 × 10³ - - - 1a
Clay 1 - - 2.4 × 10³ - - - 1a
Organic 1 - - 5.4 × 10³ - - - 1a
Unspecified 1 - - 8.5 × 10³ - - - 1b
Hg Unspecified 1 - - 6.3 × 10³ - - - 1
Ho All soils 4 9.3 × 10² 3 1.3 × 10³ 1.2 × 10³ 2.4 × 10² 3.0 × 10³ 1a
Sand 1 - - 2.4 × 10² - - - 1
Loam 1 - - 8.1 × 10² - - - 1
Clay 1 - - 1.3 × 10³ - - - 1
Organic 1 - - 3.0 × 10³ - - - 1
In All soils 2 - - 4.8 × 10² - 2.4 × 10² 7.3 × 10² 1b
Sand 1 - - 2.4 × 10² - - - 1
Unspecified 1 - - 7.3 × 10² - - - 1
Ir Unspecified 15 3.0 - - - 1 1.1 × 101 1
K All soils 237 1.3 × 101 4 3.5 × 101 7.0 × 101 7.0 ×10⁻¹ 9.1 × 10² 9
Sand 60 3.4 3 1.4 × 101 4.0 × 101 7.0 ×10⁻¹ 1.8 × 10² 8
Loam 81 2.0 × 101 4 5.0 × 101 1.1 × 10² 1.8 9.1 × 10² 5
Clay 12 4.3 × 101 3 7.7 × 101 9.0 × 101 9.3 2.9 × 10² 2
Organic 76 1.9 × 101 3 3.0 × 101 3.0 × 101 2.5 1.3 × 10² 5
Unspecified 8 1.1 × 101 3 2.9 × 101 6.0 × 101 4.3 1.8 × 10² 2
La Sand 1 - - 5.3 × 10³ - - - 1b
Lu Sand 1 - - 5.1 × 10³ - - - 1b
Mg All soils 30 3.8 3 8.0 1.0 × 101 4.0 ×10⁻¹ 4.5 × 101 1
Sand 6 1.3 4 3.5 6 4.0 ×10⁻¹ 1.6 × 101 1
Loam 20 4.8 3 8.8 1.0 × 101 9.0 ×10⁻¹ 4.5 × 101 1
Clay 4 6.8 3 1.1 × 101 1.0 × 101 2.1 2.9 × 101 1

88
Mn All soils 83 1.2 × 10³ 9 9.8 × 10³ 1.8 × 10⁴ 3.6 × 101 7.9 × 10⁴ 4
Sand 13 9.8 × 10² 1.4×101 1.2 × 10⁴ 2.5 × 10⁴ 4.0 × 101 7.9 × 10⁴ 4
Loam 56 1.1 × 10³ 8 7.7 × 10³ 1.5 × 10⁴ 6.0 × 101 7.7 × 10⁴ 3
Clay 10 4.5 × 10³ 1.3×101 2.2 × 10⁴ 2.4 × 10⁴ 1.4 × 10² 5.7 × 10⁴ 3
Organic 3 1.6 × 10² 4 2.5 × 10² 2.3 × 10² 3.6 × 101 4.9 × 10² 2
Unspecified 1 - - 1.0 × 10⁴ - - - 1
Mo All soils 9 3.8 × 101 3 5.7 × 101 5.0 × 101 7.4 1.3 × 10² 5
Sand 2 - - 4.5 × 101 - 7.4 8.2 × 101 2
Loam 1 - - 1.3 × 10² - - - 1a
Clay 1 - - 9.0 × 101 - - - 1a
Organic 2 - - 2.3 × 101 - 1.8 × 101 2.7 × 101 2
Unspecified 3 3.7 × 101 3 5.3 × 101 5.0 × 101 1.3 × 101 1.1 × 10² 3
Na All soils 30 3.4 3 5.7 6 2.0 × 10⁻¹
2.6 × 101 1
Sand 6 2.2 4 5.2 9 4.0 × 10⁻¹
2.3 × 101 1
Loam 20 4.6 2 6.3 6 3.0 × 10⁻¹
2.6 × 101 1
Clay 4 1.7 6 3.9 5 2.0 × 10⁻¹
1.1 × 101 1
Nb All soils 11 1.5 × 10³ 4 2.9 × 10³ 2.7 × 10³ 1.6 × 10² 8.4 × 10³ 3
Sand 2 - - 1.7 × 10² - 1.6 × 10² 1.9 × 10² 2
Loam 5 2.5 × 10³ 3 3.6 × 10³ 3.0 × 10³ 5.4 × 10² 8.4 × 10³ 2
Clay 3 2.4 × 10³ 2 3.0 × 10³ 1.9 × 10³ 9.0 × 10² 4.7 × 10³ 2
Organic 1 - - 2.0 × 10³ - - - 1a
Np All soils 26 3.6 × 101 6 1.6 × 10² 3.2 × 10² 1.3 1.2 × 10³ 3
Sand 8 1.4 × 101 4 2.9 × 101 4.0 × 101 3.0 1.1 × 10² 3
Loam 12 2.3 × 101 4 4.2 × 101 4.0 × 101 1.3 1.2 × 10² 3
Clay 2 - - 3.8 × 101 - 2.0 × 101 5.5 × 101 2
Organic 4 8.1 × 10² 1 8.5 × 10² 2.9 × 10² 5.0 × 10² 1.2 × 10³ 3
P All soils 6 8.7 × 101 5 2.2 × 10² 3.0 × 10² 9.0 7.6 × 10² 2
Sand 2 - - 3.9 × 10² - 9.0 7.6 × 10² 2
Loam 2 - - 2.0 × 10² - 3.0 × 101 3.8 × 10² 2
Clay 1 - - 4.9 × 101 - - - 1a
Organic 1 - - 1.1 × 10² - - - 1a
Pa All soils 4 2.0 × 10³ 3 2.9 × 10³ 2.6 × 10³ 5.4 × 10² 6.6 × 10³ 1a
Sand 1 - - 5.4 × 10² - - - 1
Loam 1 - - 1.8 × 10³ - - - 1
Clay 1 - - 2.7 × 10³ - - - 1
Organic 1 - - 6.6 × 10³ - - - 1
Pb All soils 23 2.0 × 10³ 1.0×101 1.5 × 10⁴ 3.3 × 10⁴ 2.5 × 101 1.3 × 10⁵ 5
Sand 9 2.2 × 10² 4 4.0 × 10² 4.3 × 10² 2.5 × 101 1.3 × 10³ 2
Loam 5 1.0 × 10⁴ 3 1.5 × 10⁴ 1.6 × 10⁴ 3.6 × 10³ 4.3 × 10⁴ 2
Clay 2 - - 6.6 × 10⁴ - 5.4 × 10³ 1.3 × 10⁵ 2
Organic 5 2.5 × 10³ 3 3.7 × 10³ 3.8 × 10³ 8.8 × 10² 1.0 × 10⁴ 2

89
Unspecified 2 - - 5.9 × 10⁴ - 1.6 × 10⁴ 1.0 × 10⁵ 2
Pd All soils 6 1.8 × 10² 2 2.4 × 10² 2.2 × 10² 5.5 × 101 6.7 × 10² 2
Sand 2 - - 9.0 × 101 - 5.5 × 101 1.3 × 10² 2a,b
Loam 1 - - 1.8 × 10² - - - 1a
Clay 1 - - 2.7 × 10² - - - 1a
Organic 1 - - 6.7 × 10² - - - 1a
Unspecified 1 - - 1.7 × 10² - - - 1b
Pm All soils 2 - - 4.5 × 10² - 4.5 × 10² 4.5 × 10² 1b
Sand 1 - - 4.5 × 10² - - - 1
Unspecified 1 - - 4.5 × 10² - - - 1
Po All soils 44 2.1 × 10² 5 5.6 × 10² 1.1 × 10³ 1.2 × 101 7.0 × 10³ 2
Sand 14 1.0 × 10² 6 7.4 × 10² 1.9 × 10³ 1.7 × 101 7.0 × 10³ 1
Loam 27 2.3 × 10² 4 4.6 × 10² 4.6 × 10² 1.2 × 101 1.8 × 10³ 2
Clay 2 - - 1.7 × 10³ - 7.2 × 10² 2.7 × 10³ 2
Organic 1 - - 6.6 × 10³ - - - 1a
Pt Unspecified 15 2.4 × 101 - - - 1.2 × 101 8.3 × 101 1
Pu All soils 62 7.4 × 10² 4 1.6 × 10³ 2.0 × 10³ 3.2 × 101 9.6 × 10³ 7
Sand 11 4.0 × 10² 4 1.0 × 10³ 2.0 × 10³ 3.3 × 101 6.9 × 10³ 5
Loam 27 9.5 × 10² 4 1.9 × 10³ 2.3 × 10³ 1.0 × 10² 9.6 × 10³ 4
Clay 10 1.8 × 10³ 2 2.5 × 10³ 2.2 × 10³ 4.3 × 10² 7.6 × 10³ 4
Organic 6 7.6 × 10² 4 1.3 × 10³ 1.1 × 10³ 9.0 × 101 3.0 × 10³ 4
Unspecified 8 2.3 × 10² 5 6.1 × 10² 8.5 × 10² 3.2 × 101 2.1 × 10³ 2
Ra All soils 51 2.5 × 10³ 1.3×101 3.4 × 10⁴ 1.3 × 10⁵ 1.2 × 101 9.5 × 10⁵ 8
Sand 20 3.1 × 10³ 8 9.6 × 10³ 1.2 × 10⁴ 4.9 × 101 4.0 × 10⁴ 4
Loam 19 1.1 × 10³ 1.7×101 1.5 × 10⁴ 3.2 × 10⁴ 1.2 × 101 1.2 × 10⁵ 5
Clay 6 3.8 × 10⁴ 1.2×101 2.0 × 10⁵ 3.7 × 10⁴ 7.0 × 10² 9.5 × 10⁵ 3
Organic 2 - - 1.3 × 10³ - 2.0 × 10² 2.4 × 10³ 2
Unspecified 4 1.2 × 10³ 1 1.3 × 10³ 5.0 × 10² 7.8 × 10² 1.9 × 10³ 1
Rb All soils 4 2.1 × 10² 3 2.9 × 10² 2.7 × 10² 5.5 × 101 6.7 × 10² 1a
Sand 1 - - 5.5 × 101 - - - 1
Loam 1 - - 1.8 × 10² - - - 1
Clay 1 - - 2.7 × 10² - - - 1
Organic 1 - - 6.7 × 10² - - - 1
Rh Unspecified 12 4.0 - - - 6.0 × 10⁻¹
2.9 × 101 1
Ru All soils 15 2.7 × 10² 8 4.7 × 10³ 1.7 × 10⁴ 5.0 6.6 × 10⁴ 5
Sand 3 3.6 × 101 6 7.7 × 101 9.0 × 101 5.0 1.7 × 10² 3
Loam 3 3.0 × 10² 3 4.7 × 10² 4.7 × 10² 8.2 × 101 9.9 × 10² 3
Clay 4 5.0 × 10² 2 6.0 × 10² 3.6 × 10² 2.0 × 10² 9.9 × 10² 3
Organic 1 - - 6.6 × 10⁴ - - - 1a
Unspecified 4 1.4 × 10² 3 2.3 × 10² 2.1 × 10² 3.4 × 101 4.9 × 10² 2
Sb All soils 152 6.2 × 101 4 1.3 × 10² 2.0 × 10² 6.0 × 10⁻¹
2.1 × 10³ 5

90
Sand 19 1.7 × 101 6 6.4 × 101 1.2 × 10² 6.0 × 10⁻¹
4.7 × 10² 4
Loam 92 6.1 × 101 3 1.2 × 10² 2.3 × 10² 4.0 2.1 × 10³ 2
Clay 18 1.4 × 10² 2 2.0 × 10² 1.7 × 10² 3.8 × 101 6.1 × 10² 2
Organic 3 7.5 × 101 8 2.2 × 10² 2.8 × 10² 7.8 5.4 × 10² 2
Unspecified 20 9.9 × 101 4 1.7 × 10² 1.6 × 10² 4.0 6.1 × 10² 2
Sc All soils 2 - - 2.1 × 10³ - 6.7 × 10² 3.5 × 10³ 1b
Sand 1 - - 6.7 × 10² - - - 1
Unspecified 1 - - 3.5 × 10³ - - - 1
Se All soils 172 2.0 × 10² 3 3.6 × 10² 3.7 × 10² 4.0 2.1 × 10³ 10
Sand 15 5.6 × 101 5 2.2 × 10² 4.6 × 10² 4.0 1.6 × 10³ 6
Loam 101 2.2 × 10² 3 3.7 × 10² 3.5 × 10² 1.2 × 101 1.6 × 10³ 4
Clay 33 2.4 × 10² 3 3.7 × 10² 4.0 × 10² 2.2 × 101 2.1 × 10³ 6
Organic 2 - - 1.0 × 10³ - 2.3 × 10² 1.8 × 10³ 2
Unspecified 21 2.3 × 10² 2 3.0 × 10² 1.9 × 10² 2.0 × 101 6.2 × 10² 3
Si All soils 4 1.3 × 10² 3 1.8 × 10² 1.6 × 10² 3.3 × 101 4.0 × 10² 1a
Sand 1 - - 3.3 × 101 - - - 1
Loam 1 - - 1.1 × 10² - - - 1
Clay 1 - - 1.8 × 10² - - - 1
Organic 1 - - 4.0 × 10² - - - 1
Sm All soils 4 9.3 × 10² 3 1.3 × 10³ 1.2 × 10³ 2.4 × 10² 3.0 × 10³ 1a
Sand 1 - - 2.4 × 10² - - - 1
Loam 1 - - 8.1 × 10² - - - 1
Clay 1 - - 1.3 × 10³ - - - 1
Organic 1 - - 3.0 × 10³ - - - 1
Sn All soils 12 1.6 × 10³ 6 5.7 × 10³ 9.1 × 10³ 1.3 × 10² 3.1 × 10⁴ 4
Sand 2 - - 1.5 × 10² - 1.3 × 10² 1.7 × 10² 2a,b
Loam 1 - - 4.5 × 10² - - - 1a
Clay 1 - - 6.7 × 10² - - - 1a
Organic 1 - - 1.6 × 10³ - - - 1a
Unspecified 7 4.1 × 10³ 5 9.4 × 10³ 1.1 × 10⁴ 3.3 × 10² 3.1 × 10⁴ 3
Ta All soils 5 7.8 × 10² 3 1.1 × 10³ 1.1 × 10³ 2.4 × 10² 3.0 × 10³ 2
Sand 2 - - 3.1 × 10² - 2.4 × 10² 3.8 × 10² 2a,b
Loam 1 - - 8.1 × 10² - - - 1a
Clay 1 - - 1.3 × 10³ - - - 1a
Organic 1 - - 3.0 × 10³ - - - 1a
Tb All soils 2 - - 6.0 × 10³ - 5.4 × 10³ 6.6 × 10³ 1b
Sand 1 - - 5.4 × 10³ - - - 1
Unspecified 1 - - 6.6 × 10³ - - - 1
Tc All soils 33 2.3 × 10⁻¹ 9 2 5 1.0 × 10⁻²
1.1 × 101 4
Sand 5 4.0 × 10⁻² 3 5.0 × 10⁻² 5.0 ×10⁻² 1.0 × 10⁻²
1.0 ×10⁻¹ 2

91
Loam 14 7.0 × 10⁻² 3 2.0 × 10⁻¹ 2.0 ×10⁻¹ 1.0 × 10⁻²
9.0 ×10⁻¹ 4
Clay 3 9.0 × 10⁻² 1.0×101 4.0 × 10⁻¹ 7.0 ×10⁻¹ 2.0 × 10⁻²
1.2 2
Organic 11 3.1 3 6 7 9.2 × 10⁻¹
1.1 × 101 2
Te All soils 2 - - 4.9 × 10² - 1.8 × 10² 7.9 × 10² 1b
Sand 1 - - 1.8 × 10² - - - 1
Unspecified 1 - - 7.9 × 10² - - - 1
Th All soils 46 1.9 × 10³ 1.0×101 1.6 × 10⁴ 4.2 × 10⁴ 1.8 × 101 2.5 × 10⁵ 8
Sand 12 7.0 × 10² 1.1×101 1.0 × 10⁴ 2.8 × 10⁴ 3.5 × 101 1.0 × 10⁵ 3
Loam 6 1.8 × 10⁴ 4 5.3 × 10⁴ 9.7 × 10⁴ 5.0 × 10³ 2.5 × 10⁵ 2
Clay 7 4.5 × 10³ 3 7.4 × 10³ 8.0 × 10³ 8.0 × 10² 2.4 × 10⁴ 2
Organic 5 7.3 × 10² 4.4×101 1.9 × 10⁴ 3.5 × 10⁴ 1.8 × 101 8.0 × 10⁴ 3
Unspecified 16 1.5 × 10³ 5 8.9 × 10³ 2.5 × 10⁴ 2.1 × 10² 1.0 × 10⁵ 3
Tm Sand 1 - - 3.3 × 10² - - - 1b
V All soils 2 - - 3.0 × 10² - 1.8 × 10² 4.1 × 10² 1b
Sand 1 - - 1.8 × 10² - - - 1
Unspecified 1 - - 4.1 × 10² - - - 1
Y All soils 7 4.7 × 101 4 6.5 × 101 1.0 × 10² 1.0 × 101 3.8 × 10² 1
Sand 5 2.2 × 101 2 2.6 × 101 2.0 × 101 1.0 × 101 4.7 × 101 1
Organic 2 - - 3.2 × 10² - 2.6 × 10² 3.8 × 10² 1
Zr All soils 11 4.1 × 10² 2.1×101 3.0 × 10³ 3.8 × 10³ 1.5 1.0 × 10⁴ 4
Sand 4 3.2 × 101 1.6×101 2.0 × 10² 2.8 × 10² 1.5 6.0 × 10² 3
Loam 2 - - 5.2 × 10³ - 2.2 × 10³ 8.1 × 10³ 2
Clay 2 - - 6.8 × 10³ - 3.3 × 10³ 1.0 × 10⁴ 2
Organic 2 - - 3.7 × 10³ - 2.3 × 101 7.3 × 10³ 2
Unspecified 1 - - 4.8 × 10² - - - 1b
a Kd values originate from the Technical Reports Series No. 364 [32]. b Kd values originate from experiments using neutron activation analyses [37].
2.1. A kinetic approach to examining sorption dynamics
The form of radionuclides when they are first deposited on the soil is initially governed by
their chemical form in the contamination source (e.g. fuel particles; water soluble fallout).
Regarding soluble contamination sources, water soluble forms of radionuclides are sorbed
onto soil particles and undergo a number of reactions in the solid soil phase. The processes
underlying transformation between chemical forms of radionuclides in the soil and soil
solution can be summarized as shown in Fig. 4 [38-39]. The transformation between chemical
forms would eventually lead to changes (mostly, increases) in the Kd values, as a result of the
transfer of the radionuclide to sites where it is no longer available to exchange with the
radionuclide in solution, thus decreasing the reversibly sorbed radionuclide fraction. This
process is often described as aging in the literature.
Kinetics studies have examined the changes in Kd value with time. Various models have been
proposed to fit the experimental data. Although for several radionuclides their soluble
complexes must be taken into account (RN2), in most cases to postulate that the radionuclide
occurs in the soil solution as a free cation is an adequate approach.

92
A three-box model is often used to describe the kinetics of radionuclide sorption [13, 38, 40].
This model assumes that the radionuclide in the soil solution may be sorbed either at a labile
pool of sites (RN3), thus defining an exchangeable Kd, or sorbed at non-exchangeable sites
(RN4). This process is estimated through its corresponding rate constants (see k14 and k41 in
the Fig. 4), which describes a pseudo-first order reaction, assuming that forward and
backward reactions are independent of the capacity of sorption sites and composition of the
soil solution. Other models postulate that additional types of transformation should be
considered. For instance, it has been suggested that the radionuclide reaches the non-labile
pool after being sorbed in the labile pool [39]. Therefore, the corresponding rate constants
(see k43 and k43 in the Fig. 4) must be quantified.
2.1.1. The case of radiostrontium
In most soil types, radiostrontium does not undergo complexation reactions in soil solution, in
contrast to the transition elements. Moreover, the fixation process is almost negligible for this
radionuclide [38], although slight decreases in the reversible sorbed fraction have been seen in
the short-term after contamination [13, 41]. Besides the ion exchange mechanisms that control
radiostrontium sorption in soils, other specific interactions (e.g. isomorphic substitutions in
Ca-bearing minerals; formation of insoluble inorganic and organic compounds) have been
postulated to explain radiostrontium aging processes. In any case, the rate constant k41 can be
hypothesized to be much larger than k14, resulting in a major part of radiostrontium being in
an exchangeable form. Representative values for these rate constants in loam soils are k14 =
0.01 – 0.03 d-1
and k41 = 0.13 – 0.14 d-1
[42].
RN1: Cationic form of a radionuclide in soil solution
RN2: Radionuclide soluble complex compounds in the soil solution
RN3: Radionuclide cation sorbed by ion-exchange process (labile pool)
RN4: Non-exchangeable (strongly-bonded) form of a radionuclide (non-labile pool)
RNp: Radionuclide in solid particles (fuel particles) as a source-term
Kd: Exchangeable (labile) distribution coefficient
kij: Rate constant for a given (kinetically controlled) transformation process
RN1
RN2
RN3
RN4
Kd
k12
k21
k41
k14
k43k34
RNp
kp1
RN1
RN2
RN3
RN4
Kd
k12
k21
k41
k14
k43k34
RNp
kp1
FIG. 4. Kinetic steps of radionuclide sorption in the soil solution-soil system.
2.1.2. The case of radiocaesium
As with radiostrontium, radiocaesium does not undergo complexation reactions in solution.
For radiocaesium, the three-box kinetic model is the most usually applied approach to
describe the kinetics of its sorption [13, 38, 40]. However, for this radionuclide it has been
shown that after an initial rapid sorption at the most outer FES and on the organic and planar
surface sites of the soil particles, there is a second kinetic step in which a moderately fast
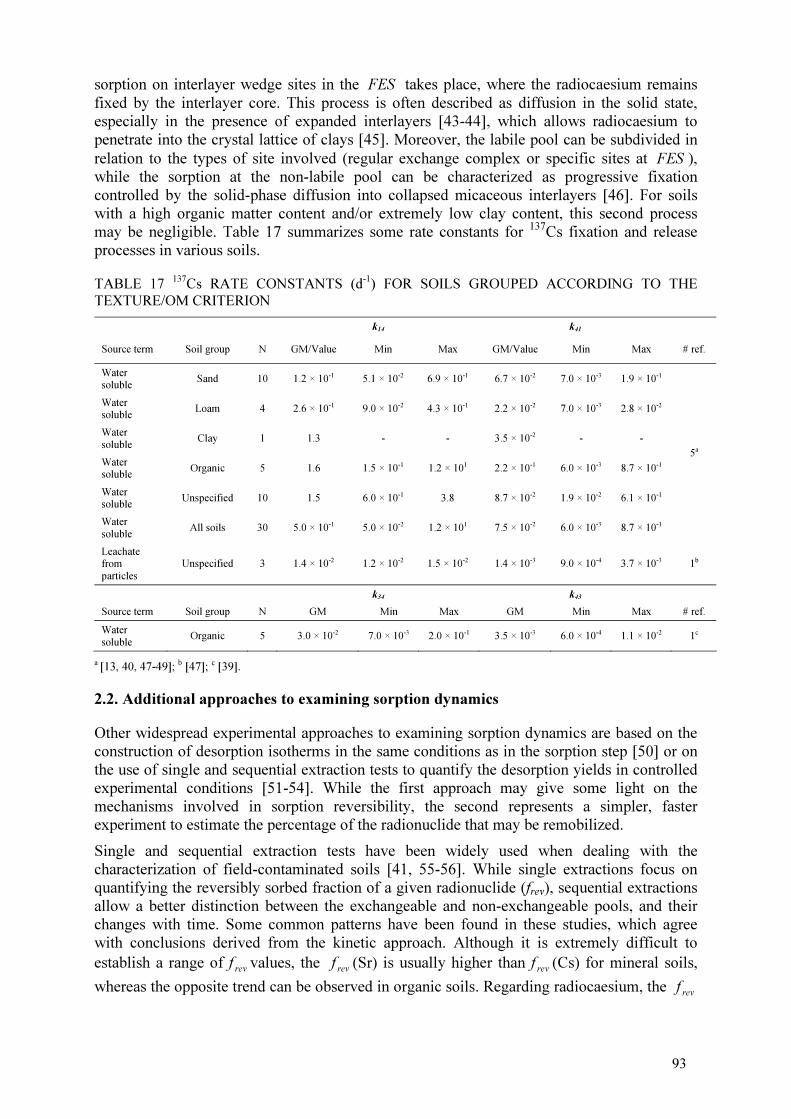
93
sorption on interlayer wedge sites in the FES takes place, where the radiocaesium remains
fixed by the interlayer core. This process is often described as diffusion in the solid state,
especially in the presence of expanded interlayers [43-44], which allows radiocaesium to
penetrate into the crystal lattice of clays [45]. Moreover, the labile pool can be subdivided in
relation to the types of site involved (regular exchange complex or specific sites at FES ),
while the sorption at the non-labile pool can be characterized as progressive fixation
controlled by the solid-phase diffusion into collapsed micaceous interlayers [46]. For soils
with a high organic matter content and/or extremely low clay content, this second process
may be negligible. Table 17 summarizes some rate constants for 137
Cs fixation and release
processes in various soils.
TABLE 17 137Cs RATE CONSTANTS (d-1) FOR SOILS GROUPED ACCORDING TO THE TEXTURE/OM CRITERION
k14 k41
Source term Soil group N GM/Value Min Max GM/Value Min Max # ref.
Water soluble
Sand 10 1.2 × 10⁻¹ 5.1 × 10⁻² 6.9 × 10⁻¹ 6.7 × 10⁻² 7.0 × 10⁻³ 1.9 × 10⁻¹
Water soluble
Loam 4 2.6 × 10⁻¹ 9.0 × 10⁻² 4.3 × 10⁻¹ 2.2 × 10⁻² 7.0 × 10⁻³ 2.8 × 10⁻²
Water
soluble Clay 1 1.3 - - 3.5 × 10⁻² - -
Water soluble
Organic 5 1.6 1.5 × 10⁻¹ 1.2 × 101 2.2 × 10⁻¹ 6.0 × 10⁻³ 8.7 × 10⁻¹
Water soluble
Unspecified 10 1.5 6.0 × 10⁻¹ 3.8 8.7 × 10⁻² 1.9 × 10⁻² 6.1 × 10⁻¹
Water
soluble All soils 30 5.0 × 10⁻¹ 5.0 × 10⁻² 1.2 × 101 7.5 × 10⁻² 6.0 × 10⁻³ 8.7 × 10⁻¹
5a
Leachate from
particles
Unspecified 3 1.4 × 10⁻² 1.2 × 10⁻² 1.5 × 10⁻² 1.4 × 10⁻³ 9.0 × 10⁻⁴ 3.7 × 10⁻³ 1b
k34 k43
Source term Soil group N GM Min Max GM Min Max # ref.
Water
soluble Organic 5 3.0 × 10⁻²
7.0 × 10⁻³ 2.0 × 10⁻¹ 3.5 × 10⁻³ 6.0 × 10⁻⁴ 1.1 × 10⁻² 1c
a [13, 40, 47-49];
b [47];
c [39].
2.2. Additional approaches to examining sorption dynamics
Other widespread experimental approaches to examining sorption dynamics are based on the
construction of desorption isotherms in the same conditions as in the sorption step [50] or on
the use of single and sequential extraction tests to quantify the desorption yields in controlled
experimental conditions [51-54]. While the first approach may give some light on the
mechanisms involved in sorption reversibility, the second represents a simpler, faster
experiment to estimate the percentage of the radionuclide that may be remobilized.
Single and sequential extraction tests have been widely used when dealing with the
characterization of field-contaminated soils [41, 55-56]. While single extractions focus on
quantifying the reversibly sorbed fraction of a given radionuclide (frev), sequential extractions
allow a better distinction between the exchangeable and non-exchangeable pools, and their
changes with time. Some common patterns have been found in these studies, which agree
with conclusions derived from the kinetic approach. Although it is extremely difficult to
establish a range ofrevf values, the
revf (Sr) is usually higher than
revf (Cs) for mineral soils,
whereas the opposite trend can be observed in organic soils. Regarding radiocaesium, the revf

94
(Cs) in mineral soils usually decreases with the texture sequence sand > loam > clay soils. For
actinides, therevf values reported are much smaller than for radiostrontium and radiocaesium.
Although to date a successful approach to predicting desorption yields from sorption data has
not been developed, the quantification of revf through the use of harmonized laboratory tests
has improved radionuclide mobility predictions based solely on radionuclide distribution
coefficients.
3. CONCLUSIONS
A significant amount of data has been added to the new Kd database, comparing with the
former Technical Reports Series No. 364. However, there are still evident gaps of values of
Kd for a substantial number of radionuclides and soil types. In some cases, values originate
from a single reference. This fact restricts the possibility of proposing best estimates in many
cases, and GM and single values must be considered only as approximate estimates, suitable
for screening purposes, but not for specific risk assessments. For these gaps, the use of
analogues (data on other elements or media, such as pure soil phases or sediments) is an
option, but must be undertaken with care, with due consideration for the distinctions in
chemical form and affinity for different types of binding site that may exist between the
analogue and the radionuclide of interest.
The large number of experimental approaches used to quantify Kd values is partly responsible
for the wide ranges of values that can be found for a given radionuclide-soil type
combination. Values derived from mass transport experiments seem to lead to Kd values one-
two orders of magnitude lower than those derived from batch experiments. Regarding this
latter approach, the ionic composition of the contact solution may affect the Kd value by up to
some orders of magnitude.
Finally, it is recommended not to use stable isotopes (at larger concentrations than
radioisotopes), to quantify the Kd values of the corresponding radionuclide, since the derived
values will often be significantly lower.
The Kd values derived from field-contaminated soils are usually higher than those resulting
from a laboratory sorption tests, because the radionuclide quantified in the solid phase of the
contaminated soil may include sorbed radionuclide not available for exchange with the soil
solution due to a larger time elapsed since radionuclide incorporation, in comparison with
laboratory experiments.
There is a need to have information on the reversibility of sorption and how it may change
with time. The dynamics of the soil-radionuclide interaction is significant for a limited
number of radionuclides, as in the cases of radiostrontium and radiocaesium. For
radionuclides with very low or very high sorption, this may be a consideration of minor
significance.
Soil-radionuclide interactions are governed by multiple factors that depend on the
radionuclide and on various soil properties. As the quality and quantity of the mineral matter
is one of the key soil properties, the definition of Kd values for soil groups based on soil
texture and organic matter content is a satisfactory approach to establish the estimated values
of Kd for a large number of radionuclides. However, it is recommended that consideration and
use be made, as much as possible, of additional soil and radionuclide properties (cofactors)

95
that govern soil-radionuclide interactions, for better prediction of Kd values and to decrease
the variability in estimates of those values.
The main soil parameters controlling the interaction should be measured and monitored to
improve the prediction of Kd, and they should also be included in models predicting the
radionuclide transport in the environment. Clear examples are RIP and K and NH4+ status for
radiocaesium, CEC and Ca and Mg concentrations for radiostrontium, and pH for heavy metal
radionuclides and uranium. Therefore, modellers can choose to use the best estimates derived
from the GM values of Kd for soils arranged according to texture and organic matter or, when
available, according to other criteria such as specific properties, pH and speciation. Moreover,
modellers and end-users can also consider using existing single and multiple correlations
between soil properties and Kd to calculate best estimates from soil properties, especially in
those cases where the mechanisms governing radionuclide interactions are well known.
REFERENCES
[1] GOODY, D.C., SHAND, P., KINNIBURGH, D.G., VAN RIEMSDIJK, W.H., Field-based partition coefficients for trace elements in soil solutions, European Journal of Soil Science 46 (1995) 265.
[2] ORGANISATION FOR ECONOMIC COOPERATION AND DEVELOPMENT, Guideline for the testing of chemicals: Adsorption-desorption using a batch equilibrium method, Guideline 106 (2000).
[3] AMERICAN SOCIETY FOR TESTING AND MATERIALS, Standard test method for distribution ratios by the short-term batch method, ASTM D 4319-93, West Conshohocken, PA, US (2001).
[4] STAUNTON, S., Sensitivity of the distribution coefficient, d
K , of nickel to changing soil
chemical properties, Geoderma 122 (2004) 281. [5] GIL-GARCÍA, C.J., RIGOL, A., RAURET, G., VIDAL, M., Radionuclide sorption-desorption
pattern in soils from Spain, Applied Radiation and Isotopes (2007), doi:10.1016/j.apradiso.2007.07.032.
[6] GARCÍA-GUTIÉRREZ, M., CORMENZARA, J. L., MISSANA, T., MINGARRO, M., Diffusion coefficient and accessible porosity for HTO and 36Cl- in compacted FEBEX bentonite, Applied Clay Science 26 (2004) 65.
[7] OCHS, M., BOONEKAMP, M., WANNER, H., SATO, H., YUI, M., A quantitative model for ion diffusion in compacted bentonite, Radiochimica Acta 82 (1998) 437.
[8] OCHS, M., LOTHENBACH, B., WANNER, H., SATO, H., YUI, M., An integrated sorption-diffusion model for the calculation of consistent distribution and diffusion coefficients in compacted bentonite, Journal of Contaminant Hydrology 47 (2001) 283.
[9] OKAMOTO, A., IDEMITSU, K., FURUYA, H., INAGAKI, Y., ARIMA, T., Distribution coefficients and apparent diffusion coefficients of caesium in compacted bentonites, Mater. Res. Soc. Symp. Proc. 556 (1999) 1091.
[10] FERNANDEZ-TORRENT, R., VIDAL, M., RAURET, G., RIGOL, A., Laboratory experiments to characterize radionuclide diffusion in soils, paper presented at 2nd International Conference on Radioactivity in the Environment, Aix-en-Provence, France (2005).
[11] RAURET, G., FIRSAKOVA, S., The transfer of radionuclides through the terrestrial environment to agricultural products, including the evaluation of agrochemical practices, EUR 16528 EN, European Commission, Luxembourg (1996).
[12] HILTON, J., COMANS, R. N. J., Chemical forms of radionuclides and their quantification in environmental samples”, Radioecology, Radioactivity and Ecosystems (VAN DER STRICHT, E., KIRCHMANN, R. Eds.), Fortemps, Liège (2001) 99-111.
[13] VALCKE, E., The behaviour dynamics of radioCaesium and radiostrontium in soils rich in organic matter, PhD Thesis, Katholieke Universiteit Leuven (1993).
[14] YASUDA, H., UCHIDA, S., Statistical approach for the estimation of strontium distribution coefficient, Environmental Science and Technology 27 (1993) 2462.

96
[15] WAUTERS, J., ELSEN, A., CREMERS, A., KONOPLEV, A., BULGAKOV, A. A., COMANS, R. N. J., Prediction of solid liquid distribution coefficients of radiocaesium in soils and sediments. Part one: A simplified procedure for the solid phase characterization, Applied Geochemistry 11 (1996) 589.
[16] SWEECK, L., WAUTERS., J., VALCKE., E., CREMERS., A. The specific interception potential of soils for radiocaesium, Transfer of Radionuclides in Natural and Seminatural Environments (DESMET G, NASSIMBENI P, BELLI M. Eds.), EUR 12448, Elsevier Applied Science, London (1990) 249-258.
[17] BROUWER, E., BAEYENS, B., MAES, A., CREMERS, A., Caesium and rubidium ion equilibrium in illite clay, Journal of Physical Chemistry 87 (1983) 1213.
[18] CREMERS, A., ELSEN, A., DE PRETER, P., MAES, A., Quantitative analysis of radiocaesium retention in soils, Nature 335 (1988) 247.
[19] VIDAL, M., ROIG, M., RIGOL, A., LLAURADÓ, M., RAURET, G., WAUTERS, J., ELSEN, A., CREMERS, A., Two approaches to the study of radiocaesium partitioning and mobility in agricultural soils from the Chernobyl area, Analyst 120 (1995) 1785.
[20] RIGOL, A., VIDAL, M., RAURET, G., SHAND, C. A., CHESHIRE, M. V., Competition of organic and mineral phases in radiocaesium partitioning in organic soils of Scotland and the area near Chernobyl, Environmental Science and Technology 32 (1998) 663.
[21] WAUTERS, J., VIDAL, M., ELSEN, A., CREMERS, A., Prediction of solid liquid distribution coefficients of radiocaesium in soils and sediments. Part two: a new procedure for solid phase speciation of radiocaesium, Applied Geochemistry 11 (1996) 595.
[22] WAEGENEERS, N., SMOLDERS, E., MERCKX, R., A statistical approach for estimating the radiocaesium interception potential of soils, Journal of Environmental Quality 28 (1999) 1005.
[23] ALLARD, B., OLOFSSON, U., TORSTENFELT, B., Environmental actinide chemistry, Inorganica Chimica Acta 94 (1984) 205.
[24] LANGMUIR, D., Uranium solution-mineral equilibrium at low temperature with applications to sedimentary ore deposits, Geochimica et Cosmochimica Acta 42 (1978) 547.
[25] ENVIRONMENTAL PROTECTION AGENCY, Understanding Variation in Partitioning Coefficients,
dK , Values: Volume II: Review of Geochemistry and Available
dK Values for
Cadmium, Caesium, Chromium, Lead, Plutonium, Radon, Strontium, Thorium, Tritium and Uranium, US-EPA, Office of Air and Radiation EPA 402-R-99-004B, Washington, USA (1999).
[26] ECHEVARRIA, G., SHEPPARD, M., MOREL, J.L., Effect of pH on the sorption of uranium in soils, Journal of Environmental Radioactivity 53 (2001) 257.
[27] VANDENHOVE, H., VAN HEES, M., WANNIJN. J., Can we predict uranium bioavailability based on soil parameters? Part 1: Effect of soil parameters on soil solution uranium concentration, Environmental Pollution 145 (2007) 587.
[28] SIMON, S. L., IBRAHIM, S. A., Biological uptake of radium by terrestrial plants: a review, The Environmental Behaviour of Radium Vol 1. IAEA, Vienna, (1990) 545-599.
[29] VANDENHOVE, H., VAN HEES, M., Predicting radium availability and uptake from soil properties, Chemosphere (2007) (in press).
[30] YLARANTA, T., Sorption of selenite and selenate in the soil, Annales Agriculturae Fenniae 22 (1983) 30.
[31] YOSHIDA, S., MURAMATSU, Y., UCHIDA, S., Adsorption of I- and IO3
- onto 63 Japanese soils, Radioisotopes 44 (1995) 837.
[32] INTERNATIONAL ATOMIC ENERGY AGENCY, Handbook of Parameter Values for the Prediction of Radionuclide Transfer in Temperate Environments, Technical Report No 364, IAEA, Vienna (1994).
[33] SHEPPARD, M.I., THIBAULT, D.H., Default soil solid/liquid partition coefficients, d
K s, for
four major soil types: a compendium, Health Physics 59 (1990) 471. [34] THIBAULT, D.H., SHEPPARD, M.I., SMITH, P.A., A critical compilation and review of
default soil solid/liquid partition coefficients, d
K , for use in environmental assessments, AECL
10125, Atomic Energy of Canada Limited, Pinawa, Manitoba, Canada (1990).

97
[35] MURAMATSU, Y., UCHIDA, S., SRIYOTHA, P., SRIYOTHA, K., Some considerations on the sorption and desorption phenomena of iodide and iodate on soil, Water, Air and Soil Pollution 49 (1990) 125.
[36] YOSHIDA, S., MURAMATSU, Y., UCHIDA, S., Soil-solution distribution coefficients, d
K ’s,
of I- and IO3
- for 68 Japanese soils, Radiochimica Acta 82 (1998) 293. [37] ZUYI, T., XIANGKE, W., XIONGXIN, D., JINZHOU, D., Adsorption characteristics of 47
elements on a calcareous soil, a red earth and an alumina: a multitracer study, Applied Radiation and Isotopes 52 (2000) 821.
[38] KONOPLEV A.V., VIKTOROVA, N.V., VIRCHENKO, E.P., POPOV, V.E., BULGAKOV, A.A., DESMET, G.M., Influence of agricultural countermeasures on the ratio of different chemical forms of radionuclides in soil and soil solution, Science of the Total Environment 137 (1993) 147.
[39] ABSALOM, J.P., Radiocaesium lability and fixation in upland soils: measurement and modelling, PhD Thesis, Nottingham Univ. (1995).
[40] SWEECK L., Soil-chemical availability of radiocaesium in mineral soils, PhD Thesis, Katholieke Universiteit Leuven (1996).
[41] RIGOL, A., ROIG, M., VIDAL, M., RAURET, G., Sequential extractions for the study of radiocaesium and radiostrontium dynamics in mineral and organic soil from Western Europe and Chernobyl areas, Environmental Science and Technology 33 (1999) 887.
[42] FRERE, M.H., CHAMPION, D.F., Characterisation of fixed strontium in sesquioxide gel – kaolinite clay systems, Soil Science Society of America, Proceedings 31 (1967) 188.
[43] HIRD, A.B., RIMMER, D.L., Total caesium-fixing potentials of acid organic soils, Journal of Environmental Radioactivity 26 (1995) 103.
[44] ABSALOM, J. P., YOUNG S. D., CROUT N. M., Radio-caesium fixation dynamics: measurement in six Cumbrian soils, European Journal of Soil Science 46 (1995) 461.
[45] KONOPLEV, A.V., BULGAKOV, A.A., POPOV, V.E., BOBOVNIKOVA, Ts.I., Behaviour of long-lived Chernobyl radionuclides in a soil-water system, Analyst 117 (1992) 1041.
[46] ABSALOM, J.P., CROUT, N.M. J., YOUNG, S.D., Modelling radiocaesium fixation in upland organic soils of Northwest England, Environmental Science and Technology 30 (1996) 2735.
[47] KONOPLEV, A.V., BULGAKOV, A.A., SHKURATOVA, V., Migration of certain radioactive products in the soil and surface run off in the Chernobyl NPP Zone (in Russian), Meteorologiya i Gidrologiya 6 (1990) 119.
[48] MOISEEV, U.T., TIKHOMIROV, F.A., RERIKH, L.A., CHIZHIKOVA, N.P., Radionuclide speciation in soils and their transformations (in Russian), Agrokhimiya 1 (1981) 110.
[49] SURKOVA, L.V., POGODIN, P.U., Speciation and occurrence of forms of 137Cs in soil of different areas of accidental Chernobyl release (in Russian), Agrokhimiya 4 (1991) 84.
[50] COMANS, R.N.J., HALLER, M., DE PRETER P., Sorption of caesium on illite: non-equilibrium behaviour and reversibility, Geochimica et Cosmochimica Acta 55 (1991) 433.
[51] WAUTERS, J., SWEECK, L., VALCKE, E., ELSEN, A., CREMERS, A., Availability of radiocaesium in soils: A new methodology, Science of the Total Environment 157 (1994) 239.
[52] FAWARIS, B.H., JOHANSON, K.J., Sorption of 137Cs from undisturbed forest soil in a zeolite trap, Science of the Total Environment 172 (1995) 251.
[53] KENNEDY, V.H., SANCHEZ, A.L., OUGHTON, D. H., ROWLAND, A. P., Use of single and sequential chemical extractants to assess radionuclide and heavy metal availability from soils for root uptake, Analyst 122 (1997) 89R.
[54] ROIG, M., VIDAL, M., RAURET, G., Estimating the radionuclide available fraction in mineral soils using an extraction technique, Analyst 123 (1998) 519.
[55] RIISE, G., BJOERNSTAD, H.E., LIEN, H. N., OUGHTON, D.H., SALBU, B., A study on radionuclide association with soil components using a sequential extraction procedure, Journal of Radioanalytical and Nuclear Chemistry 142 (1990) 531.
[56] SANZHAROVA, N.I., FESENKO, S.V., ALEXAKHIN, R.M., ANISIMOV, V.S., KUZNETSOV, V.K, CHERNYAYEVA, L.G., Changes in the forms of 137Cs and its availability for plants as dependent on properties of fallout after the Chernobyl nuclear power plant accident, Science of the Total Environment 154 (1994) 9.

98
APPENDIX
List of publications used for Kd data evaluation
ABSALOM, J.P., Radiocaesium liability and fixation in upland soils: measurement and modelling, PhD Thesis, Nottingham Univ. (1995).
AGAPKINA, G.I., TIKHOMIROV, F.A., SHCHEGLOV, A.I., KRACKE, W., BUNZL, K., Association of Chernobyl derived 239,240Pu, 241Am, 90Sr and 137Cs with organic matter in the soil solution, Journal of Environmental Radioactivity 29 (1995) 257.
ASHWORTH, D.J., SHAW, G., Effects of moisture content and redox potential on in situ Kd values for radioiodine in soil, Science of the Total Environment 359 (2006) 244.
BARNETT, M.O., JARDINE, P.M., BROOKS, S. C., SELIM, H.M., Adsorption and transport of Uranium(VI) in subsurface media, Soil Science Society of America Journal 65 (2000) 908.
BACHHUBER, H., BUNZL, K., SCHIMMACK, W., Spatial variability of the distribution coefficients of 137Cs, 65Zn, 85Sr, 57Co, 109Cs, 141Ce, 103Ru, 95mTc and 131I in a cultivated soil, Nuclear Technology 72 (1985) 359.
BELL, J., BATES, T. H., Distribution coefficients of radionuclides between soils and groundwaters and their dependence on various test parameters, Science of the Total Environment 69 (1988) 297.
BENES, P., STAMBERG, K., STEGMANN, R., Study of the kinetics of the interaction of Cs-137 and Sr-85 with soils using a batch method: methodological problems, Radiochimica Acta 66/67 (1994) 315.
BUNZL, K., SCHIMMACK, W., Kinetics of the sorption of 137Cs, 85Sr, 57Co, 65Zn and 109Cd by the organic horizons of a forest soil, Radiochimica Acta 54 (1991) 97.
CAMPS, M., RIGOL, A., VIDAL, M., RAURET, G., Assessment of the suitability of soil amendments to reduce 137Cs and 90Sr root uptake in meadows, Environmental Science and Technology 37 (2003) 2820.
CAMPS, M., RIGOL, A., HILLIER, S., VIDAL, M., RAURET, G., Quantitative assessment of the effects of agricultural practices designed to reduce 137Cs and 90Sr soil-plant transfer in meadows, Science of the Total Environment 332 (2004) 23.
CHRISTENSEN, T. H., LEHMANN, N., JACKSON, T., HOLM, P. E., Cadmium and nickel distribution coefficients for sandy aquifer minerals, Journal of Contaminant Hydrology 24 (1996) 75.
CHOI, Y. H., LIM, K. M., CHOI, H. J., CHOI, G. S., LEE, H. S., LEE, C. W., Plant uptake and downward migration of 85Sr and 137Cs after their deposition on to flooded rice fields: lysimeter experiments with and without the addition of KCl and lime, Journal of Environmental Radioactivity 78 (2005) 35.
COLLE, C., MAUGER, S., MASSIANI, C., KASHPAROV, A. A., GRASSET, G., Behaviour of chlorine (36Cl) in cultivated terrestrial ecosystems, Radioprotection-Colloques 37 (2002) C18.
CRANÇON, P., VAN DER LEE, J., Speciation and mobility of uranium(VI) in humic-containing soils, Radiochimica Acta 91 (2003) 673.
DE BROUWERE, K., SMOLDERS, E., MERCKX, R., Soil properties affecting solid-liquid distribution of As(V) in soils, European Journal of Soil Science 55 (2004) 165.
DENYS, S., Prédiction de la phytodisponibilité de deux radionucléides (63Ni et 99Tc) dans les sols, PhD Thesis, Sciences Agronomiques, Nancy Univ. (2001).
ECHEVARRIA, G., Contribution à la prévision des transferts sol-plante des radionucléides, PhD Thesis, Sciences Agronomiques, Nancy Univ. (1996).

99
ECHEVARRIA, G., MOREL, J. L., FLORENTIN, L., LECLERC-CESSAC, E., Influence of climatic conditions, soil type and plant physiology on 99TcO4
- uptake by crops, Journal of Environmental Radioactivity 70 (2003) 85.
ECHEVARRIA, G., MOREL, J. L., LECLERC-CESSAC, E., Retention and phytoavailability of 95Nb in soils, Journal of Environmental Radioactivity 78 (2005) 343.
ELEJALDE, C., HERRANZ, M., LEGARDA, F., ROMERO, F., Determination and analysis of distribution coefficients of 137Cs in soils from Biscay (Spain), Environmental Pollution 110 (2000) 157.
FERRAND, E., Étude de la spéciation en solution, de la rétention dans les sòls et du transfert sol-plante du Zr, PhD Thesis, Paris VI Pierre et Marie Curie Univ. (2005).
FEVRIER, L., MARTIN-GARIN, A., LECLERC E., Variation of the distribution coefficient Kd of selenium in soils under various microbial states, Journal of Environmental Radioactivity 97 (2007) 189-205.
FUKUI, M., FUJIKAWA, Y., SATTA, N., Factors affecting interaction of radioiodide and iodate species with soil, Journal of Environmental Radioactivity 31 (1996) 199.
HAKEM, N., MHAMID, I., APPS, J., MORIDIS, G. J., Sorption of caesium and strontium on Hanford soil, Journal of Radioanalytical and Nuclear Chemistry 246 (2000) 275.
HANSEN, W. R., WATTERS, R. L., Unsupported polonium-210 oxide in soil. Soil absorption and characterization of soil solution species, Soil Science 112 (1971) 145.
JINZHOU, D., WENMING, D., XIANGKE, W., ZUYI, T., Sorption and desorption of radiostrontium on calcareous soils and its solid components, Journal of Radioanalytical and Nuclear Chemistry 203 (1996) 31.
JOHN, M.K., SAUNDERS, W.M.H., WATKINSON, J.H., Selenium adsorption by New Zealand soils. I. Relative adsorption of selenite by representative soils and the relation to soil properties, New Zealand Journal of Agricultural Research 19 (1975) 143.
JOHNSON, W. H., SERKIZ, S. M., JOHNSON, L. M., CLARK, S. B. Uranium partitioning under acidic conditions in a sandy soil aquifer, U.S. Department of Energy Report WSRC-MS-94-0528 (1995).
KONOPLEV, A. V., BULGAKOV, A. A., SHKURATOVA, V., Migration of certain radioactive products in the soil and surface run off in the Chernobyl NPP Zone (in Russian), Meteorologiya i Gidrologiya 6 (1990) 119.
KOTOVA A.Y., A study into the mechanisms of 90Sr, 106Ru, 137Cs, and 144Ce sorption and bioavailability in different soil types, PhD thesis, Obninsk Univ. (1998).
KAMEI-ISHIKAWA N., UCHIDA, S., TAGAMI, K., “Sorption behaviour of 137Cs in Japanese agricultural soils”, Proc. International Symposium on Environmental Modeling and Radioecology, Rokkasho, Japan, 2006.
LAKIN, H. W., Selenium accumulation in soils and its absorption by plants and animals, Geological Society of America, Bulletin 83 (1972) 173.
COLLE, C., Transfert de l’iode 129 dans la biosphere – étude bibliographique, IRSN Report for ANDRA, CRPPSTR060007 (2006).
LEGOUX, Y., BLAIN, G., GUILLAUMONT, R., OUZOUNIAN, G., BRILLARD, L., HUSSONNOIS, M., Kd measurements of activation, fission and heavy elements in water/solid phase systems, Radiochimica Acta 58-59 (1992) 211.
MASSOURA, S. T., Fate of 36Cl in the soil-plant system through isotopic exchange processes, ANDRA post-doc report, CRP1INR050001 (2005).
MOISEEV, U.T., TIKHOMIROV, F.A., RERIKH, L.A., CHIZHIKOVA, N.P., Radionuclide speciation in soils and their transformations (in Russian), Agrokhimiya 1 (1981) 110.
100
MU, D.H., DU, J. Z., LI, D.J., SONG, H.Q., YAN, S. P., GU, Y.J., Sorption/desorption of radiozinc on the surface sediments, Journal of Analytical Chemistry 267 (2006) 585.
NAKAMARU, Y., TAGAMI, K., UCHIDA, S., Distribution coefficient of selenium in Japanese agricultural soils, Chemosphere 58 (2005) 1347.
NAKAMARU, Y., TAGAMI, K., UCHIDA, S., Antimony mobility in Japanese agricultural soils and the factors affecting antimony sorption behaviour, Environmental Pollution 141 (2006) 321.
NAKAMARU, Y., UCHIDA, S., Distribution coefficients of tin in Japanese agricultural soils and the factors affecting tin sorption behaviour, submitted to Journal of Environmental Radioactivity
NATHWANI, J.S., PHILLIPS, C.R., Adsorption of radium-226 by soils, Chemosphere 8 (1979) 285.
NATHWANI, J.S., PHILLIPS, C. R., Adsorption of radium-226 by soils in the presence of Ca+2 ions: specific adsorption, Chemosphere 8 (1979) 293.
OHNUKI, T., Sorption characteristics of strontium on sandy soils and their components, Radiochimica Acta 64 (1994) 237.
PAYNE, T.E., HARRIES, J.R., Adsorption of Cs and U(VI) on soils of the Australian arid zone, Radiochimica Acta 88 (2000) 799.
PINEL, F., Chimie de 63Ni et de 137Cs dans le système sol-plante, PhD Thesis, Montpellier Univ. (2002).
PINEL, F., LECLERC-CESSAC, E., STAUNTON, S., Relative contributions of soil chemistry, plant physiology and rhizosphere induced changes in speciation on Ni accumulation in plants shoots, Plant Soil 255 (2003) 619.
RIGOL, A., VIDAL. M., RAURET, G., Effect of the ionic status and drying on radiocesium adsorption and desorption in organic soils, Environmental Science and Technology 33 (1999) 3788.
ROCA, M. C., VALLEJO, V. R., ROIG, M., TENT, J., VIDAL, M., RAURET, G., Prediction of caesium-134 and strontium-85 crop uptake based on soil properties, Journal of Environmental Quality 26 (1997) 1354.
ROUSSEL-DEBET, S., Experimental values for 241Am and 239+240Pu Kd's in French agricultural soils, Journal of Environmental Radioactivity 79 (2005) 171.
SANCHEZ, A. L., WRIGHT, S. M., SMOLDERS, E., NAYLOR, C., STEVENS, P. A., KENNEDY, V. H., DODD, B. A., SINGLETON, D. L., BARNETT, C. L., High plant uptake of radiocesium from organic soils due to Cs mobility and low soil K content, Environmental Science and Technology 33 (1999) 2752.
SANCHEZ, A. L., SMOLDERS, E., VAN DEN BRANDE, K., MERCKX, R., WRIGHT, S. M., NAYLOR, C., Predictions of in situ solid/liquid distribution of radiocaesium in soils, Journal of Environmental Radioactivity 63 (2002) 35.
SASTRE, J., RAURET, G., VIDAL, M., Sorption-desorption tests to assess the risk derived from metal contamination in mineral and organic soils, Environment International 33 (2007) 246.
SAURAS, T., WAEGENEERS, N, TENT, J., VALLEJO, V.R., VIDAL, M., Effect of soil water content on radiouclide availability, submitted to Journal of Environmental Quality
SAUVÉ, S., HENDERSHOT, W., ALLEN H., Solid-solution partitioning of metals in contaminated soils: dependence on pH, total metal burden, and organic matter, Environmental Science and Technology 34 (2000) 1125.
SHANG, Z. R., LEUNG, J. K.C., 110mAg root and foliar uptake in vegetables and its migration in soil, Journal of Environmental Radioactivity 68 (2003) 297.
SHENBER, M. A., ERIKSSON, A., Sorption behaviour of caesium in various soils, Journal of Environmental Radioactivity 19 (1993) 41.

101
SHEPPARD, M. I., SHEPPARD, S. C., A solute transport model evaluated on two experimental systems, Ecological Modelling 37 (1987) 191.
SHEPPARD, S. C., EVEDEN. W. G., The assumption of linearity in soil and plant concentration ratios: an experimental evaluation, Journal of Environmental Radioactivity 7 (1988) 221.
SHEPPARD, S. C., EVEDEN, W., G., POLLOCK., J. R., Uptake of natural radionuclides by field and garden crops, Canadian Journal of Soil Sciences 69 (1989) 751.
SHEPPARD, M. I., THIBAULT, D. H., Migration of technetium, iodine, neptunium and uranium in the peat of two minerotrophic mires, Journal of Environmental Quality 17 (1988) 644.
SHEPPARD, M. I., THIBAULT, D. H., A four-years mobility study of selected trace elements and heavy metals, Journal of Environmental Quality 20 (1991) 101.
SHEPPARD, S.C., SHEPPARD, M.I., ILIN, M., TAIT, J.C., SANIPELLI, B. L., Primordial radionuclides in Canadian background sites: secular equilibrium and isotopic differences, EcoMatters, Canada (2004).
SHEPPARD, S.C., SHEPPARD, M.I., TAIT, J.C., SANIPELLI, B. L., Revision and meta–analysis of selected biosphere parameter values for chlorine, iodine, neptunium, radium, radon and uranium, Journal of Environmental Radioactivity 89 (2006) 115.
SKIPPERUD, L., OUGHTON, D., SALBU, B., The impact of Pu speciation on distribution coefficients in Mayak soil, Science of the Total Environment 257 (2000) 81.
SMOLDERS, E., BRANS, K., FÖLDI, A., MERCKX, R., Cadmium fixation in soils measured by isotopic dilution, Soil Science Society of America Journal 63 (1999) 78.
SOKOLIK, G.A., IVANOVA, T.G., LEINOVA, S.L., OVSIANNIKOVA, S.V., KIMLENKO I.M., Migration ability of radionuclides in soil-vegetation cover of Belarus after Chernobyl accident, Environment International 26 (2001) 183.
STAUNTON, S., BARTHES, M., LECLERC-CESSAC, E., PINEL, E., Effect of sterilization, incubation time, solution composition and soil: solution ratio on the isotopic exchange of nickel in two contrasting soils, European Journal of Soil Science 53 (2002) 655.
SURKOVA, L.V., POGODIN, P.U., Speciation and occurrence of forms of 137Cs in soil of different areas of accidental Chernobyl release (in Russian), Agrokhimiya 4 (1991) 84.
SWEECK L., Soil-chemical availability of radiocesium in mineral soils, PhD Thesis, Katholieke Universiteit Leuven (1996).
SZENKNECT, S., Transfert de radioéléments en zone non saturée. Étude expérimentale et modélisation appliquées au Site Pilote de Tchernobyl, PhD Thesis, Université Joseph Fourier (2003).
TIANWEI, Q., HONGXIAO, T., JIAJUN, C., SHENG, W. J., CHUNLI, L. GUIBIN, W., Simulation of the migration of 85Sr in Chinese loess under artificial rainfall condition, Radiochimica Acta 89 (2001) 403.
TIPPING, E., WOOF, C., KELLY, M., BRADSHAW, K., ROWE, J. E., Solid-solution distributions of radionuclides in acid soils: application of the Wham Chemical speciation model, Environmental Science and Technology 29 (1995) 1365.
TWINING, J. R., PAYNE, T. E., ITAKURA, T., Soil-water distribution coefficients and plant transfer factors for 134Cs, 85Sr and 65Zn under field conditions in tropical Australia, Journal of Environmental Radioactivity 71 (2004) 71.
TYLER, G., OLSSON, T., Conditions related to solubility of rare and minor elements in forest soils, Journal of Plant Nutrition and Soil Science 165 (2002) 594.
VALCKE, E., The behaviour dynamics of radiocesium and radiostrontium in soils rich in organic matter, PhD Thesis, Katholieke Universiteit Leuven (1993).
VANDENHOVE, H., QUARCH, H., CLERC, J.J., LEJEUNE, J.M., SWEECK, L., SILLEN, X., MALLANTS, D., ZEEVAERT, TH. Remediation of Uranium Mining and Milling Tailing in Mailuu

102
Suu District Kyrgyzstan, Final report, EC-TACIS Project N° SCRE1/N°38, SCK•CEN R-3721, Mol, Belgium (2003).
VANDENHOVE, H. ANTUNES, K., WANNIJN, J., DUQUÈNE, L., VAN HEES, M., Method of diffusive gradient in thin films (DGT) compared with other testing methods to predict uranium phytoavailability, Science of the Total Environment 373 (2007), 542.
WILLETT, I. R., BOND, W. J., Sorption of manganese, uranium, and radium by highly weathered soils, Journal of Environmental Quality 24 (1995) 834.
YASUDA, H., AMBE, S., UCHIDA, S., Distribution coefficient of platinum group metals between soil solid and liquid phases, Environmental Technology 17 (1996) 1151.
YASUDA, H., UCHIDA, S., MURAMATSU, Y., YOSHIDA, S., Sorption of manganese, cobalt, zinc, strontium and caesium onto agricultural soils: statistical analysis on effects of soil properties, Water, Air and Soil Pollution 83 (1995) 85.
ZHENG, Z., TOKUNAGA, T. K., WAN, J., Influence of calcium carbonate on U (VI) sorption to soils, Environmental Science and Technology 37 (2003) 5603.
ZHENG, Z., WAN, J., Release of contaminant U (VI) from soils, Radiochimica Acta 93 (2005) 211

103
VERTICAL MIGRATION OF RADIONUCLIDES IN UNDISTURBED SOILS
F. STREBL Austrian Research Centers GmbH–ARC, Div. Radiation Safety and Applications, Seibersdorf, Austria
M. GERZABEK University of Natural Resources and Applied Life Sciences Vienna, Vienna, Austria
G. KIRCHNER BfS, Federal Office for Radiation Protection, Salzgitter, Germany
S. EHLKEN Klinikum Bremen-Mitte, Bremen, Germany
P. BOSSEW Institute for Environment and Sustainability, DG Joint Research Centre, European Commission, Ispra, Italy
Abstract
Literature data on numerical values obtained for the parameters of the two most popular models for simulating the migration
of radionuclides in undisturbed soils have been compiled and evaluated statistically. Parameters evaluated include D
(dispersion coefficient) and v (effective convection velocity) of the Convection-Dispersion-Equation and migration rates
derived from different approaches (compartment models, repeated measurements, CDE-approaches). Due to restrictions on
the applicability of compartmental models, the convection–dispersion equation and its parameter values should be
preferred. For temperate environments the data base is sufficiently strong, but for other environments (e.g. Tropics or Arctic)
as well as for radionuclides other than caesium data on vertical migration are still scarce.
1. PHYSICAL AND CHEMICAL BEHAVIOUR OF RADIONUCLIDES IN SOILS
Soil parameters can have a distinct influence on the mobility of deposited radionuclides in soil. The most important factors governing radionuclide mobility in soil are as follows [1]:
• the composition of the soil solution (pH, concentration of inorganic ions, redox potential, concentration of organic substances),
• physical and chemical soil properties (species/characteristics and contents of clay minerals, oxides and organic matter, surface characteristics and charges of particles, soil texture/particle size distribution),
• micro-organisms and fungi (mycorrhiza) and
• temperature.
Most radionuclides in soil are present in cationic form (but iodine is an important exception). In general, therefore, low pH-values, low clay contents and a resulting low cation exchange capacity lead to increased radionuclide mobility within the soil profile [2]. Changes of soil organic matter contents can yield different effects, depending on the ability of the respective radionuclide to form organic complexes or not [3].
Furthermore, the vertical migration velocity of radionuclides is determined by the site-specific water balance. Transport of radionuclides in both soluble form and bound to soil particles (colloids) is possible, especially for less water-soluble radionuclides. For the migration of different radionuclides in the soil profile, Bunzl [4] reports typical time spans of hundreds to

104
thousands of years for Cs; tens to hundreds of years for Sr and less than one to tens of years for Tc.
Experimental results about the fixation of radionuclides in agricultural soils are described in the earlier part of this chapter related to Kd values. A detailed description of element-specific properties of radionuclides with respect to their mobility in soils can be found in [5,6].
After deposition of Chernobyl-derived contamination it soon became evident that radionuclide behaviour in semi-natural environments differs significantly from that in agricultural areas. Especially, the radiocaesium migration in the soil profile was slower than that expected based on earlier experience with agricultural soils. Organic soil horizons, high microbial/fungal biomass in soils [7,8] and dense and superficial rooting systems all play an important role in Cs retention in semi-natural soils under highland or alpine meadows (and forests).
2. MODELING OF RADIONUCLIDE TRANSPORT IN SOIL
The basic processes controlling mobility of radionuclides (and other trace elements) in soil include convective transport by flowing water, dispersion caused by spatial variations of convection velocities, diffusive movement within the fluid, and physico-chemical interactions with the soil matrix. In addition to abiotic processes, soil fauna may contribute to the transport of radionuclides in soils [9], and their action under general conditions results in a dispersion-like translocation [10].
Since the early 1960s, scientific interest has focused on predicting the environmental fate of 90Sr, 137Cs and 238-240Pu, all of which have long or very long radioactive half-lives. These radionuclides strongly sorb to the soil matrix, showing
dK values mostly well above 100 L
kg-1. It is easily calculated that transport velocities in the unsaturated zone for these radionuclides will be about 1 cm y-1 or lower, indicating that a major fraction of the originally deposited activity may remain within the rooting zone for decades. Because of this slow migration velocity, models that simulate radionuclide movement in soils usually do not take into account soil moisture changes in the unsaturated zone, but (often implicitly) assume a constant mean water content.
As a second simplification, usually one-dimensional models are applied, based on the assumption that deposition rates are spatially uniform, which may be justified for weapons-testing fallout and, at least on a local scale, also for the Chernobyl fallout. With these simplifications, two approaches have become most popular for modelling the migration of radionuclides in soils–a serial compartmental approach and application of the convection-dispersion equation.
2.1. Compartment models
Compartment models are often considered as a black-box approach [11], which can be applied without detailed information about the site-specific hydrological, physico-chemical and biological processes that influence radionuclide mobility. Consequently, such models have often been used for the generic description of radionuclide migration in soils [e.g. 12]. Usually, the soil profile is split into a series of horizontal layers (compartments), which are connected by downward transport rates for the respective radionuclide. It is assumed that:

105
• the radionuclides are homogeneously mixed in each compartment,
• transfer rates are time-invariant,
• sorption of the radionuclide is instantaneous and characterized by a linear isotherm,
• fluxes between compartments are donor-controlled.
The radionuclide dynamics is described by a system of linear first-order differential equations with constant coefficients. If deposition of the radionuclides from the atmosphere can be approximated by pulse-like inputs into the surface compartment or continuous uniform rates of input, then analytical solutions of this system of differential equations are available [13,14]. However, numerical methods of solution that can be used with arbitrary deposition histories and initial radionuclide concentrations in the compartments have also been developed [15].
Site-specific values of transfer rates, from which migration velocities and residence times can easily be calculated, are usually estimated by tuning the model to measured concentrations in soil profile layers. Consequently, for parameter estimation, the thickness of the compartments into which the soil profile is divided is usually arbitrarily set to the dimensions of the soil layers sampled in the field.
Multi-compartmental models are simple chromatographic models that can be interpreted as discrete analogues of the dispersion-convection equation [16,17]. Hence, the compartmental model chosen should not be considered as a black-box approach, but must reflect the basic transport characteristics of the soil studied. As a consequence, the serial compartmental model is applicable only if the transport of the radionuclides is dominated by convection [18]. The number of compartments is then a discrete analogue of the dispersion characteristics of the soil under study and hence should not be chosen arbitrarily [18]. If the translocation of the radionuclide in soil is dominated by dispersion-like processes–as is indicated by concentration profiles declining exponentially with depth [e.g. 19,20]–a compartmental model with backflow should be chosen; this type of model adequately represents transport driven by vertical concentration differences [18].
2.2. Convection-dispersion models
A number of studies applying the convection-dispersion equation have been reported in the literature [e.g. 14, 21-23]. The deposition history is mostly approximated by pulse-like input functions, and effective values of the dispersion coefficient and convection velocity are obtained by fitting the analytical solution of the model equation to measured depth distributions of the radionuclides.
An extensive study has been performed by Bossew [24], who analyzed more than 1300 depth distributions taken at 477 sites in Austria. Generally, all nuclides analyzed had a limited mobility in soil with radiocaesium having smaller values of velocity and dispersion than 106Ru, 125Sb, 110mAg and 144Ce. Bossew [24] also showed that the parameter values resulting from the fitting procedure could be grouped with regard to soil types and that parameter variability was considerably reduced within groups.
This indicates that the fitted parameter values are related to the physics of radionuclide transport in the soils studied and hence can be used for predictive modelling. In general, radionuclide mobility increased in the sequence humic alpine soils–podsols–brown earths, chernozems.
106
In many studies, a small fraction of the deposited radionuclide activity was found at greater depths than predicted by the convection-dispersion model [21, 22]. This effect has also been observed with other solutes [e.g. 25] and is related to stochastic spatial variations of the hydraulic properties [26].
A simple stochastic approach is the transfer function model suggested by Jury [27] and Simmons [28] and discussed by [29]. If transport is stationary and linear, all information on the system dynamics is inherent in its impulse-response function, which then can be taken as the probability density function of travel times to a fixed depth or, alternatively, of travel distances in soil during a fixed time period. Hydraulic conductivities of soils have repeatedly been found to show spatial variations that are distributed approximately log-normally [30]. In soils with such spatial properties, solute transport, which is assumed to occur by convection via individual isolated streamlines, is characterized by lognormal travel time probability density functions. This model, as proposed by Simmons [28], may be characterized as stochastic-convective transport. It shows dispersion properties that are fundamentally different from those of the familiar convective-dispersive model [31]: the variance of travel times (which is a convenient measure of a solute dispersion) grows linearly with transport distance for convective-dispersive transport, but with the square of the distance for the stochastic-convective model.
Kirchner [32] extended the stochastic-convective model to take also into account spatial variability of radionuclide sorption. After fitting both CDE and stochastic-convective models to the depth distribution of weapons fallout 90Sr in a podsol soil to derive model parameter values, the latter model was found to be more adequate.
2.3. Relationships between Kd and migration parameters
If sorption of a radionuclide in soil is instantaneous, reversible and independent of its concentration (i.e. the Kd concept applies), this process is reflected in the convection-dispersion model by the following relations of the model parameters of a sorbing and a non-sorbing trace substance, respectively:
ret
s
f
DD = (1)
tre
w
s
f
vv = (2)
where Ds, sv are the effective dispersion coefficient and convective velocity of the
radionuclide showing sorption, D is the dispersion coefficient of a non-sorbing trace substance, vw is the mean pore water velocity and
retf is the retardation factor.
Thus, ifD and wv are known, e.g. from observations using tritium, it is possible to estimate
an in-situ d
K from the depth distribution of a radionuclide (and vice versa). This is most
easily achieved if the input of the radionuclide can be approximated by a single pulse-like function. In this case, for large t the first two moments of the depth-distribution function are asymptotically [33]
[ ] tvzEs⋅≅ (3)
107
[ ] .2var tDzs⋅⋅≅ (4)
Thus, sv and
sD are estimated from the position of the peak concentration in soil, zM, and the
distance ∆z between zM and the depth, where the concentration reduces to ca. 0.6 ⎟⎠
⎞⎜⎝
⎛=
e
1
of its maximum, by
t
zv
M
s= (5)
( )t
zD
s
2
2
Δ= . (6)
Based on the values of sv and
sD deduced in Ref. [33] from analysing more than 500 depth
distributions, for 137Cs this approximation can be used for t >15 y.
3. PARAMETERS FOR VERTICAL MIGRATION IN UNDISTURBED SOIL PROFILES
The following data compilation takes into account literature data on the vertical migration of radionuclides in undisturbed meadow soils (agricultural and semi-natural); all sources are given in the reference list. Most data refer to 137Cs from Chernobyl fallout (deposition event in May 1986) and 137Cs from weapons fallout (peak of deposition in the early 1960s). Other radionuclides are covered only in a limited number of literature sources. For convection-dispersion models the two key parameters, v (convection velocity) and D (dispersion coefficient) are reported. These values can be used in the convection-dispersion equation for a chosen time t to produce a vertical profile of the radionuclide. In some cases, authors not only reported v and D but also the migration rate, derived from the peak of the vertical distribution (or half-depth, i.e. the soil depth, above which 50% of the total activity is present) at a given time t.
Results from compartment model approaches are generally expressed as residence half-times or migration rates. These two figures are related by the formula [34]:
τ
Lv = (7)
Where v represents the migration rate (cm a-1); L represents the thickness of the evaluated soil layer (cm) and τ the ecological residence half-time (i.e. the time, over which the radionuclide activity decreases to 50% of the initial value, excluding physical decay).
Bonne et al. [13] have stressed the importance of separating topsoil profiles into small depth intervals to yield a good approximation of measured depth distributions. On the other hand, since multi-layer-compartment models can be interpreted as analogues of the dispersion-convection-model, layers should not be chosen arbitrarily (see above). There seems to be a depth dependence of migration rates derived from compartment models with higher values for deeper layers (Table 1).
Even if extraordinary high values, typically reported for deeper compartments of multi-layered profiles (15-20 cm depth and deeper) are excluded from the statistics, migration rates derived from compartment models (geometric mean: 0.51x2.8±1; n=45) are significantly higher than corresponding values derived from CDE-based models or repeated measurements (geometric mean: 0.24 × 2.2±1; n=58, Table 2).

108
TABLE 1. MIGRATION RATES (cm a-1) FOR 137Cs AND 134Cs IN UNDISTURBED MEADOW SOIL PROFILES DERIVED BY USE OF COMPARTMENT MODELS1
Soil groups N GM GSD AM SD Min Max #ref.
Chernobyl fallout layers < 10 cm
All soils 45 5.1 × 10⁻¹ 2.8 1.1 2.0 8 × 10⁻² 1.0 × 101 12 Clay 5 1.3 × 10⁻¹ 1.4 1.3 × 10⁻¹ 1 × 10⁻² 8 × 10⁻² 2 × 10⁻¹ 1 Loam 19 5.0 × 10⁻¹ 2.1 6.3 × 10⁻¹ 5 × 10⁻¹ 1.0 × 10⁻¹ 2.0 7 Sand 10 3.5 × 10⁻¹ 1.3 3.5 × 10⁻¹ 1 × 10⁻¹ 2.0 × 10⁻¹ 4 × 10⁻¹ 4 Peat 3 3.0 4.2 4.9 4.1 6.0 × 10⁻¹ 8.7 2 Unspecified 8 1.1 3.0 2.1 3.3 3.8 × 10⁻¹ 1.0 × 101 3
Chernobyl fallout deep layers (>10 cm)
All soils 15 3.2 3.1 4.9 3.9 3.2 × 10⁻¹ 1.2 × 101 4 Loam 4 2.0 2.9 2.9 2.4 7.5 × 10⁻¹ 5.0 2 Sand 1 - - 3.2 × 10⁻¹ - - - 1 Peat 6 4.8 3.2 7.0 4.9 6.0 × 10⁻¹ 1.2 × 101 2 Unspecified 4 4.7 1.3 4.8 1.6 3.90 7.2 1
Weapons fallout; layers < 10 cm
All soils 19 2.8 × 10⁻¹ 2.0 3.5 × 10⁻¹ 2 × 10⁻¹ 9 × 10⁻² 8.5 × 10⁻¹ 6 Clay 1 - - 2.0 × 10⁻¹ - - - 1 Loam 9 3.0 × 10⁻¹ 1.8 3.5 × 10⁻¹ 1 × 10⁻¹ 9 × 10⁻² 5.0 × 10⁻¹ 5 Sand 6 3.0 × 10⁻¹ 2.6 4.2 × 10⁻¹ 3 × 10⁻¹ 9 × 10⁻² 8.5 × 10⁻¹ 3 Peat 1 - - 3.0 × 10⁻¹ - - - 1 Unspecified 2 - - 2.5 × 10⁻¹ - 9 × 10⁻² 4.0 × 10⁻¹ 1
Weapons fallout; deep layers >10 cm
All soils 8 7.1 × 10⁻¹ 1.5 7.5 × 10⁻¹ 2 × 10⁻¹ 3.0 × 10⁻¹ 1.0 2 Loam 4 8.9 × 10⁻¹ 1.2 9.0 × 10⁻¹ 1 × 10⁻¹ 7.0 × 10⁻¹ 1.0 2 Sand 3 6.9 × 10⁻¹ 1.0 6.9 × 10⁻¹ - 6.9 × 10⁻¹ 6.9 × 10⁻¹ 1 Peat 1 - - 3.0 × 10⁻¹ - - - 1
Artificial contamination
All soils 23 4.1 × 10⁻¹ 2.6 5.5 × 10⁻¹ 4 × 10⁻¹ 4 × 10⁻² 1.80 4 1Values from different contamination sources and from layers deeper than 10 cm (10-15, 20-30 cm) were treated separately.
TABLE 2. MIGRATION RATES (MR, cm a-1) OF 137Cs IN UNDISTURBED GRASSLAND SOILS
DERIVED BY CDE-APPROACHES OR REPEATED MEASUREMENT (NOT COMPARTMENT MODELS)
Soil groups N GM GSD AM SD Min Max ref.
All soils 58 2.4 × 10⁻¹ 2.2 3.4 × 10⁻¹ 2.9 × 10⁻¹ 7 × 10⁻² 1.16 7
Clay 2 - - 4.2 × 10⁻¹ - 2.4 × 10⁻¹ 6.0 × 10⁻¹ 1
Loam 15 2.3 × 10⁻¹ 2.5 3.4 × 10⁻¹ 3.2 × 10⁻¹ 7 × 10⁻² 1.00 5
Sand 33 2.1 × 10⁻¹ 2.0 2.7 × 10⁻¹ 2.6 × 10⁻¹ 8 × 10⁻² 1.16 4
Peat 8 5.0 × 10⁻¹ 1.9 5.8 × 10⁻¹ 2.8 × 10⁻¹ 1.4 × 10⁻¹ 1.00 3
MRa 58 3.4 × 10⁻¹ 2.6 6.0 × 10⁻¹ 1.2 4 × 10⁻² 1.0 × 101 29
aCalculated based on all available values for the layer from the soil surface down to 10 cm in depth given in Tables 1-2.

109
This difference may reflect the problems arising from the use of compartmental models.
Moreover, this and all following comparisons are biased to some extent, mainly because the
number of observations from different soil types within compared groups is never the same,
and the times of evaluation (i.e. times after deposition, at which the depth profiles were
studied) do not correspond.
In order to give a robust estimate, it seems justified to combine results from different
modelling approaches: the selected literature represents state of the art (peer reviewed)
estimations, and only if combined covers the full range of possible results for vertical
migration of radionuclides in soils. The overall geometric mean for 137
Cs migration rates
yields 0.34 * 2.6±1
cm a-1
(see Table 2). Parameters D and ν derived from undisturbed
grassland soil profiles using CDE approaches are summarized in Table 3 for different sources
of contamination.
4. TIME DEPENDENCE OF 137
Cs VERTICAL MIGRATION
Some studies have pointed to a time-dependence of migration rates. One month after the
Chernobyl fallout event, Schimmack et al. [35] observed migration rates for 137
Cs of 0.2 cm
per hour (equivalent to 1752 cm a-1
) in a silty loam meadow soil. In Bavaria, the Chernobyl
fallout was deposited by heavy rainfall, and radioactivity was washed into the soil profile
quite deeply. The fixation of radionuclides to soil components like clay minerals or humus
takes some time, and as it progresses, migration rates tend to decrease with increasing time,
due to irreversible fixation of part of the radionuclide content. Between 1987 and 1994
migration rates in soddy-podsolic soils of Bryansk decreased from 0.27 to 0.08 cm a-1
and
similar decreases were observed for other soils (peaty podsol 0.24 – 0.09 /1987 – 1994). In
Sweden such a decrease in migration rates was also observed [36]: one year after Chernobyl
fallout migration rates in peat and gley soil profiles were determined to be 0.6 and 1.0 cm a-1
.
In 1994 (eight years after fallout, see Fig. 1), the migration rates had decreased to 0.18 and
0.41 cm a-1
, respectively.
5. EFFECTS OF SOIL TEXTURE ON 137
Cs MIGRATION
As described above, soil characteristics, including amongst others texture and composition,
have a distinct influence on the migration behaviour of radionuclides. Values for each texture
group (clay, loam, sand, peat) can be found in Table 1 (migration rates) and Table 19 (CDE-
parameters). For migration rates (Table 1) of Chernobyl fallout 137
Cs derived using
compartment model approaches, a significant difference (t-test, p < 0.05) was found between
clay and the other textures (loam, sand and peat), with lower migration rates in clay soils. For 137
Cs migration rates derived by other approaches, the migration rates in sand and peat soils
were significantly different at the 95% confidence level (Table 2). For values of migration
rates from weapons fallout (Table 1) and for parameters of the CDE-function (Table 3) only
non-significant differences were found dependent on soil type.

110
TABLE 3. PARAMETERS OF THE CONVECTION DISPERSION MODEL (D, cm2 a-1 AND ,v cm a-1) FOR 137Cs (AND 134Cs) FROM DIFFERENT SOURCES OF CONTAMINATION (CHERNOBYL AND GLOBAL FALLOUT, ARTIFICIAL CONTAMINATION)
Soil group N GM GSD AM SD Min Max #ref
D, cm2 a
-1
Chernobyl fallout
All soils 31 2.2 × 10⁻¹ 3.1 3.7 × 10⁻¹ 4 × 10⁻¹ 2 × 10⁻² 1.9 13
Loam 4 2.0 × 10⁻¹ 4.6 3.6 × 10⁻¹ 3 × 10⁻¹ 2 × 10⁻² 8 × 10⁻¹ 2
Sand 11 1.1 × 10⁻¹ 2.3 1.6 × 10⁻¹ 2 × 10⁻¹ 3 × 10⁻² 6 × 10⁻¹ 5
Peat 3 9.4 × 10⁻¹ 1.8 1.1 7 × 10⁻¹ 6.3 × 10⁻¹ 1.9 3
Unspecified 12 2.7 × 10⁻¹ 2.6 3.7 × 10⁻¹ 3 × 10⁻¹ 4 × 10⁻² 8 × 10⁻¹ 6
Global Fallout
All soils 12 2.2 × 10⁻¹ 4.3 5.7 × 10⁻¹ 9 × 10⁻¹ 4 × 10⁻² 2.9 6
Loam 2 - - 1.6 - 3.9 × 10⁻¹ 2.9 1
Sand 3 1.3 × 10⁻¹ 5.9 3.6 × 10⁻¹ 5 × 10⁻¹ 4 × 10⁻² 1.0 3
Peat 1 - - 1.6 - - - 1
Unspecified 6 1.2 × 10⁻¹ 2.2 1.6 × 10⁻¹ 1 × 10⁻¹ 5 × 10⁻² 4 × 10⁻¹ 1
Artificial contamination
All soils 4 1.2 1.5 1.3 5 × 10⁻¹ 8.0 × 10⁻¹ 2.0 1
v, cm a-1
Chernobyl fallout
All soils 31 1.8 × 10⁻¹ 3.3 2.7 × 10⁻¹ 2 × 10⁻¹ 0.00 9 × 10⁻¹ 13
Loam 4 6 × 10⁻² 1.8 × 101 2.4 × 10⁻¹ 3 × 10⁻¹ 0.00 6 × 10⁻¹ 3
Sand 11 1.5 × 10⁻¹ 1.7 1.7 × 10⁻¹ 1 × 10⁻¹ 7 × 10⁻² 6 × 10⁻¹ 5
Peat 3 6.9 × 10⁻¹ 1.6 7.3 × 10⁻¹ 3 × 10⁻¹ 4.0 × 10⁻¹ 9 × 10⁻¹ 3
Unspecified 12 2.2 × 10⁻¹ 1.6 2.4 × 10⁻¹ 1 × 10⁻¹ 9 × 10⁻² 5 × 10⁻¹ 6
Global fallout
All soils 11 9 × 10⁻² 3.3 1.6 × 10⁻¹ 2 × 10⁻¹ 1 × 10⁻² 7 × 10⁻¹ 6
Loam 2 - - 2 × 10⁻² - 1 × 10⁻² 1 × 10⁻¹ 1
Sand 2 - - 3.9 × 10⁻¹ - 6 × 10⁻² 7 × 10⁻¹ 3
Peat 1 - - 1.0 × 10⁻¹ - - - 1
Unspecified 6 1.3 × 10⁻¹ 1.4 1.3 × 10⁻¹ 1 × 10⁻² 9 × 10⁻² 2 × 10⁻¹ 1
Artificial contamination
All soils 3 1.9 × 10⁻¹ 1.5 1.5 × 10⁻¹ 1 × 10⁻¹ 1.5 × 10⁻¹ 3 × 10⁻¹ 1
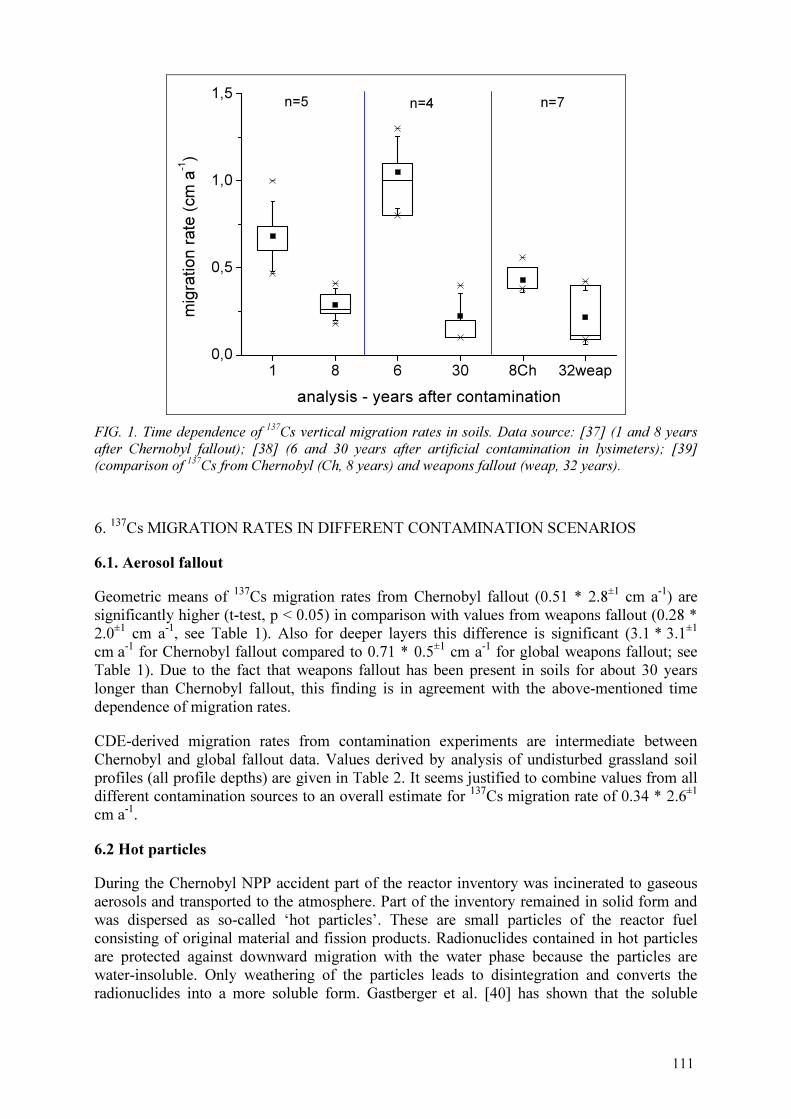
111
1 8 6 30 8Ch 32weap0,0
0,5
1,0
1,5n=7n=4
mig
ration r
ate
(cm
a-1
)
analysis - years after contamination
n=5
FIG. 1. Time dependence of
137Cs vertical migration rates in soils. Data source: [37] (1 and 8 years
after Chernobyl fallout); [38] (6 and 30 years after artificial contamination in lysimeters); [39] (comparison of 137Cs from Chernobyl (Ch, 8 years) and weapons fallout (weap, 32 years).
6. 137Cs MIGRATION RATES IN DIFFERENT CONTAMINATION SCENARIOS
6.1. Aerosol fallout
Geometric means of 137Cs migration rates from Chernobyl fallout (0.51 * 2.8±1 cm a-1) are significantly higher (t-test, p < 0.05) in comparison with values from weapons fallout (0.28 * 2.0±1 cm a-1, see Table 1). Also for deeper layers this difference is significant (3.1 * 3.1±1 cm a-1 for Chernobyl fallout compared to 0.71 * 0.5±1 cm a-1 for global weapons fallout; see Table 1). Due to the fact that weapons fallout has been present in soils for about 30 years longer than Chernobyl fallout, this finding is in agreement with the above-mentioned time dependence of migration rates.
CDE-derived migration rates from contamination experiments are intermediate between Chernobyl and global fallout data. Values derived by analysis of undisturbed grassland soil profiles (all profile depths) are given in Table 2. It seems justified to combine values from all different contamination sources to an overall estimate for 137Cs migration rate of 0.34 * 2.6±1 cm a-1.
6.2 Hot particles
During the Chernobyl NPP accident part of the reactor inventory was incinerated to gaseous aerosols and transported to the atmosphere. Part of the inventory remained in solid form and was dispersed as so-called ‘hot particles’. These are small particles of the reactor fuel consisting of original material and fission products. Radionuclides contained in hot particles are protected against downward migration with the water phase because the particles are water-insoluble. Only weathering of the particles leads to disintegration and converts the radionuclides into a more soluble form. Gastberger et al. [40] has shown that the soluble

112
fraction of 90Sr increases with decreasing presence of hot particles at the Semipalatinsk nuclear test site. Therefore, activity caused by hot particle fallout will remain at the soil surface. Only physical mixing of surface soil layers (by redistribution or bioturbation, particle transport in soil cracks during heavy rainfall events etc.) leads to vertical transport of radionuclides in the initial phase after fallout. In contrast, condensed aerosol fallout consists of radionuclides in a more mobile (cationic) form and will show a faster vertical migration into the soil profile. An illustration of this principle is given in Fig. 2, comparing soil profiles of 137Cs from hot particle influenced locations and nearby sampling spots with aerosol fallout. Although differences are only significant (p < 0.05); for the parameter v (convection velocity) at the investigated sampling locations (median: 0.141 vs 0.215), sites with hot particles present also tend to have lower dispersion constants (median: 0.199 vs. 0.403).
0,0
0,2
0,4
0,6
0,8
1,0
0,0
0,5
1,0
1,5
2,0
Dcondensedfallout
vhot
particles
vcondensedfallout
D (
dis
pe
rsio
ncm
2a-1
)
n=11 n=9 n=11 n=9
Dhot
particlesv (
co
nve
ctio
n)
(cm
a-1
)
standard dev.
75% percentil
min
25% percentil
median
arith. mean
max
0,0
0,2
0,4
0,6
0,8
1,0
0,0
0,5
1,0
1,5
2,0
Dcondensedfallout
vhot
particles
vcondensedfallout
D (
dis
pe
rsio
ncm
2a-1
)
n=11 n=9 n=11 n=9
Dhot
particlesv (
co
nve
ctio
n)
(cm
a-1
)
standard dev.
75% percentil
min
25% percentil
median
arith. mean
max
FIG. 2. Influence of hot particles on 137
Cs depth distribution (data source: [41]).
7. VERTICAL MIGRATION OF RADIONUCLIDES OTHERS THAN 137Cs
Only a very limited number of data have been reported for the vertical migration of other radionuclides in soil. The results are listed in Table 4. Although the number of observations is far too small to yield representative values, the figures given in Table 4 agree with general descriptions of radionuclide mobility in soils (see above): migration rates decrease in the following order.: I > Sr > Ru, Ce, Co > Cs, > Pu, Am.

113
TA
BL
E.
4. C
DE
-PA
RA
ME
TE
RS
D A
ND
v A
ND
MIG
RA
TIO
N R
AT
ES
(MR
) F
OR
MIS
CE
LL
AN
EO
US
RA
DIO
NU
CL
IDE
S
Par
amet
er
N
GM
G
SD
A
M
SD
M
in
Max
S
oil
typ
es
# r
ef
No
tes
110A
g
D (
cm²
a-1)
3
3.4
× 1
0-1
2
.0
4.0
× 1
0-1
3 ×
10-1
1.8
× 1
0-1
7
.2 ×
10
-1
Unsp
ecif
ied
1
110A
g
ν (
cm a
-1)
3
4.7
× 1
0-1
1
.8
5.3
× 1
0-1
4 ×
10-1
3.2
× 1
0-1
9
.4 ×
10
-1
Unsp
ecif
ied
1
241A
m
D (
cm²
a-1)
2
- -
6 ×
10
-2
- 3
× 1
0-2
8
× 1
0-2
sa
nd :
1;
unsp
ecif
ied:
1
2
241A
m
ν (
cm a
-1)
2
- -
1.5
× 1
0-1
-
1.0
× 1
0-1
2
.1 ×
10
-1
sand :
1;
unsp
ecif
ied:
1
2
241A
m
MR
(cm
a-1
) 5
5
.0 ×
10
-1
1.6
5
.4 ×
10
-1
3 ×
10-1
3.0
× 1
0-1
1.0
S
ilt
1
sever
al d
epth
lay
ers
144C
e D
(cm
² a-
1)
2
- -
1.2
-
7.6
× 1
0-1
1.5
U
nsp
ecif
ied
1
144C
e ν (
cm a
-1)
2
- -
5.4
× 1
0-1
-
2.6
× 1
0-1
8
.1 ×
10
-1
Unsp
ecif
ied
1
60C
o
D (
cm²
a-1)
5
6
.9 ×
10
-1
4.8
1
.2
9 ×
10-1
5 ×
10
-2
2.4
lo
am:
4;
sand:
1
2
Art
ific
ial
con
tam
inat
ion
(e.
g. ly
sim
eter
) 60C
o
ν (
cm a
-1)
4
1.9
× 1
0-1
1
.4
1.6
× 1
0-1
1 ×
10-1
1.5
× 1
0-1
3
.0 ×
10
-1
loam
: 3;
sand:
1
2
Art
ific
ial
con
tam
inat
ion
(e.
g. ly
sim
eter
) 154/1
55E
u
D (
cm²
a-1)
2
- -
9 ×
10
-2
- 9
× 1
0-2
9
x1
0-2
S
and
1
154/1
55E
u
ν (c
m a
-1)
2
- -
2.2
× 1
0-1
-
2.0
× 1
0-1
2
.3 ×
10
-1
San
d
1
129/1
31I
MR
(cm
a-1)
6
1.6
2
.7
2.2
1.7
2
.9 ×
10
-1
5.0
U
nsp
ecif
ied
1
Art
ific
ial
con
tam
inat
ion
(e.
g. ly
sim
eter
) 131I
MR
(cm
a-1)
1
- -
2.6
x1
02
- -
- L
oam
1
C
her
nob
yl
fall
ou
t,
1
mo
nth
af
ter
the
acci
den
t 94gN
b
ν (
cm a
-1)
1
- -
1.9
× 1
0-1
-
- -
San
d
1
94gN
b
D (
cm²
a-1)
1
- -
3 ×
10
-2
- -
- S
and
1
237N
p
MR
(cm
a-1
) 3
4
.3 ×
10
-1
1.5
4
.5 ×
10
-1
1 ×
10-1
2.9
× 1
0-1
5
.8 ×
10
-1
Sil
t 1
0-2
, 2
-5, 5
-10
cm
lay
ers
237N
p
MR
(cm
a-1
) 3
9
.3 ×
10
-1
1.4
9
.7 ×
10
-1
3 ×
10-1
6.3
× 1
0-1
1.2
S
ilt
1
10
-15
, 15
-20
. 2
0-3
0 c
m l
ayer
238P
u
D (
cm²
a-1)
2
- -
8 ×
10
-2
- 7
× 1
0-2
8
× 1
0-2
sa
nd :
1;
unsp
ecif
ied:
1
2
238P
u
ν (
cm a
-1)
2
- -
1.5
× 1
0-1
-
1.1
× 1
0-1
1
.9 ×
10
-1
sand :
1;
unsp
ecif
ied:
1
2
239/4
0P
u
D (
cm²
a-1)
2
- -
7 ×
10
-2
- 7
× 1
0-2
7
× 1
0-2
sa
nd :
1;
unsp
ecif
ied:
1
2
239/4
0P
u
ν (
cm a
-1)
2
- -
1.4
× 1
0-1
-
1.1
× 1
0-1
1
.7 ×
10
-1
sand :
1;
unsp
ecif
ied:
1
2
239/4
0P
u
MR
(cm
a-1
) 1
8
3.5
× 1
0-1
1
.6
3.9
× 1
0-1
2 ×
10-1
2.1
× 1
0-1
9
.4 ×
10
-1
sand:
7;
loam
: 10;
pea
t: 5
4
Glo
bal
fal
lou
t, 0
-2, 0
-5, 5
-10 c
m l
ayer
s 239/4
0P
u
MR
(cm
a-1
) 2
4
8.8
× 1
0-1
2
.2
1.2
9 ×
10-1
1.8
× 1
0-1
3.0
lo
am:
14;
sand:
9;
pea
t: 1
3
Glo
bal
fa
llo
ut,
L
ayer
s:
fro
m
10
-15
to
87
cm

TA
BL
E.
4. C
DE
-PA
RA
ME
TE
RS
D A
ND
v A
ND
MIG
RA
TIO
N R
AT
ES
(MR
) F
OR
MIS
CE
LL
AN
EO
US
RA
DIO
NU
CL
IDE
S (
Co
nt.
)
Par
amet
er
N
GM
G
SD
A
M
SD
M
in
Max
S
oil
typ
es
# r
ef
No
tes
226R
a D
(cm
² a-
1)
4
1.8
1
.9
2.2
1
.7
1.0
4
.6
Lo
am
1
226R
a ν (
cm a
-1)
3
1.4
× 1
0-1
1.4
1.1
× 1
0-1
1 ×
10
-1
1.0
× 1
0-1
2.0
× 1
0-1
L
oam
1
106R
u
MR
(cm
a-1)
1
- -
2.6
× 1
03
- -
- L
oam
1
C
her
nob
yl
fall
ou
t,
1
mo
nth
af
ter
the
acci
den
t 106R
u
MR
(cm
a-1)
2
- -
4.4
× 1
0-1
- 4.3
× 1
0-1
4.5
× 1
0-1
L
oam
1
106R
u
D (
cm²
a-1)
6
5.0
× 1
0-1
1.4
5.2
× 1
0-1
2 ×
10
-1
2.6
× 1
0-1
8.2
× 1
0-1
U
nsp
ecif
ied
1
Dif
fere
nt
geo
logic
al r
egio
ns
in A
ust
ria
106R
u
ν (
cm a
-1)
5
4.5
× 1
0-1
1.2
4.6
× 1
0-1
1 ×
10
-1
3.5
× 1
0-1
5.8
× 1
0-1
U
nsp
ecif
ied
1
125S
b
D (
cm²
a-1)
6
3.5
× 1
0-1
2.3
4.4
× 1
0-1
3 ×
10
-1
8 ×
10-2
8.0
× 1
0-1
unsp
ecif
ied:
5;
sand:
1
1
125S
b
ν (
cm a
-1)
6
3.8
× 1
0-1
1.5
4.0
× 1
0-1
1 ×
10
-1
2.0
× 1
0-1
6.3
× 1
0-1
unsp
ecif
ied:
5;
sand:
1
1
90S
r
D (
cm²
a-1)
10
3.8
× 1
0-1
2.9
5.9
× 1
0-1
6 ×
10
-1
5 ×
10-2
1.7
sa
nd:
7;
loam
: 2;
pea
t:
1
2
Ch
ern
ob
yl
fall
ou
t
90S
r
ν (
cm a
-1)
10
2.2
× 1
0-1
2.2
3.0
× 1
0-1
3 ×
10
-1
6 ×
10-2
9.2
× 1
0-1
sa
nd:
7;
loam
: 2;
pea
t:
1
2
Ch
ern
ob
yl
fall
ou
t
90S
r
MR
(cm
a-1)
16
4.8
× 1
0-1
2.0
5.9
× 1
0-1
4 ×
10
-1
1.2
× 1
0-1
1.5
sa
nd:
11;
pea
t: 4
;
loam
: 1
3
Ch
ern
ob
yl
fall
ou
t
90S
r
D (
cm²
a-1)
1
- -
2.4
-
- -
San
d
1
Glo
bal
fal
lou
t 90S
r
ν (
cm a
-1)
1
- -
8 ×
10-2
- -
- S
and
1
G
lob
al f
allo
ut
90S
r
MR
(cm
a-1)
12
8.0
× 1
0-1
1.6
8.8
× 1
0-1
4 ×
10
-1
4.6
× 1
0-1
1.4
sa
nd:
7;
loam
: 3;
pea
t:
2
2
Glo
bal
fal
lou
t, 0
-10 c
m l
ayer
90S
r
MR
(cm
a-1)
24
8
.9 ×
10
-
1
2.5
1
.4
2.0
2
.0 ×
10
-
1
9.5
unsp
ecif
ied:
6;
loam
:
6;
sand:
4;
clay
: 2
4
Art
ific
ial
con
tam
inat
ion
(e.
g. ly
sim
eter
)
114
115
8. CONCLUSIONS
Results from recent studies show that mathematical constraints exist that can lead to artefacts
when applying compartmental models for the description of vertical distributions of
radionuclides in soil profiles. Especially, the arbitrarily chosen thickness of layers can yield
unrealistic results. Therefore, literature values of migration rates derived from compartmental
models should be seen as order of magnitude estimates valuable for comparison of
radionuclides in different soil types, but not as the first choice for predictive purposes. This is
underlined by the large variability of migration rates in the data compilation, which allows not
more than a rough estimate for each radionuclide in a particular soil context.
For the modelling of vertical migration in undisturbed soils, it is highly recommended to rely
on CDE-approaches or other innovative calculation methods, because they offer a more
realistic representation of the observed processes. This shift of recommendations is also
supported by publication history, where there is a strong preference for CDE-approaches in
more recent papers.
In comparison with soil-plant transfer factors, the data base for vertical migration parameters
is very limited. At the moment, no data for D and v in tropical meadow soils are available.
Only a few values have been derived from arctic soils and for subtropical climate conditions.
Therefore, at the present time, it is not possible to give separate values for different
ecosystems.
Future studies should focus on the development of improved modelling techniques, based on
stochastic or CDE approaches, to develop robust models for the description of radionuclide
vertical migration in soils and improve the database of existing values for different
environments and soil characteristics.
REFERENCES
[1] BUNZL, K., “Radionuklide”, Handbuch der Bodenkunde. (BLUME, H.-P., FELIX-HENNIGSEN, P., FISCHER, W.R., FREDE, H.-G., HORN, R., STAHR, K., Eds.) Ecomed, Landberg/Lech Germany (1997). Chapter 6.5.2.6.
[2] MORTVEDT, J.J., Plant and soil relationships of uranium and thorium decay series radionuclides–A review, Journal of Environmental Quality 23 (1994) 643-650.
[3] FRISSEL, M., NOORDIJK, H., VAN BERGEIJK, K.E. The impact of extreme environmental conditions, as occurring in natural ecosystems, on the soil-to-plant transfer of radionuclides, Transfer of radionuclides in natural and semi-natural environments (DESMET, G., NASSIMBENI, S., BELLI, M., Eds.) Elsevier, London, UK (1990) 40-47.
[4] BUNZL, K. Das Verhalten von Radionukliden im Boden, Deutsche Tieraerztliche Wochenschrift 94 (1987) 357-359.
[5] GERZABEK, M.H, STREBL, F., EHLKEN, S., KIRCHNER, G., “Radioactivity in the Soil-Plant System”, Handbook of processes and modelling in the soil-plant system. (BENBI, D.K., NIEDER, R., Eds.). The Hayworth Press, New York (2003) 149-175. Chapter 6.
[6] COUGHTREY, P.J., THORNE, M.C., Radionuclide distribution and transport in terrestrial and aquatic ecosystems; a critical review of data. A.A. Balkema, Rotterdam, Netherlands, Vol. 1 (1983).
[7] JOHANSON, K.J., NIKOLOVA, I., The role of fungi in the transfer of 137Cs in the forest ecosystem, Mitteilungen der Oesterreichischen Geologischen Gesellschaft 53 (1996) 259-266.
[8] STEMMER, M., HROMATKA, A., LETTNER, H., STREBL, F., RadioCaesium storage in soil microbial biomass of undisturbed alpine meadow soils and its relation to soil-plant transfer, Journal of Environmental Radioactivity 79 (2005) 107-118.
116
[9] MUELLER-LEMANS, H., VAN DORP, F., Bioturbation as a mechanism for radionuclide transport in soil: Relevance of earthworms, Journal of Environmental Radioactivity 31 (1996) 7-20.
[10] BOUDREAU, P., Mathematics of tracer mixing in sediments: I. Spatially-dependent, diffusive mixing, American Journal of Science 286 (1986) 161-169.
[11] COUGHTREY, P.J., Models for radionuclide transport in soils, Soil Use and Management 4 (1988) 84-90.
[12] FRISSEL, M.J., PENNDERS, R., “Models for the accumulation and migration of 90Sr, 137Cs, 239,240Pu and 241Am in the upper layer of soils”, Ecological Aspects of Radionuclide Release (COUGHTREY, P.J., BELL, J.N.B., ROBERTS, T.M., Eds.) Blackwell Scientific, Oxford, UK (1983) 63-72.
[13] BOONE, F.W., KANTELO, M.V., MAYER, P.G., PALMS, J.M., Residence half-times of 129I in undisturbed surface soils based on measured soil concentration profiles, Health Physics 48 (1985) 401-413.
[14] SCHULLER, P., ELLIES, E., KIRCHNER, G., Vertical migration of fallout 137Cs in agricultural soils from Southern Chile, Science of the Total Environment 193 (1997) 197-205.
[15] BUNZL, K., FOERSTER, H., KRACKE, W., SCHIMMACK, W., Residence times of 239+240Pu, 238Pu, 241Am and 137Cs in the upper horizons of an undisturbed grassland soil, Journal of Environmental Radioactivity 22 (1994) 11-27.
[16] NAUMANN, E.B., BUFFHAM, B.A., Mixing in Continuous Flow Systems. John Wiley & Sons. New York (1983).
[17] SMITH, J.T., ELDER, D.G., A comparison of models for characterizing the distribution of radionuclides with depth in soils, European Journal of Soil Science 50 (1999) 295-307.
[18] KIRCHNER, G., Applicability of compartmental models for simulating the transport in soils, Journal of Environmental Radioactivity 38 (1998) 339-352.
[19] ISAKSSON, M., ERLANDSSON, B., Models for the vertical migration of 137Cs in the ground — a field study, Journal of Environmental Radioactivity 41 (1998) 163-182.
[20] HOELGYE, Z., MALY, M., Sources, vertical distribution, and migration rates of 239,240Pu, 238Pu, and 137Cs in grassland soil in three localities of central Bohemia, Journal of Environmental Radioactivity 47 (2000) 135-147.
[21] SMITH, J.T., HILTON, J., COMANS, R.N.J., Application of two simple models to the transport of 137Cs in an upland organic catchment, Science of the Total Environment 168 (1995) 57-61.
[22] BOSSEW, P., STREBL, F. Radioactive contamination of tropical rainforest soils in Southern Costa Rica, Journal of Environmental Radioactivity 53 (2001) 199-213.
[23] SHINONAGA, T., SCHIMMACK, W., GERZABEK, M.H., Vertical migration of 60Co, 137Cs and 226Ra in agricultural soils as observed in lysimeters under crop rotation, Journal of Environmental Radioactivity 79 (2005) 93-106.
[24] BOSSEW, P. Migration von Radionukliden in ungestörten Böden. Bericht an das Österreichische Wissenschaftsministerium, (1997) (In German) (data covered by mean values of Bossew and Kirchner, 2004).
[25] KHAN, A.U.-H., JURY, W.A., A laboratory study of the dispersion scale effect in column outflow experiments, Journal of Contaminant Hydrology 5 (1990) 119-131.
[26] DAGAN, G., Flow and Transport in Porous Formations. Springer-Verlag, New York (1989). [27] JURY, W.A., Simulation of solute transport using a transfer function model, Water Resources
Research 18 (1982) 363-368. [28] SIMMONS, C.S., A stochastic-convective transport representation of dispersion in one-
dimensional porous media systems, Water Resources Research 18 (1982) 1193-1214. [29] JURY, W.A., and ROTH, K., Transfer Functions and Solute Movement through Soils. Basel,
Switzerland: Birkhäuser Verlag (1990) 226. [30] JURY, W.A., RUSSO, D., SPOSITIO, G., ELABD, H., The spatial variability of water and
solute transport properties in unsaturated soil. I. Analysis of property variation and spatial structure with statistical models, Hilgardia 55 (1987) 1-32.
[31] JURY, W.A., SPOSITO, G., Field calibration and validation of solute transport models for the unsaturated zone, Soil Science Society of America Journal Continues 49 (1985) 1331-1341.

117
[32] KIRCHNER, G., Modelling the migration of fallout radionuclides in soil using a transfer function model, Health Physics 74 (1998b) 78-85.
[33] BOSSEW, P., KIRCHNER, G., Modelling the vertical distribution of radionuclides in soil. Part 1: the convection-dispersion equation revisited, Journal of Environmental Radioactivity 73 (2004) 127-150.
[34] BUNZL, K., KRACKE, W., SCHIMMACK, W., AUERSWALD, K., Migration of fallout 239-
240Pu, 241Am and 137Cs in the various horizons of a forest soil under pine, Journal of Environmental Radioactivity 28 (1995) 17-34.
[35] SCHIMMACK, W., BUNZL, K., ZELLES, L., Initial rates of migration of radionuclides from the Chernobyl fallout in undisturbed soils, Geoderma 44 (1989) 211-218.
[36] ROSEN, K., OEBORN, I., LOENSJOE, H., Migration of radiocaesium in Swedish soil profiles after the Chernobyl accident, 1987–1995, Journal of Environmental Radioactivity 46 (1999) 45-66.
[37] SHEPPARD, M.I., ELRICK, D.E., PETERSON, S.R., Review and performance of four models to assess the fate of radionuclides and heavy metals in surface soil, Canadian Journal of Soil Science 77 (1997) 333-344.
[38] PALAGYI, S., PALAGYIOVA, J., Vertical migration of 85Sr, 137Cs 131I in various arable and undisturbed soils, Journal of Radioanalytical and Nuclear Chemistry 257 (2003) 353-359.
[39] BUNZL, K., SCHIMMACK, W., ZELLES, L., ALBERS, B.P, Spatial variability of the vertical migration of fallout 137Cs in the soil of a pasture, and consequences for long-term predictions, Radiation and Environmental Biophysics 39 (2000) 197 – 205.
[40] GASTBERGER, M., STEINHAEUSLER, F., GERZABEK, M.H., HUBMER, A., LETTNER, H., 90Sr and 137Cs in environmental samples from Dolon near the Semipalatinsk nuclear test site, Health Physics 79 (2000) 257-265.
[41] IVANOV, Y.A., LEWYCKYI, N., LEVCHUK, S.E., PRISTER, B.S., FIRSAKOVA, S.K., ARKHIPOV, N.P., ARKHIPOV, A.N., KRUGLOV, S.V., ALEXAKHIN, R.M., SANDALLS, J., ASKBRANDT, S., Migration of 137Cs and 90Sr from Chernobyl fallout in Ukrainian, Belarussian and Russian soils, Journal of Environmental Radioactivity 35 (1997) 1-21.

118
APPENDIX
List of publication used for parameters of radionuclide vertical migration in soil evaluation
ARAPIS, G.D., PETRAYEV, E., SHAGALOVA, E., ZHUKOVA, O., SOKOLIK, G., IVANOVA, T., Effective migration velocity of 137Cs and 90Sr as a function of the type of soils in Belarus, Journal of Environmental Radioactivity 34 (1997) 171-185.
BELLI, M., BLASI, M., BORGIA, A., DELUISA, A., MENEGON, S., MICHELUTTI, G., et al., “The behaviour of caesium in mountainous soils”, Transfer of radionuclides in natural and semi-natural environments (DESMET, G., NASSIMBENI, P., BELLI, M. Eds.) Elsevier, London and New York (1990) 143-151.
BONAZZOLA, G.C., ROPOLO, R., FACCHINELLI, A., Profiles and downward migration of 134Cs and 106Ru deposited on Italian soils after the Chernobyl accident. Health Physics 64 (1993) 479-484.
BOSSEW, P., GASTBERGER, M., GOHLA, H., HOFER, P., HUBMER, A., Vertical distribution of radionuclides in soil of a grassland site in Chernobyl exclusion zone, Journal of Environmental Radioactivity 73 (2004) 87-99.
BOSSEW, P., KIRCHNER, G., Modelling the vertical distribution of radionuclides in soil. Part 1: the convection-dispersion equation revisited, Journal of Environmental Radioactivity 73 (2004) 127-150.
BUNZL, K., FOERSTER, H., KRACKE, W., SCHIMMACK, W., Residence times of 239+240Pu, 238Pu, 241Am and 137Cs in the upper horizons of an undisturbed grassland soil, Journal of Environmental Radioactivity 22 (1994) 11-27.
BUNZL, K., KOFUJI, H., SCHIMMACK, W., TSUURA, A., UENO, K., YAMAMOTO, M., Residence times of global weapons testing fallout 237Np in a grassland soil compared to 239+240Pu, 241Am, and 137Cs, Health Physics 68 (1995) 89-93.
BUNZL, K., SCHIMMACK, W., ZELLES, L., ALBERS, B.P, Spatial variability of the vertical migration of fallout 137Cs in the soil of a pasture, and consequences for long-term predictions, Radiation and Environmental Biophysics 39 (2000) 197 – 205.
CHIBOVSKI, S., MITURA, A., Studies of the rate of migration of radiocesium in some types of soils in Eastern Poland, Science of the Total Environment 170 (1995) 193-198.
CHIBOWSKI, S., ZYGMUNT, J., The influence of the sorptive properties of organic soils on the migration rate of 137Cs, Journal of Environmental Radioactivity 61 (2002) 213-223.
DENK, H.-J., FELSMANN, M., “Measurements and evaluation of a multicompartment model for estimating future activity profiles of radiocesium in undisturbed soil of pasture-land in North Rhine-Westphalia”, Natural and Artificial Radionuclides, Proc. of the 15th Regional Congress of IRPA (FELDT, W., Ed) Visby, Sweden, Sept. 10-14th 1989. TÜV Rheinland, Köln, Report FS-48-T. (1989) 182-187.
FORSBERG, S., ROSEN, K., FERNANDEZ, V., JUHAN, H., Migration of 137Cs and 90Sr in undisturbed soil profiles under controlled and close-to-real conditions, Journal of Environmental Radioactivity 50 (2000) 235-252.
FORSBERG, S., STRANDMARK, M. Migration and chemical availability of 137Cs and 90Sr in Swedish long-term experimental pastures. Water, Air and Soil Pollution 127 (2001) 157–171.
HOELGYE, Z., MALY, M., Sources, vertical distribution, and migration rates of 239,240Pu, 238Pu, and 137Cs in grassland soil in three localities of central Bohemia, Journal of Environmental Radioactivity 47 (2000) 135-147.
HRABOVSKY, V., DZENDZELYUK, O., KATERYNCHUK, I., FURGALA, Y. Monitoring of radionuclides contamination of soils in Shatsk National Natural Park (Volyn Region, Ukraine) during 1994–2001, Journal of Environmental Radioactivity 72 (2004) 25–33.

119
ISAKSSON, M., ERLANDSSON B., MATTSSON S., A 10-year study of the 137Cs distribution in soil and a comparison of Cs soil inventory with precipitation-determined deposition, Journal of Environmental Radioactivity 55 (2001) 47-59.
ISAKSSON, M., ERLANDSSON, B., Models for the vertical migration of 137Cs in the ground — a field study, Journal of Environmental Radioactivity 41 (1998) 163-182.
IVANOV, Y.A., LEWYCKYI, N., LEVCHUK, S.E., PRISTER, B.S., FIRSAKOVA, S.K., ARKHIPOV, N.P., ARKHIPOV, A.N., KRUGLOV, S.V., ALEXAKHIN, R.M., SANDALLS, J., ASKBRANDT, S., Migration of 137Cs and 90Sr from Chernobyl fallout in Ukrainian, Belarussian and Russian soils, Journal of Environmental Radioactivity 35 (1997) 1-21.
KIRCHNER, G., BAUMGARTEN, D., Migration rates of radionuclides deposited after the Chernobyl accident in various North German soils, Analyst 117 (1992) 475-479.
KIRCHNER, G., Modeling the migration of fallout radionuclides in soil using a transfer function model, Health Physics 74 (1998b) 78-85.
KNATKO, V.A., SKOMOROKHOV, A.G., ASIMOVA; V.D., STRAKH, L.I., BOGDANOV, A.P., MIRONOV, V.P., Characteristics of 90Sr, 137Cs and 239, 240Pu migration in undisturbed soils of southern Belarus after the Chernobyl accident, Journal of Environmental Radioactivity 30 (1996) 185-196.
KOBLINGER-BOKORI, E., KOBLINGER, L., SZERBIN, P., UGRON, A., Measurements and modelling of 137Cs migration into various types of soil, Proc. of the 10th IRPA Congress, 14-19 May 2000. Hiroshima, Japan (2000).
KRSTIC, D., NIKEZI, D., STEVANOVI, N., JELI, M., Vertical profile of 137Cs in soil, Applied Radiation and Isotopes, 61 (2004) 1487-1492.
KUDELSKY, A.V., SMITH, J.T., OVSIANNIKOVA, S.V., HILTON, J., Mobility of Chernobyl-derived 137Cs in a peat bog system within the catchment of the Pripyat River, Belarus, Science of the Total Environment 188 (1996) 101-113.
LUJANIENE, G., PLUKIS, A., KIMTYS, E., REMEIKIS, V., JANKUENAITE, D., OGORODNIKOV, B.I., Study of 137Cs, 90Sr, 239,240Pu, 238Pu and 241Am behaviour in the Chernobyl soil, Journal of Radioanalytical and Nuclear Chemistry 251 (2003) 59-68.
PADOVANI, R., CONTENTO, C., Giovani, C., Malisan, M.R., “Field study of fallout radiocaesium in upland soils” Transfer of radionuclides in natural and semi-natural environments (DESMET, G., NASSIMBENI, P., BELLI, M. Eds.) Elsevier, London and New York (1990) 292-299.
PALAGYI, S., PALAGYIOVA, J., Vertical migration of 85Sr, 137Cs 131I in various arable and undisturbed soils, Journal of Radioanalytical and Nuclear Chemistry 257 (2003) 353-359.
ROSEN, K., OEBORN, I., LOENSJOE, H., Migration of radiocaesium in Swedish soil profiles after the Chernobyl accident, 1987–1995, Journal of Environmental Radioactivity 46 (1999) 45-66.
SANZHAROVA, N.I., KOTIK, V.A., ARHIPOV, A.N., SOCOLIC, G.A., IVANOV, Y.A., FESENKO, S.V., LEVCHUK, S.E., Quantitative parameters of radionuclide vertical migration in the soils of different meadow types, Radiation and Environmental Biophysics 36 (1996) 488-497 (in Russian).
SCHIMMACK, W., BUNZL, K., ZELLES, L., Initial rates of migration of radionuclides from the Chernobyl fallout in undisturbed soils, Geoderma 44 (1989) 211-218.
SCHULLER, P., BUNZL, K., VOIGT, G., ELLIES, E., CASTILLO, A., Global fallout 137Cs accumulation and vertical migration in selected soils from South Patagonia, Journal of Environmental Radioactivity 71 (2004) 43-60.
SCHULLER, P., BUNZL, K., VOIGT, G., HANDL, J., ELLIS, A., CASTILLO, A., Fallout radiocesium in an Antarctic region: deposition history, activity densities and vertical transport in soils, Radiation and Environmental Biophysics 41 (2002) 295-302.
120
SCHULLER, P., ELLIES, E., KIRCHNER, G., Vertical migration of fallout 137Cs in agricultural soils from Southern Chile, Science of the Total Environment 193 (1997) 197-205.
SHEPPARD, M.I., ELRICK, D.E., PETERSON, S.R., Review and performance of four models to assess the fate of radionuclides and heavy metals in surface soil, Canadian Journal of Soil Science 77 (1997) 333-344.
SHINONAGA, T., SCHIMMACK, W., GERZABEK, M.H., Vertical migration of 60Co, 137Cs and 226Ra in agricultural soils as observed in lysimeters under crop rotation, Journal of Environmental Radioactivity 79 (2005) 93-106.
SMITH, J.T., HILTON, J., COMANS, R.N.J., Application of two simple models to the transport of 137Cs in an upland organic catchment, Science of the Total Environment 168 (1995) 57-61.
SZERBIN, P., KOBLINGER-BOKORI, E., KOBLINGER, L., VEGVARI, I., UGRON, A., Caesium-137 migration in Hungarian soils, Science of the Total Environment 227 (1999) 215-227.
VELASCO, R.H., BELLI, M., SANSONE, U., MENEGON, S., Vertical transport of radiocaesium in surface soils: model implementation and dose-rate computation, Health Physics 64 (1993) 37-44.
AGRICULTURAL ECOSYSTEMS: ROOT UPTAKE

123
PROCESSES GOVERNING RADIONUCLIDE TRANSFER TO PLANTS
N. SANZHAROVA
RIARAE, Russian Institute of Agricultural Radiology & Agroecology,
Obninsk, Russian Federation
S. FESENKO
International Atomc Energy Agency,
E. REED
SENES Oak Ridge Inc., Center for Risk Analysis, Oak Ridge, United States of marica
Abstract
Processes governing radionuclide transfers to plants from soil are described. Six basic factors, including: the chemical form
of depositions; the properties of radionuclide; time after depositions; properties of soil; type of crop; crop cultivation practice
(application of fertilizers, irrigation, ploughing, liming, etc.); climate conditions; and the experimental conditions under
which the transfer factors were obtained were identified as basic factors influencing variability of transfer factors from soil to
plants.
1. INTRODUCTION
Radionuclides can enter the soil environment via several routes. Generally, most large-scale
contamination is through air deposition or advection from neighbouring contaminated areas.
Contamination may also occur via contaminated surface water (inundation, irrigation) or
contaminated ground water (upwelling, irrigation).
Naturally occurring radionuclides (NORs) are present in many natural resources. High
concentrations of these radionuclides are often found in certain geological materials, namely
igneous rocks and ores. Human activities that exploit these resources may lead to enhanced
concentrations of naturally occurring radionuclide materials and/or enhanced potential for
exposure to naturally occurring radioactive materials (NORMs) in products, by-products, and
wastes. Soil contamination routes are comparable to those for the artificial radionuclides
except for large-scale air deposition. The transfer of radionuclides along food chains and
through food webs has been studied extensively over the last 50 years. At the beginning of
this period, the objective of the research was to evaluate the biological impact of nuclear
weapons testing and releases from military sites. Studies on the impact of global fallout on
man showed that some radionuclides such as 90
Sr, 131
I, and 137
Cs are very mobile in the
environment, and that accumulation in food stuffs can be responsible for much of the effective
dose to the population [1-2].
In the 1960s the development of civilian uses for nuclear energy stimulated some expansion
in the list of radionuclides of interest. New experiments on the transfer of some activation
products (54
Mn, 60
Co, 65
Zn), natural (238
U, 226
Ra, 228+232
Th, 210
Pb and 210
Po), transuranic
(237
Np, 239+240
Pu, 241
Pu, 241
Am), and some other radionuclides (3H and
14C) were started to
extend the scientific basis for predicting the contamination of agricultural products in various
contamination scenarios [2].
After the Chernobyl accident, extensive, further studies of radionuclide behaviour in
agricultural ecosystems were carried out, and many data on 137
Cs bioavailability in soil-plant
systems have been obtained.
Seibersdorf

124
In addition, since the 1980s, many parameter values for tropical and subtropical crops have
been determined. Although these data are reasonably extensive, the number of radionuclides
considered is limited, geographical coverage is very variable, and a limited number of soil and
crop type combinations have been studied.
The continuing growth of a body of relevant data over recent years means that there is a
general need for a systematic review of radionuclide soil-to-plant transfer factors for use in
dose assessments. Assessment models require well-founded default parameter values and
ranges on which to base predictions and estimate uncertainties in those predictions.
Observed transfer factor values vary enormously. Six main factors (Fig. 1) determine this
variability: the form in which the activity enters or is present the soil (e.g. as particles, as
aerosol or in solution); the physicochemical properties of the radionuclide; time after entry
into the soil; type of soil and the physicochemical characteristics of the soil environment; type
of crop; crop management practices (application of fertilizers, irrigation, ploughing, liming,
etc.); climate conditions; and the experimental conditions under which the transfer factors
were obtained [1, 3-8, 9-11].
FIG. 1. Factors influencing radionuclide root uptake
2. DEPOSITION PROPERTIES
Different types of radioactive materials in routine or accidental releases from the nuclear fuel
cycle can be identified according to their mobility in soil-plant systems [9, 10].
The first group exists primarily in the particulate state and has extremely low solubility
(radioisotopes of the actinides and some other elements such as zirconium). For these
radionuclides, the transported forms are typically either oxides (particles) or carbonates.
However, in the case of process wastes, the actinides can often be in a somewhat soluble form
(nitrates, organic complexes) [1, 8, 10]. Among the actinides, plutonium, thorium, and
americium would be expected to have the most stable oxide/hydroxide form and very low
solubility rates. Neptunium and curium have exhibited slightly higher biotic transfer rates.
Uranium has the widest range in bioavailability, because it forms both cationic and anionic
species [11].

125
The second group includes radionuclides that can exist in the cationic and/or anionic forms
and are characterised by higher bioavailability to plants [1, 10]. The activation and fission
products are in this group. The radionuclides of this group may be contained within refractory
waste forms, e.g. fuel particles, and may or may not be present in stable chemical forms
within the refractory material. However, once released to the soil environment, stable
speciation of these elements will occur. For example, elements (technetium, selenium, iodine)
that can readily form anions in environmental pH/Eh regimes will be more mobile, and, in
many cases, more plant-available. Elements such as Ni, Cs, Sr, Ag, Sn, and Nb will likely be
present in cationic forms and form stable compounds that will limit both mobility and
bioavailability. The naturally occurring radionuclides 226/228
Ra, 210
Pb and 210
Po may also be
included in this group [10].
The physicochemical composition of deposition influences radionuclide behaviour in the soil-
plant system. For example, after the Chernobyl accident, the major part of 137
Cs was deposited
in the form of easily soluble, finely dispersed aerosols, but some of it was included in coarser
material and in fuel particles. Leaching of 137
Cs from fuel matrices was found to be a factor
that significantly affected the bioavailability of the radionuclide, which changed with time
after the accident in consequence of the leaching process [9, 12].
It has been found that in the early period after contamination, 137
Cs Fv values for plants in the
zone with the "fuel" type of deposition were significantly lower than values in the zone in
which gas-aerosol deposition dominated. However, in areas with such contamination, 137
Cs
activity concentrations in plants have increased considerably with time and, in some cases,
have exceeded 137
Cs concentrations in plants of the ‘remote’ zone of the Chernobyl NPP [13-
15]. This is due to the fixation of exchangeable and mobile 137
Cs in both zones, compensated
by on-going leaching of 137
Cs from the fuel matrix in the ‘fuel’ type deposition zone.
3. TIME AFTER CONTAMINATION
A decrease in the radionuclide content in farm crops as time elapses is a typical phenomenon
observed in agricultural ecosystems [13, 16]. A variety of processes are involved, including
fixation to soil minerals, incorporation by microorganisms, and migration within the rooting
zone. As a result, the biological availability of radionuclides for incorporation into food
chains is reduced.
Fixation is partly irreversible [17]. In particular, slow adsorption of Cs occurs, especially on
clay minerals [18, 19]. Usually, fixation is most important in the first years after
contamination of the soil, but the degree of fixation differs among soil types [14-16, 20]. The
availability of 137
Cs in soil, in the early period before fixation has occurred to its full extent,
may be up to a factor of 10 higher than after fixation has occurred and equilibrium conditions
have been achieved. The availability of 90
Sr also decreases with time, but the effect is much
less pronounced than with 137
Cs [21].
At the present time, ecological half-lives have been mostly determined for 137
Cs. For other
radionuclides, this information is almost unavailable and long-term behaviour studies are
required.
4. SOIL PROPERTIES
The accumulation of radionuclides in farm crops varies considerably for different soils. The
difference in transfer factors to farm crops for different soils can be up to three orders of
126
magnitude [1, 3, 7, 8, 11, 22, 39]. Soil properties that are likely to affect bioavailability
include mineralogical and granulometric composition, organic matter content, pH, and
fertility. The cation exchange capacity and the nature of exchangeable bases are important.
The highest availability of many radionuclides is reported for sandy soils. Soils with higher
fertility generally retain radionuclides more strongly. Thus, for 137
Cs, the transfer factors to
farm crops for high fertility soils are typically two order of magnitude lower than for low-
fertility soils [1, 22-24].
5. CROP PROPERTIES
Among the key factors influencing Fv values, the biological variability inherent in plants and
distinctions between different varieties and species is a likely source of the variability in
transfer factors. The sources of this variability include differences in metabolic and
biochemical mechanisms of radionuclide uptake by plants; crop requirements for certain
nutrients (for example, analogues for radionuclides: K for Cs, Ca and Mg for Sr or Ra),
detoxification and exclusion mechanisms, distribution of roots in the soil, and rhizosphere
properties. Duration of the vegetative period and yield may also influence radionuclide
transfer factors. Radionuclides often transfer in greater concentrations to leaves and stems and
in much lower concentrations to generative parts [4, 7, 23-25]. Sr-90 is more effectively
accumulated by legumes than by cereals.
6. CROP CULTIVATION PRACTICES
Cultivation of agricultural crops implies various technologies of soil management, different
rates and combinations of fertilizers, irrigation in dry areas, drainage in boggy environments,
etc. Crop cultivation practices may affect soil properties or lead to redistribution of
radionuclides in the root zone, and, as a consequence, change radionuclide accumulation in
crops. For example, under irrigation, radionuclide accumulation in plants is increased by a
factor of 1.2 to 2.0 [26].
Ploughing has been found to decrease v
F values by as much as a factor of two [1]. Liming
reduces plant uptake for some of radionuclides as 90
Sr and 137
Cs by a factor of 2-3 and
application of fertilizers by a factor of 2-5 [1]. Thus, crop cultivation practice should be
considered in the estimation of parameters for plant uptake in soil-plant systems [1, 7, 26-33].
7. RADIONUCLIDE PROPERTIES
Five groups of radionuclides can be identified according their physicochemical characteristics
[1]. The first of these groups comprises light natural radionuclides (3H,
14C,
40K). The primary
uptake of 3H by plants is by absorption of water and, to some degree, uptake of vapour from
the atmosphere. The role of active absorbtion by roots from soil solution is considered to be
insignificant. The migration of 14
C is determined by the characteristics of the biogeochemical
carbon cycle, indicating that 14
C accumulates in plants mainly as a consequence of uptake of
carbon dioxide through the leaves and its subsequent use in photosynthesis. The role of
uptake from soil in comparison with uptake from air is insignificant. The degree of 40
K
accumulation depends on the physiological requirements of plants [1, 22].
The second group, heavy natural radionuclides (232
Th, 238
U, 226
Ra, 210
Pb, 210
Po), exhibit
relatively low Fv values. The Fv values are generally about 10 fold lower for Th and Po than
for U, Ra and Pb. Bioavailability of 238
U and
232Th is highly influenced by soil pH, more than

127
by soil texture. Uptake of the bivalent 226
Ra is mostly ruled by factors affecting the soil
exchange capacity. For 210
Pb and 210
Po Fv data are too limited to point to major soil properties
ruling transfer. Fv values of heavy natural radionuclides for different species of plants differed
by 10-100 times, and, for different soil types, by up to 10 times [10, 11].
Transuranic elements (Am, Cm, Pu, Np), comprising the third group, exhibit very complex
soil chemistry, because of various degrees of oxidation, absence of stable carriers, and high
propensities to complexation and hydrolysis. Fv values for transuranic elements varied from
about 100 to about 10
-6. Concentrations of these radionuclides in fruits and grains are 10-1000
times lower than in the vegetative parts of plants. Accumulation of elements decreases in the
order Np> Am> Cm> Pu. Among the higher actinides, Np appears to be the most
environmentally mobile and plant available. Hydrolysis is a major factor influencing the
behaviour of Am and Cm in soils. The mobility of Pu depends on its form and decreases
according to Pu (V)> Pu (VI)> Pu (III)> Pu (IV) [8].
The fission products (89,90
Sr, 134,137
Cs, 129,131
I, 91
Y, 95
Zr, 95
Nb, 103,106
Ru, 141,144
Ce etc.–the
fourth group) generate a rather diverse class in terms of the environmenral mobility of
radionuclides. Y-91, 95
Zr, 95
Nb, 103,106
Ru, 141,144
Ce are poorly accumulated by agricultural
plants because of their strong sorption in soil, a factor that is believed to dominate Fv
behavior. Soil acidity and organic matter content most significantly influence the behaviour of
these radionuclides. Up to 99% of the plant uptake of radionuclides is retained in the roots,
and very little transfer to above-ground parts occurs. Zr-95 and 141,144
Ce are the least
accessible of this group to plants. Fv values vary by factors of 10-30 on different soils [1, 4-6,
10, 22].
Most of the activation products (51
Cr, 54
Mn, 55,59
Fe, 60
Co, 65
Zn, 115
Cd), comprising the fifth
group, are radioisotopes of biologically important micronutrients. As a rule, they have high
mobility in soil-plant systems [5-6, 33]. The behaviour of these radionuclides depends
strongly on the oxidation-reduction potential of the soil, the acidity of the soil solution, and
the organic matter content [1]. Cadmium is known to be maximally mobile in all soil types.
From 6.5 to 37% of this element is found in soil in a mobile form. It is followed by lead (5-
14% in a mobile form). The next element, as far as mobility is concerned, is zinc (from 7.5%
in soddy-podzolic to 1.5-2% in chernozems and chestnut soils). The content of Cu mobile
forms varies between 7.5% in soddy-podzolic soils and 1% in chernozems. Chrome has the
least mobility of the above elements in soddy-podzolic, grey and brown forest soils (1-4%).
However in chernozems, its mobility is higher (5-5.5%) [1, 34]. More specific information for
the most important radionuclides is given below.
7.1. Uranium
Uranium is widely distributed in nature. The main sources of uranium are hydrothermal veins,
sedimentary rocks, and pyritic conglomerate beds. Uranium is an important constituent of
about 155 minerals. It is also found in phosphate rock, lignite, and monazite sands [11, 35].
Natural uranium comprises three isotopes, 234
U, 235
U, and 238
U, with relative mass abundances
of 0.0055, 0.72 and 99.27%, respectively [35]. The dominant isotope, 238
U, has a physical
half-life of 4.5 × 10⁹ yr, giving it a very low specific activity (12400 Bq g
-1 U). In many
instances, the natural abundance has been altered due either to anthropogenic uranium
enrichment or to geological processes.

128
Uranium occurs in the valences +3, +4, +5 and +6, and, in soils, the valences +4 and +6 are
the most important. U+4
dominates at Eh<200 mV [36], which is typical for waterlogged to
wet soils. Tetravalent U has a tendency to strongly bind to organic matter and to precipitate
and therefore, is immobile. The most oxidized state of U in nature is U+6
, and in oxidizing,
aqueous environments, U is present as the uranyl ion, UO22+
. U availability is predominantly
influenced by pH, soil carbonate content, amount of amorphous iron oxides and hydroxides,
and organic matter content. Generally uranium is not very mobile. As it is incorporated in the
mineral phase, it tends to remain in situ. However, uranium entering the environment due to
human activities tends to be more mobile in spite of the fact that plant uptake of uranium
tends to be quite limited.
Although extensive work has been done on U solubility in soils, there is comparatively little
information regarding the uptake and translocation of U by plants as affected by soil
properties. Generally, it appears that the U Fv value decreases from sandy through loamy to
clay soils [37]. The presence of organic matter generally decreases the U Fv value [36-39].
7.2. Radium
Radium (226
Ra, 2/1
T =1600 yr) is a natural decay product of 238
U. Ra-228 (2/1
T =5.75 yr) and 224
Ra (2/1
T = 3.82 d) are decay products from 232
Th and are present in the soil at comparable to
slightly higher concentrations than 226
Ra [1, 11].
In tailings from uranium mills, phosphate mines, and phopshate processing sites, but also in
various waste products from the NORM industry, the radium concentrations may be orders of
magnitudes higher than in average [35, 38, 40].
Radium is the heaviest member of the alkaline earth metals, a group of metals whose lighter
members (Ca and Mg) play a very important role in plant growth and nutrition [41]. As
radium is highly electropositive, it reacts readily with many agents; most of these products are
insoluble. It also co-precipitates with barium and strontium to form insoluble sulfate. Due to
its basic characteristics, it is not easily complexed.
Compared with many other radioelements, little information exists on the uptake of radium
from soil. Among the reported v
F values, large discrepancies are noticeable. Linsalata et al.
[36] reported values ranging from 0.3 × 10⁻⁴
to 0.02. Based on data for a large series of crop
and soil types, IUR [90] ninety-five percent confidence limits range from 2.9 × 10⁻⁴
to 0.12.
Radium has a high affinity for the regular exchange sites of the soil. According to Simon and
Ibrahim [41], organic matter adsorbs about ten times as much radium as clay adsorbs.
Increased exchangeable Ca [41], increasing pH [40], and high soil sulfate content [41] are
reported to decrease the radium transfer factor.
7.3. Lead and Polonium
Uptake of 210
Pb and 210
Po in plants can occur both indirectly through the root system and by
direct deposition from atmosphere [40, 42-45]. The relative importance of these two pathways
depends upon the concentration of the radionuclides in the soil, the soil-plant Fv value, and
the rate of deposition onto above-ground plant parts. One important implication of these
considerations is that activity concentrations in crops, such as roots , tubers, cereals, and
legumes, where the edible portion is protected by inedible plant parts, should not be
129
significantly affected by direct deposition. For leafy vegetables, observed concentrations may
be up to 3-5 times higher due to deposition effects. The 210
Pb and 210
Po content of soils varies
with soil type. For example, Berger et al. [43] observed that the content was three times
higher in organic soils than in mineral soils. Several sources have reported that
superphosphate fertilizers contain significant concentrations of 210
Pb and 210
Po, which can
provide a source of these radionuclides to plants [46-47].
7.4. Thorium
Thorium occurs naturally in the Earth’s crust at an average background concentration of 8–12
mg kg-1
. The typical concentration range of Th in soils is 2–12 mg kg-1
with an average value
of 6 mg kg-1
[11, 37, 46]. In solution, thorium shows only the +4 oxidation state Because of
its high charge, Th4+
may be strongly adsorbed from a solution by natural ion exchangers. It
has been reported that the Th content of soil is normally higher for a higher clay content of the
soil. It was shown [47] that the Th ion is largely hydrolyzed at pH values above 3.2, and that
hydroxyl complexes are involved in the sorption process. The adsorption of Th on clays,
oxides, and organic matter increases with increasing pH and reaches a maximum at a pH of
6.5 [47]. On the other hand, it has been suggested [48] that the mobility of Th in soil may be
less affected by soil pH than by soil organic matter.
7.5. Plutonium
Plutonium is a product of the nuclear fuel cycle, and exists primarily in the +4 state under
normal environmental conditions. Depending on the waste release scenario, plutonium can
enter the environment as a refractory oxide, with low solubility and slow conversion kinetics,
or as more reactive/mobile forms, including nitrates, carbonates, and hydroxides. Plutonium
behavior and transport characteristics vary with both contaminant levels and form [8, 10, 49].
Overall, v
F values for plutonium are in the range of about 10-3
to about 10-10
. This relatively
low availability and low transport potential likely arises from the propensity of Pu to undergo
hydrolysis and from strong sorption to soil solids [50]. With plutonium, a serious
consideration is the relative role of contaminant form with respect to plant availability [53].
The relative bioavailability/uptakes of nitrate versus oxide forms were 7.5 and >10 for
leaves/stems and seeds of barley, and 7.7 and >10 for pea leaves and seed, respectively [51].
The normal hydrolyzed nature of Pu(IV) was not evident for plutonium transported from root
to all aerial tissues. The oxidation-reduction potential and acidity of the soil may significantly
influence the mobility of plutonium [50].
7.6. Neptunium
Among the actinides, neptunium has a rather unique environmental chemistry. Although
neptunium can exist in many oxidation states, NpO2+ appears to dominate [8, 52, 54, 55]. This
chemical preference may account for the mobility and plant availability of neptunium. Not
many soil/plant data are available for neptunium. In a large multi-year field lysimeter study,
the relative ratio of Np/Pu in specific plants and tissues, as a measure of plant availability,
was calculated [51]. The relative availability of neptunium, compared with plutonium, was
1200 and 1500 for cheatgrass and alfalfa leaves; 7500 and 43 000 for barley stem/leaves and
seed; and 3500 and 370 000 for pea leaves and seed, respectively [52-53].

130
7.7. Americium
Americium is likely to occur in the environment as III and/or IV valence form. This would be
relatively consistent with the biological behavior of the actinides, and mean Fv values for
actinides can be presented as follows: Np>Cm>Am>Pu. Fv values for americium have
generally been confined to laboratory studies [51]. The reported range in Fv is 10-6
to 10-1
. It
is difficult to assess the reasons for the seemingly broad range, but it likely results from
differences in contaminant source chemistry, amendment levels, and amendment methods.
This said, there are some useful and reasonably consistent field evaluations. Livens et al. [50]
reported Fv of 1.7 × 10⁻⁴
for mixed vegetation from an estuary impacted by a reprocessing site
in the UK. On the whole, it would appear that americium transfer to plants is factor of 10 to
100-fold higher than for plutonium [8, 10].
7.8. Curium
As for americium, the environmental form of curium is likely the III and/or IV valence forms.
Curium, like americium, has not been sufficiently studied to fully delineate the role of
contaminant form and biological/soil factors on speciation and bioavailability. However, like
americium, it appears that overall plant availability is a factor of 10 or more greater than for
plutonium [8, 10].
7.9. Strontium
Natural strontium consists of 4 stable isotopes with mass numbers 84, 86, 87, 88. The average
content of stable Sr in the earth’s crust is 3.4 × 10⁻²
%. Among the fission products are two Sr
radioisotopes: 90
Sr, (2/1
T = 28.1 years), and 89
Sr (2/1
T = 50.5 days). The chemical properties of
strontium are typical for alkali-earth elements. Strontium is considered a highly mobile and
bioavailable element [1, 5, 7, 10].
Strontium exists in the environment in the Sr(II) oxidation state. The total concentration range
in soils is between 50 and 1000 mg/kg. Strontium is usually present in the surface
environment as a carbonate or a sulfate mineral. As a result of nuclear-weapons testing, 90
Sr is
distributed widely in the biosphere [56]. The chemistries of strontium and calcium are closely
related [57-59]. The dominant aqueous strontium species in natural waters over a broad pH
range (2 to 9) is the free divalent Sr2+
species.
The solubility of Sr2+
is not greatly affected by the presence of most inorganic anions, because
Sr2+
forms only weak aqueous complexes with CO32-
, SO42-
, Cl-, and NO3
-. However, large
concentrations of SO42-
or elevated alkalinity could play an important role in strontium
mobility. Since strontium and calcium form humic acid complexes of similar stability [60-61],
strontium should not effectively compete with calcium for humic acid ligands because
calcium is typically present at much greater concentrations.
Strontium is one of the most bioavailable elements. Plants incorporate from 0.2% to 3% of the
strontium in the soil [59, 62]. The transfer of 90
Sr from soil to plants is affected by the
presence of stable strontium and its chemical analogue, calcium, in the system [7, 21, 59, 62,
63]. This factor is believed to be the main contributor to variability in Fv values.
The basic mechanism of absorption of Sr by soil is ion exchange. Strontium uptake by plants,
in general, is greatest from soils of low calcium content and, in many cases, of high organic
matter content. Strontium Fv values can differ by more than a factor of 100, depending on soil

131
properties and biological features of plants. A decrease in exchangable strontium in soil does
occur, but only very slowly [21]. Therefore, the availability to plants of soil 90
Sr decreases
only slightly with time [64, 65].
7.10. Caesium
Among the numerous fission products of 235
U, the radioactive isotope 137
Cs, is of great
importance, generated with a large fission yield (6.2%) and having a relatively long half-life
(30.17 years) [56]. During 235
U fission, in addition to 137
Cs, 12 more isotopes of Cs are
formed. However, almost all these are short-lived, except for 134
Cs (Т1/2=2.06 years), and very
long-lived 135
Cs (2/1
T =2.3·106 years). The stable isotope
133Cs
serves a source of formation of
radioactive 134
Cs by a (n, γ) reaction.
A peculiar feature of 137
Cs is its high biological mobility, caused by the fact that it is a
radioisotope of an alkali element, which is a chemical analogue of a biochemically important
element – K [1, 62, 66-67]. Caesium exists in the environment in the 1+ oxidation state.
Stable caesium is ubiquitous in the environment with a crustal abundance of approximately
3.2 mg/kg; in soils, caesium concentrations range between 0.3 and 25 mg/kg.
The dominant aqueous species in soil and aquatic systems is thought to be free Cs+. The Cs
+
ion forms only extremely weak aqueous complexes with SO4-2
, Cl- , and NO3
-, and the
formation of inorganic complexes is not believed to be a major influence on caesium
speciation [7]. Sorption of caesium to organic colloids should follow a relationship similar to
that to dissolved organic humic materials and, as a result, should not be an important sink for
caesium in most soils [60]. It has been frequently demonstrated that caesium becomes
associated with the clay mineral fraction of soils [68]. The association of caesium with clay
minerals is characterized by a high selectivity. An important feature of the behavior of Cs
isotopes is their ability for non-exchangeable sorption (fixation) by the soil solid phase [68,
69].
Accumulation of 137
Cs in plants depends on soil properties and decreases with increasing
cation exchangeable capacity and clay fraction, with the concentrations of competing cations
exerting a modifying effect [1]. Cs mobility is marked in peat and sandy soils. As noted
above, caesium is an alkaline element, and its chemical analogue is potassium. With an
increase of potassium concentration in soil, Cs accumulation by plants is decreased [7, 62, 66,
67]. The behaviour of caesium in soil is characterised by selective, irreversible absoption by
micaceous clay minerals; as a result, over time, caesium mobility decreases considerably. On
average, caesium Fv values are a factor of 2-10 lower than those of strontium [7, 65, 70, 71].
Fv values for caesium vary from about 10-3
up to about 1.0 [1, 62, 72-75]. For meadow
grasses Fv values ranged from 0.5 to 33 in Chernobyl affected areas [70].
7.11. Iodine
Stable iodine (127
I) is present in soils at an average concentration of 5 mg/kg [10]. Typical
terrestrial plants and food crops contain from 0.07 to 10 mg/kg of stable 127
I. The natural ratio
of 129
I to 127
I is 10-14
, and it can be assumed that these two isotopes mimic each other, unless
there is a contribution to129
I concentrations from nuclear activities. It has long been believed
that the dominant species in the aerobic soil environment are I- and IO3
-, and I2, and methyl
iodine for the marine system [10, 77].
132
Iodine Fv values vary from 0.1 to 5.0 for vegetative mass and from 0.5 × 10⁻³
up to 7.0 × 10⁻²
for generative parts. Accumulation of iodine depends on soil properties [76, 77]. High cation
exchange capacity and organic matter content decrease Fv values for iodine Iodine transfers
from soil-to-grain of rye and wheat are characterized by Fv values from 5 × 10⁻⁴
to 8 × 10⁻³
.
Studies by Garland et al. [74] at various locations adjacent to a fuel reprocessing site showed
a marked difference in the transfers of 127
I and 129
I from soil to plants. In these studies, v
F
values for 127
I were calculated as 0.08, 1.2, 0.22, 0.2, 0.38, and 0.23 for tumble mustard,
sagebrush leaves, Russian knapweed, and willow leaves, asparagus, and cottonwood leaves,
respectively, while for 129
I, these values were as follows: 0.64, 1.0, 4.1, 0.5, 3.7, and 1.5. This
would indicate that 127
I and 129
I were not showing similar behaviour, with a factor of 5-10
greater availability for 129
I, except for sagebrush leaves.
The potential volatile component of the iodine cycle has been investigated [10]. A series of
nine soils was used; 129
I concentrations ranged from 0.17 to 23 pg/g. The soils were planted
with soybeans, maintained in a closed growth chamber, and harvested after 21 days. Analysis
of the plant tissues indicated that, although there was a factor of 135-fold difference in soil
concentrations, each plant had a similar 129
I content, ranging from 62 to 85 pg/g tissue, and
that there must be a volatile I component accounting for the loss. Analysis of volatile iodine
components (both organic and inorganic) from the gas phases of 125
I amended soils and plants
grown on contaminated soils, showed the presence of a significant organic iodine cycle. Total
volatiles represented 0.028% for soils and 0.12% for plants; 75% of the volatile releases were
organic in nature [10].
7.12. Ruthenium and Cerium
Natural ruthenium consists of 7 stable isotopes with mass numbers of 96, 98 to 102 and104.
The content of stable Ru in the earth’s crust is 5.0 × 10⁻⁷
%. Radiologically, the most
important Ru isotopes are 103
Ru and 106
Ru. Ruthenium, an element of group VIII of the
periodic system, has a high coordinative ability compared with other long-lived nuclear
fission products [56, 78-82]. Therefore, in soil solution, Ru is practically always in the form
of complex compounds, which contain oxo-groups with multiple bonds.
The number of Ru chemical forms in solution is noticeably increased due to the relatively
high Ru tendency to hydrolysis [79]. In nitric acid, sulphuric acid, and hydrochloric acid
solutions, the tetravalent state is typical for Ru. In the presence of deoxidants, the tri- and
even the bi-valent state may be dominant.
Of crucial importance in Ru fixation on and distribution in soil constituents are the redox
regime of the soil, the presence in soil of organic and inorganic ligands, and soil solution pH
[79, 83]. Ru has 9 oxidation states. The fact that in the periodic table it is positioned in the
group under Fe dictates a certain degree of chemical similarity with this element. In its
heptavalent form, Ru resembles properties of Mn7+
, Te7+
and Re7+
.
The properties of trivalent Ru compounds closely resemble the behavior of Co3+
, Rh 3+
, and
Ir3+
. In soil solutions, Ru can be present in both cationic and anionic forms. Anionic forms of 106
Ru are more mobile, whereas cationic forms are readily sorbed by the soil solid phase. The
absorbed 106
Ru does not enter significantly into ionic exchange reactions, as is shown by low
desorption of the radionuclide by salt solutions and the absence of dependence on
concentrations or charges of competing cations.

133
Since 144
Ce and 106
Ru are not analogues of biologically essential elements and are in soil in
the sorbed state, their uptake by plants is low compared with 90
Sr and 137
Cs [81]. Up to 99%
of the total content of 144
Ce and 106
Ru radionuclides taken up by plants is retained by the root
system, and only a very small amount is accumulated in the above-ground mass [80-81].
Among moderate to long-lived fission products, 106
Ru, and especially 144
Ce, are two of the
least available for plant uptake.
Uptake by plants of these radionuclides from soddy-podzolic sandy loam soil is much higher
than from chernozem [81]. Plant accumulation of 144
Ce is greatly influenced by soil solution
reactions. Results of greenhouse experiments with a crop grown in solution [83] demonstrate
that the maximum uptake of nuclides is observed at a pH of solution close to neutral values.
With pH variation from 4.5 to 8.5, 106
Ru accumulation in plants varies by a factor of 2–4 [78].
7.13. Niobium
Niobium is estimated to be present in surface soils at approximately 10 ppm [10]. Plant
concentrations are believed to be in the range of 0.3 ppm. Nb is generally present in its +V
oxidation state but it can also occur under the valence +II, +III and +IV. Tyler and Olsson
[83] reported Fv of 0.38 to 1.2 and 0.005 to 0.04 for roots and shoots of Agrostis capillaris,
respectively. Gerzabek et al. (1994) [84] reported distinctly lower Fv for a study with a
Dystric Cambisol (pH 6.4) and a Calcic Chernozem (pH 8.2). Lowest Fv values were
observed for bean pods (<0.0012-0.0017), then rape (0.0014-0.0025) and highest Fv values
were reported for bean-shoots (0.0069-0.013). The lower Fv values were obtained for the
Calcic Chernozem, attributed to a higher chelating ability of the organic matter due to the
higher pH.
7.14. Cobalt
Cobalt is a chemical element of group VIII in the periodic system.The most common
oxidation states of cobalt are +3 and +2 [84-86]. It occurs in different valences, is readily
hydrolysed, and tends to form complexes with organic and inorganic matter. In nature,
compounds of bivalent cobalt prevail, and trivalent compounds are much less often
encountered [83].
The migration capacity of 60
Со depends on its form in solution and characteristics of the
migration environment including the following: acidity, ground sorption properties, presence
of agents for complex formation, and concentrations of chemical analogues [84, 87]. The
migration ability of cobalt is particularly influenced by versene (a sodium salt of ethylene
diamine tetraacetic acid EDTA), which forms a complex anion of bivalent cobalt, СоIIEDTA
2,
a stable compound [60-61, 78].
Со-60 concentration ratios vary widely, from 2.5 × 10⁻⁴
to 9.3 × 10⁻¹
[85-86]. The smallest
concentration ratios have been obtained for heavy textured soils (for example, chernozem)
and peaty soils, and the largest have been found for sandy soils [87].
7.15. Copper and Zinc
Copper is an element of a secondary subgroup of group I in the Mendeleev Periodic System.
Cu+2
is the most mobile form of Cu, but other ionic forms can also be found in soils [1, 34].
Aluminium and iron hydroxides, carbonates, and clay aluminosilicates have a high sorption
power for Cu. The key reactions governing Cu behavior in most soils are chelation and
complexation. Humic and fulvic acids are capable of forming stable complexes with Cu.
134
Adsorption of Cu ionic forms is pH dependent [87]. Solubility of different Cu forms in soil
decreases with pH and approaches zero at pH 8.
The predominant and most mobile Zn form in soil is Zn2+
. The most crucial factors
responsible for Zn mobility in soils is the content of clay minerals, hydroxides Fe and A1, and
pH value; not so important is organic complexing and Zn sedimentation in the form of
hydroxides, carbonates, and sulphides [1, 34]. Zn is most mobile and bioavailable in acid light
mineral soils.
Zn ions are sorbed by organic matter and clay particles, with cation exchange being observed
at pH <7 and precipitation at pH >7. Some 24-63% of the total Zn content in soil is bound to
clay minerals and 14-38% is bound to hydroxides Fe and Al. Zn adsorption on hydroxides Fe
and Mn starts from pH 5 and increases as acidity decreases. Organic matter influences Zn
sorption to a much lesser extent. Iron hydroxides sorb Zn 1.5-2 times stronger than humic
acids. Organic matter binds Zn into stable forms; as a result, Zn accumulation is observed in
the organic horizons of soils and peat.
7.16. Nickel
The predominant form of nickel is Ni+2
[10. 34]. Global soil concentration for nickel averages
50 ppm. Relatively few studies directed at v
F values have been conducted, but nickel has
been extensively studied in plants because it is an essential element, and it has a high
absorption rate by plants. Tyler and Olsson [83] reported v
F values of 0.46 to 1.39 and 0.13 to
0.29 for, respectively, roots and shoots of Agrostis capillaries. Cataldo et. al. (1978) studied
root transport of nickel [88]. Frissel and Bergeijk (1989) reported a value of 0.51 for clover
[90). Gerzabek et al. (1994) observed values of 0.08 and 0.29 for rape, of 0.43 and 0.56 for
bean shoot and of 1.77 and 3.63 for bean pods [84].
REFERENCES
[1] Agricultural Radioecology. (R.M. ALEXAKHIN, N.A, KORNEEV. Eds.) Moscow (1992) (in Russian).
[2] INTERNATIONAL UNION OF RADIOECOLOGY, Assessing the Radiological Impact of Releases of Radionuclides to the Environment: Radioecology. Radioactivity and Ecosystems (VAN DER STRICHT, E., KIRCHMAN, R., EDS), Fortems, Liege (2001) 1-30
[3] EVANS, E.J., DEKKER, A.J., Plant uptake of 137
Cs from nine Canadian soils, Journal of Soil Science 46 (1966) 167-176.
[4] GULYAKIN, I.V., YUDINTSEVA, E.B., Radioactive fission products in soils and plants. M.
Gosatomizdat (1962) (in Russian)
[5] Soil-to-Plant Concentration Factors for Radiological Assessments, Final report, Y.C. Ng, S.E. Thompson, C.S. Colsher, Lawrence Livermore national Laboratory. National Technical
Information Service. NUREG/CR-2975 UCID-19463, (1982) 132.
[6] STAVEN, L.H., RHOADS, K., NAPIER, B.A., STRENGE, D.L., A Compendium of Transfer Factors for Agricultural and Animal Products,. PNNL-13421. The U.S. Department of Energy.
Washington, (2003) 16.
[7] YUDINTSEVA, E.V., GULYAKIN, I.V., Agrochemistry of radioactive isotopes of strontium and caesium, Atomizdat. (1968) 472 (in Russian)
[8] Environmental Research on Actinide Elements, (J.E. PINDER III, J.J. ALBERTS, K.W. MCLEOD, R.G. SCHRECKHISE Eds.) CONF-841142 (DE86006713) U.S. DOE OHER Symposium Series 59. (1987).
[9] HILTON, J., CAMBRAY, R.S., GREEN, N., Fractionation of radioactive caesium in airborne particles containing bomb fallout, Chernobyl fallout and atmospheric material from the Selafield site. Journal of Environmental Radioactivity 15 (1992) 103-108.

135
[10] Literature Review and Assessment of Plant and Animal Transfer Factors Used in Performance
Assessment Modelling, U.S. Nuclear Regulatory Commission Office of Nuclear Regulatory Research. Washington, DC 20555-0001. (2003) 170.
[11] EWERS, L.W., HAM, G.J., WILKINS, B.T., Review of the Transfer of Naturally Occurring Radionuclides to Terrestrial Plants and Domestic Animals, NRPB-W49. Chilton. Didcot, UK (2003) 64.
[12] KONOPLEV, A.V., BULGAKOV, A.A., POPOV, V.E., TS. I. BOBOVNIKOVA., Behaviour of long-lived Chernobyl radionuclides in soil-water system, Annalist 117 (1992) 1041-1047.
[13] FESENKO, S.V., SPIRIDONOV, S.I., SANZHAROVA, N.I., ALEXAKHIN, R.M., Dynamics of 137Cs bioavailability in a soil-plant system in areas of the Chernobyl Nuclear Power Plant
accident zone with a different physicochemical composition of radioactive fallout, Journal of Environmental Radioactivity 34 (1996) 287-313.
[14] KROUGLOV, S.V., FILIPAS, A.S., ALEXAKHIN, R.M., ARKHIPOV, N.P., Long-Term Study on the Transfer of 137Cs and
90Sr from Chernobyl-Contaminated Soils to Grain Crops,
Journal of Environmental Radioactivity 34(3) (1997) 267-286.
[15] SANZHAROVA, N.I., FESENKO, S.V., ALEXAKHIN, R.M., ANISIMOV, V.S, KUZNETSOV, V.K., CHERNYAYEVA, L.G., Changes in the forms of 137
Cs and its availability for plants as dependent on properties of fallout after the Chernobyl nuclear power
plant accident, Science of the Total Environment 154 (1994) 9-22.
[16] MOISEEV, I.T., TIKHOMIROV, F.A., ALEXAKHIN, R.M., RERICH, L.F., Influence of soil properties and time on 137Cs forms dynamic and availability for plants, Agrohimiya 8 (1982)
109-113 (in Russian).
[17] EVANS, E.J., DEKKER, A.J., The fixation and plant recovery of 137
Cs, Soil Science 107/3 (1969) 175-180.
[18] BAKUNOV, N.A., YUDINTSEVA, E.B., To question about decrease 137
Cs accumulation by plant after application of natural sorbents, Agrohimiya 6 (1989) 90-96 (in Russian).
[19] NISHITA, H., HAUG R.M., HAMILTON, M., Influence of minerals on 90
Sr and 137
Cs uptake by bean plants, Soil Science 105/4 (1968) 237–243.
[20] SANZHAROVA, N.I., FESENKO, S.V., ALEXAKHIN, R.M., ABRAMOVA, T.N., KUZNETSOV, V.K., Estimation of the factors determining the dynamics of contamination of agricultural production after the accident at Chernobyl NPP, Radiazionnaya biologiya.
Radioecologiya, 35/3 (1995) 307-315 (in Russian).
[21] ARKHIPOV, A.N., Behavior of 90
Sr and 137
Cs in agroecosystems of the restriction zone of the Chernobyl NPP, Candidate thesis, Obninsk (1995) 26 (in Russian).
[22] MENZEL, R.G., Competitive uptake by plants of potassium, rubidium, caesium, calcium, strontium and barium from soils. Soil Science, 77 (6), (1954) 419-425.
[23] GULYAKIN, I.V., YUDINTZEVA, E.V., GORINA, L.I., 137
Cs accumulation by plant yield as
result of specific features, Agrohimiya 7 (1975) 12-19 (in Russian).
[24] KUZNETSOV, V.K, SANZHAROVA, N.I., Influence of specific and variety features of the in plant yield on 137Cs accumulation from sod-podzolic and chernozem soils, Agricultural Biology
1 (2000) 374-383 (in Russian).
[25] BONDAR, P.F., LOSCHILOV, N.A., TERESCHENKO, N.P., MASLO, A.V. “Quantitative characteristics radiocaesium accumulation in crop yield from soddy podzolic soils of Ukrainian
Polessie”, Problems of Agricultural Radiology, 3, Kiev (1993) 83-93 (in Russian).
[26] Radioecology of Irrigation Farming (ALEXAKHIN, R.M. Ed.), Energoatomizdat, Moscow (1985) 224 (in Russian)
[27] ALEXAKHIN, R.M., Countermeasures in agricultural production as an effective means of mitigating the radiological consequences of the Chernobyl accident. Science of the Total Environment 137 (1993) 9-20
[28] BOGDEVITCH, I.M, Guide for Agricultural Practice on Lands Contaminated by Radionuclides in the Republic of Belarus for 1997-2000, Minsk (1997) 76.
[29] FESENKO, S.V., ALEXAKHIN, R.M., BALONOV, M. I., BOGDEVITCH, I.M., HOWARD, B.J., KASHPAROV, V.A., SANZHAROVA, N.I., PANOV, A.V., VOIGT, G., ZHUCHENKA,

136
Y.M., An extended critical review of twenty years of countermeasures used in agriculture after
the Chernobyl accident, Science of the Total Environment 383(1-3) (2007) 1-24.
[30] FESENKO, S.V., SANZHAROVA, N.I., ALEXAKHIN, R.M., Assessment of the efficiency of
countermeasures in a long term after the accident at the Chernobyl NPP, Radiation Biology. Radioecology 3 (1998) 721-736 (in Russian).
[31] PRISTER, B.S., Guide for Agricultural Practice on Radioactive Contaminated Territories of
Ukraine after accident on Chernobyl NPP for 1999-2002. Ed. Prister B.S. Kiev (1998) 104 (in Russian).
[32] STATE COMMISSION OF THE USSR, Recommendation of Farming in Conditions of
Radioactive Contamination of Territory as a result of the Chernobyl accident for the period of 1991-1995. M.: State Commission of the USSR Council of Ministers on Food and Purchases, 1991 57 (in Russian).
[33] VANDENHOVE H., ZEEVAERT, TH., BOUSHER A., JACKSON D., LAMBERS B., HEDEMANN JENSEN, P., Investigation of a possible basis for a common approach with regard to the restoration of areas affected by lasting radiation exposure as a result of past or old
practice or work activity–CARE, Final report for EC-DG XI-project 96-ET-006, Radiation Protection 115, European Communities, Luxembourg, Office for Official Publication, Belgium,
(2000). 238.
[34] Trace Elements in Soil and Plants (KABATA-PENDIAS, A., AND PENDIAS, H. Eds.), Lewis Publishers, Inc. (2000).
[35] RIBERA D., LABROT F., TISNERAT G. AND NARBONNE J.-F., Uranium in the environment: Occurrence, transfer and biological effects, Review on Environmental Contamination and Toxicology, 146 (1996) 53-89.
[36] LINSALATA, P., MORES, R.S., FORD, H., EISENBUD, M., PENNA FRANCA E., DE CASTRO M.B. LOBAO, N. SACHETT, I., CARLOS. M., An assessment of soil-to-plant concentration ratios for some natural analogues of the transuranic elements, Health Physics
56(1) 1989) 33-46.
[37] MORTVEDT, J.J. Plant and soil relationship of uranium and thorium decay series radionuclides–A review, Journal of Environmental Quality 23 (1994) 643-650.
[38] IBRAHIM, S.A., AND WHICKER, F.W. Comparative uptake of U and Th by native plants at a U production site. Health Physics 54 (4) (1988) 413-419.
[39] NATHWANI, J.S., PHILLIPS, C.R. Adsorption of Ra-226 by soils (I). Chemosphere 5 (1979) 285-291.
[40] PETTERSSON, H.B.L., HALLSTADIUS, L., HEDVALL, R., AND HOLM, E., Radioecology in the vicinity of prospected uranium mining sites in the subarctic environment, Journal of Environmental Radioactivity, 6 (1988) 25-40.
[41] SIMON, S.L., AND IBRAHIM, S.A., The soil/plant concentration ratio for calcium, radium, lead and polonium: Evidence for non-linearity with reference to substrate concentration, Journal of Environmental Radioactivity 5 (1987)123-142.
[42] PIETRZAK-FLIS Z., AND SKOWROFISKA, M.,. Transfer of 210
Pb and 210
Po to plants via root system and above-ground interception, Science of the Total Environment 162 (1995) 139-147.
[43] BERGER, K.C., EARHARDT, W.H. AND FRANCIS, C.W., , 210
Po analyses of vegetables,
cured and uncured tobacco and associated soils, Science 150 (1965) 1738-1739.
[44] AMARAL, E.C.S., ROCHEDO, E.R.R., PARETZKE, H.G. AND FRANCA, E.P. The radiological impact of agricultural activities in an area of high natural radioactivity, Radiation
Protection Dosimetry 45 (1992) 289-292.
[45] SANTOS, P.L., GOUVEA, R.C. AND DUTRA, I.R., Accumulation of 210
Pb in foodstuffs cultivated in farms around the Brazilian mining and milling facilities on Poços de Caldas
Plateau, Journal of Environmental Radioactivity 11 (1989) 141-149.
[46] HARMSEN, K. AND DE HAAN, F.A.M., Occurrence and behaviour of uranium and thorium in soil and water, Netherland Journal of Agricultural Sciences 28 (1980) 40-62.
[47] SYED, H.S., Comparison studies adsorption of thorium and uranium on pure clay minerals and local Malaysian soil sediments, Journal of Radioanalytical Nuclear Chemistry 241 (1) (1999) 11-14.

137
[48] HUNSEN, R.O. and HUNTINGTON, G.L. (1969), Thorium movements in morainal soils of the
high Sierra, California. Soil Science, 108, 257-265.
[49] ALLARD B., OLOFSSON U. AND TORSTENFELT, B., Environmental actinide chemistry, Inorganic Chemistry Acta 94 (1984) 205-221.
[50] LIVENS F.R., HORRILL A.D., SINGLETON D.L., The relationship between concentrations of Pu and Am in soil interstitial waters and their uptake by plants Science of the Total Environment 155 (1994) 151-159.
[51] SCHRECKHISE R.G., CLINE J.F., Comparative uptake and distribution of plutonium, americium, curium and neptunium in four plant species, Health Physics 38 (1980) 817-824.
[52] CATALDO, D.A., GARLAND, T.R., WILDUNG, R.E, Absorption, distribution and chemical forms of Np in plants, Journal of Agricultural and Food Chemistry 36 (1988) 657-662.
[53] SOKOLIK, G.A., OVSIANNIKOVA, S.V., IVANOVA, T.G., LEINOVA, S.L. Soil-plant transfer of plutonium and americium in contaminated regions of Belarus after the Chernobyl catastrophe. Environment International 30 (7) (2004) 939-947.
[54] NISHITA H., WALLACE A., ROMNEY E.M., SCHULTZ R.K., Effect of soil type on the extractability of Np, Pu, Am and Cm as a function of pH, Soil Science 132 (1981) 25-34.
[55] FRISSEL, M. J.,. An update of the recommended soil-to-plant transfer factors of 90
Sr, 137
Cs and
transuranics, 8th Report of the Working Group Meeting on Soil-to-Plant Transfer Factors, IUR
Madrid (1992) 16-25.
[56] PAVLOTZKAYA, F.I. Migration of radioactive products of global fission in soils, M.
Atomizdat (1974) 215 (in Russian).
[57] COMAR, C.L., WASSERMAN, NOLD, M.M., Strontium-calcium discrimination factors in the rat, Proc. Society Experimental Biology and Medicine 92 (1956) 859.
[58] MENZEL, R.G., Factors influencing the biological availability of radionuclides for plants, Federation Proceedings. Federation of American Societies for Experimental Biology 22 (1963) 1398-1401.
[59] ARKHIPOV N.P., EGOROV A.V., KLECHLOVSKEY V.M., Estimation of 90
Sr transfer from soil to plant and its accumulation in crop, Dokladu VASHNIL 1 (1969) 2–4 (in Russian).
[60] STEVENSON, F.J. FITCH, A. Chemistry of Complexation of Metal Ions with Soil Solution Organics. Eds. P.M. Huang and M. Schnitzer. In: Interaction of Soil minerls with Natural
Organics and Microbes, SSSa Special Publication, Soil Science Society of America Journal 17 Madison, WI. (1986).
[61] BOVARD P., GRAUBY A., SASS A. “Chelating effects of organic matter and its influence on the migration of fission products” Proc. of Symposium: Isotopes and Radiation in Soil Organic – Matter Studies, CONF-680725, STI/PUB-190 (CONF-680725), NSA. IAEA, Vienna (1968)
471-495.
[62] NISBET, A.F., WOODMAN, R.F.M., Soil-to-plant transfer factors for radiocaesium and radiostrontium in agricultural systems, Health Physics 78 (3) (2000) 279-288.
[63] KORNEYEV, N.A., FIRSAKOVA, S.K. MALYSHEVA, M.D., Uptake of strontium-90 by meadow grasses from different soil types of the non-chernozemic zone, Pochvovedenie 11 (1975) 53-59. (in Russian)
[64] KASHPAROV, V.A., OUGHTON, D.H., PROTSAK, V.P., ZVARISCH, S.I., PROTSAK, V.P., LEVCHUK, S.E.,. Kinetics of fuel particle weathering and 90Sr mobility in the Chernobyl 30 km exclusion zone, Health Physics 76 (1999) 251-259.
[65] CLINE, J.F., Aging effects of the availability of strontium and cesium to plants. Health Physics 23 (1981) 317-324.
[66] YUDINTSEVA, E.V., LEVINA, E.М.,. Role of potassium in availability of 137
Cs for plants, Agrohimiya 4 (1982) 75–81 (in Russian).
[67] SIMON, S.L., GRAHAM, J.C., AND TERP, S.D., Uptake of 40
K and 137
Cs in native plants of the Marshall Islands. Journal of Environmental Radioactivity 59 (2002) 223-243.
[68] SAWNEY B. L., Sorption and fixation of microquantities of caesium by clay minerals: effect of
saturating cations, Soil Science Society of America Journal Continues: Soil Science Society of America.Proceedings 28 (1964) 183-186.
138
[69] SMOLDERS, E., Some principles behind the selection of crops to minimise radionuclide uptake
from soil, Science of the Total Environment 137 (1993) 135-146.
[70] SANZHAROVA, N.I., BELLI, M., ARKHIPOV, A.N., IVANOVA, T.G., FESENKO, S.V., PEREPELYATNIKOV, G.P., TSVETNOVA, O., Radionuclide transfer to meadow plants. The
radiological consequences of the Chernobyl accident. Proceedings of the first international conferenceсe, Minsk, Belarus, 18-22 March 1996, 507-510 (in Russian).
[71] GULYAKIN, I.V., YUDINTSEVA, E.V., Agricultural radiobiology, M., “Kolos”. (1973) 272 (in Russian).
[72] SCHULLER, P., LOVERGREEN, C., HANDL, H., 137
Сs concentration in soil Prairie plants, and milk from sites in Southern Chile, Heath Physics 64 (1993) 157-161.
[73] VOIGT, G., PROHL, G., MUELLER, H., Experiments on the seasonality of caesium translocation in cereals, potatoes, and vegetables, Radiation and Environmental Biophysics 30 (1991) 295-304.
[74] GARLAND, T.R., CATALDO, D.A., MCFADDEN, K.M., SCHRECKHISE, R.G., WILDUNG, R.E., Comparative behavior of 99Tc,
129I,
127I and
137Cs in the environment adjacent
to a fuel reprocessing facility, Health Physics 44 (1983) 658-662.
[75] CARINI, F., Radionuclide transfer from soil to fruit, Journal of Environmental Radioactivity 52 (2001) 237-279.
[76] PRISTER, B.P., GRIGORIEVA, T.A. AND PEREVEZENTSEV, V.M., Iodine behavior in the soil-plant system, Agrohimiya 3 (1979) 93-99 (in Russian).
[77] CLINE, J.F., KLEPPER, E.L., Iodine-125 accumulation in plant parts: Influence of water use rate and stable iodine content of soil, Health Physics 28, (1975) 801-804.
[78] MOLCHANOVA, I.V., KULIKOV, N.V., Radioactive isotopes in soil-plant systems, M.,
“Atomizdat”. (1972) 82 (in Russian).
[79] SEDDON, E.A., SEDDON, K.R., The chemistry of ruthenium. (1984)
[80] KLEHKOVSKEY, V.M., GULYAKIN, I.V., Behaviour of strontium, caesium, ruthenium and zirconium in soil and plants, Pochvovedeneye 3 (1958) 1. (in Russian).
[81] KOTOVA, A.Yu., Dynamic of 90
Sr, 106
Ru, 137
Cs and 144
Ce behavior in soil-plant system, Candidate Thesis, Obninsk (1997) (in Russian).
[82] IL’INA, G.B., RUDKEY, S.G., Study of radioactive fission product accumulation by crops,
Vestnik MGU. Seria: Biologiya, pohvovedenie 1 (1965) 42-52 (in Russian).
[83] TYLER, G. OLSSON, T., Plant uptake of major and minor elements as influenced by soil acidity and liming, Plant and Soil 230 (2001) 307-321.
[84] GERZABEK, M.H., MOHAMAD, S.A., MUCK, K., HORAK, O., 60
Co, 63
Ni and 94
Nb soil-to-plant transfer in pot experiments, Journal of Environmental Radioactivity, 25(3) (1994) 205-212.
[85] GULYAKIN, I.V., YUDINTSEVA, E.V., 60
Co uptake by plants and its accumulation in yield, Doklady USSR Acad. Sci., 123(2) (1958) 368-370.
[86] YUDINTSEVA, E.V., FILIPAS, N.A., RATNIKOV, A.N., VOSTRIKOVA, O.A., Effects of soil properties on 60Со and
115Cd behavior in the soil-plant system, Agrohimiya 5 (1984) 82-87
(in Russian).
[87] ANISIMOV, V.S., ANISIMOVA, L.N., LOMONOSOVA, N.V., ALEKSAKHIN, R.M, FRIGIDOVA, L.M., KRUGLOV, S.V., BIKOVA, T.A., Effect of loamy soddy-podzolic soil
acidity on the mobility and bioavailability of radionuclides 60Со and 137
Cs and trace elements Co, Cu, Zn, Mn, and Fe, Agrohimiya 7 (2005) 51-58 (in Russian).
[88] CATALDO, D.A., GARLAND, T.R., WILDUNG, R.E, Nickel in Plants: II. Distribution and Chemical Form in Soybean Plamts, Plant Physiology 36 (1978) 566-570.
[89] INTERNATIONAL ATOMIC ENERGY AGENCY. The classification of soil systems on the basis of transfer factors of radionuclides from soil to reference plants. A FAO/IAEA/IUR
Coordinated Research Programme. IAEA, Vienna, (1999).
[90] FRISSEL, M.J., Van BERGEIJK, K.E., “Mean Transfer Values Derived by Simple Statistical Regression Analysis”, VIth Report of the IUR Working group Soil-to-Plant Transfer Factors:
Report of the working group meeting in Guttannen Switzerland Bilthoven, RIVM 240 (1989) 24-26.

139
ROOT UPTAKE: TEMPERATE ENVIRONMENT
N. SANZHAROVA, O. SHUBINA
RIARAE, Russian Institute of Agricultural Radiology & Agroecology,
Obninsk, Russian Federation
H. VANDENHOVE, G. OLYSLAEGERS
SCK•CEN, Belgian Nuclear Research Centre, Mol, Belgium
S. FESENKO
International Atomic Energy Agency, Vienna
Z.R. SHANG Nuclear and Radiation Safety Centre of State Environmental Protection Administration,
Beijing, China
E. REED
SENES Oak Ridge Inc., Center for Risk Analysis, Oak Ridge, United States of America
H. VELASCO
GEA-IMASL – Universidad Nacional de San Luis/Conicet, Argentina
Abstract
Soil-to-plant transfer factor data were compiled based on an extensive literature survey, comprising 1167 information
sources, including international and national databases. In order to decrease the uncertainty associated with soil/plant factors
a special classification schema was developed and soil-to-plant transfer factors were grouped according to the selected plant
and soil categories. Best estimates were generally derived from geometric means calculated for major plants groups and also
for some plant compartments within these groups. For the natural radionuclides 2162 data were recorded and for the artificial
radionuclides - 9390. Most transfer factor data were available for 90Sr, 137Cs, U and Ra. Radionuclide accumulation shows
high variability, which is influenced by properties of radionuclides, soil characteristics, peculiarities of plant species. In
comparison to Technical Reports Series No. 364, information presented in the paper substantially increases the amount of
available data on radionuclide transfer to plants. The data, providing information for specific plant and soil groups, allows
more precise radiological assessments in different areas around the world.
1. INFORMATION SOURCES AND DATA EVALUATION
1.1. Sources of information
The literature review was started through Science Direct, by consideration of references in
earlier reviews on Fv values for natural radionuclides and by considering the references (if
available) from the IAEA coordination research projects [1, 2] and the IUR databases on
radionuclide transfer to plants (Fig. 1). All useful cited references were then evaluated, as
described below, and a new database was created.
With respect to the evaluation of former databases, there was a great similarity between the
IAEA CRP 1998 data base and the IUR-1989 data base, and most of the data in these
databases was included because they were well referenced (but only after having checked the
original references in most of the cases). Use of the RADFLUX database was very limited
because it was not clearly referenced.
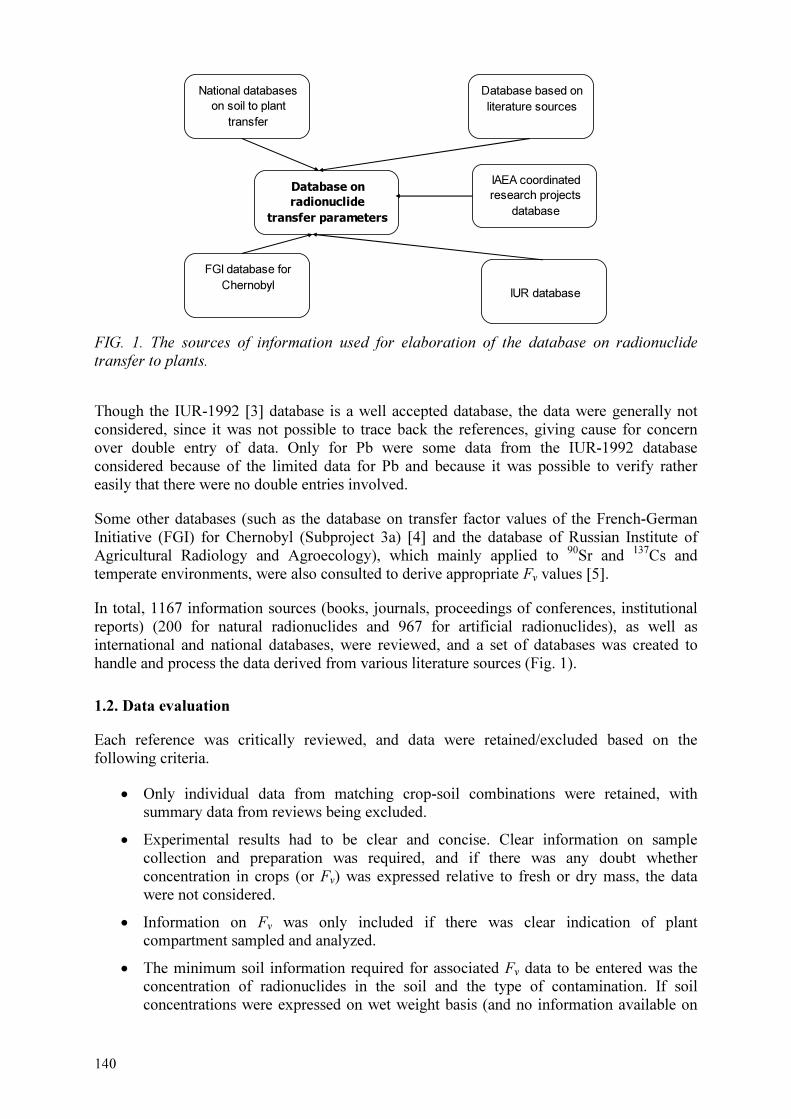
140
National databases
on soil to plant
transfer
Database on
radionuclide
transfer parameters
IAEA coordinated
research projects
database
Database based on
literature sources
IUR database
FGI database for
Chernobyl
FIG. 1. The sources of information used for elaboration of the database on radionuclide
transfer to plants.
Though the IUR-1992 [3] database is a well accepted database, the data were generally not
considered, since it was not possible to trace back the references, giving cause for concern
over double entry of data. Only for Pb were some data from the IUR-1992 database
considered because of the limited data for Pb and because it was possible to verify rather
easily that there were no double entries involved.
Some other databases (such as the database on transfer factor values of the French-German
Initiative (FGI) for Chernobyl (Subproject 3a) [4] and the database of Russian Institute of
Agricultural Radiology and Agroecology), which mainly applied to 90
Sr and 137
Cs and
temperate environments, were also consulted to derive appropriate Fv values [5].
In total, 1167 information sources (books, journals, proceedings of conferences, institutional
reports) (200 for natural radionuclides and 967 for artificial radionuclides), as well as
international and national databases, were reviewed, and a set of databases was created to
handle and process the data derived from various literature sources (Fig. 1).
1.2. Data evaluation
Each reference was critically reviewed, and data were retained/excluded based on the
following criteria.
• Only individual data from matching crop-soil combinations were retained, with
summary data from reviews being excluded.
• Experimental results had to be clear and concise. Clear information on sample
collection and preparation was required, and if there was any doubt whether
concentration in crops (or Fv) was expressed relative to fresh or dry mass, the data
were not considered.
• Information on Fv was only included if there was clear indication of plant
compartment sampled and analyzed.
• The minimum soil information required for associated Fv data to be entered was the
concentration of radionuclides in the soil and the type of contamination. If soil
concentrations were expressed on wet weight basis (and no information available on

141
soil water content to calculated concentrations per dry mass) or if contaminant level
expressed as available fraction, Fv data were not included.
• Data from areas with high natural radioactivity were included, except when it
concerned specific substrates (non-soils) (e.g. uranium tailings, red mud,
phosphogypsum).
• Data from pot experiments were excluded, with the exception of experiments with
natural radionuclides, where data were used independent of pot size.
For each individual reference retained, mean Fv values were calculated for specific crop/soil
combinations. The Fv values were presented with SD and range, if this information was
available or if the values could be calculated from information in the reference. Differences of
an order of magnitude could sometimes be observed between samples collected at a same site
and for the same crop. In spite of the fact that there was considerable uncertainty associated
with the average Fv values recorded in the database, only the average Fv values were
considered when evaluating the data and not the associated SD and range.
2. DERIVED TRANSFER FACTOR VALUES FOR NATURAL RADIONUCLIDES
Derived transfer factor values for U, Th, Ra, Pb and Po are presented in Tables 2-7 while
Table 1 gives the number of entries, the number of entries retained, and entries for which a
soil class was given or could be deduced for radionuclides of these elements.
TABLE 1 STATISTICAL INFORMATION ON AVAILABILITY AND USE OF DATA RELEVANT TO CALCULATING TRANSFER FACTORS FOR NORMS
Element Entries Entries considered* Entries with soil group
Pb 232 208 95
Po 73 57 **
Ra 594 561 339
Th 351 335 95
U 912 781 278
* Only entries giving Fv values for specific crop groups (natural vegetation excluded, except for natural
pastures); Fv values for special substrates (e.g. tailings) not included; for Pb and Po, no entry if it was clear that
deposition was involved**: For Po, information on soil type was given only for few entries, and the only soils
for which information was available were sandy soils.
The database for natural radionuclides included 2162 records for 5 elements. Most data were
available for U followed by Ra, and minimum information was available for Po. Between 40
and 60% of the entries contained information on soil groups or sufficient information on soil
texture or organic matter content to deduce a soil group. For 210
Po there were only a few
entries containing information on soil group, all for sandy soil.
The data presented show clear differences between GMs and AMs. Overall, the value derived
for AM is 3 to 5-fold higher than the value derived for GM. It should be stressed that, though
information is given on arithmetic mean and SD, Fv values should generally be characterized
using the GM and GSD, since the log-transformed data were generally normally distributed
whereas the non-transformed data were not.

TA
BL
E 2
. S
OIL
-TO
PL
AN
T T
RA
NS
FE
R F
AC
TO
R (Fv)
VA
LU
ES
FO
R U
Pla
nt
Gro
up
Pla
nt
Co
mp
artm
ent
Soil
N
G
M
GS
D
AM
S
D
Min
M
ax
#re
f
All
781
2.3
× 1
0-2
9.1
2.1
× 1
0-1
9.1
× 1
0-1
3.0
× 1
0-5
1.4
× 1
01
57
Cer
eals
G
rain
A
ll
59
6.2
× 1
0-3
7.7
5.0
× 1
0-2
1.4
× 1
0-1
1.6
× 1
0-4
8.2
× 1
0-1
1
6
San
d
6
8.9
× 1
0-3
1.1
× 1
01
2.8
× 1
0-2
2.5
× 1
0-2
1.9
× 1
0-4
6.2
× 1
0-2
3
Loam
20
7.7
× 1
0-3
5.1
1.8
× 1
0-2
1.9
× 1
0-2
1.6
× 1
0-4
6.2
× 1
0-2
7
Cla
y
11
3.8
× 1
0-3
4.0
9.4
× 1
0-3
1.5
× 1
0-2
7.6
× 1
0-4
5.0
× 1
0-2
4
Ste
ms
and
sh
oots
A
ll
55
2.7
× 1
0-2
7.5
1.4
× 1
0-1
4.8
× 1
0-1
3.0
× 1
0-5
3
.5
13
San
d
6
3.4
× 1
0-2
6.0
7.5
× 1
0-2
6.5
× 1
0-2
2.1
× 1
0-3
1.7
× 1
0-1
3
Loam
25
5.4
× 1
0-2
6.3
0
2.5
× 1
0-1
7.0
× 1
0-1
7.4
× 1
0-4
3
.5
7
Cla
y
8
1.0
× 1
0-2
3.6
2.3
× 1
0-2
3.4
× 1
0-2
2.8
× 1
0-3
9.8
× 1
0-2
2
Mai
ze
Gra
in
All
9
1.5
× 1
0-2
1.2
× 1
01
1.2
× 1
0-1
2.3
× 1
0-1
5.0
× 1
0-4
7.1
× 1
0-1
5
Ste
ms
and
sh
oots
A
ll
11
7.8
× 1
0-3
1.4
× 1
01
1.1
× 1
0-1
2.9
× 1
0-1
1.6
× 1
0-4
9.6
× 1
0-1
6
Lea
fy V
eget
able
s L
eaves
A
ll
108
2.0
× 1
0-2
7.3
2.2
× 1
0-1
1
.1
7.8
× 1
0-5
8
.8
15
San
d
7
1.7
× 1
0-1
1.5
× 1
01
1.5
3
.3
1.5
× 1
0-3
8
.8
2
Loam
14
4.3
× 1
0-2
3.9
8.7
× 1
0-2
8.8
× 1
0-2
7.7
× 1
0-3
2.7
× 1
0-1
3
Cla
y
9
3.6
× 1
0-3
4.2
1.0
× 1
0-2
1.6
× 1
0-2
7.6
× 1
0-4
4.3
× 1
0-2
3
Pea
t 6
1.8
× 1
0-1
9.7
1.5
3
.2
7.9
× 1
0-3
8
.0
2
Non-l
eafy
Veg
etab
les
Fru
its,
h
ead
s,
ber
ries
,
bu
ds
All
38
1.5
× 1
0-2
4.2
3.6
× 1
0-2
5.3
× 1
0-2
5.2
× 1
0-4
2.0
× 1
0-1
1
0
San
d
7
1.9
× 1
0-2
5.5
4.9
× 1
0-2
6.0
× 1
0-2
1.3
× 1
0-3
1.6
× 1
0-1
2
Loam
4
2.3
× 1
0-2
2.2
2.8
× 1
0-2
1.7
× 1
0-2
7.6
× 1
0-3
4.7
× 1
0-2
2
Cla
y
7
1.8
× 1
0-2
4.2
4.8
× 1
0-2
7.4
× 1
0-2
5.0
× 1
0-3
2.0
× 1
0-1
2
Ste
ms
and
sh
oots
A
ll
6
5.3
× 1
0-2
9.9
2.6
× 1
0-1
3.5
× 1
0-1
4.3
× 1
0-3
7.1
× 1
0-1
4
Leg
um
inous
Veg
etab
les
Po
ds
All
19
2.2
× 1
0-3
1.2
× 1
01
2.2
× 1
0-2
4.6
× 1
0-2
5.4
× 1
0-5
1.5
× 1
0-1
1
0
Loam
4
3.0
× 1
0-3
1.8
× 1
01
1.5
× 1
0-2
2.2
× 1
0-2
5.4
× 1
0-5
4.7
× 1
0-2
3
Cla
y
7
5.5
× 1
0-4
4.7
1.4
× 1
0-3
1.9
× 1
0-3
5.7
× 1
0-5
5.0
× 1
0-3
3
14 2

TA
BL
E 2
. S
OIL
-TO
PL
AN
T T
RA
NS
FE
R F
AC
TO
R (Fv)
VA
LU
ES
FO
R U
(C
ont.
)
Pla
nt
Gro
up
Pla
nt
Co
mp
artm
ent
Soil
N
G
M
GS
D
AM
S
D
Min
M
ax
#re
f L
egum
inous
Veg
etab
les
Ste
ms
and s
hoots
A
ll
21
6.4
× 1
0-2
1
.4 ×
101
8.4
× 1
0-1
2
.0
7.4
× 1
0-4
8
.7
11
San
d
6
2.8
× 1
0-1
2
.0 ×
101
2.4
3
.5
5.3
× 1
0-3
8
.7
4
Lo
am
6
1
.2 ×
10-2
6
.2
3.5
× 1
0-2
5
.1 ×
10-2
7
.4 ×
10-4
1
.4 ×
10-1
5
Root
Cro
ps
Roots
A
ll
46
8.4
× 1
0-3
6
.2
3.6
× 1
0-2
6
.5 ×
10-2
4
.9 ×
10-4
2
.6 ×
10-1
1
6
San
d
9
7.8
× 1
0-3
5
.9
3.8
× 1
0-2
7
.6 ×
10-2
9
.9 ×
10-4
2
.3 ×
10-1
6
Lo
am
1
0
2.5
× 1
0-2
3
.2
4.3
× 1
0-2
4
.3 ×
10-2
2
.6 ×
10-3
1
.2 ×
10-1
4
Cla
y
5
6.8
× 1
0-3
6
.2
2.3
× 1
0-2
3
.9 ×
10-2
7
.9 ×
10-4
9
.2 ×
10-2
4
S
tem
s an
d s
hoots
A
ll
37
2.8
× 1
0-2
5
.4
9.5
× 1
0-2
1
.6 ×
10-1
2
.0 ×
10-3
7
.0 ×
10-1
1
2
San
d
9
2.5
× 1
0-2
5
.6
6.7
× 1
0-2
8
.3 ×
10-2
2
.0 ×
10-3
2
.4 ×
10-1
5
Lo
am
1
1
5.0
× 1
0-2
3
.0
8.6
× 1
0-2
9
.8 ×
10-2
1
.3 ×
10-2
3
.2 ×
10-1
3
Cla
y
5
1.1
× 1
0-2
4
.3
2.2
× 1
0-2
2
.3 ×
10-2
2
.0 ×
10-3
5
.8 ×
10-2
3
Tuber
s T
uber
s A
ll
28
5.0
× 1
0-3
6
.4
1.7
× 1
0-2
2
.4 ×
10-2
1
.8 ×
10-4
8
.0 ×
10-2
1
1
San
d
4
1.9
× 1
0-2
3
.8
3.3
× 1
0-2
3
.4 ×
10-2
4
.3 ×
10-3
7
.8 ×
10-2
3
Lo
am
3
2
.8 ×
10-2
3
.2
4.0
× 1
0-2
3
.6 ×
10-2
8
.2 ×
10-3
8
.0 ×
10-2
3
Cla
y
6
9.2
× 1
0-4
3
.0
1.5
× 1
0-3
1
.7 ×
10-3
1
.9 ×
10-4
4
.8 ×
10-3
3
S
tem
s an
d s
hoots
A
ll
1
1.9
× 1
0-1
1
Fru
it
Fru
its
All
11
1.2
× 1
0-2
5
.9
5.7
× 1
0-2
1
.2 ×
10-1
1
.3 ×
10-3
3
.7 ×
10-1
5
L
eaves
A
ll
66
3.5
× 1
0-1
3
.6
6.7
× 1
0-1
1
.1
3.6
× 1
0-4
7
.5
3
Her
bs
A
ll
9
3.6
× 1
0-2
4
.9
1.1
× 1
0-1
1
.6 ×
10-1
8
.6 ×
10-3
4
.1 ×
10-1
4
Oth
er C
rops
Lea
ves
(su
nfl
ow
er)
All
39
7.1
× 1
0-2
3
.9
3.1
× 1
0-1
1
.2
8.9
× 1
0-3
7
.8
3
San
d
5
4.1
× 1
0-1
5
.3
1.7
3
.4
1.6
× 1
0-1
7
.8
2
Lo
am
2
2
7.1
× 1
0-2
2
.9
1.2
× 1
0-1
1
.4 ×
10-1
1
.0 ×
10-2
6
.4 ×
10-1
2
Cla
y
11
2
.7 ×
10-2
2
.1
3.5
× 1
0-2
2
.8 ×
10-2
8
.9 ×
10-3
1
.0 ×
10-1
1
G
rain
(su
nfl
ow
er)
All
2
1.5
× 1
0-2
2
.4
1.8
× 1
0-2
1
.5 ×
10-2
8
.2 ×
10-3
2
.9 ×
10-2
1
Gra
sses
S
tem
s an
d s
hoots
A
ll
147
1.7
× 1
0-2
9
.4
1.2
× 1
0-1
4
.9 ×
10-1
2
.0 ×
10-4
5
.5
18
San
d
19
1
.6 ×
10-2
1
.7 ×
101
2.5
× 1
0-1
5
.0 ×
10-1
5
.5 ×
10-4
1
.8
5
Lo
am
3
4
9.8
× 1
0-3
8
.4
5.5
× 1
0-2
1
.0 ×
10-1
3
.1 ×
10-4
4
.6 ×
10-1
5
Pas
ture
(N
atura
l)
Ste
ms
and s
hoots
A
ll
53
4.6
× 1
0-2
5
.3
4.2
× 1
0-1
2
.0
1.3
× 1
0-3
1
.4 ×
101
9
San
d
3
2.7
× 1
0-3
1
.8
3.0
× 1
0-3
1
.5 ×
10-3
1
.3 ×
10-3
3
.9 ×
10-3
1
Lo
am
7
7
.2 ×
10-2
3
.3 ×
101
2.7
5
.2
1.8
× 1
0-3
1
.4 ×
101
3
Fodder
Leg
um
inous
S
tem
s an
d s
hoots
A
ll
15
1.5
× 1
0-2
4
.2
1.2
× 1
0-1
4
.0 ×
10-1
2
.0 ×
10-3
1
.6
4
San
d
12
1
.0 ×
10-2
2
..0
1
.2 ×
10-2
5
.9 ×
10-3
2
.0 ×
10-3
2
.1 ×
10-2
1
14 3

TA
BL
E 3
. S
OIL
-TO
PL
AN
T T
RA
NS
FE
R F
AC
TO
R (Fv)
VA
LU
ES
FO
R T
h
Pla
nt
Gro
up
Pla
nt
Co
mp
artm
ent
Soil
N
G
M
GS
D
AM
S
D
Min
M
ax
#re
f
All
All
335
3.4
× 1
0-3
1.5
× 1
01
5.8
× 1
0-2
2.4
× 1
0-1
1.2
× 1
0-6
2
.7 ×
2
8
Cer
eals
G
rain
A
ll
36
2.1
× 1
0-3
3.3
9
3.8
0 ×
10-3
4.5
× 1
0-3
1.6
× 1
0-4
2.2
× 1
0-2
1
0
San
d
4
4.4
× 1
0-3
1.3
5
4.5
× 1
0-3
1.3
× 1
0-3
3.0
× 1
0-3
6.0
× 1
0-3
1
Loam
18
2.7
× 1
0-3
3.3
8
4.8
× 1
0-3
5.5
× 1
0-3
2.1
× 1
0-4
2.2
× 1
0-2
7
Cla
y
9
1.2
× 1
0-3
1.5
6
1.3
× 1
0-3
6.5
× 1
0-4
7.0
× 1
0-4
2.6
× 1
0-3
3
S
tem
s an
d s
ho
ots
A
ll
28
6.1
× 1
0-3
2.4
3
9.0
× 1
0-3
9.0
× 1
0-3
1.6
× 1
0-3
3.7
× 1
0-2
5
San
d
4
1.4
× 1
0-2
1.2
6
1.4
× 1
0-2
3.3
× 1
0-3
1.1
× 1
0-2
1.8
× 1
0-2
1
Loam
11
6.6
× 1
0-3
1.9
4
7.8
× 1
0-3
4.0
× 1
0-3
2.4
× 1
0-3
1.3
× 1
0-2
2
Cla
y
8
3.6
× 1
0-3
1.5
7
3.9
× 1
0-3
1.7
× 1
0-3
2.0
× 1
0-3
6.0
× 1
0-3
3
Org
anic
3
2.0
× 1
0-3
1.4
9
2.1
× 1
0-3
9.2
× 1
0-4
1.6
× 1
0-3
3.2
× 1
0-3
1
Mai
ze
Gra
in
All
18
6.4
× 1
0-5
9.2
3
8.5
× 1
0-4
2.6
× 1
0-3
1.2
× 1
0-6
1.1
× 1
0-2
5
Loam
10
2.0
× 1
0-4
9.3
4
1.5
× 1
0-3
3.4
× 1
0-3
1.4
× 1
0-5
1
.10
x 1
0-2
3
Cla
y
7
1.5
× 1
0-5
3.7
0
2.5
× 1
0-5
2.1
× 1
0-5
1.2
× 1
0-6
5.4
× 1
0-5
2
S
tem
s an
d s
ho
ots
A
ll
2
1.8
× 1
0-3
1.7
× 1
0-3
5.4
× 1
0-4
3.0
× 1
0-3
2
Lea
fy V
eget
able
s L
eav
es
All
24
1.2
× 1
0-3
6.0
3
1.1
8 ×
10-2
4.3
× 1
0-2
9.4
× 1
0-5
2.1
× 1
0-1
7
Loam
13
8.6
× 1
0-4
3.3
2
1.5
× 1
0-3
1.6
× 1
0-3
9.4
× 1
0-5
5.8
× 1
0-3
3
Cla
y
7
4.9
× 1
0-4
2.8
1
9.1
× 1
0-4
1.4
× 1
0-3
1.9
× 1
0-4
4.1
× 1
0-3
3
Non-l
eafy
Veg
etab
les
Fru
its,
h
eads,
b
erri
es, b
uds
All
17
7.8
× 1
0-4
6.7
6
3.4
× 1
0-3
5.4
× 1
0-3
6.2
× 1
0-5
1.6
× 1
0-2
4
Loam
10
2.0
× 1
0-4
9.3
4
1.5
× 1
0-3
3.4
× 1
0-3
1.4
× 1
0-5
1.1
× 1
0-2
1
Cla
y
7
1.5
× 1
0-5
3.7
0
2.5
× 1
0-5
2.1
× 1
0-5
1.2
× 1
0-6
5.4
× 1
0-5
3
S
tem
s an
d s
ho
ots
A
ll
6
2.2
× 1
0-3
5.1
6.1
× 1
0-3
9.2
× 1
0-3
3.3
× 1
0-4
2.4
× 1
0-2
4
Leg
um
inous
Veg
etab
les
Pods
All
22
5.3
× 1
0-4
9.4
2.3
× 1
0-2
1.0
× 1
0-1
2.5
× 1
0-5
4.8
× 1
0-1
8
Loam
14
1.8
× 1
0-3
3.9
4.4
× 1
0-3
7.1
× 1
0-3
1.7
× 1
0-4
2.4
× 1
0-2
4
Cla
y
10
4.1
× 1
0-4
2.3
× 1
01
4.9
× 1
0-2
1.5
× 1
0-1
2.5
× 1
0-5
4.8
× 1
0-1
4
Org
anic
4
4.5
× 1
0-4
7.6
1.4
× 1
0-3
1.9
× 1
0-3
8.0
× 1
0-5
4
.0x
10-3
1
S
tem
s an
d s
ho
ots
A
ll
7
4.3
× 1
0-3
4.0
8.5
× 1
0-3
9.1
× 1
0-3
5.3
× 1
0-4
2.4
× 1
0-2
5
Root
Cro
ps
Ro
ots
A
ll
33
8.0
× 1
0-4
1.3
× 1
01
9.3
× 1
0-3
2.0
× 1
0-2
8.2
× 1
0-6
9.5
× 1
0-2
8
Loam
14
1.1
× 1
0-3
1.6
× 1
01
9.1
× 1
0-3
1.5
× 1
0-2
8.2
× 1
0-6
5.3
× 1
0-2
4
Cla
y
14
2.6
× 1
0-4
5.4
2.0
× 1
0-3
6.1
× 1
0-3
4.5
× 1
0-5
2.3
× 1
0-2
4
S
tem
s an
d s
ho
ots
A
ll
8
8.7
× 1
0-3
4.4
2.1
× 1
0-2
2.8
× 1
0-2
2.1
× 1
0-3
7.8
× 1
0-2
6
144
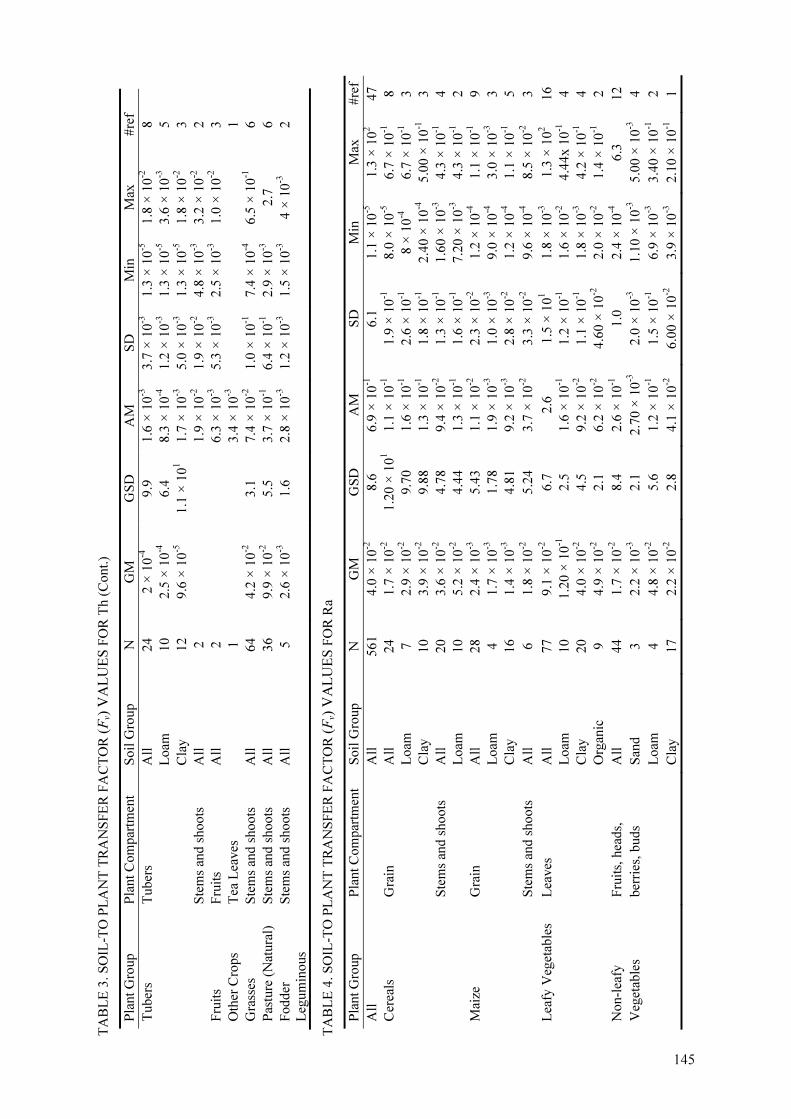
TA
BL
E 3
. S
OIL
-TO
PL
AN
T T
RA
NS
FE
R F
AC
TO
R (Fv)
VA
LU
ES
FO
R T
h (
Cont.
)
Pla
nt
Gro
up
Pla
nt
Com
par
tmen
t S
oil
Gro
up
N
GM
G
SD
A
M
SD
M
in
Max
#
ref
Tuber
s T
uber
s A
ll
24
2 ×
10-4
9.9
1
.6 ×
10-3
3
.7 ×
10-3
1
.3 ×
10-5
1
.8 ×
10-2
8
Loam
10
2.5
× 1
0-4
6.4
8
.3 ×
10-4
1
.2 ×
10-3
1
.3 ×
10-5
3
.6 ×
10-3
5
Cla
y
12
9.6
× 1
0-5
1.1
× 1
01
1.7
× 1
0-3
5
.0 ×
10-3
1
.3 ×
10-5
1
.8 ×
10-2
3
S
tem
s an
d s
hoots
A
ll
2
1.9
× 1
0-2
1
.9 ×
10-2
4
.8 ×
10-3
3
.2 ×
10-2
2
Fru
its
Fru
its
All
2
6.3
× 1
0-3
5
.3 ×
10-3
2
.5 ×
10-3
1
.0 ×
10-2
3
Oth
er C
rops
Tea
Lea
ves
1
3.4
× 1
0-3
1
Gra
sses
S
tem
s an
d s
hoots
A
ll
64
4.2
× 1
0-2
3.1
7
.4 ×
10-2
1
.0 ×
10-1
7
.4 ×
10-4
6
.5 ×
10-1
6
Pas
ture
(N
atura
l)
Ste
ms
and s
hoots
A
ll
36
9.9
× 1
0-2
5.5
3
.7 ×
10-1
6
.4 ×
10-1
2
.9 ×
10-3
2
.7
6
Fodder
Leg
um
inous
Ste
ms
and s
hoots
A
ll
5
2.6
× 1
0-3
1.6
2
.8 ×
10-3
1
.2 ×
10-3
1
.5 ×
10-3
4 ×
10-3
2
TA
BL
E 4
. S
OIL
-TO
PL
AN
T T
RA
NS
FE
R F
AC
TO
R (Fv)
VA
LU
ES
FO
R R
a
Pla
nt
Gro
up
Pla
nt
Com
par
tmen
t S
oil
Gro
up
N
GM
G
SD
A
M
SD
M
in
Max
#
ref
All
All
561
4.0
× 1
0-2
8.6
6
.9 ×
10-1
6
.1
1.1
× 1
0-5
1
.3 ×
102
47
Cer
eals
G
rain
A
ll
24
1.7
× 1
0-2
1.2
0 ×
101
1.1
× 1
0-1
1
.9 ×
10-1
8
.0 ×
10-5
6
.7 ×
10-1
8
Loam
7
2.9
× 1
0-2
9.7
0
1.6
× 1
0-1
2
.6 ×
10-1
8 ×
10-4
6
.7 ×
10-1
3
Cla
y
10
3.9
× 1
0-2
9.8
8
1.3
× 1
0-1
1
.8 ×
10-1
2
.40
× 1
0-4
5
.00
× 1
0-1
3
S
tem
s an
d s
hoots
A
ll
20
3.6
× 1
0-2
4.7
8
9.4
× 1
0-2
1
.3 ×
10-1
1
.60
× 1
0-3
4
.3 ×
10-1
4
Loam
10
5.2
× 1
0-2
4.4
4
1.3
× 1
0-1
1
.6 ×
10-1
7
.20
× 1
0-3
4
.3 ×
10-1
2
Mai
ze
Gra
in
All
28
2.4
× 1
0-3
5.4
3
1.1
× 1
0-2
2
.3 ×
10-2
1
.2 ×
10-4
1
.1 ×
10-1
9
Loam
4
1.7
× 1
0-3
1.7
8
1.9
× 1
0-3
1
.0 ×
10-3
9
.0 ×
10-4
3
.0 ×
10-3
3
Cla
y
16
1.4
× 1
0-3
4.8
1
9.2
× 1
0-3
2
.8 ×
10-2
1
.2 ×
10-4
1
.1 ×
10-1
5
S
tem
s an
d s
hoots
A
ll
6
1.8
× 1
0-2
5.2
4
3.7
× 1
0-2
3
.3 ×
10-2
9
.6 ×
10-4
8
.5 ×
10-2
3
Lea
fy V
eget
able
s L
eaves
A
ll
77
9.1
× 1
0-2
6.7
2
.6
1.5
× 1
01
1.8
× 1
0-3
1
.3 ×
102
16
Loam
10
1.2
0 ×
10-1
2.5
1
.6 ×
10-1
1
.2 ×
10-1
1
.6 ×
10-2
4
.44
x 1
0-1
4
Cla
y
20
4.0
× 1
0-2
4.5
9
.2 ×
10-2
1
.1 ×
10-1
1
.8 ×
10-3
4
.2 ×
10-1
4
Org
anic
9
4.9
× 1
0-2
2.1
6
.2 ×
10-2
4
.60
× 1
0-2
2
.0 ×
10-2
1
.4 ×
10-1
2
Non-l
eafy
F
ruit
s, h
eads,
A
ll
44
1.7
× 1
0-2
8.4
2
.6 ×
10-1
1
.0
2.4
× 1
0-4
6
.3
12
Veg
etab
les
ber
ries
, buds
San
d
3
2.2
× 1
0-3
2.1
2
.70
× 1
0-3
2
.0 ×
10-3
1
.10
× 1
0-3
5
.00
× 1
0-3
4
Loam
4
4.8
× 1
0-2
5.6
1
.2 ×
10-1
1
.5 ×
10-1
6
.9 ×
10-3
3
.40
× 1
0-1
2
Cla
y
17
2.2
× 1
0-2
2.8
4
.1 ×
10-2
6
.00
× 1
0-2
3
.9 ×
10-3
2
.10
× 1
0-1
1
14 5

TA
BL
E 4
. S
OIL
-TO
PL
AN
T T
RA
NS
FE
R F
AC
TO
R (Fv)
VA
LU
ES
FO
R R
a (C
ont.
)
Pla
nt
Gro
up
Pla
nt
Com
par
tmen
t S
oil
N
G
M
GS
D
AM
S
D
Min
M
ax
#re
f
S
tem
s an
d s
hoots
A
ll
13
6.1
× 1
0-2
6.4
3.1
× 1
0-1
5
.7 ×
10-1
6
.7 ×
10-3
1
.8
4
Leg
um
inous
Veg
etab
les
Pods
All
40
1.4
× 1
0-2
8.2
2.4
× 1
0-1
1
.0
3.2
0 ×
10-4
6
.2
14
Loam
12
9.8
× 1
0-3
4.5
2.2
× 1
0-2
2
.6 ×
10-2
4
.80
× 1
0-4
8
.7 ×
10-2
5
Cla
y
15
9.3
× 1
0-3
4.2
2.2
× 1
0-2
3.0
× 1
0-2
8 ×
10-4
1.1
0 ×
10-1
5
S
tem
s an
d s
hoots
A
ll
18
2.8
× 1
0-2
1.1
× 1
01
1.4
× 1
0-1
3
.5 ×
10-1
1
.1 ×
10-5
1
.50
8
Loam
6
1.1
× 1
0-2
3.2
× 1
01
4.8
× 1
0-2
4
.6 ×
10-2
1
.1 ×
10-5
1
.10
× 1
0-1
3
Root
Cro
ps
Roots
A
ll
60
7 ×
10-2
9.2
1
.9
7.8
2
.0 ×
10-3
5
.6 ×
101
16
San
d
3
4.8
× 1
0-3
2.3
6 ×
10-3
4
.5 ×
10-3
2
.0 ×
10-3
1
.1 ×
10-2
2
Loam
8
9.1
× 1
0-2
1.9
1.1
× 1
0-1
5
.9 ×
10-2
2
.9 ×
10-2
2 ×
10-1
3
Cla
y
23
3.9
× 1
0-2
2.9
5.1
× 1
0-2
5
.20
× 1
0-2
3
.2 ×
10-3
2
.2 ×
10-1
4
Root
Cro
ps
Ste
ms
and s
hoots
A
ll
22
7.1
× 1
0-2
4.6
1.8
× 1
0-1
2
.2 ×
10-1
2
.5 ×
10-3
7
.1 ×
10-1
9
Loam
6
1.5
× 1
0-1
5.6
3.1
× 1
0-1
2
.8 ×
10-1
9
.60
× 1
0-3
7
.1 ×
10-1
2
Tuber
s T
uber
s A
ll
45
1.1
× 1
0-2
6.8
1.4
× 1
0-1
5
.9 ×
10-1
2
.40
× 1
0-4
3
.9
15
Loam
8
1.2
0 ×
10-2
1.1
× 1
01
9.2
× 1
0-2
2
.1 ×
10-1
2
.40
× 1
0-4
6
.20
× 1
0-1
4
Cla
y
24
5.4
0 ×
10-3
2.5
9.5
× 1
0-3
1
.6 ×
10-2
1
.3 ×
10-3
8
.00
× 1
0-2
7
S
hoots
A
ll
6
1.6
× 1
0-1
2.2
1.9
× 1
0-1
1
.1 ×
10-1
4
.3 ×
10-2
3
.3 ×
10-1
3
Her
bs
Her
bs
All
20
6.9
× 1
0-2
4.5
2.6
× 1
0-1
7
.3 ×
10-1
5
.30
× 1
0-3
3
.3
5
Fru
its
Fru
its
All
12
1.2
× 1
0-2
3.7
2.7
× 1
0-2
4
.6 ×
10-2
1
.4 ×
10-3
1
.7 ×
10-1
4
Oth
er C
rops
Sunfl
ow
er-3
/pea
nut-
1
All
4
4.2
× 1
0-1
3.0
5.8
× 1
0-1
4
.2 ×
10-1
8
.50
× 1
0-2
1
.10
2
T
ea l
eaves
A
ll
1
3.3
× 1
0-2
1
Gra
sses
S
tem
s an
d s
hoots
A
ll
62
1.3
× 1
0-1
4
2.6
× 1
0-1
3
.20
× 1
0-1
3
.6 ×
10-3
1
.6
19
San
d
24
1.4
× 1
0-1
4.2
3.1
× 1
0-1
4 ×
10-1
5
.4 ×
10-3
1
.6
7
Loam
14
2.6
× 1
0-1
2.0
0
3.2
× 1
0-1
2
.1 ×
10-1
9
.6 ×
10-2
7
.2 ×
10-1
2
Cla
y
3
4.2
0 ×
10-2
1.5
4.4
× 1
0-2
1
.70
× 1
0-2
2
.70
× 1
0-2
6
.1 ×
10-2
1
Pas
ture
(N
atura
l)
Ste
ms
and s
hoots
A
ll
42
7.1
0 ×
10-2
7.6
1.9
× 1
0-1
2
.8 ×
10-1
5
.1 ×
10-5
1
.60
1
6
San
d
3
8 ×
10-3
3.8
1.2
× 1
0-2
1
.1 ×
10-2
1
.80
× 1
0-3
2
.3 ×
10-2
1
Loam
6
8.8
× 1
0-3
1.9
× 1
01
3.9
× 1
0-2
4 ×
10-2
5
.1 ×
10-5
1
.1 ×
10-1
4
Fodder
Leg
um
inous
S
tem
s an
d s
hoots
A
ll
16
1.7
× 1
0-1
3.1
3.0
× 1
0-1
3
.70
× 1
0-1
3
.40
× 1
0-2
1
.5
4
San
d
5
1.7
0 ×
10-1
2.5
2.4
× 1
0-1
2
.20
× 1
0-1
8
.00
× 1
0-2
5
.7 ×
10-1
3
Loam
8
1.2
× 1
0-1
3.9
3.1
× 1
0-1
5
.1 ×
10-1
3
.40
× 1
0-2
1
.5
2
146

TA
BL
E 5
. S
OIL
-TO
PL
AN
T T
RA
NS
FE
R F
AC
TO
R (Fv)
VA
LU
ES
FO
R P
b
Pla
nt
Gro
up
Pla
nt
Co
mp
artm
ent
Soil
N
G
M
GS
D
AM
S
D
Min
M
ax
#re
f
All
208
2.0
× 1
0-2
1.4
× 1
01
6.3
× 1
0-1
2
.9
1.5
× 1
0-4
2.5
× 1
01
24
Cer
eals
G
rain
A
ll
9
1.1
× 1
0-2
3.6
1.8
× 1
0-2
1.6
× 1
0-2
1.9
× 1
0-3
4.8
× 1
0-2
5
S
tem
s an
d s
ho
ots
A
ll
4
2.3
× 1
0-2
3.5
3.8
× 1
0-2
4.1
× 1
0-2
5.1
× 1
0-3
9.6
× 1
0-2
3
M
aize
G
rain
A
ll
9
1.2
× 1
0-3
2.3
1.7
× 1
0-3
1.4
× 1
0-3
5.2
× 1
0-4
3.8
× 1
0-3
4
S
tem
s an
d s
ho
ots
A
ll
3
2.8
× 1
0-3
6.6
8.5
× 1
0-3
1
.3x
10-2
6.0
× 1
0-4
2.3
× 1
0-2
2
Lea
fy V
eget
able
s L
eav
es
All
31
8.0
× 1
0-2
1.3
× 1
01
2.1
6
.1
3.2
× 1
0-3
2.5
× 1
01
9
San
d
4
7.3
× 1
0-2
1.5
7.8
× 1
0-2
3.3
× 1
0-2
4.9
× 1
0-2
1.1
× 1
0-1
1
Loam
3
8.2
× 1
0-1
1.0
8.2
× 1
0-1
3.5
× 1
0-2
7.9
× 1
0-1
8.6
× 1
0-1
1
Cla
y
7
2.8
× 1
0-2
4.1
5.1
× 1
0-2
4.8
× 1
0-2
4.1
× 1
0-3
1.2
× 1
0-1
3
Non-l
eafy
Veg
etab
les
Fru
its,
hea
ds,
ber
ries
, b
ud
s A
ll
5
1.5
× 1
0-2
2.6
× 1
01
7.8
× 1
0-1
1
.7
1.5
× 1
0-3
3
.9
3
S
tem
s an
d s
ho
ots
A
ll
2
8.8
× 1
0-3
4.2
× 1
0-3
5.8
× 1
0-3
1.2
× 1
0-2
2
Leg
um
inous-
Veg
etab
les
Po
ds
All
17
5.3
× 1
0-3
1.2
× 1
01
3.4
× 1
0-1
1
.20
4
.6 ×
10-4
4
.9
6
San
d
3
2.7
× 1
0-3
3.2
4.2
× 1
0-3
3.4
× 1
0-3
6.5
× 1
0-4
8.9
× 1
0-3
2
Loam
5
1.4
× 1
0-3
4.4
4.2
× 1
0-3
3.4
× 1
0-3
6.5
× 1
0-4
8.9
× 1
0-3
2
Cla
y
4
8.0
× 1
0-4
1.0
3.3
× 1
0-3
4.7
× 1
0-3
4.6
× 1
0-4
1.0
× 1
0-2
2
S
tem
s an
d s
ho
ots
A
ll
1
8.0
× 1
0-4
1
Root
Cro
ps
Ro
ots
A
ll
27
1.5
× 1
0-2
1.6
× 1
01
4.1
× 1
0-1
9.8
× 1
0-1
2.4
× 1
0-4
3
.3
9
San
d
5
6.4
× 1
0-2
1.6
7.3
× 1
0-2
3.4
× 1
0-2
4.2
× 1
0-2
1.2
× 1
0-1
3
Loam
5
2.3
× 1
0-3
4.7
5.0
× 1
0-3
6.8
× 1
0-3
2.4
× 1
0-4
1.7
× 1
0-2
2
S
tem
s an
d s
ho
ots
A
ll
12
6.3
× 1
0-2
1.5
× 1
01
2.5
5
.7
3 ×
10-3
1.6
× 1
01
4
Tuber
s T
uber
s A
ll
30
1.5
× 1
0-3
7.4
9.1
× 1
0-2
4.8
× 1
0-1
1.5
× 1
0-4
2
.6
10
S
and
5
6.4
× 1
0-3
3.5
1.2
0 ×
10-2
1.6
× 1
0-2
1.6
× 1
0-3
3.9
× 1
0-2
3
L
oam
17
5.2
0 ×
10-4
2.4
7.3
× 1
0-4
6.2
× 1
0-4
1.5
× 1
0-4
2.3
× 1
0-3
4
Fru
its
Fru
its
All
5
7.7
× 1
0-3
2.6
1.0
× 1
0-2
6 ×
10-3
1.5
× 1
0-3
1.7
× 1
0-2
3
L
eaves
A
ll
1
2.5
× 1
0-1
1
Gra
sses
S
tem
s an
d s
ho
ots
A
ll
17
3.1
× 1
0-1
1.8
3.6
× 1
0-1
2.2
× 1
0-1
1.1
× 1
0-1
1
.0
2
Pas
ture
(N
atura
l)
Ste
ms
and
sh
oots
A
ll
34
9.2
× 1
0-2
4.8
2.3
× 1
0-1
2.9
× 1
0-1
2.2
× 1
0-3
1
.0
7
Fodder
Leg
um
ino
us
S
tem
s an
d s
ho
ots
A
ll
1
1.6
× 1
0-2
1
147
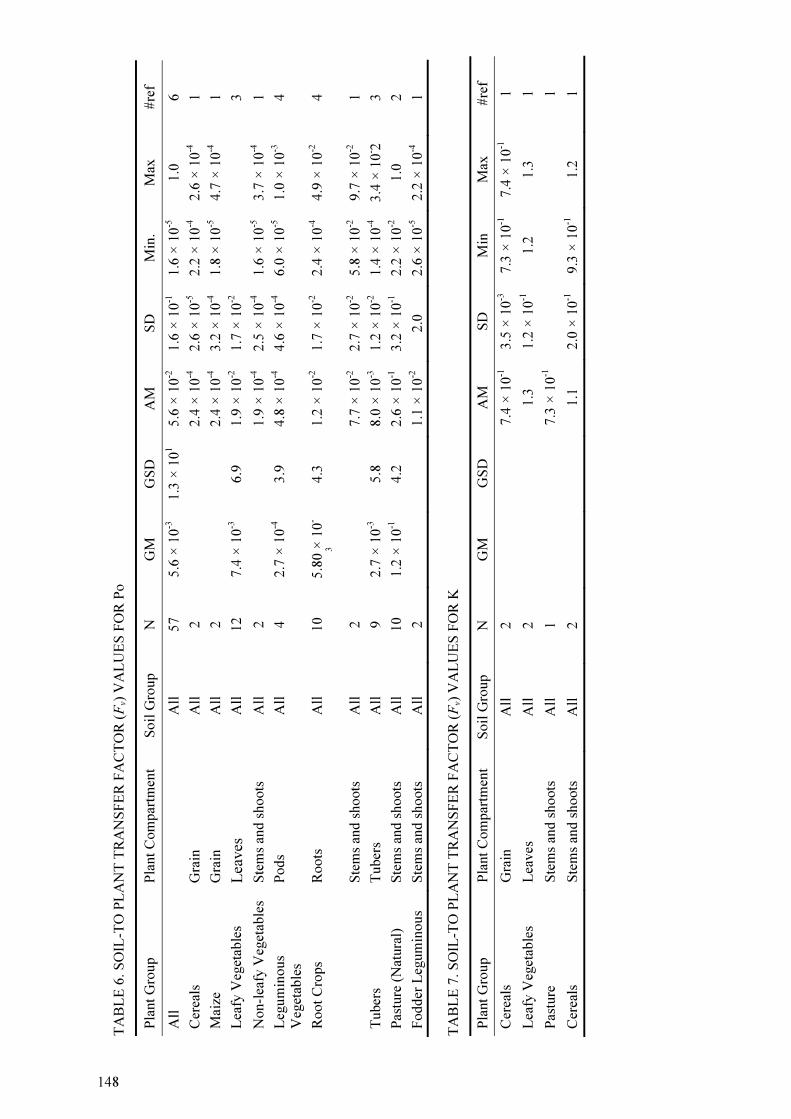
TA
BL
E 6
. S
OIL
-TO
PL
AN
T T
RA
NS
FE
R F
AC
TO
R (Fv)
VA
LU
ES
FO
R P
o
Pla
nt
Gro
up
Pla
nt
Co
mp
artm
ent
Soil
Gro
up
N
GM
G
SD
A
M
SD
M
in.
Max
#
ref
All
A
ll
57
5.6
× 1
0-3
1.3
× 1
01
5.6
× 1
0-2
1.6
× 1
0-1
1.6
× 1
0-5
1
.0
6
Cer
eals
G
rain
A
ll
2
2.4
× 1
0-4
2.6
× 1
0-5
2.2
× 1
0-4
2.6
× 1
0-4
1
Mai
ze
Gra
in
All
2
2.4
× 1
0-4
3.2
× 1
0-4
1.8
× 1
0-5
4.7
× 1
0-4
1
Lea
fy V
eget
able
s L
eav
es
All
12
7.4
× 1
0-3
6.9
1
.9 ×
10-2
1.7
× 1
0-2
3
Non-l
eafy
Veg
etab
les
Ste
ms
and
sh
oots
A
ll
2
1.9
× 1
0-4
2.5
× 1
0-4
1.6
× 1
0-5
3.7
× 1
0-4
1
Leg
um
inous
Veg
etab
les
Po
ds
All
4
2.7
× 1
0-4
3.9
4
.8 ×
10-4
4.6
× 1
0-4
6.0
× 1
0-5
1.0
× 1
0-3
4
Root
Cro
ps
Ro
ots
A
ll
10
5.8
0 ×
10-
3
4.3
1
.2 ×
10-2
1.7
× 1
0-2
2.4
× 1
0-4
4.9
× 1
0-2
4
S
tem
s an
d s
ho
ots
A
ll
2
7.7
× 1
0-2
2.7
× 1
0-2
5.8
× 1
0-2
9.7
× 1
0-2
1
Tuber
s T
uber
s A
ll
9
2.7
× 1
0-3
5.8
8
.0 ×
10-3
1.2
× 1
0-2
1.4
× 1
0-4
3.4
× 1
0- 2
3
Pas
ture
(N
atura
l)
Ste
ms
and
sh
oots
A
ll
10
1.2
× 1
0-1
4.2
2
.6 ×
10-1
3.2
× 1
0-1
2.2
× 1
0-2
1
.0
2
Fodder
Leg
um
ino
us
S
tem
s an
d s
ho
ots
A
ll
2
1.1
× 1
0-2
2
.0
2.6
× 1
0-5
2.2
× 1
0-4
1
TA
BL
E 7
. S
OIL
-TO
PL
AN
T T
RA
NS
FE
R F
AC
TO
R (Fv)
VA
LU
ES
FO
R K
Pla
nt
Gro
up
Pla
nt
Co
mp
artm
ent
Soil
Gro
up
N
GM
G
SD
A
M
SD
M
in
Max
#
ref
Cer
eals
G
rain
A
ll
2
7.4
× 1
0-1
3.5
× 1
0-3
7.3
× 1
0-1
7.4
× 1
0-1
1
Lea
fy V
eget
able
s L
eaves
A
ll
2
1.3
1.2
× 1
0-1
1
.2
1.3
1
Pas
ture
S
tem
s an
d s
ho
ots
A
ll
1
7.3
× 1
0-1
1
Cer
eals
S
tem
s an
d s
ho
ots
A
ll
2
1.1
2
.0 ×
10-1
9.3
× 1
0-1
1
.2
1
148

149
A substantial range of variation is observed: the SD is generally more than half the value of
the mean and the range between minimum and maximum values is generally more than two
orders of magnitude. Table 2 gives the Fv-U estimates for selected crop groups. A generic Fv-
U value of 2.15 10-2
(GSD 9.4) kg kg-1
was derived. Fodder, Pasture and Grasses, and Herbs
showed the highest Fv-U (2.3-6.5 10-2
kg kg-1
), and Legumes, Cereals, and Tubers the lowest
(2.2-5 10-3
kg kg-1
).
Differences in Fv-U between crop groups overall is a factor 10. Typical ranges in Fv-U within
a crop group are 1 to 5 orders of magnitude. The highest Fv -U values were found for Organic
soils, followed by Sand and Loam soils, and the lowest for Clay soils. Experimental and
climatic conditions and contamination history did not significantly affect Fv-U.
The generic GM for Fv-Th derived is 3.4 10-3
(GSD 15) kg kg-1
(6 orders of magnitude range)
(Table 3) and is, on average, 10-fold lower than the generic GM for the Fv of the other natural
radionuclides in this study, except for Po.
The highest Fv-Th values were found for Pasture and Grasses (5.7 10-2
kg kg-1
), followed by
Fodder and Fruits (~5.0 10-3
kg kg-1
), while the lowest Fv-Th (2.0 10-4
kg kg-1
) was observed
for Tubers,. Variation within a crop group is substantial, with ranges covering 2 to 4 orders of
magnitude. Very few significant differences between crop groups were observed in derived
Fv-Th values. Fv-Th to Cereal Straw is a factor of two higher than to Cereal Grains.
Evaluation of the overall effect of soil texture on the Th availability for plant uptake showed
that Organic soils had the lowest Fv-Th, and that Fv-Th for Sand, Loam and Clay soils did not
differ substantially each from other.
The derived generic Fv-Ra is 4 × 10⁻²
(GSD 9) kg kg-1
, but the range in observed values is 7
orders of magnitude (Table 4). Pasture, Grasses, Leafy Vegetables, Root Crops, Fodder, and
Herbs showed the highest Fv-Ra (6 × 10⁻²
– 10-1
kg kg-1
), Cereals, Non-leafy Vegetables,
Legumes, Tubers, and Fruits showed the lowest (9 × 10⁻³
– 2 × 10⁻²
kg kg-1
).
Variation within a crop group is 1 to 5 orders of magnitude, and significant differences in Fv
values between crop groups were rarely observed. Fv-Ra to Cereal Straw is a factor of two
lower than to Cereal Grains. Evaluation of the overall effect of soil texture on the Ra
availability for plant uptake, showed that Clay and Organic soils had the lowest Fv–Ra, and
Sand and Loam soils the highest, yet the difference is only 4-fold. No significant effect of
experimental conditions, contamination history, or climate could be found on Fv–Ra, based on
the analysis of the available data.
Table 5 shows Fv-Pb for the different crop groups. The overall GM for the Fv-Pb is 2.0 × 10⁻²
(GSD 14) kg kg-1
and the range covers 5 orders of magnitude. For most crop groups a fair
number of observations were recorded, except for Non-leafy Vegetables, Fruits, and Fodder
Leguminous. Fv-Pb was highest for Pasture (1.4 × 10⁻¹
kg kg-1
), followed by Leafy Vegetables
(8.0 × 10⁻²
kg kg-1
) and Fodder (2.5 × 10⁻²
kg kg-1
), and was lowest for Tubers (1.5 × 10⁻³
kg
kg-1
).
Within a plant group variation is low (factor of 10 or less) to substantial (4 orders of
magnitude). Therefore, very few Fv-Pb are significantly different between crop groups. Fv-Pb
to Cereal Grain was about a factor of 2 lower than to the Cereal Straw. Fv-Pb are highest for
Sand and Clay soils. Variation within a soil category is three orders of magnitude. For
Organic soils, only two observations were recorded
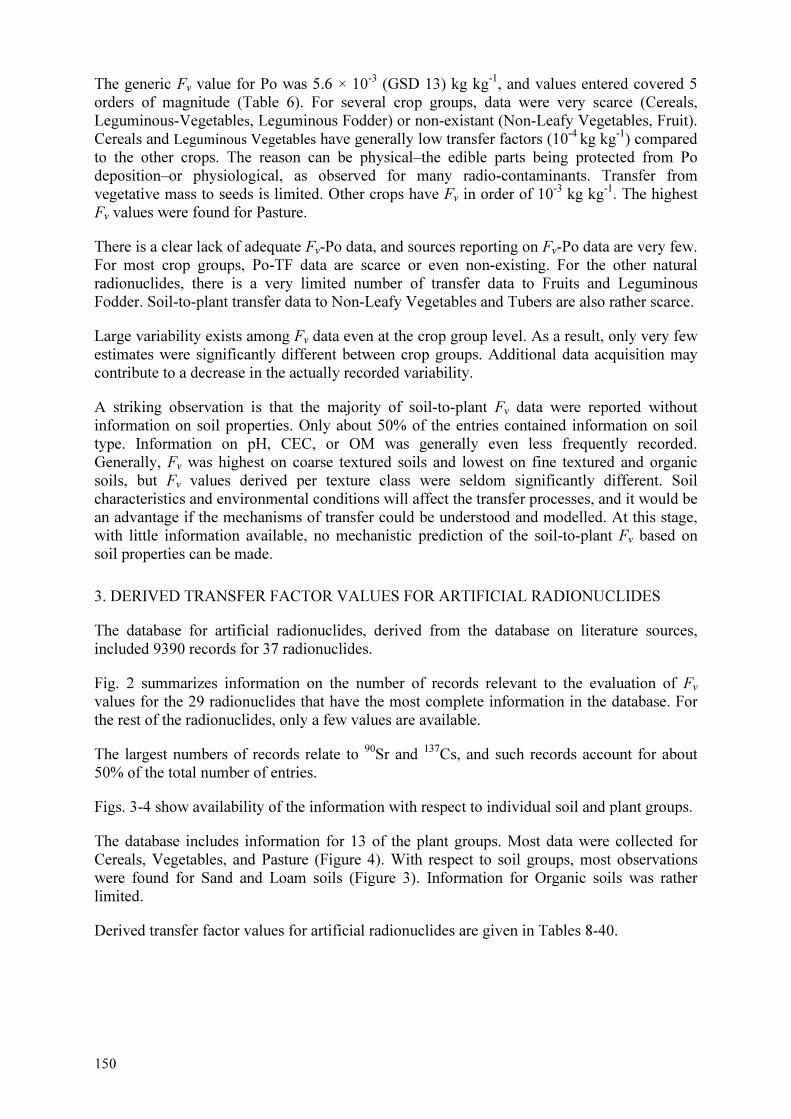
150
The generic Fv value for Po was 5.6 × 10⁻³
(GSD 13) kg kg-1
, and values entered covered 5
orders of magnitude (Table 6). For several crop groups, data were very scarce (Cereals,
Leguminous-Vegetables, Leguminous Fodder) or non-existant (Non-Leafy Vegetables, Fruit).
Cereals and Leguminous Vegetables have generally low transfer factors (10-4
kg kg-1
) compared
to the other crops. The reason can be physical–the edible parts being protected from Po
deposition–or physiological, as observed for many radio-contaminants. Transfer from
vegetative mass to seeds is limited. Other crops have Fv in order of 10-3
kg kg-1
. The highest
Fv values were found for Pasture.
There is a clear lack of adequate Fv-Po data, and sources reporting on Fv-Po data are very few.
For most crop groups, Po-TF data are scarce or even non-existing. For the other natural
radionuclides, there is a very limited number of transfer data to Fruits and Leguminous
Fodder. Soil-to-plant transfer data to Non-Leafy Vegetables and Tubers are also rather scarce.
Large variability exists among Fv data even at the crop group level. As a result, only very few
estimates were significantly different between crop groups. Additional data acquisition may
contribute to a decrease in the actually recorded variability.
A striking observation is that the majority of soil-to-plant Fv data were reported without
information on soil properties. Only about 50% of the entries contained information on soil
type. Information on pH, CEC, or OM was generally even less frequently recorded.
Generally, Fv was highest on coarse textured soils and lowest on fine textured and organic
soils, but Fv values derived per texture class were seldom significantly different. Soil
characteristics and environmental conditions will affect the transfer processes, and it would be
an advantage if the mechanisms of transfer could be understood and modelled. At this stage,
with little information available, no mechanistic prediction of the soil-to-plant Fv based on
soil properties can be made.
3. DERIVED TRANSFER FACTOR VALUES FOR ARTIFICIAL RADIONUCLIDES
The database for artificial radionuclides, derived from the database on literature sources,
included 9390 records for 37 radionuclides.
Fig. 2 summarizes information on the number of records relevant to the evaluation of Fv
values for the 29 radionuclides that have the most complete information in the database. For
the rest of the radionuclides, only a few values are available.
The largest numbers of records relate to 90
Sr and 137
Cs, and such records account for about
50% of the total number of entries.
Figs. 3-4 show availability of the information with respect to individual soil and plant groups.
The database includes information for 13 of the plant groups. Most data were collected for
Cereals, Vegetables, and Pasture (Figure 4). With respect to soil groups, most observations
were found for Sand and Loam soils (Figure 3). Information for Organic soils was rather
limited.
Derived transfer factor values for artificial radionuclides are given in Tables 8-40.
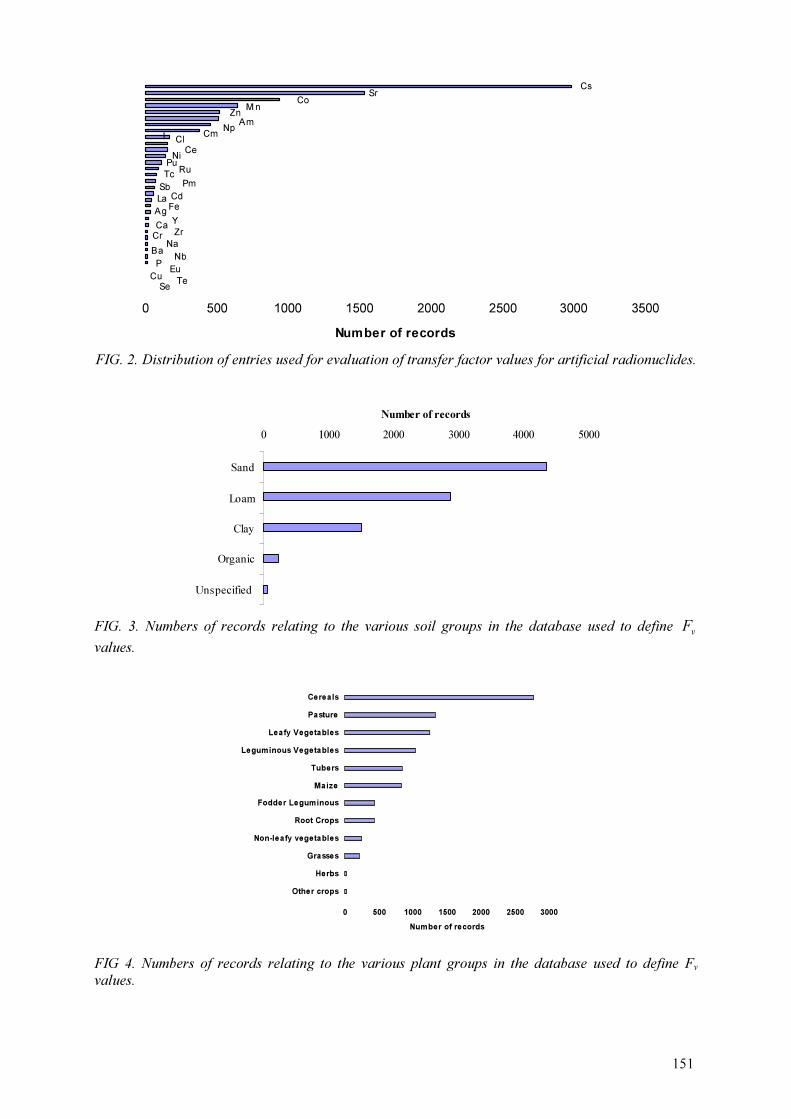
151
I
Cs
CoSr
M nZnAm
NpCm
ClCe
NiPu
RuTc
PmSbCdLaFe
AgY
CaZrCr
NaBa
NbP
EuCu
TeSe
0 500 1000 1500 2000 2500 3000 3500
Number of records
FIG. 2. Distribution of entries used for evaluation of transfer factor values for artificial radionuclides.
0 1000 2000 3000 4000 5000
Sand
Loam
Clay
Organic
Unspecified
Number of records
FIG. 3. Numbers of records relating to the various soil groups in the database used to define v
F
values.
0 500 1000 1500 2000 2500 3000
Other crops
Herbs
Grasses
Non-leafy vegetables
Root Crops
Fodder Leguminous
Maize
Tubers
Leguminous Vegetables
Leafy Vegetables
Pasture
Cereals
Number of records
FIG 4. Numbers of records relating to the various plant groups in the database used to define Fv
values.

TA
BL
E 8
. S
OIL
-TO
PL
AN
T T
RA
NS
FE
R F
AC
TO
R (Fv)
VA
LU
ES
FO
R A
g
Pla
nt
Gro
up
Pla
nt
Co
mp
artm
ent
So
il G
roup
N
GM
G
SD
A
M
SD
M
in
Max
#
ref
All
5
1.8
× 1
0-4
3.3
3.6
× 1
0-4
5.3
× 1
0-4
5.9
× 1
0-5
1.3
× 1
0-3
3
San
d
2
1.7
× 1
0-4
9.6
× 1
0-5
2.5
× 1
0-4
1
Lea
fy
Veg
etab
les
Lea
ves
Lo
am
3
2.0
× 1
0-4
5.0
4.9
× 1
0-4
7.0
× 1
0-4
5.9
× 1
0-5
1.3
× 1
0-3
3
All
5
6.4
× 1
0-4
2.3
8.5
× 1
0-4
7.2
× 1
0-4
2.5
× 1
0-4
2.0
× 1
0-3
3
San
d
2
1.6
× 1
0-3
6.4
× 1
0-4
1.1
× 1
0-3
2.0
× 1
0-3
1
Non-l
eafy
V
eget
able
s F
ruit
s
Lo
am
3
3.7
× 1
0-4
1.4
3.8
× 1
0-4
1.2
× 1
0-4
2.5
× 1
0-4
4.7
× 1
0-4
3
All
6
1.3
× 1
0-3
2.0
1.6
× 1
0-3
1.2
× 1
0-3
5.7
× 1
0-4
3.9
× 1
0-3
3
San
d
3
1.7
× 1
0-3
2.4
2.1
× 1
0-3
1.6
× 1
0-3
6.8
× 1
0-4
3.9
× 1
0-3
1
Root
Cro
ps
Ro
ot
Lo
am
3
1.0
× 1
0-3
1.7
1.1
× 1
0-3
5.7
× 1
0-4
5.7
× 1
0-4
1.7
× 1
0-3
3
TA
BL
E 9
. S
OIL
-TO
PL
AN
T T
RA
NS
FE
R F
AC
TO
R (Fv)
VA
LU
ES
FO
R A
m
Pla
nt
Gro
up
Pla
nt
Co
mp
artm
ent
So
il G
roup
N
GM
G
SD
A
M
SD
M
in
Max
#
ref
All
83
2.2
× 1
0-5
11.0
1.9
× 1
0-3
7.1
× 1
0-3
7.4
× 1
0-7
3.4
× 1
0-2
4
San
d
66
2.7
× 1
0-5
4.1
1.7
× 1
0-4
9.8
× 1
0-4
2.7
× 1
0-6
8.0
× 1
0-3
2
Lo
am
7
4.0
× 1
0-4
2.0
102
1.7
× 1
0-2
1.6
× 1
0-2
1.0
× 1
0-6
3.4
× 1
0-2
3
Cla
y
9
1.6
× 1
0-5
2.5
101
6.7
× 1
0-4
1.4
× 1
0-3
7.4
× 1
0-7
4.0
× 1
0-3
2
Cer
eals
G
rain
Org
anic
1
1.5
× 1
0-7
1
All
10
2.7
× 1
0-4
3.3
4.6
× 1
0-4
4.8
× 1
0-4
4.0
× 1
0-5
1.5
× 1
0-3
2
San
d
5
5.3
× 1
0-4
2.7
7.3
× 1
0-4
5.6
× 1
0-4
1.7
× 1
0-4
1.5
× 1
0-3
1
Lo
am
2
1.6
× 1
0-4
4.1
2.4
× 1
0-4
2.5
× 1
0-4
6.0
× 1
0-5
4.1
× 1
0-4
1
Lea
fy
Veg
etab
les
Lea
ves
Org
anic
2
1.4
× 1
0-4
1.3
× 1
0-4
4.0
× 1
0-5
2.3
× 1
0-4
1
All
9
3.6
× 1
0-4
5.0
7.9
× 1
0-4
7.3
× 1
0-4
2.3
× 1
0-5
1.9
× 1
0-3
2
Non-l
eafy
V
eget
able
s F
ruit
s, h
ead
s,
ber
ries
, b
uds
San
d
8
3.9
× 1
0-4
5.5
8.6
× 1
0-4
7.5
× 1
0-4
2.3
× 1
0-5
1.9
× 1
0-3
1
All
12
3.8
× 1
0-4
2.6
4.8
× 1
0-4
2.1
× 1
0-4
2.2
× 1
0-5
7.9
× 1
0-4
1
Leg
um
inous
Veg
etab
les
See
ds
and
po
ds
San
d
12
3.8
× 1
0-4
2.6
4.8
× 1
0-4
2.1
× 1
0-4
2.2
× 1
0-5
7.9
× 1
0-4
1
All
4
6.7
× 1
0-4
2.4
8.6
× 1
0-4
6.2
× 1
0-4
2.0
× 1
0-4
1.7
× 1
0-3
2
Root
Cro
ps
Ro
ot
San
d
3
1.0
× 1
0-3
1.6
1.1
× 1
0-3
5.4
× 1
0-4
7.3
× 1
0-4
1.7
× 1
0-3
1
1 52
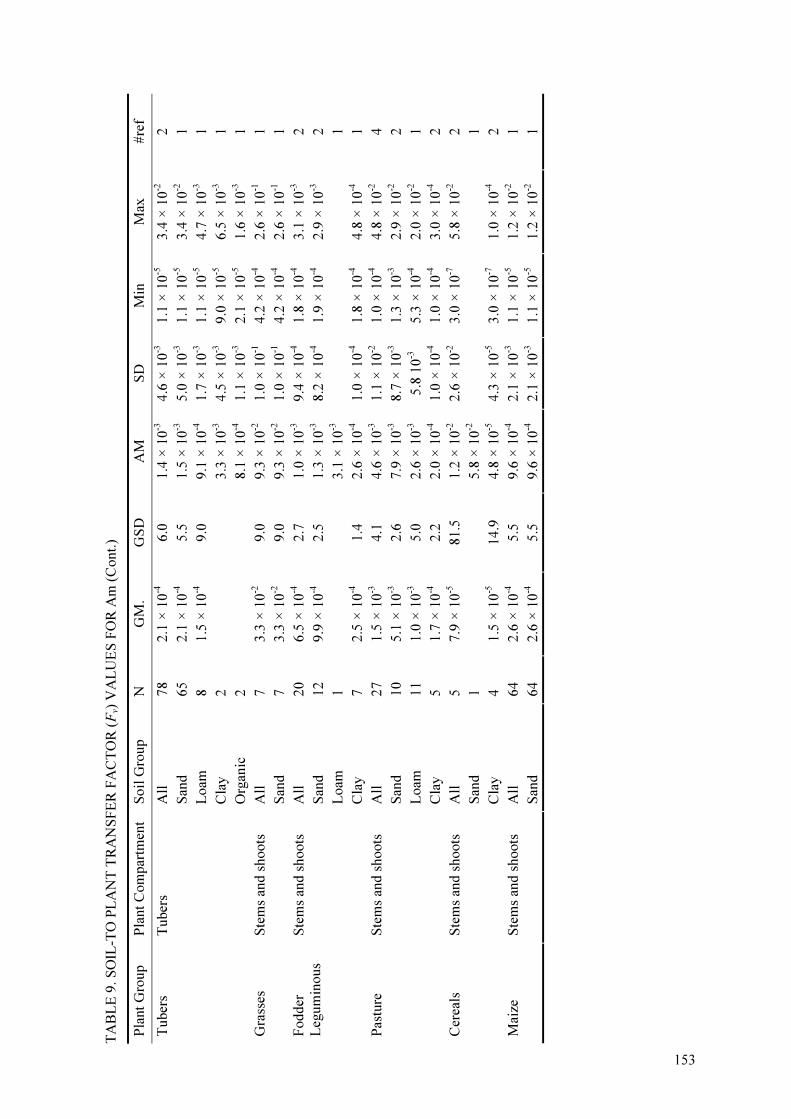
TA
BL
E 9
. S
OIL
-TO
PL
AN
T T
RA
NS
FE
R F
AC
TO
R (Fv)
VA
LU
ES
FO
R A
m (
Cont.
)
Pla
nt
Gro
up
Pla
nt
Co
mp
artm
ent
So
il G
roup
N
GM
. G
SD
A
M
SD
M
in
Max
#
ref
All
78
2.1
× 1
0-4
6.0
1.4
× 1
0-3
4.6
× 1
0-3
1.1
× 1
0-5
3.4
× 1
0-2
2
San
d
65
2.1
× 1
0-4
5.5
1.5
× 1
0-3
5.0
× 1
0-3
1.1
× 1
0-5
3.4
× 1
0-2
1
Lo
am
8
1.5
× 1
0-4
9.0
9.1
× 1
0-4
1.7
× 1
0-3
1.1
× 1
0-5
4.7
× 1
0-3
1
Cla
y
2
3.3
× 1
0-3
4.5
× 1
0-3
9.0
× 1
0-5
6.5
× 1
0-3
1
Tuber
s T
uber
s
Org
anic
2
8.1
× 1
0-4
1.1
× 1
0-3
2.1
× 1
0-5
1.6
× 1
0-3
1
All
7
3.3
× 1
0-2
9.0
9.3
× 1
0-2
1.0
× 1
0-1
4.2
× 1
0-4
2.6
× 1
0-1
1
G
rass
es
Ste
ms
and
sh
oots
San
d
7
3.3
× 1
0-2
9.0
9.3
× 1
0-2
1.0
× 1
0-1
4.2
× 1
0-4
2.6
× 1
0-1
1
All
20
6.5
× 1
0-4
2.7
1.0
× 1
0-3
9.4
× 1
0-4
1.8
× 1
0-4
3.1
× 1
0-3
2
San
d
12
9.9
× 1
0-4
2.5
1.3
× 1
0-3
8.2
× 1
0-4
1.9
× 1
0-4
2.9
× 1
0-3
2
Lo
am
1
3.1
× 1
0-3
1
Fodder
Leg
um
inous
Ste
ms
and
sh
oots
Cla
y
7
2.5
× 1
0-4
1.4
2.6
× 1
0-4
1.0
× 1
0-4
1.8
× 1
0-4
4.8
× 1
0-4
1
All
27
1.5
× 1
0-3
4.1
4.6
× 1
0-3
1.1
× 1
0-2
1.0
× 1
0-4
4.8
× 1
0-2
4
San
d
10
5.1
× 1
0-3
2.6
7.9
× 1
0-3
8.7
× 1
0-3
1.3
× 1
0-3
2.9
× 1
0-2
2
Lo
am
11
1.0
× 1
0-3
5.0
2.6
× 1
0-3
5
.8 1
0-3
5.3
× 1
0-4
2.0
× 1
0-2
1
Pas
ture
S
tem
s an
d s
ho
ots
Cla
y
5
1.7
× 1
0-4
2.2
2.0
× 1
0-4
1.0
× 1
0-4
1.0
× 1
0-4
3.0
× 1
0-4
2
All
5
7.9
× 1
0-5
81.5
1.2
× 1
0-2
2.6
× 1
0-2
3.0
× 1
0-7
5.8
× 1
0-2
2
San
d
1
5.8
× 1
0-2
1
Cer
eals
S
tem
s an
d s
ho
ots
Cla
y
4
1.5
× 1
0-5
14.9
4.8
× 1
0-5
4.3
× 1
0-5
3.0
× 1
0-7
1.0
× 1
0-4
2
All
64
2.6
× 1
0-4
5.5
9.6
× 1
0-4
2.1
× 1
0-3
1.1
× 1
0-5
1.2
× 1
0-2
1
M
aize
S
tem
s an
d s
ho
ots
San
d
64
2.6
× 1
0-4
5.5
9.6
× 1
0-4
2.1
× 1
0-3
1.1
× 1
0-5
1.2
× 1
0-2
1
153
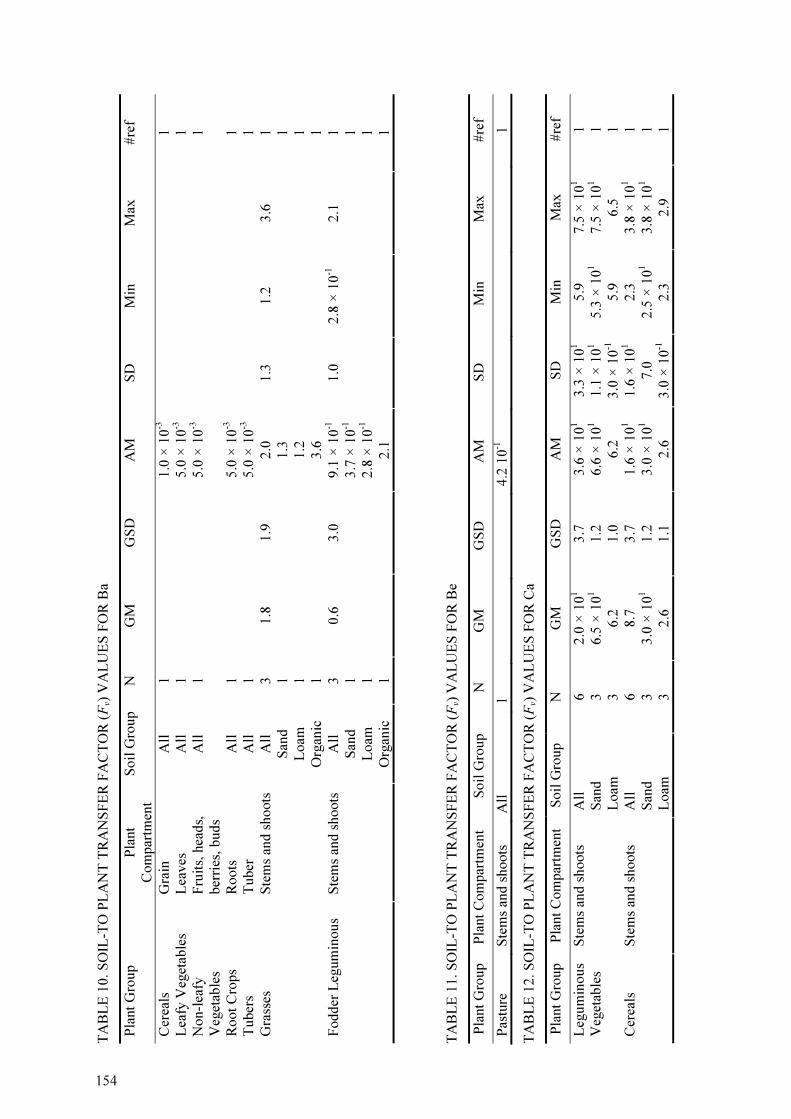
TA
BL
E 1
0.
SO
IL-T
O P
LA
NT
TR
AN
SF
ER
FA
CT
OR
(Fv)
VA
LU
ES
FO
R B
a
Pla
nt
Gro
up
Pla
nt
Co
mp
artm
ent
Soil
Gro
up
N
GM
G
SD
A
M
SD
M
in
Max
#
ref
Cer
eals
G
rain
A
ll
1
1.0
× 1
0-3
1
Lea
fy V
eget
able
s L
eaves
A
ll
1
5.0
× 1
0-3
1
Non-l
eafy
Veg
etab
les
Fru
its,
hea
ds,
ber
ries
, b
uds
All
1
5.0
× 1
0-3
1
Root
Cro
ps
Ro
ots
A
ll
1
5.0
× 1
0-3
1
Tuber
s T
uber
A
ll
1
5.0
× 1
0-3
1
All
3
1.8
1.9
2.0
1
.3
1.2
3
.6
1
San
d
1
1.3
1
Loam
1
1.2
1
Gra
sses
S
tem
s an
d s
ho
ots
Org
anic
1
3.6
1
All
3
0.6
3.0
9.1
× 1
0-1
1
.0
2.8
× 1
0-1
2
.1
1
San
d
1
3.7
× 1
0-1
1
Loam
1
2.8
× 1
0-1
1
Fodder
Leg
um
ino
us
Ste
ms
and
sh
oots
Org
anic
1
2.1
1
TA
BL
E 1
1.
SO
IL-T
O P
LA
NT
TR
AN
SF
ER
FA
CT
OR
(Fv)
VA
LU
ES
FO
R B
e
Pla
nt
Gro
up
Pla
nt
Co
mp
artm
ent
So
il G
roup
N
GM
G
SD
A
M
SD
M
in
Max
#
ref
Pas
ture
S
tem
s an
d s
ho
ots
A
ll
1
4.2
10-1
1
TA
BL
E 1
2.
SO
IL-T
O P
LA
NT
TR
AN
SF
ER
FA
CT
OR
(Fv)
VA
LU
ES
FO
R C
a
Pla
nt
Gro
up
Pla
nt
Co
mp
artm
ent
So
il G
roup
N
GM
G
SD
A
M
SD
M
in
Max
#
ref
All
6
2.0
× 1
01
3.7
3.6
× 1
01
3.3
× 1
01
5.9
7
.5 ×
101
1
San
d
3
6.5
× 1
01
1.2
6.6
× 1
01
1.1
× 1
01
5.3
× 1
01
7.5
× 1
01
1
Leg
um
inous
Veg
etab
les
Ste
ms
and
sh
oots
Lo
am
3
6.2
1.0
6.2
3
.0 ×
10-1
5
.9
6.5
1
All
6
8.7
3.7
1.6
× 1
01
1.6
× 1
01
2.3
3
.8 ×
101
1
San
d
3
3.0
× 1
01
1.2
3.0
× 1
01
7.0
2
.5 ×
101
3.8
× 1
01
1
Cer
eals
S
tem
s an
d s
ho
ots
Lo
am
3
2.6
1.1
2.6
3
.0 ×
10-1
2
.3
2.9
1
1 54
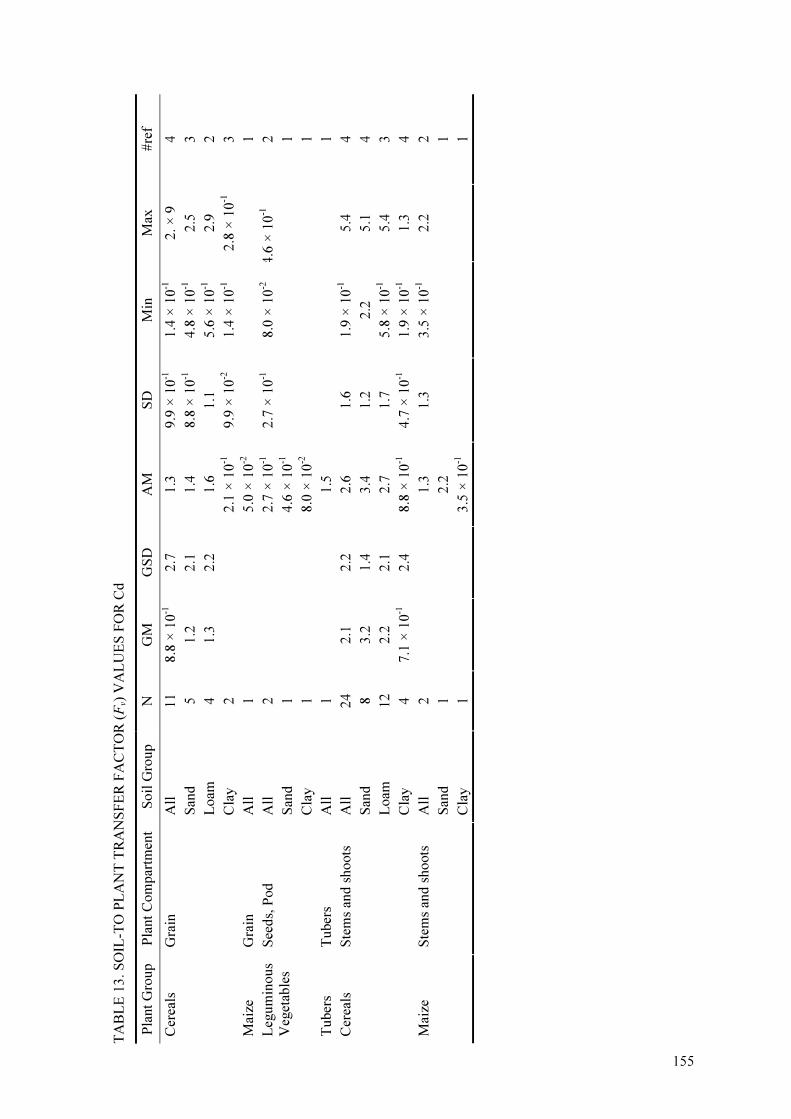
TA
BL
E 1
3.
SO
IL-T
O P
LA
NT
TR
AN
SF
ER
FA
CT
OR
(Fv)
VA
LU
ES
FO
R C
d
Pla
nt
Gro
up
Pla
nt
Co
mp
artm
ent
So
il G
roup
N
GM
G
SD
A
M
SD
M
in
Max
#
ref
All
11
8.8
× 1
0-1
2.7
1.3
9
.9 ×
10-1
1.4
× 1
0-1
2
. ×
9
4
San
d
5
1.2
2.1
1.4
8
.8 ×
10-1
4.8
× 1
0-1
2
.5
3
Lo
am
4
1.3
2.2
1.6
1
.1
5.6
× 1
0-1
2
.9
2
Cer
eals
G
rain
Cla
y
2
2.1
× 1
0-1
9.9
× 1
0-2
1.4
× 1
0-1
2.8
× 1
0-1
3
Mai
ze
Gra
in
All
1
5.0
× 1
0-2
1
All
2
2.7
× 1
0-1
2.7
× 1
0-1
8.0
× 1
0-2
4
.6 ×
10-1
2
San
d
1
4.6
× 1
0-1
1
Leg
um
inous
Veg
etab
les
See
ds,
Pod
Cla
y
1
8.0
× 1
0-2
1
Tuber
s T
uber
s A
ll
1
1.5
1
All
24
2.1
2.2
2.6
1
.6
1.9
× 1
0-1
5
.4
4
San
d
8
3.2
1.4
3.4
1
.2
2.2
5
.1
4
Lo
am
12
2.2
2.1
2.7
1
.7
5.8
× 1
0-1
5
.4
3
Cer
eals
S
tem
s an
d s
ho
ots
Cla
y
4
7.1
× 1
0-1
2.4
8.8
× 1
0-1
4.7
× 1
0-1
1.9
× 1
0-1
1
.3
4
All
2
1.3
1
.3
3.5
× 1
0-1
2
.2
2
San
d
1
2.2
1
Mai
ze
Ste
ms
and
sh
oots
Cla
y
1
3.5
× 1
0-1
1
1 55
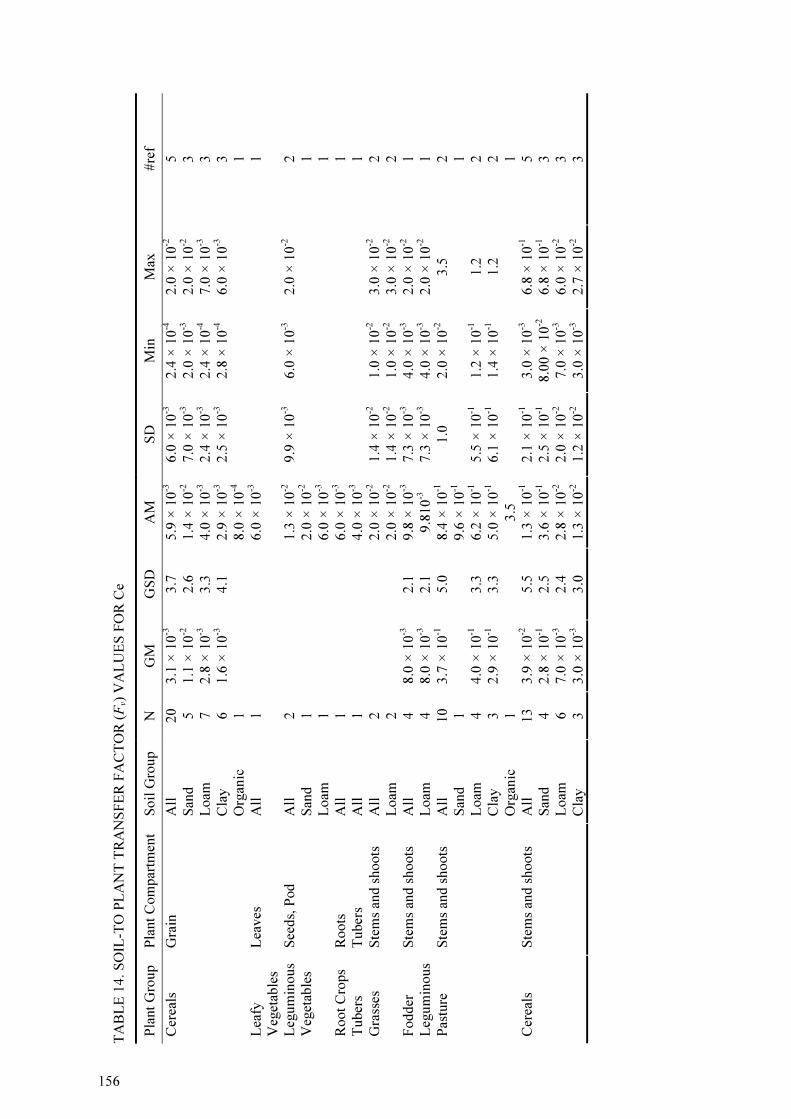
TA
BL
E 1
4.
SO
IL-T
O P
LA
NT
TR
AN
SF
ER
FA
CT
OR
(Fv)
VA
LU
ES
FO
R C
e
Pla
nt
Gro
up
Pla
nt
Co
mp
artm
ent
So
il G
roup
N
GM
G
SD
A
M
SD
M
in
Max
#
ref
All
20
3.1
× 1
0-3
3.7
5.9
× 1
0-3
6.0
× 1
0-3
2.4
× 1
0-4
2.0
× 1
0-2
5
San
d
5
1.1
× 1
0-2
2.6
1.4
× 1
0-2
7.0
× 1
0-3
2.0
× 1
0-3
2.0
× 1
0-2
3
Lo
am
7
2.8
× 1
0-3
3.3
4.0
× 1
0-3
2.4
× 1
0-3
2.4
× 1
0-4
7.0
× 1
0-3
3
Cla
y
6
1.6
× 1
0-3
4.1
2.9
× 1
0-3
2.5
× 1
0-3
2.8
× 1
0-4
6.0
× 1
0-3
3
Cer
eals
G
rain
Org
anic
1
8.0
× 1
0-4
1
Lea
fy
Veg
etab
les
Lea
ves
A
ll
1
6.0
× 1
0-3
1
All
2
1.3
× 1
0-2
9.9
× 1
0-3
6.0
× 1
0-3
2.0
× 1
0-2
2
San
d
1
2.0
× 1
0-2
1
Leg
um
inous
Veg
etab
les
See
ds,
Pod
Lo
am
1
6.0
× 1
0-3
1
Root
Cro
ps
Ro
ots
A
ll
1
6.0
× 1
0-3
1
Tuber
s T
uber
s A
ll
1
4.0
× 1
0-3
1
All
2
2.0
× 1
0-2
1.4
× 1
0-2
1.0
× 1
0-2
3.0
× 1
0-2
2
G
rass
es
Ste
ms
and
sh
oots
Lo
am
2
2.0
× 1
0-2
1.4
× 1
0-2
1.0
× 1
0-2
3.0
× 1
0-2
2
All
4
8.0
× 1
0-3
2.1
9.8
× 1
0-3
7.3
× 1
0-3
4.0
× 1
0-3
2.0
× 1
0-2
1
F
odder
Leg
um
inous
Ste
ms
and
sh
oots
Lo
am
4
8.0
× 1
0-3
2.1
9.8
10-3
7.3
× 1
0-3
4.0
× 1
0-3
2.0
× 1
0-2
1
All
10
3.7
× 1
0-1
5.0
8.4
× 1
0-1
1.0
2
.0 ×
10-2
3
.5
2
San
d
1
9.6
× 1
0-1
1
Lo
am
4
4.0
× 1
0-1
3.3
6.2
× 1
0-1
5.5
× 1
0-1
1.2
× 1
0-1
1
.2
2
Cla
y
3
2.9
× 1
0-1
3.3
5.0
× 1
0-1
6.1
× 1
0-1
1.4
× 1
0-1
1
.2
2
Pas
ture
S
tem
s an
d s
ho
ots
Org
anic
1
3.5
1
All
13
3.9
× 1
0-2
5.5
1.3
× 1
0-1
2.1
× 1
0-1
3.0
× 1
0-3
6.8
× 1
0-1
5
San
d
4
2.8
× 1
0-1
2.5
3.6
× 1
0-1
2.5
× 1
0-1
8
.00
× 1
0-2
6.8
× 1
0-1
3
Lo
am
6
7.0
× 1
0-3
2.4
2.8
× 1
0-2
2.0
× 1
0-2
7.0
× 1
0-3
6.0
× 1
0-2
3
Cer
eals
S
tem
s an
d s
ho
ots
Cla
y
3
3.0
× 1
0-3
3.0
1.3
× 1
0-2
1.2
× 1
0-2
3.0
× 1
0-3
2.7
× 1
0-2
3
156

TA
BL
E 1
5.
SO
IL-T
O P
LA
NT
TR
AN
SF
ER
FA
CT
OR
(Fv)
VA
LU
ES
FO
R C
m
Pla
nt
Gro
up
Pla
nt
Co
mp
artm
ent
Soil
Gro
up
N
GM
G
SD
A
M
SD
M
in
Max
#
ref
All
67
2.3
× 1
0-5
3.3
4.1
× 1
0-5
4.3
× 1
0-5
1.4
× 1
0-6
2.0
× 1
0-4
2
C
erea
ls
Gra
in
San
d
66
2.3
× 1
0-5
3.3
4.2
× 1
0-5
4.9
× 1
0-5
1.4
× 1
0-6
2.9
× 1
0-4
1
All
7
1.4
× 1
0-3
4.5
2.8
× 1
0-3
3.0
× 1
0-3
2.0
× 1
0-4
8.1
× 1
0-3
2
L
eafy
Veg
etab
les
Lea
ves
San
d
6
1.9
× 1
0-3
3.7
3.3
× 1
0-3
3.0
× 1
0-3
3.0
× 1
0-4
8.1
× 1
0-3
1
All
8
3.2
× 1
0-4
4.5
6.4
× 1
0-4
6.0
× 1
0-4
3.6
× 1
0-5
1.4
× 1
0-3
2
N
on-l
eafy
Veg
etab
les
Fru
its
San
d
8
2.9
× 1
0-4
4.5
6.3
× 1
0-4
6.1
× 1
0-4
3.6
× 1
0-5
1.4
× 1
0-3
1
All
17
7.5
× 1
0-4
1.5
8.2
× 1
0-4
3.5
× 1
0-4
4.2
× 1
0-4
1.6
× 1
0-3
1
L
egu
min
ous
Veg
etab
les
See
ds,
Pod
San
d
17
7.5
× 1
0-4
1.5
8.2
× 1
0-4
3.5
× 1
0-4
4.2
× 1
0-4
1.6
× 1
0-3
1
All
6
8.5
× 1
0-4
3.0
1.3
× 1
0-3
1.4
× 1
0-3
2.0
× 1
0-4
3.9
× 1
0-3
2
R
oot
Cro
ps
Ro
ots
San
d
5
1.1
× 1
0-3
2.5
1.6
× 1
0-3
1.4
× 1
0-3
4.1
× 1
0-4
3.9
× 1
0-3
1
All
66
1.5
× 1
0-4
3.7
3.4
× 1
0-4
4.2
× 1
0-4
1.1
× 1
0-5
2.1
× 1
0-3
2
T
uber
s T
uber
s
San
d
65
1.5
× 1
0-4
4.1
3.4
× 1
0-4
4.2
× 1
0-4
1.1
× 1
0-5
2.1
× 1
0-3
1
All
17
1.0
× 1
0-3
2.4
1.4
× 1
0-3
1.0
× 1
0-3
1.0
× 1
0-4
3.6
× 1
0-3
2
San
d
6
2.1
× 1
0-3
1.7
2.3
× 1
0-3
1.1
× 1
0-3
1.1
× 1
0-3
3.6
× 1
0-3
1
Loam
8
8.3
× 1
0-4
1.4
8.7
× 1
0-4
2.9
× 1
0-4
4.6
× 1
0-4
1.4
× 1
0-3
1
Pas
ture
S
tem
s an
d s
ho
ots
Cla
y
2
2.5
× 1
0-4
2.1
× 1
0-4
1.0
× 1
0-4
4.0
× 1
0-4
1
All
71
2.0
× 1
0-4
5.0
5.2
× 1
0-4
7.8
× 1
0-4
5.7
× 1
0-6
4.4
× 1
0-3
1
M
aize
S
tem
s an
d s
ho
ots
San
d
71
2.0
× 1
0-4
5.0
5.2
× 1
0-4
7.8
× 1
0-4
5.7
× 1
0-6
4.4
× 1
0-3
1
157
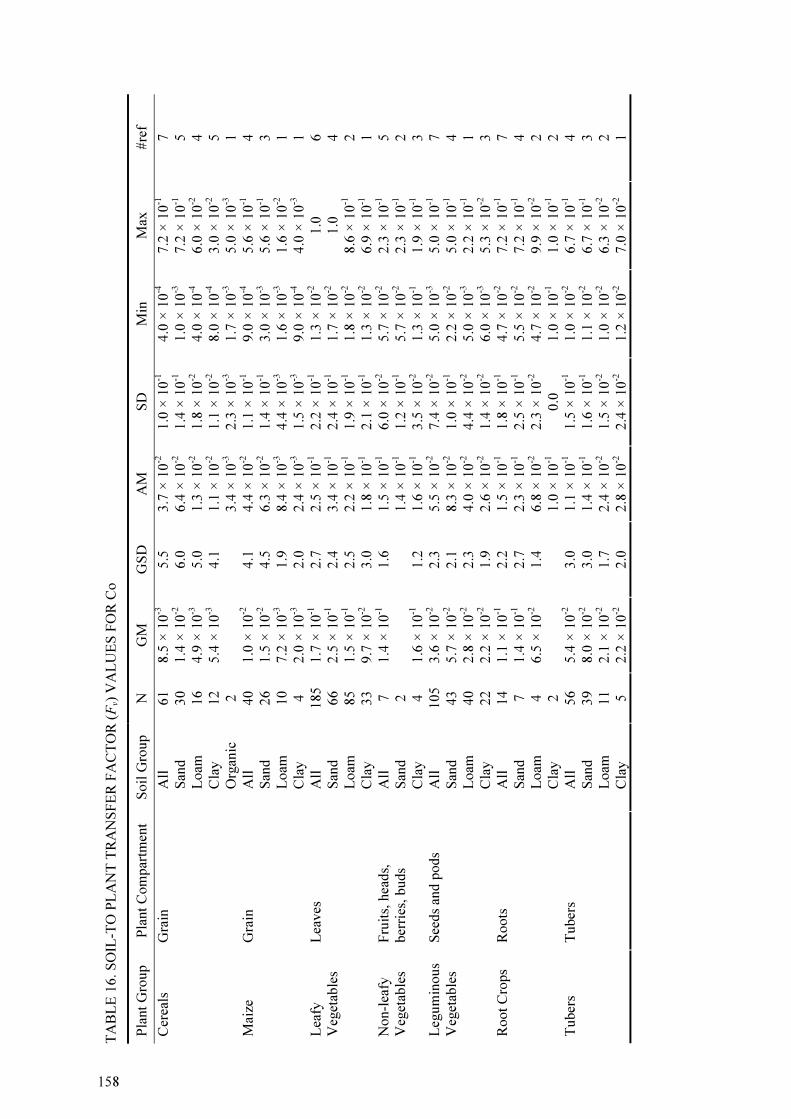
TA
BL
E 1
6.
SO
IL-T
O P
LA
NT
TR
AN
SF
ER
FA
CT
OR
(Fv)
VA
LU
ES
FO
R C
o
Pla
nt
Gro
up
Pla
nt
Co
mp
artm
ent
So
il G
roup
N
GM
G
SD
A
M
SD
M
in
Max
#
ref
All
61
8.5
× 1
0-3
5.5
3.7
× 1
0-2
1.0
× 1
0-1
4.0
× 1
0-4
7.2
× 1
0-1
7
San
d
30
1.4
× 1
0-2
6.0
6.4
× 1
0-2
1.4
× 1
0-1
1.0
× 1
0-3
7.2
× 1
0-1
5
Loam
16
4.9
× 1
0-3
5.0
1.3
× 1
0-2
1.8
× 1
0-2
4.0
× 1
0-4
6.0
× 1
0-2
4
Cla
y
12
5.4
× 1
0-3
4.1
1.1
× 1
0-2
1.1
× 1
0-2
8.0
× 1
0-4
3.0
× 1
0-2
5
Cer
eals
G
rain
Org
anic
2
3.4
× 1
0-3
2.3
× 1
0-3
1.7
× 1
0-3
5.0
× 1
0-3
1
All
40
1.0
× 1
0-2
4.1
4.4
× 1
0-2
1.1
× 1
0-1
9.0
× 1
0-4
5.6
× 1
0-1
4
San
d
26
1.5
× 1
0-2
4.5
6.3
× 1
0-2
1.4
× 1
0-1
3.0
× 1
0-3
5.6
× 1
0-1
3
Loam
10
7.2
× 1
0-3
1.9
8.4
× 1
0-3
4.4
× 1
0-3
1.6
× 1
0-3
1.6
× 1
0-2
1
Mai
ze
Gra
in
Cla
y
4
2.0
× 1
0-3
2.0
2.4
× 1
0-3
1.5
× 1
0-3
9.0
× 1
0-4
4.0
× 1
0-3
1
All
185
1.7
× 1
0-1
2.7
2.5
× 1
0-1
2.2
× 1
0-1
1.3
× 1
0-2
1
.0
6
San
d
66
2.5
× 1
0-1
2.4
3.4
× 1
0-1
2.4
× 1
0-1
1.7
× 1
0-2
1
.0
4
Lo
am
85
1.5
× 1
0-1
2.5
2.2
× 1
0-1
1.9
× 1
0-1
1.8
× 1
0-2
8.6
× 1
0-1
2
Lea
fy
Veg
etab
les
Lea
ves
Cla
y
33
9.7
× 1
0-2
3.0
1.8
× 1
0-1
2.1
× 1
0-1
1.3
× 1
0-2
6.9
× 1
0-1
1
All
7
1.4
× 1
0-1
1.6
1.5
× 1
0-1
6.0
× 1
0-2
5.7
× 1
0-2
2.3
× 1
0-1
5
San
d
2
1.4
× 1
0-1
1.2
× 1
0-1
5.7
× 1
0-2
2.3
× 1
0-1
2
Non-l
eafy
V
eget
able
s F
ruit
s, h
ead
s,
ber
ries
, b
uds
Cla
y
4
1.6
× 1
0-1
1.2
1.6
× 1
0-1
3.5
× 1
0-2
1.3
× 1
0-1
1.9
× 1
0-1
3
All
105
3.6
× 1
0-2
2.3
5.5
× 1
0-2
7.4
× 1
0-2
5.0
× 1
0-3
5.0
× 1
0-1
7
San
d
43
5.7
× 1
0-2
2.1
8.3
× 1
0-2
1.0
× 1
0-1
2.2
× 1
0-2
5.0
× 1
0-1
4
Loam
40
2.8
× 1
0-2
2.3
4.0
× 1
0-2
4.4
× 1
0-2
5.0
× 1
0-3
2.2
× 1
0-1
1
Leg
um
inous
Veg
etab
les
See
ds
and
po
ds
Cla
y
22
2.2
× 1
0-2
1.9
2.6
× 1
0-2
1.4
× 1
0-2
6.0
× 1
0-3
5.3
× 1
0-2
3
All
14
1.1
× 1
0-1
2.2
1.5
× 1
0-1
1.8
× 1
0-1
4.7
× 1
0-2
7.2
× 1
0-1
7
San
d
7
1.4
× 1
0-1
2.7
2.3
× 1
0-1
2.5
× 1
0-1
5.5
× 1
0-2
7.2
× 1
0-1
4
Loam
4
6.5
× 1
0-2
1.4
6.8
× 1
0-2
2.3
× 1
0-2
4.7
× 1
0-2
9.9
× 1
0-2
2
Root
Cro
ps
Ro
ots
Cla
y
2
1.0
× 1
0-1
0
.0
1.0
× 1
0-1
1.0
× 1
0-1
2
All
56
5.4
× 1
0-2
3.0
1.1
× 1
0-1
1.5
× 1
0-1
1.0
× 1
0-2
6.7
× 1
0-1
4
San
d
39
8.0
× 1
0-2
3.0
1.4
× 1
0-1
1.6
× 1
0-1
1.1
× 1
0-2
6.7
× 1
0-1
3
Loam
11
2.1
× 1
0-2
1.7
2.4
× 1
0-2
1.5
× 1
0-2
1.0
× 1
0-2
6.3
× 1
0-2
2
Tuber
s T
uber
s
Cla
y
5
2.2
× 1
0-2
2.0
2.8
× 1
0-2
2.4
× 1
0-2
1.2
× 1
0-2
7.0
× 1
0-2
1
1 58
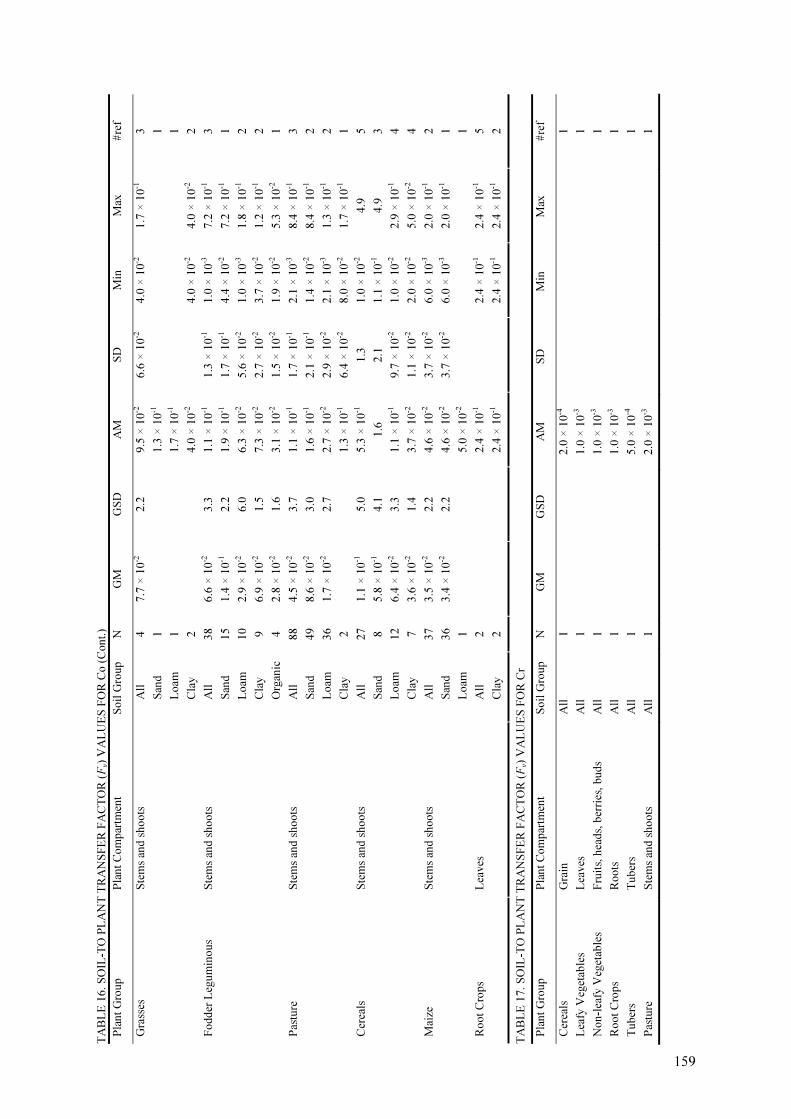
TA
BL
E 1
6. S
OIL
-TO
PL
AN
T T
RA
NS
FE
R F
AC
TO
R (Fv)
VA
LU
ES
FO
R C
o (
Con
t.)
Pla
nt
Gro
up
P
lan
t C
om
par
tmen
t S
oil
Gro
up
N
G
M
GS
D
AM
S
D
Min
M
ax
#re
f
All
4
7
.7 ×
10-2
2.2
9
.5 ×
10-2
6.6
× 1
0-2
4.0
× 1
0-2
1.7
× 1
0-1
3
San
d
1
1.3
× 1
0-1
1
Lo
am
1
1
.7 ×
10-1
1
Gra
sses
S
tem
s an
d s
ho
ots
Cla
y
2
4.0
× 1
0-2
4
.0 ×
10-2
4.0
× 1
0-2
2
All
3
8
6.6
× 1
0-2
3.3
1
.1 ×
10-1
1.3
× 1
0-1
1.0
× 1
0-3
7.2
× 1
0-1
3
San
d
15
1
.4 ×
10-1
2.2
1
.9 ×
10-1
1.7
× 1
0-1
4.4
× 1
0-2
7.2
× 1
0-1
1
Lo
am
1
0
2.9
× 1
0-2
6.0
6
.3 ×
10-2
5.6
× 1
0-2
1.0
× 1
0-3
1.8
× 1
0-1
2
Cla
y
9
6.9
× 1
0-2
1.5
7
.3 ×
10-2
2.7
× 1
0-2
3.7
× 1
0-2
1.2
× 1
0-1
2
Fo
dd
er L
egu
min
ou
s S
tem
s an
d s
ho
ots
Org
anic
4
2
.8 ×
10-2
1.6
3
.1 ×
10-2
1.5
× 1
0-2
1.9
× 1
0-2
5.3
× 1
0-2
1
All
8
8
4.5
× 1
0-2
3.7
1
.1 ×
10-1
1.7
× 1
0-1
2.1
× 1
0-3
8.4
× 1
0-1
3
San
d
49
8
.6 ×
10-2
3.0
1
.6 ×
10-1
2.1
× 1
0-1
1.4
× 1
0-2
8.4
× 1
0-1
2
Lo
am
3
6
1.7
× 1
0-2
2.7
2
.7 ×
10-2
2.9
× 1
0-2
2.1
× 1
0-3
1.3
× 1
0-1
2
Pas
ture
S
tem
s an
d s
ho
ots
Cla
y
2
1.3
× 1
0-1
6.4
× 1
0-2
8.0
× 1
0-2
1.7
× 1
0-1
1
All
2
7
1.1
× 1
0-1
5.0
5
.3 ×
10-1
1.3
1
.0 ×
10-2
4.9
5
San
d
8
5.8
× 1
0-1
4.1
1
.6
2.1
1
.1 ×
10-1
4.9
3
Lo
am
1
2
6.4
× 1
0-2
3.3
1
.1 ×
10-1
9.7
× 1
0-2
1.0
× 1
0-2
2.9
× 1
0-1
4
Cer
eals
S
tem
s an
d s
ho
ots
Cla
y
7
3.6
× 1
0-2
1.4
3
.7 ×
10-2
1.1
× 1
0-2
2.0
× 1
0-2
5.0
× 1
0-2
4
All
3
7
3.5
× 1
0-2
2.2
4
.6 ×
10-2
3.7
× 1
0-2
6.0
× 1
0-3
2.0
× 1
0-1
2
San
d
36
3
.4 ×
10-2
2.2
4
.6 ×
10-2
3.7
× 1
0-2
6.0
× 1
0-3
2.0
× 1
0-1
1
Mai
ze
Ste
ms
and
sh
oo
ts
Lo
am
1
5
.0 ×
10-2
1
All
2
2
.4 ×
10-1
2
.4 ×
10-1
2.4
× 1
0-1
5
Ro
ot
Cro
ps
Lea
ves
Cla
y
2
2.4
× 1
0-1
2
.4 ×
10-1
2.4
× 1
0-1
2
TA
BL
E 1
7. S
OIL
-TO
PL
AN
T T
RA
NS
FE
R F
AC
TO
R (Fv)
VA
LU
ES
FO
R C
r
Pla
nt
Gro
up
P
lan
t C
om
par
tmen
t S
oil
Gro
up
N
G
M
GS
D
AM
S
D
Min
M
ax
#re
f
Cer
eals
G
rain
A
ll
1
2.0
× 1
0-4
1
Lea
fy V
eget
able
s L
eaves
A
ll
1
1.0
× 1
0-3
1
No
n-l
eafy
Veg
etab
les
Fru
its,
hea
ds,
ber
ries
, bu
ds
All
1
1
.0 ×
10-3
1
Ro
ot
Cro
ps
Ro
ots
A
ll
1
1.0
× 1
0-3
1
Tu
ber
s T
ub
ers
All
1
5
.0 ×
10-4
1
Pas
ture
S
tem
s an
d s
ho
ots
A
ll
1
2.0
× 1
0-3
1
15 9

TA
BL
E 1
8.
SO
IL-T
O P
LA
NT
TR
AN
SF
ER
FA
CT
OR
(Fv)
VA
LU
ES
FO
R C
s
Pla
nt
Gro
up
Pla
nt
Co
mp
artm
ent
So
il G
roup
N
GM
G
SD
A
M
SD
M
in
Max
#
ref
All
470
2.9
× 1
0-2
4.1
7.6
× 1
0-2
1.5
× 1
0-1
2.0
× 1
0-4
9.0
× 1
0-1
3
1
San
d
156
3.9
× 1
0-2
3.3
8.0
× 1
0-2
1.2
× 1
0-1
2.0
× 1
0-3
6.6
× 1
0-1
2
6
Lo
am
158
2.0
× 1
0-2
4.1
4.3
× 1
0-2
5.0
× 1
0-2
8.0
× 1
0-4
2.0
× 1
0-1
1
9
Cla
y
110
1.1
× 1
0-2
2.7
1.8
× 1
0-2
1.7
× 1
0-2
2.0
× 1
0-4
9.0
× 1
0-2
2
0
Cer
eals
G
rain
Org
anic
28
4.3
× 1
0-2
2.7
8.3
× 1
0-2
1
.56
× 1
0-1
1.0
× 1
0-2
7.3
× 1
0-1
8
All
67
3.3
× 1
0-2
3.0
5.5
× 1
0-2
5.7
× 1
0-2
3.0
× 1
0-3
2.6
× 1
0-1
5
San
d
47
4.9
× 1
0-2
2.4
6.9
× 1
0-2
6.2
× 1
0-2
8.0
× 1
0-3
2.6
× 1
0-1
3
Lo
am
14
1.6
× 1
0-2
2.7
2.3
× 1
0-2
2.0
× 1
0-2
3.2
× 1
0-3
7.0
× 1
0-2
1
Mai
ze
Gra
in
Cla
y
11
1.2
× 1
0-2
3.3
2.2
× 1
0-2
2.4
× 1
0-2
3.0
× 1
0-3
7.0
× 1
0-2
3
All
290
6.0
× 1
0-2
6.0
1.7
× 1
0-1
2.1
× 1
0-1
3.0
× 1
0-4
9.8
× 1
0-1
8
San
d
96
1.2
× 1
0-1
4.1
2.4
× 1
0-1
2.4
× 1
0-1
2.1
× 1
0-3
9.8
× 1
0-1
6
Lo
am
119
7.4
× 1
0-2
5.0
1.8
× 1
0-1
2.0
× 1
0-1
3.0
× 1
0-4
7.3
× 1
0-1
5
Cla
y
67
1.8
× 1
0-2
6.7
8.7
× 1
0-2
1.7
× 1
0-1
5.0
× 1
0-4
7.2
× 1
0-1
4
Lea
fy
Veg
etab
les
Lea
ves
Org
anic
7
2.2
5 ×
10-2
7.4
1.2
× 1
0-1
2.0
× 1
0-1
4.0
× 1
0-3
4.6
× 1
0-1
2
All
38
2.1
× 1
0-2
4.1
7.0
× 1
0-2
1.5
× 1
0-1
7.0
× 1
0-4
7.3
× 1
0-1
7
San
d
17
3.5
× 1
0-2
4.1
1.1
× 1
0-1
2.1
× 1
0-1
1.2
× 1
0-2
7.3
× 1
0-1
6
Lo
am
5
3.3
× 1
0-2
5.5
9.4
× 1
0-2
1.3
× 1
0-1
6.3
× 1
0-3
3.0
× 1
0-1
2
Non-l
eafy
V
eget
able
s F
ruit
s, h
ead
s, b
erri
es,
bu
ds
Cla
y
14
9.1
× 1
0-3
2.2
1.1
× 1
0-2
3.7
× 1
0-3
7.0
× 1
0-4
1.6
× 1
0-2
5
All
126
4.0
× 1
0-2
3.7
8.5
× 1
0-2
1.1
× 1
0-1
1.0
× 1
0-3
7.1
× 1
0-1
1
0
San
d
66
8.7
× 1
0-2
2.5
1.3
× 1
0-1
1.3
× 1
0-1
3.5
× 1
0-3
7.1
× 1
0-1
5
Lo
am
42
2.0
× 1
0-2
3.3
4.3
× 1
0-2
7.3
× 1
0-2
1.0
× 1
0-3
4.2
× 1
0-1
4
Leg
um
inous
Veg
etab
les
See
ds
and
po
ds
Cla
y
18
1.3
× 1
0-2
3.0
2.2
× 1
0-2
2.2
× 1
0-2
2.0
× 1
0-3
8.1
× 1
0-2
3
All
81
4.2
× 1
0-2
3.0
7.5
× 1
0-2
1.1
× 1
0-1
1.0
× 1
0-3
8.8
× 1
0-1
1
0
San
d
37
6.2
× 1
0-2
2.5
9.1
× 1
0-2
8.8
× 1
0-2
8.0
× 1
0-3
4.0
× 1
0-1
1
0
Lo
am
21
3.0
× 1
0-2
3.7
5.3
× 1
0-2
4.7
× 1
0-2
1.0
× 1
0-3
1.6
× 1
0-1
5
Cla
y
17
2.4
× 1
0-2
2.2
3.0
× 1
0-2
2.0
× 1
0-2
5.0
× 1
0-3
6.0
× 1
0-2
6
Root
Cro
ps
Ro
ots
Org
anic
5
5.9
× 1
0-2
5.0
2.0
× 1
0-1
3.8
× 1
0-1
1.6
× 1
0-2
8.8
× 1
0-1
3
1 60

TA
BL
E 1
8.
SO
IL-T
O P
LA
NT
TR
AN
SF
ER
FA
CT
OR
(Fv)
VA
LU
ES
FO
R C
s (C
ont.
)
Pla
nt
Gro
up
Pla
nt
Co
mp
artm
ent
So
il G
roup
N
GM
G
SD
A
M
SD
M
in
Max
#
ref
All
138
5.6
× 1
0-2
3.0
1.0
× 1
0-1
1.2
× 1
0-1
4.0
× 1
0-3
6.0
× 1
0-1
9
San
d
69
9.3
× 1
0-2
3.0
1.5
× 1
0-1
1.4
× 1
0-1
4.0
× 1
0-3
6.0
× 1
0-1
9
L
oam
40
3.5
× 1
0-2
2.3
4.6
× 1
0-2
3.3
× 1
0-2
4.8
× 1
0-3
1.4
× 1
0-1
5
C
lay
21
2.5
× 1
0-2
2.2
3.2
× 1
0-2
2.3
× 1
0-2
5.0
× 1
0-3
9.0
× 1
0-2
6
Tuber
s T
uber
s
Org
anic
7
5.8
× 1
0-2
3.7
1.3
× 1
0-1
1.9
× 1
0-1
1
.61
0-2
5.4
× 1
0-1
4
A
ll
64
6.3
× 1
0-2
36.6
1.3
× 1
0-1
1.8
× 1
0-1
4.8
× 1
0-3
9.9
× 1
0-1
8
San
d
41
8.4
× 1
0-2
3.3
1.6
× 1
0-1
2.1
× 1
0-1
1.0
× 1
0-2
9.9
× 1
0-1
6
L
oam
10
4.8
× 1
0-2
2.3
6.5
× 1
0-2
5.8
× 1
0-2
1.2
× 1
0-2
2.1
× 1
0-1
4
Cla
y
9
1.2
× 1
0-2
2.1
1.6
× 1
0-2
1.3
× 1
0-2
4.8
× 1
0-3
4.3
× 1
0-2
3
Gra
sses
S
tem
s an
d s
ho
ots
Org
anic
4
2.8
× 1
0-1
1.2
2.9
× 1
0-1
5.8
× 1
0-2
2.1
× 1
0-1
3.4
× 1
0-1
1
A
ll
85
1.6
× 1
0-1
3.3
3.1
× 1
0-1
3.7
× 1
0-1
1.0
× 1
0-2
1
.8
8
San
d
29
2.4
× 1
0-1
3.7
4.6
× 1
0-1
4.9
× 1
0-1
1.8
× 1
0-2
1
.8
7
Lo
am
51
1.5
× 1
0-1
3.0
2.5
× 1
0-1
2.6
× 1
0-1
1.0
× 1
0-2
1
.2
5
Fodder
Leg
um
inous
Ste
ms
and
sh
oots
Cla
y
4
4.6
× 1
0-2
4.1
9.5
× 1
0-2
1.4
× 1
0-1
1.3
× 1
0-2
3.0
× 1
0-1
3
A
ll
401
2.5
× 1
0-1
4.1
5.5
× 1
0-1
8.2
× 1
0-1
1.0
× 1
0-2
5
.0
16
S
and
169
2.9
× 1
0-1
4.1
6.4
× 1
0-1
8.6
× 1
0-1
1.0
× 1
0-2
4
.8
14
Lo
am
124
1.9
× 1
0-1
4.1
4.3
× 1
0-1
5.7
× 1
0-1
1.0
× 1
0-2
2
.6
12
C
lay
75
1.8
× 1
0-1
3.7
3.4
× 1
0-1
3.3
× 1
0-1
1.0
× 1
0-2
1
.2
11
Pas
ture
S
tem
s an
d s
ho
ots
Org
anic
31
7.6
× 1
0-1
2.2
1.1
1
.2
3.0
× 1
0-1
5
.0
6
Her
bs
Ste
ms
and
sh
oots
A
ll
4
6.6
× 1
0-2
14.9
7.2
× 1
0-1
1
.4
4.8
× 1
0-3
2
.8
3
Oth
er C
rops
A
ll
9
3.1
× 1
0-1
4.5
6.8
× 1
0-1
8.0
× 1
0-1
3.6
× 1
0-2
2
.2
4
All
130
1.5
× 1
0-1
5.0
3.6
× 1
0-1
7.2
× 1
0-1
4.3
× 1
0-3
3
.7
22
S
and
35
2.1
× 1
0-1
3.3
4.1
× 1
0-1
5.0
× 1
0-1
4.1
× 1
0-2
1
.9
8
Lo
am
36
1.1
× 1
0-1
4.5
2.7
× 1
0-1
3.9
× 1
0-1
6.5
× 1
0-3
1
.5
9
Cer
eals
S
tem
s an
d s
ho
ots
Cla
y
37
5.6
× 1
0-2
3.7
1.1
× 1
0-1
1.2
× 1
0-1
4.3
× 1
0-3
5.3
× 1
0-1
9
A
ll
101
7.3
× 1
0-2
3.0
1.2
× 1
0-1
1.1
× 1
0-1
3.0
× 1
0-3
4.9
× 1
0-1
9
San
d
77
1.0
× 1
0-1
2.3
1.4
× 1
0-1
1.2
× 1
0-1
1.4
× 1
0-2
4.9
× 1
0-1
7
L
oam
10
1.5
× 1
0-2
2.5
2.1
× 1
0-2
1.8
× 1
0-2
3.0
× 1
0-3
5.2
× 1
0-2
4
Cla
y
11
2.2
× 1
0-2
2.1
2.9
× 1
0-2
2.0
× 1
0-2
7.8
× 1
0-3
6.0
× 1
0-2
5
Mai
ze
Ste
ms
and
sh
oots
Org
anic
3
1.4
× 1
0-1
1.3
1.4
× 1
0-1
3.2
× 1
0-2
1.0
× 1
0-1
1.6
× 1
0-1
2
161

TA
BL
E 1
8.
SO
IL-T
O P
LA
NT
TR
AN
SF
ER
FA
CT
OR
(Fv)
VA
LU
ES
Cs
(Cont.
)
Pla
nt
Gro
up
Pla
nt
Co
mp
artm
ent
So
il G
roup
N
GM
G
SD
A
M
SD
M
in
Max
#
ref
All
12
3.5
× 1
0-2
3.0
6.8
× 1
0-2
1.2
× 1
0-1
6.0
× 1
0-3
4.5
× 1
0-1
2
San
d
3
1.1
× 1
0-1
3.3
1.9
× 1
0-1
2.1
× 1
0-3
5.1
× 1
0-2
4.5
× 1
0-1
1
Lo
am
2
2.6
× 1
0-2
2.4
× 1
0-2
9.0
× 1
0-3
4.3
× 1
0-2
2
Root
crops
Lea
ves
Cla
y
7
2.6
× 1
0-2
2.1
3.0
× 1
0-2
1.4
× 1
0-2
6.0
× 1
0-3
4.7
× 1
0-2
2
TA
BL
E 1
9.
SO
IL-T
O P
LA
NT
TR
AN
SF
ER
FA
CT
OR
(Fv)
VA
LU
ES
FO
R F
e
Pla
nt
Gro
up
Pla
nt
Co
mp
artm
ent
So
il G
roup
N
GM
G
SD
A
M
SD
M
in
Max
#
ref
Cer
eals
G
rain
A
ll
1
2.0
× 1
0-4
1
Lea
fy
Veg
etab
les
Lea
ves
A
ll
1
1.0
× 1
0-3
1
Non-l
eafy
Veg
etab
les
Fru
its,
hea
ds,
ber
ries
, b
uds
All
1
1.0
× 1
0-3
1
Leg
um
inous
Veg
etab
les
Ste
ms
and
sh
oots
A
ll
3
3.7
× 1
0-1
1.3
3.8
× 1
0-1
9.3
× 1
0-2
3.0
× 1
0-1
4.8
× 1
0-1
2
Root
Cro
ps
Ro
ots
A
ll
1
1.0
× 1
0-3
1
Tuber
s T
uber
s A
ll
1
5.0
× 1
0-4
1
Pas
ture
S
tem
s an
d s
ho
ots
A
ll
1
2.0
× 1
0-3
1
Cer
eals
S
tem
s an
d s
ho
ots
A
ll
3
2.9
× 1
0-1
1.3
2.9
× 1
0-1
6.6
× 1
0-2
2.2
× 1
0-1
3.5
× 1
0-1
2
1 62
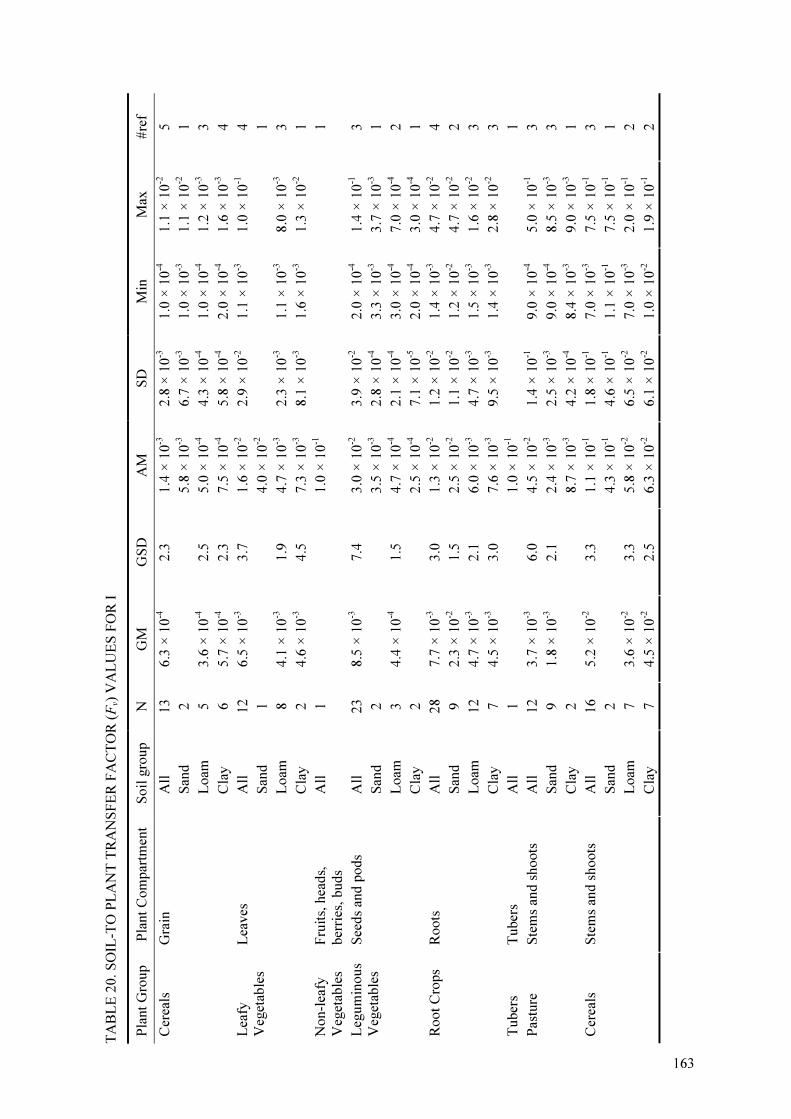
TA
BL
E 2
0.
SO
IL-T
O P
LA
NT
TR
AN
SF
ER
FA
CT
OR
(Fv)
VA
LU
ES
FO
R I
Pla
nt
Gro
up
Pla
nt
Co
mp
artm
ent
So
il g
roup
N
GM
G
SD
A
M
SD
M
in
Max
#
ref
All
13
6.3
× 1
0-4
2.3
1.4
× 1
0-3
2.8
× 1
0-3
1.0
× 1
0-4
1.1
× 1
0-2
5
San
d
2
5.8
× 1
0-3
6.7
× 1
0-3
1.0
× 1
0-3
1.1
× 1
0-2
1
Loam
5
3.6
× 1
0-4
2.5
5.0
× 1
0-4
4.3
× 1
0-4
1.0
× 1
0-4
1.2
× 1
0-3
3
Cer
eals
G
rain
Cla
y
6
5.7
× 1
0-4
2.3
7.5
× 1
0-4
5.8
× 1
0-4
2.0
× 1
0-4
1.6
× 1
0-3
4
All
12
6.5
× 1
0-3
3.7
1.6
× 1
0-2
2.9
× 1
0-2
1.1
× 1
0-3
1.0
× 1
0-1
4
San
d
1
4.0
× 1
0-2
1
Loam
8
4.1
× 1
0-3
1.9
4.7
× 1
0-3
2.3
× 1
0-3
1.1
× 1
0-3
8.0
× 1
0-3
3
Lea
fy
Veg
etab
les
Lea
ves
Cla
y
2
4.6
× 1
0-3
4.5
7.3
× 1
0-3
8.1
× 1
0-3
1.6
× 1
0-3
1.3
× 1
0-2
1
Non-l
eafy
Veg
etab
les
Fru
its,
hea
ds,
ber
ries
, b
uds
All
1
1.0
× 1
0-1
1
All
23
8.5
× 1
0-3
7.4
3.0
× 1
0-2
3.9
× 1
0-2
2.0
× 1
0-4
1.4
× 1
0-1
3
San
d
2
3.5
× 1
0-3
2.8
× 1
0-4
3.3
× 1
0-3
3.7
× 1
0-3
1
Loam
3
4.4
× 1
0-4
1.5
4.7
× 1
0-4
2.1
× 1
0-4
3.0
× 1
0-4
7.0
× 1
0-4
2
Leg
um
inous
Veg
etab
les
See
ds
and
po
ds
Cla
y
2
2.5
× 1
0-4
7.1
× 1
0-5
2.0
× 1
0-4
3.0
× 1
0-4
1
All
28
7.7
× 1
0-3
3.0
1.3
× 1
0-2
1.2
× 1
0-2
1.4
× 1
0-3
4.7
× 1
0-2
4
San
d
9
2.3
× 1
0-2
1.5
2.5
× 1
0-2
1.1
× 1
0-2
1.2
× 1
0-2
4.7
× 1
0-2
2
Loam
12
4.7
× 1
0-3
2.1
6.0
× 1
0-3
4.7
× 1
0-3
1.5
× 1
0-3
1.6
× 1
0-2
3
Root
Cro
ps
Ro
ots
Cla
y
7
4.5
× 1
0-3
3.0
7.6
× 1
0-3
9.5
× 1
0-3
1.4
× 1
0-3
2.8
× 1
0-2
3
Tuber
s T
uber
s A
ll
1
1.0
× 1
0-1
1
All
12
3.7
× 1
0-3
6.0
4.5
× 1
0-2
1.4
× 1
0-1
9.0
× 1
0-4
5.0
× 1
0-1
3
San
d
9
1.8
× 1
0-3
2.1
2.4
× 1
0-3
2.5
× 1
0-3
9.0
× 1
0-4
8.5
× 1
0-3
3
Pas
ture
S
tem
s an
d s
ho
ots
Cla
y
2
8.7
× 1
0-3
4.2
× 1
0-4
8.4
× 1
0-3
9.0
× 1
0-3
1
All
16
5.2
× 1
0-2
3.3
1.1
× 1
0-1
1.8
× 1
0-1
7.0
× 1
0-3
7.5
× 1
0-1
3
San
d
2
4.3
× 1
0-1
4.6
× 1
0-1
1.1
× 1
0-1
7.5
× 1
0-1
1
Loam
7
3.6
× 1
0-2
3.3
5.8
× 1
0-2
6.5
× 1
0-2
7.0
× 1
0-3
2.0
× 1
0-1
2
Cer
eals
S
tem
s an
d s
ho
ots
Cla
y
7
4.5
× 1
0-2
2.5
6.3
× 1
0-2
6.1
× 1
0-2
1.0
× 1
0-2
1.9
× 1
0-1
2
1 63
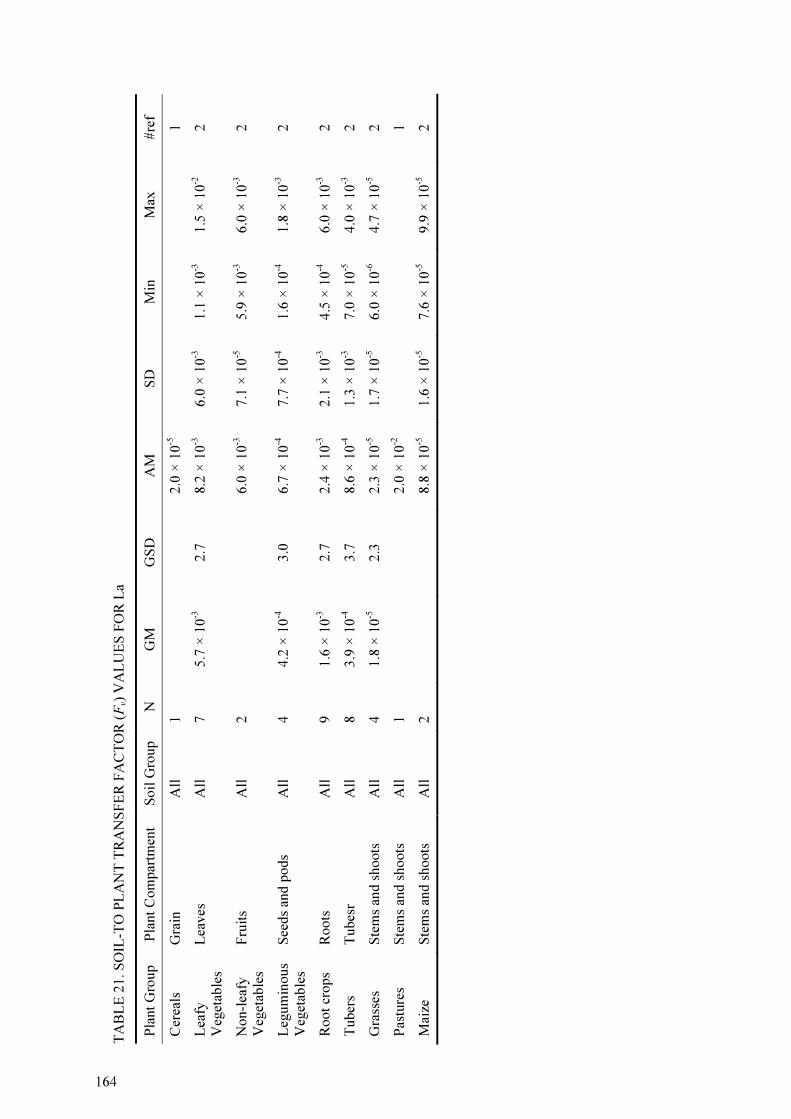
TA
BL
E 2
1.
SO
IL-T
O P
LA
NT
TR
AN
SF
ER
FA
CT
OR
(Fv)
VA
LU
ES
FO
R L
a
Pla
nt
Gro
up
Pla
nt
Co
mp
artm
ent
So
il G
roup
N
GM
G
SD
A
M
SD
M
in
Max
#
ref
Cer
eals
G
rain
A
ll
1
2.0
× 1
0-5
1
Lea
fy
Veg
etab
les
Lea
ves
A
ll
7
5.7
× 1
0-3
2.7
8.2
× 1
0-3
6.0
× 1
0-3
1.1
× 1
0-3
1.5
× 1
0-2
2
Non-l
eafy
V
eget
able
s F
ruit
s A
ll
2
6.0
× 1
0-3
7.1
× 1
0-5
5.9
× 1
0-3
6.0
× 1
0-3
2
Leg
um
inous
Veg
etab
les
See
ds
and
po
ds
All
4
4.2
× 1
0-4
3.0
6.7
× 1
0-4
7.7
× 1
0-4
1.6
× 1
0-4
1.8
× 1
0-3
2
Root
crops
Ro
ots
A
ll
9
1.6
× 1
0-3
2.7
2.4
× 1
0-3
2.1
× 1
0-3
4.5
× 1
0-4
6.0
× 1
0-3
2
Tuber
s T
ubes
r A
ll
8
3.9
× 1
0-4
3.7
8.6
× 1
0-4
1.3
× 1
0-3
7.0
× 1
0-5
4.0
× 1
0-3
2
Gra
sses
S
tem
s an
d s
ho
ots
A
ll
4
1.8
× 1
0-5
2.3
2.3
× 1
0-5
1.7
× 1
0-5
6.0
× 1
0-6
4.7
× 1
0-5
2
Pas
ture
s S
tem
s an
d s
ho
ots
A
ll
1
2.0
× 1
0-2
1
Mai
ze
Ste
ms
and
sh
oots
A
ll
2
8.8
× 1
0-5
1.6
× 1
0-5
7.6
× 1
0-5
9.9
× 1
0-5
2
164

TA
BL
E 2
2.
SO
IL-T
O P
LA
NT
TR
AN
SF
ER
FA
CT
OR
(Fv)
VA
LU
ES
FO
R M
n
Pla
nt
Gro
up
Pla
nt
Co
mp
artm
ent
Soil
Gro
up
N
GM
G
SD
A
M
SD
M
in
Max
#
ref
All
78
2.8
× 1
0-1
3.3
4.9
× 1
0-1
5.3
× 1
0-1
1.4
× 1
0-2
2
.7
11
San
d
33
3.4
× 1
0-1
3.3
6.1
× 1
0-1
6.5
× 1
0-1
1.4
× 1
0-2
2
.7
7
Loam
22
2.0
× 1
0-1
2.6
3.1
× 1
0-1
3.2
× 1
0-1
5.6
× 1
0-2
1
.1
5
Cla
y
15
2.2
× 1
0-1
4.1
4.0
× 1
0-1
3.2
× 1
0-1
2.4
× 1
0-2
1
.0
5
Cer
eals
G
rain
Org
anic
6
6.5
× 1
0-1
2.1
8.2
× 1
0-1
6.1
× 1
0-1
2.7
× 1
0-1
1
.7
1
All
19
7.5
× 1
0-2
2.1
9.7
× 1
0-2
7.7
× 1
0-2
1.8
× 1
0-2
3.0
× 1
0-1
2
San
d
7
1.4
× 1
0-1
1.8
1.6
× 1
0-1
9.5
× 1
0-2
6.4
× 1
0-2
3.0
× 1
0-1
2
Loam
9
5.6
× 1
0-2
1.6
6.2
× 1
0-2
3.0
× 1
0-2
3.1
× 1
0-2
1.1
× 1
0-1
2
Mai
ze
Gra
in
Cla
y
3
4.5
× 1
0-2
2.4
5.6
× 1
0-2
4.1
× 1
0-2
1.8
× 1
0-2
9.9
× 1
0-2
2
All
103
4.1
× 1
0-1
2.4
5.8
× 1
0-1
5.3
× 1
0-1
5.2
× 1
0-2
3
.0
6
San
d
35
8.5
× 1
0-1
1.8
1.0
6
.4 ×
10-1
2.5
× 1
0-1
3
.0
5
Loam
49
3.4
× 1
0-1
1.9
4.2
× 1
0-1
2.6
× 1
0-1
7.4
× 1
0-2
1
.0
5
Lea
fy V
eget
able
s L
eaves
Cla
y
18
1.7
× 1
0-1
2.3
2.3
× 1
0-1
2.1
× 1
0-1
5.2
× 1
0-2
7.7
× 1
0-1
5
Non-l
eafy
Veg
etab
les
Fru
its
All
3
3.1
× 1
0-1
4.1
6.0
× 1
0-1
7.7
× 1
0-1
1.0
× 1
0-1
1
.5
3
All
92
2.2
× 1
0-1
2.5
3.4
× 1
0-1
3.9
× 1
0-1
2.2
× 1
0-2
2
.8
11
San
d
37
5.0
× 1
0-1
1.9
6.2
× 1
0-1
4.9
× 1
0-1
1.6
× 1
0-1
2
.8
7
Loam
43
1.4
× 1
0-1
1.6
1.6
× 1
0-1
7.2
× 1
0-2
5.0
× 1
0-2
3.4
× 1
0-1
8
Leg
um
inous
Veg
etab
les
See
ds
and
po
d
Cla
y
12
7.8
× 1
0-2
2.3
1.2
× 1
0-1
1.6
× 1
0-1
2.2
× 1
0-2
6.0
× 1
0-1
5
All
13
4.2
× 1
0-1
5.5
1.1
1
.4
1.5
× 1
0-2
3
.9
5
San
d
8
1.3
2.4
1.7
1
.4
3.9
× 1
0-1
3
.9
5
Root
crops
Ro
ots
Loam
4
6.7
× 1
0-2
3.7
1.2
× 1
0-1
1.4
× 1
0-1
1.5
× 1
0-2
3.1
× 1
0-1
3
All
23
4.7
× 1
0-2
2.2
6.6
× 1
0-2
6.7
× 1
0-2
1.2
× 1
0-2
3.0
× 1
0-1
5
San
d
9
8.1
× 1
0-2
2.2
1.1
× 1
0-1
9.1
× 1
0-2
2.6
× 1
0-2
3.0
× 1
0-1
5
Loam
9
3.6
× 1
0-2
1.6
4.0
× 1
0-2
2.0
× 1
0-2
1.6
× 1
0-2
7.6
× 1
0-2
5
Tuber
s T
uber
s
Cla
y
4
2.4
× 1
0-2
2.2
3.1
× 1
0-2
2.8
× 1
0-2
1.2
× 1
0-2
7.3
× 1
0-2
2
1 65
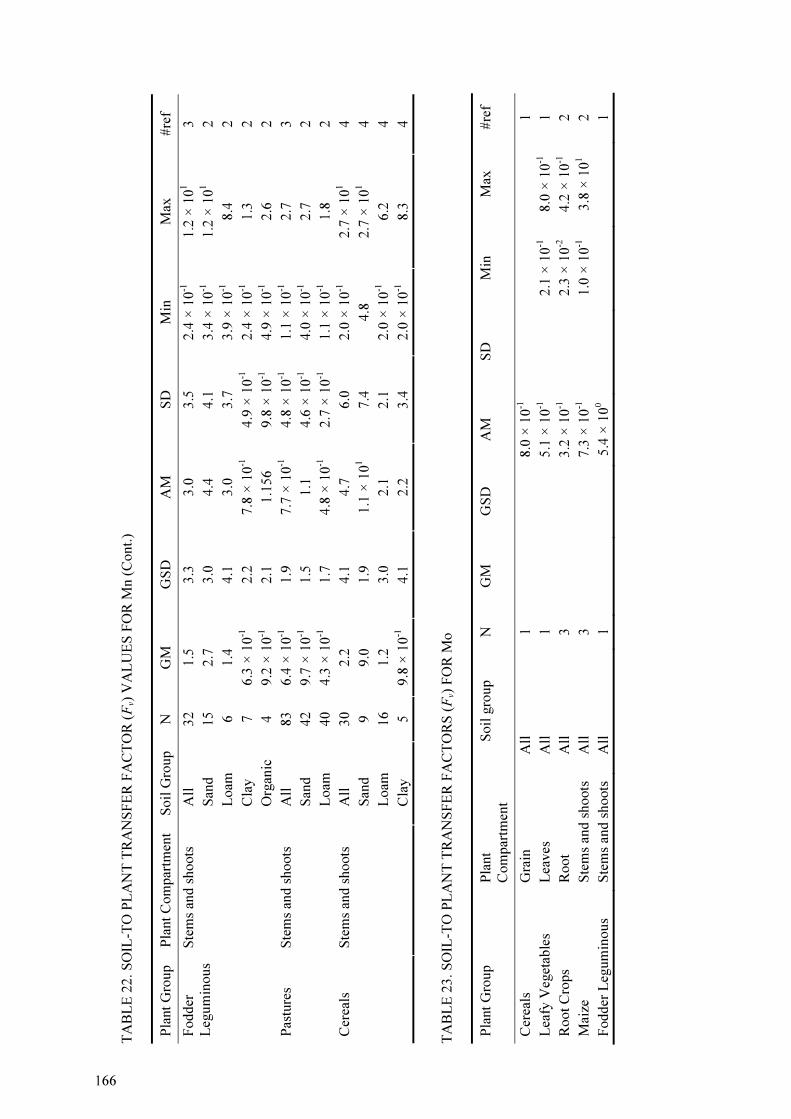
TA
BL
E 2
2.
SO
IL-T
O P
LA
NT
TR
AN
SF
ER
FA
CT
OR
(Fv)
VA
LU
ES
FO
R M
n (
Cont.
)
Pla
nt
Gro
up
Pla
nt
Co
mp
artm
ent
So
il G
roup
N
GM
G
SD
A
M
SD
M
in
Max
#
ref
All
32
1.5
3.3
3.0
3
.5
2.4
× 1
0-1
1.2
× 1
01
3
San
d
15
2.7
3.0
4.4
4
.1
3.4
× 1
0-1
1.2
× 1
01
2
Lo
am
6
1.4
4.1
3.0
3
.7
3.9
× 1
0-1
8
.4
2
Cla
y
7
6.3
× 1
0-1
2.2
7.8
× 1
0-1
4.9
× 1
0-1
2.4
× 1
0-1
1
.3
2
Fodder
Leg
um
inous
Ste
ms
and
sh
oots
Org
anic
4
9.2
× 1
0-1
2.1
1.1
56
9.8
× 1
0-1
4.9
× 1
0-1
2
.6
2
All
83
6.4
× 1
0-1
1.9
7.7
× 1
0-1
4.8
× 1
0-1
1.1
× 1
0-1
2
.7
3
San
d
42
9.7
× 1
0-1
1.5
1.1
4
.6 ×
10-1
4.0
× 1
0-1
2
.7
2
Pas
ture
s S
tem
s an
d s
ho
ots
Lo
am
40
4.3
× 1
0-1
1.7
4.8
× 1
0-1
2.7
× 1
0-1
1.1
× 1
0-1
1
.8
2
All
30
2.2
4.1
4.7
6
.0
2.0
× 1
0-1
2.7
× 1
01
4
San
d
9
9.0
1.9
1.1
× 1
01
7.4
4
.8
2.7
× 1
01
4
Lo
am
16
1.2
3.0
2.1
2
.1
2.0
× 1
0-1
6
.2
4
Cer
eals
S
tem
s an
d s
ho
ots
Cla
y
5
9.8
× 1
0-1
4.1
2.2
3
.4
2.0
× 1
0-1
8
.3
4
TA
BL
E 2
3.
SO
IL-T
O P
LA
NT
TR
AN
SF
ER
FA
CT
OR
S (Fv)
FO
R M
o
Pla
nt
Gro
up
Pla
nt
Co
mp
artm
ent
Soil
gro
up
N
GM
G
SD
A
M
SD
M
in
Max
#
ref
Cer
eals
G
rain
A
ll
1
8.0
× 1
0-1
1
Lea
fy V
eget
able
s L
eaves
A
ll
1
5.1
× 1
0-1
2.1
× 1
0-1
8.0
× 1
0-1
1
Root
Cro
ps
Ro
ot
All
3
3.2
× 1
0-1
2.3
× 1
0-2
4.2
× 1
0-1
2
Mai
ze
Ste
ms
and
sh
oots
A
ll
3
7.3
× 1
0-1
1.0
× 1
0-1
3.8
× 1
01
2
Fodder
Leg
um
ino
us
Ste
ms
and
sh
oots
A
ll
1
5.4
× 1
00
1
166
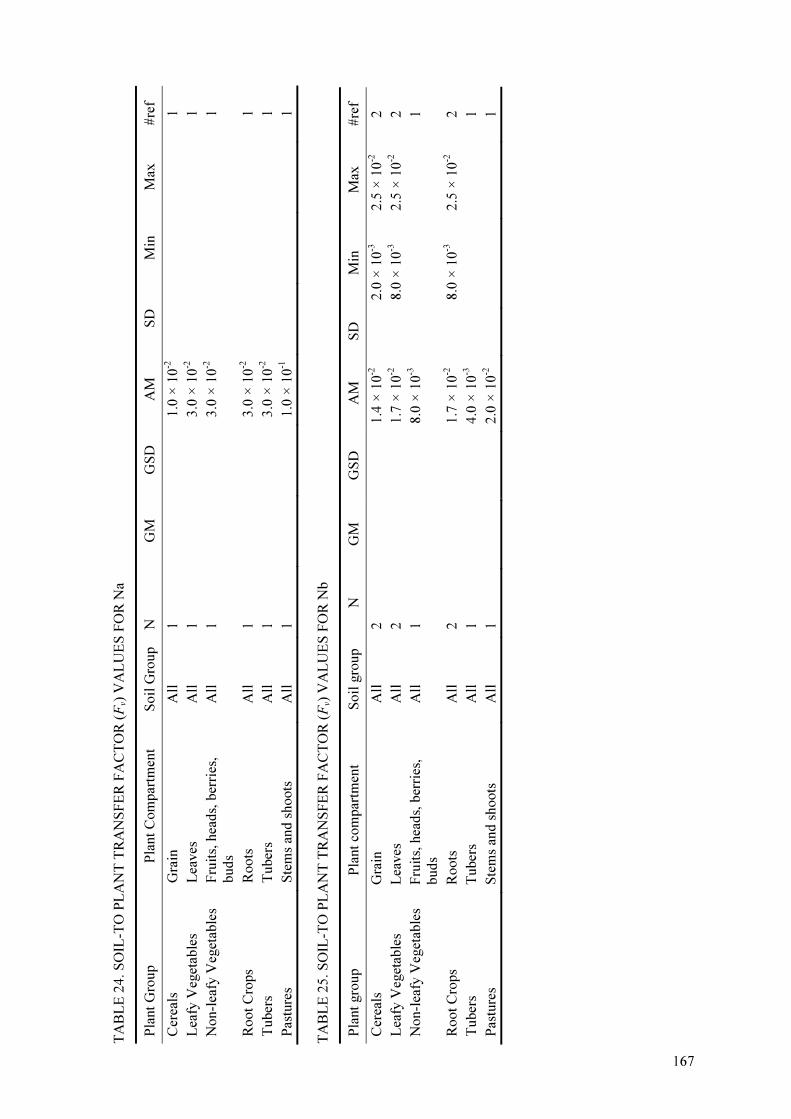
TA
BL
E 2
4.
SO
IL-T
O P
LA
NT
TR
AN
SF
ER
FA
CT
OR
(Fv)
VA
LU
ES
FO
R N
a
Pla
nt
Gro
up
Pla
nt
Co
mp
artm
ent
Soil
Gro
up
N
GM
G
SD
A
M
SD
M
in
Max
#
ref
Cer
eals
G
rain
A
ll
1
1.0
× 1
0-2
1
Lea
fy V
eget
able
s L
eaves
A
ll
1
3.0
× 1
0-2
1
Non-l
eafy
Veg
etab
les
Fru
its,
hea
ds,
ber
ries
,
bu
ds
All
1
3.0
× 1
0-2
1
Root
Cro
ps
Ro
ots
A
ll
1
3.0
× 1
0-2
1
Tuber
s T
uber
s A
ll
1
3.0
× 1
0-2
1
Pas
ture
s S
tem
s an
d s
ho
ots
A
ll
1
1.0
× 1
0-1
1
TA
BL
E 2
5.
SO
IL-T
O P
LA
NT
TR
AN
SF
ER
FA
CT
OR
(Fv)
VA
LU
ES
FO
R N
b
Pla
nt
gro
up
Pla
nt
com
par
tmen
t S
oil
gro
up
N
GM
G
SD
A
M
SD
M
in
Max
#
ref
Cer
eals
G
rain
A
ll
2
1.4
× 1
0-2
2.0
× 1
0-3
2.5
× 1
0-2
2
Lea
fy V
eget
able
s L
eaves
A
ll
2
1.7
× 1
0-2
8.0
× 1
0-3
2.5
× 1
0-2
2
Non-l
eafy
Veg
etab
les
Fru
its,
hea
ds,
ber
ries
,
bu
ds
All
1
8.0
× 1
0-3
1
Root
Cro
ps
Ro
ots
A
ll
2
1.7
× 1
0-2
8.0
× 1
0-3
2.5
× 1
0-2
2
Tuber
s T
uber
s A
ll
1
4.0
× 1
0-3
1
Pas
ture
s S
tem
s an
d s
ho
ots
A
ll
1
2.0
× 1
0-2
1
1 7 6

TA
BL
E 2
6.
SO
IL-T
O P
LA
NT
TR
AN
SF
ER
FA
CT
OR
(Fv)
VA
LU
ES
FO
R N
i
Pla
nt
Gro
up
Pla
nt
Co
mp
artm
ent
So
il G
roup
N
GM
G
SD
A
M
SD
M
in
Max
#
ref
All
44
2.7
× 1
0-2
2.7
4.2
× 1
0-2
3.9
× 1
0-2
3.1
× 1
0-3
1.7
× 1
0-1
3
San
d
26
3.7
× 1
0-2
2.4
5.2
× 1
0-2
4.3
× 1
0-2
8.2
× 1
0-3
1.7
× 1
0-1
3
Lo
am
4
7.6
× 1
0-3
1.7
8.5
× 1
0-3
5.1
× 1
0-3
4.9
× 1
0-3
1.6
× 1
0-2
2
Cla
y
9
3.2
× 1
0-2
2.4
4.3
× 1
0-2
3.0
× 1
0-2
6.3
× 1
0-3
9.3
× 1
0-2
2
Cer
eals
G
rain
Org
anic
4
6.1
× 1
0-3
1.6
6.6
× 1
0-3
2.8
× 1
0-3
3.1
× 1
0-3
1.0
× 1
0-2
1
All
38
1.7
× 1
0-1
2.6
2.3
× 1
0-1
1.5
× 1
0-1
1.8
× 1
0-2
5.8
× 1
0-1
4
San
d
18
2.6
× 1
0-1
1.6
2.8
× 1
0-1
1.1
× 1
0-1
8.2
× 1
0-2
5.1
× 1
0-1
3
Lo
am
5
1.1
× 1
0-1
1.6
1.2
× 1
0-1
4.7
× 1
0-2
5.6
× 1
0-2
1.7
× 1
0-1
1
Cla
y
10
2.5
× 1
0-1
1.8
2.9
× 1
0-1
1.7
× 1
0-1
1.1
× 1
0-1
5.8
× 1
0-1
1
Gra
sses
S
tem
s an
d s
ho
ots
Org
anic
5
2.4
× 1
0-2
1.5
2.6
× 1
0-2
1.4
× 1
0-2
1.8
× 1
0-2
5.0
× 1
0-2
1
All
27
4.0
× 1
0-1
2.5
5.8
× 1
0-1
5.2
× 1
0-1
7.3
× 1
0-2
2
.6
1
San
d
14
6.5
× 1
0-1
1.8
7.8
× 1
0-1
6.0
× 1
0-1
2.8
× 1
0-1
2
.6
1
Lo
am
3
2.5
× 1
0-1
2.6
3.4
× 1
0-1
3.4
× 1
0-1
1.2
× 1
0-1
7.4
× 1
0-1
1
Cla
y
6
3.2
× 1
0-1
2.4
4.2
× 1
0-1
2.9
× 1
0-1
1.1
× 1
0-1
7.3
× 1
0-1
1
Fodder
L
egu
min
ous
Ste
ms
and
sh
oots
Org
anic
4
1.5
× 1
0-1
3.3
2.9
× 1
0-1
4.1
× 1
0-1
7.3
× 1
0-2
9.1
× 1
0-1
1
16 8

TA
BL
E 2
7.
SO
IL-T
O-P
LA
NT
TR
AN
SF
ER
FA
CT
OR
(Fv)
VA
LU
ES
FO
R N
p
Pla
nt
Gro
up
Pla
nt
Co
mp
artm
ent
Soil
Gro
up
N
GM
G
SD
A
M
SD
M
in
Max
#
ref
All
85
2.9
× 1
0-3
5.0
7.5
× 1
0-3
1.2
× 1
0-2
2.3
× 1
0-5
7.1
× 1
0-2
3
San
d
79
3.5
× 1
0-3
4.1
8.0
× 1
0-3
1.2
× 1
0-2
2.5
× 1
0-4
7.1
× 1
0-2
2
Loam
2
8.5
× 1
0-4
7.9
× 1
0-4
2.9
× 1
0-4
1.4
× 1
0-3
2
Cla
y
2
3.9
× 1
0-5
2.2
× 1
0-5
2.3
× 1
0-5
5.4
× 1
0-5
2
Cer
eals
G
rain
Org
anic
1
9.7
× 1
0-5
1
Mai
ze
Gra
in
All
2
4.8
× 1
0-3
6.6
× 1
0-3
1.0
× 1
0-4
9.4
× 1
0-3
1
Lea
fy V
eget
able
s L
eaves
A
ll
5
2.7
× 1
0-2
3.0
4.0
× 1
0-2
3
.31
0-2
5.0
× 1
0-3
8.0
× 1
0-2
2
Non-l
eafy
veg
etab
les
Fru
its
All
9
1.8
× 1
0-2
2.4
2.3
× 1
0-2
1.6
× 1
0-2
4.0
× 1
0-3
5.7
× 1
0-2
1
All
17
1.7
× 1
0-2
1.8
1.9
× 1
0-2
8.9
× 1
0-3
4.0
× 1
0-3
3.8
× 1
0-2
1
L
egu
min
ous
Veg
etab
les
See
ds
and
po
ds
San
d
17
1.7
× 1
0-2
1.8
1.9
× 1
0-2
8.9
× 1
0-3
4.0
× 1
0-3
3.8
× 1
0-2
1
All
7
2.2
× 1
0-2
2.0
2.6
× 1
0-2
1.1
× 1
0-2
5.0
× 1
0-3
3.6
× 1
0-2
3
R
oot
Cro
ps
Ro
ots
San
d
6
2.9
× 1
0-2
1.2
2.9
× 1
0-2
6.2
× 1
0-3
2.1
× 1
0-2
3.6
× 1
0-2
2
All
57
5.7
× 1
0-3
2.5
8.2
× 1
0-3
6.9
× 1
0-3
7.1
× 1
0-4
2.7
× 1
0-2
3
T
uber
s T
uber
s
San
d
56
5.8
× 1
0-3
2.5
8.3
× 1
0-3
7.0
× 1
0-3
7.1
× 1
0-4
2.7
× 1
0-2
2
Gra
sses
S
tem
s an
d s
ho
ots
A
ll
3
3.1
× 1
0-2
3.7
4.8
× 1
0-2
3.9
× 1
0-2
7.2
× 1
0-3
8.6
× 1
0-2
2
All
34
2.5
× 1
0-2
3.3
4.2
× 1
0-2
3.4
× 1
0-2
2.0
× 1
0-3
1.2
× 1
0-1
2
San
d
23
4.6
× 1
0-2
1.8
5.4
× 1
0-2
3.1
× 1
0-2
1.6
× 1
0-2
1.2
× 1
0-1
1
Loam
2
6.1
× 1
0-2
2.8
× 1
0-3
5.9
× 1
0-2
6.3
× 1
0-2
1
Fodder
Leg
um
inous
Ste
ms
and
sh
oots
Cla
y
9
4.1
× 1
0-3
1.5
4.4
× 1
0-3
1.7
× 1
0-3
2.0
× 1
0-3
8.1
× 1
0-3
1
All
16
6.1
× 1
0-2
2.7
1.0
× 1
0-1
1.3
× 1
0-1
1.3
× 1
0-2
4.7
× 1
0-1
2
San
d
5
2.1
× 1
0-1
2.0
2.5
× 1
0-1
1.6
× 1
0-1
8.9
× 1
0-2
4.7
× 1
0-1
2
Pas
ture
S
tem
s an
d s
ho
ots
Loam
10
3.4
× 1
0-2
1.7
3.7
× 1
0-2
1.5
× 1
0-2
1.3
× 1
0-2
5.7
× 1
0-2
2
All
58
1.9
× 1
0-2
3.3
3.4
× 1
0-2
3.1
× 1
0-2
1.4
× 1
0-3
1.1
× 1
0-1
1
M
aize
S
tem
s an
d s
ho
ots
San
d
58
1.9
× 1
0-2
3.3
3.4
× 1
0-2
3.1
× 1
0-2
1.4
× 1
0-3
1.1
× 1
0-1
1
169

TA
BL
E 2
8.
SO
IL-T
O-P
LA
NT
TR
AN
SF
ER
FA
CT
OR
(Fv)
VA
LU
ES
FO
R P
Pla
nt
Gro
up
Pla
nt
Co
mp
artm
ent
Soil
Gro
up
N
GM
G
SD
A
M
SD
M
in
Max
#
ref
Cer
eals
G
rain
A
ll
1
2.0
× 1
0-1
1
Lea
fy V
eget
able
s L
eaves
A
ll
1
1.0
1
Non-l
eafy
Veg
etab
les
Fru
its,
hea
ds,
ber
ries
, b
uds
All
1
1.0
1
Root
Cro
ps
Ro
ots
A
ll
1
1.0
1
Tuber
s T
uber
s A
ll
1
5.0
× 1
0-1
1
Pas
ture
S
tem
s an
d s
ho
ots
A
ll
1
2.0
1
TA
BL
E 2
9.
SO
IL-T
O-P
LA
NT
TR
AN
SF
ER
FA
CT
OR
(Fv)
VA
LU
ES
FO
R P
m
Pla
nt
Gro
up
Pla
nt
Co
mp
artm
ent
So
il G
roup
N
GM
G
SD
A
M
SD
M
in
Max
#
ref
All
17
1.4
× 1
0-2
6.0
4.7
× 1
0-2
6.8
× 1
0-2
1.7
× 1
0-3
2.4
× 1
0-1
3
San
d
10
6.6
× 1
0-3
6.0
4.1
× 1
0-2
8.2
× 1
0-2
1.7
× 1
0-3
2.4
× 1
0-1
3
Lo
am
6
4.6
× 1
0-2
2.7
6.3
× 1
0-2
4.6
× 1
0-2
1.0
× 1
0-2
1.3
× 1
0-1
2
Cer
eals
G
rain
Cla
y
1
2.0
× 1
0-2
2
All
4
1.7
× 1
0-1
7.4
4.8
× 1
0-1
2.0
× 1
0-2
1
.2
1
San
d
1
5.0
× 1
0-2
1
Leg
um
inous-
Veg
etab
les
See
ds
and
po
d
Lo
am
1
2.0
× 1
0-2
1
Root
Cro
ps
Ro
ot
All
5
4.2
× 1
0-2
1.2
4.3
× 1
0-2
9.6
× 1
0-3
3.6
× 1
0-2
6.0
× 1
0-2
1
Tuber
s T
uber
A
ll
3
1.0
× 1
0-2
1.3
1.0
× 1
0-2
2.3
× 1
0-3
7.5
× 1
0-3
1.2
× 1
0-2
1
All
19
2.3
× 1
0-1
4.1
4.4
× 1
0-1
4.2
× 1
0-1
2.2
× 1
0-2
1
.4
3
San
d
10
1.2
× 1
0-1
5.0
3.2
× 1
0-1
4.5
× 1
0-1
2.2
× 1
0-2
1
.4
3
Lo
am
7
5.8
× 1
0-1
1.8
6.6
× 1
0-1
3.6
× 1
0-1
2.9
× 1
0-1
1
.2
2
Cer
eals
S
tem
s an
d s
ho
ots
Cla
y
2
2.8
× 1
0-1
2.0
× 1
0-1
1.3
× 1
0-1
4.2
× 1
0-1
2
Root
Cro
ps
Lea
ves
A
ll
5
1.9
× 1
0-1
1.2
2.0
× 1
0-1
3.9
× 1
0-2
1.6
× 1
0-1
2.5
× 1
0-1
1
170
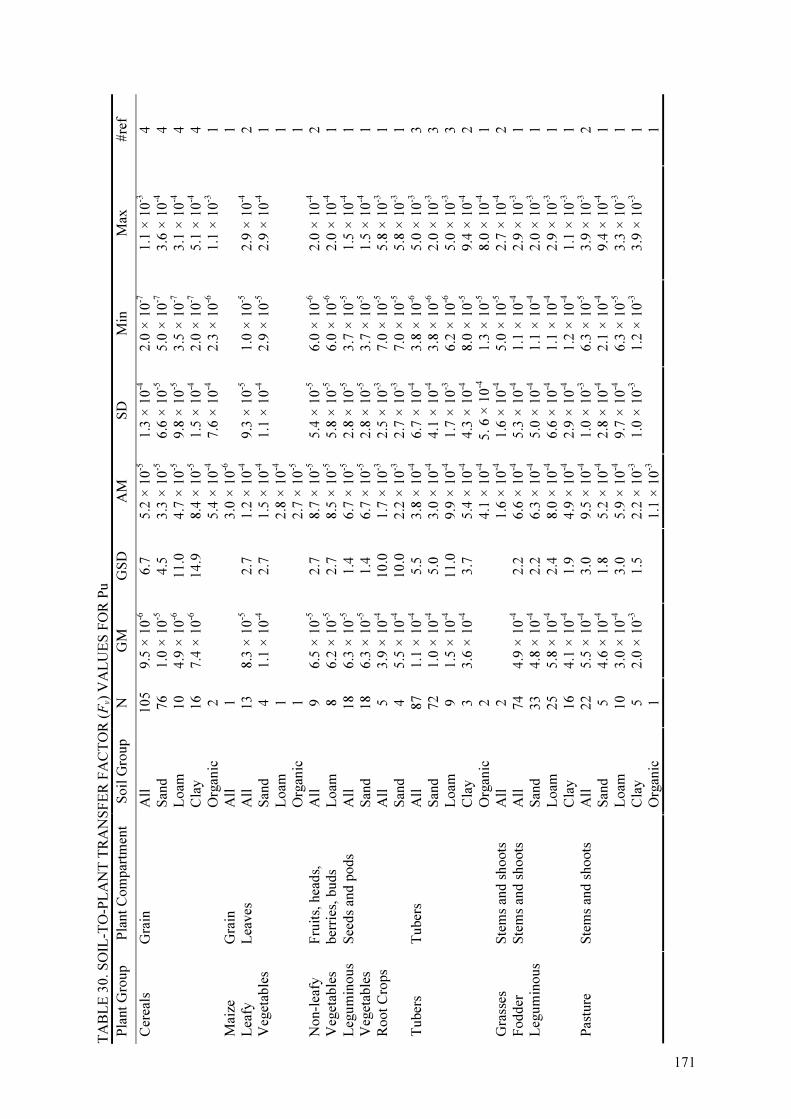
TA
BL
E 3
0.
SO
IL-T
O-P
LA
NT
TR
AN
SF
ER
FA
CT
OR
(Fv)
VA
LU
ES
FO
R P
u
Pla
nt
Gro
up
Pla
nt
Co
mp
artm
ent
So
il G
roup
N
GM
G
SD
A
M
SD
M
in
Max
#
ref
All
105
9.5
× 1
0-6
6.7
5.2
× 1
0-5
1.3
× 1
0-4
2.0
× 1
0-7
1.1
× 1
0-3
4
San
d
76
1.0
× 1
0-5
4.5
3.3
× 1
0-5
6.6
× 1
0-5
5.0
× 1
0-7
3.6
× 1
0-4
4
Lo
am
10
4.9
× 1
0-6
11.0
4.7
× 1
0-5
9.8
× 1
0-5
3.5
× 1
0-7
3.1
× 1
0-4
4
Cla
y
16
7.4
× 1
0-6
14.9
8.4
× 1
0-5
1.5
× 1
0-4
2.0
× 1
0-7
5.1
× 1
0-4
4
Cer
eals
G
rain
Org
anic
2
5.4
× 1
0-4
7.6
× 1
0-4
2.3
× 1
0-6
1.1
× 1
0-3
1
Mai
ze
Gra
in
All
1
3.0
× 1
0-6
1
All
13
8.3
× 1
0-5
2.7
1.2
× 1
0-4
9.3
× 1
0-5
1.0
× 1
0-5
2.9
× 1
0-4
2
San
d
4
1.1
× 1
0-4
2.7
1.5
× 1
0-4
1.1
× 1
0-4
2.9
× 1
0-5
2.9
× 1
0-4
1
Lo
am
1
2.8
× 1
0-4
1
Lea
fy
Veg
etab
les
Lea
ves
Org
anic
1
2.7
× 1
0-5
1
All
9
6.5
× 1
0-5
2.7
8.7
× 1
0-5
5.4
× 1
0-5
6.0
× 1
0-6
2.0
× 1
0-4
2
N
on-l
eafy
V
eget
able
s F
ruit
s, h
ead
s,
ber
ries
, b
uds
Lo
am
8
6.2
× 1
0-5
2.7
8.5
× 1
0-5
5.8
× 1
0-5
6.0
× 1
0-6
2.0
× 1
0-4
1
All
18
6.3
× 1
0-5
1.4
6.7
× 1
0-5
2.8
× 1
0-5
3.7
× 1
0-5
1.5
× 1
0-4
1
L
egu
min
ous
Veg
etab
les
See
ds
and
po
ds
San
d
18
6.3
× 1
0-5
1.4
6.7
× 1
0-5
2.8
× 1
0-5
3.7
× 1
0-5
1.5
× 1
0-4
1
Root
Cro
ps
A
ll
5
3.9
× 1
0-4
10.0
1.7
× 1
0-3
2.5
× 1
0-3
7.0
× 1
0-5
5.8
× 1
0-3
1
San
d
4
5.5
× 1
0-4
10.0
2.2
× 1
0-3
2.7
× 1
0-3
7.0
× 1
0-5
5.8
× 1
0-3
1
All
87
1.1
× 1
0-4
5.5
3.8
× 1
0-4
6.7
× 1
0-4
3.8
× 1
0-6
5.0
× 1
0-3
3
San
d
72
1.0
× 1
0-4
5.0
3.0
× 1
0-4
4.1
× 1
0-4
3.8
× 1
0-6
2.0
× 1
0-3
3
Lo
am
9
1.5
× 1
0-4
11.0
9.9
× 1
0-4
1.7
× 1
0-3
6.2
× 1
0-6
5.0
× 1
0-3
3
Cla
y
3
3.6
× 1
0-4
3.7
5.4
× 1
0-4
4.3
× 1
0-4
8.0
× 1
0-5
9.4
× 1
0-4
2
Tuber
s T
uber
s
Org
anic
2
4.1
× 1
0-4
5
. 6
× 1
0-4
1.3
× 1
0-5
8.0
× 1
0-4
1
Gra
sses
S
tem
s an
d s
ho
ots
A
ll
2
1.6
× 1
0-4
1.6
× 1
0-4
5.0
× 1
0-5
2.7
× 1
0-4
2
All
74
4.9
× 1
0-4
2.2
6.6
× 1
0-4
5.3
× 1
0-4
1.1
× 1
0-4
2.9
× 1
0-3
1
San
d
33
4.8
× 1
0-4
2.2
6.3
× 1
0-4
5.0
× 1
0-4
1.1
× 1
0-4
2.0
× 1
0-3
1
Lo
am
25
5.8
× 1
0-4
2.4
8.0
× 1
0-4
6.6
× 1
0-4
1.1
× 1
0-4
2.9
× 1
0-3
1
Fodder
L
egu
min
ous
Ste
ms
and
sh
oots
Cla
y
16
4.1
× 1
0-4
1.9
4.9
× 1
0-4
2.9
× 1
0-4
1.2
× 1
0-4
1.1
× 1
0-3
1
All
22
5.5
× 1
0-4
3.0
9.5
× 1
0-4
1.0
× 1
0-3
6.3
× 1
0-5
3.9
× 1
0-3
2
San
d
5
4.6
× 1
0-4
1.8
5.2
× 1
0-4
2.8
× 1
0-4
2.1
× 1
0-4
9.4
× 1
0-4
1
Lo
am
10
3.0
× 1
0-4
3.0
5.9
× 1
0-4
9.7
× 1
0-4
6.3
× 1
0-5
3.3
× 1
0-3
1
Cla
y
5
2.0
× 1
0-3
1.5
2.2
× 1
0-3
1.0
× 1
0-3
1.2
× 1
0-3
3.9
× 1
0-3
1
Pas
ture
S
tem
s an
d s
ho
ots
Org
anic
1
1.1
× 1
0-3
1
1 71

TA
BL
E 3
0.
SO
IL-T
O-P
LA
NT
TR
AN
SF
ER
FA
CT
OR
(Fv)
VA
LU
ES
FO
R P
u (
Cont.
)
Pla
nt
Gro
up
Pla
nt
Co
mp
artm
ent
So
il G
roup
N
GM
G
SD
A
M
SD
M
in
Max
#
ref
All
10
4.4
× 1
0-5
16.4
2.7
× 1
0-4
3.3
× 1
0-4
4.4
× 1
0-7
9.0
× 1
0-4
2
San
d
1
4.0
× 1
0-5
1
Lo
am
5
4.5
× 1
0-4
2.0
5.3
× 1
0-4
2.9
× 1
0-4
1.5
× 1
0-4
9.0
× 1
0-4
2
Cer
eals
S
tem
s an
d s
ho
ots
Cla
y
4
2.4
× 1
0-6
5.5
6.4
× 1
0-6
9.2
× 1
0-6
4.4
× 1
0-7
2.0
× 1
0-5
2
All
58
5.2
× 1
0-5
2.7
8.0
× 1
0-5
7.8
× 1
0-5
2. ×
10-6
3.2
× 1
0-4
1
M
aize
S
tem
s an
d s
ho
ots
San
d
58
5.2
× 1
0-5
2.7
8.0
× 1
0-5
7.8
× 1
0-5
2. ×
10-6
3.2
× 1
0-4
1
All
10
1.2
× 1
0-3
2.5
1.6
× 1
0-3
1.4
× 1
0-3
2.5
× 1
0-4
4.9
× 1
0-3
2
San
d
4
7.7
× 1
0-4
1.9
8.8
× 1
0-4
5.2
× 1
0-4
3.4
× 1
0-4
1.6
× 1
0-3
2
Lo
am
5
2.2
× 1
0-3
1.8
2.5
× 1
0-3
1.5
× 1
0-3
1.1
× 1
0-3
4.9
× 1
0-3
2
Root
Cro
ps
Lea
ves
Org
anic
1
2.5
× 1
0-4
1
TA
BL
E 3
1`.
SO
IL-T
O-P
LA
NT
TR
AN
SF
ER
FA
CT
OR
(Fv)
VA
LU
ES
FO
R R
b
Pla
nt
Gro
up
Pla
nt
Co
mp
artm
ent
So
il G
roup
N
GM
G
SD
A
M
SD
M
in
Max
#
ref
Cer
eals
G
rain
A
ll
1
9.0
× 1
0-1
1
Lea
fy
Veg
etab
les
Lea
ves
A
ll
1
6.2
× 1
0-1
3.4
× 1
0-1
9
.0x
10-1
2
Root
Cro
ps
Ro
ots
A
ll
1
9.0
× 1
0-1
1
172

TA
BL
E 3
2.
SO
IL-T
O-P
LA
NT
TR
AN
SF
ER
FA
CT
OR
(Fv)
VA
LU
ES
FO
R R
u
Pla
nt
Gro
up
Pla
nt
Co
mp
artm
ent
Soil
Gro
up
N
GM
G
SD
A
M
SD
M
in
Max
#
ref
All
12
3.0
× 1
0-3
2.6
4.2
× 1
0-3
3.0
× 1
0-3
6.0
× 1
0-4
1.0
× 1
0-2
4
San
d
2
6.5
× 1
0-3
4.9
× 1
0-3
3.0
× 1
0-3
1.0
× 1
0-2
2
Loam
6
3.4
× 1
0-3
2.2
4.3
× 1
0-3
2.8
× 1
0-3
1.0
× 1
0-3
8.0
× 1
0-3
2
Cer
eals
G
rain
Cla
y
3
1.3
× 1
0-3
3.3
2.1
× 1
0-3
2.5
× 1
0-3
6.0
× 1
0-4
5.0
× 1
0-3
3
Lea
fy V
eget
able
s L
eaves
A
ll
3
9.0
× 1
0-2
3.7
1.4
10-1
1.1
× 1
0-1
2.0
× 1
0-2
2.3
× 1
0-1
1
Non-l
eafy
Veg
etab
les
Fru
its
All
1
2.0
× 1
0-2
1
Leg
um
inous
Veg
etab
les
See
ds
and
po
ds
All
2
1.5
× 1
0-2
7.1
× 1
0-3
1.0
× 1
0-2
2.0
× 1
0-2
2
Root
Cro
ps
Ro
ots
A
ll
1
1.0
× 1
0-2
1
Tuber
s T
uber
s A
ll
1
5.0
× 1
0-3
1
All
19
1.6
× 1
0-1
2.7
2.6
× 1
0-1
2.7
× 1
0-1
3.0
× 1
0-2
1
.0
3
San
d
3
5.9
× 1
0-1
1.9
6.6
× 1
0-1
3.5
× 1
0-1
3.0
× 1
0-1
1
.0
2
Loam
10
2.0
× 1
0-1
2.2
2.5
× 1
0-1
1.9
× 1
0-1
5.0
× 1
0-2
6.5
× 1
0-1
3
Cer
eals
S
tem
s an
d s
ho
ots
Cla
y
5
6.2
× 1
0-2
1.7
6.8
× 1
0-2
3.0
× 1
0-2
3.0
× 1
0-2
9.5
× 1
0-2
3
TA
BL
E 3
3.
SO
IL-T
O-P
LA
NT
TR
AN
SF
ER
FA
CT
OR
(Fv)
VA
LU
ES
FO
R S
b
Pla
nt
Gro
up
Pla
nt
Co
mp
artm
ent
Soil
Gro
up
N
GM
G
SD
A
M
SD
M
in
Max
#
ref
All
24
1.8
× 1
0-3
2.7
2.8
× 1
0-3
2.7
× 1
0-3
3.0
× 1
0-4
9.0
× 1
0-3
3
San
d
4
1.2
× 1
0-3
3.7
2.5
× 1
0-3
3.6
× 1
0-3
4.5
× 1
0-4
7.8
× 1
0-3
2
Cer
eals
G
rain
Loam
19
2.0
× 1
0-3
2.7
3.0
× 1
0-3
2.6
× 1
0-3
3.0
× 1
0-4
9.0
× 1
0-3
3
All
5
9.4
× 1
0-5
2.6
1.3
× 1
0-4
8.7
× 1
0-5
2.2
× 1
0-5
2.3
× 1
0-4
2
San
d
2
2.2
× 1
0-4
1.6
× 1
0-5
2.0
× 1
0-4
2.3
× 1
0-4
1
Lea
fy V
eget
able
s L
eaves
Loam
3
5.5
× 1
0-5
2.2
6.6
× 1
0-5
4.1
× 1
0-5
2.2
× 1
0-5
1.0
× 1
0-4
1
Non-l
eafy
Veg
etab
les
Fru
its
All
5
1.3
× 1
0-4
6.7
4.2
× 1
0-4
6.7
× 1
0-4
1.5
× 1
0-5
1.6
× 1
0-3
2
Leg
um
inous
Veg
etab
les
See
ds
and
po
ds
All
1
7.0
× 1
0-3
1
Root
Cro
ps
Ro
ots
A
ll
5
6.2
× 1
0-4
1.5
6.6
× 1
0-4
2.7
× 1
0-4
4.0
× 1
0-4
1.1
× 1
0-3
2
Tuber
s T
uber
s A
ll
1
2.0
× 1
0-3
1
Cer
eals
S
tem
s an
d s
ho
ots
A
ll
7
2.5
× 1
0-2
1.6
2.7
× 1
0-2
1.3
× 1
0-2
1.2
× 1
0-2
5.3
× 1
0-2
2
173
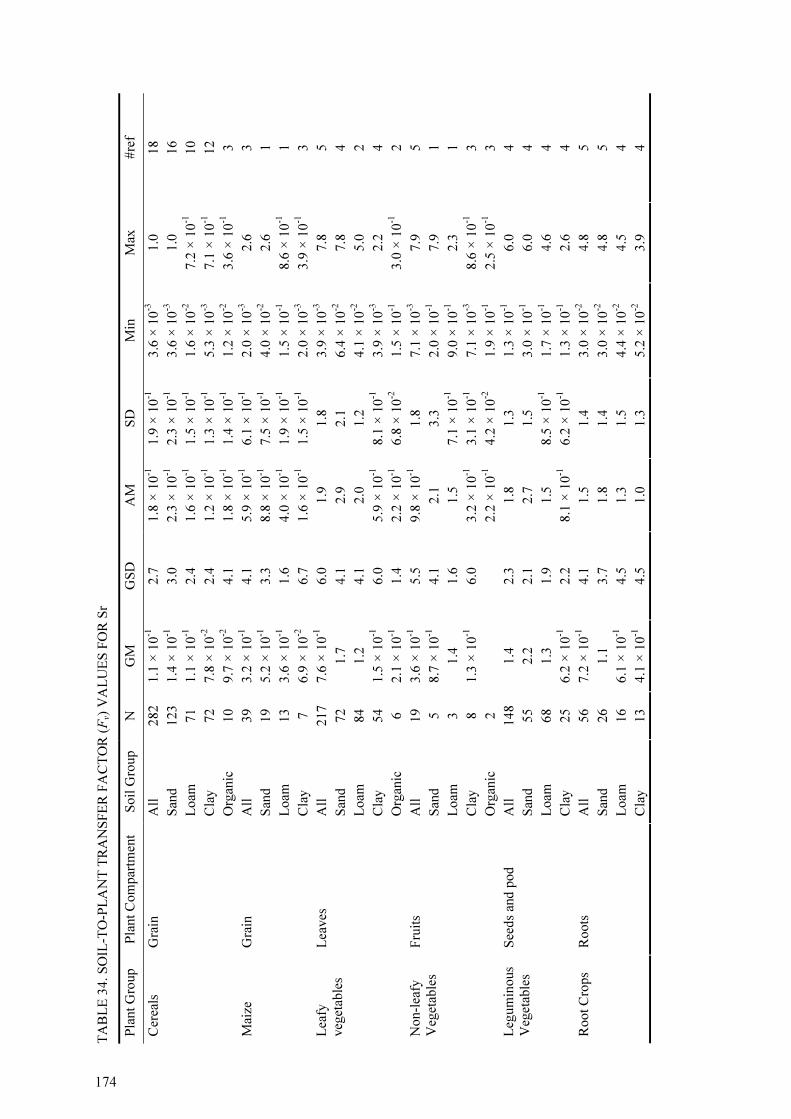
TA
BL
E 3
4. S
OIL
-TO
-PL
AN
T T
RA
NS
FE
R F
AC
TO
R (Fv)
VA
LU
ES
FO
R S
r
Pla
nt
Gro
up
Pla
nt
Com
par
tmen
t S
oil
Gro
up
N
GM
G
SD
A
M
SD
M
in
Max
#
ref
All
282
1.1
× 1
0-1
2.7
1.8
× 1
0-1
1.9
× 1
0-1
3
.6 ×
10-3
1
.0
18
San
d
123
1.4
× 1
0-1
3.0
2.3
× 1
0-1
2.3
× 1
0-1
3
.6 ×
10-3
1
.0
16
Loam
71
1.1
× 1
0-1
2.4
1.6
× 1
0-1
1.5
× 1
0-1
1
.6 ×
10-2
7
.2 ×
10-1
1
0
Cla
y
72
7.8
× 1
0-2
2.4
1.2
× 1
0-1
1.3
× 1
0-1
5
.3 ×
10-3
7
.1 ×
10-1
1
2
Cer
eals
G
rain
Org
anic
10
9.7
× 1
0-2
4.1
1.8
× 1
0-1
1.4
× 1
0-1
1
.2 ×
10-2
3
.6 ×
10-1
3
All
39
3.2
× 1
0-1
4.1
5.9
× 1
0-1
6.1
× 1
0-1
2
.0 ×
10-3
2
.6
3
San
d
19
5.2
× 1
0-1
3.3
8.8
× 1
0-1
7.5
× 1
0-1
4
.0 ×
10-2
2
.6
1
Loam
13
3.6
× 1
0-1
1.6
4.0
× 1
0-1
1.9
× 1
0-1
1
.5 ×
10-1
8
.6 ×
10-1
1
Mai
ze
Gra
in
Cla
y
7
6.9
× 1
0-2
6.7
1.6
× 1
0-1
1.5
× 1
0-1
2
.0 ×
10-3
3
.9 ×
10-1
3
All
217
7.6
× 1
0-1
6.0
1.9
1
.8
3.9
× 1
0-3
7
.8
5
San
d
72
1.7
4.1
2.9
2
.1
6.4
× 1
0-2
7
.8
4
Loam
84
1.2
4.1
2.0
1
.2
4.1
× 1
0-2
5
.0
2
Cla
y
54
1.5
× 1
0-1
6.0
5.9
× 1
0-1
8.1
× 1
0-1
3
.9 ×
10-3
2
.2
4
Lea
fy
veg
etab
les
Lea
ves
Org
anic
6
2.1
× 1
0-1
1.4
2.2
× 1
0-1
6.8
× 1
0-2
1
.5 ×
10-1
3
.0 ×
10-1
2
All
19
3.6
× 1
0-1
5.5
9.8
× 1
0-1
1
.8
7.1
× 1
0-3
7
.9
5
San
d
5
8.7
× 1
0-1
4.1
2.1
3
.3
2.0
× 1
0-1
7
.9
1
Loam
3
1.4
1.6
1.5
7.1
× 1
0-1
9
.0 ×
10-1
2
.3
1
Cla
y
8
1.3
× 1
0-1
6.0
3.2
× 1
0-1
3.1
× 1
0-1
7
.1 ×
10-3
8
.6 ×
10-1
3
Non-l
eafy
Veg
etab
les
Fru
its
Org
anic
2
2.2
× 1
0-1
4.2
× 1
0-2
1
.9 ×
10-1
2
.5 ×
10-1
3
All
148
1.4
2.3
1.8
1
.3
1.3
× 1
0-1
6
.0
4
San
d
55
2.2
2.1
2.7
1
.5
3.0
× 1
0-1
6
.0
4
Loam
68
1.3
1.9
1.5
8.5
× 1
0-1
1
.7 ×
10-1
4
.6
4
Leg
um
inous
Veg
etab
les
See
ds
and p
od
Cla
y
25
6.2
× 1
0-1
2.2
8.1
× 1
0-1
6.2
× 1
0-1
1
.3 ×
10-1
2
.6
4
All
56
7.2
× 1
0-1
4.1
1.5
1
.4
3.0
× 1
0-2
4
.8
5
San
d
26
1.1
3.7
1.8
1
.4
3.0
× 1
0-2
4
.8
5
Loam
16
6.1
× 1
0-1
4.5
1.3
1
.5
4.4
× 1
0-2
4
.5
4
Root
Cro
ps
Roots
Cla
y
13
4.1
× 1
0-1
4.5
1.0
1
.3
5.2
× 1
0-2
3
.9
4
174
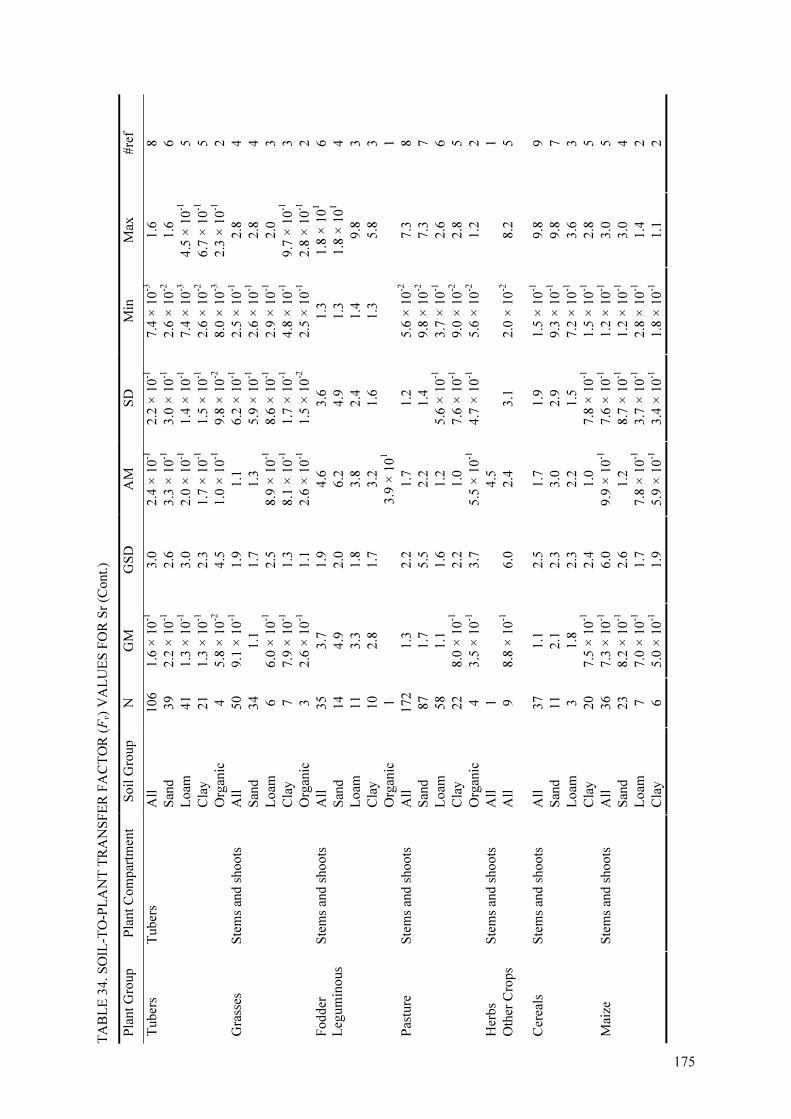
TA
BL
E 3
4. S
OIL
-TO
-PL
AN
T T
RA
NS
FE
R F
AC
TO
R (Fv)
VA
LU
ES
FO
R S
r (C
ont.
)
Pla
nt
Gro
up
Pla
nt
Com
par
tmen
t S
oil
Gro
up
N
GM
G
SD
A
M
SD
M
in
Max
#
ref
All
106
1.6
× 1
0-1
3.0
2.4
× 1
0-1
2
.2 ×
10-1
7
.4 ×
10-3
1
.6
8
San
d
39
2.2
× 1
0-1
2.6
3.3
× 1
0-1
3
.0 ×
10-1
2
.6 ×
10-2
1
.6
6
Loam
41
1.3
× 1
0-1
3.0
2.0
× 1
0-1
1
.4 ×
10-1
7
.4 ×
10-3
4
.5 ×
10-1
5
Cla
y
21
1.3
× 1
0-1
2.3
1.7
× 1
0-1
1
.5 ×
10-1
2
.6 ×
10-2
6
.7 ×
10-1
5
Tuber
s T
uber
s
Org
anic
4
5.8
× 1
0-2
4.5
1.0
× 1
0-1
9
.8 ×
10-2
8
.0 ×
10-3
2
.3 ×
10-1
2
All
50
9.1
× 1
0-1
1.9
1.1
6
.2 ×
10-1
2
.5 ×
10-1
2
.8
4
San
d
34
1.1
1.7
1.3
5
.9 ×
10-1
2
.6 ×
10-1
2
.8
4
Loam
6
6.0
× 1
0-1
2.5
8.9
× 1
0-1
8
.6 ×
10-1
2
.9 ×
10-1
2
.0
3
Cla
y
7
7.9
× 1
0-1
1.3
8.1
× 1
0-1
1
.7 ×
10-1
4
.8 ×
10-1
9
.7 ×
10-1
3
Gra
sses
S
tem
s an
d s
hoots
Org
anic
3
2.6
× 1
0-1
1.1
2.6
× 1
0-1
1
.5 ×
10-2
2
.5 ×
10-1
2
.8 ×
10-1
2
All
35
3.7
1.9
4.6
3
.6
1.3
1
.8 ×
101
6
San
d
14
4.9
2.0
6.2
4
.9
1.3
1
.8 ×
101
4
Loam
11
3.3
1.8
3.8
2
.4
1.4
9
.8
3
Cla
y
10
2.8
1.7
3.2
1
.6
1.3
5
.8
3
Fodder
Leg
um
inous
Ste
ms
and s
hoots
Org
anic
1
3.9
× 1
01
1
All
172
1.3
2.2
1.7
1
.2
5.6
× 1
0-2
7
.3
8
San
d
87
1.7
5.5
2.2
1
.4
9.8
× 1
0-2
7
.3
7
Loam
58
1.1
1.6
1.2
5
.6 ×
10-1
3
.7 ×
10-1
2
.6
6
Cla
y
22
8.0
× 1
0-1
2.2
1.0
7
.6 ×
10-1
9
.0 ×
10-2
2
.8
5
Pas
ture
S
tem
s an
d s
hoots
Org
anic
4
3.5
× 1
0-1
3.7
5.5
× 1
0-1
4
.7 ×
10-1
5
.6 ×
10-2
1
.2
2
Her
bs
Ste
ms
and s
hoots
A
ll
1
4.5
1
Oth
er C
rops
A
ll
9
8.8
× 1
0-1
6.0
2.4
3
.1
2.0
× 1
0-2
8
.2
5
All
37
1.1
2.5
1.7
1
.9
1.5
× 1
0-1
9
.8
9
San
d
11
2.1
2.3
3.0
2
.9
9.3
× 1
0-1
9
.8
7
Loam
3
1.8
2.3
2.2
1
.5
7.2
× 1
0-1
3
.6
3
Cer
eals
S
tem
s an
d s
hoots
Cla
y
20
7.5
× 1
0-1
2.4
1.0
7
.8 ×
10-1
1
.5 ×
10-1
2
.8
5
All
36
7.3
× 1
0-1
6.0
9.9
× 1
0-1
7
.6 ×
10-1
1
.2 ×
10-1
3
.0
5
San
d
23
8.2
× 1
0-1
2.6
1.2
8
.7 ×
10-1
1
.2 ×
10-1
3
.0
4
Loam
7
7.0
× 1
0-1
1.7
7.8
× 1
0-1
3
.7 ×
10-1
2
.8 ×
10-1
1
.4
2
Mai
ze
Ste
ms
and s
hoots
Cla
y
6
5.0
× 1
0-1
1.9
5.9
× 1
0-1
3
.4 ×
10-1
1
.8 ×
10-1
1
.1
2
1 75
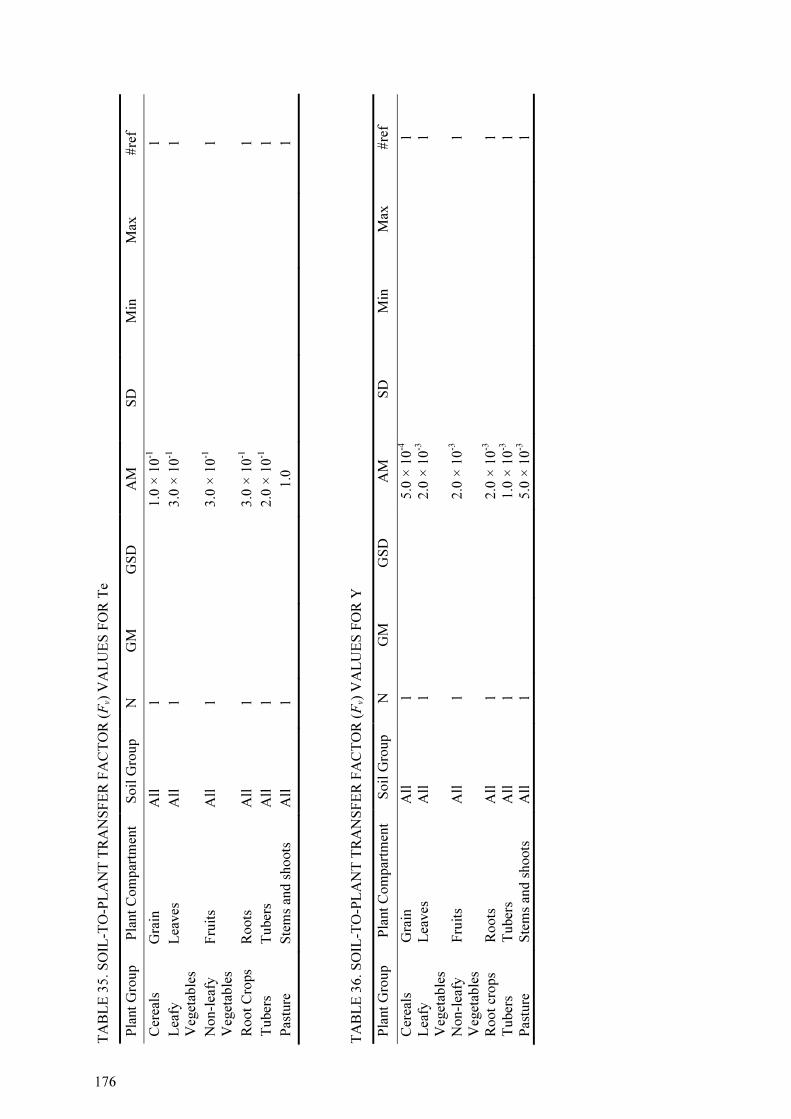
TA
BL
E 3
5.
SO
IL-T
O-P
LA
NT
TR
AN
SF
ER
FA
CT
OR
(Fv)
VA
LU
ES
FO
R T
e
Pla
nt
Gro
up
Pla
nt
Co
mp
artm
ent
So
il G
roup
N
GM
G
SD
A
M
SD
M
in
Max
#
ref
Cer
eals
G
rain
A
ll
1
1.0
× 1
0-1
1
Lea
fy
Veg
etab
les
Lea
ves
A
ll
1
3.0
× 1
0-1
1
Non-l
eafy
Veg
etab
les
Fru
its
All
1
3.0
× 1
0-1
1
Root
Cro
ps
Ro
ots
A
ll
1
3.0
× 1
0-1
1
Tuber
s T
uber
s A
ll
1
2.0
× 1
0-1
1
Pas
ture
S
tem
s an
d s
ho
ots
A
ll
1
1.0
1
TA
BL
E 3
6.
SO
IL-T
O-P
LA
NT
TR
AN
SF
ER
FA
CT
OR
(Fv)
VA
LU
ES
FO
R Y
Pla
nt
Gro
up
Pla
nt
Co
mp
artm
ent
So
il G
roup
N
GM
G
SD
A
M
SD
M
in
Max
#
ref
Cer
eals
G
rain
A
ll
1
5.0
× 1
0-4
1
Lea
fy
Veg
etab
les
Lea
ves
A
ll
1
2.0
× 1
0-3
1
Non-l
eafy
V
eget
able
s F
ruit
s A
ll
1
2.0
× 1
0-3
1
Root
crops
Ro
ots
A
ll
1
2.0
× 1
0-3
1
Tuber
s T
uber
s A
ll
1
1.0
× 1
0-3
1
Pas
ture
S
tem
s an
d s
ho
ots
A
ll
1
5.0
× 1
0-3
1
176
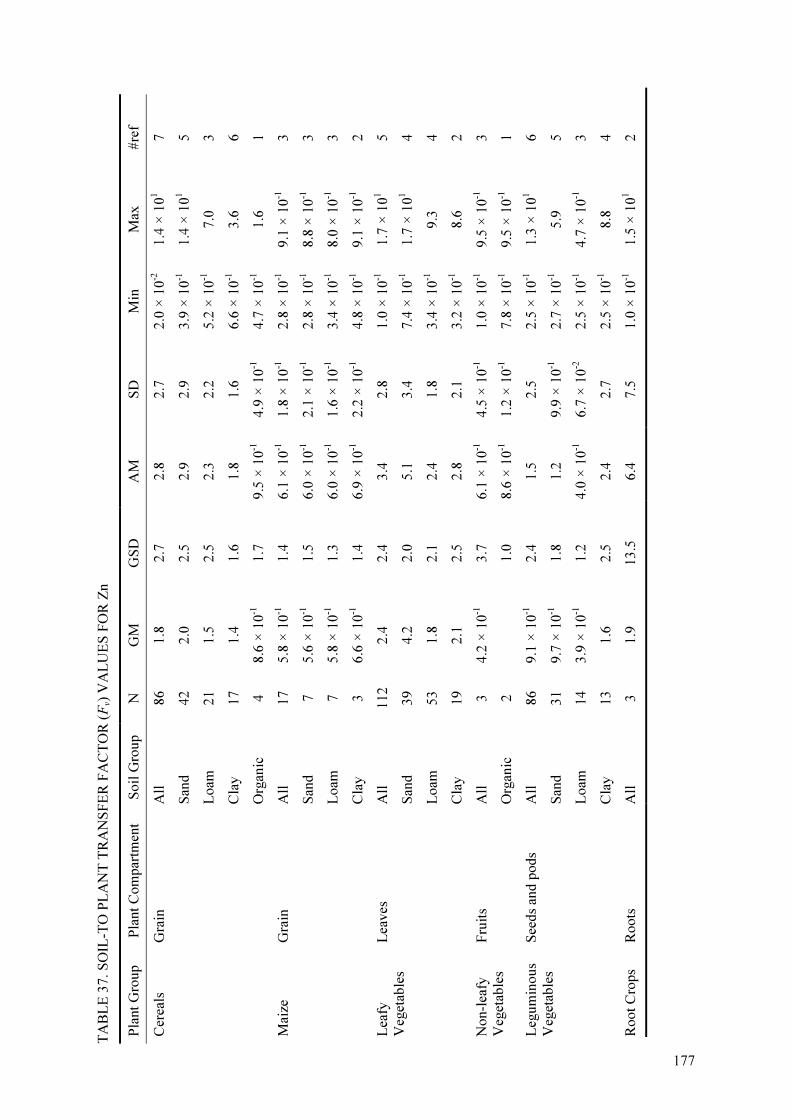
TA
BL
E 3
7.
SO
IL-T
O P
LA
NT
TR
AN
SF
ER
FA
CT
OR
(Fv)
VA
LU
ES
FO
R Z
n
Pla
nt
Gro
up
Pla
nt
Co
mp
artm
ent
So
il G
roup
N
GM
G
SD
A
M
SD
M
in
Max
#
ref
All
86
1.8
2.7
2.8
2
.7
2.0
× 1
0-2
1.4
× 1
01
7
San
d
42
2.0
2.5
2.9
2
.9
3.9
× 1
0-1
1.4
× 1
01
5
Lo
am
21
1.5
2.5
2.3
2
.2
5.2
× 1
0-1
7
.0
3
Cla
y
17
1.4
1.6
1.8
1
.6
6.6
× 1
0-1
3
.6
6
Cer
eals
G
rain
Org
anic
4
8.6
× 1
0-1
1.7
9.5
× 1
0-1
4.9
× 1
0-1
4.7
× 1
0-1
1
.6
1
All
17
5.8
× 1
0-1
1.4
6.1
× 1
0-1
1.8
× 1
0-1
2.8
× 1
0-1
9.1
× 1
0-1
3
San
d
7
5.6
× 1
0-1
1.5
6.0
× 1
0-1
2.1
× 1
0-1
2.8
× 1
0-1
8.8
× 1
0-1
3
Lo
am
7
5.8
× 1
0-1
1.3
6.0
× 1
0-1
1.6
× 1
0-1
3.4
× 1
0-1
8.0
× 1
0-1
3
Mai
ze
Gra
in
Cla
y
3
6.6
× 1
0-1
1.4
6.9
× 1
0-1
2.2
× 1
0-1
4.8
× 1
0-1
9.1
× 1
0-1
2
All
112
2.4
2.4
3.4
2
.8
1.0
× 1
0-1
1.7
× 1
01
5
San
d
39
4.2
2.0
5.1
3
.4
7.4
× 1
0-1
1.7
× 1
01
4
Lo
am
53
1.8
2.1
2.4
1
.8
3.4
× 1
0-1
9
.3
4
Lea
fy
Veg
etab
les
Lea
ves
Cla
y
19
2.1
2.5
2.8
2
.1
3.2
× 1
0-1
8
.6
2
All
3
4.2
× 1
0-1
3.7
6.1
× 1
0-1
4.5
× 1
0-1
1.0
× 1
0-1
9.5
× 1
0-1
3
N
on-l
eafy
V
eget
able
s F
ruit
s
Org
anic
2
1.0
8.6
× 1
0-1
1.2
× 1
0-1
7.8
× 1
0-1
9.5
× 1
0-1
1
All
86
9.1
× 1
0-1
2.4
1.5
2
.5
2.5
× 1
0-1
1.3
× 1
01
6
San
d
31
9.7
× 1
0-1
1.8
1.2
9
.9 ×
10-1
2.7
× 1
0-1
5
.9
5
Lo
am
14
3.9
× 1
0-1
1.2
4.0
× 1
0-1
6.7
× 1
0-2
2.5
× 1
0-1
4.7
× 1
0-1
3
Leg
um
inous
Veg
etab
les
See
ds
and
po
ds
Cla
y
13
1.6
2.5
2.4
2
.7
2.5
× 1
0-1
8
.8
4
Root
Cro
ps
Ro
ots
A
ll
3
1.9
13.5
6.4
7
.5
1.0
× 1
0-1
1.5
× 1
01
2
177

TA
BL
E 3
7.
SO
IL-T
O P
LA
NT
TR
AN
SF
ER
FA
CT
OR
(Fv)
VA
LU
ES
FO
R Z
n (
Cont)
Pla
nt
Gro
up
Pla
nt
Co
mp
artm
ent
Soil
Gro
up
N
GM
G
SD
A
M
SD
M
in
Max
#
ref
All
20
3.0
× 1
0-1
1.8
3.4
× 1
0-1
1.5
× 1
0-1
5.0
× 1
0-2
6.3
× 1
0-1
4
San
d
6
3.5
× 1
0-1
1.5
3.7
× 1
0-1
1.5
× 1
0-1
1.9
× 1
0-1
6.3
× 1
0-1
3
Lo
am
10
3.0
× 1
0-1
1.6
3.3
× 1
0-1
1.5
× 1
0-1
1.5
× 1
0-1
5.8
× 1
0-1
3
Tuber
s T
uber
s
Cla
y
3
3.7
× 1
0-1
1.4
3.8
× 1
0-1
1.2
× 1
0-1
2.4
× 1
0-1
4.6
× 1
0-1
3
All
73
1.0
1.9
1.2
6
.0 ×
10-1
5.4
× 1
0-2
3
.2
2
San
d
38
1.3
1.4
1.4
4
.8 ×
10-1
4.8
× 1
0-1
2
.5
2
Pas
ture
S
tem
s an
d s
ho
ots
Loam
34
7.8
× 1
0-1
2.1
9.7
× 1
0-1
6.3
× 1
0-1
5.4
× 1
0-2
3
.2
2
All
28
5.3
1.7
6.1
3
.4
2.0
1
.5 ×
101
6
San
d
6
8.2
1.5
8.8
3
.3
4.2
1
.2 ×
101
5
Loam
14
4.4
1.5
4.7
1
.9
2.5
9
.5
5
Cer
eals
S
tem
s an
d s
ho
ots
Cla
y
8
3.8
1.6
4.2
1
.9
2.0
7
.2
5
Mai
ze
Ste
ms
and
sh
oots
A
ll
2
5.8
1
.8
4.5
7
.0
TA
BL
E 3
8.
SO
IL-T
O-P
LA
NT
TR
AN
SF
ER
FA
CT
OR
(Fv)
VA
LU
ES
FO
R Z
r
Pla
nt
Gro
up
Pla
nt
Co
mp
artm
ent
Soil
Gro
up
N
GM
G
SD
A
M
SD
M
in
Max
#
ref
Cer
eals
G
rain
A
ll
1
1.0
× 1
0-3
1
Lea
fy
Veg
etab
les
Lea
ves
A
ll
1
4.0
× 1
0-3
1
Non-l
eafy
V
eget
able
s F
ruit
s, h
ead
s,
ber
ries
, b
uds
All
1
4.0
× 1
0-3
1
Root
Cro
ps
Ro
ots
A
ll
1
4.0
× 1
0-3
1
Tuber
s T
uber
s A
ll
1
2.0
× 1
0-3
1
Pas
ture
S
tem
s an
d s
ho
ots
A
ll
1
1.0
× 1
0-2
1
17 8
179
By definition, soil-plant transfer factors concept implies equilibrium or quasi equilibrium
conditions in the soil-plant system. This precondition is valid with some accuracy, if flows of
radionuclides from available pool of radionuclides to plants (or unavailable pool) are
negligible. Special care was taken in data selection for the current document to avoid data
obtained in non-equilibrium conditions because of interference by soil sorption/adsorption
processes and it has been assumed that radionuclide flows from soil to plants are low
compared to the available pool of radionuclide in soil.
This is not the case for very mobile radionuclides (such as chlorine and technetium), i.e. for
radionuclides with soil-plant transfer factors values which are around 100 or even higher. It
should be mentioned that these values have been also determined properly, as the ratio of the
activity concentrations in plants and soil at harvest; but most likely this was done for the
conditions with no equilibrium in the soil-plant system.
Another point is that chlorine and technetium are very mobile in soil and may be subject to a
considerable migration to deeper soil layers; i.e. the soil activities at the end of the vegetation
are much lower than at the beginning. Such observations are made in the study by Kashparov
et al. [5.24-5.25], where the chlorine activity dropped by a factor of 10-100 due to heavy
rainfall during the growing period. However, the activity in plant is due to uptake from soil
during the whole vegetation period. Transfer factors from the radionuclide activity
concentrations in soil and plant are usually being determined at the end of the vegetation
period. Applying those values to activity concentration determined at the start of the
vegetation period may cause serious overestimations.
Therefore, for the current document average values for Cl concentration in soil were selected.
Besides, for some of these radionuclides, e.g. 3H,
14C, and
36Cl, transfer parameters and
models are normally formulated in terms of specific activity concepts. Therefore, data for
these particular radionuclides are mainly treated separately and given in a specific paper of
this TECDOC.
As previously reported for natural radionuclides, the data given in Tables 8-40 show clear
differences between the geometric and arithmetic mean values. The mean ratio of the
arithmetic mean to the geometric mean, calculated across all the datasets used for estimation
of radionuclide transfer factors from all soils to all plants, was 1.8 with the standard deviation
around that mean of 1.14. However, the majority of such ratios calculated for individual
databases is less than factor 3 (Fig. 5).
The Fv geometric mean values for transuranic elements range from 4.3 × 10⁻⁷
to 5.1 × 10⁻¹
; for
fission products from 5.1 × 10⁻⁶
to 5.3 × 10²
(Fig. 7); for neutron activation products from 4.5
× 10-4
to 5.2 × 10².
Radionuclide accumulation shows high variability, which is influenced by the physical and
chemical properties of radionuclides, soil properties, and peculiarities of plant species. Figs.
6-8 illustrate effects of radionuclide properties, representing Fv values to Cereals planted on
sandy soils.
At the same time, the general point, relevant to all crop and soil groups, is that extremely
large variability in transfer factors was not observed. For any combination of soil/crop, the
uncertainity factor, expressed as a GSD, is less than a factor of five for the majority of
datasets. The exceptions were the data for Am (Cereals, all plant compartments, Clay and
Loam soils), Cs (Herbs: Stems and shoots ), Pu (Cereals and Tubers, 6 datasets), Tc (Maize
and Leafy Vegetables) and the data for Zn transfer to Root Crops.
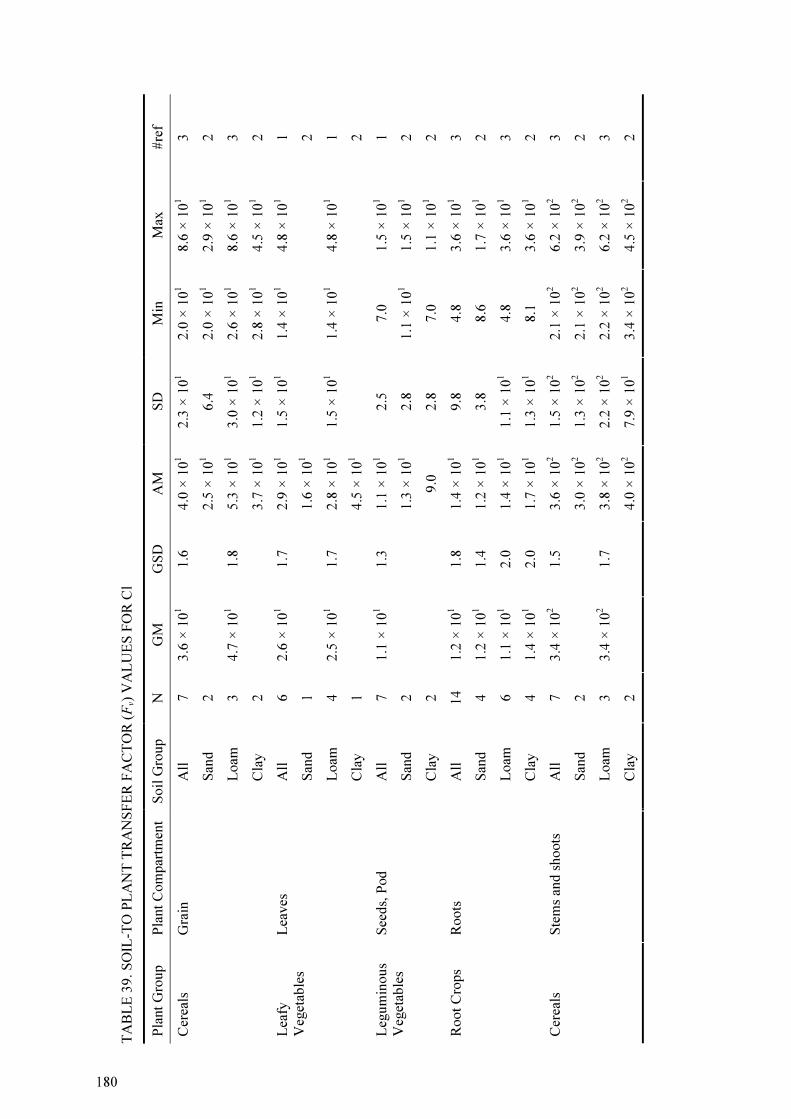
TA
BL
E 3
9.
SO
IL-T
O P
LA
NT
TR
AN
SF
ER
FA
CT
OR
(Fv)
VA
LU
ES
FO
R C
l
Pla
nt
Gro
up
Pla
nt
Co
mp
artm
ent
So
il G
roup
N
GM
G
SD
A
M
SD
M
in
Max
#
ref
All
7
3.6
× 1
01
1.6
4.0
× 1
01
2.3
× 1
01
2.0
× 1
01
8.6
× 1
01
3
San
d
2
2.5
× 1
01
6.4
2
.0 ×
101
2.9
× 1
01
2
Loam
3
4.7
× 1
01
1.8
5.3
× 1
01
3.0
× 1
01
2.6
× 1
01
8.6
× 1
01
3
Cer
eals
G
rain
Cla
y
2
3.7
× 1
01
1.2
× 1
01
2.8
× 1
01
4.5
× 1
01
2
All
6
2.6
× 1
01
1.7
2.9
× 1
01
1.5
× 1
01
1.4
× 1
01
4.8
× 1
01
1
San
d
1
1.6
× 1
01
2
Loam
4
2.5
× 1
01
1.7
2.8
× 1
01
1.5
× 1
01
1.4
× 1
01
4.8
× 1
01
1
Lea
fy
Veg
etab
les
Lea
ves
Cla
y
1
4.5
× 1
01
2
All
7
1.1
× 1
01
1.3
1.1
× 1
01
2.5
7
.0
1.5
× 1
01
1
San
d
2
1.3
× 1
01
2.8
1
.1 ×
101
1.5
× 1
01
2
Leg
um
inous
Veg
etab
les
See
ds,
Pod
Cla
y
2
9.0
2
.8
7.0
1
.1 ×
101
2
All
14
1.2
× 1
01
1.8
1.4
× 1
01
9.8
4
.8
3.6
× 1
01
3
San
d
4
1.2
× 1
01
1.4
1.2
× 1
01
3.8
8
.6
1.7
× 1
01
2
Loam
6
1.1
× 1
01
2.0
1.4
× 1
01
1.1
× 1
01
4.8
3
.6 ×
101
3
Root
Cro
ps
Ro
ots
Cla
y
4
1.4
× 1
01
2.0
1.7
× 1
01
1.3
× 1
01
8.1
3
.6 ×
101
2
All
7
3.4
× 1
02
1.5
3.6
× 1
02
1.5
× 1
02
2.1
× 1
02
6.2
× 1
02
3
San
d
2
3.0
× 1
02
1.3
× 1
02
2.1
× 1
02
3.9
× 1
02
2
Loam
3
3.4
× 1
02
1.7
3.8
× 1
02
2.2
× 1
02
2.2
× 1
02
6.2
× 1
02
3
Cer
eals
S
tem
s an
d s
ho
ots
Cla
y
2
4.0
× 1
02
7.9
× 1
01
3.4
× 1
02
4.5
× 1
02
2
1 80

TA
BL
E 4
0.
SO
IL-T
O-P
LA
NT
TR
AN
SF
ER
FA
CT
OR
S (Fv)
FO
R T
c
Pla
nt
Gro
up
Pla
nt
Co
mp
artm
ent
So
il G
roup
N
GM
G
SD
A
M
SD
M
in
Max
#
ref
Cer
eal
Gra
in
All
2
1.3
1
.6
1.8
× 1
0-1
2
.4
2
Mai
ze
Gra
in
All
8
3.8
8.2
1.7
× 1
01
2.3
× 1
01
5.0
× 1
0-1
5.2
× 1
01
3
All
10
1.8
× 1
02
13.5
1.1
× 1
03
1.4
× 1
03
4.5
3
.4 ×
103
2
San
d
4
1.1
× 1
02
33.1
1.2
× 1
03
1.4
× 1
03
4.5
2
.9 ×
103
1
Lea
fy
Veg
etab
les
Lea
ves
Lo
am
6
2.5
× 1
02
8.2
1.1
× 1
03
1.6
× 1
03
2.5
× 1
01
3.4
× 1
03
1
All
5
4.3
5.2
1.1
× 1
01
1.4
× 1
01
1.1
3
.0 ×
101
2
San
d
3
1.3
1.1
1.3
1
.6 ×
10-1
1
.1
1.4
2
Leg
um
inous
Veg
etab
les
See
ds
and
po
ds
Lo
am
2
2.6
× 1
01
4.7
2
.3 ×
101
3.0
× 1
01
2
Root
Cro
ps
Ro
ots
A
ll
2
4.6
× 1
01
4.6
× 1
01
1.4
× 1
01
7.9
× 1
01
2
All
8
2.3
× 1
0-1
3.7
3.5
× 1
0-1
2.2
× 1
0-1
1.3
× 1
0-2
6.5
× 1
0-1
2
San
d
6
3.9
× 1
0-1
1.6
4.3
× 1
0-1
1.8
× 1
0-1
1.8
× 1
0-1
6.5
× 1
0-1
2
Tuber
s T
uber
s
Lo
am
2
9.4
× 1
0-2
1.2
× 1
0-1
1.3
× 1
0-2
1.8
× 1
0-1
2
Gra
sses
S
tem
s an
d s
ho
ots
A
ll
1
1
Pas
ture
S
tem
s an
d s
ho
ots
A
ll
18
7.6
× 1
01
3.0
1.2
× 1
02
1.3
× 1
02
7.9
4
.7 ×
102
2
Mai
ze
Ste
ms
and
sh
oots
A
ll
20
6.4
3.3
1.1
× 1
01
1.1
× 1
01
8.4
× 1
0-1
3.7
× 1
01
2
1 18

182
FIG. 5. Relative frequencies distribution plot of ratios of the arithmetic means of the transfer factors
to those of the geometric means.
Am
Cm
Np
Pu
1.00E-08
1.00E-07
1.00E-06
1.00E-05
1.00E-04
1.00E-03
1.00E-02
1.00E-01
1.00E+00
Tra
ns
fer
fac
tors
to
pla
nts
GM
95%Conf. Interval
FIG. 6. Chart representation of distribution of Fv values to cerals for transuranic elements (sandy
soils).
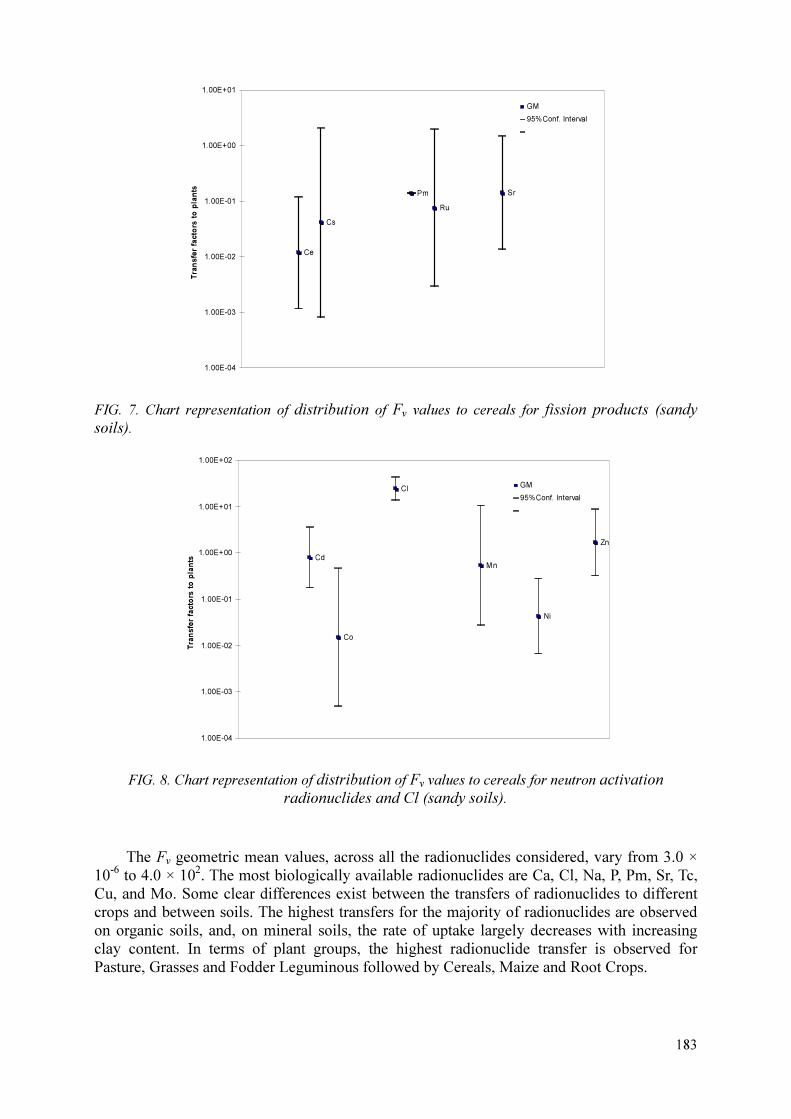
183
Ce
Cs
Pm
Ru
Sr
1.00E-04
1.00E-03
1.00E-02
1.00E-01
1.00E+00
1.00E+01
Tra
ns
fer
fac
tors
to
pla
nts
GM
95%Conf. Interval
FIG. 7. Chart representation of distribution of Fv values to cereals for fission products (sandy
soils).
Cd
Co
Cl
Mn
Ni
Zn
1.00E-04
1.00E-03
1.00E-02
1.00E-01
1.00E+00
1.00E+01
1.00E+02
Tra
nsfe
r fa
cto
rs t
o p
lan
ts
GM
95%Conf. Interval
FIG. 8. Chart representation of distribution of Fv values to cereals for neutron activation
radionuclides and Cl (sandy soils).
The Fv geometric mean values, across all the radionuclides considered, vary from 3.0 ×
10-6
to 4.0 × 10². The most biologically available radionuclides are Ca, Cl, Na, P, Pm, Sr, Tc,
Cu, and Mo. Some clear differences exist between the transfers of radionuclides to different
crops and between soils. The highest transfers for the majority of radionuclides are observed
on organic soils, and, on mineral soils, the rate of uptake largely decreases with increasing
clay content. In terms of plant groups, the highest radionuclide transfer is observed for
Pasture, Grasses and Fodder Leguminous followed by Cereals, Maize and Root Crops.

184
4. COMPARISON OF THE AVAILABLE DATA
WITH TECHNICAL REPORTS SERIES NO. 364
The present database contains information about eight elements, in addition to those
previously included in Technical Reports Series No. 364, and in particular, Ca, Cd, Cl, K, Pm,
and P. Data for these are given in the current document (Figure 9). For some radionuclides,
e.g. 3H,
14C, and
36Cl, transfer parameters and models are normally formulated in terms of
specific activity concepts. Therefore, data for these particular radionuclides are treated
separately and presented in the separate paper1 presented in this document below.
For Сu, Nd, Pr, Rh and W, no additional information was obtained; as a result, the present
database contains Fv values only from Technical Reports Series No. 364 [6]. It should be
recognized that the expected values for these five elements presented in Technical Reports
Series No. 364 are mainly a product of expert judgement and based only on one reference,
namely [7]. Therefore, results of radiological assessments with these values involved should
be interpreted with great caution.
FIG. 9. Comparison of data available from Technical Reports Series No. 364 and from the current document.
TABLE 41 SOIL-TO PLANT TRANSFER FACTORS FOR RADIONUCLIDES PRESENTED ONLY IN Technical Reports Series No. 364
Element Plant Group Plant
compartment
Soil
Group
N Expected
Value
Uncertainity
Factor
#ref
Cu Not specified All 1 0.8 - 1
Nd Not specified All 1 2.0 × 10⁻² - 1
Pr Cereal Grain All 1 2.0 × 10⁻² - 1
Leafy Vegetables Leaves All 2.0 × 10⁻² -
Root Crops Roots All 2.0 × 10⁻² -
Rh Not specified All 1 9.0 × 10⁻¹ - 1
W Not specified All 1 1.0 × 10⁻¹ - 1
1 See Davis et al. ‘Specific activity models and parameter values for tritium, 14C and 36Cl’ in this documment

185
In comparison to Technical Reports Series No. 364, the current document contains many
more data for radionuclide transfer to different crop groups and for different soils and allows,
at least in part, for better differentiation between specific contamination scenarios.
5. CONCLUSIONS
Assessment of Fv values based on the literature sources is always associated with many
shortcomings, and very often considerable judgment must be exercised in evaluating the
available data. First, such data are normally based on studies that were not originally intended
for transfer factors assessments. Second, the experimental design may deviate greatly from
the transfer factor definition. For example, vertical distribution of radionuclides in soil
profiles can depart from the uniform distribution assumed by the transfer factor definition,
etc. Radionuclide transfer to plants depends on numerous factors including physical and
chemical forms of the radionuclide, soil properties, plant species, plant compartment, farming
practices, etc. Such factors result in high variability, and the individual Fv values themselves
can vary over three orders of magnitude [2, 3, 8].
In order to decrease the uncertainty associated with soil/plant factors, several classifications
were developed and soil-to-plant transfer factors for temperate environments were reviewed
and grouped according to the selected plant and soil categories. New information presented in
this paper substantially increases the amount of available data on radionuclide transfer to
plants. The data, providing information for specific plant and soil groups, allows more precise
radiological assessments in different areas around the world. However, there are still clear
gaps in transfer factor values for a substantial number of radionuclides, plants, and soil
groups.
Acceptable numbers of data entries for radionuclide transfer to plants are available only for a
few elements, such as Cs, Sr, and partially for U, Ra, Mn, and Co. From 100 to 500 estimates
are available for some other elements such as Pu, Ni, Ce, Cl, I, Cm, Np, Am, Zn, Th and Pb
while for 19 elements (Cu, Eu, P, Nb, Ba, Na, Cr, Zr, Ca, Y, Ag, Fe, La, Cd, Sb, Pm, Tc, Ru
and Po), only from 10 to 100 entries are available. For some elements such as Te, Mo and Rb,
only a few values are available, and for elements such as Cu, Nd, Pr, Rh, and W, single values
available from the literature are provided, based on expert judgement, or estimated, based on
behaviour of stable analogues. Thus, for many radionuclides, there are no experimental data
to support radiological assessments, and an analogue approach should be used to derive the
necessary values.
REFERENCES
[1] INTERNATIONAL ATOMIC ENERGY AGENCY. The classification of soil systems on the basis of transfer factors of radionuclides from soil to reference plants. A FAO/IAEA/IUR
Coordinated Research Programme. IAEA, Vienna, (1999).
[2] FRISSEL, M.J., Van BERGEIJK, K.E., “Mean Transfer Values Derived by Simple Statistical Regression Analysis”, VIth Report of the IUR Working group Soil-to-Plant Transfer Factors:
Report of the working group meeting in Guttannen Switzerland Bilthoven, RIVM 240 (1989) 24-26.
[3] FRISSEL, M. J.,. An update of the recommended soil-to-plant transfer factors of 90
Sr, 137
Cs and transuranics, 8th
Report of the Working Group Meeting on Soil-to-Plant Transfer Factors, IUR Madrid (1992) 16-25.

186
[4] DEVILLE-CAVELIN, G., BIESOLD, H., CHABANYUK, V., BRUN-YABA, Ch.,
RUTSCHKOWSKY, N. and FRIEDERICHS, H.G. (2004) Synthesis Report of the Radioecology Project of the French-German Initiative for Chernobyl – FGI Report 04-01.
[5] RUSSIAN INSTITUTE OF AGRICULTURAL RADIOLOGY AND AGROECOLOGY, Annual scientific report. RIARAE, Obninsk (2003) 139
[6] INTERNATIONAL ATOMIC ENERGY AGENCY, Handbook of Parameter Values for the Prediction of Radionuclide Transfer in Temperate Environments, Technical Report Series
No.364, IAEA, Vienna (1994).
[7] Soil-to-Plant Concentration Factors for Radiological Assessments, Final report, Y.C. Ng, S.E. Thompson, C.S. Colsher, Lawrence Livermore national Laboratory. National Technical
Information Service. NUREG/CR-2975 UCID-19463, (1982) 132.
[8] Agricultural Radioecology. (R.M. ALEXAKHIN, N.A, KORNEEV. Eds.) Moscow (1992) (in Russian).
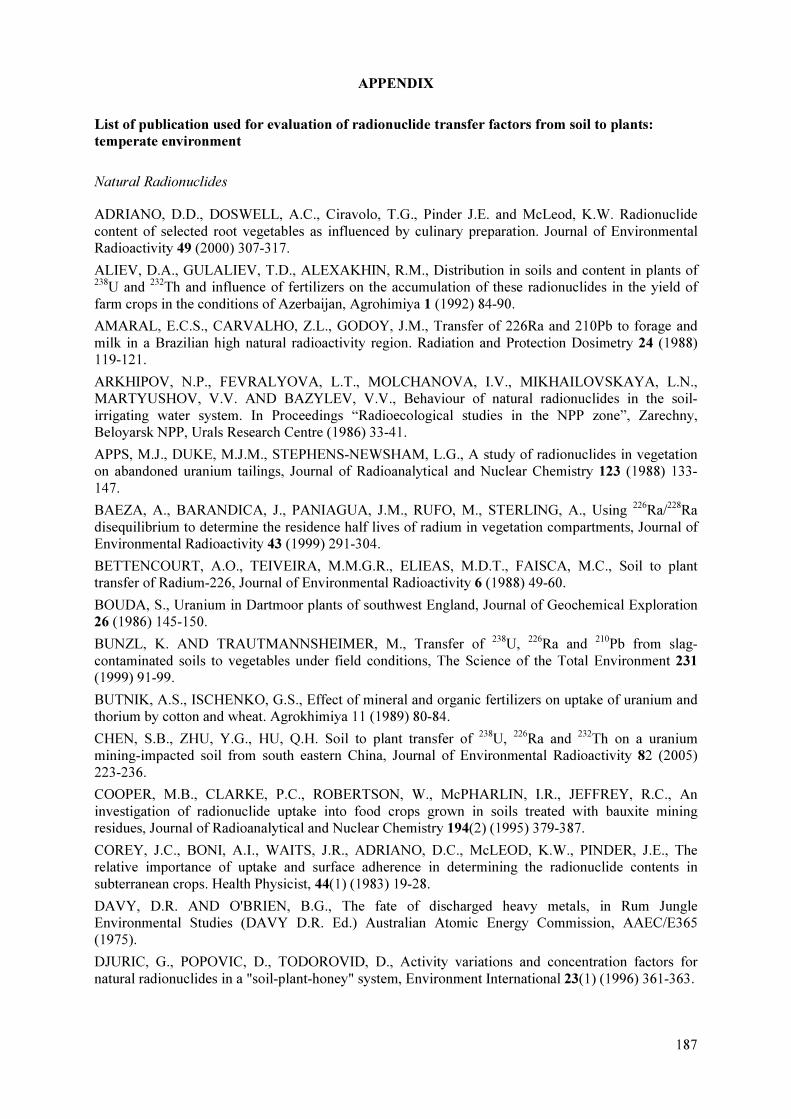
187
APPENDIX
List of publication used for evaluation of radionuclide transfer factors from soil to plants:
temperate environment
Natural Radionuclides
ADRIANO, D.D., DOSWELL, A.C., Ciravolo, T.G., Pinder J.E. and McLeod, K.W. Radionuclide content of selected root vegetables as influenced by culinary preparation. Journal of Environmental Radioactivity 49 (2000) 307-317.
ALIEV, D.A., GULALIEV, T.D., ALEXAKHIN, R.M., Distribution in soils and content in plants of 238U and 232Th and influence of fertilizers on the accumulation of these radionuclides in the yield of farm crops in the conditions of Azerbaijan, Agrohimiya 1 (1992) 84-90.
AMARAL, E.C.S., CARVALHO, Z.L., GODOY, J.M., Transfer of 226Ra and 210Pb to forage and milk in a Brazilian high natural radioactivity region. Radiation and Protection Dosimetry 24 (1988) 119-121.
ARKHIPOV, N.P., FEVRALYOVA, L.T., MOLCHANOVA, I.V., MIKHAILOVSKAYA, L.N., MARTYUSHOV, V.V. AND BAZYLEV, V.V., Behaviour of natural radionuclides in the soil-irrigating water system. In Proceedings “Radioecological studies in the NPP zone”, Zarechny, Beloyarsk NPP, Urals Research Centre (1986) 33-41.
APPS, M.J., DUKE, M.J.M., STEPHENS-NEWSHAM, L.G., A study of radionuclides in vegetation on abandoned uranium tailings, Journal of Radioanalytical and Nuclear Chemistry 123 (1988) 133-147.
BAEZA, A., BARANDICA, J., PANIAGUA, J.M., RUFO, M., STERLING, A., Using 226Ra/228Ra disequilibrium to determine the residence half lives of radium in vegetation compartments, Journal of Environmental Radioactivity 43 (1999) 291-304.
BETTENCOURT, A.O., TEIVEIRA, M.M.G.R., ELIEAS, M.D.T., FAISCA, M.C., Soil to plant transfer of Radium-226, Journal of Environmental Radioactivity 6 (1988) 49-60.
BOUDA, S., Uranium in Dartmoor plants of southwest England, Journal of Geochemical Exploration 26 (1986) 145-150.
BUNZL, K. AND TRAUTMANNSHEIMER, M., Transfer of 238U, 226Ra and 210Pb from slag-contaminated soils to vegetables under field conditions, The Science of the Total Environment 231 (1999) 91-99.
BUTNIK, A.S., ISCHENKO, G.S., Effect of mineral and organic fertilizers on uptake of uranium and thorium by cotton and wheat. Agrokhimiya 11 (1989) 80-84.
CHEN, S.B., ZHU, Y.G., HU, Q.H. Soil to plant transfer of 238U, 226Ra and 232Th on a uranium mining-impacted soil from south eastern China, Journal of Environmental Radioactivity 82 (2005) 223-236.
COOPER, M.B., CLARKE, P.C., ROBERTSON, W., McPHARLIN, I.R., JEFFREY, R.C., An investigation of radionuclide uptake into food crops grown in soils treated with bauxite mining residues, Journal of Radioanalytical and Nuclear Chemistry 194(2) (1995) 379-387.
COREY, J.C., BONI, A.I., WAITS, J.R., ADRIANO, D.C., McLEOD, K.W., PINDER, J.E., The relative importance of uptake and surface adherence in determining the radionuclide contents in subterranean crops. Health Physicist, 44(1) (1983) 19-28.
DAVY, D.R. AND O'BRIEN, B.G., The fate of discharged heavy metals, in Rum Jungle Environmental Studies (DAVY D.R. Ed.) Australian Atomic Energy Commission, AAEC/E365 (1975).
DJURIC, G., POPOVIC, D., TODOROVID, D., Activity variations and concentration factors for natural radionuclides in a "soil-plant-honey" system, Environment International 23(1) (1996) 361-363.
188
DOBRIN, R.I., DULAMA, D.N., TOMA, A.L., Soil-plant experimental radionuclide transfer factors, Romanian Journal of Physics, 51(1-2) (2006) 73-76.
DOWDALL, M., GWYNN, J.P., MORAN, C., O'DEA, J., DAVIDS, C., LIND, B., Uptake of radionuclides by vegetation at a High Arctic Location, Environmental Pollution 133 (2005) 327-332.
DREESEN, D.R., WILLIAMS, J.M., MARPLE, M.L., GLADNEY, E.S., PERRIN, D.R., Mobility and bioavailability of uranium mill tailings contaminants, Environmental Science and Technology 16 (1982) 702-709.
DRICHKO V.P., LISACHENKO E.P., MIKHAILOVA O.A., PONIKAROVA T.M., POPOV D.K., Transfer of some radionuclides from soil to plants, State Committee on Atomic Energy Use (1976).
DUQUÈNE, L., VANDENHOVE, H., TACK , F., VAN DER AVOORT, E., VAN HEES, M., WANNIJN, J., Plant induced changes in soil chemistry do not explain differences in uranium transfer, Journal of Environmental Radioactivity 90 (2006) 1-14.
FRESQUEZ, P.R., ARMSTRONG, D.R., MULLEN, M.A., NARANJO, L., The uptake of radionuclides by beans, squash and corn, growing in contaminated alluvial soils at Los Alamos National Laboratory, Journal of Environmental Science and Health, 33(1) (1998) 99-122.
FROST, H. L., KETCHUM, L.H., JAIN, J.C., NEAL, C.R., Heavy metal uptake during the growth of durum wheat from application of sewage sludge and commercial fertilizer, Purdue Industrial Waste Water Conference Proceedings 52 (1997) 395-400.
GARTEN, C.T., Comparative uptake of 234U, 238U, 239Pu, 241Am, and 244Cm by box elder trees (Acer
negundo) inhabiting a contaminated Tennessee floodplain, Health Physics 39(2) (1980) 332-334.
GERZABEK, M.H., STREBL, F., TEMMEL, B., Plant uptake of radionuclides in lysimeter experiments, Environmental Pollution 99 (1998) 93-103.
GIASSI-NEJAD, M., BEITOLLHANI, M.M., ASEFI, M., REZA-NEJAD, F., Exposure to 226Ra from consumption of vegetables in the high level natural radiation area of Rmsar-Iran. Journal of Environmental Radioactivity 66 (2003) 215-222.
GREEMAN, D.J., ROSE, A.W., WASHINGTON, J.W., DOBOS, R.R., CIOLKOSZ E.J., Geochemistry of radium in soils of the Eastern United States, Applied Geochemistry 14 (1999) 365-385.
HAM, G.J., WILKINS, B.T., EWERS L.W., 210Pb, 210Po, 226Ra, U and Th in arable crops and ovine liver: variations in concentrations in the United Kingdom and resultant doses, Radiation Protection Dosimetry 93(2) (2001) 151-159.
HARIDASAN, P.P., PAUL, A.C., DESAI, M.V.M., Natural radionuclides in the aquatic environment of a phosphorgypsum disposal area. Journal of Environmental Radioactivity 53 (2001) 155-165.
HEWAMANNA, R., SAMARAKOON, C.M. AND KARUNARATNE, P.A.V.N., Concentration and chemical distribution of radium in plants from monazite bearing soils, Environmental and Experimental Botany 28(2) (1988) 137-143.
IBRAHIM, S.I., WHICKER W., Comparative uptake of U and Th by native plants at a U production site, Health Physics 54(4) (1987) 413-419.
IBRAHIM, S.A., WHICKER, F.W., Plant/soil transfer factors of 226Ra for contrasting sites around an active U mine-mill, Health Physicist 55(6) (1988) 903-910.
IBRAHIM, S.A., WHICKER, F.W., Comparative plant uptake and environmental behavior of U-series radionuclides at the Uranium mine-mill, Journal of Radioanalytical and Nuclear Chemistry 156 (1992) 253-267.
IBRAHIM, S.A., WHICKER, F.W., Plant accumulation and plant/soil transfer factors of 210Pb and 210Po at various sites within a uranium mining and milling operation, Environmental and Experimental Botany 27(2) (1987) 203-213.
IDIZ, E.F., CARLISLE, D., KAPLAN, I.R., Interaction between organic matter and trace metals in uranium rich bog, Kern County, California, USA. Applied Geochemistry 1 (1986) 573-590.
JAIN, G.S., AERY, N.C., Effect of uranium additions on certain biochemical constituents and uranium accumulation in wheat, Biologia Bratislava 52 (1997) 599-604.
189
Jigareva T.L., Ratnikov A.N., Petrov, K. I., Popova, G.L, Sviridenko, D.G., Kasianenko, A.A., 238U and 232Th migration in plant phytocenoses. In: Topical problems of ecology and use of nature: Collected scientific works 6 (2004) 188-191 (In Russian).
KIRCHMANN, R., LAFONTAINE, A., CANTILLON, G., BOULENGER, R., Etude du cycle biologique parcouru par la radioactivity, BLG477, SCK-CEN (1973).
KÖHLER, M., GLEISBERG, B., NIESE S., Investigation of the soil-plant transfer of primordial radionuclides in tomatoes by low-level gamma-ray spectrometry, Applied Radiation and Isotopes 53 (2000) 203-208.
LAKSHMANAN, A.R., VENKATESWARLU, K.S., Uptake of uranium by vegetables and rice, Water, Air and Soil Pollution 38 (1988) 151-155.
LI, J., SHANG, Z., YANG, J. AND TANG, S., Manual of parameters on radionuclide transfer in ecosystems (2006).
LIMA, V.T. AND PENNA FRANCA, E., Uptake of endogenous and exogenous 226Ra by vegetables from soils of a highly radioactive region, Radiation Protection Dosimetry 24(1/4), (1988) 123-126.
LINSALATA, P. Studies of transport pathways of Th, U, rare earths, Ra-228 and Ra-226 from soil to plants and farm animal, Report DOE/ER 60134-4. Institute of Environmental Medicine, New York University Medical Center (1986).
LINSALATA, P., MORSE, R., FORD, H., EISENBUD, M., FRANCA, E.P., DE CASTRO, M.B., LOBAO, N., SACHETT, I., CARLOS, M., Transport pathways of Th, U, Ra and La from soil to cattle tissue, Journal of Environmental Radioactivity 10 (1989) 115-140.
LINSALATA, P., MORSE, R., FORD, H., EISENBUD, M., FRANCA, E.P., DE CASTRO, M.B., LOBAO, N., SACHETT, I., CARLOS, M., An assessment of soil-to-plant transfer factors for some natural analogues of the transuranic elements, Health Physics 1 (1989) 33-46.
MAHON, D.C. AND MATTHEWES, R.W., Uptake of naturally occurring radioisotopes by vegetation in a region of high radioactivity, Canadian Journal of Soil Science 63 (1983)281-290.
MALIKOV V.G., ZHUKOV B.I., PEREPELYATNIKOVA, L.V., Migration of radionuclides from soil to farm crops in conditions of Northern Caucasus, Agrohimiya 5 (1988) 92-96.
MARKOSE, P.M., BHAT, I.S., PILLAI, K.C., Some characteristics of 226Ra transfer from soil and uranium mill tailings to plants, Journal of Environmental Radioactivity 21 (1983) 131-142.
MARTINEZ-AGUIRRE, A., PERIANEZ, R., Soil to plant transfer of 226Ra in a marsh area: modelling application, Journal of Environmental Radioactivity 39(2) (1998) 199-213.
MARTÍNEZ-AGUIRRE, A., GARCÍA-ORELLANA, I., GRACIA-LEÓN, M., Transfer of natural radionuclides from soils to plant in a marsh enhanced by the operation of non-nuclear industries, Journal of Environmental Radioactivity 35 (1997) 149-171.
MILLION, J.B., SARTAIN, J.B., GONZALEZ, R.X., CARRIER, W.D. III., Radium-226 and calcium uptake by crops grown in mixtures of sand and clay tailings from phosphate mining, Journal of Environmental Quality 24 (1994) 671-676.
MISLEVY, P., BLUE, W.G., ROESSLER, C.E., Productivity of clay tailings from phosphate mining: I. Biomass crops, Journal of Environmental Quality 18 (1989) 95-100.
MISLEVY, P., BLUE, W.G., ROESSLER, C.E., Productivity of clay tailings from phosphate mining: II. Forage crops, Journal of Environmental Quality 19 (1990) 694-700.
MISLEVY, P., BLUE, W.G., ROESSLER, C.E., MARTIN, F.G., Productivity of clay tailings from phosphate mining: III. Grain crops, Journal of Environmental Quality 20 (1991) 788-794.
MOFFETT, D. AND TELLIER, M., Uptake of radioisotopes by vegetation growing on uranium tailings, Canadian Journal of Soil Science 57 (1977) 417-424.
MORISHIMA, H., KOGA, T., KAWAI, H., HONDA, Y., KATSURAYAMA, K. Studies on the movement and distribution of uranium in the environment-distribution of uranium in agricultural products, Journal of Radiation Research 18 (1977) 139-150.

190
MORTVEDT, J.J., Plant and soil relationship of uranium and thorium decay series radionuclides–A review. Journal of Environmental Quality 23 (1994) 643-650.
NARAYANA, Y., RADHAKRISHNA, A.P., SOMASHEKARAPPA, H.M., KARUNAKARA, N., BALAKRISHNA, K.M., SIDDAPPA, K., Distribution of some natural and artificial radionuclides in the environment of coastal Karnataka of south India, Journal of Environmental Radioactivity 28(2) (1995) 113-139.
PAUL, A.C., PILLAI, K.C., Transfer and uptake of radium in a natural and in a technologically modified radiation environment, Journal of Environmental Radioactivity 3 (1986) 55-73.
PETTERSSON, H.B.L., HALLSTADIUS, L., HEDVALL, R., HOLM, E., Radioecology in the vicinity of prospected uranium mining sites in the subarctic environment, Journal of Environmental Radioactivity 6 (1988) 25-40.
PIETRZAK-FILS, Z., SKOWRONSKA-SMOLAK, M., Transfer of 210Pb and 210Po to plants via root system and above-ground interception, The Science of the Total Environment 162 (1995) 139-147.
POKARZHENVSKII, A.D., KRIVOLUTZKII, D.A., Background concentrations of 226Ra in terrestrial animals, Biogeochemistry 39 (1997) 1-13.
POZOLOTINA, V.N., SOBAKIN, P.I., MOLCHANOVA, I.V., KARAVAEVA, E.N. AND MIKHAILOVSKAYA, L.N., Migration and Biological Effect on Natural Heavy Radionuclides on Plants, Russian Journal of Ecology 1 (2000) 17-23 (In Russian).
PULHANI, V.A., DAFAUTI, S., HEGDE, A.G., SHARMA, R.M., MISHRA, U.C., Uptake and distribution of natural radioactivity in wheat plants from soil, Journal of Environmental Radioactivity 79 (2005) 331-346.
RADHAKRISHNA, A.P., SOMASEKHARAPPA, H.M., NARAYANA, Y., SIDDAPPA, K., Distribution of some natural and artificial radionuclides in Mangalore Environment of South India. Journal of Environmental Radioactivity 30(1) (1996) 31-54.
Radioecology of irrigation farming (ALEXAKHIN R.M. Ed.,) Energoatomizdat, Moscow (1985) (In Russian).
RAMASWAMI, A., CARR, P., BURKHARDT, M., Plant-uptake of uranium: Hydroponic and soil system studies, International Journal of Phytoremediation 3(2) (2001) 189-201.
ROMANOV, G.N., Mitigation of consequences of radiation accidents, Energoatomizdat, Moscow: (1993) (In Russian).
RUFYIKIRI, G., HUYSMANS, L., WANNIJN, J., VAN HEES, M., LEYVAL, C., JAKOBSEN, I., Arbuscular mycorrhizal fungi can decrease the uptake of uranium by subterranean clover grown at high levels of uranium in soil, Environmental Pollution 130 (2004) 427-436.
RUMBLE, M.A., BJUGSTAD, A.J., Uranium and radium concentrations in plants growing on uranium mill tailings in South Dakota, Reclamation and Revegetation Research 4 (1986) 271-277.
SAM, A.K., ERIKSSON, A., Radium-226 uptake by vegetation grown in Western Sudan. Journal of Environmental Radioactivity, 29(1) (1995) 27-38.
SARIC, M.R., STOJANOVIC, M., BABIC, M., Uranium in plant species grown on natural barren soil, Journal of Plant Nutrition 18 (7) (1995) 1509-1518.
SCHRECKHISE, R.G., CLINE, J.F., Uptake and distribution of 238U in peas and barley, Health Physics 38 (1980) 341-343.
SHAHANDEH, H., HOSSNER, L.R., Role of soil properties in phytoaccumulations of uranium, Water. Air and Soil Pollution, 141, (2002) 165-180.
SHAWKY, S., IBRAHIM, N., FAROUK, A., GHODS, A., Laser fluorimetric determination of uranium in environmental samples from Nile Delta and adjacent regions, Applied Radiation and Isotopes 45(11) (1994) 1079-1084.
SHEARD, J.W., Distribution of uranium series radionuclides in upland vegetation of northern Saskatchewan. I. Plant and soil concentrations, Canadian Journal of Botany 64(11) (1985) 2446-2452.
191
SHEPPARD, S.C., EVENDEN, W.G., The assumption of linearity in soil and plant transfer factors: An experimental evaluation, Journal of Environmental Radioactivity 7 (1988) 221-247.
SHEPPARD, S.C., EVENDEN, W.G., Bioavailability indices for uranium: effect of concentration in eleven soils, Archives of Environmental Contamination and Toxicology 23 (1992) 117-124.
SHEPPARD, M. I., VANDERGRAAF, T.T., THIBAULT, D.H., KEITH REID J. A., Technetium and uranium: sorption by and plant uptake from peat and sand, Health Physics 44(6) (1983) 635-643.
SHEPPARD, M. I., THIBAULT, D.H., SHEPPARD, S.C., Concentrations and transfer factors of U, As and Co in Scots Pine grown in a waste-site soil and an experimentally contaminated soil, Water, Air and Soil Pollution 26 (1985) 85-94.
SHEPPARD, S.C., EVENDEN, W.G., POLLOCK, R.J., Uptake of natural radionuclides by field and garden crops, Canadian Journal of Soil Sciences 69 (1989) 751-767.
SIMON, S.L., FRALEY, L., Uptake by Sagebrush of uranium progeny injected in situ, Journal of Environmental Quality 15 (1986) 345-350.
SINGH, K.P., Uranium uptake by plants Research communications, Current Science 73(6) (1997) 532-535.
SINGH, S., MALHOTRA, R., KUMAR, J., SINGH, B., SINGH, L., Uranium analysis of geological samples, water and plants from Kulu Area, Himachal Pradesh, India, Radiation Measurements 34 (2001) 427-431.
TEIXEIRA, V.S., FRANCA, E.P., “Root uptake of exogenous Ra-226 by three edible vegetables grown in farm soils from the vicinity of the first Brazilian uranium mine and mill”, Chemicals in the Environment. (LESTER, J.N., PERRY, R. Eds.) Selper Ltd., London, UK. (1986) 830-836.
TRACY, B.L., PRANTL, F.A., QUINN, J.M., Transfer of 226Ra, 210Pb and uranium from soil to garden produce: assessment of risk, Health Physics 44(5) (1983) 469-477.
TSUKURA, H., NAKAMURA, Y., Transfer of 31 elements in several agricultural plants collected from 150 farm fields in Aomori, Japan, Journal of Radioanalytical and Nuclear Chemistry 236(1-2) (1998) 123-131.
TYLER, G., OLSSON, T., Plant uptake of major and minor mineral elements as by soil acidity and liming, Plant and Soil 230 (2001) 307-321.
UCHIDA, S., TAGAMIN, K., HIRAE, I., KOMAMURA, M., Transfer factors of radionuclides and stable elements from soil to rice and wheat, Radioprotection 40(1) (2005) 129-134.
VAN NETTEN, C., MORLEY, D.R., Differential uptake of U, Mo and Cu, by roots, stalks and seeds. of oats grown on uranium rich soils, International Journal of Environmental Studies 19 (1982) 259-262.
VANDENHOVE, H., SWEECK, L., MALLANTS, D., VANMARCKE, H., AITKULOV, A., SADYROV, O., SAVOSIN, M., TOLONGUTOV, B., MIRZACHEV, M., CLERC, J.J. QUARCH, H., AITALIEV, A., Assessment of radiation exposure in the uranium mining and milling area of Mailuu Suu, Kyrgyzstan, Journal of Environmental Radioactivity 88 (2006) 118-139.
VANDENHOVE, H., VAN HEES, M., VAN WINCKEL, S., Feasibility of phytoextraction to clean up low-level uranium-contaminated soil, International Journal of Phytoremediation 3(3), (2001) 301-320.
VANDENHOVE, H., QUARCH, H., CLERC J.J., LEJEUNE, J.M., SWEECK, L., SILLEN, X., MALLANTS, D., ZEEVAERT, T.H., Final report in frame of EC-TACIS Project N°SCRE1/N°38, Final report in frame of EC-TACIS Project N° SCRE1/N°38 Remediation of Uranium Mining and Milling Tailing in Mailuu Suu District Kyrgyzstan, Contract Report, SCK•CEN, Mol Belgium, R-3721, (2003) 421.
VANDENHOVE, H., EYCKMANS, T., VAN HEES, M., Can barium and strontium be used as tracers for radium in soil–plant transfer studies, Journal of Environmental Radioactivity 81 (2005) 255-267.
192
VANDENHOVE, H., VAN HEES, M., WANNIJN, J., WOUTERS, K., WANG, L. Can we predict uranium bioavailability based on soil parameters? Part 2: Soil solution uranium concentration not a good bioavailability index, Environmental Pollution 145(2) (2007) 577-586.
VANDENHOVE, H., ANTUNES, K., WANNIJN, J., DUQUÈNE, L., VAN HEES, M., Method of diffusive gradients in thin films (DGT) compared with other soil testing methods to predict uranium phytoavailability, Science of The Total Environment 373(2-3) (2007) 542-555.
VANDENHOVE, H., VAN HEES, M., Can we predict radium bioavailability based on soil parameters, In preparation (2007).
VASCONCELLOS, L.M.H., AMARAL, E.C.S., VIANNA, M.E., Uptake of 226Ra and 210Pb by food crops cultivated in a region of high natural radioactivity in Brazil, Journal of Environmental Radioactivity 5 (1987) 287-302.
VASCONCELLOS, L.M.H., Levantamento dos Teores de Ra-226 e Pb-210 em Alimentos Cultivados no Planalto de Poços de Caldas, Tese de Mestrado, Instituto de Biociências, UERJ, (1984) 88.
TOMÉ V.F., RODRÍGUEZ, B.P., LOZANO, J.C., Distribution and mobilization of U, Th and 226Ra in the plant–soil compartments of a mineralized uranium area in south-west Spain, Journal of Environmental Radioactivity 59 (2002) 41-61.
TOMÉ V.F., RODRÍGUEZ, B.P., LOZANO, J.C. Soil-to-plant transfer factors for natural radionuclides and stable elements in a Mediterranean area, Journal of Environmental Radioactivity 65(2) (2003) 161-175.
VLASOV, O.K., SIROTKIN, A.N., RATNIKOV, A.N., BELOLIPETSKAYA, V.I., ZHIGAREVA, T.L., Regional coefficients of radionuclides transition in to agricultural products of the Altai region for nuclear explosion on august 7, 1962 at the Semipalatinsk test site. Vestnik of the "Semipalatinsk test site–Аltai" project 4 (1994) 64-72.
WHICKER, F.W., HINTON, T.G., ORLANDINI, K.A., CLARK, S.B., Uptake of natural and anthropogenic actinides in vegetable crops grown on a contaminated lake bed, Environmental Radioactivity 45 (1999) 1-12.
WHITEHEAD, N.E., BROOKS, R.R., COOTE, G.E., Gamma radiation of some plants and soils from an uraniferous area in New Zealand, New Zealand Journal of Science 14 (1970) 66-76.
WICHTEREY, K., SAWALLISCH, S., Radiological investigation of a uranium mining heap used for horticultural purposes, Kerntechnik 65(4) (2000)176-182.
YAMAMOTO, T., MASUDA, K., Studies on environmental contamination by uranium: 4. Uranium absorption by Chinese cabbage, Journal of Radiation Research 15 (1974) 1-6.
YAPRAK, G., CAM, N.F., YENER, G., Determination of uranium in plants from high background area by instrumental neutron activation analysis, Journal of Radiological and Nuclear Chemistry 238(1-2) (1998) 167-173.
YOSHIDA, S., MURAMATSU, Y., TAGAMI, K., UCHIDA, S., BAN-NAI, T., YONEHARA, H., SAHOO S., Concentration of uranium and 235U/238U ratios in soil and plant samples collected around the uranium conversion building in the JCO campus, Journal of Environmental Radioactivity 50 (2000) 161-172.
YUDINTSEVA E.V., LEVINA E.M., KOZHEMYAKINA T.A., Behaviour of 137Cs, 106Ru, 147Pm, 144Ce in the soil-plant system, Agrohimiya 12 (1979) 104-111 (In Russian).
YUNOKI, E., KATAOKA, T., MICHIRO, K., SUGIYAMA, H., SHIMIZU, M., MORI, T., Activity concentrations of 238U and 226Ra in agricultural samples, Journal of Radioanalytical and Nuclear Chemistry 174(2) (1993) 223-228.
ZARARZIS, S., KIRMAZ, R., ONERTOY, S., ARIKAN, P. (1997) A case study on uptake of thorium from soil to plant by using X-ray fluorescence spectrometry, Journal of Radioanalytical and Nuclear Chemistry 221(1-2) 173-177.
Artificial radionuclides
ABDULAEV M.A., ALIEV J.A., Migration of man-made and natural radionuclides in the soil-plant system. Eds Abdulaev M.A. Baku – ELM Publisher (1998) (In Russian).

193
ABSALOM J.P., YOUNG S.D., CROUT N.M.J., NISBET A.F., WOODMAN R.F.M., SMOLDERS E., GILLETT, A.G., Predicting Soil to Plant Transfer of Radiocesium Using Soil Characteristics, Environmental Science and Technology 33(8) (1999) 1218–1223.
AGEYETS, V.Yu, A system of radioecological countermeasures in the agrosphere of Belarus, Minsk, Propelei (2001) 249 pp. (In Russian).
ALBERS B.P., RACKWITZ R., SCHIMMACK W., BUNZL K., Transect survey of radiocesium in soils and plants of two alpine pastures, The Science of The Total Environment 216(1-2) (1998) 159-172.
ALBERS B.P., STEIND H., SCHIMMACK W., BUNZL K., Soil-to-plant and plant-to-cow’s milk transfer of radiocaesium in alpine pastures: significance of seasonal variability, Chemosphere 41(5), (2000) 717-723.
ALBRECHT A., SCHULTZE U., LIEDGENS M., FLЬHLER H., FROSSARD E., Incorporating soil structure and root distribution into plant uptake models for radionuclides: toward a more physically based transfer mode, Journal of Environmental Radioactivity 59(3) (2002) 329-350.
ALEXAKHIN R.M. Countermeasures in agricultural production as an effective means of mitigating the radiological consequences of the Chernobyl accident, The Science of the Total Environment 137 (1993) 9-20.
Radioecology of irrigation farming (ALEXAKHIN, R.M., BUFATIN, O.I., MALIKOV, V.G., Eds) Energoatomizdat, Moscow (1985) (In Russian).
General regularities of 90Sr and 137Cs migration in the soil-plant cover of Azerbaijan. (ALIEV, D.A., ABDULAEV, M.A., ALEXAKHIN, R.M., Eds.) Preprint Inst. Atominform Moscow (1988) (In Russian).
ALIEV, D.A., ABDULAEV, M.A., Strontium-90 and caesium-137 in the soil-plant cover of Azerbaijan, Nayka М.oscow (1983) 101 pp. (In Russian)
ALIEV, D.A., ABDULAEV, M.A., TAGIEV, A.T., “Distribution of 90Sr and 137Cs in soils of Azerbaijan and their uptake by plants” Proc. Conf. Agricultural Radiology, Moscow (1998) (In Russian).
ALIPBEKOV, O.A., Effects of plant species and fertilizers on promethium-147 uptake by farm crops, Agrohimiya 9 (1991) 83-85 (In Russian).
ALIPBEKOV, O.A., Estimation of possible levels of 117Pr accumulation by spring wheat from different soils, Agrohimiya 7 (1991) 17-82 (In Russian).
ALIPBEKOV, O.A., ZHUKOV, B.I., On 147Pm in the soil-plant system, Agrohimiya 12 (1988) 91-95 (In Russian).
ANANYAN, V.L., AVETISYAN, A.S.H., Uptake of calcium, magnesium and radiostrontium by wheat depending on their content in the soils of Armenia, Agrohimiya 10 (1975) 121-128 (In Russian).
Agrochemical studies of man-made radionuclides in the Armenian SSR, (ANANYAN, V.L. Ed), Academic Sciences, Armenia (1983) (In Russian).
ANANYAN, V.L., SARKISYAN, G.A., Peculiarities of 90Sr, Ca, Mg, K, Na accumulation by heranium plants grown on soil and hydroponics, Ecologiya 4 (1981) 88-90 (In Russian).
ANISIMOV, V.S., ANISIMOVA, L.N., LOMONOSOVA, N.V., ALEKSAKHIN, R.M, FRIGIDOVA, L.M., KRUGLOV, S.V., BIKOVA, T.A., Effect of Loamy Soddy-podzolic Soil Acidity on the Mobility and Bioavailability of Radionuclides 60Со and 137Cs and Trace Elements Co, Cu, Zn, Mn, and Fe, Agrohimiya 7 (2005) 51-58 (In Russian).
ANISIMOVA, L.N., ANISIMOV, V.S., FRIGIDOVA, L.M., KROUGLOV, S.V., LOMONOSOVA, N.V., ALEXAKHIN, R.M., ASTAKHOV, E.YU., “Effects of acidulation of soddy-podzolic loam soil on 137Cs, Mn, Fe, Co mobility and bioavailability in conditions of a model experiment” Production of safe plant and animal products, Proc. Practical Conf., Bryansk (2004) 53-56 (In Russian).
Farming in regions of radioactive contamination (radionuclides in food products), (ANNENKOV B.N. AVERIN, V.S., Ed.) Minsk, Propilei (2003) (In Russian).
194
ANTONOPOULOS-DOMIS, M.,CLOUVAS, A., GAGIANAS, A., Derivation of soil to plant transfer factors of radiocesium in Northern Greece after the Chernobyl accident, and comparison with greenhouse experiments, Environmental Pollution 68(1-2) (1990) 119-128.
ARKHIPOV, A.N., Behaviour of 90Sr and 137Cs in agroecosystems of the restriction zone of the Chernobyl NPP, Candidate thesis, Obninsk (1995) (In Russian).
ARKHIPOV, N.P, FYODOROV, YE.A, ALEXAKHIN, R.M., BONDAR, P.F., KOZHEVNIKOVA, T.L., SUSLOVA, V.V., Soil chemistry andaccumulation by roots of artificial radionuclides in crop yields. Pochvovedenie 11 (1975) 40-52 (In Russian).
ARKHIPOV, N.P., FEVRALYOVA, L.T., MOLCHANOVA, I.V., MIKHAILOVSKAYA, L.N., MARTYUSHOV, V.V., BAZYLEV, V.V., Behavior of natural radionuclides in the soil-irrigating water system. In Proseedings “Radioecological studies in the NPP zone”, Zarechny, Beloyarsk NPP. Urals Research Center (1986) 33-41 (In Russian)..
ARKHIPOV, N.P., FYODOROV, E.A., ALEXAKHIN, R.M., BONDAR, P.F., KOZHEVNIKOVA, T.L., SUSLOVA, V.V., Soil chemistry and root uptake of artificial radionuclides in the yield of farm crops, Pochvovedenie 11 (1975) 40-50 (In Russian).
ASKBRANT, S., SANDALLS, J., Root uptake of 137Cs and 90Sr by rye-grass on various soils in the CIS, Journal of Environmental Radioactivity 38(1) (1998) 85-95.
BAES, C.F., SHAR, R.D., SJOREEN, A.L., SHOR, R.W., A review and analysis of parameters for assessing the transport of environmentally released radionuclide through agriculture. Oak Ridge, TN: Office of Scientific and Technical Information; ORNL-5786 (1984).
BAEZA, A., PANIAGUA, J.M., RUFO, M., STERLING, A., BARANDICA, J., Radiocaesium and radiostrontium uptake by turnips and broad beans via leaf and root absorption, Applied Radiation and Isotopes 50 (1999) 467-474.
BAKUNOV, N.A., Effects of soil properties and soil-forming metals on 137Cs uptake by plants, Candidate thesis, Moscow (1967) (In Russian).
BAKUNOV, N.A., On 137Cs accumulation in plants and specific features in its behaviour in soils, Agrohimiya 5 (1989) 194-199 (In Russian).
BAKUNOV, N.A., The role of allumosilicate minerals in 137Cs absorption by plants from soils, Pochvovedeniye 6 (2005) 715-723 (In Russian).
BAKUNOV N.A., YUDINTSEVA, E.V., On 137Cs accumulation decrease in plants when soils are enriched with natural sorbents, Agrohimiya 6 (1989) 90-96 (In Russian).
BAN-NAI, T., MURAMATSU, Y., YANAGISAW, K., Transfer of some selected radionuclides (Cs, Sr, Mn, Co, Zn and Ce) from soil to root vegetables, Journal of Radioanalytical and Nuclear Chemistry 241(3) (1998) 529-531.
BELL, J.N.B., SHAW, G., Ecological lessons from the Chernobyl accident, Environment International 31(6) (2005) 771-777.
BELLI, M., SANSONE, U., ARDIANI, R., FEOLI, E., SCIMONE, M., MENEGON, S., PARENTE G., The effect of fertilizer applications on 137Cs uptake by different plant species and vegetation types, Journal of Environmental Radioactivity 27(1) (1995) 75-89.
BELOUS, N.M., Reproduction of fertility and rehabilitation of contaminated soddy-podzolic soils of the south-west of Russia, Doctor thesis, Moscow (2000).
BELOUS, N.M., MOISEYENKO, F.V., SANZHAROVA, N.I., “Effectiveness of agrochemical measures for reducing 137Cs in the yield of farm crops in the Bryansk”, Proceeding Sci. Session of Rosselkhozakademiya, Moscow, (2003) 165-183 (In Russian).
BERESFORD, N.A., HOWARD, B.J., BARNETT, C.L., The uptake by vegetation of Chernobyl and aged radiocaesium in upland West Cumbria, 16(2) (1992) 181-195.
BERESNEV B.G., BELOUS N.M., KIRIKOI YA. T., POVTAR A.G., Potato fertilizing in conditions of radioactive contamination of soddy-podzolic sandy soil, Agrohimiya 3 (1993) 49-60 (In Russian).

195
BILO, M., STEFFENS, W., FÜHR F. Uptake of 134/137Cs in soil by cereals as a function of several soil parameters of three soil types in upper Swabia and North Rhine-Westphalia (FRG), Journal of Environmental Radioactivity 19(1) (1993) 25-39.
BOGDEVICH, I.M., AGEYETS, V.Y.U., SMEYAN, N.I., SHMIGELSKAYA. I.D., VASILYUK, G.V., KLEBANOVICH, N.V., KASIANCHIK, S.A., CHERNYSH, A.F., MIKHAILOVSKAYA, N.A., MOROZ, G.V., RAK, M.V., KOVALEVICH, Z.V., PUTYATIN, YU.V., SERAYA, T.M., GOLOVATYI, S.E., SHIBUT, L.I., SAMUSIK, I.D., Guidebook on agricultural production in conditions of radioactive contamination of lands in Belarus for 1977-2000. Belorussian Institute of Soil Science and Agrochemistry, Minsk (1977) (In Russian).
BONDAR, P.F., On the mechanism of 90Sr uptake by potato tubers, Agrohimiya 2 (1985) 91-96 (In Russian).
BONDAR, P.F., LOSHCHILOV, N.A., TERESHCHENKO, N.P., MASLOV, A.V., 137Cs uptake by the yield of farm crops on soddy-podzolic sandy loam soil, Agrohimiya 5 (1994) 74-79 (In Russian).
BONDAR, P.F., YUDINTSEVA, E.V., Estimation of the effects of some soil properties on 137Cs uptake by plants and prediction of its accumulation in the oat yield, Agrohimiya 9 (1984) 85-93 (In Russian).
BOVARD, P., GRAUBY, A., SASS, A., “Chelating effects of organic matter and its influence on the migration of fission products”: Isotopes and Radiation in Soil Organic –matter Studies, Proc. of Symposium, CONF-680725, STI/PUB-190 (CONF-680725), NSA, IAEA, Vienna (1968) 471-495.
BOULARBAH, A., SCHWARTZ, C., BITTON, G., ABOUDRAR, W., OUHAMMOU, A., MOREL, J.L., Heavy metal contamination from mining sites in south Morocco: 2. Assessment of metal accumulation and toxicity in plants, Chemosphere 63(5) (2006) 811-817.
BRAMBILLA, M., FORTUNATI, P., CARINI, F., Foliar and root uptake of 134Cs, 85Sr and 65Zn in processing tomato plants (Lycopersicon esculentum Mill.), Journal of Environmental Radioactivity 60(3) (2002) 351-363.
BRUDKEVICH, T.A., ZABOLOTNY, A.I., KUDRYASHOV, V.P., Estimation of 242Am and 137Cs biomobility in agrocenoses of legume and cereal crops under the action of mineral fertilizers and epibrassinolide, Agrohimiya 10 (2005) 71-81 (In Russian).
BUNZL, K., KRACKE, W., Soil to plant transfer of 239+240Pu, 238Pu, 241Am, 137Cs and 90Sr from global fallout in flour and bran, Science of the Total Environment 63 (1987) 111-124.
BUNZL, K., KRACKE, W., Seasonal Variation of Soil-to-plant Transfer of K and Fallout 134,137Cs in Peatland Vegetation 57(4) (1989) 593-600.
BUNZL, K., ALBERS, B.P., SHIMMACK, W., RISSANEN, K., SUOMELA, M., PUHAKAINEN, M., RAHOLA, T., STEINNES, E., Soil to plant uptake of fallout 137Cs by plants from boreal areas polluted by industrial emissions from smelters, The Science of The Total Environment 234(1-3) (1999) 213-221.
BURNAZYAN, A.I., Results of the study and experience in liquidating consequences of an accidental contamination of the territory by uranium fission products, Moscow, Energoatomizdat (1990) (In Russian).
BUTNIK, A.S., MIKULIN, R.G., RASTOPCHINA, V.A., Effects of mineral fertilizers on radiocesium accumulation in the yield of crops, Agrohimiya 12 (1977) 95-98 (In Russian).
CATALDO, D.A., GARLAND, T.R., WILDUNG, R.E., Nikel in Plant : II. Distribution and chemical forms in soybean plants, Plant Physiology 62 (1978) 566-570.
CATALDO, D.A., WILDUNG, R.E., GARLAND, T.R., Root absorption and transport behaviour of technetium in Soybean, Plant Physiology 73 (1983) 849-852.
CATALDO, D.A., GARLAND, T.R., WILDUNG, R.E, Absorption, distribution and chemical forms of Np in plants, Journal of Agricultural and Food Chemistry 36 (1988) 657-662.
CHOI, Y.H., JO, J.S., Uptake and Accumulation of Soil Strontium-90 by Peanut and Sesame, Korean Journal of Environmental Agriculture 15(1) (1996) 11-19.

196
CHOI, Y.H., CHUNG, K.H., CHUN, K.J., KIM, S. R., LEE, J.H., Sr-90 Uptake by the Barley (Hordeum yulgare L. emend. Lamark) and Soil-to-Plant Transfer Coefficient, Journal of the Korean Association for Radiation Protection 16(1) (1991) 33-42.
CHOI, Y.H., KIM, K.C., LEE, C.W., LE, K.S., LEE, J.H., PAK, C.K., CHO, Y.W., Soil-to-Plant Transfer Coefficients of Mn-54, Co-60, Zn-65 and Cs-137 for Rice, Soybean and Vegetalbles, Journal of the Korean Association for Radiation Protection 16(2) (1991) 55-64 (In Korean)
CHOI, Y.H., KIM, K.CH., LEE, CH. W., LEE, K.S., LEE, J. H., PAK, C.K., CHO, Y. W., Soil-to-Plant Transfer Coefficients of Mn-54, Co-60, Zn-65 and Cs-137 for Rice, Soybean and Vegetalbles, Journal of the Korean Association for Radiation Protection 16 (1991) 55-65 (In Korean)
CHOI, Y.H., LEE, C.W., LEE, K.S., LEE, J.H., JO J.S,. CHUNG, K. H., Absorption and Accumulation of Sr-90 by Rice and Soybean and Its Soil-to-Plant Transfer Coefficients, Journal of the Korean Nuclear Society 24(2) (1992) 121-129 (In Korean)
CHOI, Y.H., LIM, K.M., LEE, M.H., CHOI, G.S., CHUNG, K.H., Soil-to-Plant Transfer Factors of 137Cs in Paddy and Upland Fields of Korea. Korean Journal of Environmental Agriculture 18(2) (1999) 164-168 (In Korean).
CIUFFO, L., VELASCO, H., BELLI, M., SANSONE, U., 137Cs Soil-to-plant Transfer for Individual Species in a Semi-natural Grassland. Influence of Potassium, Journal of Radiation Research 44(3) (2003) 277-283.
CLINE, J.F., Aging Effects of the Availability of Strontium and Caesium to Plants, Health Physics 23 (1981) 317-324.
CLINE, J.F., KLEPPER, E.L., Iodine-125 Accumulation in Plant Parts: Influence of Water Use rate and Stable Iodine Content of Soil, Health Physics 28 (1975) 801-804.
COMAR, C.L., WASSERMAN, NOLD M.M., Strontium-calcium Discrimination Factors in the Rat. Proc. Soc. Exp. Biol. Med. 92 (1956) 859.
COPPLESTONE, D., JOHNSON, M.S., JONES, S.R., TOAL, M.E., JACKSON, D., Radionuclide behaviour and transport in a coniferous woodland ecosystem: vegetation, invertebrates and wood mice, Apodemus sylvaticus, Science of the Total Environment 239 (1999) 95-109.
DANILCHENKO, A.V., DERGUNOV, I.D., Effects of mineral fertilizing on strontium-90 accumulation in the yield of rice and ambary, Аgrohimiya 1 (1977) 131-135 (In Russian).
DEITERMANN, W.-I., HAUSCHILD, J., ROBENS-PALAVINSKAS, E., AUMANN, D.C., Soil-to-vegetation transfer of natural 127I, and of 129I from global fallout, as revealed by field measurements on permanent pastures, Journal of Environmental Radioactivity 10(1) (1989) 79-88.
DENYS, S., ECHEVARRIA, G., LECLERC-CASSAC, E., MASSOURA, S., MOREL, J.-L., Assessment of plant uptake of radioactive nickel from soils, Journal of Environmental Radioactivity 62 (2002) 195-205.
DERGUNOV, I.D., DANILCHENKO, A.V., 90Sr and 137Cs accumulation in the yield of crops cultivated in Uzbekistan, Agrohimiya 11 (1976) 101-107 (In Russian).
DJINGOVA, R., KOVACHEVA, P., TODOROV, B., ZLATEVA, B., KULEFF, I., On the influence of soil properties on the transfer of 137Cs from two soils (Chromic Luvisol and Eutric Fluvisol) to wheat and cabbage, Journal of Environmental Radioactivity 82(1) (2005) 63-79.
DOLIN, V.V., BONDARENKO, G.M., ORLOV, O.O., Environmental self-clearing after the Chernobyl catastrophe (SOBOTOVYCH, E.V. Ed.) Kiev (2004) (In Russian).
DRICHKO, V.P., LISACHENKO, E.P., MIKHAILOVA, O.A., PONIKAROVA, T.M., POPOV, D.K. Transfer of some radionuclides from soil to plants. State Committee on Atomic Energy Use (1976) (In Russian).
DUBOVAYA, V.G., Analysis of factors responsible for the contamination levels of farm products and justification of countermeasures in the long term after the Chernobyl accident (exemplified by the contaminated districts of the Kaluga region) Candidate thesis, Obninsk (2001) (In Russian).
197
ECHEVARRIA, G., VONG, P.C., LECLERC-CESSAC, E., MOREL, J.L., Bioavailability of technetium-99 as affected by plant species and growth, application form, and soil incubation, Journal of Environmental Quality 26(4) (1997) 947-956.
ECHEVARRIA, G., MOREL, J.L., LECLERC-CESSAC, E., Retention and phytoavailability of radioniobium in soils, Journal of Environmental Radioactivity 78(3) (2005) 343-352.
EGOROV, A.V., ILJIN, V.G., KROUGLOV, V.T., PESKOV, P.G., PANCHENKO, I.Y.A., YUDINTSEVA, E.V., TSELISHCHEV, C.P., Recommendations on the assessment of the impact of radioactive contamination of agricultural lands, radiation damage to animals and farming in these conditions (Povalyaev, A.P. Ed) Moscow, ‘Kolos’ (1973) (In Russian).
Environmental Radioactivity Special Topic Steering Committee. Radiocaesium in natural systems — A UK coordinated study, Journal of Environmental Radioactivity 18(2) (1993) 133-149.
Environmental Research on Actinide Elements, (PINDER, J.E., III, ALBERTS, J.J., McLEOD, K.W., SCHRECKHISE, R.G., Eds) CONF-841142 (DE86006713) U.S. DOE OHER Symposium Series 59. (1987).
EVANS, E.J., DEKKER, A.J., Plant uptake of 137Cs from nine Canadian soils, Canadian Journal of Soil Sciences 46 (1966) 167-176.
EVANS, E.J., DEKKER, A.J., The fixation and plant recovery of 137Cs, Soil Science 107(3) (1969) 175-180.
EWERS, L.W., HAM, G.J., WILKINS, B.T. Review of the Transfer of Naturally Occurring Radionuclides to Terrestrial Plants and Domestic Animals, NRPB-W49, Chilton, Didcot, UK (2003).
FESENKO, S.V., Agricultural and forest ecosystems: radioecological consequences and effectiveness of countermeasures during radioactive contamination, Doctor of Sceince thesis, Obninsk (1997) (In Russian).
FESENKO, S.V., SANZHAROVA, N.I., SPIRIDONOV, S.I., Analysis of factors responsible for 137Cs availability in soils of forest ecosystems, Radiation Biology, Radioecology 42 (2002) 448-456 (In Russian).
FESENKO, S.V., SPIRIDONOV, S.I., SANZHAROVA, N.I., ALEXAKHIN, R.M., Dynamics of 137Cs bioavailability in a soil-plant system in areas of the Chernobyl Nuclear Power Plant accident zone with a different physico-chemical composition of radioactive fallout, Journal of Environmental Radioactivity 34(3) (1997) 287-313.
FILIPAS, A.S., Agrocenoses in conditions of radioactive contamination: status and radiobiological consequences, Doctor of Sceince thesis (2003) (In Russian).
FILIPAS, N.A., YUDINTSEVA, E.V., RATNIKOV, A.N., “Uptake of some elements of neutron activation by farm crops from the major soils of the Nonchernozemic area” Radioecological studies in the ChNPP zone, Sverdlovsk, Urals Branch Academic Science (1988) (In Russian).
FIRSAKOVA, S.K., TIMOFEYEV, S.F., SHUMILIN, V.A., TIMOFEYEV, A.S., PODOLYAK, A.G., 90Sr accumulation by field crops during radioactive contamination of agricultural lands. Radiation Biology, Radioecology 42(3) (2002) 345-351 (In Russian).
FRISSEL, M. J, DEB, D.L., FATHONY, M., LIN, Y.M., MOLLAH, A.S., NGO, N.T., OTHMAN, I., ROBISON, W.L., SKARLOU-ALEXIOU, V., TOPCUOLU, S., TWINING, J.R., UCHIDA, S., WASSERMAN, M.A., Generic values for soil-to-plant transfer factors of radiocaesium, Journal of Environmental Radioactivity 58(2-3) (2002) 113-128.
FUHRMANN, M., LASAT, M., EBBS, S., CORNISH, J., KOCHIAN, L., Uptake and Release of Cesium-137 by Five Plant Species as Influenced by Soil Amendments in Field Experiments, Journal of Environmental Quality 32 (2003) 2272-2279.
FUHRMANN, M., LASAT, M.M., EBBS, S.D., KOCHIAN, L.V., CORNISH, J., Uptake of Cesium-137 and Strontium-90 from Contaminated Soil by Three Plant Species. Application to Phytoremediation, Journal of Environmental Quality 31 (2002) 904-909.

198
FUHRMANN, M., LASAT, M.M., EBBS, S.D., KOCHIAN, L.V., CORNISH, J., Uptake of caesium-137 and strontium-90 from contaminated soil by three plant species: application to phytoremediation, Journal of Environmental Quality 31 (2002) 904-909.
FYODOROV, E.A., BAKUROV, A.S., FYODOROVA, M.N., RASULEV, M.F., Plutonium behaviour in soil and plant uptake, Agrohimiya 12 (1986) 83-88 (In Russian).
GARLAND, T.R., CATALDO, D.A., McFADDEN, K.M., SCHRECKHISE, R.G., WILDUNG, R.E., Comparative Behaviour of 99Tc, 129I, 127I and 137Cs in the Environment Adjacent to a Fuels Reprocessing facility, Health Physics 44 (1983) 658-662.
GARTEN, C.T., HOFFMAN, F.J., BONDIETTI, E.A., Field and greenhouse experiments on the fate of technetium in plants and soil, Health Physics 46 (1984) 647-656.
GASTBERGER M., STEINHÄUSLER, F., GERZABEK, M.H., LETTNER, H., HUBMER, A., Soil-to-plant transfer of fallout caesium and strontium in Austrian lowland and Alpine pastures, Journal of Environmental Radioactivity 49(2) (2000) 217-233.
GERZABEK M.H., MOHAMAD S.A., MÜCK K., Horak, O., 60Co, 63Ni and 94Nb soil-to-plant transfer in pot experiments, Journal of Environmental Radioactivity 25(3), (1994) 205-212.
GIGLIOTTI, G., BUSINELLI, D., GIUSQUIANI, P.L., Trace metals uptake and distribution in corn plants grown on a 6-year urban waste compost amended soil, Agriculture, Ecosystems and Environment 58(2-3) (1996) 199-206.
GORINA, L.I., Radiocaesium accumulation by farm crops as a function of soil properties and biological peculiarities of plants, Candidate thesis, Moscow (1976)
GREBENSHCHIKOVA, N.V., FIRSAKOVA, S.K., NOVIK, A.A., A study into the regularities of 137Cs behavior in the soil-plant cover of the Belorussian Polesyes after the Chernobyl accident, Agrohimiya 1 (1992) 91-99 (In Russian).
GREEN, N., POULTNEY, S., “Distribution of radionuclides in root vegetables–implications for dose assessments” Environmental Radiochemical Analysis, Proc. 8th Intern. Sympos. Blackpool, (1998) 374-381.
GREEN, N., WILKINS, В.Т., РОULTNEУ, S., Distribution of radionuclides in potato tubers: Implications for dose assessments, Journal of Radioanalytical and Nuclear Chemistry 226(1-2) (1997) 75-78.
GREEN, N., HAMMOND, D.J., WILKINS, B.T., A long-term study of the transfer of radionuclides from soil to fruit, Health Protection Agency, Center for Radiation, Chemical and Environmental Hazards, Oxfordshire, UK. HPA-RPD-006 (2005).
GRYTSYUK, N., ARAPIS, G., DAVYDCHUK, V., Root uptake of 137Cs by natural and semi-natural grasses as a function of texture and moisture of soils, Journal of Environmental Radioactivity 85(1) (2006) 48-58.
GULYAKIN, I.V., YUDINTSEVA, E.V., Plant uptake of fission products and their accumulation in yield when soil is added by lime, humus and potassium fertilisers, Izvestiya ТSHA, 2 (1957) 121-140 (In Russian).
GULYAKIN, I.V., YUDINTSEVA, E.V., 60Co uptake by plants and its accumulation in yield, Doklady USSR Academic Science 123(2) (1958) 368-370 (In Russian).
GULYAKIN, I.V., YUDINTSEVA, E.B., Radioactive fission products in soils and plants, M.: Gosatomizdat (1962) (In Russian).
GULYAKIN, I.V., YUDINTSEVA, E.V., ALPATOVA, A.N., Strontium-90 accumulation in some cereal crops and their accompanying weed plants, Doklady USSR Academic Science 149 (1969) 11-14 (In Russian).
GULYAKIN, I.V., YUDINTSEVA, E.V., DEMIN, V.A., Accumulation of strontium-90 and caesium-137 by vegetable crops yield, Agrohimiya 8 (1968) 101-109 (In Russian).
GULYAKIN, I.V., YUDINTSEVA, E.V., MAKAREVICH, K.I., Strontium-90 accumulation in wheat on various soils, Izvestiya ТSHA 2 (separate issue) (1971) 106-113 (In Russian).

199
GULYAKIN, I.V., YUDINTSEVA, E.V., MAKAREVICH, K.I., Uptake of strontium-90 by pea plants from soddy-podzolic soils, Agrohimiya 4 (1977) 101-106 (In Russian).
GULYAKIN, I. V.; YUDINTSEVA, E. V.; MAMONTOVA, L. A., Effect of phosphates, lime, and peat on the fixing of strontium-90 in soil and on its accumulation in oat crops Agrokhimiya 3, (1976) 111-118 (In Russian).
GULYAKIN, I.V., YUDINTSEVA, E.V., ZHIGAREVA, T.L., SIDOROVA, E.D., 90Sr uptake by plants dependent on the use of mineral fertilizers, Agrohimiya 4 (1978) 112-118 (In Russian).
HANDLEY, R., BABCOCK, K.L., Uptake and translocation of Sr by Zea mays, Radiation Botany 13(5) (1973)273-281.
INTERNATIONAL ATOMIC ENERGY AGENCY, Handbook of parameter values for the prediction of radionuclide transfer in temperate environments, Technical Report Series No.364, IAEA, Vienna (1994).
Transuranium elements in the environment, (HANSON Ed.) (translation from English) Moscow, Energoatomizdat (1985).
ILYIN, M.I., PEREPELYATNIKOV, G.P., PRISTER, B.S., Effects of radical improvement of natural meadows in the Ukrainian Poliesye on radiocaesium transfer from soil to grass stand, Agrohimiya 1 (1991) 101-105 (In Russian).
ILYIN, V.B, Assessment of Heavy Metal Mass Flux in the Soil-Crop System, Agrohimiya 3 (2006) 52-59 (In Russian).
INTERNATIONAL ATOMIC ENERGY AGENCY, The classification of soil systems on the basis of transfer factors of radionuclides from soil to reference plants, A FAO/IAEA/IUR Coordinated Research Programme, IAEA, Vienna (2006).
IOANNIDES, K.G., PAPACHRISTODOULOU, C.A., MERTZIMEKIS, T.J., TZIALLA, C.E., Effect of soil amendments on radiocaesium transfer to alfalfa, Health Physics 84(3) (2003) 637-641.
INTERNATIONAL UNION OF RADIOECOLOGY databank, Collection of about 3000 Cs and Sr transfer values, TF values were determined by a working group of the IUR between 1982 and 1992, Electronic copies available from IUR (1992).
INTERNATIONAL UNION OF RADIOECOLOGY, Working group soil to plant transfer. Protocol developed between 1982 and 1992. Contact address for protocol: e-mail [email protected]. Contact address for IUR secretariat e-mail: [email protected].
INTERNATIONAL UNION OF RADIOECOLOGY, The IUR databank contains soil to plant transfer factors (concentration ratios). They are available as Excel files. Contact address e-mail: [email protected].
IVANOV, Y.A., LEWYCKYJ, N., LEVCHUK, S.E., PRISTER, B.S., FIRSAKOVA, S.K., ARKHIPOV, N.P., ARKHIPOV, A.N., KRUGLOV, S.V., ALEXAKHIN, R.M., SANDALLS, J., ASKBRANT, S., Migration of 137Cs and 90Sr from Chernobyl fallout in Ukrainian, Belarussian and Russian soils, Journal of Environmental Radioactivity 35(1) (1997) 1-21.
IZRAEL, YU. A., SOKOLOVSKY, V.G., SOKOLOV, V.E., ALEXAKHIN, R.M., VETROV, V.A., DIBOBES, I.K., TRUSOV, A.G., RYABOV, I.N., POVALYAEV, A.P., BULDAKOV, L.A., BORZILOV, V.A., The environmental impact of radioactive contamination of natural environments in the region affected by the Chernobyl accident, Atomnaya Energiya 64(1) (1988) 28-40 (In Russian).
JONES, D.R., PAUL, L., MITCHELL, N.G., Effects of ameliorative measures on the radiocaesium transfer to upland vegetation in the UK, Journal of Environmental Radioactivity 44(1) (1999) 55-69.
Parameters on the radionuclide transfer in crop plans for Korean food chain dose assessment, Report, KAERI/TR-1993/2001 (2001).
KARAVAEVA, E.N., MOLCHANOV, I.V., The behaviour of radioactive and stable calcium isotopes in the soil-solution-plant system under various soil moisture, Ecologiya 2 (1976) 94-96 (In Russian).
KASHPAROV, V., COLLE, C., LEVCHUK, S., YOSCHENKO, V., SVYDYNUK, N., Transfer of chlorine from the environment to agricultural foodstuffs, Journal of Environmental Radioactivity 94 (2007) 1-15.

200
KASHPAROV, V., COLLE, C., LEVCHUK, S., YOSCHENKO, V., ZVARICH, S. Radiochlorine concentration ratios for agricultural plants in various soil conditions. Journal of Environmental Radioactivity 95(1) (2007) 10-22.
KASHPAROV, V., COLLE, C., ZVARICH, S., YOSCHENKO, V., LEVCHUK, S., LUNDIN, S., Soil-to-plant halogens transfer studies 1. Root uptake of radioiodine by plants, Journal of Environmental Radioactivity 79(2) (2005) 187-204.
KASHPAROV, V., COLLE, C., ZVARICH, S., YOSCHENKO, V., LEVCHUK, S., LUNDIN, S., Soil-to-plant halogens transfer studies 2. Root uptake of radiochlorine by plants, Journal of Environmental Radioactivity 79(3) (2005) 233-253.
KASHPAROV, V.A., LAZAREV, M.M., PEREPELYATNIKOVA, L.V., PRISTER, B.S., IVANOV, YU.A., IVANOVA, T.M., BONDAR, P.F., ROMANOV, L.M., PEREPELYATNIKOVA, G.P., Farming in the Chernobyl contaminated areas of the Ukraine for the period 1999-2002 (methodological recommendations), Ukrainian Inst. Agricult. Radiol. Kiev (1998) (In Russian).
KASHPAROV, V.A., OUGHTON, D.H., ZVARICH, S.I., PROTSAK, V.P., LEVCHUK, S.E., Kinetics of Fuel Particle Weathering and 90Sr Mobility In the Chernobyl 30-KM Exclusion Zone. Health Physics 76(3), (1999) 251-259.
KHOMICH, V.K., Study of the radioecological situation in Belarus in the conditions of intensive radioactive fallout. PhD thesis, Obninsk (1990) (In Russian).
KLECHKOVSKY, V.M., FYODOROV, YE.A., ROMANOV, G.N., PRISTER, B.S., ARKHIPOV, N.P., BUROV, N.I., ALEXAKHIN, R.M., TIKHOMIROV, F.A., DIBOBES, I.K., POVALYAEV, A.P., Recommendations on farming and forestry in radioactive contamination of the environment (1973) (In Russian).
KŁOS, R., ALBRECHT, A., The significance of agricultural vs. natural ecosystem pathways in temperate climates in assessments of long-term radiological impact, Journal of Environmental Radioactivity 83(2) (2005) 137-169.
KNATKO, V.A., AGEETS, V.U, SHMIGELSKAYA, I.V., IVASHKEVICH, I.I., Soil-to-potato transfer of 137Cs in an area of Belarus: regression analysis of the transfer factor against 137Cs deposition and soil characteristics, Journal of Environmental Radioactivity 48(2) (2000) 171-181.
KÖHLER, M., GLEISBERG, B., NIESE, S., Investigation of the soil–plant transfer of primordial radionuclides in tomatoes by low-level γ-ray spectrometry. Applied Radiation and Isotopes, 53(1-2) (2000) 203-208.
KONOPLYOVA, I.V., Dynamics of radiocaesium bioavailability in forest soils. PhD thesis, Obninsk (1999) (In Russian).
KORNEJEV, N.A., BUROV N.I., SIROTKIN, A.N., NIKOLAEVA, E.M., PANCHENKO, I.YD., Migration of 90Sr in the biological chain and possibilities of its reduction in the latter. The results of observations on cultivated plants and animals, Zhurnal Obshchei Biologii 31(6) (1970) 690-697 (In Russian).
KORNEJEV, N.A., KORNEJEVA, N.V., POPOVA, G.I., Strontium-90 accumulation in fodder crops with the radionuclide location in the arable and sub-arable layers of soil. Doklady VASHNIL, 2 (1976) 26-27 (In Russian).
KORNEJEV, N.A., NIKOLAEVA, E.M., OVECHKIN, I.L., SUSLOVA, V.V. 90Sr accumulation by plants in case of its different soil location. In: Reports on fodder production: Collected papers Моscow 2 (1970) 71-78 (In Russian).
KORNEJEV, V.A., SUSLOVA, V.V., Sr-90 transfer from soil to plants of a natural meadow and fodder crop rotation plants. Doklady VASHNIL 7 (1971) 12-13 (In Russian).
KORNEYEV, N.A., FIRSAKOVA, S.K., MALYSHEVA, M.D., Uptake of strontium-90 by meadow grasses from different soil types of the non-chernozemic zone, Pochvovedenie 11 (1975) 53-59 (In Russian).

201
KOROBOVA, E., ERMAKOV, A., LINNIK, V., 137Cs and 90Sr mobility in soils and transfer in soil–plant systems in the Novozybkov district affected by the Chernobyl accident, Applied Geochemistry 13(7) (1998) 803-814.
KOSTIAINEN, E., RANTAVAARA, A., Transfer of 137Cs and 90Sr from finnish soils to cereal grains. In: Proceeding Ecorad 2001. The radioecology-ecotoxilogy of continental and estuarine environments. France, 37 (C1), (2002) 509-514.
KOTIK ZH.., A comprehensive assessment of the influence of crop cultivation technologies on 137Cs accumulation in farm crops on leached and podzolozed chernozems. PhD thesis, Obninsk. (1996) (In Russian).
KROUGLOV, S.V., Physico-chemical aspects of agricultural land contamination as a result of a radiation accident and radionuclide migration in the soil-plant system (exemplified by the Chernobyl accident). Doctor osf Sceince thesis, Obninsk (1997) (In Russian).
KROUGLOV, S.V., FILIPAS, A.S., ALEXAKHIN, R.M., ARKHIPOV, N.P., Long-term study on the transfer of 137Cs and 90Sr from Chernobyl-contaminated soils to grain crops, Journal of Environmental Radioactivity, 34(3) (1997) 267-286 (In Russian).
KULIKOV N.V. AND MOLCHANOVA I.V. Continental radioecology (soil and fresh water ecosystems), Sverdlovsk, (1976) (In Russian).
KUZNETSOV V.K., MALIKOV V.G., PEREPELYATNIKOV G.P. Accumulation of some radionuclides by vegetable crops. Agrohimiya, 10 (1984) 110-113 (In Russian).
KUZNETSOV V.K., SANZHAROVA N.I., AKSYONOVA S.P., KOTIK ZH. A. Reduction in 137Cs accumulation in farm crops, Agrohimiya 4 (1995) 74-79 (In Russian).
KUZNETSOV V.K., SANZHAROVA N.I., ALEXAKHIN R.M., ANISIMOV V.S., ABRAMOVA T.N. Effects of P fertilizers on 137Cs accumulation by farm crops, Agrohimiya 9 (2001) 47-51 (In Russian).
KUSNETSOV, V.K, SANZHAROVA, N.I.. Influence of specific and variety features of the in plant yield on 137Cs accumulation from sod-podzolic and chernozem soils, Agricultural biology 1 (2000) 374-383 (In Russian).
Literature Review and Assessment of Plant and Animal Transfer Factors Used in Performance Assessment Modeling. (2003) U.S. Nuclear Regulatory Commission Office of Nuclear Regulatory Research. NUREG/CR-6825 PNNL-14321. Washinton, DC 20555-0001.
LIVENS F.R., HORRILL A.D., SINGLETON D.L., The relationship Between Concentration of Pu and Am in Soil Interstitial Waters and Their Uptake by Plants. Science of the Total Environment 155 (1994) 151-159.
LOTFIA M., NOTAROA M., AZIMI-GARAKANIA R., CUBADDAB R., SANTARONIB G.P., TOMMASINOA L. Concentrations of radiocaesium in Italian durum wheat and its products after the Chernobyl accident, Journal of Environmental Radioactivity 11(2) (1990) 177-182.
McNEILL G., DUFFY J.T., CUNNINGHAM J.D., COULTER B., DIAMOND S., McAULAY I.R., MORAN D., Transfer characteristics of radiocaesium from soils to permanent pasture, The Analyst 117(3) (1992) 521 – 524.
MALIKOV V.G., ZHUKOV B.I., PEREPELYATNIKOVA L.V., Migration of radionuclides from soil to farm crops in conditions of Northern Caucasus, Agrohimiya 5 (1988) 92-96 (In Russian).
MASCANZONI D. Plant uptake of activation and fission products in a long-term field study. Journal of Environmental Radioactivity 10(3) (1989) 233-249.
MINENKO V.A. “Effects of agrochemical and agrotechnical methods on 137Cs accumulation in green mass of perennial grasses”, Proceeding Sci.-Practical Conf. Production of safe plant and animal products, Bryansk (2004) 57-59 (In Russian).
MOISEEV I.T., TIKHOMIROV F.A., ALEXAKHIN R.M., RERIKH L.A. A comparative assessment of different methods to study 137Cs uptake by farm crops from soil, Agrohimiya 10 (1975) 129-134 (In Russian).
202
MOISEYEV I.T., AGAPKINA G.I., RERIKH L.A. A study into 137Cs behaviour in soils and its uptake by farm crops as a function of different factors, Agrohimiya 2 (1994) 103-118 (In Russian).
MOISEYEV I.T., TIKHOMIROV F.A., ALEXAKHIN R.M. On Cs-137 accumulation by plants on leached chernozems, Agrohimiya 9 (1972) 122-125 (In Russian).
MOISEYEV I.T., TIKHOMIROV F.A.. RERIKH L.A. Estimation of the parameters of 137Cs accumulation by perennial grasses depending on their species peculiarities, fertilizing and soil properties, Agrohimiya 2 (1982) 94-99 (In Russian).
MOISEYEV I.T., TIKHOMIROV F.A., ALEXAKHIN R.M., RERIKH L.A., SALNIKOV V.G., Cesium-137 behaviour in soils and its accumulation in farm crops, Pochvovedenie 7 (1976) 45-52 (In Russian).
MOLCHANOVA I.V. AND KULIKOV N.V., Radioactive isotopes in the soil-plant system, Sverdlovsk, (1972) (In Russian).
MOUSNY A.F., MYTENAERE C. Absortion of Tc by palnts in relation to soil type. Contamination level and time, Plant soil 61 (1981) 403-412.
NEDBAEVSKAYA N.A., Estimation of the effects of NPP releases on agroecosystens (exemplified by the Leningrad NPP), PhD thesis, Obninsk (1992) (In Russian).
NG. Y.C., COLSHER C.S., THOMPSON S.E., Soil-to Plant Concentration Factors for Radionuclide Assissments, Rep. NUREG/CR-2975 UCID-19463, Lawrence Livermore Nat. Lab., CA (1982)
NISHITA H., WALLACE A., ROMNEY E.M., SCHULTZ R.K. Effect of Soil Type on the Extractability of Np, Pu, Am and Cm as a function of pH, Soil Sciences 132 (1981) 25-34.
NISHITA H., HAUG R. M., HAMILTON M., Influence of Minerals on 90Sr and 137Cs Uptake by Bean Plants, Soil Sciences 105(4) (1968) 237–243.
NISBET A.F., WOODMAN R.F. M., HAYLOCK R.G.E., Recommended Soil-to-plant Transfer Factors for Radiocaesium and Radiostrontium for Use In Arable. Report ТЕМ AS project, Contract No. F14P-CT950021 (1999).
NISBET A.F., SHAW S. Summary of a 5-year lysimeter study on the time-dependent transfer of 137Cs, 90Sr, 239,240Pu and 241Am to crops from three contrasting soil types: 1. Transfer to the edible portion, Journal of Environmental Radioactivity 23(1) (1994) 1-17.
NISBET A.F., WOODMAN R.F.M., Soil-to-plant transfer factors for radiocesium and radiostrontium in agricultural systems, Health Physics 78(3) (2000) 279-288.
PAASIKALLIO A., RANTAVAARA A., SIPPOLA J. The transfer of cesium-137 and strontium-90 from soil to food crops after the Chernobyl accident, Science of The Total Environment 155(2) (1994) 109-124.
PAPASTEFANOU C., MANOLOPOULOU M., STOULOS S., IOANNIDOU A., GERASOPOULOS E., Soil-to-plant transfer of 137Cs, 40K and 7Be, Journal of Environmental Radioactivity 45(1) (1999) 59-65.
PEREPELYATNIKOVA L.V., MALIKOV V.G., ZHUKOV B.I., Effects of lime fertilizers on radionuclide availability to plants, Agrohimiya 6 (1981) 117-121 (In Russian).
PEREVOLOTSKY A.N., BULAVIK I.M., PEREVOLOTSKAYA T.V., PASKROBKO L.A., ANDRUSH S.N., 137Cs and 90Sr accumulation by the wood of white birch (Betula pendula Roth.) in different growth conditions, Radiation Biology. Radioecology 45(4), (2005) 498-505 (In Russian).
PIETRZAK-FLIS Z., KRAJEWSKI P., KRAJEWSKA G., SUNDERLAND N.R., Transfer of radiocesium from uncultivated soils to grass after the Chernobyl accident, The Science of The Total Environment, 141(1-3) (1994) 147-153.
PODOLYAK A.G., Effects of agrochemical and agrotechnical methods of improvement of the main meadow types of the Belorussian Poliesije on 137Cs and 90Sr uptake by grass stand, PhD thesis (2002) (In Russian)
PODVORKO G.A., Regularities of 137Cs migration on waterlogged meadows in the long term after the Chernobyl accident, PhD thesis, Obninsk (2004) (In Russian).

203
POGOSYAN E.A. Radiostrontium, calcium and magnesium accumulation by potato plants in Armenia, Agrohimiya 12 (1978) 103-116 (In Russian).
Recommendation on farming in conditions of radioactive contamination of the territory (POVALYAEV A.P. Ed.), Kolos Moscow (1977) (In Russian).
PRISTER B.P., GRIGORIEVA T.A., PEREVEZENTSEV V.M., Iodine behavior in the soil-plant system, Agrohimiya 3 (1979) 93-99 (In Russian).
RAASIKALLIO, A. RATAVAARA, A. AND SIPPOLA, J. The transfer of cesium-137 and strontium-90 from soil to food crops after the Chernobyl accident, Science of the Total Environment 155(2) (1994) 109-124.
Radioecology of irrigation farming, (ALEXAKHIN, R.M. Ed.) Moscow: Energoatomizdat (1985) (In Russian).
RATNIKOV A.N., A system of countermeasures and technological procedures for plant production on agricultural lands affected by radioactive contamination after the Chernobyl accident, Doctor of Science thesis, Obninsk (2002) (In Russian).
RATNIKOV A.N., ALEXAKHIN R.M., ZHIGAREVA T.L., SANZHAROVA N.I., POPOVA G.I. Effectiveness of a system of agroameliorative measures to reduce 137Cs accumulation in plant products in the Chernobyl affected area (within Russia). Agrohimiya 9 (1992) 112-116 (In Russian).
RATTAN R.K., DATTA S.P., CHHONKAR P.K., SURIBABU K., SINGH A.K. Long-term impact of irrigation with sewage effluents on heavy metal content in soils, crops and groundwater—a case study. Agriculture, Ecosystems and Environment, 109(3-4) (2005) 310-322.
Recommendation of farming in conditions of radioactive contamination of territory as a result of the Chernobyl accident for the period of 1991-1995. State Commission of the USSR Council of Ministers on food and purchases, Izdat, Moscow (1991) (In Russian).
RERIKH L.A., MOISEYEV I.T. Comparison of the results of microfield and field experiments in studying 137Cs transfer from soil to perennial grasses, Agrohimiya 9 (1989) 85-87 (In Russian).
ROBISON W.L., CONRADO C.L., HAMILTON T.F., A Comparative study on 137Cs transfer from soil to vegetation in the Marshall Islands, Paper presented to the International Meeting on the influence of Climatic Characteristics Upon Behaviour of Radioactive Elements, October 1997. UCRL-JC-128490.
ROMANOV G.N., Mitigation of consequences of radiation accidents, Izdat, Moscow (1993) (In Russian).
ROSEN K., ANDERSSON I., LÖNSJÖ H. Transfer of radiocaesium from soil to vegetation and to grazing lambs in a mountain area in northern Sweden, Journal of Environmental Radioactivity 26(3) (1995) 237-257.
RYABOVA E.R., PESHCHEROVA N.N., TEPLYAKOV I.G Accumulation of 54Mn, 60Co and 65Zn by plants under irrigation and application to soil of stable elements, Agrohimiya 11 (1980) 121-124 (In Russian).
SALNIKOV V.G., PAVLOTSKAYA F.I., MOISEJEV I.T. On 90Sr relation to soil organic matter components in the situation of lime and peat application and their role in the radioisotope accumulation by plants, Pochvovedenie 5 (1976) 87-94 (In Russian).
SANDALLS J., BENNETT L., Radiocaesium in upland herbage in Cumbria, UK: A three year field study. Journal of Environmental Radioactivity, 16(2) (1992) 147-165.
SANZHAROVA N.I. Radioecological monitoring of agroecosystems and farming in the area influenced by nuclear power plants. Doctor of Science thesis, Obninsk (1997) (In Russian).
SANZHAROVA N.I., BELLI M., ARKHIPOV A.N., IVANOVA T.G., FESENKO S.V., PEREPELYATNIKOV G.P., TSVETNOVA O. Radionuclide transfer to meadow plants. The radiological consequences of the Chernobyl accident. Proceedings of the first international conference. Minsk, Belarus, 18-22 March 1996, 507-510 (In Russian).
SANZHAROVA N.I., BELOVA N.V., YURIKOV L.A., Transfer of 137Cs to plants from soddy-podzolic soil as a function of K dose and its mobility, Agrohimiya 7 (2004) 58-66 (In Russian).

204
SANZHAROVA N.I., FESENKO S.V., ALEXAKHIN R.M., Dynamics of 137Cs biological availability in the soil-plant system after the Chernobyl accident, Doklagy RASHN 338(4) (1994) 564-566 (In Russian).
SANZHAROVA N.I., FESENKO S.V., ALEXAKHIN R. M., ANISIMOV V.S., KUZNETSOV V.K., CHERNYAYEVA L.G., Changes in the forms of 137Cs and its availability for plants as dependent on properties of fallout after the Chernobyl nuclear power plant accident, Science of The Total Environment 154(1) (1994) 9-22.
SANZHAROVA N.I., FESENKO S.V., ALEXAKHIN R.M., ABRAMOVA T.N., KUZNETSOV V.K., Estimation of factors responsible for the dynamics of 137Cs contamination of farm products after the Chernobyl accident. Radiation Biology. Radioecology 35(3) (1995) 307-315 (In Russian).
SANZHAROVA N.I., FESENKO S.V., KUZNETSOV V.K., ISAMOV N.N., BELOVA N.V., SIDOROVA E.V., GESHEL I.V., CHIONOV V.G., KOCHERIAN V.M., The radiological situation in agriculture in regions near the Balakovo and Volgodonsk nuclear power plants. Inform. Bull., Obninsk (2004) (In Russian).
SCHIMMACK W., ZIMMERMANN G., SOMMER M., DIETL F., SCHULTZ W., PARETZKE H.G., Soil-to-grain transfer of fallout 137Cs for 28 winter wheat cultivars as observed in field experiments. Radiation and Environmental Biophysics 42(4) (2004) 275 –284.
SCHRECKHISE R.G. AND CLINE J.F., Comparative Uptake and distribution of Plutonium, Americium, Curium and Neptunium in Four Plant Species. Health Physics 38 (1980) 817-824.
SCHULLER P., LOVERGREEN C., HANDL H., 137Сs Concentration in Soil, Prarie Plants, and Milk from Sites in Southern Chile, Heath Physics 64 (1993) 157-161.
SELNES T.D., STRAND P. Comparison of the uptake of radiocaesium from soil to grass after nuclear weapons tests and the Chernobyl accident, The Analyst 117(3) (1992) 493–496.
SEMYONOVA G.M., AHMEROVA V.G., PIHODKO V.I., ALIPBEKOV O.A., ZHUKOV B.I., SAVINKOV A.F., “Behaviour of some radionuclides in the soil-plant system”, Proceeding of Radioecological studies in the NPP zone, July 1985, Zarechny, Beloyarsk NPP., Sverdlovsk (1986) 23-29 (In Russian).
SHEPPARD S.C., EVENDEN W.G., Variation in Transfer Factors for Stochastic Models: Soil-To-Plant Transfer, Health Physics 72(5) (1997) 727-733.
SHEPPARD, M.I., VANDERGRAAF, T.T., THIBAULT, D.H., REID, J.A. K., Technetium and uranium: sorption by and plant uptake from peat and sand, Health Physics 44 (1983) 635-643.
SHINONAGA, T. GERZABEK, M.H., STREBL, F., MURAMATSU, Y., Transfer of iodine from soil to cereal grains in agricultural areas of Austria, Science of the Total Environment 267 (2001) 33-40.
SIMON, S.L., GRAHAM, J.C., AND TERP, S.D., Uptake of 40K and 137Cs in native plants of the Marshall Islands, Journal of Environmental Radioactivity 59 (2002) 223-243.
SKARLOU V., PAPANICOLAOU E.P., NOBELI C., Soil to plant transfer of radioactive cesium and its relation to soil and plant properties, Geoderma 72(1-2) (1996) 53-63.
SOKOLIK G.A., IVANOVA T.G., LEINOVA S.L., OVSIANNIKOVA S.V., KIMLENKO I.M., Migration ability of radionuclides in soil-vegetation cover of Belarus after Chernobyl accident, Environment International 26(3) (2001) 183-187.
SOKOLIK, G.A., OVSIANNIKOVA, S.V., IVANOVA, T.G., LEINOVA, S.L., Soil-plant transfer of plutonium and americium in contaminated regions of Belarus after the Chernobyl catastrophe, Environment International 30(7) (2004) 939-947.
SOLECKI, J., CHIBOWSKI, S., 2002. Determination of transfer factors for 137Cs and 90Sr isotopes in soil-plant system, Journal of Radioanalytical and Nuclear Chemistry 252(1) (2002) 89-93.
STAUNTON S., HINSINGER P., GUIVARCH A., BRECHIGNAC F., Root uptake and translocation of radiocaesium from agricultural soils by various plant species. Plant and Soil, 254 (2), (2003) 443-455.

205
STAVEN L.H., RHOADS K., NAPIER B.A., STRENGE D.L., A Compendium of Transfer Factors for Agricultural and Animal Products, PNNL-13421,. The U.S. Department of Energy, Washington (2003).
STEVENSON F.J., FITCH A., Chemistry of Complexation of Metal Ions with Soil Solution Organics. Eds. P.M. Huang and m. Schnitzer. In: Interaction of Soil minerls with Natural Jrganics and Microbes, SSSa Special Publication, No 17. Soil Science Society of America Inc. Madison, WI (1986).
STREBL F., RINGER W., GERZABEK M.H., Radiocaesium contamination of meadow vegetation—time-dependent variability and influence of soil characteristics at grassland sites in Austria, Journal of Environmental Radioactivity 58(2-3) (2002) 143-161.
SHANG, Z.R., LEUNG, J.K., 110mAg root and foliar uptake in vegetables and its migration in soil, Journal of Environmental Radioactivity 65(3) (2003) 297-307.
TAGAMI, K., UCHIDA, S., Soil-to-plant transfer factors of technetium-99 for various plants collected in the Chernobyl area, Journal of Nuclear and Radiochemical Science, 6(3) (2005) 261-264.
TIKHOMIROV F.A., MOISEYEV I.T., PEREVEZENTSEV V.M., Effects of soil properties and phase of plant development on radioiodine uptake by the aboveground phytomass, Agrohimiya 1 (1983) 87-92 (In Russian).
TIKHOMIROV F.A., MOISEYEV I.T., RUSINA T.V., Dynamics of radioiodine availability to plants in different soils, Agrohimiya 11 (1980) 115-120 (In Russian).
TIKHOMIROV F.A., SANZHAROVA N.I., SMIRNOV E.G., 90Sr accumulation by herbaceous plants of meadows and forests, Lesovedenie 5 (1976) 78-84 (In Russian).
TSEITIN K.F., Radioecological monitoring of the Moscow region. PhD thesis. Obninsk (1997) (In Russian).
TSUKADA H., HASEGAWA H., Soil-to-plant transfer of 137Cs and other essential and trace elements in cabbage plants, Journal Radioanalytical Nuclear Chemistry 252(2) (2002) 219-324.
TSUKADA H., NAKAMURA Y., Transfer factors of 31 elements in several agricultural plants collected from 150 farm fields in Aomori, Japan, Journal Radioanalytical and Nuclear Chemistry 236(1-2) (1998) 123-131.
TYLER, G., Rare earth elements in soil and plant systems – A review. Plant and Soil 267(1-2) (2004) 191-206.
TYLER G. , OLSSON T., Plant Uptake of Major and Minor Elements as Influenced by Soil Acidity and Liming, Plant and Soil 230(2001) 307-321.
UCHIDA S. AND OHMOMO Y., “Impact of radionuclides on soil, groundwater, and crops and radionuclide cleanup in Japan”, Soils and groundwater pollution and remediation: Asia, Africa, and Oceania, (HUANG, P.M., ISKANDAR, I.K., Eds.) (1999) 96-125.
VANDENHOVE H. AND VAN HEES M., Fibre crops as alternative land use for radioactively contaminated arable land. Journal of Environmental Radioactivity 81(2-3), (2005) 131-141.
VANDENHOVE H., CREMERS A., SMOLDERS E., VAN HEES M., Effect of K and bentonite additions on Cs-transfer to ryegrass, Journal of Environmental Radioactivity 81(2-3) (2005) 233-253.
VANDENHOVE H., EYCKMANS T., VAN HEES M., Can barium and strontium be used as tracers for radium in soil–plant transfer studies? Journal of Environmental Radioactivity 81(2-3) (2005) 255-267.
VITKOVSKAYA S.E., Interaction of radioantimony and phosphorus in the soil-plant system, PhD thesis, Obninsk (1996) (In Russian).
VITKOVSKAYA S.E., DRICHKO V.F., 125Sb uptake by spring wheat at different levels of P availability (experiments with aqueous and soil crops), Agrohimiya 5 (2001) 70-75 (In Russian).
VLASOV O.K., SIROTKIN A.N., RATNIKOV A.N., BELOLIPETSKAYA V.I., ZHIGAREVA T.L., Regional coefficients of radionuclides transition in to agricultural products of the Altai region for nuclear explosion on august 7, 1962 at the Semipalatinsk test site, Vestnik of the ‘Semipalatinsk test site–Аltai’ project 4 64-72 (In Russian).

206
VOIGHT G., PROHL G., MUELLER H., Experiments on the Seasonally of Cesium Translocation in cereals, potatoes and vegetables, Radiation and Environmental Biophysics 30 (1991) 295-304.
VOLKOVA M.P., DRICHKO V.P., PONIKAROVA T.M., SHUTOV V.N., Transfer of elements from soil to carrot plants, Soil processes and ways of plant nutrition control in the north-western part of the Russian Federation, 394 (1980) 111-116 (In Russian).
VOROBIYOVA L.A., BARDADYN M.A., REZUNOV A.A., “Effects of the level of soil fertility and mineral fertilizers on 137Cs content and transfer factor to farm crops” Proceeding Sci.-Practical Conf. of Production of safe plant and animal products, Bryansk, (2004) 46-49 (In Russian).
VORONOV S.I., ALEXAKHIN R.M., Main regularities of migration in natural and cultivated cenoses of Uzbekistan (radioecology of the Tashkent oasis), Atomnaya Energiya 73(2) (1992) 132-138 (In Russian).
YUDINTSEVA E.V., BAKUNOV N.A., 137Cs uptake to wheat plants from different soils. Doklady TSHA 115 (1965) 61-66 (In Russian).
YUDINTSEVA E.V., POVALYAEV A.P., Reduction in the content of radioactive substances in plant products (recommendations), Moscow, Agropromizdat (1989) (In Russian).
YUDINTSEVA E.V., FILIPAS N.A., RATNIKOV A.N., VOSTRIKOVA O.A., Effects of soil properties on 60Со and 115Cd behaviour in the soil-plant system, Agrohimiya 5 (1984) 82-87 (In Russian).
YUDINTSEVA E.V., KHODORKOVSKY YU.M., ZYULIKOVA A.G., 54Mn uptake by plants from various soils, Agrohimiya 9 (1981) 119-125 (In Russian).
YUDINTSEVA E.V., LEVINA E.M., KOZHEMYAKINA T.A., Behaviour of 137Cs, 106Ru, 147Pm, 144Ce in the soil-plant system, Agrohimiya 12 (1979) 104-111 (In Russian).
YUDINTSEVA E.V., ZHIGAREVA T.L., LEVINA E.M., SOKOLOVA S.D., SIDOROVA E.D., Changes in the radionuclide availability to plants with chemicalization of agriculture, Agrohimiya 5 (1982) 82-88 (In Russian).
ZHU Y.-G., SMOLDERS E., Plant uptake of radiocaesium: a review of mechanisms, regulation and application, Journal of Experimental Botany 51(351) (2000) 1635-1645.
ZUBAREVA I.F., Effects of 90Sr concentration in soil on radiostrontium transfer factors in wheat seedlings, Agrohimiya 10 (1975) 135-137 (In Russian).

207
ROOT UPTAKE: TROPICAL AND SUB-TROPICAL ENVIRONMENTS
H. VELASCO, J. JURI AYUB
GEA-IMASL – Universidad Nacional de San Luis/Conicet, Argentina
Abstract
In this paper we analyse the radionuclide soil-to-plant transfer factors obtained for tropical and subtropical environments. In
these regions several soil types occur in which radionuclide uptake by crops consistently deviates from the values
characteristic of temperate environments. Fv values from 6 countries from tropical regions and 10 countries belonging
subtropical environments have been gathered in the corresponding databases. In total, more than 2700 individual transfer
factor values were considered mainly for radioisotopes of Cs, Ra, U, Sr, Co, Th, Pb, K, Mn and Zn, but also for radioisotopes
of I, Ag, Tc, Pu, and Am. Four broad soil groups and 13 plant groups were separately investigated. Additionally, different
plant compartments were distinguished. The wide variability and uncertainty observed in transfer factors is considerably
reduced when data are independently grouped into clusters containing the same radionuclide/soil type/plant group/plant part
combinations. For each cluster, standard statistical quantities were determined.
1. INTRODUCTION
Previously, existing reviews of environmental radionuclide transfers were principally limited
to temperate climatic zones, as data from other climatic zones were typically unavailable [1-
7]. However, recently new data on tropical environments have become available, and from
these new data it appears that, although the direct influence of climatic conditions on
radioecological transfer parameters seems to be minimal, its indirect effects can be significant
[2, 6, 8, 9-11].
Climate and parent rock material determine, to a large extent, the characteristics of soil
development. In tropical areas, several soil types occur in which radionuclide uptake by crops
consistently deviates from the values characteristic of temperate environments. In typical
tropical environments, almost all of the organic material that reaches the soil surface
decomposes rapidly, and surface accumulation of soil organic matter is minimal.
Consequently, there is rapid recycling of nutrients and contaminants into the vegetation. In
temperate zones, the decomposition of organic debris is slower, and the accumulation of soil
organic matter is usually greater than the rate of decomposition, resulting in highly organic
surface soil [12-15].
2. MAIN FACTORS GOVERNING RADIONUCLIDE BEHAVIOUR IN TROPICAL AND
SUBTROPICAL ENVIRONMENTS
Tropical climatic region is the geographic area of the Earth centred on the equator and limited
in latitude, respectively, by the tropics of Cancer (northern hemisphere) and Capricorn
(southern hemisphere). In this region, ecosystems can consist of rainforests, dry deciduous
forest, spiny forest, desert, and other types of environments. In tropical environments, almost
all organic material that reaches the soil surface decomposes rapidly, and the surface
accumulation of soil organic matter is therefore minimal. Consequently, there is rapid
recycling of nutrients and contaminants into the vegetation. In the tropics, due to the long age
of soils and the high mineral weathering rates, clays of low exchange activity such as
kaolinite are more common than in the temperate zone. This lead to soils that, in spite of
having a high clay content, can have a low exchange capacity. Subtropical region refers to the
zones of the Earth immediately north and south of tropic zone including range of latitudes
between 23.5 and approximately 40 degrees (parts of arid and semiarid regions). These areas
typically have hot summer, and, throughout the annual period, the air temperature usually

208
does not go below freezing (0 o
C). Subtropical areas do not usually have markedly wet or dry
seasons, and the rain distribution is fairly regular throughout the year [17]. It should be
recognised that there are several quite different classifications of the geographical zones
according to the climatic conditions. For the purpose of the current report, the simplest is used
as a first experience in the application of an geographical approach for the classification of
agricultural systems for radiological assessments.
3. INFORMATION SOURCES AND DATA ANALYSIS
Values of soil-to-plant transfer factors in tropical and subtropical environments determined
before 1998 were mostly obtained from the IAEA CRP [18], and IUR databases [6, 12]. In
total, 180 references were reviewed, of which only 55 were retained and used for transfer
factor value evaluation. These are identified in the reference list given in Appendix 3. The
database on tropical soil-to-plant Fv values contains 1269 entries, principally for radioisotopes
of Cs, Ra, U, Sr and Zn, but also for radioisotopes of Co, Pb, Th, K, Pu and Am. Fig. 1 shows
the number of entries for each radionuclide.
The database on subtropical soil-to-plant Fv values contains 940 entries. Most of them are for
radioisotopes of Cs and Sr, but also included are radioisotopes of I, K, Co, Mn, Ag, Zn, Tc,
and Pu. The number of entries for each radionuclide in this database are given in Fig. 2.
Figures 3 and 4 show the number of records for different plant groups accumulated in the
tropical and subtropical databases, respectively. Soils were grouped based on classification
given in previous paper, considering primarily the texture classification. Figures 5 and 6 show
the number of entries for each soil type represented in the two databases. In terms of number
of records associated with different plant groups, the largest contribution to the tropical
database is for Leafy and Leguminous Vegetables, followed by Grasses and Non-Leafy
Vegetables, and finally Tubers, Rice, Maize, Fruits and Cereals. Rather a large percentage
(≈20%) is related to plants outside the classification scheme. This emphasises the need for
alternative guidance as to the grouping of tropical plants. For both tropical and subtropical
ecosystems, the major contribution to the database is for Leafy Vegetables (around 30%),
followed by Grasses, Root/Tuber Crops, Leguminous Vegetables.
0 50 100 150 200 250 300
Am
Pu
K
Th
Pb
Co
Zn
Sr
U
Ra
Cs
Num ber of records
Tropical database
FIG. 1. Number of entries for every radionuclide in the tropical database.

209
0 50 100 150 200 250 300 350 400 450
Pu
Tc
Ag
I
Mn
K
Zn
Co
Sr
Cs
Num ber of records
Subtropical database
FIG. 2. Number of entries for every radionuclide in the subtropical database.
0 50 100 150 200 250 300
Pasture
Cereals
Fruits
Maize
Herbs
Root Crops
Tubers
Non-Leafy Vegetables
Grasses
Leguminous Vegetables
Leafy Vegetables
Other Crops
Number of records
Tropical database
FIG. 3. Number of entries for each individual plant group in the tropical database.
0 50 100 150 200 250
Maize
Herbs
Fruits
Pasture
Other Crops
Cereals
Leguminous Vegetables
Non-Leafy Vegetables
Tubers
Grasses
Root Crops
Leafy Vegetables
Num ber of records
Subtropical database
FIG. 4. Number of entries for each individual plant group in the subtropical database.

210
0 50 100 150 200 250 300 350 400 450 500
Organic
Sand
Loam
Clay
Unspecified
Number of records
Tropical database
FIG. 5. Number of entries for each soil group in the tropical database.
0 50 100 150 200 250 300 350 400 450
Organic
Clay
Sand
Loam
Unspecified
Number of records
Subtropical database
FIG. 6. Number of entries for each soil group in the subtropical database.
It should be also noted that between 30-50% of available publications do not provide
sufficient information on soil properties to define their class according to the approach given
in previous paper of this IAEA-TECDOC. For subtropical environments, in terms of the data
availability, soil groups can be ranked as follows: Loam>Sand>Clay>Others. For tropical
environments, the majority of the data available are for clay soils (around 30%), followed by
loam>sand and finally organic and others.
4. DERIVED TRANSFER FACTOR VALUES
The available information for both tropical and subtropical environments is markedly
heterogeneous in terms of locations around the world. For each respective environment, Table
1 shows the number of entries in the database associated with each country. Tables 2-22 give
Fv values for each element included in the data collected in the tropical and subtropical
databases, respectively.

211
TABLE 1. NUMBER OF ENTRIES FOR EACH COUNTRY IN EACH DATABASE
Environment Country/Part of country4 Number of Entries
Australia 345
Brazil 229
India 224
Indonesia 40
Marshall Islands 51
Vietnam 380
Tropical
Total 1269
Bangladesh 101
Cuba 30
China 43
Iraq 15
Japan 263
Republic of Korea 24
Syrian Arab Republic 200
Taiwan 226
Turkey 38
Total 940
Subtropical
Total 2209
4 From some countries located partly in temperate and partly in subtropical environments data from the areas
with subtropical conditions were selected.

TA
BL
E 2
. T
RO
PIC
AL
EN
VIR
ON
ME
NT
: S
OIL
TO
PL
AN
T T
RA
NS
FE
R F
AC
TO
R (Fv)
VA
LU
ES
FO
R A
m
Pla
nt
Gro
up
Pla
nt
Co
mp
artm
ent
Soil
Gro
up
N
GM
G
SD
A
M
SD
M
in
Max
#
ref
Fru
its
Oth
ers1
23.7
× 1
0-5
1.6
× 1
0-5
2.6
× 1
0-5
4.8
× 1
0-5
1
Fru
its
Co
con
ut
Mil
k2
Oth
ers1
1
3.7
× 1
0-5
1
Non-l
eafy
V
eget
able
s
Fru
its
Oth
ers1
1
1.1
× 1
0-5
1
1 O
ther
s re
fer
to s
oil
s w
hic
h a
re o
ut
of
the
clas
sifi
cati
on
sch
ema
use
d b
y t
he
curr
ent
do
cum
ent
such
as
Mar
shar
ll I
slan
d s
oil
s, c
lass
ifie
d b
y a
uth
ors
as
cora
l sa
nd
so
il.
2 N
ame
is b
eyo
nd
th
e
clas
sifi
cati
on
use
d. A
uth
ors
rep
ort
dat
a on
rad
ionu
clid
es i
n p
lan
t co
mp
artm
ents
fo
r th
e sa
me
pla
nts
. 2 T
he
pla
nt
com
par
tmen
t is
beyo
nd o
f th
e cl
assi
fica
tio
n u
sed
by t
he
curr
ent
do
cum
ent.
TA
BL
E 3
. T
RO
PIC
AL
EN
VIR
ON
ME
NT
: S
OIL
TO
PL
AN
T T
RA
NS
FE
R F
AC
TO
R (Fv)
VA
LU
ES
FO
R C
o
Pla
nt
Gro
up
Pla
nt
Co
mp
artm
ent
Soil
Gro
up
N
GM
G
SD
A
M
SD
M
in
Max
#
ref
All
19
6.6
× 1
0-1
2.3
9.4
× 1
0-1
9
.74
x 1
0-1
2 ×
10-3
3
.6
1
Leg
um
inous
Veg
etab
les
See
ds
and
po
ds
Cla
y
18
6.5
× 1
0-1
2.3
9.4
× 1
0-1
1
.0
2 ×
10-1
3
.6
1
All
41
9.2
× 1
0-2
1.9
1.1
× 1
0-1
7.2
× 1
0-2
3.2
× 1
0-2
2.8
× 1
0-1
2
L
eafy
Veg
etab
les
Lea
ves
Cla
y
39
9.1
× 1
0-2
2
1.1
× 1
0-1
7.4
× 1
0-2
3.2
× 1
0-2
2.8
× 1
0-1
1
All
28
3.1
× 1
0-1
1.7
3.5
× 1
0-1
1.7
× 1
0-1
1.4
× 1
0-1
6.9
× 1
0-1
2
N
on-l
eafy
V
eget
able
s F
ruit
s,
hea
ds,
ber
ries
, b
ud
s C
lay
26
3.1
× 1
0-1
1.7
3.5
× 1
0-1
1
.70
× 1
0-1
1.4
× 1
0-1
6.9
× 1
0-1
1
All
7
1.2
× 1
0-1
1.7
1.3
× 1
0-1
6.4
× 1
0-2
6.3
× 1
0-2
2.1
× 1
0-1
2
R
oot
Cro
ps
Ro
ots
Cla
y
5
1.2
× 1
0-1
1.7
1.3
× 1
0-1
6.9
× 1
0-2
6.3
× 1
0-2
2.1
× 1
0-1
1
All
4
3.7
× 1
0-1
1.0
3.7
× 1
0-1
1.4
× 1
0-2
3.6
× 1
0-1
3.9
× 1
0-1
2
T
uber
s T
uber
s
Cla
y
3
3.7
× 1
0-1
1.2
3.7
× 1
0-1
1.7
× 1
0-2
3.6
× 1
0-1
3.9
× 1
0-1
1
212

TA
BL
E 4
. T
RO
PIC
AL
EN
VIR
ON
ME
NT
: S
OIL
TO
PL
AN
T T
RA
NS
FE
R F
AC
TO
R (Fv)
VA
LU
ES
FO
R K
Pla
nt
Gro
up
Pla
nt
com
par
tmen
t S
oil
gro
up
N
GM
G
SD
A
M
SD
M
in
Max
#
ref
Fru
its
Org
anic
2
5.5
× 1
01
2.1
4
.0 ×
101
7.0
× 1
01
1
All
2
3.2
× 1
01
4.3
× 1
01
9.0
× 1
0-1
6.2
× 1
01
2
Loam
1
9.0
× 1
0-1
1
Fru
its
Lea
ves
1
Org
anic
1
6.2
× 1
01
1
Gra
sses
S
tem
s an
d s
ho
ots
L
oam
1
8.7
× 1
0-1
1
Lea
ves
L
oam
13
1.4
2.0
1.7
1
.5
4.9
× 1
0-1
5
.6
1
Oth
er C
rops
Ste
ms
and
sh
oots
L
oam
5
1.7
1.3
1.7
4
.8 ×
10-1
1
.2
2.3
1
Tuber
s T
uber
s L
oam
1
2.7
1
TA
BL
E 5
TR
OP
ICA
L E
NV
IRO
NM
EN
T:
SO
IL T
O P
LA
NT
TR
AN
SF
ER
FA
CT
OR
(Fv)
VA
LU
ES
FO
R C
s
Pla
nt
Gro
up
Pla
nt
Co
mp
artm
ent
Soil
gro
up
N
GM
G
SD
A
M
SD
M
in
Max
#
ref
All
4
2.3
× 1
0-1
3.4
3.8
× 1
0-1
2.1
× 1
0-1
6.0
× 1
0-2
1
.0
3
San
d
1
1.3
× 1
0-1
1
Cer
eals
G
rain
Loam
1
3.3
× 1
0-1
1
All
13
4.8
× 1
0-1
5.7
1.7
2
.9
5.0
× 1
0-2
8
.7
3
San
d
1
3.6
× 1
0-1
1
Fru
its
Unsp
ecif
ied
5
2.6
3.6
4.1
3
.5
3.6
× 1
0-1
8
.7
2
Co
con
ut
Mil
k1
Unsp
ecif
ied
2
4.3
5
.6
3.2
× 1
0-1
8
.2
1
Fru
its
Lea
ves
U
nsp
ecif
ied
1
5.8
1
All
34
1.4
× 1
0-2
2.9
× 1
01
1.6
3
.5
1.5
× 1
0-4
1.3
× 1
01
4
San
d
24
6.6
× 1
0-3
2.8
× 1
01
1.2
2
.8
1.5
× 1
0-4
8
.6
1
Gra
in
Unsp
ecif
ied
2
1.2
× 1
01
2.1
1
.0 ×
101
1.3
× 1
01
1
Gra
sses
Ste
ms
and
sh
oots
S
and
24
1.1
× 1
0-2
2.5
× 1
01
1.5
3
.4
4.2
× 1
0-4
9
.60
1
All
3
5.3
× 1
0-1
1.4
× 1
01
1.7
1
.6
2.
× 1
0-2
3
.20
2
H
erbs
Lea
ves
O
ther
s 1
1.9
1
1N
ame
is b
eyo
nd t
he
clas
sifi
cati
on s
khem
a use
d.
Auth
ors
rep
ort
dat
a on r
adio
nucl
ides
in p
lant
com
par
tmen
ts f
or
the
sam
e pla
nts
.
213
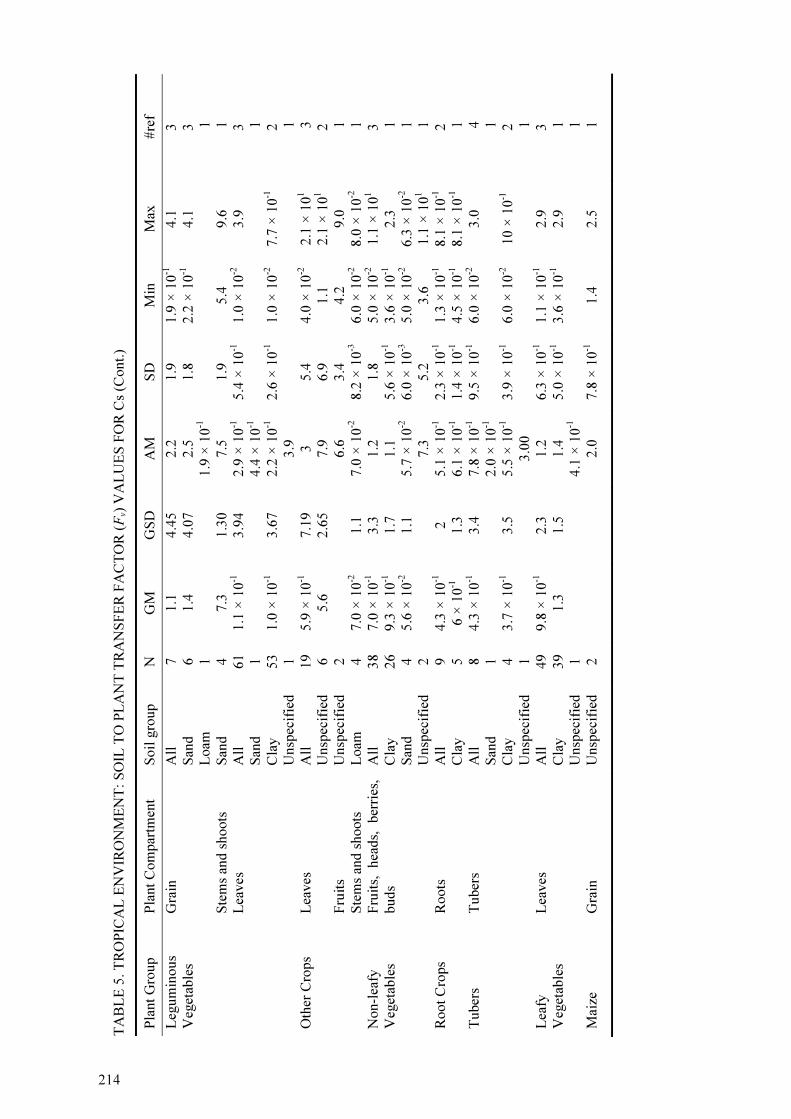
TA
BL
E 5
. T
RO
PIC
AL
EN
VIR
ON
ME
NT
: S
OIL
TO
PL
AN
T T
RA
NS
FE
R F
AC
TO
R (Fv)
VA
LU
ES
FO
R C
s (C
on
t.)
Pla
nt
Gro
up
Pla
nt
Co
mp
artm
ent
Soil
gro
up
N
GM
G
SD
A
M
SD
M
in
Max
#
ref
All
7
1.1
4.4
5
2.2
1
.9
1.9
× 1
0-1
4
.1
3
San
d
6
1.4
4.0
7
2.5
1
.8
2.2
× 1
0-1
4
.1
3
Gra
in
Loam
1
1.9
× 1
0-1
1
Ste
ms
and
sh
oots
S
and
4
7.3
1.3
0
7.5
1
.9
5.4
9
.6
1
All
61
1.1
× 1
0-1
3.9
4
2.9
× 1
0-1
5.4
× 1
0-1
1.0
× 1
0-2
3
.9
3
San
d
1
4.4
× 1
0-1
1
Cla
y
53
1.0
× 1
0-1
3.6
7
2.2
× 1
0-1
2.6
× 1
0-1
1.0
× 1
0-2
7.7
× 1
0-1
2
Leg
um
inous
Veg
etab
les
Lea
ves
Unsp
ecif
ied
1
3.9
1
All
19
5.9
× 1
0-1
7.1
9
3
5.4
4
.0 ×
10-2
2.1
× 1
01
3
Lea
ves
U
nsp
ecif
ied
6
5.6
2.6
5
7.9
6
.9
1.1
2
.1 ×
101
2
Fru
its
Unsp
ecif
ied
2
6.6
3
.4
4.2
9
.0
1
Oth
er C
rops
Ste
ms
and
sh
oots
L
oam
4
7.0
× 1
0-2
1.1
7.0
× 1
0-2
8.2
× 1
0-3
6.0
× 1
0-2
8.0
× 1
0-2
1
A
ll
38
7.0
× 1
0-1
3.3
1.2
1
.8
5.0
× 1
0-2
1.1
× 1
01
3
Cla
y
26
9.3
× 1
0-1
1.7
1.1
5
.6 ×
10-1
3.6
× 1
0-1
2
.3
1
San
d
4
5.6
× 1
0-2
1.1
5.7
× 1
0-2
6.0
× 1
0-3
5.0
× 1
0-2
6.3
× 1
0-2
1
Non-l
eafy
Veg
etab
les
Fru
its,
h
eads,
b
erri
es,
bu
ds
Unsp
ecif
ied
2
7.3
5
.2
3.6
1
.1 ×
101
1
All
9
4.3
× 1
0-1
2
5.1
× 1
0-1
2.3
× 1
0-1
1.3
× 1
0-1
8.1
× 1
0-1
2
R
oot
Cro
ps
Ro
ots
C
lay
5
6 ×
10-1
1.3
6.1
× 1
0-1
1.4
× 1
0-1
4.5
× 1
0-1
8.1
× 1
0-1
1
All
8
4.3
× 1
0-1
3.4
7.8
× 1
0-1
9.5
× 1
0-1
6.0
× 1
0-2
3
.0
4
San
d
1
2.0
× 1
0-1
1
Cla
y
4
3.7
× 1
0-1
3.5
5.5
× 1
0-1
3.9
× 1
0-1
6.0
× 1
0-2
10 ×
10-1
2
Tuber
s T
uber
s
Unsp
ecif
ied
1
3.0
0
1
A
ll
49
9.8
× 1
0-1
2.3
1.2
6
.3 ×
10-1
1.1
× 1
0-1
2
.9
3
Cla
y
39
1.3
1.5
1.4
5
.0 ×
10-1
3.6
× 1
0-1
2
.9
1
Lea
fy
Veg
etab
les
Lea
ves
Unsp
ecif
ied
1
4.1
× 1
0-1
1
Mai
ze
Gra
in
Unsp
ecif
ied
2
2.0
7
.8 ×
10-1
1
.4
2.5
1
21 4
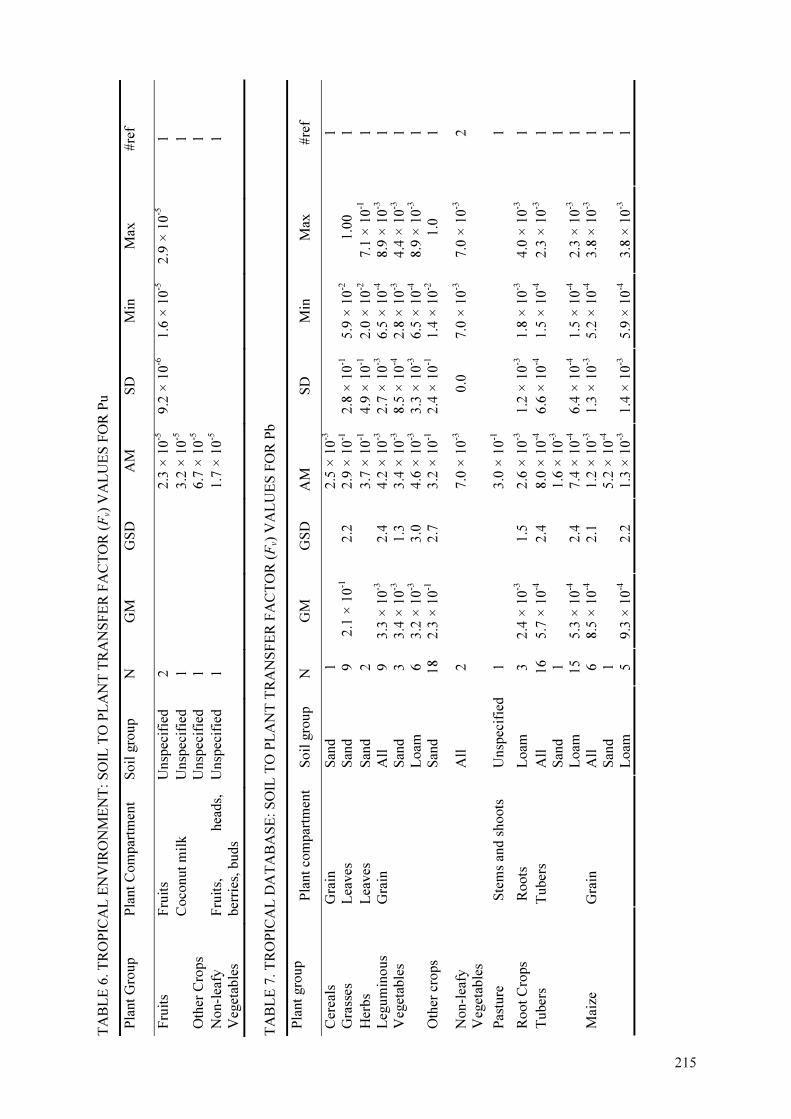
TA
BL
E 6
. T
RO
PIC
AL
EN
VIR
ON
ME
NT
: S
OIL
TO
PL
AN
T T
RA
NS
FE
R F
AC
TO
R (Fv)
VA
LU
ES
FO
R P
u
Pla
nt
Gro
up
Pla
nt
Co
mp
artm
ent
Soil
gro
up
N
GM
G
SD
A
M
SD
M
in
Max
#
ref
Fru
its
Unsp
ecif
ied
2
2.3
× 1
0-5
9.2
× 1
0-6
1.6
× 1
0-5
2.9
× 1
0-5
1
F
ruit
s
Co
con
ut
mil
k
Unsp
ecif
ied
1
3.2
× 1
0-5
1
Oth
er C
rops
U
nsp
ecif
ied
1
6.7
× 1
0-5
1
Non-l
eafy
Veg
etab
les
Fru
its,
hea
ds,
ber
ries
, b
uds
Unsp
ecif
ied
1
1.7
× 1
0-5
1
TA
BL
E 7
. T
RO
PIC
AL
DA
TA
BA
SE
: S
OIL
TO
PL
AN
T T
RA
NS
FE
R F
AC
TO
R (Fv)
VA
LU
ES
FO
R P
b
Pla
nt
gro
up
Pla
nt
com
par
tmen
t S
oil
gro
up
N
GM
G
SD
A
M
SD
M
in
Max
#
ref
Cer
eals
G
rain
S
and
1
2.5
× 1
0-3
1
Gra
sses
L
eaves
S
and
9
2.1
× 1
0-1
2.2
2.9
× 1
0-1
2.8
× 1
0-1
5.9
× 1
0-2
1
.00
1
Her
bs
Lea
ves
S
and
2
3.7
× 1
0-1
4.9
× 1
0-1
2.0
× 1
0-2
7.1
× 1
0-1
1
All
9
3.3
× 1
0-3
2.4
4.2
× 1
0-3
2.7
× 1
0-3
6.5
× 1
0-4
8.9
× 1
0-3
1
S
and
3
3.4
× 1
0-3
1.3
3.4
× 1
0-3
8.5
× 1
0-4
2.8
× 1
0-3
4.4
× 1
0-3
1
L
egu
min
ous
Veg
etab
les
Gra
in
Loam
6
3.2
× 1
0-3
3.0
4.6
× 1
0-3
3.3
× 1
0-3
6.5
× 1
0-4
8.9
× 1
0-3
1
O
ther
cro
ps
S
and
18
2.3
× 1
0-1
2.7
3.2
× 1
0-1
2.4
× 1
0-1
1.4
× 1
0-2
1
.0
1
Non-l
eafy
V
eget
able
s
All
2
7.0
× 1
0-3
0
.0
7.0
× 1
0-3
7.0
× 1
0-3
2
Pas
ture
S
tem
s an
d s
ho
ots
U
nsp
ecif
ied
1
3.0
× 1
0-1
1
Root
Cro
ps
Ro
ots
L
oam
3
2.4
× 1
0-3
1.5
2.6
× 1
0-3
1.2
× 1
0-3
1.8
× 1
0-3
4.0
× 1
0-3
1
All
16
5.7
× 1
0-4
2.4
8.0
× 1
0-4
6.6
× 1
0-4
1.5
× 1
0-4
2.3
× 1
0-3
1
S
and
1
1.6
× 1
0-3
1
Tuber
s T
uber
s
Loam
15
5.3
× 1
0-4
2.4
7.4
× 1
0-4
6.4
× 1
0-4
1.5
× 1
0-4
2.3
× 1
0-3
1
A
ll
6
8.5
× 1
0-4
2.1
1.2
× 1
0-3
1.3
× 1
0-3
5.2
× 1
0-4
3.8
× 1
0-3
1
S
and
1
5.2
× 1
0-4
1
Mai
ze
Gra
in
Loam
5
9.3
× 1
0-4
2.2
1.3
× 1
0-3
1.4
× 1
0-3
5.9
× 1
0-4
3.8
× 1
0-3
1
215

TA
BL
E 8
. T
RO
PIC
AL
EN
VIR
ON
ME
NT
: S
OIL
TO
PL
AN
T T
RA
NS
FE
R F
AC
TO
R (Fv)
VA
LU
ES
FO
R R
a
Pla
nt
gro
up
Pla
nt
com
par
tmen
t S
oil
gro
up
N
GM
G
SD
A
M
SD
M
in
Max
#
ref
All
3
3.5
× 1
0-3
2.5
4.7
× 1
0-3
4.6
× 1
0-3
1.7
× 1
0-3
1.0
× 1
0-2
2
C
erea
ls
San
d
2
2.1
× 1
0-3
5.7
× 1
0-4
1.7
× 1
0-3
2. ×
10-3
1
F
ruit
s L
eaves
L
oam
1
1.0
× 1
0-1
1
All
33
1.7
4.3
4.4
1
.0 ×
101
1.8
× 1
0-2
5
.80
× 1
01
2
Gra
sses
S
tem
s an
d s
ho
ots
L
oam
1
1.9
× 1
0-1
1
Ste
ms
and
sh
oots
U
nsp
ecif
ied
4
7.5
× 1
0-2
1.4
× 1
01
7.8
× 1
0-1
1
.5
1.0
× 1
0-2
3
.0
1
Her
bs
Lea
ves
U
nsp
ecif
ied
11
1.1
× 1
0-1
4.8
2.9
× 1
0-1
3.6
× 1
0-1
1.1
× 1
0-2
1
.0
1
All
31
2.1
× 1
0-2
4.3
5.1
× 1
0-2
7.1
× 1
0-2
7.6
× 1
0-4
2.7
× 1
0-1
1
San
d
5
3.6
× 1
0-2
3.0
4.9
× 1
0-2
3.2
× 1
0-2
5.7
× 1
0-3
8.7
× 1
0-2
1
Leg
um
inous
Veg
etab
les
Gra
in
Loam
26
1.9
× 1
0-2
4.5
5.1
× 1
0-2
7.7
× 1
0-2
7.6
× 1
0-4
2.7
× 1
0-1
1
A
ll
12
1.1
× 1
0-1
2.1
1.4
× 1
0-1
1.1
× 1
0-1
3.7
× 1
0-2
3.7
× 1
0-1
2
L
eaves
Loam
11
1.2
× 1
0-1
2,0
1.5
1 ×
10-1
1.2
× 1
0-1
4.0
× 1
0-2
3.7
× 1
0-1
1
R
oo
ts
All
3
9.8
× 1
0-2
5.8
1.8
× 1
0-1
1.5
× 1
0-1
1.3
× 1
0-2
2.7
× 1
0-1
1
All
6
1.2
× 1
0-1
2.5
1.5
× 1
0-1
8.3
× 1
0-2
2.0
× 1
0-2
2.7
× 1
0-1
2
S
tem
s an
d s
ho
ots
L
oam
5
1.6
× 1
0-1
1.4
1.7
× 1
0-1
6.1
× 1
0-2
1.0
× 1
0-1
2.7
× 1
0-1
1
A
ll
57
2.6
5.5
9.4
1
.9 ×
101
5.7
× 1
0-2
1.3
× 1
02
1
Oth
er C
rops
Loam
1
8.0
× 1
0-2
1
All
9
3.2
× 1
0-3
5.6
1.2
× 1
0-2
2.3
× 1
0-2
5.2
× 1
0-4
7.0
× 1
0-2
4
N
on-l
eafy
Veg
etab
les
Fru
its,
h
ead
s,
ber
ries
, b
uds
Loam
6
1.4
× 1
0-3
3.4
3.2
× 1
0-3
5.3
× 1
0-3
5.2
× 1
0-4
1.4
× 1
0-2
2
P
astu
re
Ste
ms
and
sh
oots
U
nsp
ecif
ied
1
7.0
× 1
0-2
1
Root
Cro
ps
Ro
ots
L
oam
22
1.1
× 1
0-2
4.9
3.4
× 1
0-2
5.5
× 1
0-2
1.2
× 1
0-3
2.2
× 1
0-1
1
All
42
1.9
× 1
0-3
3.8
8.1
× 1
0-3
2.9
× 1
0-2
2.6
× 1
0-4
1.9
× 1
0-1
2
S
and
1
1.6
× 1
0-3
1
Tuber
s T
uber
s
Loam
41
2.0
× 1
0-3
3.9
8.3
× 1
0-3
3.0
× 1
0-2
2.6
× 1
0-4
1.9
× 1
0-1
2
L
eafy
Veg
etab
les
L
oam
22
2.7
× 1
0-2
4.5
7.1
× 1
0-2
1.0
× 1
0-1
3.0
× 1
0-3
4.3
× 1
0-1
1
All
18
1.1
× 1
0-3
2.4
1.7
× 1
0-3
2.0
× 1
0-3
1.9
× 1
0-4
8.3
× 1
0-3
1
S
and
3
3.8
× 1
0-3
2.0
4.6
× 1
0-3
3.3
× 1
0-3
2.0
× 1
0-3
8.3
× 1
0-3
1
M
aize
G
rain
Loam
15
8.7
× 1
0-4
2.0
1.1
× 1
0-3
8.7
× 1
0-4
1.9
× 1
0-4
3.8
× 1
0-3
1
216
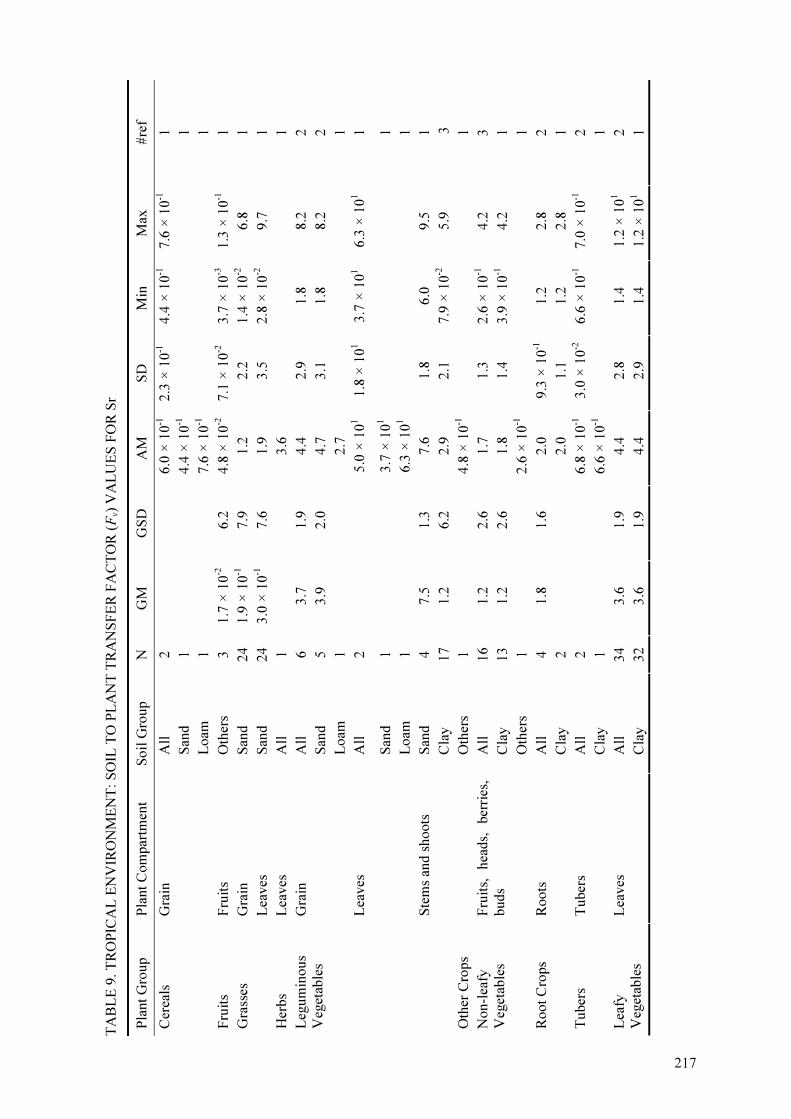
TA
BL
E 9
. T
RO
PIC
AL
EN
VIR
ON
ME
NT
: S
OIL
TO
PL
AN
T T
RA
NS
FE
R F
AC
TO
R (Fv)
VA
LU
ES
FO
R S
r
Pla
nt
Gro
up
Pla
nt
Co
mp
artm
ent
Soil
Gro
up
N
GM
G
SD
A
M
SD
M
in
Max
#
ref
All
2
6.0
× 1
0-1
2.3
× 1
0-1
4.4
× 1
0-1
7.6
× 1
0-1
1
San
d
1
4.4
× 1
0-1
1
Cer
eals
G
rain
Loam
1
7.6
× 1
0-1
1
Fru
its
Fru
its
Oth
ers
3
1.7
× 1
0-2
6.2
4.8
× 1
0-2
7.1
× 1
0-2
3.7
× 1
0-3
1.3
× 1
0-1
1
Gra
in
San
d
24
1.9
× 1
0-1
7.9
1.2
2
.2
1.4
× 1
0-2
6.8
1
G
rass
es
Lea
ves
S
and
24
3.0
× 1
0-1
7.6
1.9
3
.5
2.8
× 1
0-2
9.7
1
Her
bs
Lea
ves
A
ll
1
3.6
1
All
6
3.7
1.9
4.4
2
.9
1.8
8
.2
2
San
d
5
3.9
2.0
4.7
3
.1
1.8
8
.2
2
Gra
in
Loam
1
2.7
1
All
2
5.0
× 1
01
1.8
× 1
01
3.7
× 1
01
6.3
× 1
01
1
San
d
1
3.7
× 1
01
1
Lea
ves
Loam
1
6.3
× 1
01
1
Ste
ms
and
sh
oots
S
and
4
7.5
1.3
7.6
1
.8
6.0
9
.5
1
Leg
um
inous
Veg
etab
les
C
lay
17
1.2
6.2
2.9
2
.1
7.9
× 1
0-2
5.9
3
Oth
er C
rops
O
ther
s 1
4.8
× 1
0-1
1
All
16
1.2
2.6
1.7
1
.3
2.6
× 1
0-1
4.2
3
Cla
y
13
1.2
2.6
1.8
1
.4
3.9
× 1
0-1
4.2
1
Non-l
eafy
Veg
etab
les
Fru
its,
h
eads,
ber
ries
,
bu
ds
Oth
ers
1
2.6
× 1
0-1
1
All
4
1.8
1.6
2.0
9
.3 ×
10-1
1.2
2
.8
2
Root
Cro
ps
Ro
ots
Cla
y
2
2.0
1
.1
1.2
2
.8
1
All
2
6.8
× 1
0-1
3.0
× 1
0-2
6.6
× 1
0-1
7.0
× 1
0-1
2
Tuber
s T
uber
s
Cla
y
1
6.6
× 1
0-1
1
All
34
3.6
1.9
4.4
2
.8
1.4
1
.2 ×
101
2
Lea
fy
Veg
etab
les
Lea
ves
Cla
y
32
3.6
1.9
4.4
2
.9
1.4
1
.2 ×
101
1
217
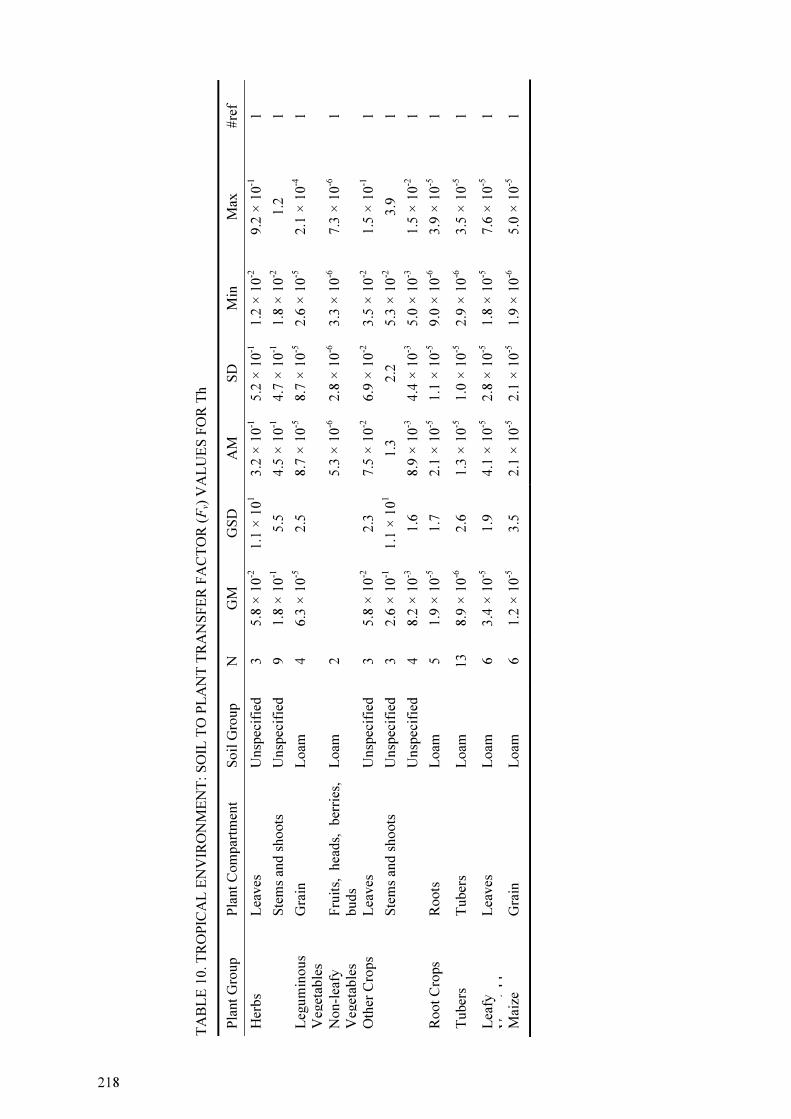
TA
BL
E 1
0. T
RO
PIC
AL
EN
VIR
ON
ME
NT
: S
OIL
TO
PL
AN
T T
RA
NS
FE
R F
AC
TO
R (Fv)
VA
LU
ES
FO
R T
h
Pla
nt
Gro
up
Pla
nt
Co
mp
artm
ent
Soil
Gro
up
N
GM
G
SD
A
M
SD
M
in
Max
#
ref
Lea
ves
U
nsp
ecif
ied
3
5.8
× 1
0-2
1.1
× 1
01
3.2
× 1
0-1
5.2
× 1
0-1
1.2
× 1
0-2
9.2
× 1
0-1
1
H
erbs
Ste
ms
and
sh
oots
U
nsp
ecif
ied
9
1.8
× 1
0-1
5.5
4.5
× 1
0-1
4.7
× 1
0-1
1.8
× 1
0-2
1
.2
1
Leg
um
inous
Ve g
etab
les
Gra
in
Loam
4
6.3
× 1
0-5
2.5
8.7
× 1
0-5
8.7
× 1
0-5
2.6
× 1
0-5
2.1
× 1
0-4
1
Non-l
eafy
V
e get
able
s F
ruit
s,
hea
ds,
b
erri
es,
bu
ds
Loam
2
5.3
× 1
0-6
2.8
× 1
0-6
3.3
× 1
0-6
7.3
× 1
0-6
1
Lea
ves
U
nsp
ecif
ied
3
5.8
× 1
0-2
2.3
7.5
× 1
0-2
6.9
× 1
0-2
3.5
× 1
0-2
1.5
× 1
0-1
1
Ste
ms
and
sh
oots
U
nsp
ecif
ied
3
2.6
× 1
0-1
1.1
× 1
01
1.3
2
.2
5.3
× 1
0-2
3
.9
1
Oth
er C
rops
U
nsp
ecif
ied
4
8.2
× 1
0-3
1.6
8.9
× 1
0-3
4.4
× 1
0-3
5.0
× 1
0-3
1.5
× 1
0-2
1
Root
Cro
ps
Ro
ots
L
oam
5
1.9
× 1
0-5
1.7
2.1
× 1
0-5
1.1
× 1
0-5
9.0
× 1
0-6
3.9
× 1
0-5
1
Tuber
s T
uber
s L
oam
13
8.9
× 1
0-6
2.6
1.3
× 1
0-5
1.0
× 1
0-5
2.9
× 1
0-6
3.5
× 1
0-5
1
Lea
fy
Veg
etab
les
Lea
ves
L
oam
6
3.4
× 1
0-5
1.9
4.1
× 1
0-5
2.8
× 1
0-5
1.8
× 1
0-5
7.6
× 1
0-5
1
Mai
ze
Gra
in
Loam
6
1.2
× 1
0-5
3.5
2.1
× 1
0-5
2.1
× 1
0-5
1.9
× 1
0-6
5.0
× 1
0-5
1
21 8

TA
BL
E 1
1. T
RO
PIC
AL
EN
VIR
ON
ME
NT
: S
OIL
TO
PL
AN
T T
RA
NS
FE
R F
AC
TO
R (Fv)
VA
LU
ES
FO
R U
Pla
nt
gro
up
Pla
nt
com
par
tmen
t S
oil
gro
up
N
GM
G
SD
A
M
SD
M
in
Max
#
ref
All
3
1.8
× 1
0-2
3.8
× 1
01
2.8
× 1
0-1
4.7
× 1
0-1
6.0
× 1
0-4
8.2
× 1
0-1
3
G
rain
San
d
1
6.0
× 1
0-4
1
Cer
eals
All
pla
nt
Unsp
ecif
ied
1
4.6
× 1
0-1
1
Fru
its
Unsp
ecif
ied
3
4.4
× 1
0-2
3.9
7.3
× 1
0-2
7.7
× 1
0-2
1.1
× 1
0-2
1.6
× 1
0-1
2
F
ruit
s
All
pla
nt
Unsp
ecif
ied
1
6.2
× 1
0-1
1
Gra
sses
S
tem
s an
d s
ho
ots
U
nsp
ecif
ied
10
6.4
× 1
0-1
1.5
6.9
× 1
0-1
2.3
× 1
0-1
2.5
× 1
0-1
8.8
× 1
0-1
1
Lea
ves
U
nsp
ecif
ied
5
7.8
× 1
0-3
1.4
8.2
× 1
0-3
2.8
× 1
0-3
5.0
× 1
0-3
1.2
× 1
0-2
1
Fru
its
Unsp
ecif
ied
1
3.7
× 1
0-1
1
Her
bs
U
nsp
ecif
ied
3
4.9
× 1
0-2
1.9
5.6
× 1
0-2
3.7
× 1
0-2
2.8
× 1
0-2
9.8
× 1
0-2
1
All
7
3.8
× 1
0-2
1.1
× 1
01
2.0
× 1
0-1
3.3
× 1
0-1
2.3
× 1
0-3
9.2
× 1
0-1
2
San
d
2
3.4
× 1
0-3
1.5
× 1
0-3
2.3
× 1
0-3
4.4
× 1
0-3
1
Gra
in
Loam
1
3.2
× 1
0-3
1
Leg
um
inous
Veg
etab
les
All
pla
nt
Unsp
ecif
ied
2
8.5
× 1
0-1
2.8
× 1
0-3
8.5
× 1
0-1
8.6
× 1
0-1
1
Lea
ves
U
nsp
ecif
ied
8
4.9
× 1
0-3
1.5
5.2
× 1
0-3
2.0
× 1
0-3
3.3
× 1
0-3
8.4
× 1
0-3
1
Ro
ots
U
nsp
ecif
ied
10
2.5
× 1
0-2
1.9
2.9
× 1
0-2
1.7
× 1
0-2
1.1
× 1
0-2
5.5
× 1
0-2
1
Tu
ber
s U
nsp
ecif
ied
7
8.9
× 1
0-3
2.0
1.1
× 1
0-2
7.6
× 1
0-3
2.9
× 1
0-3
2.6
× 1
0-2
1
Oth
er C
rops
All
pla
nt
Unsp
ecif
ied
27
2.2
× 1
0-1
6.1
4.3
× 1
0-1
2.7
× 1
0-1
8.0
× 1
0-4
9.4
× 1
0-1
1
Fru
its
Unsp
ecif
ied
14
2.6
× 1
0-2
2.8
4.3
× 1
0-2
5.4
× 1
0-2
4.3
× 1
0-3
1.8
× 1
0-1
2
N
on-l
eafy
V
eget
able
s A
ll p
lant
U
nsp
ecif
ied
2
7.0
× 1
0-1
7.1
× 1
0-4
7.0
× 1
0-1
7.1
× 1
0-1
1
Lea
ves
U
nsp
ecif
ied
1
2.5
× 1
0-1
1
Ro
ots
U
nsp
ecif
ied
6
4.7
× 1
0-2
5.1
1.1
× 1
0-1
1.2
× 1
0-1
8.3
× 1
0-3
2.6
× 1
0-1
2
Ro
ots
Ste
ms
and
sh
oots
U
nsp
ecif
ied
1
1.7
× 1
0-1
1
Tuber
s T
uber
s U
nsp
ecif
ied
4
2.0
× 1
0-2
2.3
2.5
× 1
0-2
1.7
× 1
0-2
7.3
× 1
0-3
4.3
× 1
0-2
1
Lea
ves
U
nsp
ecif
ied
19
4.8
× 1
0-2
3.2
8.8
× 1
0-2
1.1
× 1
0-1
4.4
× 1
0-3
4.1
× 1
0-1
2
L
eafy
Veg
etab
les
All
pla
nt
Unsp
ecif
ied
1
6.8
× 1
0-1
1
219

TA
BL
E 1
1 T
RO
PIC
AL
EN
VIR
ON
ME
NT
: S
OIL
TO
PL
AN
T T
RA
NS
FE
R F
AC
TO
R (Fv)
VA
LU
ES
FO
R U
(C
on
t.)
Pla
nt
Gro
up
Pla
nt
Co
mp
artm
ent
Soil
Gro
up
N
GM
G
SD
A
M
SD
M
in
Max
#
ref
All
2
8.7
× 1
0-2
1.2
× 1
0-1
1.5
× 1
0-3
1.7
× 1
0-1
2
G
rain
San
d
1
1.5
× 1
0-3
1
Mai
ze
All
pla
nt
Unsp
ecif
ied
1
9.6
× 1
0-1
1
TA
BL
E 1
2. T
RO
PIC
AL
EN
VIR
ON
ME
NT
: S
OIL
TO
PL
AN
T T
RA
NS
FE
R F
AC
TO
R (Fv)
VA
LU
ES
FO
R Z
n
Pla
nt
Gro
up
Pla
nt
Co
mp
artm
ent
Soil
Gro
up
N
GM
G
SD
A
M
SD
M
in
Max
#
ref
All
2
2.2
× 1
01
5.7
×
1.8
× 1
01
2.6
× 1
01
1
San
d
1
1
Cer
eals
G
rain
Loam
1
2.6
× 1
01
1
Gra
in
San
d
12
2.2
× 1
0-1
1.8
2.6
× 1
0-1
1.8
× 1
0-1
1.1
× 1
0-1
7.0
× 1
0-1
1
G
rass
es
Ste
ms
and
sh
oots
S
and
12
2.0
× 1
0-1
1.9
2.5
× 1
0-1
1.7
× 1
0-1
9.5
× 1
0-2
5.7
× 1
0-1
1
All
2
1.8
× 1
01
3.5
1
.5 ×
101
2.0
× 1
01
1
San
d
1
1.5
× 1
01
1
Gra
in
Loam
1
2.0
× 1
01
1
All
2
1.9
× 1
01
5.0
1
.5 ×
101
2.2
× 1
01
1
San
d
1
1.5
× 1
01
1
Lea
ves
Loam
1
2.2
× 1
01
1
All
19
1.5
1.4
1.6
5
.6 ×
10-1
9.3
× 1
0-1
2
.5
1
Leg
um
inous
Veg
etab
les
Cla
y
18
1.5
1.4
1.6
5
.8 ×
10-1
9.3
× 1
0-1
2
.5
1
All
28
1.7
1.6
1.9
7
.8 ×
10-1
5.8
× 1
0-1
3
.4
2
Non-l
eafy
V
eget
able
s F
ruit
s
Cla
y
26
1.7
1.6
1.8
7
.8 ×
10-1
5.8
× 1
0-1
3
.4
1
All
7
1.2
1.8
1.4
6
.8 ×
10-1
5.6
× 1
0-1
2
.2
2
Root
Cro
ps
R
oo
ts
Cla
y
5
1.3
1.8
1.4
7
.1 ×
10-1
5.6
× 1
0-1
2
.2
1
All
4
1.1
1.2
1.1
2
.5 ×
10-1
9.2
× 1
0-1
1
.5
2
Tuber
s T
uber
s C
lay
3
1.1
1.3
1.1
3
.1 ×
10-1
9.2
× 1
0-1
1
.5
1
All
41
1.7
1.4
1.8
6
.7 ×
10-1
7.3
× 1
0-1
4
.8
2
Lea
fy
Veg
etab
les
Lea
ves
Cla
y
39
1.7
1.4
1.8
6
.8 ×
10-1
7.3
× 1
0-1
4
.8
1
220
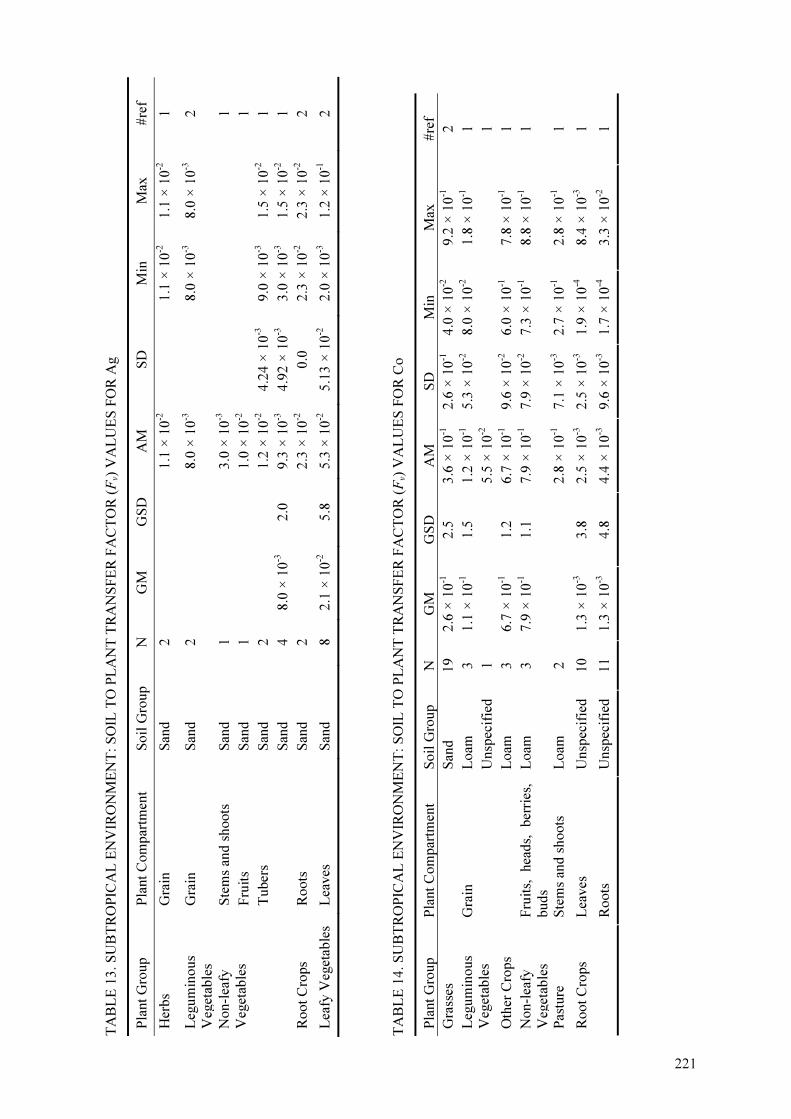
TA
BL
E 1
3.
SU
BT
RO
PIC
AL
EN
VIR
ON
ME
NT
: S
OIL
TO
PL
AN
T T
RA
NS
FE
R F
AC
TO
R (Fv)
VA
LU
ES
FO
R A
g
Pla
nt
Gro
up
Pla
nt
Co
mp
artm
ent
Soil
Gro
up
N
GM
G
SD
A
M
SD
M
in
Max
#
ref
Her
bs
Gra
in
San
d
2
1.1
× 1
0-2
1.1
× 1
0-2
1.1
× 1
0-2
1
Leg
um
inous
Ve g
etab
les
Gra
in
San
d
2
8.0
× 1
0-3
8.0
× 1
0-3
8.0
× 1
0-3
2
Ste
ms
and
sh
oots
S
and
1
3.0
× 1
0-3
1
Fru
its
San
d
1
1.0
× 1
0-2
1
Tu
ber
s S
and
2
1.2
× 1
0-2
4
.24
× 1
0-3
9.0
× 1
0-3
1.5
× 1
0-2
1
Non-l
eafy
Veg
etab
les
S
and
4
8.0
× 1
0-3
2.0
9.3
× 1
0-3
4
.92
× 1
0-3
3.0
× 1
0-3
1.5
× 1
0-2
1
Root
Cro
ps
Ro
ots
S
and
2
2.3
× 1
0-2
0
.0
2.3
× 1
0-2
2.3
× 1
0-2
2
Lea
fy V
eget
able
s L
eaves
S
and
8
2.1
× 1
0-2
5.8
5.3
× 1
0-2
5
.13
× 1
0-2
2.0
× 1
0-3
1.2
× 1
0-1
2
TA
BL
E 1
4.
SU
BT
RO
PIC
AL
EN
VIR
ON
ME
NT
: S
OIL
TO
PL
AN
T T
RA
NS
FE
R F
AC
TO
R (Fv)
VA
LU
ES
FO
R C
o
Pla
nt
Gro
up
Pla
nt
Co
mp
artm
ent
Soil
Gro
up
N
GM
G
SD
A
M
SD
M
in
Max
#
ref
Gra
sses
San
d
19
2.6
× 1
0-1
2.5
3.6
× 1
0-1
2.6
× 1
0-1
4.0
× 1
0-2
9.2
× 1
0-1
2
Gra
in
Loam
3
1.1
× 1
0-1
1.5
1.2
× 1
0-1
5.3
× 1
0-2
8.0
× 1
0-2
1.8
× 1
0-1
1
L
egu
min
ous
Veg
etab
les
U
nsp
ecif
ied
1
5.5
× 1
0-2
1
Oth
er C
rops
L
oam
3
6.7
× 1
0-1
1.2
6.7
× 1
0-1
9.6
× 1
0-2
6.0
× 1
0-1
7.8
× 1
0-1
1
Non-l
eafy
Ve g
etab
les
Fru
its,
hea
ds,
b
erri
es,
bu
ds
Loam
3
7.9
× 1
0-1
1.1
7.9
× 1
0-1
7.9
× 1
0-2
7.3
× 1
0-1
8.8
× 1
0-1
1
Pas
ture
S
tem
s an
d s
ho
ots
L
oam
2
2.8
× 1
0-1
7.1
× 1
0-3
2.7
× 1
0-1
2.8
× 1
0-1
1
Lea
ves
U
nsp
ecif
ied
10
1.3
× 1
0-3
3.8
2.5
× 1
0-3
2.5
× 1
0-3
1.9
× 1
0-4
8.4
× 1
0-3
1
R
oot
Cro
ps
Ro
ots
U
nsp
ecif
ied
11
1.3
× 1
0-3
4.8
4.4
× 1
0-3
9.6
× 1
0-3
1.7
× 1
0-4
3.3
× 1
0-2
1
221

TA
BL
E 1
4.
SU
BT
RO
PIC
AL
EN
VIR
ON
ME
NT
: S
OIL
TO
PL
AN
T T
RA
NS
FE
R F
AC
TO
R (Fv)
VA
LU
ES
FO
R C
o (
Co
nt.
)
Pla
nt
gro
up
Pla
nt
com
par
tmen
t S
oil
gro
up
N
GM
G
SD
A
M
SD
M
in
Max
#
ref
All
19
1.1
× 1
0-1
5.8
3.4
× 1
0-1
4.6
× 1
0-1
4.8
× 1
0-3
1.5
×
3
Lea
ves
Loam
7
5.1
× 1
0-1
2.0
6.2
× 1
0-1
4.0
× 1
0-1
2.0
× 1
0-1
1
.2
1
Ro
ots
L
oam
2
4.7
× 1
0-2
5.1
× 1
0-2
1.1
× 1
0-2
8.3
× 1
0-2
1
Lea
fy-
Veg
etab
les
Ste
ms
and
sh
oots
L
oam
2
1.1
× 1
0-2
1.4
× 1
0-3
1.0
× 1
0-2
1.2
× 1
0-2
1
TA
BL
E 1
5.
SU
BT
RO
PIC
AL
EN
VIR
ON
ME
NT
: S
OIL
TO
PL
AN
T T
RA
NS
FE
R F
AC
TO
R (Fv)
VA
LU
ES
FO
R K
Pla
nt
gro
up
Pla
nt
com
par
tmen
t S
oil
gro
up
N
GM
G
SD
A
M
SD
M
in
Max
#
ref
Gra
sses
S
tem
s, s
ho
ots
33
1.5
1.5
1.6
5
.62
× 1
0-1
6.7
× 1
0-1
2
.84
1
Oth
er C
rops
O
ther
s 3
2.8
2.3
3.5
3
.18
1
.6
7.2
0
1
All
18
2.4
× 1
0-1
1.5
2.5
× 1
0-1
8
.11
× 1
0-2
1.0
× 1
0-1
4
.10
× 1
0-1
1
San
d
6
1.8
× 1
0-1
1.5
1
2.0
× 1
0-1
7
.50
× 1
0-2
1.0
× 1
0-1
2
.70
× 1
0-1
1
Loam
8
2.9
× 1
0-1
1.3
3.0
× 1
0-1
6
.90
× 1
0-2
1.8
× 1
0-1
4
.10
× 1
0-1
1
Tuber
s T
uber
s
Cla
y
4
2.4
× 1
0-1
1.4
2.5
× 1
0-1
6
.85
× 1
0-2
1.5
× 1
0-1
3
.00
× 1
0-1
1
222

TA
BL
E 1
6.
SU
BT
RO
PIC
AL
EN
VIR
ON
ME
NT
: S
OIL
TO
PL
AN
T T
RA
NS
FE
R F
AC
TO
R (Fv)
VA
LU
ES
FO
R C
s
Pla
nt
Gro
up
Pla
nt
Com
par
tmen
t S
oil
Gro
up
N
GM
G
SD
A
M
SD
M
in
Max
#
ref
All
23
3.1
× 1
0-3
2.4
4.8
× 1
0-3
5
.8 ×
10-3
1
.0 ×
10-3
2
.6 ×
10-2
3
G
rain
Loam
15
2.5
× 1
0-3
2.4
4.2
× 1
0-3
6
.4 ×
10-3
1
.0 ×
10-3
2
.6 ×
10-2
2
Cer
eals
Ste
ms
and s
hoots
L
oam
11
1.0
× 1
0-2
1.9
1.2
× 1
0-2
6
.0 ×
10-3
3
.4 ×
10-3
2
.0 ×
10-2
1
A
ll
20
2.0
× 1
0-2
4.3
6.8
× 1
0-2
1
.5 ×
10-1
2
.8 ×
10-3
6
.6 ×
10-1
5
Loam
12
2.1
× 1
0-2
6.3
1.0
× 1
0-1
1
.9 ×
10-1
2
.8 ×
10-3
6
.6 ×
10-1
3
Fru
its
Cla
y
8
1.7
× 1
0-2
2.0
2.1
× 1
0-2
1
.2 ×
10-2
6
.0 ×
10-3
3
.5 ×
10-2
2
Fru
its
Skin
C
lay
1
9.0
× 1
0-3
1
Gra
in
Loam
9
2.7
× 1
0-3
1.3
2.8
× 1
0-3
6
.8 ×
10-4
1
.9 ×
10-3
4
.0 ×
10-3
1
A
ll
51
2.5
× 1
0-1
6.3
8.3
× 1
0-1
1
.1
6.0
× 1
0-3
3
.7
4
Gra
sses
S
tem
s an
d s
hoots
Loam
21
2.7
× 1
0-1
1.6
× 1
01
1.6
1
.5
6.0
× 1
0-3
3
.7
2
All
18
1.1
× 1
0-1
3.9
2.1
× 1
0-1
2
.5 ×
10-1
5
.4 ×
10-3
8
.9 ×
10-1
2
L
oam
8
9.6
× 1
0-2
1.7
1.1
× 1
0-1
5
.8 ×
10-2
4
.6 ×
10-2
1
.90
× 1
0-1
1
L
eaves
Cla
y
8
2.4
× 1
0-1
2.9
3.7
× 1
0-1
3
.1 ×
10-1
5
.1 ×
10-2
8
.9 ×
10-1
1
Fru
it
Cla
y
1
7.0
× 1
0-4
1
Her
bs
Ste
ms,
shoots
U
nsp
ecif
ied
1
6.8
× 1
0-3
1
All
31
1.6
× 1
0-2
4.1
4.5
× 1
0-2
7
.7 ×
10-2
2
.0 ×
10-3
3
.1 ×
10-1
3
L
oam
28
1.5
× 1
0-2
4.1
4.4
× 1
0-2
8
.0 ×
10-2
2
.0 ×
10-3
3
.1 ×
10-1
3
L
egu
min
ous
Veg
etab
les
Gra
in
Cla
y
2
5.9
× 1
0-2
7
.2 ×
10-2
8
.0 ×
10-3
1
.1 ×
10-1
1
Gra
in
Cla
y
1
3.0
× 1
0-4
1
All
10
1.3
× 1
0-1
1.1
× 1
01
5.7
× 1
0-1
6
.5 ×
10-1
3
.7 ×
10-3
1
.9
2
Lea
ves
San
d
4
8.9
× 1
0-3
2.4
1.2
× 1
0-2
1
.2 ×
10-2
3
.7 ×
10-3
2
.9 ×
10-2
1
A
ll
2
6.2
× 1
0-2
3
.0 ×
10-2
4
.0 ×
10-2
8
.3 ×
10-2
2
San
d
1
8.3
× 1
0-2
1
Roots
Loam
1
4.0
× 1
0-2
1
Ste
ms
and s
hoots
U
nsp
ecif
ied
9
5.5
× 1
0-1
2.4
7.5
× 1
0-1
5
.7 ×
10-1
2
.1 ×
10-1
1
.5
1
All
18
6.9
× 1
0-1
9.6
3
.0
4.1
3
.0 ×
10-3
1
.0 ×
101
9
Loam
6
2.4
× 1
0-1
4.6
4.5
× 1
0-1
3
.7 ×
10-1
2
.6 ×
10-2
8
.9 ×
10-1
3
C
lay
2
5.7
× 1
0-2
7
.6 ×
10-2
3
.0 ×
10-3
1
.1 ×
10-1
1
Oth
er C
rops
Oth
ers2
3
7.3
1.8
8
.0
3.4
3
.8
1.0
× 1
01
1
1 N
ame
is b
eyond o
f th
e cl
assi
fica
tio
n s
chem
a use
d .
2 O
ther
s re
fer
to s
awdust
as
a su
bst
rate
wher
e th
is p
lants
gro
up w
as g
row
n.
223

TA
BL
E 1
6.
SU
BT
RO
PIC
AL
EN
VIR
ON
ME
NT
: S
OIL
TO
PL
AN
T T
RA
NS
FE
R F
AC
TO
R (Fv)
VA
LU
ES
FO
R C
s (C
on
t.)
Pla
nt
Gro
up
Pla
nt
Co
mp
artm
ent
Soil
Gro
up
N
GM
G
SD
A
M
SD
M
in
Max
#
ref
All
13
1.9
× 1
0-2
6.5
7.9
× 1
0-2
1.2
× 1
0-1
2.3
× 1
0-3
3.0
× 1
0-1
7
Loam
10
2.5
× 1
0-2
7.8
1.0
× 1
0-1
1.3
× 1
0-1
2.3
× 1
0-3
3.0
× 1
0-1
3
Fru
its,
hea
ds,
ber
ries
, b
uds
Cla
y
3
7.3
× 1
0-3
1.8
8.1
× 1
0-3
4.0
× 1
0-3
4.0
× 1
0-3
1.2
× 1
0-2
2
Lea
ves
L
oam
6
2.6
× 1
0-2
2.1
3.7
× 1
0-2
3.1
× 1
0-2
1.0
× 1
0-2
8.0
× 1
0-2
1
Ro
ots
L
oam
6
5.3
× 1
0-3
3.3
8.7
× 1
0-3
8.3
× 1
0-3
1.0
× 1
0-3
2.3
× 1
0-2
1
A
ll
6
3.2
× 1
0-2
4.1
5.1
× 1
0-2
3.5
× 1
0-2
2.0
× 1
0-3
1.1
× 1
0-1
4
Loam
2
5.0
× 1
0-2
0
.0
5.0
× 1
0-2
5.0
× 1
0-2
1
Non-L
eafy
Veg
etab
les
Cla
y
2
1.7
× 1
0-2
2.1
× 1
0-2
2.0
× 1
0-3
3.1
× 1
0-2
2
All
34
1.9
× 1
0-1
2.5
2.6
× 1
0-1
1.8
× 1
0-1
2.0
× 1
0-2
6.3
× 1
0-1
4
P
astu
re
Ste
ms,
sh
oo
ts
Loam
6
7.5
× 1
0-2
2.8
1.1
× 1
0-1
8.6
× 1
0-2
2.0
× 1
0-2
2.2
× 1
0-1
3
Lea
ves
U
nsp
ecif
ied
10
3.5
× 1
0-2
4.5
8.7
× 1
0-2
1.2
× 1
0-1
3.9
× 1
0-3
3.5
× 1
0-1
1
All
15
1.5
× 1
0-2
4.4
4.1
× 1
0-2
6.4
× 1
0-2
1.4
× 1
0-3
2.3
× 1
0-1
3
Root
crops
Ro
ots
Loam
2
2.6
× 1
0-2
6.4
× 1
0-3
2.1
× 1
0-2
3.0
× 1
0-2
1
All
34
6.5
× 1
0-2
2.4
9.8
× 1
0-2
1.1
× 1
0-1
9.0
× 1
0-3
4.1
× 1
0-1
4
San
d
8
1.5
× 1
0-1
2.3
2.0
× 1
0-1
1.5
× 1
0-1
4.8
× 1
0-2
4.1
× 1
0-1
2
Loam
8
4.2
× 1
0-2
2.0
4.9
× 1
0-2
2.3
× 1
0-2
9.0
× 1
0-3
8.0
× 1
0-2
2
Tuber
s T
uber
s
Cla
y
4
4.7
× 1
0-2
1.6
5.1
× 1
0-2
2.4
× 1
0-2
3.0
× 1
0-2
8.0
× 1
0-2
1
All
35
3.8
× 1
0-2
6.2
1.7
× 1
0-1
3.1
× 1
0-1
1.1
× 1
0-3
1
.4
7
San
d
6
1.0
4 ×
10-2
5.4
9
2.7
1 ×
10-2
3.4
2 ×
10-2
1.1
× 1
0-3
8.9
0 ×
10-2
1
Loam
22
4.1
× 1
0-2
6.0
1.7
× 1
0-1
2.6
× 1
0-1
6.0
× 1
0-3
8.9
× 1
0-1
3
Lea
fy V
eget
able
sL
eaves
Cla
y
1
8.0
× 1
0-3
1
Mai
ze
Gra
in
Cla
y
2
5.0
× 1
0-3
4.2
× 1
0-3
2.0
× 1
0-3
8.0
× 1
0-3
1
2 24

TA
BL
E 1
7.
SU
BT
RO
PIC
AL
EN
VIR
ON
ME
NT
: S
OIL
TO
PL
AN
T T
RA
NS
FE
R F
AC
TO
R (Fv)
VA
LU
ES
FO
R I
Pla
nt
Gro
up
Pla
nt
Co
mp
artm
ent
Soil
Gro
up
N
GM
G
SD
A
M
SD
M
in
Max
#
ref
Gra
in
Unsp
ecif
ied
1
1.5
× 1
0-4
1
Lea
ves
U
nsp
ecif
ied
1
2.0
× 1
0-2
1
Cer
eals
Ste
ms,
sh
oo
ts
Unsp
ecif
ied
3
1.0
× 1
0-2
4.5
2.2
× 1
0-2
3.1
× 1
0-2
4.1
× 1
0-3
5.8
× 1
0-2
1
Lea
ves
U
nsp
ecif
ied
1
2.4
× 1
0-1
1
Her
bs
Ste
ms,
sh
oo
ts
Unsp
ecif
ied
1
1
Leg
um
inous
Veg
etab
les
Gra
in
Unsp
ecif
ied
1
3.0
× 1
0-3
1
Fru
its,
h
eads,
ber
ries
,
bu
ds
Unsp
ecif
ied
3
1.2
× 1
0-3
2.1
1.4
× 1
0-3
1.1
× 1
0-3
6.5
× 1
0-4
2.7
× 1
0-3
2
Lea
ves
U
nsp
ecif
ied
1
4.5
× 1
0-2
1
Non-l
eafy
veg
etab
les
Ro
ots
U
nsp
ecif
ied
1
1.1
× 1
0-2
1
Lea
ves
U
nsp
ecif
ied
1
1.2
× 1
0-1
1
Root
Cro
ps
Ro
ots
U
nsp
ecif
ied
2
5.6
× 1
0-2
7.1
× 1
0-3
5.1
× 1
0-2
6.1
× 1
0-2
1
All
8
3.0
× 1
0-2
2.4
3.9
× 1
0-2
2.7
× 1
0-2
6.7
× 1
0-3
8.0
× 1
0-2
1
L
eaves
San
d
5
3.5
× 1
0-2
2.0
4.1
× 1
0-2
2.1
× 1
0-2
1.2
× 1
0-2
6.3
× 1
0-2
3
Ro
ots
U
nsp
ecif
ied
1
1.3
× 1
0-1
1
Lea
fy V
eget
able
s
Ste
ms
and
sh
oots
U
nsp
ecif
ied
1
3.0
× 1
0-3
1
225
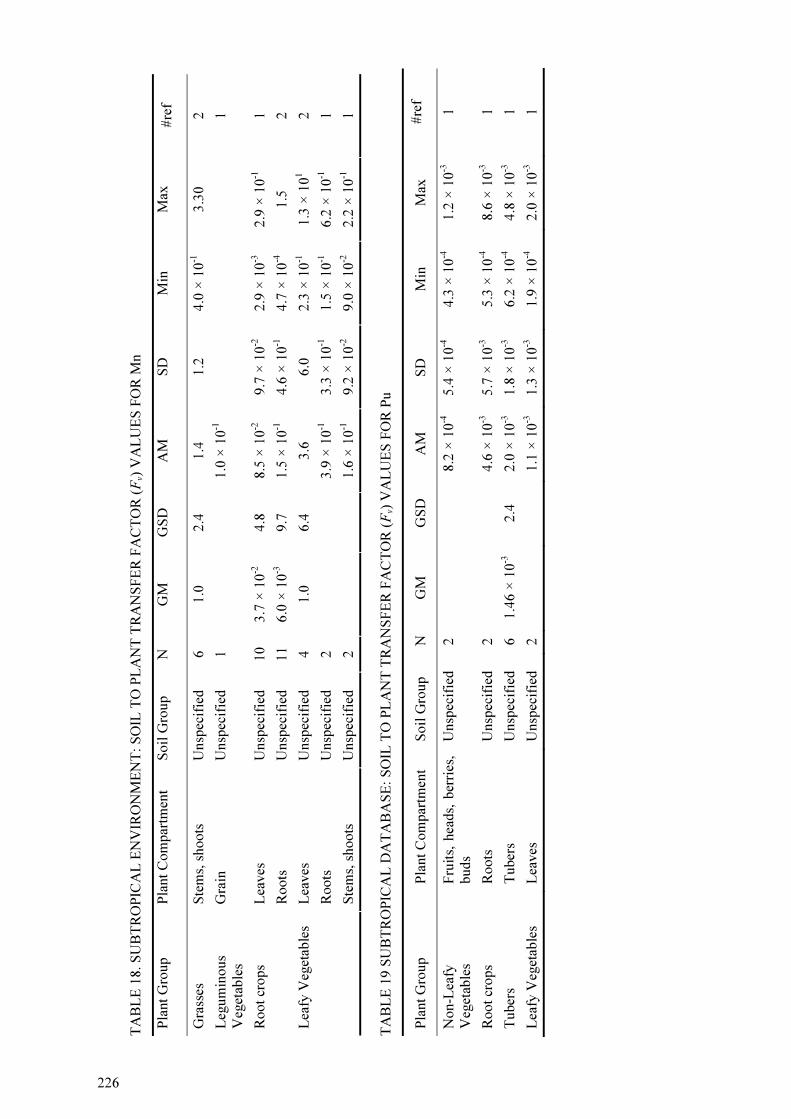
TA
BL
E 1
8.
SU
BT
RO
PIC
AL
EN
VIR
ON
ME
NT
: S
OIL
TO
PL
AN
T T
RA
NS
FE
R F
AC
TO
R (Fv)
VA
LU
ES
FO
R M
n
Pla
nt
Gro
up
Pla
nt
Co
mp
artm
ent
Soil
Gro
up
N
GM
G
SD
A
M
SD
M
in
Max
#
ref
Gra
sses
S
tem
s, s
ho
ots
U
nsp
ecif
ied
6
1.0
2.4
1.4
1
.2
4.0
× 1
0-1
3
.30
2
Leg
um
inous
Veg
etab
les
Gra
in
Unsp
ecif
ied
1
1.0
× 1
0-1
1
Lea
ves
U
nsp
ecif
ied
10
3.7
× 1
0-2
4.8
8.5
× 1
0-2
9.7
× 1
0-2
2.9
× 1
0-3
2.9
× 1
0-1
1
R
oot
crops
Ro
ots
U
nsp
ecif
ied
11
6.0
× 1
0-3
9.7
1.5
× 1
0-1
4.6
× 1
0-1
4.7
× 1
0-4
1
.5
2
Lea
ves
U
nsp
ecif
ied
4
1.0
6.4
3.6
6
.0
2.3
× 1
0-1
1.3
× 1
01
2
Ro
ots
U
nsp
ecif
ied
2
3.9
× 1
0-1
3.3
× 1
0-1
1.5
× 1
0-1
6.2
× 1
0-1
1
Lea
fy V
eget
able
s
Ste
ms,
sh
oo
ts
Unsp
ecif
ied
2
1.6
× 1
0-1
9.2
× 1
0-2
9.0
× 1
0-2
2.2
× 1
0-1
1
TA
BL
E 1
9 S
UB
TR
OP
ICA
L D
AT
AB
AS
E:
SO
IL T
O P
LA
NT
TR
AN
SF
ER
FA
CT
OR
(Fv)
VA
LU
ES
FO
R P
u
Pla
nt
Gro
up
Pla
nt
Co
mp
artm
ent
Soil
Gro
up
NG
M
GS
D
AM
S
D
Min
M
ax
#re
f
Non-L
eafy
V
eget
able
s F
ruit
s, h
eads,
ber
ries
, b
ud
s
Unsp
ecif
ied
2
8.2
× 1
0-4
5.4
× 1
0-4
4.3
× 1
0-4
1.2
× 1
0-3
1
Root
crops
Ro
ots
U
nsp
ecif
ied
2
4.6
× 1
0-3
5.7
× 1
0-3
5.3
× 1
0-4
8.6
× 1
0-3
1
Tuber
s T
uber
s U
nsp
ecif
ied
6
1.4
6 ×
10-3
2.4
2.0
× 1
0-3
1.8
× 1
0-3
6.2
× 1
0-4
4.8
× 1
0-3
1
Lea
fy V
eget
able
s L
eaves
U
nsp
ecif
ied
2
1.1
× 1
0-3
1.3
× 1
0-3
1.9
× 1
0-4
2.0
× 1
0-3
1
226
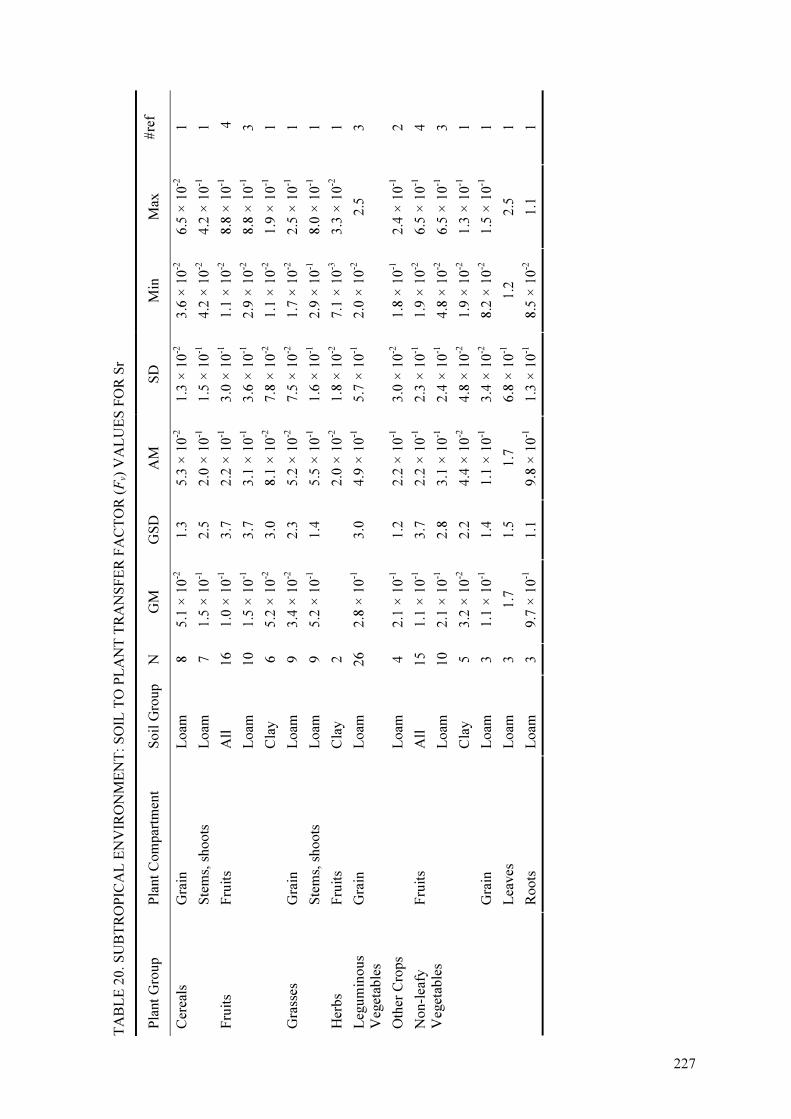
TA
BL
E 2
0.
SU
BT
RO
PIC
AL
EN
VIR
ON
ME
NT
: S
OIL
TO
PL
AN
T T
RA
NS
FE
R F
AC
TO
R (Fv)
VA
LU
ES
FO
R S
r
Pla
nt
Gro
up
Pla
nt
Co
mp
artm
ent
Soil
Gro
up
N
GM
G
SD
A
M
SD
M
in
Max
#
ref
Gra
in
Loam
8
5.1
× 1
0-2
1.3
5.3
× 1
0-2
1.3
× 1
0-2
3.6
× 1
0-2
6.5
× 1
0-2
1
C
erea
ls
Ste
ms,
sh
oo
ts
Loam
7
1.5
× 1
0-1
2.5
2.0
× 1
0-1
1.5
× 1
0-1
4.2
× 1
0-2
4.2
× 1
0-1
1
All
16
1.0
× 1
0-1
3.7
2.2
× 1
0-1
3.0
× 1
0-1
1.1
× 1
0-2
8.8
× 1
0-1
4
Loam
10
1.5
× 1
0-1
3.7
3.1
× 1
0-1
3.6
× 1
0-1
2.9
× 1
0-2
8.8
× 1
0-1
3
Fru
its
Fru
its
Cla
y
6
5.2
× 1
0-2
3.0
8.1
× 1
0-2
7.8
× 1
0-2
1.1
× 1
0-2
1.9
× 1
0-1
1
Gra
in
Loam
9
3.4
× 1
0-2
2.3
5.2
× 1
0-2
7.5
× 1
0-2
1.7
× 1
0-2
2.5
× 1
0-1
1
G
rass
es
Ste
ms,
sh
oo
ts
Loam
9
5.2
× 1
0-1
1.4
5.5
× 1
0-1
1.6
× 1
0-1
2.9
× 1
0-1
8.0
× 1
0-1
1
Her
bs
Fru
its
Cla
y
2
2.0
× 1
0-2
1.8
× 1
0-2
7.1
× 1
0-3
3.3
× 1
0-2
1
Leg
um
inous
Veg
etab
les
Gra
in
Loam
26
2.8
× 1
0-1
3.0
4.9
× 1
0-1
5.7
× 1
0-1
2.0
× 1
0-2
2
.5
3
Oth
er C
rops
L
oam
4
2.1
× 1
0-1
1.2
2.2
× 1
0-1
3.0
× 1
0-2
1.8
× 1
0-1
2.4
× 1
0-1
2
All
15
1.1
× 1
0-1
3.7
2.2
× 1
0-1
2.3
× 1
0-1
1.9
× 1
0-2
6.5
× 1
0-1
4
Loam
10
2.1
× 1
0-1
2.8
3.1
× 1
0-1
2.4
× 1
0-1
4.8
× 1
0-2
6.5
× 1
0-1
3
Fru
its
Cla
y
5
3.2
× 1
0-2
2.2
4.4
× 1
0-2
4.8
× 1
0-2
1.9
× 1
0-2
1.3
× 1
0-1
1
Gra
in
Loam
3
1.1
× 1
0-1
1.4
1.1
× 1
0-1
3.4
× 1
0-2
8.2
× 1
0-2
1.5
× 1
0-1
1
Lea
ves
L
oam
3
1.7
1.5
1.7
6
.8 ×
10-1
1
.2
2.5
1
Non-l
eafy
V
eget
able
s
Ro
ots
L
oam
3
9.7
× 1
0-1
1.1
9.8
× 1
0-1
1.3
× 1
0-1
8.5
× 1
0-2
1
.1
1
227
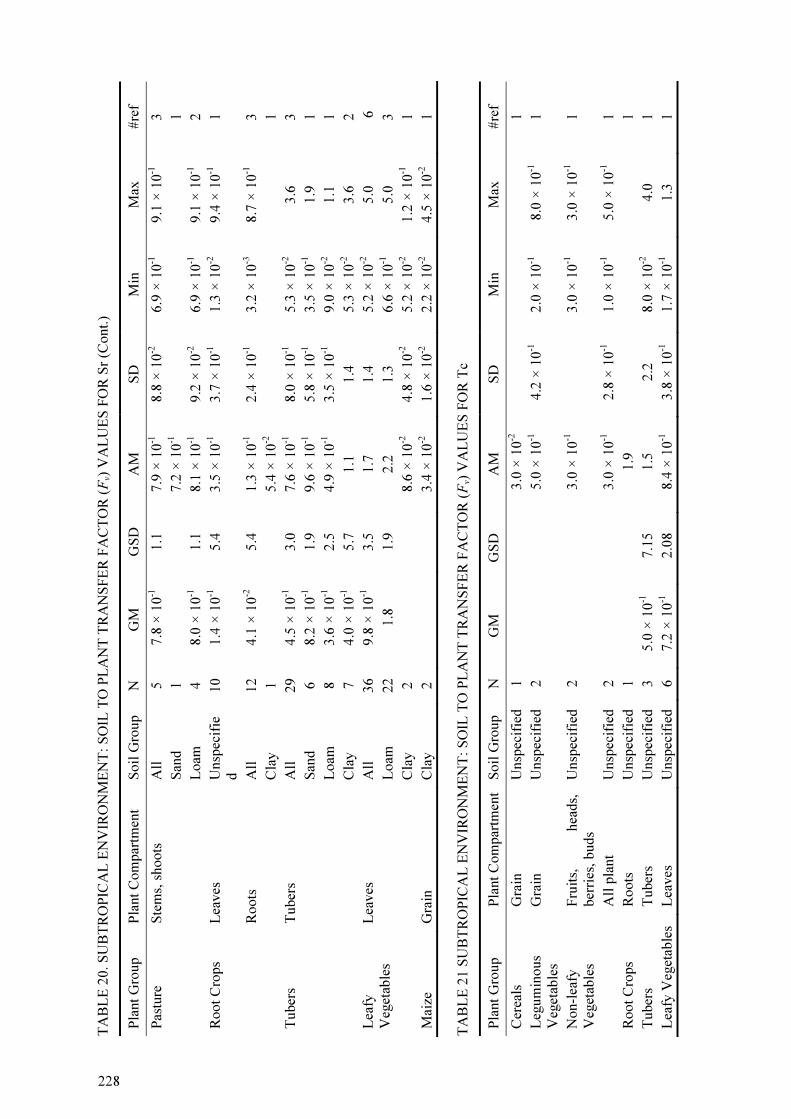
TA
BL
E 2
0.
SU
BT
RO
PIC
AL
EN
VIR
ON
ME
NT
: S
OIL
TO
PL
AN
T T
RA
NS
FE
R F
AC
TO
R (Fv)
VA
LU
ES
FO
R S
r (C
on
t.)
Pla
nt
Gro
up
Pla
nt
Co
mp
artm
ent
Soil
Gro
up
N
GM
G
SD
A
M
SD
M
in
Max
#
ref
All
5
7.8
× 1
0-1
1.1
7.9
× 1
0-1
8.8
× 1
0-2
6.9
× 1
0-1
9.1
× 1
0-1
3
San
d
1
7.2
× 1
0-1
1
Pas
ture
S
tem
s, s
ho
ots
Loam
4
8.0
× 1
0-1
1.1
8.1
× 1
0-1
9.2
× 1
0-2
6.9
× 1
0-1
9.1
× 1
0-1
2
Lea
ves
U
nsp
ecif
ied
10
1.4
× 1
0-1
5.4
3.5
× 1
0-1
3.7
× 1
0-1
1.3
× 1
0-2
9.4
× 1
0-1
1
All
12
4.1
× 1
0-2
5.4
1.3
× 1
0-1
2.4
× 1
0-1
3.2
× 1
0-3
8.7
× 1
0-1
3
Root
Cro
ps
Ro
ots
Cla
y
1
5.4
× 1
0-2
1
All
29
4.5
× 1
0-1
3.0
7.6
× 1
0-1
8.0
× 1
0-1
5.3
× 1
0-2
3
.6
3
San
d
6
8.2
× 1
0-1
1.9
9.6
× 1
0-1
5.8
× 1
0-1
3.5
× 1
0-1
1
.9
1
Loam
8
3.6
× 1
0-1
2.5
4.9
× 1
0-1
3.5
× 1
0-1
9.0
× 1
0-2
1
.1
1
Tuber
s T
uber
s
Cla
y
7
4.0
× 1
0-1
5.7
1.1
1
.4
5.3
× 1
0-2
3
.6
2
All
36
9.8
× 1
0-1
3.5
1.7
1
.4
5.2
× 1
0-2
5
.0
6
Loam
22
1.8
1.9
2.2
1
.3
6.6
× 1
0-1
5
.0
3
Lea
fy
Veg
etab
les
Lea
ves
Cla
y
2
8.6
× 1
0-2
4.8
× 1
0-2
5.2
× 1
0-2
1.2
× 1
0-1
1
Mai
ze
Gra
in
Cla
y
2
3.4
× 1
0-2
1.6
× 1
0-2
2.2
× 1
0-2
4.5
× 1
0-2
1
TA
BL
E 2
1 S
UB
TR
OP
ICA
L E
NV
IRO
NM
EN
T:
SO
IL T
O P
LA
NT
TR
AN
SF
ER
FA
CT
OR
(Fv)
VA
LU
ES
FO
R T
c
Pla
nt
Gro
up
Pla
nt
Co
mp
artm
ent
Soil
Gro
up
N
GM
G
SD
A
M
SD
M
in
Max
#
ref
Cer
eals
G
rain
U
nsp
ecif
ied
1
3.0
× 1
0-2
1
Leg
um
inous
Veg
etab
les
Gra
in
Unsp
ecif
ied
2
5.0
× 1
0-1
4.2
× 1
0-1
2.0
× 1
0-1
8.0
× 1
0-1
1
Fru
its,
h
eads,
ber
ries
, b
uds
Unsp
ecif
ied
2
3.0
× 1
0-1
3.0
× 1
0-1
3.0
× 1
0-1
1
N
on-l
eafy
Veg
etab
les
All
pla
nt
Unsp
ecif
ied
2
3.0
× 1
0-1
2.8
× 1
0-1
1.0
× 1
0-1
5.0
× 1
0-1
1
Root
Cro
ps
Ro
ots
U
nsp
ecif
ied
1
1.9
1
Tuber
s T
uber
s U
nsp
ecif
ied
3
5.0
× 1
0-1
7.1
5
1.5
2
.2
8.0
× 1
0-2
4
.0
1
Lea
fy V
eget
able
s L
eaves
U
nsp
ecif
ied
6
7.2
× 1
0-1
2.0
8
8.4
× 1
0-1
3.8
× 1
0-1
1.7
× 1
0-1
1
.3
1
2 28
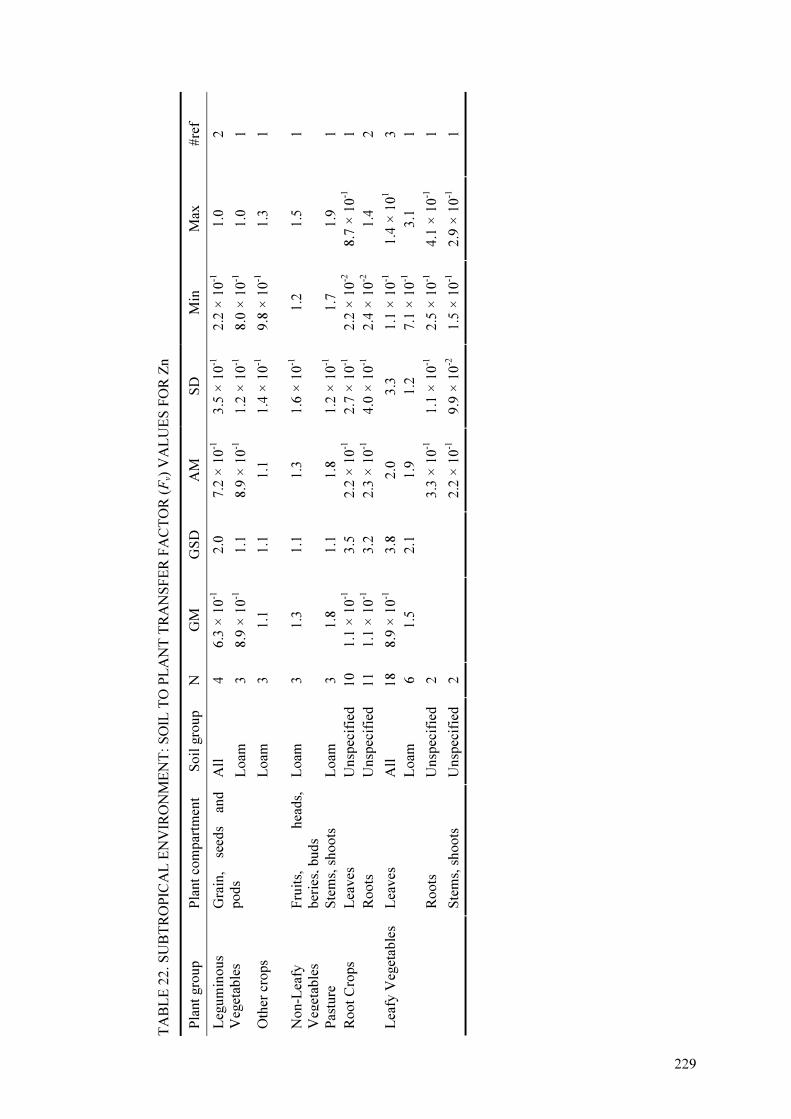
TA
BL
E 2
2.
SU
BT
RO
PIC
AL
EN
VIR
ON
ME
NT
: S
OIL
TO
PL
AN
T T
RA
NS
FE
R F
AC
TO
R (Fv)
VA
LU
ES
FO
R Z
n
Pla
nt
gro
up
Pla
nt
com
par
tmen
t S
oil
gro
up
N
GM
G
SD
A
M
SD
M
in
Max
#
ref
All
4
6.3
× 1
0-1
2.0
7.2
× 1
0-1
3.5
× 1
0-1
2.2
× 1
0-1
1
.0
2
Leg
um
inous
Veg
etab
les
Gra
in,
seed
s an
d
po
ds
Loam
3
8.9
× 1
0-1
1.1
8.9
× 1
0-1
1.2
× 1
0-1
8.0
× 1
0-1
1
.0
1
Oth
er c
rops
L
oam
3
1.1
1.1
1.1
1
.4 ×
10-1
9.8
× 1
0-1
1
.3
1
Non-L
eafy
V
e get
able
s F
ruit
s,
hea
ds,
ber
ies,
bu
ds
Loam
3
1.3
1.1
1.3
1
.6 ×
10-1
1
.2
1.5
1
Pas
ture
S
tem
s, s
ho
ots
L
oam
31.8
1.1
1.8
1.2
× 1
0-1
1.7
1.9
1
Lea
ves
U
nsp
ecif
ied
10
1.1
× 1
0-1
3.5
2.2
× 1
0-1
2.7
× 1
0-1
2.2
× 1
0-2
8.7
× 1
0-1
1
Root
Cro
ps
Ro
ots
U
nsp
ecif
ied
11
1.1
× 1
0-1
3.2
2.3
× 1
0-1
4.0
× 1
0-1
2.4
× 1
0-2
1
.4
2
All
18
8.9
× 1
0-1
3.8
2.0
3.3
1.1
× 1
0-1
1.4
× 1
01
3
Lea
ves
Loam
6
1.5
2.1
1.9
1
.2
7.1
× 1
0-1
3
.1
1
Ro
ots
U
nsp
ecif
ied
2
3.3
× 1
0-1
1.1
× 1
0-1
2.5
× 1
0-1
4.1
× 1
0-1
1
Lea
fy V
eget
able
s
Ste
ms,
sh
oo
ts
Unsp
ecif
ied
2
2.2
× 1
0-1
9.9
× 1
0-2
1.5
× 1
0-1
2.9
× 1
0-1
1
229

230
4. EVALUATION OF THE DATA ON RADIONUCLIDE TRANSFERS TO PLANTS IN
TROPICAL AND SUBTROPICAL ENVIRONMENTS
Altogether, experiments performed in the tropical and sub-tropical environments provided
information on 15 radionuclides. Of the available data, 29% were related to 137
Cs, 17% to 90
Sr, 16% to neutron activation products (Co, Zn, Mn), around 21% to naturally occurring
radionuclides, and around 17% to other radionuclides (Ag, Am, Pu, Tc etc.).
The statistical parameters of radionuclide transfers from all studied soils to all studied plants
are given in Table 23. For most cases, the orders of magnitude of difference between
maximum and minimum Fv values were larger than a factor of three, reaching a factor of five
for radiocaesium transfers in tropical environments.
The coefficient of variation (ratio of the standard deviation to the mean–CV) was, in all these
cases, larger than one. CVs for Cs were 2.6 and 3.2, respectively, for tropical and subtropical
environments. The maximum variability was found for Ra transfers to plants in tropical
environments (CV = 4).
For Cs, arithmetic and geometric mean values calculated for the tropical environments were
one order of magnitude higher than those calculated for subtropical environments. Similar
behavior was observed for Sr. However, this difference is chiefly attributable to the different
plants considered for each climatic region.
For both tropical and subtropical environments, the highest Fv values were observed for Zn
and Sr (geometric means for the entire set of data for these radionuclides were 1.2 and 0.96
for tropical environments, and 0.41 and 0.24 for subtropical environments). The lowest Fv
value were those for Th (geometric mean of 4.0 × 10⁻⁴
). Geometric means for Cs for these
data sets were 0.21 for tropical and 0.05 for subtropical environments.
TABLE 23 MAIN RADIONUCLIDES IN TROPICAL AND SUBTROPICAL DATABASES: STATISTICAL VALUES
Tropical Subtropical Elem.
N AM GM CV DIF N AM GM CV DIF
Co 100 4.5 × 10⁻¹ 1.0 × 10⁻¹ 1.5 4 82 2.5 × 10⁻¹ 4.5 × 10⁻² 1.3 4
Cs 278 1.6 2.1 × 10⁻¹ 2.6 5 409 3.6 × 10⁻¹ 4.9 × 10⁻² 3.2 4
I - - - - - 27 4.5 × 10⁻² 1.6 × 10⁻² 1.3 3
Pb 67 1.4 × 10⁻¹ 1.3 × 10⁻² 1.6 4 - - - - -
Ra 275 2.5 6.2 × 10⁻² 4.0 5 - - - - -
Sr 140 3.4 9.6 × 10⁻¹ 1.9 4 209 6.3 × 10⁻¹ 2.4 × 10⁻¹ 1.4 3
U 179 2.3 × 10⁻¹ 6.1 × 10⁻² 1.3 3 - - - - -
Zn 129 2.3 1.2 1.8 3 59 1.0 4.1 × 10⁻¹ 1.9 2
* Orders of magnituded of difference between maximum and minimum values.

231
Statistical distributions of soil-to-plant transfer factors for some plant groups were examined
when a reasonable quantity of Fv values were available. Transfer factor distributions were
analysed for various combinations of environment/plant group/radionuclide (Table 24). In
every case, it was found that the uncertainity in assessment of transfer factor values was
significantly less than that for the case when only environment/radionuclide combinations
were considered (Table 23). In most cases, when the Shapiro-Wilk normality test [11, 19] was
applied to the data set, the data were acceptably fitted by a lognormal distribution. The last
column of Table 24 gives information on the coefficient of variation for the lognormal
distribution:
CVlog=exp(µ)[exp(σ2)-1]
1/2
where µ and σ the mean and the standard deviation of ln(Fv).
Exploring the influence of soil group on radionuclide transfer factors was difficult due to
insufficient data clusters involving the same combinations of environment/plant
group/radionuclide/ for different soil types.
In the case of the Cs transfer to Tubers, a substantial difference was observed. Sand soil
showed a significantly larger transfer than clay or Loam soils. Transfer of Cs to Fruits shows
similar behavior on Clay and Loam soils, though with greater variability in the later case, and
a relatively larger AM value. The transfer of Sr to Tubers is greatest in Sand soils. In the case
of K and transfers from soil to Tuber plants, Loam soil shows the greatest transfer, whereas
for Sand soil, the transfer is less.
CONCLUSIONS
As it is was found in the current and in the previous section, Fv values present a wide
variability which constitutes a strong limitation for their application. The concentration of a
radionuclide in a soil is not the only factor influencing its uptake by plants. Mean values
reported in this investigation would be used only as a tendency for the radionuclide transfer
from soil to plants. In this paper more than 2200 Fv values from tropical and subtropical
environments were statistically analyzed with the purpose of exploring the influence of crop
types and soil properties on the radionuclide uptake by plants. Various radionuclides have
been examined, however more information was found for radioisotopes of Cs, Ra, Sr, U, Zn
and Co.
The foremost results obtained are the following.
Wide Fv variability was found for all radionuclides when data were unified for all plants and
soils. CV ranged from 1.3 to 4.0 (Table 23). The difference in the orders of magnitude
between maximum and minimum Fv values ranged from 2 (Zn) to 5 (Cs).

232
When different soil group/plant type combinations are separately considered Fv variability
was markedly lower. In most combinations, CV is less than 2. Additionally, it was found that
for many combinations Fv reasonably fit a log-normal probability distribution (see Table 24).
For most plant groups, Zn and Sr present the highest Fv. Th and U present the lowest Fv
values. A relatively high transfer is found for Ra accumulation in grasses. Transfer factors for
Cs present an intermediate value.
Although more detailed further analysis is still necessary, the derived data allows the
preliminarily conclusion that Fv values assessed for the ‘all soils’ soil group based on the
tropical database tend to be higher that those defined based on subtropical database.
TABLE 24 TRANSFER FACTOR PROBABILITY DISTRIBUTIONS AND COEFFICIENTS OF VARIATION FOR DIFFERENT ENVIRONMENT (PLANT GROUP) RADIONUCLIDE COMBINATIONS
Environment Plant Group Rad. Probability distribution CV CVlog Cs - 2.2 - Pb Lognormal 1.0 0.9 Ra Lognormal 2.3 2.7 Sr - 1.9 - U - 0.3 -
Grasses
Zn Lognormal 0.7 0.7 Co Lognormal 1.0 1.0 Cs - 2.0 - Pb Lognormal 0.6 1.1 Ra Lognormal 1.4 2.7 Sr - 1.8 - Th Lognormal 1.0 1.2 U Lognormal 1.2 2.4
Leguminous Vegetables
Zn Lognormal 0.4 0.4 Co - 0.6 - Cs - 0.5 - Ra Lognormal 1.5 3.0 Sr Lognormal 0.6 0.7 Th Lognormal 0.7 0.7 U Lognormal 1.4 2.0
Leafy Vegetables
Zn Lognormal 0.4 0.3 Co Lognormal 0.5 0.5 Cs - 1.5 - Ra Lognormal 1.8 4.3 Sr Lognormal 0.8 1.2 U Lognormal 1.8 2.8
Tropical
Non-Leafy Vegetables
Zn Lognormal 0.4 0.5
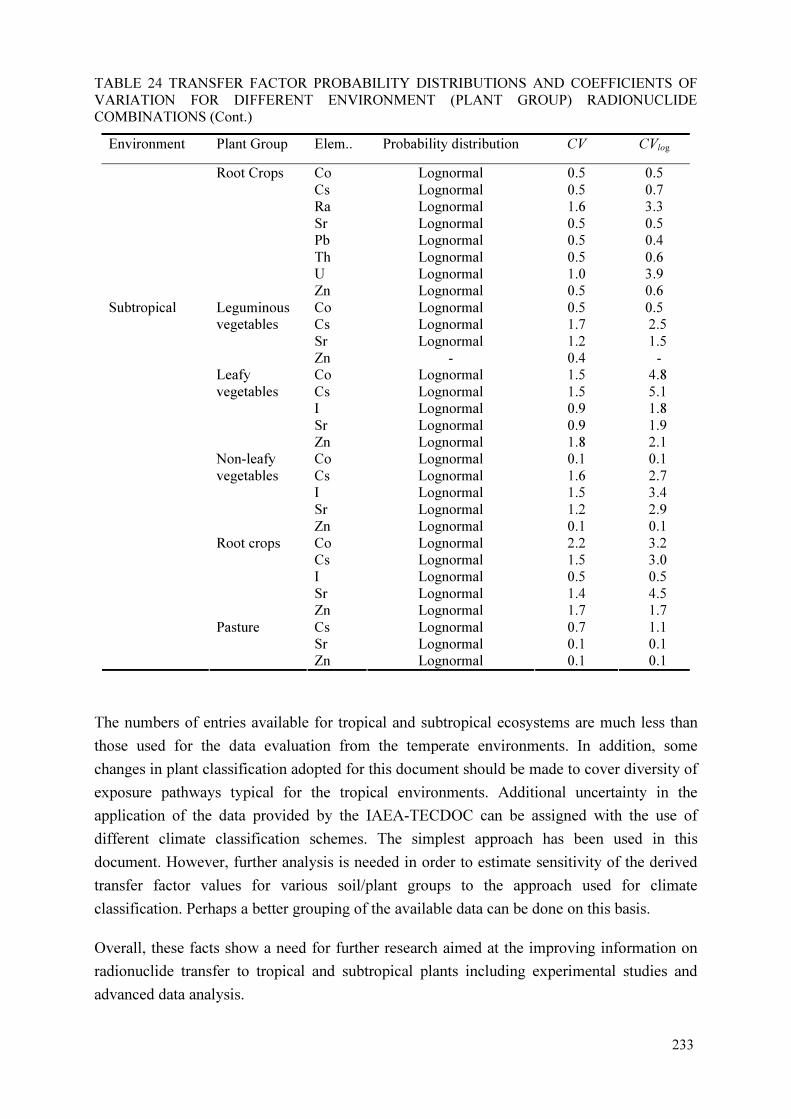
233
TABLE 24 TRANSFER FACTOR PROBABILITY DISTRIBUTIONS AND COEFFICIENTS OF VARIATION FOR DIFFERENT ENVIRONMENT (PLANT GROUP) RADIONUCLIDE COMBINATIONS (Cont.)
Environment Plant Group Elem.. Probability distribution CV CVlog
Co Lognormal 0.5 0.5 Cs Lognormal 0.5 0.7 Ra Lognormal 1.6 3.3 Sr Lognormal 0.5 0.5 Pb Lognormal 0.5 0.4 Th Lognormal 0.5 0.6 U Lognormal 1.0 3.9
Root Crops
Zn Lognormal 0.5 0.6 Co Lognormal 0.5 0.5 Cs Lognormal 1.7 2.5 Sr Lognormal 1.2 1.5
Leguminous vegetables
Zn - 0.4 - Co Lognormal 1.5 4.8 Cs Lognormal 1.5 5.1 I Lognormal 0.9 1.8 Sr Lognormal 0.9 1.9
Leafy vegetables
Zn Lognormal 1.8 2.1 Co Lognormal 0.1 0.1 Cs Lognormal 1.6 2.7 I Lognormal 1.5 3.4 Sr Lognormal 1.2 2.9
Subtropical
Non-leafy vegetables
Zn Lognormal 0.1 0.1 Co Lognormal 2.2 3.2
Cs Lognormal 1.5 3.0 I Lognormal 0.5 0.5 Sr Lognormal 1.4 4.5
Root crops
Zn Lognormal 1.7 1.7 Cs Lognormal 0.7 1.1 Sr Lognormal 0.1 0.1
Pasture
Zn Lognormal 0.1 0.1
The numbers of entries available for tropical and subtropical ecosystems are much less than
those used for the data evaluation from the temperate environments. In addition, some
changes in plant classification adopted for this document should be made to cover diversity of
exposure pathways typical for the tropical environments. Additional uncertainty in the
application of the data provided by the IAEA-TECDOC can be assigned with the use of
different climate classification schemes. The simplest approach has been used in this
document. However, further analysis is needed in order to estimate sensitivity of the derived
transfer factor values for various soil/plant groups to the approach used for climate
classification. Perhaps a better grouping of the available data can be done on this basis.
Overall, these facts show a need for further research aimed at the improving information on
radionuclide transfer to tropical and subtropical plants including experimental studies and
advanced data analysis.

234
REFERENCES
[1] Soil-to-Plant Concentration Factors for Radiological Assessments, Final report, Y.C. Ng, S.E. Thompson, C.S. Colsher, Lawrence Livermore national Laboratory. National Technical Information Service. NUREG/CR-2975 UCID-19463, (1982) 132.
[2] STAVEN, L.H., RHOADS, K., NAPIER, B.A., STRENGE, D.L., A Compendium of Transfer Factors for Agricultural and Animal Products,. PNNL-13421. The U.S. Department of Energy. Washington, (2003) 16.
[3] Environmental Research on Actinide Elements, (J.E. PINDER III, J.J. ALBERTS, K.W. MCLEOD, R.G. SCHRECKHISE Eds.) CONF-841142 (DE86006713) U.S. DOE OHER Symposium Series 59. (1987).
[4] Literature Review and Assessment of Plant and Animal Transfer Factors Used in Performance Assessment Modelling, U.S. Nuclear Regulatory Commission Office of Nuclear Regulatory Research. Washington, DC 20555-0001. (2003) 170.
[5] EWERS, L.W., HAM, G.J., WILKINS, B.T., Review of the Transfer of Naturally Occurring Radionuclides to Terrestrial Plants and Domestic Animals, NRPB-W49. Chilton. Didcot, UK (2003) 64.
[6] FRISSEL, M. J.,. An update of the recommended soil-to-plant transfer factors of 90Sr, 137Cs and transuranics, 8th Report of the Working Group Meeting on Soil-to-Plant Transfer Factors, IUR Madrid (1992) 16-25.
[7] NISBET, A.F., WOODMAN, R.F.M., Soil-to-plant transfer factors for radiocaesium and radiostrontium in agricultural systems, Health Physics 78 (3) (2000) 279-288.
[8] INTERNATIONAL UNION OF RADIOECOLOGY, Assessing the Radiological Impact of Releases of Radionuclides to the Environment: Radioecology. Radioactivity and Ecosystems (VAN DER STRICHT, E., KIRCHMAN, R., EDS), Fortems, Liege (2001) 1-30.
[9] UCHIDA, S., Radionuclides in tropical and subtropical ecosystems, Radioactivity in the Environment 10 (2007) 193-209.
[10] DEVORE, J.L., Probability and statistics for Engineering and the Sciences, 4th Edition, Brooks/Cole Publishing Company, ISBN 0-534-24264-2, (1998).
[11] LIMPERT, E., STAHEL, W., ABBT, M., Log-normal distributions across the Sciences: keys and clues, BioScience, 51 (5) (2001) 341-352.
[12] FRISSEL, M.J., Van BERGEIJK, K.E., “Mean Transfer Values Derived by Simple Statistical Regression Analysis”, VIth Report of the IUR Working group Soil-to-Plant Transfer Factors: Report of the working group meeting in Guttannen Switzerland Bilthoven, RIVM 240 (1989) 24-26.
[13] DEVILLE-CAVELIN, G., BIESOLD, H., CHABANYUK, V., BRUN-YABA, Ch., RUTSCHKOWSKY, N. and FRIEDERICHS, H.G. (2004) Synthesis Report of the Radioecology Project of the French-German Initiative for Chernobyl – FGI Report 04-01.
[14] RUSSIAN INSTITUTE OF AGRICULTURAL RADIOLOGY AND AGROECOLOGY, Annual scientific report. RIARAE, Obninsk (2003) 139.
[15] RUELAS-INZUNZA, J. R., Páez-Osuna F., Comparative bioavailability of trace metals using three filter-feeder organisms in a subtropical coastal environment (Southeast Gulf of California), Environmental Pollution 107(3) (2000) 437-444.
[16] CHIH-YU CHIU, SHU-YIN LAI, YU-MING LIN, HSIEN-CHUEH CHIANG: Distribution of the radionuclide 137Cs in the soils of a wet mountainous forest in Taiwan, Applied Radiation and Isotopes 50(6) (1999) 1097-1103.
[17] BEGON, M., HARPER, J.L. AND TOWNSEND, C.R., Ecology, Individuals, Populations and Communities, Blackwell Scientific Publications Oxford (1987).
[18] INTERNATIONAL ATOMIC ENERGY AGENCY. The classification of soil systems on the basis of transfer factors of radionuclides from soil to reference plants. A FAO/IAEA/IUR Coordinated Research Programme. IAEA, Vienna, (1999).
[19] DEVORE, J.L.,. Probability and Statistics for Engineering and the Sciences, 4th Edition. Brooks/Cole Publishing Company, ISBN 0-534-24264-2 (1998).
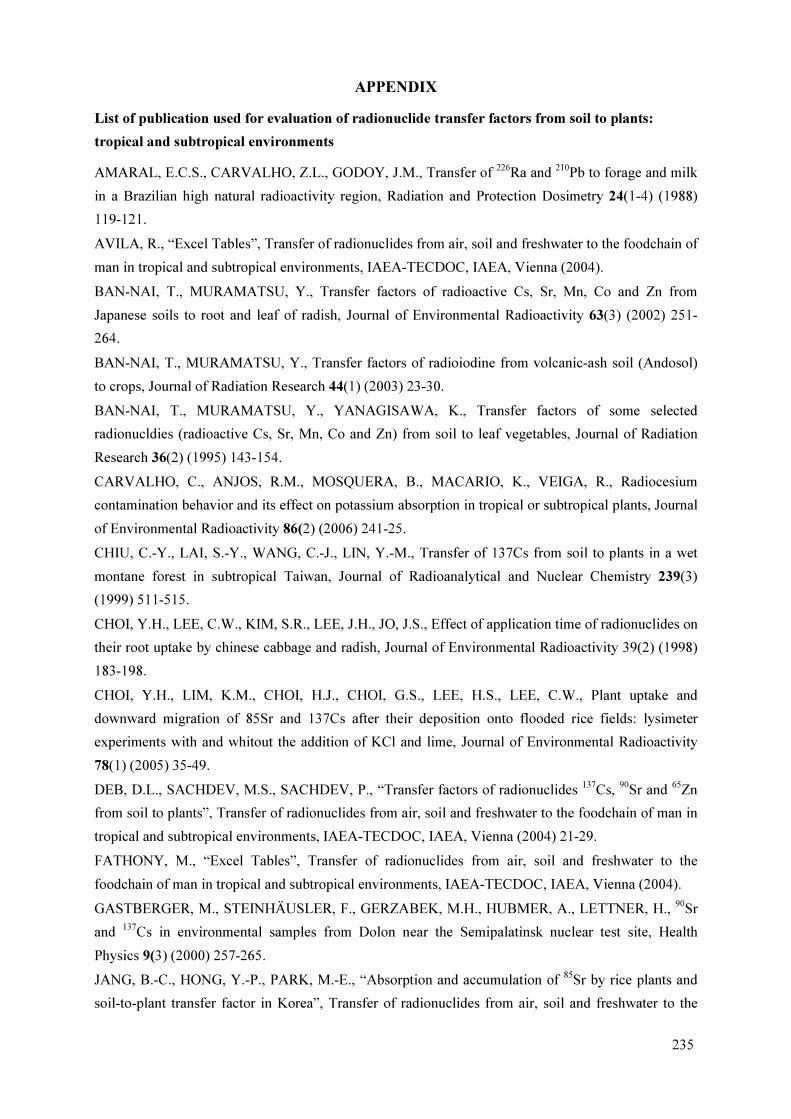
235
APPENDIX
List of publication used for evaluation of radionuclide transfer factors from soil to plants:
tropical and subtropical environments
AMARAL, E.C.S., CARVALHO, Z.L., GODOY, J.M., Transfer of 226Ra and 210Pb to forage and milk
in a Brazilian high natural radioactivity region, Radiation and Protection Dosimetry 24(1-4) (1988)
119-121.
AVILA, R., “Excel Tables”, Transfer of radionuclides from air, soil and freshwater to the foodchain of
man in tropical and subtropical environments, IAEA-TECDOC, IAEA, Vienna (2004).
BAN-NAI, T., MURAMATSU, Y., Transfer factors of radioactive Cs, Sr, Mn, Co and Zn from
Japanese soils to root and leaf of radish, Journal of Environmental Radioactivity 63(3) (2002) 251-
264.
BAN-NAI, T., MURAMATSU, Y., Transfer factors of radioiodine from volcanic-ash soil (Andosol)
to crops, Journal of Radiation Research 44(1) (2003) 23-30.
BAN-NAI, T., MURAMATSU, Y., YANAGISAWA, K., Transfer factors of some selected
radionucldies (radioactive Cs, Sr, Mn, Co and Zn) from soil to leaf vegetables, Journal of Radiation
Research 36(2) (1995) 143-154.
CARVALHO, C., ANJOS, R.M., MOSQUERA, B., MACARIO, K., VEIGA, R., Radiocesium
contamination behavior and its effect on potassium absorption in tropical or subtropical plants, Journal
of Environmental Radioactivity 86(2) (2006) 241-25.
CHIU, C.-Y., LAI, S.-Y., WANG, C.-J., LIN, Y.-M., Transfer of 137Cs from soil to plants in a wet
montane forest in subtropical Taiwan, Journal of Radioanalytical and Nuclear Chemistry 239(3)
(1999) 511-515.
CHOI, Y.H., LEE, C.W., KIM, S.R., LEE, J.H., JO, J.S., Effect of application time of radionuclides on
their root uptake by chinese cabbage and radish, Journal of Environmental Radioactivity 39(2) (1998)
183-198.
CHOI, Y.H., LIM, K.M., CHOI, H.J., CHOI, G.S., LEE, H.S., LEE, C.W., Plant uptake and
downward migration of 85Sr and 137Cs after their deposition onto flooded rice fields: lysimeter
experiments with and whitout the addition of KCl and lime, Journal of Environmental Radioactivity
78(1) (2005) 35-49.
DEB, D.L., SACHDEV, M.S., SACHDEV, P., “Transfer factors of radionuclides 137Cs, 90Sr and 65Zn
from soil to plants”, Transfer of radionuclides from air, soil and freshwater to the foodchain of man in
tropical and subtropical environments, IAEA-TECDOC, IAEA, Vienna (2004) 21-29.
FATHONY, M., “Excel Tables”, Transfer of radionuclides from air, soil and freshwater to the
foodchain of man in tropical and subtropical environments, IAEA-TECDOC, IAEA, Vienna (2004).
GASTBERGER, M., STEINHÄUSLER, F., GERZABEK, M.H., HUBMER, A., LETTNER, H., 90Sr
and 137Cs in environmental samples from Dolon near the Semipalatinsk nuclear test site, Health
Physics 9(3) (2000) 257-265.
JANG, B.-C., HONG, Y.-P., PARK, M.-E., “Absorption and accumulation of 85Sr by rice plants and
soil-to-plant transfer factor in Korea”, Transfer of radionuclides from air, soil and freshwater to the

236
foodchain of man in tropical and subtropical environments, IAEA–TECDOC, IAEA, Vienna (2004)
30-34.
KARUNAKARA N., SOMASHEKARAPPA, H.M., NARAYANA, Y., AVADHANI, D.N.,
MAHESH, H.M., SIDDAPPA, K., 137Cs concentration in the environment of Kaiga of south west
coast of India, Health Physics 81(2) (2001) 48-155.
KARUNAKARA, N., SOMASHEKARAPPA, H.M., NARAYANA, Y., AVADHANI, D.N.,
MAHESH, H.M., SIDDAPPA, K., 226Ra, 40K and 7Be activity concentrations in plants in the
environment of Kaiga, India, Journal of Environmental Radioactivity 3 (2003) 255-266.
KEUM, D-K., LEE, H-S., CHOI, H-J., KANG, H-S., LIM, K-M., CHOI, Y-H., LEE, C-W., A
dynamic compartment model for assessing the transfer of radionuclide deposited onto flooded rice-
fields, Journal of Environmental Radioactivity 76 (2004) 349-367.
LEUNG, J.K.C., SHANG, Z.R., Uptake of 137Cs and 90Sr in rice plant, Health Physics 84(2) (2003)
170-179.
LIN, Y.M., WANG, C.J., LAI, S.Y., “Transfer factors of radionuclides from soil to crops in Taiwan”,
Transfer of radionuclides from air, soil and freshwater to the foodchain of man in tropical and
subtropical environments, IAEA-TECDOC, IAEA, Vienna (2004) 35-43.
MOLLAH, A. S., BEGUM, A., ULLAH, S. M., Determination of soil-to-plant transfer factor of 137Cs
and 90Sr in the tropical environment of Bangladesh, Radiation and Environmental Biophysics 37(2)
(1998) 125-128.
MOLLAH, A.S., BEGUM, A., A study on transfer factors of 60Co and 65Zn from soil to plants in the
tropical environment of Bangladesh, Environmental Monitoring and Assessment 68(1) (2001) 91-97.
MOLLAH, A.S., BEGUM, A., ULLAH, S.M., ZAKIR, H.K., “Studies on radionuclide transfer from
soil and freshwater to the foodchain of man in tropical environment of Bangladesh”, Transfer of
radionuclides from air, soil and freshwater to the foodchain of man in tropical and subtropical
environments, IAEA–TECDOC-, IAEA, Vienna (2004) 44-51.
MURAMATSU, Y., UCHIDA, S., SUMIYA, M., OHMOMO, Y., “Transfer of radioiodine from the
environment to rice plants”, The transfer of Radionuclides in Natural and Seminatural Environments
(Desmet, G., Nasimbeni, P., Belli, M., Eds), Elsevier Applied Science, London (1990) 619-625.
NARAYANA, Y., RADHAKRISHNA, A.P., SOMASHEKARAPPA, H.M., KARUNAKARA, N.,
BALAKRISHNA, K.M., SIDDAPPA, K., Distribution of some natural and artificial radionuclides in
the environment of coastal Karnataka of south India, Journal of Environmental Radioactivity 28(2)
(1995) 113-139.
NGO, N.T., BINH, N.T., “Excel Tables”, Transfer of radionuclides from air, soil and freshwater to the
foodchain of man in tropical and subtropical environments, IAEA–TECDOC-, IAEA, Vienna (2004).
NGUYEN, T.B., NGUYEN, T.N., NGUYEN, V.P., MAI, T.H., LE, N.S., NGUYEN, D.N., VU, T.H.,
PHAM, D.H., VUONG, T.B.C., “Factors of radionuclides transfer from air, soil and fresh water to the
food chain of man in monsoon tropical condition of Vietnam”, Transfer of radionuclides from air, soil
and freshwater to the foodchain of man in tropical and subtropical environments, IAEA-TECDOC,
IAEA, Vienna (2004) 52-68.

237
OSORES REBAZA, “Excel Tables”, Transfer of radionuclides from air, soil and freshwater to the
foodchain of man in tropical and subtropical environments, IAEA–TECDOC-, IAEA, Vienna (2004).
OTHMAN, I., YASSINE, T., ALODAT, M., SHARANEQ, A., “Transfer of 137Cs and 90Sr from
contaminated soil to some crops in Syria”, Transfer of radionuclides from air, soil and freshwater to
the foodchain of man in tropical and subtropical environments, IAEA-TECDOC-, IAEA, Vienna
(2004) 69-75.
RADHAKRISHNA, A.P., SOMASHEKARAPPA, H.M., NARAYANA, Y., SIDDAPPA, K.,
Distribution of some natural and artificial radionuclides in Mangalore environment of south India,
Journal of Environmental Radioactivity 30 1 (1996) 31-54.
RAHMAN, M.M., RAHMAN, M.M., KODDUS, A., AHMAD, G.U., VOIGT, G., Soil-to-plant
transfer of radiocaesium for selected tropical plant species in Bangladesh, Journal of Environmental
Radioactivity 83 2 (2005) 99-211.
ROBINSON, W.L., CONRADO, C.L., “Concentration ratios for foods grown on Bikini island at
Bikini atoll”, Transfer of radionuclides from air, soil and freshwater to the foodchain of man in
tropical and subtropical environments, IAEA-TECDOC, IAEA, Vienna (2004) 76-85.
ROCHEDO, E.R.R., WASSERMAN, M.A., PIRES DO RIO, M.A., The relevance of site specific data
on environmental impact assessment, V Congreso Regional de Protección Radiológica y Seguridad
(2001).
SHANG, Z., LEUNG, J.K.C., A study of 100mAg in aquatic and terrestrial ecosystems, Radiation and
Environmental Biophysics 40(1) (2003) 42-33.
SHANG, Z., Uptake of 137Cs and 90Sr in rice grown on soils from Quinshan and Bay area (in
preparation).
SHANG, Z.R., LEUNG, J.K.C., 110mAg root and foliar uptake in vegetables and its migration in soil,
Journal of Environmental Radioactivity 65(3) (2003) 297-307.
SHIMADA, Y., MORISAWA, S., YONEDA, M., INOUE, Y., A dosimetric determination of 137Cs
ingestion from global fallout and the related risks to japanese, Health physics 74(3) (1998) 316-329.
SIMON, S.L., GRAHAM, J.C., TERP, S.D., Uptake of 40K and 137Cs in native plants of the
Marsshall Islands, Journal of Environmental Radioactivity 59(2) (2002) 223-243.
SINGH, K. P., Uranium uptake by plants, Current Science 73(6) (1997) 532-535
TANG, S., CHEN, Z., LI, H., ZHENG, J., Uptake of 134Cs on the shoots of Amaranthus tricolor and
Amaranthus cruentos, Environmental Pollution 125(3) (2003) 305-312.
TELLAFAR, BANTULLA, SHEIK AMIR, SARTUNG, “Excel Tables”, Transfer of radionuclides
from air, soil and freshwater to the foodchain of man in tropical and subtropical environments, IAEA-
TECDOC, IAEA, Vienna (2004).
TOPCUOGLU, S., KUT, D., ESEN, N., SEDDIGH, E., VARINLIOGLU, A., KÖSE, A., KOCK, C.,
UNLU, M.Y., “Transfer of 137Cs from soil to tea and thyme leaves”, Transfer of radionuclides from
air, soil and freshwater to the foodchain of man in tropical and subtropical environments, IAEA-
TECDOC, IAEA, Vienna (2004) 97-105.
238
TSUKADA, H., HASEGAWA, H., HISAMATSU, S., YAMASAKI, S, Transfer of 137Cs and stable
Cs from paddy soil to polished rice in Aomori, Japan, Journal of Environmental Radioactivity 59(3)
(2002) 351-363.
TSUKADA, H., NAKAMURA, Y., Transfer of 137Cs and stable Cs from soil to potato in agricultural
fields, Science of the Total Environment 228(2-3) (1999) 111-120.
TSUKADA, H., SHIBATA, H., SUGIYAMA, H., Transfer of radiocaesium and stable caesium from
substrata to mushrooms in a pine forest in Rokkasho-mura, Aomori, Japan, Journal of Environmental
Radioactivity 39(2) (1988) 149-160.
TWINING, J.R., “Excel Tables”, Transfer of radionuclides from air, soil and freshwater to the
foodchain of man in tropical and subtropical environments, IAEA-TECDOC, IAEA, Vienna (2004).
TWINING, J.R., FERRIS, J.M., MARKICH, S.J., “Measurements of transfer factor for radionuclides,
including 137Cs and 85Sr, in freshwater fish and plant crops from tropical and subtrpical Australia:
Research summary”, Transfer of radionuclides from air, soil and freshwater to the foodchain of man in
tropical and subtropical environments, IAEA-TECDOC, IAEA, Vienna (2004) 106-114.
TWINING, J.R., PAYNE, T.E., ITAKURA, T., Soil-water distribution coefficients and plant transfer
factors for 134Cs, 85Sr y 65Zn under field conditions in tropical Australia, Journal of Environmental
Radioactivity 71(1) (2004) 71-87.
UCHIDA, S., MURAMATSU, Y., YASUDA, H., BAN-NAI, T., YANAGISAWA, K., “Radionuclide
transfer parameters obtained in Japan`s terrestrial environment”, Transfer of radionuclides from air,
soil and freshwater to the foodchain of man in tropical and subtropical environments, IAEA-
TECDOC, IAEA, Vienna (2004) 117-127.
WANG, C.-J., LAI, S-Y., WANG, J.-J., LIN, Y.-M., Transfer of radionuclides from soil to grass in
northern Taiwan, Applied Radiation and Isotopes 48(2) (1997) 301-303.
WANG, C.-J., WANG, J.-J., CHIU, C.-Y., LAI, S.-Y., LIN, Y.-M., Transfer factors of 90Sr and 137Cs
from soil to the sweet potato collected in Taiwan, Journal of Environmental Radioactivity 47(1)
(2000) 15-27.
WANG, J.-J., WANG, C.-J., HUANG, C.-C., LIN, Y.-M., Transfer factors of 90Sr and 137Cs from
paddy soil to the rice plant in Taiwan, Journal of Environmental Radioactivity 39(1) (1998) 23-34.
WANG, J.-J., WANG, CH.-J., LAI, S.-Y., LIN, Y.-M., Radioactivity concentration of 137Cs and 40K in
Basidiomycetes collected in Taiwan, Applied Radiation and Isotopes 49(1-2) (1998) 29-34.
WASSERMAN, M. A., “Soil-to-plant transfer of 137Cs in tropical areas”, Transfer of radionuclides
from air, soil and freshwater to the foodchain of man in tropical and subtropical environments, IAEA-
TECDOC, IAEA, Vienna (2004) 128-137.
WASSERMAN, M.A., “Excel Tables”, Transfer of radionuclides from air, soil and freshwater to the
foodchain of man in tropical and subtropical environments, IAEA-TECDOC, IAEA, Vienna (2004).
YU, K.N., CHEUNG, T., LUO, D.L., LI, M.F., Factors affecting uptake of 137I in Chinese white
cabbage (Brassica chinensis Linn), Journal of Environmental Radioactivity 49(2) (2000) 209-216.
YU, K.N., MAO, S.Y., YOUNG, E.C.M., Assessment of the transfer factor of 137Cs in three types of
vegetables consumed in Hong Kong, Applied Radiation and Isotopes 49(12) (1998) 1695-1700.

239
TRANSFER TO RICE
S. UCHIDA, K. TAGAMI
National Institute of Radiological Sciences, Anagawa 4-9-1, Inage-ku, Chiba, Japan
Z.R. SHANG
Nuclear and Radiation Safety Centre of State Environmental Protection Administration, Beijing, China
Y.H. CHOI
Korea Atomic Energy Research Institute, Daejeon, Republic of Korea
Abstract
One of the critical foods for the intake of radionuclides by humans is rice (Oryza sativa L.), which is the dominant staple food
crop in humid tropical and sub-tropical countries across the globe. Cultivation methods have important effects on plant
uptake of radionuclides from soil. Most rice is produced under flooded conditions, i.e. in fields with a water layer of 5-15 cm
deep on soil. This is unlike the situation in unsaturated fields where the soil conditions are significantly different, meaning
that the soil-to-rice transfer factors (Fvs) need to be discussed separately from F
v values of other cereals grown under
unsaturated field conditions. In this section, rice refers to the crop grown on wet paddy fields; since water management is the
dominant method for rice cultivation this is the most common type. Rice Fv values were collected from papers in
international journals, books and proceedings with peer reviewing processes and Fv values based on dry weight rice grain
were summarized here. Fv data for fallout isotopes (e.g. 90Sr and 137Cs), neutron activation products (e.g. 54Mn, 60Co, etc.) or
naturally existing radionluclides (e.g. 210Pb, 226Ra, 238U, etc.) and those for naturally existing stable elements under
agricultural field conditions were listed.
1. MAIN FEATURES INFLUENCING RADIONUCLIDE UPTAKE IN RICE
One of the critical foods for determining the intake of radionuclides by humans is rice (Oryza
sativa L.), which is the dominant staple food crop in humid tropical countries across the
globe. Although the total planted area for rice is smaller than that for wheat, more than half of
the world’s population depends on rice as their main source of calories (i.e. rice supplies a
third of their total caloric intake). Almost 90% of the world’s rice is produced and consumed
in Asia. Since the population there is growing, the domestic demand for rice is increasing.
Rice varieties are classified according to their area of cultivation: paddy or wet rice, which is
suited to paddy fields; upland or dry rice, which is suited to dry fields; and floating rice,
which is grown in flood-prone areas. Cultivation methods have important effects on plant
uptake of radionuclides from soil. Most rice is produced under flooded conditions, e.g. in
fields with a water layer of 5-15 cm deep.6 In this paper, rice refers to the crop grown on wet
paddy fields; since water management is the dominant method for rice cultivation, this paddy
6 Rice paddy fields are generally unflooded during the non-cultivated period, however, during the cultivation period, they are
flooded and readily reach reducing conditions in most cases.

240
fields with a water layer of 5-15 cm deep.1 In this chapter, rice refers to the crop grown on wet
paddy fields; since water management is the dominant method for rice cultivation, this paddy
rice is the most common type. In addition, no data are available for upland rice and floating
rice; further studies are needed for these farming technologies.
For paddy rice, no crop rotation is necessary, and rice has been planted in the same places for
hundreds of years. Under flooded conditions, oxygen is depleted relatively quickly by the
respiration of soil microorganisms and plant roots. After the disappearance of molecular
oxygen, various degrees of anaerobiosis occur and the chemical reduction of mineral nutrients
takes place. Subsequently, phosphate and iron species sorbed on the soil particles are
gradually changed to soluble forms, which are easily taken up by rice plants. In addition,
under these conditions, nitrogen is present as the positive ammonium ion, which is efficiently
used by rice plants.
This is unlike the situation in unsaturated fields2 where the soil conditions are significantly
different. Because of this difference, the soil-to-rice transfer factor (Fv) needs to be discussed
separately from Fv values of other cereals grown under unsaturated field conditions. For
instance, in Fig.1, Fv data for stable elements for brown rice samples are compared with those
for cereal samples (wheat and barley ‘WB’: 7 samples) collected in Japan: the comparison is
made by plotting the ratios of Fv-GMs for brown rice divided by Fv-GMs for WB. Most of the
elements, with the exception of K, Fe, As, Sr, and Mo, do not show significant differences (t-
test: p<0.05) with the Fv-GMs of WB.
The Fvs of rare earth elements, Th and U, are amongst the lowest in brown rice and in WB,
and the Fvs tend to be lower in brown rice than in WB. For Sr, the value is significantly higher
for WB; indeed, all alkaline earth metals show higher Fv-GMs for WB than for brown rice. It
should be noted that Sr and other alkaline earth metals, i.e. Ca and Ba, have almost the same
concentrations in paddy fields as in upland field soils [1].
The results indicate it is likely that Ca, Sr and Ba transfers to WB are higher than those to
brown rice. On the other hand, As accumulation is significantly higher in brown rice than in
WB, although As is not an essential element for brown rice. The mechanisms should be
clarified because As can be a toxic element if too much is ingested. Mo and Fe, essential
elements to plants, are redox sensitive so that the waterlogged condition might affect their
mobility in paddy fields. Both Fv similarities and differences exist between wheat and barley
(WB) and brown rice samples.
1 Rice paddy fields are generally unflooded during the non-cultivated period, however, during the cultivation period, they are
flooded and readily reach reducing conditions in most cases. 2 Here unsaturated field conditions extend to soils at field capacity. It is recognized that seasonally saturated soils are used for
arable and pastoral purposes, but this is distinct from the special flooded conditions under which rice is grown. It is also
recognized that some varieties of rice, i.e. upland rice, may be cultivated under unsaturated conditions like other cereal crops.
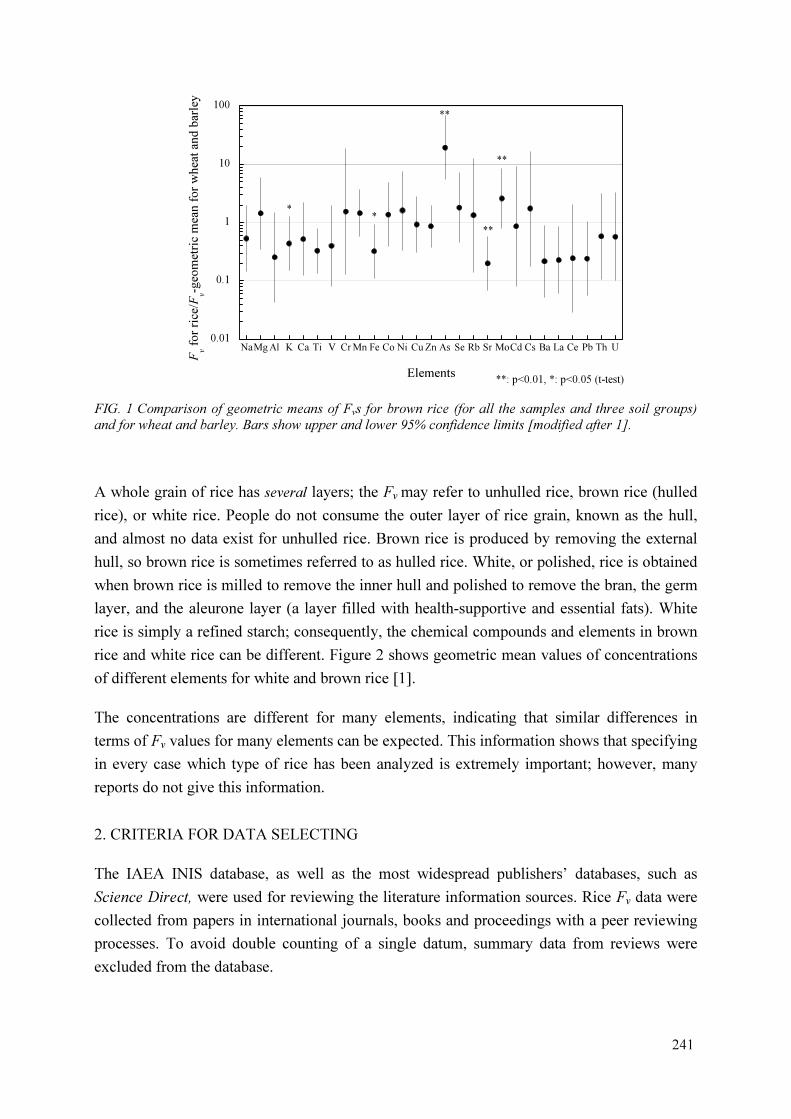
241
0.01
0.1
1
10
100
NaMgAl K Ca Ti V CrMn Fe Co Ni Cu Zn As Se Rb Sr MoCd Cs Ba La Ce Pb Th U
Fv
fo
r ri
ce/F
v
-geo
met
ric
mea
n f
or
wh
eat
and
bar
ley
Elements**: p<0.01, *: p<0.05 (t-test)
**
**
**
**
FIG. 1 Comparison of geometric means of Fvs for brown rice (for all the samples and three soil groups)
and for wheat and barley. Bars show upper and lower 95% confidence limits [modified after 1].
A whole grain of rice has several layers; the Fv may refer to unhulled rice, brown rice (hulled
rice), or white rice. People do not consume the outer layer of rice grain, known as the hull,
and almost no data exist for unhulled rice. Brown rice is produced by removing the external
hull, so brown rice is sometimes referred to as hulled rice. White, or polished, rice is obtained
when brown rice is milled to remove the inner hull and polished to remove the bran, the germ
layer, and the aleurone layer (a layer filled with health-supportive and essential fats). White
rice is simply a refined starch; consequently, the chemical compounds and elements in brown
rice and white rice can be different. Figure 2 shows geometric mean values of concentrations
of different elements for white and brown rice [1].
The concentrations are different for many elements, indicating that similar differences in
terms of Fv values for many elements can be expected. This information shows that specifying
in every case which type of rice has been analyzed is extremely important; however, many
reports do not give this information.
2. CRITERIA FOR DATA SELECTING
The IAEA INIS database, as well as the most widespread publishers’ databases, such as
Science Direct, were used for reviewing the literature information sources. Rice Fv data were
collected from papers in international journals, books and proceedings with a peer reviewing
processes. To avoid double counting of a single datum, summary data from reviews were
excluded from the database.
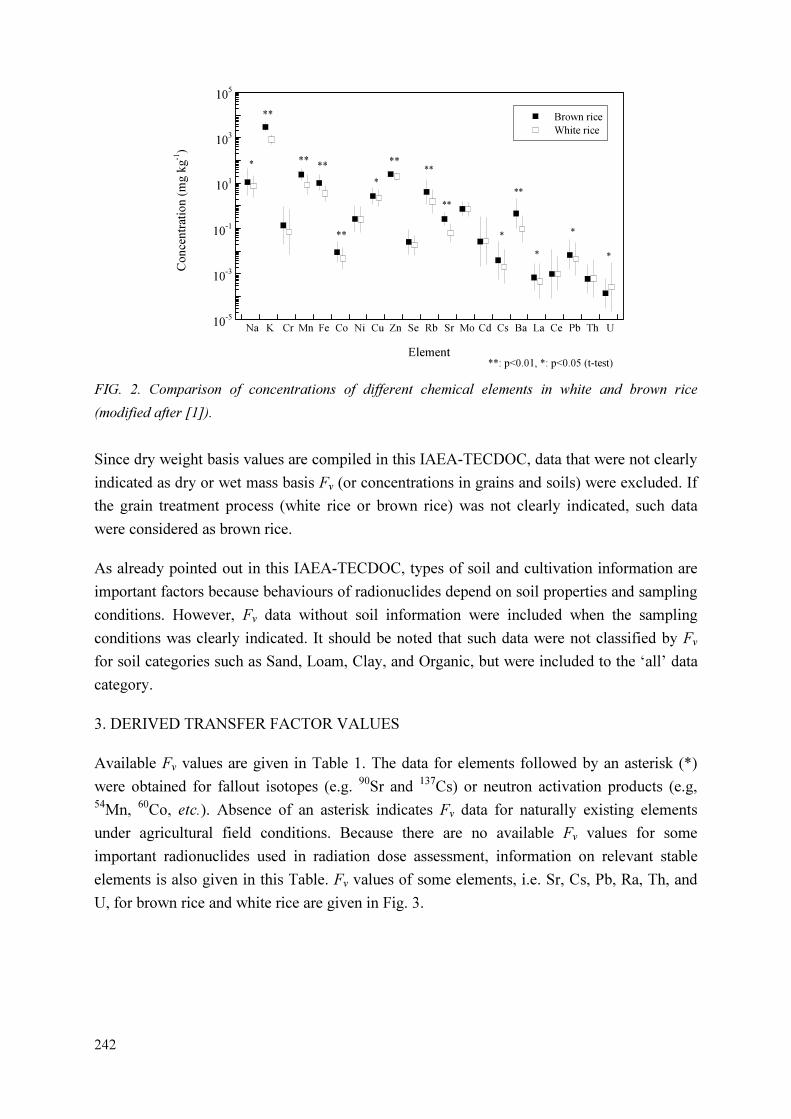
242
10-5
10-3
10-1
101
103
105
Na K Cr Mn Fe Co Ni Cu Zn Se Rb Sr Mo Cd Cs Ba La Ce Pb Th U
Brown rice
White rice
Co
nce
ntr
atio
n (
mg
kg-1
)
Element
**
****
**
*
***
**
**
*
**
*
*
*
**: p<0.01, *: p<0.05 (t-test)
FIG. 2. Comparison of concentrations of different chemical elements in white and brown rice
(modified after [1]).
Since dry weight basis values are compiled in this IAEA-TECDOC, data that were not clearly
indicated as dry or wet mass basis Fv (or concentrations in grains and soils) were excluded. If
the grain treatment process (white rice or brown rice) was not clearly indicated, such data
were considered as brown rice.
As already pointed out in this IAEA-TECDOC, types of soil and cultivation information are
important factors because behaviours of radionuclides depend on soil properties and sampling
conditions. However, Fv data without soil information were included when the sampling
conditions was clearly indicated. It should be noted that such data were not classified by Fv
for soil categories such as Sand, Loam, Clay, and Organic, but were included to the ‘all’ data
category.
3. DERIVED TRANSFER FACTOR VALUES
Available Fv values are given in Table 1. The data for elements followed by an asterisk (*)
were obtained for fallout isotopes (e.g. 90
Sr and 137
Cs) or neutron activation products (e.g, 54
Mn, 60
Co, etc.). Absence of an asterisk indicates Fv data for naturally existing elements
under agricultural field conditions. Because there are no available Fv values for some
important radionuclides used in radiation dose assessment, information on relevant stable
elements is also given in this Table. Fv values of some elements, i.e. Sr, Cs, Pb, Ra, Th, and
U, for brown rice and white rice are given in Fig. 3.
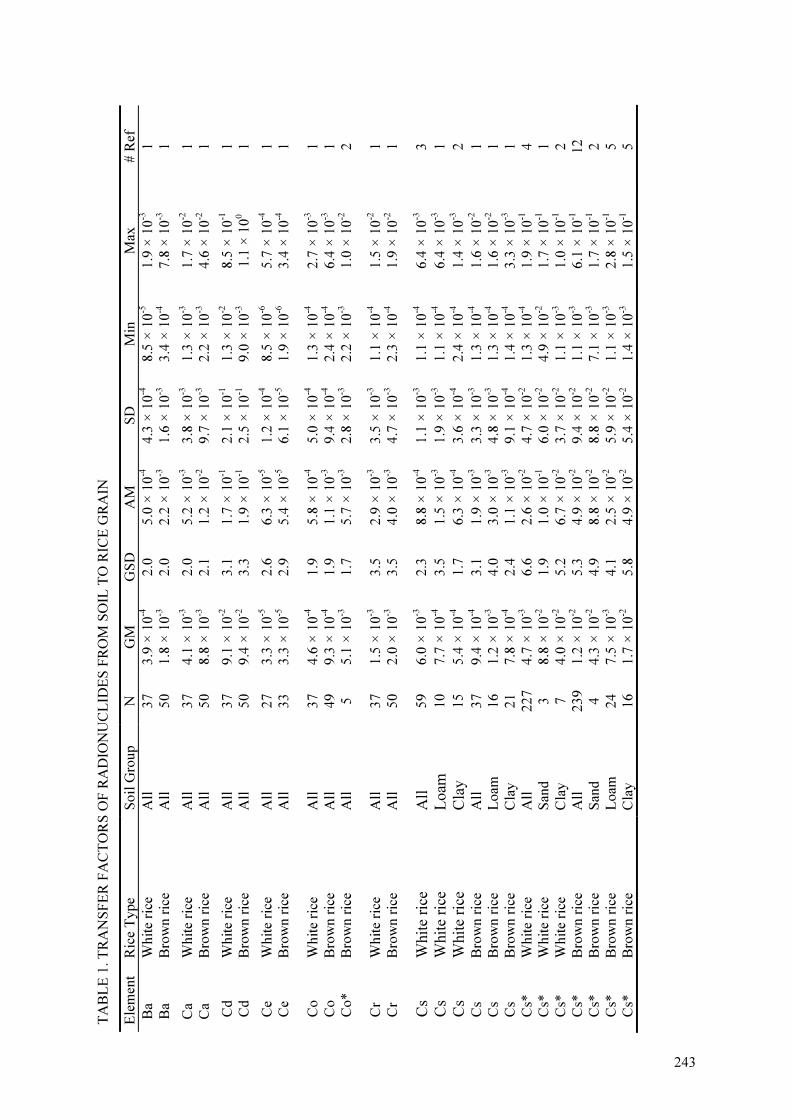
TA
BL
E 1
. T
RA
NS
FE
R F
AC
TO
RS
OF
RA
DIO
NU
CL
IDE
S F
RO
M S
OIL
TO
RIC
E G
RA
IN
Ele
men
t R
ice
Typ
e S
oil
Gro
up
N
GM
G
SD
A
M
SD
M
in
Max
#
Ref
Ba
Whit
e ri
ce
All
37
3.9
× 1
0-4
2.0
5.0
× 1
0-4
4.3
× 1
0-4
8.5
× 1
0-5
1.9
× 1
0-3
1
Ba
Bro
wn
ric
e A
ll
50
1.8
× 1
0-3
2.0
2.2
× 1
0-3
1.6
× 1
0-3
3.4
× 1
0-4
7.8
× 1
0-3
1
Ca
Whit
e ri
ce
All
37
4.1
× 1
0-3
2.0
5.2
× 1
0-3
3.8
× 1
0-3
1.3
× 1
0-3
1.7
× 1
0-2
1
C
a B
row
n r
ice
All
50
8.8
× 1
0-3
2.1
1.2
× 1
0-2
9.7
× 1
0-3
2.2
× 1
0-3
4.6
× 1
0-2
1
Cd
Wh
ite
rice
A
ll
37
9.1
× 1
0-2
3.1
1.7
× 1
0-1
2.1
× 1
0-1
1.3
× 1
0-2
8.5
× 1
0-1
1
C
d
Bro
wn
ric
e A
ll
50
9.4
× 1
0-2
3.3
1.9
× 1
0-1
2.5
× 1
0-1
9.0
× 1
0-3
1.1
× 1
00
1
Ce
Whit
e ri
ce
All
27
3.3
× 1
0-5
2.6
6.3
× 1
0-5
1.2
× 1
0-4
8.5
× 1
0-6
5.7
× 1
0-4
1
C
e B
row
n r
ice
All
33
3.3
× 1
0-5
2.9
5.4
× 1
0-5
6.1
× 1
0-5
1.9
× 1
0-6
3.4
× 1
0-4
1
Co
Wh
ite
rice
A
ll
37
4.6
× 1
0-4
1.9
5.8
× 1
0-4
5.0
× 1
0-4
1.3
× 1
0-4
2.7
× 1
0-3
1
Co
Bro
wn
ric
e A
ll
49
9.3
× 1
0-4
1.9
1.1
× 1
0-3
9.4
× 1
0-4
2.4
× 1
0-4
6.4
× 1
0-3
1
C
o*
Bro
wn
ric
e A
ll
5
5.1
× 1
0-3
1.7
5.7
× 1
0-3
2.8
× 1
0-3
2.2
× 1
0-3
1.0
× 1
0-2
2
Cr
Wh
ite
rice
A
ll
37
1.5
× 1
0-3
3.5
2.9
× 1
0-3
3.5
× 1
0-3
1.1
× 1
0-4
1.5
× 1
0-2
1
Cr
Bro
wn
ric
e A
ll
50
2.0
× 1
0-3
3.5
4.0
× 1
0-3
4.7
× 1
0-3
2.3
× 1
0-4
1.9
× 1
0-2
1
Cs
Wh
ite
rice
A
ll
59
6.0
× 1
0-3
2.3
8.8
× 1
0-4
1.1
× 1
0-3
1.1
× 1
0-4
6.4
× 1
0-3
3
Cs
Wh
ite
rice
L
oam
10
7.7
× 1
0-4
3.5
1.5
× 1
0-3
1.9
× 1
0-3
1.1
× 1
0-4
6.4
× 1
0-3
1
Cs
Wh
ite
rice
C
lay
15
5.4
× 1
0-4
1.7
6.3
× 1
0-4
3.6
× 1
0-4
2.4
× 1
0-4
1.4
× 1
0-3
2
Cs
Bro
wn
ric
e A
ll
37
9.4
× 1
0-4
3.1
1.9
× 1
0-3
3.3
× 1
0-3
1.3
× 1
0-4
1.6
× 1
0-2
1
C
s B
row
n r
ice
Lo
am
16
1.2
× 1
0-3
4.0
3.0
× 1
0-3
4.8
× 1
0-3
1.3
× 1
0-4
1.6
× 1
0-2
1
C
s B
row
n r
ice
Cla
y
21
7.8
× 1
0-4
2.4
1.1
× 1
0-3
9.1
× 1
0-4
1.4
× 1
0-4
3.3
× 1
0-3
1
Cs*
W
hit
e ri
ce
All
227
4.7
× 1
0-3
6.6
2.6
× 1
0-2
4.7
× 1
0-2
1.3
× 1
0-4
1.9
× 1
0-1
4
C
s*
Wh
ite
rice
S
and
3
8.8
× 1
0-2
1.9
1.0
× 1
0-1
6.0
× 1
0-2
4.9
× 1
0-2
1.7
× 1
0-1
1
Cs*
W
hit
e ri
ce
Cla
y
7
4.0
× 1
0-2
5.2
6.7
× 1
0-2
3.7
× 1
0-2
1.1
× 1
0-3
1.0
× 1
0-1
2
C
s*
Bro
wn
ric
e A
ll
239
1.2
× 1
0-2
5.3
4.9
× 1
0-2
9.4
× 1
0-2
1.1
× 1
0-3
6.1
× 1
0-1
1
2
Cs*
B
row
n r
ice
San
d
4
4.3
× 1
0-2
4.9
8.8
× 1
0-2
8.8
× 1
0-2
7.1
× 1
0-3
1.7
× 1
0-1
2
Cs*
B
row
n r
ice
Lo
am
24
7.5
× 1
0-3
4.1
2.5
× 1
0-2
5.9
× 1
0-2
1.1
× 1
0-3
2.8
× 1
0-1
5
C
s*
Bro
wn
ric
e C
lay
16
1.7
× 1
0-2
5.8
4.9
× 1
0-2
5.4
× 1
0-2
1.4
× 1
0-3
1.5
× 1
0-1
5
243
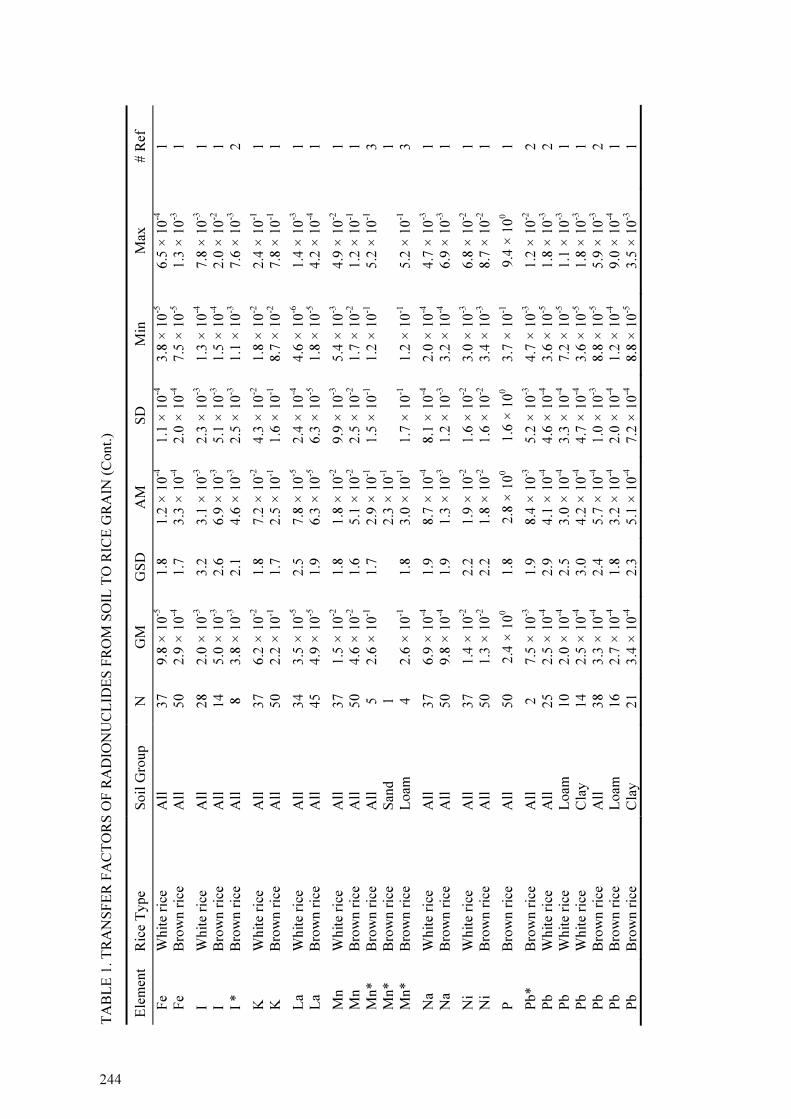
TA
BL
E 1
. T
RA
NS
FE
R F
AC
TO
RS
OF
RA
DIO
NU
CL
IDE
S F
RO
M S
OIL
TO
RIC
E G
RA
IN (
Cont.
)
Ele
men
t R
ice
Typ
e S
oil
Gro
up
N
GM
G
SD
A
M
SD
M
in
Max
#
Ref
Fe
Wh
ite
rice
A
ll
37
9.8
× 1
0-5
1.8
1.2
× 1
0-4
1.1
× 1
0-4
3.8
× 1
0-5
6.5
× 1
0-4
1
Fe
Bro
wn
ric
e A
ll
50
2.9
× 1
0-4
1.7
3.3
× 1
0-4
2.0
× 1
0-4
7.5
× 1
0-5
1.3
× 1
0-3
1
I W
hit
e ri
ce
All
28
2.0
× 1
0-3
3.2
3.1
× 1
0-3
2.3
× 1
0-3
1.3
× 1
0-4
7.8
× 1
0-3
1
I
Bro
wn
ric
e A
ll
14
5.0
× 1
0-3
2.6
6.9
× 1
0-3
5.1
× 1
0-3
1.5
× 1
0-4
2.0
× 1
0-2
1
I *
Bro
wn
ric
e A
ll
8
3.8
× 1
0-3
2.1
4.6
× 1
0-3
2.5
× 1
0-3
1.1
× 1
0-3
7.6
× 1
0-3
2
K
Whit
e ri
ce
All
37
6.2
× 1
0-2
1.8
7.2
× 1
0-2
4.3
× 1
0-2
1.8
× 1
0-2
2.4
× 1
0-1
1
K
B
row
n r
ice
All
50
2.2
× 1
0-1
1.7
2.5
× 1
0-1
1.6
× 1
0-1
8.7
× 1
0-2
7.8
× 1
0-1
1
La
Whit
e ri
ce
All
34
3.5
× 1
0-5
2.5
7.8
× 1
0-5
2.4
× 1
0-4
4.6
× 1
0-6
1.4
× 1
0-3
1
L
a B
row
n r
ice
All
45
4.9
× 1
0-5
1.9
6.3
× 1
0-5
6.3
× 1
0-5
1.8
× 1
0-5
4.2
× 1
0-4
1
Mn
Wh
ite
rice
A
ll
37
1.5
× 1
0-2
1.8
1.8
× 1
0-2
9.9
× 1
0-3
5.4
× 1
0-3
4.9
× 1
0-2
1
M
n
Bro
wn
ric
e A
ll
50
4.6
× 1
0-2
1.6
5.1
× 1
0-2
2.5
× 1
0-2
1.7
× 1
0-2
1.2
× 1
0-1
1
Mn*
Bro
wn
ric
e A
ll
5
2.6
× 1
0-1
1.7
2.9
× 1
0-1
1.5
× 1
0-1
1.2
× 1
0-1
5.2
× 1
0-1
3
M
n*
Bro
wn
ric
e S
and
1
2.3
× 1
0-1
1
Mn*
Bro
wn
ric
e L
oam
4
2.6
× 1
0-1
1.8
3.0
× 1
0-1
1.7
× 1
0-1
1.2
× 1
0-1
5.2
× 1
0-1
3
Na
Wh
ite
rice
A
ll
37
6.9
× 1
0-4
1.9
8.7
× 1
0-4
8.1
× 1
0-4
2.0
× 1
0-4
4.7
× 1
0-3
1
Na
Bro
wn
ric
e A
ll
50
9.8
× 1
0-4
1.9
1.3
× 1
0-3
1.2
× 1
0-3
3.2
× 1
0-4
6.9
× 1
0-3
1
Ni
Wh
ite
rice
A
ll
37
1.4
× 1
0-2
2.2
1.9
× 1
0-2
1.6
× 1
0-2
3.0
× 1
0-3
6.8
× 1
0-2
1
Ni
Bro
wn
ric
e A
ll
50
1.3
× 1
0-2
2.2
1.8
× 1
0-2
1.6
× 1
0-2
3.4
× 1
0-3
8.7
× 1
0-2
1
P
Bro
wn
ric
e A
ll
50
2.4
× 1
00
1.8
2.8
× 1
00
1.6
× 1
00
3.7
× 1
0-1
9.4
× 1
00
1
Pb*
Bro
wn
ric
e A
ll
2
7.5
× 1
0-3
1.9
8.4
× 1
0-3
5.2
× 1
0-3
4.7
× 1
0-3
1.2
× 1
0-2
2
Pb
Wh
ite
rice
A
ll
25
2.5
× 1
0-4
2.9
4.1
× 1
0-4
4.6
× 1
0-4
3.6
× 1
0-5
1.8
× 1
0-3
2
P
b
Wh
ite
rice
L
oam
10
2.0
× 1
0-4
2.5
3.0
× 1
0-4
3.3
× 1
0-4
7.2
× 1
0-5
1.1
× 1
0-3
1
P
b
Wh
ite
rice
C
lay
14
2.5
× 1
0-4
3.0
4.2
× 1
0-4
4.7
× 1
0-4
3.6
× 1
0-5
1.8
× 1
0-3
1
Pb
Bro
wn
ric
e A
ll
38
3.3
× 1
0-4
2.4
5.7
× 1
0-4
1.0
× 1
0-3
8.8
× 1
0-5
5.9
× 1
0-3
2
P
b
Bro
wn
ric
e L
oam
16
2.7
× 1
0-4
1.8
3.2
× 1
0-4
2.0
× 1
0-4
1.2
× 1
0-4
9.0
× 1
0-4
1
Pb
Bro
wn
ric
e C
lay
21
3.4
× 1
0-4
2.3
5.1
× 1
0-4
7.2
× 1
0-4
8.8
× 1
0-5
3.5
× 1
0-3
1
244
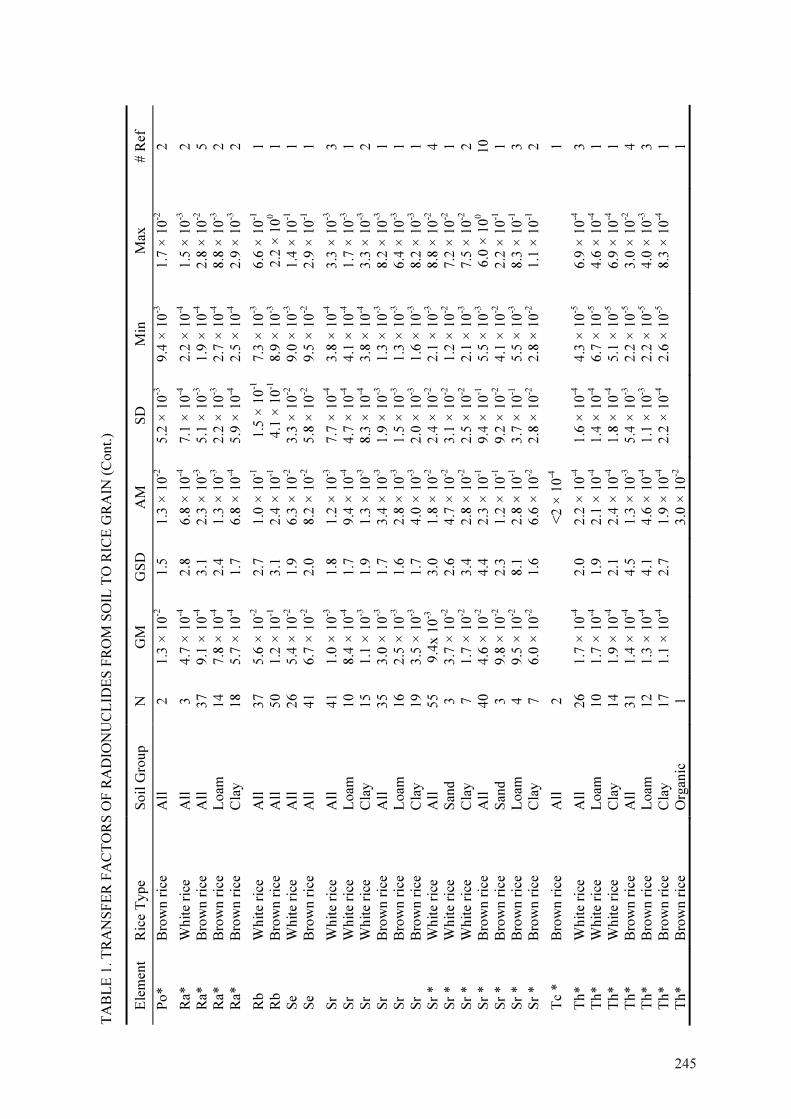
TA
BL
E 1
. T
RA
NS
FE
R F
AC
TO
RS
OF
RA
DIO
NU
CL
IDE
S F
RO
M S
OIL
TO
RIC
E G
RA
IN (
Cont.
)
Ele
men
t R
ice
Typ
e S
oil
Gro
up
N
GM
G
SD
A
M
SD
M
in
Max
#
Ref
Po*
Bro
wn
ric
e A
ll
2
1.3
× 1
0-2
1.5
1.3
× 1
0-2
5.2
× 1
0-3
9.4
× 1
0-3
1.7
× 1
0-2
2
Ra*
W
hit
e ri
ce
All
3
4.7
× 1
0-4
2.8
6.8
× 1
0-4
7.1
× 1
0-4
2.2
× 1
0-4
1.5
× 1
0-3
2
R
a*
Bro
wn
ric
e A
ll
37
9.1
× 1
0-4
3.1
2.3
× 1
0-3
5.1
× 1
0-3
1.9
× 1
0-4
2.8
× 1
0-2
5
R
a*
Bro
wn
ric
e L
oam
14
7.8
× 1
0-4
2.4
1.3
× 1
0-3
2.2
× 1
0-3
2.7
× 1
0-4
8.8
× 1
0-3
2
Ra*
B
row
n r
ice
Cla
y
18
5.7
× 1
0-4
1.7
6.8
× 1
0-4
5.9
× 1
0-4
2.5
× 1
0-4
2.9
× 1
0-3
2
Rb
Wh
ite
rice
A
ll
37
5.6
× 1
0-2
2.7
1.0
× 1
0-1
1.5
× 1
0-1
7.3
× 1
0-3
6.6
× 1
0-1
1
R
b
Bro
wn
ric
e A
ll
50
1.2
× 1
0-1
3.1
2.4
× 1
0-1
4.1
× 1
0-1
8.9
× 1
0-3
2.2
× 1
00
1
Se
Wh
ite
rice
A
ll
26
5.4
× 1
0-2
1.9
6.3
× 1
0-2
3.3
× 1
0-2
9.0
× 1
0-3
1.4
× 1
0-1
1
Se
Bro
wn
ric
e A
ll
41
6.7
× 1
0-2
2.0
8.2
× 1
0-2
5.8
× 1
0-2
9.5
× 1
0-2
2.9
× 1
0-1
1
Sr
Wh
ite
rice
A
ll
41
1.0
× 1
0-3
1.8
1.2
× 1
0-3
7.7
× 1
0-4
3.8
× 1
0-4
3.3
× 1
0-3
3
Sr
Wh
ite
rice
L
oam
10
8.4
× 1
0-4
1.7
9.4
× 1
0-4
4.7
× 1
0-4
4.1
× 1
0-4
1.7
× 1
0-3
1
S
r W
hit
e ri
ce
Cla
y
15
1.1
× 1
0-3
1.9
1.3
× 1
0-3
8.3
× 1
0-4
3.8
× 1
0-4
3.3
× 1
0-3
2
Sr
Bro
wn
ric
e A
ll
35
3.0
× 1
0-3
1.7
3.4
× 1
0-3
1.9
× 1
0-3
1.3
× 1
0-3
8.2
× 1
0-3
1
S
r B
row
n r
ice
Lo
am
16
2.5
× 1
0-3
1.6
2.8
× 1
0-3
1.5
× 1
0-3
1.3
× 1
0-3
6.4
× 1
0-3
1
Sr
Bro
wn
ric
e C
lay
19
3.5
× 1
0-3
1.7
4.0
× 1
0-3
2.0
× 1
0-3
1.6
× 1
0-3
8.2
× 1
0-3
1
S
r *
Wh
ite
rice
A
ll
55
9.4
x 1
0-3
3.0
1.8
× 1
0-2
2.4
× 1
0-2
2.1
× 1
0-3
8.8
× 1
0-2
4
S
r *
Wh
ite
rice
S
and
3
3.7
× 1
0-2
2.6
4.7
× 1
0-2
3.1
× 1
0-2
1.2
× 1
0-2
7.2
× 1
0-2
1
Sr
*
Wh
ite
rice
C
lay
7
1.7
× 1
0-2
3.4
2.8
× 1
0-2
2.5
× 1
0-2
2.1
× 1
0-3
7.5
× 1
0-2
2
S
r *
Bro
wn
ric
e A
ll
40
4.6
× 1
0-2
4.4
2.3
× 1
0-1
9.4
× 1
0-1
5.5
× 1
0-3
6.0
× 1
00
10
Sr
*
Bro
wn
ric
e S
and
3
9.8
× 1
0-2
2.3
1.2
× 1
0-1
9.2
× 1
0-2
4.1
× 1
0-2
2.2
× 1
0-1
1
S
r *
Bro
wn
ric
e L
oam
4
9.5
× 1
0-2
8.1
2.8
× 1
0-1
3.7
× 1
0-1
5.5
× 1
0-3
8.3
× 1
0-1
3
S
r *
Bro
wn
ric
e C
lay
7
6.0
× 1
0-2
1.6
6.6
× 1
0-2
2.8
× 1
0-2
2.8
× 1
0-2
1.1
× 1
0-1
2
Tc
*
Bro
wn r
ice
All
2
<2 ×
10-4
1
Th*
Wh
ite
rice
A
ll
26
1.7
× 1
0-4
2.0
2.2
× 1
0-4
1.6
× 1
0-4
4.3
× 1
0-5
6.9
× 1
0-4
3
T
h*
Wh
ite
rice
L
oam
10
1.7
× 1
0-4
1.9
2.1
× 1
0-4
1.4
× 1
0-4
6.7
× 1
0-5
4.6
× 1
0-4
1
Th*
Whit
e ri
ce
Cla
y
14
1.9
× 1
0-4
2.1
2.4
× 1
0-4
1.8
× 1
0-4
5.1
× 1
0-5
6.9
× 1
0-4
1
T
h*
Bro
wn
ric
e A
ll
31
1.4
× 1
0-4
4.5
1.3
× 1
0-3
5.4
× 1
0-3
2.2
× 1
0-5
3.0
× 1
0-2
4
T
h*
Bro
wn
ric
e L
oam
12
1.3
× 1
0-4
4.1
4.6
× 1
0-4
1.1
× 1
0-3
2.2
× 1
0-5
4.0
× 1
0-3
3
Th*
Bro
wn
ric
e C
lay
17
1.1
× 1
0-4
2.7
1.9
× 1
0-4
2.2
× 1
0-4
2.6
× 1
0-5
8.3
× 1
0-4
1
T
h*
Bro
wn
ric
e O
rgan
ic
1
3.0
× 1
0-2
1
24 5

TA
BL
E 1
. T
RA
NS
FE
R F
AC
TO
RS
OF
RA
DIO
NU
CL
IDE
S F
RO
M S
OIL
TO
RIC
E G
RA
IN (
Cont.
)
Ele
men
t R
ice
Typ
e S
oil
Gro
up
N
GM
G
SD
A
M
SD
M
in
Max
#
Ref
U*
Wh
ite
rice
A
ll24
1.9
× 1
0-4
2.0
2.3
× 1
0-4
1.3
× 1
0-4
4.5
× 1
0-5
6.3
× 1
0-4
4
U*
Whit
e ri
ce
Loam
81.7
× 1
0-4
2.3
2.3
× 1
0-4
1.9
× 1
0-4
4.7
× 1
0-5
6.3
× 1
0-4
1
U*
Wh
ite
rice
C
lay
12
2.5
× 1
0-4
1.4
2.6
× 1
0-4
8.8
× 1
0-5
1.1
× 1
0-4
4.5
× 1
0-4
1
U*
Bro
wn
ric
e A
ll41
2.8
× 1
0-4
8.9
3.8
× 1
0-3
1.4
× 1
0-4
8.6
× 1
0-6
9.0
× 1
0-2
8
U*
Bro
wn
ric
e S
and
35.4
×10-3
2.6
7.0
× 1
0-3
5.3
× 1
0-3
1.9
× 1
0-3
1.3
× 1
0-2
2
U*
Bro
wn
ric
e L
oam
15
2.3
× 1
0-4
10
2.3
× 1
0-3
6.1
× 1
0-3
8.6
× 1
0-6
2.4
× 1
0-3
4
U*
Bro
wn
ric
e C
lay
17
1.4
× 1
0-4
54.1
× 1
0-4
5.5
× 1
0-4
2.3
× 1
0-5
1.8
× 1
0-3
3
U*
Bro
wn
ric
e O
r gan
ic1
9.0
× 1
0-2
1
Zn
Wh
ite
rice
A
ll37
2.0
× 1
0-1
1.6
2.2
× 1
0-1
8.4
× 1
0-2
6.1
× 1
0-2
4.0
× 1
0-1
1
Zn
Bro
wn
ric
e A
ll50
2.4
× 1
0-1
1.5
2.6
× 1
0-1
1.1
× 1
0-1
7.3
× 1
0-2
6.8
× 1
0-1
1
Zn *
B
row
n r
ice
All
51.5
× 1
00
2.0
1.7
× 1
00
9.3
× 1
0-1
5.8
× 1
0-1
2.7
× 1
00
3
Zn *
B
row
n r
ice
San
d1
2.3
× 1
00
1
Zn *
B
row
n r
ice
Lo
am3
1.5
× 1
00
2.3
1.8
× 1
00
1.1
× 1
00
5.8
× 1
0-1
2.7
× 1
00
1
2 46

247
10-6
10-5
10-4
10-3
10-2
10-1
100
Sr Cs Pb Ra Th U
White rice*
White rice
Brown rice*
Brown rice
Tra
nsfe
r F
acto
r
Elements
FIG. 3. Geometric means of transfer factors of Sr, Cs, Pb, Ra, Th and U for brown rice and white rice (on a
dry weight basis). Fv results for White rice* (●) and Brown rice*(■) are Fv values obtained using fallout isotopes and radiotracers. The results for White rice (○) and Brown rice (□) without asterisk were obtained
using stable elements. Bars show upper and lower 95% confidence levels for Fv values.
Under equilibrium conditions, i.e. under long-time contact with the environment,
radionuclides behave similarly to their naturally existing isotopes so that naturally existing
elements can be suitable analogues. However, under freshly contaminated conditions, Fv
values will often be higher than for naturally existing elements due to different mobility in
soil-to-plant systems (ageing effect) (Table 2).
Recently compiled data in this IAEA-TECDOC for cereals and Fv values for brown rice (from
Table 1) are plotted in Fig. 4. Fv values for brown rice obtained using radionuclides are almost
the same as those for cereals. Analyses of these results for some radionuclides are given
below.
3.1. Strontium and Caesium
A number of reports are available on Fv values for Sr and Cs isotopes. These elements, as well
as many other elements, do not distribute uniformly in the rice plant. For Sr, only 0.7 and
1.1% of the total 90
Sr in the whole rice plant were found in polished rice and brown rice,
respectively, whereas, 5.3% and 7.4% of the total 137
Cs were observed in polished rice and
brown rice, respectively [2]. Tsukada et al. [3] reported that 7% and 10% of the total stable Cs
were distributed in polished rice and bran, respectively.
.
10-6
10-5
10-4
10-3
10-2
10-1
100
101
102
Mn Co Zn Sr Cs Pb Ra Th U
Radioactive isotopes (Brown rice)Stable isotopes (Brown rice)New TECDOC (Cereals, grain)
Tra
nsfe
r fa
cto
r
Elements FIG. 4 Geometric means of TFs for brown rice and TFs for cereals compiled in this IAEA-TECDOC. Bar
ends shows minimum and maximum TF values.

248
The values obtained from pot experiments are usually higher than values obtained from field
observations, due to the aging effect that occurs with the water management used in paddy
fields (Table 2).
The reported Fv values for strontium in brown rice from pot experiments are usually one order
of magnitude higher than those from field observations (fallout 90
Sr) and range from 1.4 × 10-
2 to 8.6 × 10
-2. The data from field observations are generally lower than values recommended
TABLE 2. SOIL-TO-RICE TRANSFER FACTORS FOR Sr AND Cs
Elements Country/State,
organization
Experimental
conditions Strontium Caesium
Bangladesh Rice, not specified
(Pot experiment)
(7.8 × 10⁻¹–8.9 × 10⁻¹) (2.5 × 10⁻¹–3.3 × 10⁻¹)
China Brown rice
(Pot experiment)
6.4 × 10⁻³ e
(2.1 × 10⁻³– 2.0 × 10⁻²)
(1.8±0.4) × 10-1 c,e
(6.7±0.9) × 10-2 c,e
4.0 × 10⁻³ e
(2.8 × 10⁻⁴ – 5.7 × 10⁻²)
(5.7±2.8) × 10-3 c,e
Brown rice
(Fa, Field observation)
- 4.5 × 10⁻³
(1.2 × 10⁻³ – 1.1 × 10⁻²)
Republic of
Korea
Brown rice
(Pot experiment)
1.2 × 10⁻¹ 3.1 × 10⁻²
(1.0 × 10⁻²–1.0 × 10⁻¹)
Brown rice
(F, Field observation)
1.4 × 10⁻² f 4.1 × 10⁻³ f
White rice
(F, Field observation)
4.0 × 10⁻³
(3.8±2.6) × 10-3
1.6 × 10⁻³
(2.6±2.8) × 10-3
Japan
White rice
(Sb, Field observation)
(7.4±2.7) × 10-4 (7.8±6.9) × 10-4
White rice
(F, Field observation)
(2.1±0.7) × 10-3 1.6 × 10⁻³
(2.1 × 10⁻⁴ – 1.2 × 10⁻²)
Japan
White rice
(S, Field observation)
5.6 × 10⁻⁴
(1.1 × 10⁻⁴ – 2.8 × 10⁻³)
Brown rice
(F, Field observation)
3.3 × 10⁻³
(1.1 × 10⁻³ – 2.4 × 10⁻²)
Brown rice
(S, Field observation)
3.1 × 10⁻³
(1.1 × 10⁻³ – 9.1 × 10⁻³)
9.5 × 10⁻⁴
(9.9 × 10⁻⁵ – 9.1 × 10⁻³)
Japan
White rice
(S, Field observation)
8.6 × 10⁻⁴
(2.2 × 10⁻⁴ – 3.4 × 10⁻³)
5.9 × 10⁻⁴
(8.9 × 10⁻⁵ – 3.9 × 10⁻³)
White rice
(F, Field observation)
3.7 × 10⁻²
(5 × 10⁻³–8.8 10-2)
9.7 × 10⁻²
(3 × 10⁻² – 1.8 × 10⁻¹)
Taiwan, China
Brown rice
(F, Field observation)
8.6 × 10⁻²
(2.7 × 10⁻² – 2.2 × 10⁻¹)
1.4 × 10⁻¹
(7 × 10⁻² – 2.7 × 10⁻¹)
Taiwan, China Rice, not specified
(F, Field observation)
3.1 × 10⁻² 2.2 × 10⁻³
Vietnam Rice, not specified
(Pot experiment)
(3.05±2.83) × 10-1 (1.67±3.41) × 10-1
Vietnam Rice, not specified
(Pot experiment)
1.13 × 10⁻¹
(5.1 × 10⁻² – 3.3 × 10⁻¹)
5.05 × 10⁻²
(9 × 10⁻⁴ – 1.4)
Technical
Reports Series
No. 364 d
Technical Reports
Series No. 364 d
Cereals grain
Rice (soil-to-plant)
1.2 × 10⁻¹ (clay, loam pH=6)
2.1 × 10⁻¹(sand, pH=5)
2.0 × 10⁻² (peat, pH=4)
1.0 × 10⁻² (clay, loam pH=6)
2.6 × 10⁻² (sand, pH=5)
8.3 × 10⁻² (peat, pH=4)
5.0 × 10⁻³
aF: Fallout radionuclides, bS: stable elements, c arithmetic mean, d expected values, e values were converted
from fresh weight basis Fv to dry weight basis F
v by applying dry/wet ratio of 0.85, and f calculated
from ref. [5].

249
by the IAEA (Technical Reports Series No. 364) [4] previously for Cereals (1.2 × 10⁻¹
for
Clay Loam soils). Also, the geometric mean for all 90
Sr Fv values for Cereals compiled in this
IAEA-TECDOC, 1.1 × 10⁻¹
, is higher than that obtained in field observations.
For Cs in brown rice, an Fv range of 5.7 × 10⁻³
–3.3 × 10⁻¹
is observed for pot experiments,
whereas field observation Fv values are usually on the order of 10-3
. For most cases, again, the
Fv values observed under field conditions are lower than those listed in Technical Reports
Series No. 364 for cereals. Among recent data reported in this IAEA-TECDOC, the geometric
mean of Cs Fv values for cereals, 2.9 × 10⁻²
, is also higher than the field observation results
for stable Cs and fallout 137
Cs, as shown in the Table 2.
3.2. Manganese, Cobalt and Zinc
The Fv results for 54
Mn, 60
Co, and 65
Zn [6, 7] are given in Table 3. For these radionuclides,
the only data available were from radiotracer experiments, and they are one order of
magnitude higher than Fv values of naturally existing stable elements as shown in Table 3.
The best-estimate Fv values listed in Technical Reports Series No. 364 for Cereals or Wheat
were 0.3 for Mn, 3.7 × 10⁻³
for Co, and 1.6 for Zn. GMs of recently compiled data in this
IAEA-TECDOC are 2.8 × 10⁻¹
for Mn, 8.5 × 10⁻³
for Co, and 1.8 for Zn, which are almost the
same as those compiled previously. The GM of Fv values for Co in brown rice is higher than
that in Technical Reports Series No. 364, whereas the geometric mean values for Mn and Zn
are on the same order of magnitude. It would be highly advisable to obtain more data for Co
in order to evaluate whether the difference is significant or not.
TABLE 3. SOIL-TO-RICE TRANSFER FACTORS FOR Mn, Co, Zn, Tc and I OBTAINED IN
POT EXPERIMENTS
Nuclides Type of rice N GM Min Max # Ref
60Co Rice, not specified 3 1.0 × 10
-2 9 × 10
-3 1.1 × 10
-2 1
Brown rice 4 4.3 × 10
-3 2.2 × 10
-3 6 × 10
-3 1
125I
Brown rice 4 2.5 × 10⁻³
1.1 × 10⁻³
7.3 × 10⁻³
1
Brown rice 5 5.9 × 10
-3 4.4 × 10
-3 7.6 × 10
-3 1
54Mn
Brown rice 5 2.6 × 10
-1 1.2 × 10
-1 5.2 × 10
-1 1
95mTc Brown rice 2 < 2 × 10
-4 a 1
65Zn
Rice, not specified 3 8.9 × 10
-1 7.9 × 10
-1 9.6 × 10
-1 1
Brown rice 4 1.7 5.8 × 10
-1 2.7 1
aArithmetic mean.
3.3. Technetium
Fv values for Tc in rice and wheat plants have been obtained from laboratory radiotracer
experiments [8], and the data for rice grain are listed in Table 3. The mean Fv for rice plants is
less than 0.2 × 10⁻³
for the hulled rice and 5.1 for the lower leaf blade. For wheat plants,
higher Fv values are found: 2.7 × 10⁻³
for the hulled wheat and 230 for the lower leaf blade. In
Technical Reports Series No. 364, the best estimate value of Tc for cereals was 7.3 × 10⁻¹
with a 95% confidence level of 7.3 × 10⁻²
-3.7 [4], and in recently compiled data in this IAEA-
TECDOC, the arithmetic mean of Fv values for cereals was 1.3 (range: 0.18-2.4).

250
The Tc concentrations in the grains of both rice and wheat are much lower than those in their
leaves, and Fv values of Tc for rice grain are lower than those for wheat grain. The level of Tc
in the soil solution collected from the flooded soil of rice pots decreased rapidly with time,
whereas the Tc concentration in the soil solution of wheat pots decreased slowly. When a Tc
tracer was added as TcO4
- to a flooded paddy soil sample, Tc was easily transformed to
immobile forms due to the reducing conditions generated by microbial activity. Thus, low Fv
values observed for the rice plants could be explained by fixation of Tc in the soil.
3.4. Iodine
When rice plants were grown on Andosol and Gray lowland soil, the v
F values obtained for
radioiodine for brown rice were 2.5 × 10⁻³
and 5.9 × 10⁻³
, respectively [9, 10] (Table 3). Fv
values for polished rice were 0.7 × 10⁻³
for the Andosol and 0.2 × 10⁻²
for the Gray lowland
soil. Stable iodine concentrations in paddy soil and rice samples collected in Japan have been
analyzed to estimate the Fv values for brown rice and polished rice [11]. The Fv values for
polished rice range from 0.1 × 10⁻³
to 0.8 × 10⁻²
and the geometric mean is 0.2 × 10⁻²
, whereas
those for brown rice range from 0.1 × 10⁻²
-0.2 × 10⁻¹
and the geometric mean is 0.5 × 10⁻²
.
Iodine sorbed on the soil solid phase is readily dissolved into the soil solution under flooded
conditions, as it is more soluble in anoxic than oxic conditions; however, the Fv values of
iodine for brown rice and polished rice are extremely small. One of reasons is that iodine is
mainly distributed in the leaves, and hardly any iodine translocates into the grains.
3.5. Radium, Thorium, and Uranium
As shown above, fewer data for other radionuclides are available. As a result, naturally
existing elements have been studied as analogues of these radionuclides to add information.
Recently, rice and associated soil samples have been collected from 50 sampling sites
throughout Japan to obtain Fv values of stable isotopes, Th, and U, for white rice and brown
rice grains [1]. The results are presented in Table 1, along with previous results: Fv-Th and Fv-
U, are listed, and no substantial differences were observed between the Fv values obtained in
recent and previous studies [12-15]. The Fv data are not separated by soil types since the
sample data presented in the previous report [1] showed a log-normal distribution of Fv
values. Usually, Fv values are higher in brown rice than in white rice. Some elements, such as
Fe, Mn, Co, Sr, Ba, and U, show significantly different Fv values between white rice and
brown rice. White rice is simply a refined starch, and chemical element components in brown
rice and polished rice are different as shown in Fig. 3.
Ra occurs naturally in the environment; however, its concentration is extremely low so that Fv
data obtained under natural conditions are limited. The Fv values for 226
Ra from the paddy soil
to brown rice range from 1.9 × 10⁻⁴
to 2.8 × 10⁻²
whereas those for white rice range from 2.2 ×
10-4
to 1.5 × 10⁻³
. The Fv values of brown rice and white rice are rather similar except for a
few elements. Technical Reports Series No. 364 has no Ra data for rice or cereals, but the
values reported here for white and brown rice are close to the best-estimate value for maize
(1.2 × 10⁻³
). The Ra data for cereals have been summarized here, and the geometric mean
value is 1.7 × 10⁻²
with 95% confidence level of 9.0 × 10⁻⁴
– 3.2 × 10⁻¹
. Cereals show slightly
higher Ra Fv values than brown rice (Fig. 2).
251
REFERENCES
[1] UCHIDA, S., TAGAMI, K., HIRAI, I., Soil-to-plant transfer factors of stable elements
and naturally occurring radionuclides: (2) Rice collected in Japan, Journal of Nuclear Science and Technology 44 (2007) 779-790.
[2] WANG, J.J., WANG, C.J., HUANG, C.C., LIN, Y.M., Transfer factors of 90Sr and 137
Cs from paddy soil to the rice plant in Taiwan, Journal of Environmental Radioactivity 39
(1998) 23-34. [3] TSUKADA, H., HASEGAEA, H., HISAMATSU, S., YAMASAKI, S., Transfer of 137Cs
and stable Cs from paddy soil to polished rice in Aomori, Japan, Journal of Environmental
Radioactivity 59 (2002) 351-363. [4] INTERNATIONAL ATOMIC ENERGY AGENCY, Handbook of Parameter Values for
the Prediction of Radionuclide Transfer in Temperate Environments, Technical Report Series No.364, IAEA, Vienna (1994).
[5] KOMAMURA, M., TSUMURA, A., YAMAGUCHI, N., KIHOU, N., KODAIRA, K.,
Monitoring 90Sr and
137Cs in Rice, Wheat, and Soil in Japan from 1959 to 2000.
Miscellaneous publication of National Institute for Agro-Environmental Sciences 28
Tsukuba (2006). [6] CHOI, Y.H., LIM, K.M., CHO, Y.H., LEE, M.H., CHOI, K.S., JUNG, K.H., PARK,
H.K., LEE, W.Y., PARK, D.W., CHOI, S.D., KANG, H.S., CHOI, H.J., LEE, H.S., LEE,
C.W. Parameters on the Radionuclide Transfer in Crop Plants for Korean Food Chain Dose Assessment, KAERI/TR-1993, Korea Atomic Energy Research Institute (2001) (in
Korean). [7] BINH, N.T., QUANG, N.H., Y T., SIEU, L.N., NGO, N.T., PHUC, N.V., HUONG, M.T.,
NHAN, D.D., “The transfer of radionuclides in the terrestrial environments –Recent
research results in monsoon tropical condition of Vietnam”, Proc. International Symposium on Transfer of Radionuclides in Biosphere –Prediction and Assessment-,
Mito 2002 JAERI-Conf 2003-010 79-89. [8] YANAGISAWA, K., MURAMATSU, Y., Transfer of technetium from soil to paddy and
upland rice, Journal of Radiation Research. 36 (1995) 171-178.
[9] MURAMATSU, Y., UCHIDA, S., OHMOMO, Y., Root-uptake of radioiodine by rice plants, Journal of Radiation Research 34 (1993) 214-220.
[10] UCHIDA, S., MURAMATSU, Y., Behaviour of iodine-129 in rice paddy fields, Scientific Basis for Nuclear Waste Management XVIII. Materials Research Society Symposium
Proc. 353 (1994) 141-147. [11] TAKAGI, H., KIMURA, T., KOBAYASHI, H., IWASHIMA, K., YAMAGATA, N.,
Transfer of iodine from paddy soil to rice grain, Hoken-Butsuri 20 (1985) 251-257
(abstract in English). [12] LI, J.G., SHANG, Z.R., YANG, J.C., TANG, S.M., Radionuclide Transfer Parameter
Manual, Atomic Energy Press, Beijing 2006 (in Chinese) [English translation Shang, Z.R.].
[13] KOMAMURA, M., TSUMURA, A., The transfer factors of long-lived radionuclides from
soil to polished rice measured by ICP-MS, Radioisotopes 43 (1994) 1-8. [14] YUNOKI, E., KATAOKA, T., MICHIRO, K., SUGIYAMA, H., SHIMIZU, M., MORI,
T., Activity concentrations of 238U and
226Ra in agricultural samples, Journal of
Radioanalytical and Nuclear Chemistry 174 (1993) 223-228. [15] SASAKI, T., TASHIRO, Y., FUJINAGA, H., ISHII, T., GUNJI, Y., Determination of
transfer factors of uranium, thorium, radium and lead from soil to agricultural product in Japan for estimating internal radiation dose through ingestion, Hoken-Butsuri 37 (2002)
208-221 (Abstract in English).


253
ROOT UPTAKE FOLLOWING ACUTE SOIL DEPOSITION
DURING PLANT GROWTH
Y.H. CHOI Korea Atomic Energy Research Institute, Daejeon, Republic of Korea
Abstract
Root uptake of radionuclides is generally evaluated using transfer factor (Fv) values expressed as the ratios of the plant
concentrations to the soil concentrations. Fv values are measured in the soils mixed with radionuclides to a certain depth
before planting. In contrast, radionuclides acutely deposited during plant growth will usually be localised with respect to the
soil surface till harvest. This makes the use of Fv inappropriate and makes it necessary to use aggregated transfer factors
specified for the time periods from deposition until harvest (Ta
ag, m2 kg-1). In this paper, time-dependent Ta
ag values for Mn,
Co, Sr, Cs and/or tritium for several food crops are summarized. The values vary considerably with the radionuclides, plant
species, soil types and times of deposition. They can be used for predicting the root uptake following an acute soil deposition
during the growth of crop plants. To date, however, a limited number of Ta
ag values are available. In order to reduce the
uncertainty in the prediction, it will be necessary to perform a substantial number of further experiments.
1. DEFINITION AND PROCESSES
The previous papers largely describes radionuclide transfers from soil to plants for
equilibrium conditions, i.e. in some time period after the deposition. However, a certain
amount of radionuclides can also be transferred to plants from soil in the year of deposition.
Such a situation can be of importance, in particular, for the case of acute (short term)
deposition. Many models allow the contamination of plants to be calculated for this scenario
with some uncertainty. In addition, some direct experimental data are now available, giving
the opportunity for testing and enhancing models of radionuclide transfer from soil to plants
after acute deposition.
As mentioned earlier, root uptake of radionuclides is generally evaluated using transfer factor
(Fv) values expressed as the ratios of the plant concentrations to those in soil. Fv values are
measured in the soils mixed with radionuclides to a certain depth before planting because
ploughing is a common practice done before planting.
In contrast, radionuclides acutely deposited during plant growth will usually be localised with
respect to the soil surface till harvest because farmlands are not ploughed within the growing
period. This makes the use of Fv inappropriate and makes it necessary to use aggregated
transfer factors [1-3] specified for the time periods from deposition until harvest ( a
agT ):
)(
)(2
1
−
−
=
mBqfarmlandofareaunitpersoilontodepositedacutelyActivity
kgBqharvestatplantinderadionucliofionConcentratT
a
ag
Due to the lack of such data, most of the dynamic food-chain models use Fv values even for a
growing-time deposition [4-6] in spite of its inappropriateness in this context [1-3]. Since the
physiological activity and organ development of plants, and the bioavailability of deposited
radionuclides change with time, the a
agT may greatly depend on the growth stage when a
deposition occurs.

254
2. DERIVED a
agT VALUES
2.1. a
agT values for sandy soil
Available data on radionuclide transfers from soil to plants obtained in greenhouse
experiments for acid sandy soils [7-10] are given in Tables 1-3. The a
agT values vary
considerably with the radionuclide, plant species, and time of deposition. Data in Table 1
show that, in terms of a
agT values, radionuclides used in that study can generally be ranked as
follows: Sr > Mn > Co > Cs. Comparatively high uptake of Mn by rice can likely be
explained by a rapid reduction of Mn in the water-logged soil [11]. In most cases, the
depositions at the middle or late growth stages produced higher a
agT values than those at the
early growth stage. This can largely be explained by the comparatively weak absorbing-
powers of the young roots and increasing soil fixation of the deposited radionuclides.
Particularly for rice, such an enhanced uptake of Cs, following its deposition at the middle
growth stage, may be associated with uptake via plant bases. The bases of rice plants are
normally submerged in standing water. This water contains considerable amounts of
radionuclides for some time after an accidental deposition, possibly leading to significant
plant-base uptake. Some experiments have shown that plant-base uptake in rice was very
efficient for Cs [12-13]. In Table 2, the a
agT values of tritiated water (HTO) to organically
bound tritium (OBT) in rice straw and brown rice were highest when HTO was deposited at
the most active growth stage of each compartment of plant [9].
Rice straw is supplied to cattle for feeding in some Asian countries including Republic of
Korea. The a
agT values for the grain OBT are several times higher than that for the straw OBT
when HTO is deposited at the active grain-developing stage, whereas the opposite is generally
true following deposition at the other growth stages.
The a
agT values of HTO for both TFWT (tissue free water tritium) and, to a lesser degree, OBT
in the Chinese cabbage increase sharply as the deposition time becomes closer to harvest
(Table 3) [10]. This can be explained by the dilution of tissue tritium being less for a shorter
duration. Such a dilution is caused by evapotranspiration, gas exchange, biomass increase,
and respiration.
2.2. 90
Sr and 137
Cs a
agT values to rice from various soils
For rice, further experiments were performed to measure the a
agT values for
90Sr and
137Cs in
various paddy soils [2, 3, 8]. The experimental soils, collected undisturbed into small
lysimeters, were acid loams and sands. The results of these experiments are summarised in
Table 4. It can be seen from the table that in terms of radionuclides transfer to plants there
was no big difference recorded between these two soil types. Generally, 90
Sr a
agT values were
30-40 fold higher in the rice straw than in the rice grain, whereas those of 137
Cs are only about
two times higher in the rice straws than in the rice grain. This fact suggests a higher mobility
of 137
Cs within a plant's body than of 90
Sr. The values of 137
Cs deposited at around the starting
time of the ear emergence (83 d after transplanting) are several times higher than those from
the early-tillering-stage deposition. This difference between the depositions at two different
times might be caused mainly by the difference in the plant-base uptake.
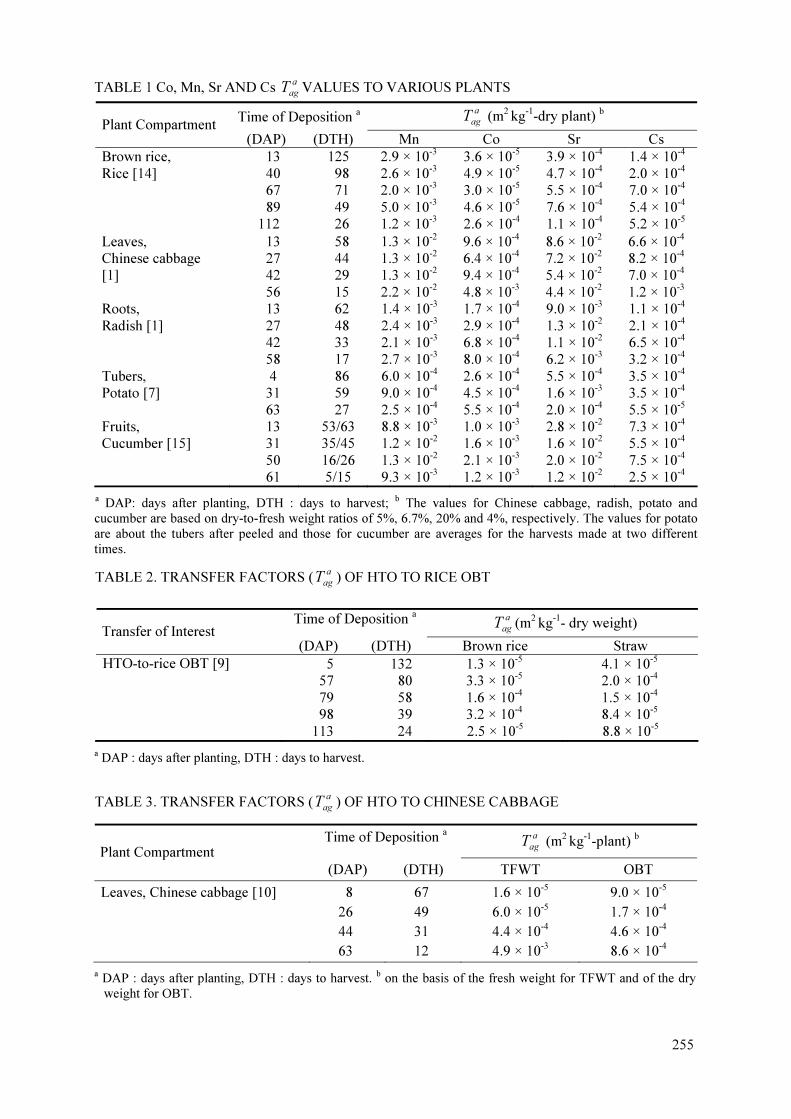
255
TABLE 1 Co, Mn, Sr AND Cs a
agT VALUES TO VARIOUS PLANTS
a DAP: days after planting, DTH : days to harvest; b The values for Chinese cabbage, radish, potato and
cucumber are based on dry-to-fresh weight ratios of 5%, 6.7%, 20% and 4%, respectively. The values for potato
are about the tubers after peeled and those for cucumber are averages for the harvests made at two different
times.
TABLE 2. TRANSFER FACTORS (a
agT ) OF HTO TO RICE OBT
a DAP : days after planting, DTH : days to harvest.
TABLE 3. TRANSFER FACTORS (a
agT ) OF HTO TO CHINESE CABBAGE
Time of Deposition a a
agT (m
2 kg
-1-plant)
b
Plant Compartment
(DAP) (DTH) TFWT OBT
Leaves, Chinese cabbage [10] 8
26
44
63
67
49
31
12
1.6 × 10⁻⁵
6.0 × 10⁻⁵
4.4 × 10⁻⁴
4.9 × 10⁻³
9.0 × 10⁻⁵
1.7 × 10⁻⁴
4.6 × 10⁻⁴
8.6 × 10⁻⁴
a DAP : days after planting, DTH : days to harvest. b on the basis of the fresh weight for TFWT and of the dry
weight for OBT.
Time of Deposition a
a
agT (m
2 kg
-1-dry plant)
b
Plant Compartment (DAP) (DTH) Mn Co Sr Cs
Brown rice,
Rice [14]
13
40 67
89 112
125
98 71
49 26
2.9 × 10⁻³
2.6 × 10⁻³
2.0 × 10⁻³
5.0 × 10⁻³
1.2 × 10⁻³
3.6 × 10⁻⁵
4.9 × 10⁻⁵
3.0 × 10⁻⁵
4.6 × 10⁻⁵
2.6 × 10⁻⁴
3.9 × 10⁻⁴
4.7 × 10⁻⁴
5.5 × 10⁻⁴
7.6 × 10⁻⁴
1.1 × 10⁻⁴
1.4 × 10⁻⁴
2.0 × 10⁻⁴
7.0 × 10⁻⁴
5.4 × 10⁻⁴
5.2 × 10⁻⁵
Leaves, Chinese cabbage [1]
13 27 42
56
58 44 29
15
1.3 × 10⁻²
1.3 × 10⁻²
1.3 × 10⁻²
2.2 × 10⁻²
9.6 × 10⁻⁴
6.4 × 10⁻⁴
9.4 × 10⁻⁴
4.8 × 10⁻³
8.6 × 10⁻²
7.2 × 10⁻²
5.4 × 10⁻²
4.4 × 10⁻²
6.6 × 10⁻⁴
8.2 × 10⁻⁴
7.0 × 10⁻⁴
1.2 × 10⁻³
Roots,
Radish [1]
13
27 42 58
62
48 33 17
1.4 × 10⁻³
2.4 × 10⁻³
2.1 × 10⁻³
2.7 × 10⁻³
1.7 × 10⁻⁴
2.9 × 10⁻⁴
6.8 × 10⁻⁴
8.0 × 10⁻⁴
9.0 × 10⁻³
1.3 × 10⁻²
1.1 × 10⁻²
6.2 × 10⁻³
1.1 × 10⁻⁴
2.1 × 10⁻⁴
6.5 × 10⁻⁴
3.2 × 10⁻⁴
Tubers, Potato [7]
4 31
63
86 59
27
6.0 × 10⁻⁴
9.0 × 10⁻⁴
2.5 × 10⁻⁴
2.6 × 10⁻⁴
4.5 × 10⁻⁴
5.5 × 10⁻⁴
5.5 × 10⁻⁴
1.6 × 10⁻³
2.0 × 10⁻⁴
3.5 × 10⁻⁴
3.5 × 10⁻⁴
5.5 × 10⁻⁵
Fruits, Cucumber [15]
13 31
50 61
53/63 35/45
16/26 5/15
8.8 × 10⁻³
1.2 × 10⁻²
1.3 × 10⁻²
9.3 × 10⁻³
1.0 × 10⁻³
1.6 × 10⁻³
2.1 × 10⁻³
1.2 × 10⁻³
2.8 × 10⁻²
1.6 × 10⁻²
2.0 × 10⁻²
1.2 × 10⁻²
7.3 × 10⁻⁴
5.5 × 10⁻⁴
7.5 × 10⁻⁴
2.5 × 10⁻⁴
Time of Deposition a
a
agT (m
2 kg
-1- dry weight)
Transfer of Interest (DAP) (DTH) Brown rice Straw
HTO-to-rice OBT [9] 5 57
79 98
113
132 80
58 39
24
1.3 × 10⁻⁵
3.3 × 10⁻⁵
1.6 × 10⁻⁴
3.2 × 10⁻⁴
2.5 × 10⁻⁵
4.1 × 10⁻⁵
2.0 × 10⁻⁴
1.5 × 10⁻⁴
8.4 × 10⁻⁵
8.8 × 10⁻⁵

TA
BL
E 4
. 137C
s A
ND
90S
r a
ag
TV
AL
UE
S T
O R
ICE
FO
LL
OW
ING
CO
NT
AM
INA
TIO
N A
T T
HE
ST
AG
ES
OF
EA
RL
Y T
ILL
ER
ING
AN
D E
AR
LY
EA
R
EM
ER
GE
NC
E
Pla
nt
Com
par
tmen
t (D
AP
a)
Soil
Gro
up
N
AM
S
D
GM
G
SD
M
in
Max
137C
s B
row
n r
ice
12
83
Tota
l
Loam
S
and
Tota
l L
oam
S
and
3
2
1
8
5
3
2.8
× 1
0-4
2.9
× 1
0-4
2.7
× 1
0-4
2.5
× 1
0-3
3.0
× 1
0-3
1.6
× 1
0-3
1.6
× 1
0-4
2.3
× 1
0-4
-
1.4
× 1
0-3
1.3
× 1
0-3
1.2
× 1
0-3
2.5
× 1
0-4
- -
2.0
× 1
0-3
2.7
× 1
0-3
1.2
× 1
0-3
1
.87
- -
2.2
6
1.8
1
2.7
5
1.3
× 1
0-4
1.3
× 1
0-4
-
3.9
× 1
0-4
1.0
× 1
0-3
3.9
× 1
0-4
4.5
× 1
0-4
4.5
× 1
0-4
-
4.2
× 1
0-3
4.2
× 1
0-3
2.7
× 1
0-3
S
traw
1
2
83
Tota
l L
oam
San
d
Tota
l
Loam
S
and
3
2
1
8
5
3
6.0
× 1
0-4
6.2
× 1
0-4
5.7
× 1
0-4
3.8
× 1
0-3
4.5
× 1
0-3
2.7
× 1
0-3
3.8
× 1
0-4
5.4
× 1
0-4
- 2.4
× 1
0-3
2.1
× 1
0-3
2.9
× 1
0-3
5.2
× 1
0-4
- -
2.9
× 1
0-3
4.0
× 1
0-3
1.6
× 1
0-3
2.0
5
- - 2
.63
1.7
3
3.9
7
2.4
× 1
0-4
2.4
× 1
0-4
- 3.8
× 1
0-4
1.8
× 1
0-3
3.8
× 1
0-4
1.0
× 1
0-3
1.0
× 1
0-3
- 6.9
× 1
0-3
6.9
× 1
0-3
9 ×
10
-3
90S
r B
row
n r
ice
83
Tota
l L
oam
San
d
5
3
2
6.4
× 1
0-4
6.2
× 1
0-4
6.8
× 1
0-4
3.3
× 1
0-4
1.9
× 1
0-4
6.0
× 1
0-4
7 ×
10
-4
6.0
× 1
0-4
-
1.7
8
1.4
0
-
2.5
× 1
0-4
4.1
× 1
0-4
2.5
× 1
0-4
1.1
× 1
0-3
7.8
× 1
0-4
1.1
× 1
0-3
Str
aw
83
Tota
l L
oam
San
d
5
3
2
2.1
× 1
0-2
1.8
× 1
0-2
2.6
× 1
0-2
7.5
× 1
0-3
4.7
× 1
0-3
9.9
× 1
0-3
2.0
× 1
0-2
1.7
× 1
0-2
-
1.4
0
1.2
9
-
1.4
× 1
0-2
1.4
× 1
0-2
1.9
× 1
0-2
3.3
× 1
0-2
2.3
× 1
0-2
3.3
× 1
0-2
a
DA
P :
day
s af
ter
pla
nti
ng. R
ice
pla
nts
wer
e h
arves
ted
14
5 d
aft
er t
ran
spla
nti
ng.
2 65
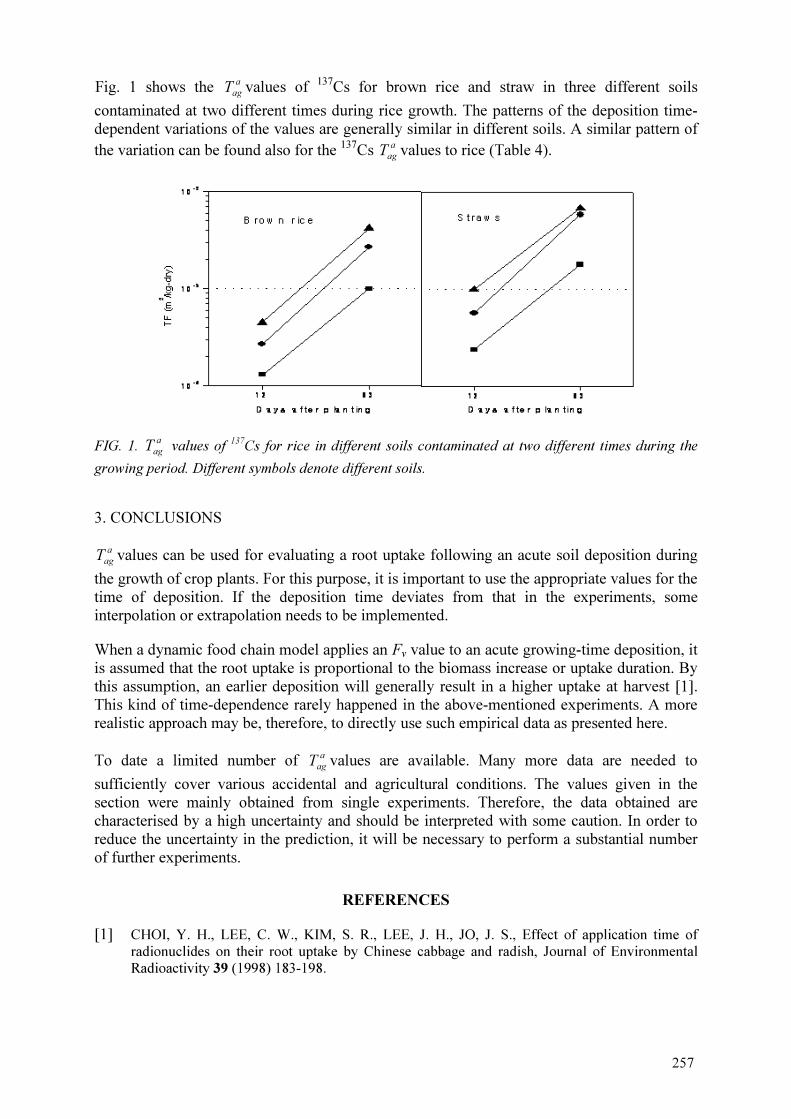
257
Fig. 1 shows the a
agT values of
137Cs for brown rice and straw in three different soils
contaminated at two different times during rice growth. The patterns of the deposition time-
dependent variations of the values are generally similar in different soils. A similar pattern of
the variation can be found also for the 137
Cs a
agT values to rice (Table 4).
FIG. 1. a
agT values of
137Cs for rice in different soils contaminated at two different times during the
growing period. Different symbols denote different soils.
3. CONCLUSIONS
a
agT values can be used for evaluating a root uptake following an acute soil deposition during
the growth of crop plants. For this purpose, it is important to use the appropriate values for the
time of deposition. If the deposition time deviates from that in the experiments, some
interpolation or extrapolation needs to be implemented.
When a dynamic food chain model applies an Fv value to an acute growing-time deposition, it
is assumed that the root uptake is proportional to the biomass increase or uptake duration. By
this assumption, an earlier deposition will generally result in a higher uptake at harvest [1].
This kind of time-dependence rarely happened in the above-mentioned experiments. A more
realistic approach may be, therefore, to directly use such empirical data as presented here.
To date a limited number of a
agT values are available. Many more data are needed to
sufficiently cover various accidental and agricultural conditions. The values given in the
section were mainly obtained from single experiments. Therefore, the data obtained are
characterised by a high uncertainty and should be interpreted with some caution. In order to
reduce the uncertainty in the prediction, it will be necessary to perform a substantial number
of further experiments.
REFERENCES
[1] CHOI, Y. H., LEE, C. W., KIM, S. R., LEE, J. H., JO, J. S., Effect of application time of radionuclides on their root uptake by Chinese cabbage and radish, Journal of Environmental Radioactivity 39 (1998) 183-198.
258
[2] CHOI, Y.H., LIM, K.M., PARK, H.G., PARK, D.W., KANG, H.S., LEE, H.S., Transfer of 137
Cs to rice plants from various paddy soils contaminated under flooded conditions at different growth stages. Journal of Environmental Radioactivity 80 (2005) 45-58.
[3] CHOI, Y.H., KANG, H.S., JUN, I., KEUM, D.K., PARK, H.G., CHOI, G.S., LEE, H.S., LEE, C.W., Transfer of 90Sr to rice plants after its acute deposition onto flooded paddy soils, Journal of Environmental Radioactivity 93 (2007) 157-169.
[4] ABBOTT, M.L., ROOD, A.S., COMIDA, A radionuclide food chain model for acute fallout deposition, Health Physics 66 (1994) 17-29.
[5] HWANG, W.T., CHO, G.S., HAN, M.H., Development of a dynamic food chain model DYNACON and its application to Korean agricultural conditions, Journal of Nuclear Science
Technology 35 (1998) 454-461.
[6] LEE, C.W., CHOI, Y.H., HWANG, W.T., LEE, J.H., Nuclides transport analysis and calculation using dynamic model for rice ingestion pathway, Journal of Korean Association for
Radiation Protection 17 (1992) 15-23 (in Korean).
[7] LEE, J.H., CHOI, Y.H., LEE, C.W. et al., A Study on the Radiation and Environmental Safety: Development of the Technology for Terrestrial Radioecology and Food Chain Analysis,
KAERI/RR-1741/96, Korea Atomic Energy Research Institute (1997).
[8] CHOI, Y.H., LIM, K.M., HWANG, W.T. et al., Development of Environmental Radiation Protection Technology : Radioecological Studies on Terrestrial Food Chain Analysis for
Accidental Release, KAERI/RR-2035/99, Korea Atomic Energy Research Institute (2000).
[9] CHOI, Y.H., KIM, S.B., LIM, K.M., PARK, H.K., LEE, W.Y., Incorporation into organically bound tritium and the underground distribution of HTO applied to a simulated rice field, Journal
of Environmental Radioactivity 47 (2000) 279-290.
[10] CHOI, Y.H., KANG, H.S., JUN, I., KEUM, D.K., LEE, H., KIM, S.B., LEE, C.W., Fate of HTO following its acute soil deposition at different growth stages of Chinese cabbage, Journal
of Environmental Radioactivity 97 (2007) 20-29.
[11] MARSCHNER, H., Mineral Nutrition in Higher Plants, Academic Press, London (1986).
[12] MYTTENAERE, C., BOURDEAU, P., MASSET, M., Relative importance of soil and water in the indirect contamination of flooded rice with radiocaesium, Health Physics 16 (1969) 701-707.
[13] D’SOUZA, T.J., MISTRY, K.B., Absorption of gamma-emitting fission products and activation products by rice under flooded and unflooded conditions from two tropical soils, Plant and Soil 55 (1980) 189-198.
[14] CHOI, Y.H., JO, J.S., LEE, C.W., HONG, K.H., LEE, J.H., Root uptake of 54
Mn, 60
Co, 85
Sr and 137
Cs deposited at different times during the growing season of rice, Journal of Korean
Association for Radiation Protection 20 (1995) 255-263 (in Korean).
[15] CHOI, Y.H., PARK, H.K., KIM, S.B., CHOI, G.S., LEE, J.H., Soil-to-plant transfer factors and migration of radionuclides applied onto soil during growing season of cucumber, Korean
Journal of Environmental Agriculture 16 (1997) 304-310 (in Korean).
259
EVOLUTION OF PLANT CONTAMINATION WITH TIME
S. FESENKO
International Atomic Energy Agency, Vienna
N. SANZHAROVA RIARAE, Russian Institute of Agricultural Radiology & Agroecology, Obninsk, Russian Federation
K. TAGAMI NIRS, National Institute of Radiological Sciences, Chiba-shi, Japan
1. BASIC DEFINITIONS
Evaluation of radionuclide transfer in the environment implies consideration of the decrease
of radionuclide activity concentrations in plants in the course of time after single release of
radionuclides into the environment. This arises because radionuclides transferred to the
environment are gradually fixed by natural sorbents (soils, bottom sediments in water
ecosystems, etc.), are lixiviated to lower soil layers and become less biologically available for
inclusion into food chains.
As mentioned earlier1, the long-term, time-dependent behaviour of radionuclides is often
quantified by reference to the ecological half-life, eco
T2/1
, which is an integral parameter that
relates to the reduction of activity or activity concentration in a specific medium. According
to the definition (see section 2.1), eco
T2/1
is equal to the period over which the concentration of a
radionuclide, in some definite component of a trophic chain, is decreased by a factor of two,
but excluding the effects of radioactive decay. Based on this approach, changes in the
radionuclide activity concentrations in plants normalised at the radionuclide activity
concentrations in soil F*v can be estimated as follows.
2/1
693.0
** )0()(T
t
vv eFtF
⋅
−
⋅=
Although field data on variations over time in radionuclide transfer factors after clearly
defined depositions are rather scarce, there are three prime sources of the information on the
radionuclides half-lives in plants: global fallout and the Kyshtym and Chernobyl accidents.
Global fallout represented a variable source term of radionuclides for the environment,
combining foliar and root uptakes, with a maximum depositions observed in 1962-1964.
However, long term monitoring data following the above time period provided an opportunity
for long term half-life assessments for 90
Sr and 137
Cs.
A unique situation for the assessment of environmental half-lives, at least for 137
Cs, developed
after the Chernobyl NPP accident: the single release with well-known characteristics, high
contamination levels, and various conditions of the environment (soil, climate etc.). As a
result, extensive data on 137
Cs bioavailability in soils and soil-plant systems have been
obtained, and the results are discussed below.
1 See paper by Fesenko et al. «Radioecological definitions, soil, plant classifications and reference ecological
data for radiological assessments » in this publication.
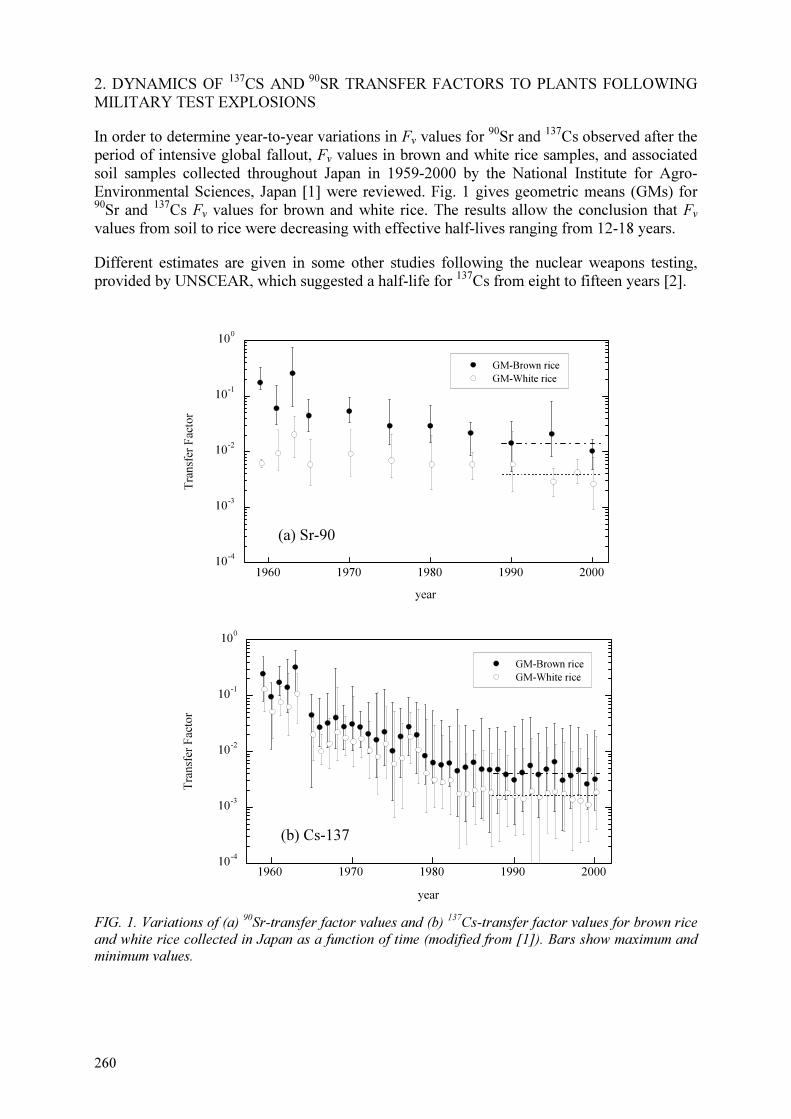
260
2. DYNAMICS OF 137
CS AND 90
SR TRANSFER FACTORS TO PLANTS FOLLOWING
MILITARY TEST EXPLOSIONS
In order to determine year-to-year variations in Fv values for 90
Sr and 137
Cs observed after the
period of intensive global fallout, Fv values in brown and white rice samples, and associated
soil samples collected throughout Japan in 1959-2000 by the National Institute for Agro-
Environmental Sciences, Japan [1] were reviewed. Fig. 1 gives geometric means (GMs) for 90
Sr and 137
Cs Fv values for brown and white rice. The results allow the conclusion that Fv
values from soil to rice were decreasing with effective half-lives ranging from 12-18 years.
Different estimates are given in some other studies following the nuclear weapons testing,
provided by UNSCEAR, which suggested a half-life for 137
Cs from eight to fifteen years [2].
10-4
10-3
10-2
10-1
100
1960 1970 1980 1990 2000
GM-Brown rice
GM-White rice
Tra
nsfe
r F
acto
r
year
(a) Sr-90
10-4
10-3
10-2
10-1
100
1960 1970 1980 1990 2000
GM-Brown rice
GM-White rice
Tra
nsfe
r F
acto
r
year
(b) Cs-137
FIG. 1. Variations of (a) 90
Sr-transfer factor values and (b) 137
Cs-transfer factor values for brown rice
and white rice collected in Japan as a function of time (modified from [1]). Bars show maximum and minimum values.

261
3. DYNAMICS OF 137
Cs AND 90
Sr TRANSFER FACTORS TO PLANTS FOLLOWING
RADIATION ACCIDENTS
The analysis of the dynamics of 137
Cs Fv values has shown that, for a 13-year period after the
Chernobyl accident, v
F reduced 3 to 10 times. This decrease was found to be dependent on
crop type, cultivation practices, and soil properties. The Fv ecological half-lives for two
periods were calculated in a comparative analysis of radionuclide availability for root uptake.
The first period included the years 1987 to 1989, when the fixation of radionuclides (primarily 137
Cs) was most intense; the second covered 1989-1999, when fixation slowed down [3].
Consequently, the dynamics of Fv decrease were described as a sum of two exponentials, and
effective half-lives have been calculated for the time periods 1987 to 1989 and 1989 to 1999
(Table 1) while the average half-lives from 1987-1999 according to [4, 5] are given in
Table 2.
TABLE 1 137
Cs HALF-LIVES IN PLANTS, YEARS [3]
Soil Group The first period, 1987-1989 The second period, 1989-1999
eco
T2/1
)0(*
vF R2
eco
T2/1
)0(*
vF R2
Barley
Sand 1.3 4.3 × 10⁻¹
9.9 × 10⁻¹
6.2 1.4 × 10⁻¹
6.5 × 10⁻¹
Loam 1.9 2.1 × 10⁻¹ 9.8 × 10
-1 6.7 9 × 10
-2 7.1 × 10
-1
Clay 1.4 1.7 × 10⁻¹
9.8 × 10⁻¹
3.8 7 × 10⁻²
8.7 × 10⁻¹
Potato
Sand 1.2 5.7 × 10⁻¹
8.8 × 10⁻¹
7.5 1.2 × 10⁻¹
9.9 × 10⁻¹
Loam 2.4 1.4 × 10⁻¹ 9.8 × 10
-1 8.5 1 × 10
-1 (2.0 × 10
-1)*
Clay 2.9 7 × 10⁻² 9.5 × 10
-1 5.0 4 × 10
-2 6.4 × 10
-1
Beetroot
Sand 2.9 3.2 × 10⁻¹
9.2 × 10⁻¹
5.2 2.9 × 10⁻¹
8.3 × 10⁻¹
Loam 2.6 2.5 × 10⁻¹
8.2 × 10⁻¹
5.9 1.2 × 10⁻¹
9.8 × 10⁻¹
Clay 2.9 1.8 × 10⁻¹ 7.2 × 10
-1 7.2 1.5 × 10
-1 9.6 × 10
-1
Natural Grasses
Sand 1.6 2.9 × 101 9.9 × 10
-1 1.5 × 10
11.8 × 10
1 8.7 × 10
-1
Loam 1.3 7.0 9.9 × 10⁻¹ 4.7 2.3 (3.7 × 10
-1)*
Clay 1.3 3.6 9.9 × 10⁻¹
4.9 1.4 5.6 × 10⁻¹
Organic 1.8 8.3 × 101 8.4 × 10
-1 1.1 × 10
13.0 × 10
1 7.2 × 10
-1
Perennial Grasses
Sand 2.3 1.2 × 101 9.9 × 10
-1 4.8 3.5 9.1 × 10
-1
Loam 2.5 1.2 × 101 9.5 × 10
-1 4.6 6 × 10
-1 6.0 × 10
-1
Clay 2.5 1.9 9.5 × 10⁻¹
1.0 × 101
6.5 × 10⁻¹
6.6 × 10⁻¹
Organic 2.6 2.3 × 101 9.9 × 10
-1 2.1 × 10
19.9 (2.1 × 10
-1)*
*–insufficient data for adequate estimation.

262
TABLE 2 AVERAGE 137Cs
vF HALF-LIVES (1987-1999) [4, 5]
Crop Soil Group Half-lives, years
Sand 7-11.8
Loam 5.1-22.0
Clay 14.4-40.4
Cereal
Peat 9.2-14.4
Sand 7.0-9.2
Loam 10
Clay 13.3
Potato,
Beetroot
Peat 10
Sand 6.4
Loam 4.0
Clay 9.8
Perennial Grasses
Peat 17.3
Sand 5.8
Loam 18.0
Clay 13.3
Natural Grasses
Peat 17.3
The analysis of the results presented suggests the following:
• The initial ecological half-lives for Fv are rather similar for different soil groups and
farm crops and vary between 1.3 and 2.9 years.
• The longer-term ecological half-lives are in the range of 4.6 to 17.3 years, with the
highest Fv values being reported for sand, loam, and organic soils.
It should be taken into account in the analysis that radionuclide transfers to plants depend on
many factors that are responsible for their considerable variations observed under field
conditions. The variability in soil characteristics within each of the identified groups caused a
certain degree of variability in Fv values. In addition, because of the specific weather
conditions of any year, Fv values can vary up to a factor of 3.
There is no information on the systematic observations of variations with time in 90
Sr
concentrations in plants following the Kyshtym accident, while some data on environmental
half-lives in cow milk are available. Peremyslova et al [6] have calculated effective half-life
for 90
Sr in milk of around 20 years for the period 1964-1999.
Although these data can not be directly used for the evaluation of plant contamination with
time, the decline of radionuclide concentrations in animal products can be considered as an
integral parameter that reflects the decrease of environmental mobility of radionuclides and,
in particular, ecological half-lives of radionuclides in plants.
4. CONCLUSIONS
During the years after depositions, the rate of radionuclide transfer to plant declines markedly,
resulting in large changes in contamination of vegetation. Evolution of plant contamination
with time is a complex task requiring analysis of big datasets with time-dependent
information on radionuclide transfer to plants. To date, the most information is available for

263
137Cs. The dynamics of the decrease of
137Cs availability in soil-plant system is considerably
influenced by soil properties, and the rates of decreasing 137
Cs uptake by plants can differ by
the factor of 3-5, being dependent on soil characteristics. The rate of decrease of radionuclide
uptake by plants is irregular by its nature, and several time periods should be considered in
applying a half-life approach for data evaluation.
In the first years after deposition, bioavailability of some radionuclides in soil reaches its
maximum, resulting in maximum radionuclide transfer rate to plants. The data allows the
conclusion that ecological half-lives for 137
Cs in plants are in range of 1-2 years in first years
after the deposition, declining up to 12-20 years in the long term after the deposition. The
half-lives of 90
Sr tend to be slightly longer and can be estimated as 20-30 years.
Unfortunately, existing literature data are rather scarce even for 90
Sr and 137
Cs, and any such
estimates should be interpreted with a great caution. No data are available for radionuclides
other than 90
Sr and 137
Cs, and long-term research is needed to estimate variation over time in
changes of radionuclide transfer of other radionuclides to plants.
REFERENCES
[1] KOMAMURA, M., TSUMURA, A., YAMAGUCHI, N., KIHOU, N., KODAIRA, K.,
Monitoring 90Sr and
137Cs in Rice, Wheat, and Soil in Japan from 1959 to 2000. Miscellaneous
publication of National Institute for Agro-Environmental Sciences 28 Tsukuba (2006).
[2] UNITED NATIONS SCIENTIFIC COMMITTEE on the EFFECTS of ATOMIC RADIATION,
Sources and Biological Effects. United Nations, New York (1988).
[3] FESENKO, S.V., COLGAN, P.A., LISSIANSKI, K.B., VAZQUEZ, C., GUARDANS, R., The dynamics of the transfer of caesium-137 to animal fodder in areas of Russia affected by the
Chernobyl accident and doses resulting from the consumption of milk and milk products, Radiation Protection Dosimetry 69/4 (1997) 289-299.
[4] SANZHAROVA N.I. Radioecological monitoring agroecosystems and agricultural management
in zones of NPP, Doctor thesis, Obninsk 1997 382 (in Russian).
[5] INTERNATIONAL ATOMIC ENERGY AGENCY. Environmental consequences of the Chernobyl accident and their remediation: twenty years of experience. Report of the UN
Chernobyl Forum Expert Group ‘Environment’ (EGE). Vienna, IAEA 2006 166.
[6] PEREMYSLOVA L.M., KOSTYUCHENKO V.A., POPOVA I.Ya., DEGTEVA M.O., TOLSTYKH E.I., TSVETKOVA N.G., Sr-90 and 137
Cs uptake with the diet and internal doses
to the population within the Karachy Trail for the period 1967-2001, Voprosy radiatsionnoi bezopasnosti 3 (2003) 50-59 (In Russian).


AGRICULTURAL ECOSYSTEMS: TRANSFER TO ANIMALS


267
TRANSFER TO ANIMALS
B.J. HOWARD, N.A. BERESFORD, C.L. BARNETT
Centre for Ecology and Hydrology, Lancaster, United Kingdom
S. FESENKO
International Atomic Energy Agency, Vienna
Abstract
Data have been compiled to derive animal product transfer coefficients for radionuclides to update the values given in
Technical Reports Series No. 364. Significant new data inputs have been incorporated from an extensive review of Russian
language information and inclusion of data published since the early 1990s. The resultant database has been used to provide
reference transfer coefficient values for a range of radionuclides to (i) cow, sheep and goat milk, (ii) meat (muscle) of cattle,
sheep, goats, pigs and poultry and (iii) eggs. The approaches and procedures used to identify and collate data, and
assumptions used are given. For most animal products, transfer coefficient values for elements additional to those in
Technical Reports Series No. 364 are provided, although some elements were considered in the earlier evaluation which were
not included in this review. Differences between the Technical Reports Series No. 364 ‘expected’ values and the reference
values from this document, which will be incorporated into the revised transfer parameter handbook, are discussed. An
alternative approach to quantifying transfer by using concentration ratios is evaluated and CR values which could be applied
across animal species have been provided for milk and meat. Information on fractional gastrointestinal absorption in adult
ruminants has been compiled and reference values presented. Despite these improvements many data gaps remain.
1. INTRODUCTION
Contamination of food products derived from both farmed and wild animals can represent
major sources of radiation exposure to humans from both routine and accidental releases of
radioactivity to the environment.
The primary health effect arising from the Chernobyl accident was the development of thyroid
cancers, especially in young children through exposure to radioiodine in contaminated milk
[1]. Animal products were the only agricultural food type requiring intervention outside of the
former Soviet Union after the Chernobyl accident, and in some countries radiocaesium
countermeasures were still being used twenty years after the accident [2].
An understanding of the factors affecting the transfer of radionuclides to, and their behaviour
in, animals is therefore essential if we are to be able to interpret monitoring results, accurately
predict activity concentrations in animal-derived food products and develop effective and
appropriate countermeasures.
Radionuclide activity concentrations in animal food products depend primarily on the rate of
intake, gastrointestinal absorption and turnover in tissues. The extent of available data on
gastrointestinal absorption, transfer to tissues and milk varies widely for different
radionuclides.
2. DATA SOURCES AND ANALYSIS
Information sources such as books, journals, conference proceedings, institutional reports, and
international and national databases were reviewed, and a database created to handle and
process the data derived from five different sources (Figure 1). The database of transfer
parameter values for domestic animals was based on an adaptation of the transfer coefficient
database for meat and milk of Green and Woodman [3], which originally contained data from
292 references. The entries in this database were individually reviewed and revised where
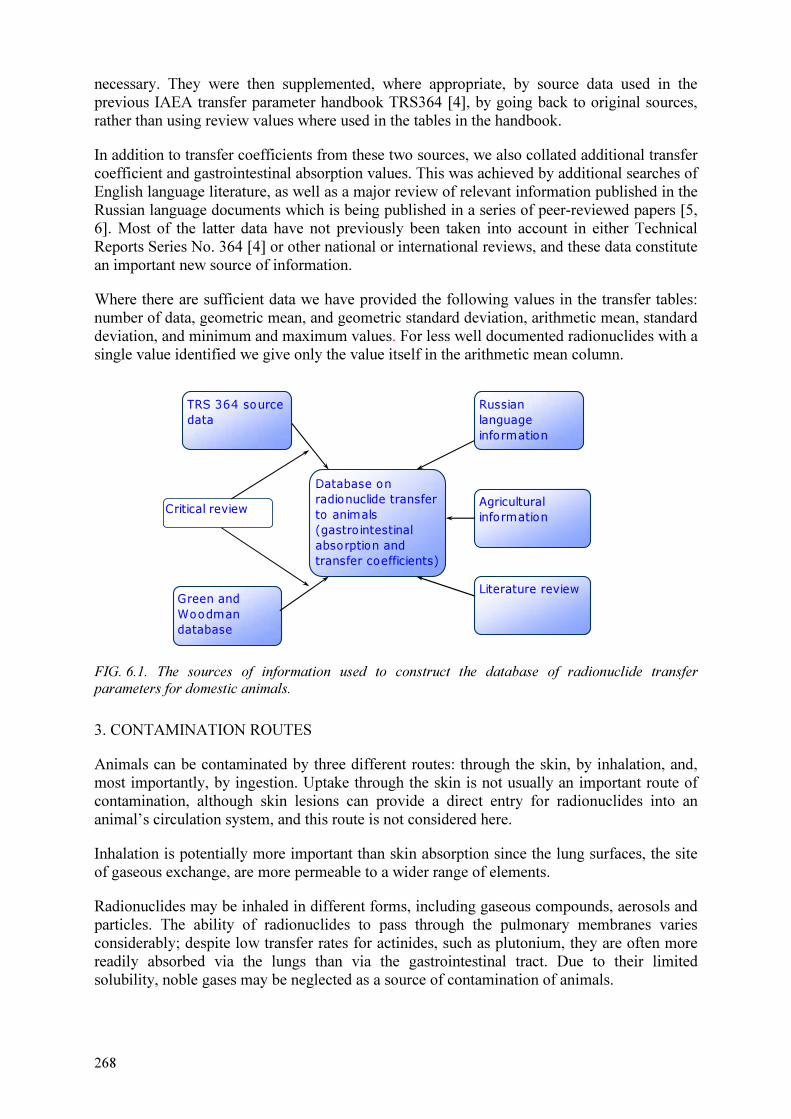
268
necessary. They were then supplemented, where appropriate, by source data used in the
previous IAEA transfer parameter handbook TRS364 [4], by going back to original sources,
rather than using review values where used in the tables in the handbook.
In addition to transfer coefficients from these two sources, we also collated additional transfer
coefficient and gastrointestinal absorption values. This was achieved by additional searches of
English language literature, as well as a major review of relevant information published in the
Russian language documents which is being published in a series of peer-reviewed papers [5,
6]. Most of the latter data have not previously been taken into account in either Technical
Reports Series No. 364 [4] or other national or international reviews, and these data constitute
an important new source of information.
Where there are sufficient data we have provided the following values in the transfer tables:
number of data, geometric mean, and geometric standard deviation, arithmetic mean, standard
deviation, and minimum and maximum values. For less well documented radionuclides with a
single value identified we give only the value itself in the arithmetic mean column.
Literature review
Database on
radionuclide transfer
to animals
(gastrointestinal
absorption and
transfer coefficients)
Green and
Woodman
database
TRS 364 source
data
Russian
language
information
Agricultural
informationCritical review
FIG. 6.1. The sources of information used to construct the database of radionuclide transfer
parameters for domestic animals.
3. CONTAMINATION ROUTES
Animals can be contaminated by three different routes: through the skin, by inhalation, and,
most importantly, by ingestion. Uptake through the skin is not usually an important route of
contamination, although skin lesions can provide a direct entry for radionuclides into an
animal’s circulation system, and this route is not considered here.
Inhalation is potentially more important than skin absorption since the lung surfaces, the site
of gaseous exchange, are more permeable to a wider range of elements.
Radionuclides may be inhaled in different forms, including gaseous compounds, aerosols and
particles. The ability of radionuclides to pass through the pulmonary membranes varies
considerably; despite low transfer rates for actinides, such as plutonium, they are often more
readily absorbed via the lungs than via the gastrointestinal tract. Due to their limited
solubility, noble gases may be neglected as a source of contamination of animals.

269
In contrast, gaseous iodine is readily absorbed. Inhalation, however, is generally not a major
contamination route of agricultural animals and is not considered here. Transfer factors for
ingestion can be modified for inhalation by multiplying by the ratio of a model-estimated
fractional systemic uptake from the respiratory system to the fractional uptake from the
gastrointestinal tract.
The most important transfer pathway to animals is the ingestion of contaminated feed, soil
and drinking water. Intake via drinking water is generally a small contributor to the total
radionuclide intake and normally restricted to soon after an accident. Radionuclide intake via
soil can be significant, but the availability for absorption of soil-associated radionuclides is
often low (see section on transfer). Hence, it is the ingestion of contaminated feed and
processes influencing absorption and retention that usually determines the radionuclide
content of animals.
4. GASTROINTESTINAL ABSORPTION
The degree of absorption from the gastrointestinal tract is generally the most important factor
in determining the degree of radionuclide contamination of animal tissues and milk.
Ruminants have a four compartment stomach: in the first two compartments (rumen and
reticulum) fermentation of chewed vegetation occurs as the gastrointestinal microflora digest
the vegetation and some absorption of breakdown products occurs. The anaerobic, reducing
environment of the rumen can lead to changes in radionuclide speciation and therefore
bioavailability. In the case of radiocobalt, rumen micro-flora synthesise vitamin B12 from
inorganic cobalt and hence radiocobalt ingested in an inorganic form may be absorbed as
vitamin B12 (which affects the transfer and residence times in tissues) [7].
Subsequently, the fermented rumen fluids pass into the omasum and abomasum and are
subject to enzymatic digestion, which is similar to that occurring in the stomach of
monogastric animals. Some fermentation does occur in non-ruminants (e.g. in the caecum in
mammals and the crop of some birds). For some radionuclides, absorption is homeostatically
controlled and the animal’s mineral status with regard to stable isotopes of the radionuclide
(e.g. stable Fe and 55
Fe) or analogous elements (e.g. calcium and radiostrontium) determines
the degree of transfer from the diet to the circulatory system.
Absorption has often been reported as the difference in dietary intake and faecal output,
expressed as a proportion of dietary intake (the apparent absorption coefficient, Aa). Whilst
for some radionuclides this approach will provide an accurate estimate of absorption, it is too
insensitive to measure absorption from sources with a low availability and negative values of
absorption can be derived.
The calculation also does not take into account endogenous secretion of absorbed
radioactivity from the body to faeces which may be important for some radionuclides (e.g.
liver excretion via bile) For example, endogenous excretion of radiocaesium in ruminants is
typically 20-25 % of that absorbed. The absorption of some radionuclides has been measured
in ruminants as the true absorption coefficient (At), which takes endogenous secretion of
radionuclides into the gastrointestinal tract into account [8].
A discussion of the relative benefits of the different methods of estimating At and suitable
protocols by which such studies can be conducted is given in [8, 9]. Previously reported
fractional absorption values have been estimated by a number of methods [10-13] some of

270
which measure apparent absorption (Aa) rather than true absorption since they do not take
account of endogenous excretion. Recently, substantial new information has been made
available from Russian language publications [5] using methodologies that give true
absorption values.
Absorption of most essential elements is controlled by dietary supply and the animal’s
requirement (absorption tending to decrease with increasing dietary concentrations when
requirement is met) and, in some instances, other essential elements (e.g. interactions between
Ca and P, Fe and Zn etc.). A frequent limitation of the radioecological data reported here is
that there is no information on dietary intakes of relevant stable elements and information is
often lacking on the animal’s nutritional requirements or status.
4.1. Absorption in Ruminants
Here, we report fractional absorption values for ruminants (Table 1) derived from either the
database or from authoritative agricultural reviews for many of the radionuclides which are
isotopes of essential nutrient elements (e.g. Ca, Cl, P, Na, Zn). Data on 90
Sr 137
Cs and 131
I
comprise more than 50 % of the total entries. Detailed discussion of the derivation of the
values and literature used can be found in Howard et al. submitted [14].
Where we have used agricultural review values we have occasionally extended the reported
range given using values from the database. The values presented largely represent those that
may be expected from ingestion of contaminated feeds.
We have not used data where there may have been effects on absorption of high stable
element intakes (e.g. Cd). We also omitted a few values that previous reviews have
considered because we had concerns about the validity, or relevance, of the data. Values in
Table 1 were derived from ruminants aged over 100 days since there is evidence for enhanced
absorption in young animals [5].
Some previous publications have derived values of absorption from tissue retention only, after
single oral administrations (in some instances after considerable time gaps) or daily ingestion
of radionuclides. We have not used such data here because losses via excreta and milk are not
accounted for.
For radiocaesium, we excluded some values derived from sources of known low
bioavailability (e.g. contaminated soils/sediments), but there were insufficient data to make
such exclusions for other elements.
The fractional absorption values for the different radionuclides in ruminants have been
grouped into orders of magnitude in Table 2.
The absorption of the three major dose determining radionuclides varies; it is complete for
radioiodine, and higher for radiocaesium than radiostrontium. The absorption of essential
elements is, not surprisingly, relatively high. In contrast, elements with high atomic weights,
which are not essential elements, or analogues of essential elements, are poorly absorbed from
the gastrointestinal tract. For example, the absorption of transuranic elements, such as Pu, is
low compared with that of many elements. Some factors influencing absorption in ruminants
are discussed below.

TA
BL
E 1
. G
AS
TR
OIN
TE
ST
INA
L F
RA
CT
ION
AL
AB
SO
RP
TIO
N V
AL
UE
S1 F
OR
AD
UL
T R
UM
INA
NT
S T
AK
EN
FR
OM
TH
E D
AT
AB
AS
E A
ND
AN
IMA
L
NU
TR
ITIO
N R
EV
IEW
S2
Rad
ionucl
ide
N
Fra
ctio
nal
abso
rpti
on
Sourc
e3
GM
2
GS
D
AM
S
D
Min
M
ax
Ag
1
5.6
× 1
0-2
At :
dat
abas
e [1
5]
Am
2
1
.4 ×
10
-4
1
.4 ×
10
-4
1.4
× 1
0-4
A
t :
dat
abas
e [1
6]
Ba
2
5.5
× 1
0-2
5.0
× 1
0-2
6
.0 ×
10
-2
At :
dat
abas
e
Ca
3
.0 ×
10
-1
8
.0 ×
10
-2
4.2
× 1
0-1
N
RC
ad
vis
ed v
alue
for
fora
ge
wit
h r
eport
ed r
ange
[17
]
Cd
1
1
.2 ×
10
-3
A
t : d
atab
ase
[18]
Ce
5
6.1
× 1
0-4
2
.9
9.9
× 1
0-4
1
.2 ×
10
-3
1.9
× 1
0-4
3
.0 ×
10
-3
At a
nd A
a :
dat
abas
e
Cl
9
.0 ×
10
-1
7
.1 ×
10
-1
1.0
N
RC
ad
vis
ed v
alue
for
all
feed
stuff
s w
ith r
eport
ed
range
[17]
Co
9
4
.7 ×
10
-2
2.9
5
.4 ×
10
-2
2.8
× 1
0-2
1
.5 ×
10
-2
1.1
× 1
0-1
A
t and A
a :
dat
abas
e
Cs
14
8
.0 ×
10
-1
1.1
8
.0 ×
10
-1
8.2
× 1
0-2
6
.7 ×
10
-1
9.3
× 1
0-1
A
t :
See
tex
t, e
xcl
udes
dat
a w
her
e bio
avai
labil
ity i
s
low
due
to c
hem
ical
form
and v
alues
fro
m [
5]
Fe
1
.0 ×
10
-1
2
.0 ×
10
-2
2.0
× 1
0-1
N
RC
ad
vis
ed v
alue
for
fora
ge
[17]
I 1
3
9.8
× 1
0-1
1
.4
9.9
× 1
0-1
1
.1 ×
10
-1
7.0
× 1
0-1
1.1
D
atab
ase
, A
t only
Mn
7.5
× 1
0-3
5.0
× 1
0-3
4
.0 ×
10
-2
NR
C a
dvis
ed v
alue
and m
axim
um
[17],
min
imum
fro
m d
atab
ase
Na
9.0
× 1
0-1
7.4
× 1
0-1
1.0
N
RC
ad
vis
ed v
alue
wit
h r
eport
ed r
ange
[17]
Nb
1
>
1.4
× 1
0-3
Aa :
dat
abas
e [1
9]
P
6.7
× 1
0-1
5.8
× 1
0-1
1
.0
NR
C
advis
ed
val
ue
for
fora
ge/
conce
ntr
ates
w
ith
range
[17]
Pb
9
4
.0 ×
10
-2
2.2
5
.0 ×
10
-2
3.1
× 1
0-2
1
.0 ×
10
-2
1.1
× 1
0-1
D
atab
ase,
all
Aa
Pm
1
>5.2
× 1
0-4
Aa ;
dat
abas
e [1
9]
271

TA
BL
E 1
. G
AS
TR
OIN
TE
ST
INA
L F
RA
CT
ION
AL
AB
SO
RP
TIO
N V
AL
UE
S1 F
OR
AD
UL
T R
UM
INA
NT
S T
AK
EN
FR
OM
TH
E D
AT
AB
AS
E A
ND
AN
IMA
L
NU
TR
ITIO
N R
EV
IEW
S2 (C
ont.
)
Rad
ionucl
ide
N
Fra
ctio
nal
abso
rpti
on
Sourc
e3
GM
2
GS
D
AM
S
D
Min
M
ax
Pu
3
8.5
× 1
0-5
1
.4
8.8
× 1
0-5
2
.9 ×
10
-5
6.5
× 1
0-5
1
.2 ×
10
-4
At :
bas
ed o
n p
aper
s ci
ted i
n r
evie
w o
f B
eres
ford
et
al.
[9]
Ru
6
5.8
× 1
0-3
4
.9
1.7
× 1
0-2
2
.8 ×
10
-2
1.4
× 1
0-3
7
.1 ×
10
-2
At :
dat
abas
e
Se
5
.2 ×
10
-1
4
.0 ×
10
-1
6.5
× 1
0-1
N
RC
rep
ort
ed r
ange
for
feed
for
rum
inan
ts [
17],
mea
n e
stim
ated
fro
m r
eport
ed r
ange
Sr
21
1
.1 ×
10
-1
2.0
1
.2 ×
10
-1
6.2
× 1
0-2
5
.5 ×
10
-2
2.7
× 1
0-1
A
t :
dat
abas
e. S
ee t
ext
excl
udes
val
ues
for
low
Ca
inta
kes
Te
1
>1
.6 ×
10
-1
A
a :
dat
abas
e [2
0]
Y
2
1.2
× 1
0-3
5.0
× 1
0-4
1
.9 ×
10
-3
At :
dat
abas
e [1
9,
21]
U
2
1.1
× 1
0-2
1.0
× 1
0-2
1
.2 ×
10
-2
At :
dat
abas
e [2
2;
23]
Zn
1
.5 ×
10
-1
5
.3 ×
10
-2
3.1
× 1
0-1
N
RC
advis
ed v
alue
[17],
min
imum
fro
m d
atab
ase
and m
axim
um
fro
m A
RC
[24]
Zr
1
6.8
× 1
0-3
At:
dat
abas
e [2
5]
1S
om
e val
ues
are
ap
par
ent
abso
rpti
on
– t
hes
e ar
e id
enti
fied
in
th
e so
urc
e co
lum
n; 2 G
M i
s giv
en w
hen
n≥
3,
oth
erw
ise
on
ly A
M i
s giv
en; 3S
ou
rce
is s
pec
ifie
d a
s ag
ricu
ltu
ral
revie
w d
ata
(NR
C 2
00
1–
Nat
ion
al R
esea
rch
Co
un
cil
[17]
and
AR
C 1
98
0–
Agri
cult
ura
l R
esea
rch
Co
un
cil
[25])
or
the
refe
ren
ces
use
d f
rom
dat
a co
mpil
atio
n, u
nle
ss n
>5
wh
en t
he
refe
ren
ces
are g
iven
in t
he
text.
No
te s
um
mar
ise
val
ues
rep
rese
nt
mea
ns
as r
epo
rted
in
th
e li
tera
ture
and
do
no
t re
flec
t ra
nges
ob
serv
ed b
etw
een
in
div
idu
al a
nim
als
2 72

273
TABLE 2 GROUPING OF FRACTIONAL ABSORPTION VALUES FOR DIFFERENT
ELEMENTS IN RUMINANTS
Fractional absorption magnitude Radionuclide
10-1
– 1 I, Cl, Na, Cs, P, Se, Ca, Te, Zn, Sr, Fe
10-2
–10-1
Ag, Ba, Co, Pb, U
10-3–
10-2
Mn, Ru , Cd, Y
10-4–
10-3
Zr, Ce , Pm, Am, Nb
10-5–
10-4
Pu
Most forms of iodine are rapidly reduced to iodide within the digestive tract [26]. Therefore, it
is unlikely that the source of radioiodine ingested by lactating ruminants will be a major factor
in determining its activity concentration in milk. For radioiodine, absorption has previously
been reported to be complete regardless of the source of radioiodine [9] or dietary stable
iodine intake [27]. The fractional absorption value for I of 1.0 in Table 1 is consistent with
these previous recommendations.
In the case of radiocaesium, the source ingested is a major factor determining subsequent
concentrations in tissues and milk with the true absorption coefficient ranging from <0.10 to
>0.80 when all data are considered. Absorption of particle or soil-associated radiocaesium is
considerably lower than that within plants. Sources with a low bioavailability were excluded
from Table 1.
The variation in At for radiostrontium, with values ranging in the entire database from 0.05–
0.72, does not appear to be related to source. The behaviour of strontium is strongly
influenced by that of its analogue, calcium, which is a homeostatically controlled essential
element [28].
The extent of calcium absorption in the gastrointestinal tract is governed by the animal’s
calcium requirement which depends on factors such as age, growth rate and milk yield [16,
25, 29]. At a given calcium requirement, there is an inverse relationship between the
absorption of calcium and the amount of calcium in the diet [25]. Beresford et al. [9] have
suggested an inverse relationship between the ratio between the calcium intake and
requirement and the true absorption of radiostrontium in ruminants (Figure 2). Under normal
levels of calcium intake, the source of radiostrontium ingested is unlikely to influence either
the extent of absorption or the concentrations in tissues and milk to any great extent [9].
0.0
0.2
0.4
0.6
0.8
1.0
1.2
1.4
1.6
0.0 1.0 2.0 3.0 4.0
Ca I/R
Rad
iostr
on
tiu
m A
t
Goats
Cattle
Sheep
At = 0.41 / (I/R)
FIG. 2. Relationship between true absorption of radiostrontium and the ratio of calcium intake to requirement (Ca I/R).

274
The geometric mean fractional absorption value derived for Sr from the database is 0.11. The
data from the Russian literature tends to be lower than that from elsewhere, possibly because
the animals were slaughtered only one day after radioisotope administration and absorption
estimated from body retention. This value is somewhat lower than that previously reported by
Beresford et al. [9] which is consistent with previous recommendations such as those of
Coughtrey and Thorne [10] although the latter include Russian data with low Ca intakes.
There are a considerable number of data in the literature documenting changes in
gastrointestinal absorption with age. The decrease of fractional absorption with age may be
due to the lower permeability of the membranes of the gastrointestinal wall of mature animals
compared with young animals which have a greater need to absorb a wide range of nutrients
and essential elements.
Some of the best evidence for the decline in fractional absorption values with age has been
reported for 90
Sr. Long-term, large-scale experiments measuring variation in 90
Sr fractional
absorption values with age were carried out by Burov et al. [31, 32] and by Panchenko et al.
[33]. As Figure 3 demonstrates, there are considerable reductions with age in fractional
absorption for all species, which is likely to be the result of high calcium requirements for
skeletal development as well as the decreasing efficiency of calcium absorption with
increasing age [16]. Further evidence of changes in fractional absorption values with age have
also been collated for ruminants by Fesenko et al. [5] for 137
Cs, 65
Zn, 59
Fe and 60
Co and 238
U.
1 10 100 1000
D
0.0
0.2
0.4
0.6
0.8
1.0
Ab
so
rpti
on
co
eff
icie
nt,
fra
cti
on
- Cattle (Burov et al., 1971)
- Sheep (Burov et al., 1969)
A
10 100 1000
D
0.0
0.2
0.4
0.6
0.8
1.0
Absorp
tion c
oeff
icie
nt, fra
ction
- Pigs (Panchenko et al., 1974)
- Goats (Burov et al., 1974)
B
FIG. 3. Change with age in the true absorption coefficients of 90
Sr for: cattle and sheep (a) and pigs
and goats (b) [5, 31-34].
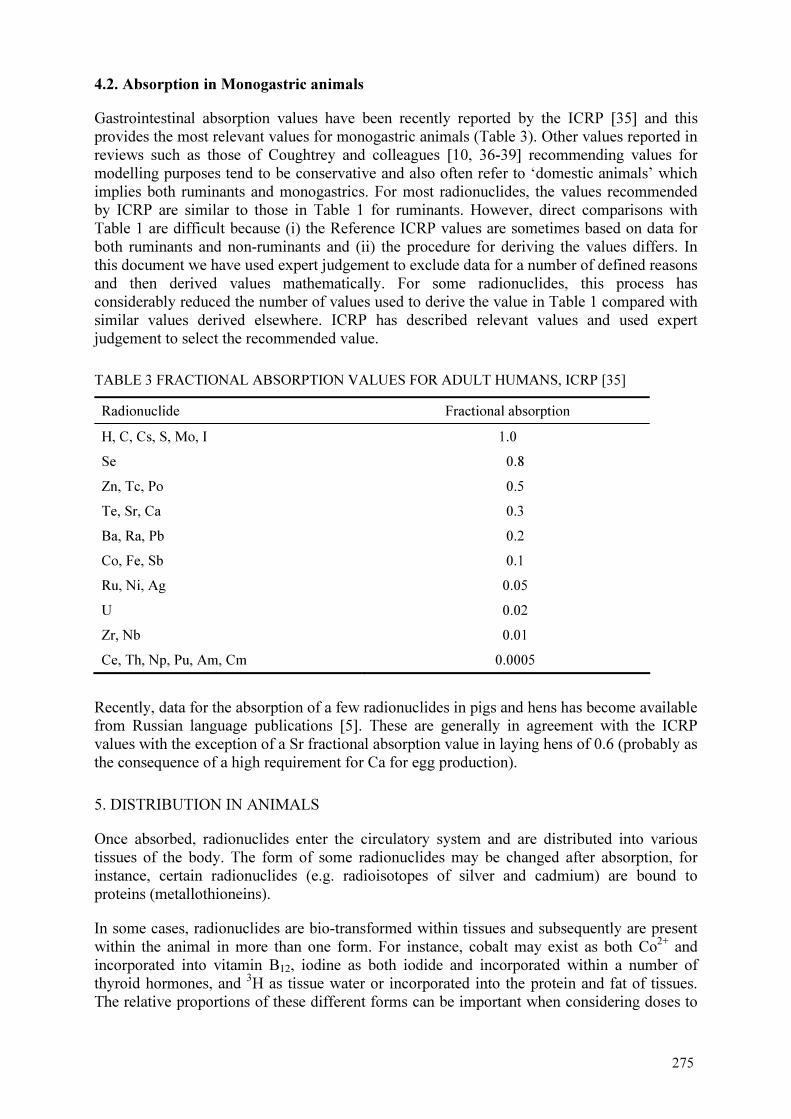
275
4.2. Absorption in Monogastric animals
Gastrointestinal absorption values have been recently reported by the ICRP [35] and this
provides the most relevant values for monogastric animals (Table 3). Other values reported in
reviews such as those of Coughtrey and colleagues [10, 36-39] recommending values for
modelling purposes tend to be conservative and also often refer to ‘domestic animals’ which
implies both ruminants and monogastrics. For most radionuclides, the values recommended
by ICRP are similar to those in Table 1 for ruminants. However, direct comparisons with
Table 1 are difficult because (i) the Reference ICRP values are sometimes based on data for
both ruminants and non-ruminants and (ii) the procedure for deriving the values differs. In
this document we have used expert judgement to exclude data for a number of defined reasons
and then derived values mathematically. For some radionuclides, this process has
considerably reduced the number of values used to derive the value in Table 1 compared with
similar values derived elsewhere. ICRP has described relevant values and used expert
judgement to select the recommended value.
TABLE 3 FRACTIONAL ABSORPTION VALUES FOR ADULT HUMANS, ICRP [35]
Radionuclide Fractional absorption
H, C, Cs, S, Mo, I 1.0
Se 0.8
Zn, Tc, Po 0.5
Te, Sr, Ca 0.3
Ba, Ra, Pb 0.2
Co, Fe, Sb 0.1
Ru, Ni, Ag 0.05
U 0.02
Zr, Nb 0.01
Ce, Th, Np, Pu, Am, Cm 0.0005
Recently, data for the absorption of a few radionuclides in pigs and hens has become available
from Russian language publications [5]. These are generally in agreement with the ICRP
values with the exception of a Sr fractional absorption value in laying hens of 0.6 (probably as
the consequence of a high requirement for Ca for egg production).
5. DISTRIBUTION IN ANIMALS
Once absorbed, radionuclides enter the circulatory system and are distributed into various
tissues of the body. The form of some radionuclides may be changed after absorption, for
instance, certain radionuclides (e.g. radioisotopes of silver and cadmium) are bound to
proteins (metallothioneins).
In some cases, radionuclides are bio-transformed within tissues and subsequently are present
within the animal in more than one form. For instance, cobalt may exist as both Co2+
and
incorporated into vitamin B12, iodine as both iodide and incorporated within a number of
thyroid hormones, and 3H as tissue water or incorporated into the protein and fat of tissues.
The relative proportions of these different forms can be important when considering doses to

276
human consumers as the form ingested can influence the degree of absorption and retention of
the radionuclide. Other radionuclides (e.g. radiocaesium) remain in an ionic form after
absorption.
Different radionuclides are accumulated in different tissues (Table 4). For some radionuclides,
the site of deposition is determined by the biological role of the corresponding stable element
or analogue. The major iodine storage organ in the body is the thyroid and the element is also
actively taken up by the mammary gland and transferred into milk. The stable iodine status of
an animal will directly affect the behaviour of radioiodine: animals with a low stable iodine
status will accumulate proportionally more in the thyroid whereas those with an excess of
iodine may secrete proportionally more to milk. Radiostrontium behaves as a Ca analogue and
is therefore accumulated in bone and also transferred into milk. Radiocaesium is an analogue
of potassium and is, therefore, found in all soft tissues particularly muscle.
The influence of an animal’s potassium status on radiocaesium behaviour is unclear although
it appears to be considerably less than that of calcium on the behaviour of radiostrontium.
Strontium, radium, plutonium and rare earth elements are all accumulated in bone. Liver and
kidneys are common storage tissues for many pollutants including some radionuclides (e.g.
actinide elements). Carbon-14, 3H,
35Cl and
35S, all of which are released by the nuclear
industry or present in waste products, are rather special cases since they have stable isotopes
that are basic constituents of animals’ tissues.
TABLE 4. TARGET ORGANS FOR SELECTED RADIONUCLIDES
Radionuclide Target organ Reference
Ag Liver [40]
Am Bone and liver [39]
Ce Bone and liver [14]
Co1 Liver [7]
Cs All soft tissue and milk [41]
I Thyroid and milk [42]
Pu Bone and liver [38]
Ru Kidney [14]
Sr Bone and milk [41]
Tc Thyroid, liver and stomach wall [37] 1Co-vitamin B12
6. TRANSFER TO ANIMAL PRODUCTS
The transfer coefficient was first proposed (in the open literature) as a measure of the transfer
of radionuclides to animal-derived food products by Ward et al. [43] to describe the transfer
of radiocaesium from the diet to the milk of dairy cattle. They defined the transfer coefficient
as the ratio between the radiocaesium activity concentration in milk and the daily dietary
radionuclide intake. Ward et al. [43] reported that this parameter exhibited less variability
between individual animals within the experimental herd than expressing transfer as the total
amount of Cs excreted in milk expressed as a percentage of intake. The same authors also
defined the meat transfer coefficient as the ratio of the 137
Cs activity concentration in boneless
meat to the dietary daily 137
Cs intake [44].
Other early papers by the same group define transfer coefficient as a percentage and not a
fraction [45-46]. In further discussion of the use of the transfer coefficient, Ward and Johnson

277
[47] commented that the wider use of the diet to milk transfer coefficient, Fm, appeared to be
justified and that factors such as stable element intake, soil intake, milk production rate,
metabolic rate and inhalation could be ignored for most situations. However, they had
previously acknowledged that assessment of transfer coefficients was based primarily on Cs
data for cow milk and noted the lack of critical evaluations for other species and radionuclides
[48].
To estimate transfer coefficients the dietary composition of the animal must be quantified. For
agricultural animals this varies according to feeding strategies (indoors or grazing),
maintenance requirements, agricultural practices and diet composition and characteristics
such as dry matter digestibility. The relative proportion of grass, grain and other dietary
constituents is important in determining radionuclide intake by agricultural animals, since
grassy vegetation tends to be more highly contaminated. Typical dietary constituents for
agricultural animals vary between and within countries, and with season.
Following the publications of Ward and co-workers in the 1960’s, the transfer coefficient was
widely adopted as the basis for quantifying transfer to both milk (Fm, d L-1
or d kg-1
) and meat
(Ff, d kg-1
) for all radionuclides (the definition in later publications generally being the
equilibrium ratio of the activity concentration in milk/meat to the daily dietary radionuclide
intake). By the late 1970’s–early 1980’s, transfer coefficient values were being recommended
for most radionuclide-animal product combinations [49-52]; such recommended values are
incorporated into many food chain models [53-56].
6.1. Factors influencing estimation of transfer coefficients
In contrast to the statement by Ward and Johnson [47], a number of authors have reported
variations in transfer coefficients for some radionuclides.
6.1.1. Intake estimation
Confidence in estimates of the amount of feed intake by experimental animals is clearly
greater for most experimental studies under controlled conditions than it is for field studies
where intake is often not measured. For the latter, different approaches are used for estimating
mass intake, some based on agricultural production criteria but others using ‘expert’
judgement and this can lead to variability in reported Fm values [3].
6.1.2. Assumption of equilibrium
By definition, for a transfer coefficient to be valid the radionuclide activity concentration in
tissues or milk needs to be at equilibrium with the dietary intake of the radionuclide. There
can be considerable temporal variation in an animal’s intake of radionuclides and hence tissue
concentrations may be constantly changing. In the case of milk (the product for which Ward
et al. [46] originally suggest transfer coefficients) an approximate equilibrium is reached
rapidly for many radionuclides. However, experimental observations, from which transfer
coefficients are derived, are often not conducted for long enough for equilibrium to have been
reached in tissues or milk. The requirement of equilibrium conditions is often not met for
radionuclides with short physical half lives or for those radionuclides with long radioactive
and biological half lives in tissues (Pu) so that activity concentrations in tissues will not have
equilibrated with the diet by the time of slaughter. For this reason, dynamic models describing
the behaviour of radionuclides within animal tissues have been developed. These models can

278
be used to predict radionuclides activity concentrations in different tissues following
continuous, single or varying intakes [14, 57-59].
6.1.3. Physicochemical form
Physicochemical form affects transfer to tissue, mostly through changing the extent of
gastrointestinal absorption. The best documented example of an effect of form is for
radiocaesium, where transfer coefficients vary with a number of factors. Differences of over
two orders of magnitude in transfer coefficients to the milk and meat of ruminants have been
reported for different environmental dietary sources of radiocaesium, including soils,
sediments, milk (for suckling lambs) and fungi [60-63].
Furthermore, Voigt et al. [63] noted differences in radiocaesium transfer coefficients to hen
eggs and meat between contaminated wheat and grass pellet diets. Further variation in transfer
coefficients has been explained by metabolic factors including dietary intake rates [64],
lactation [65] and exercise [66].
After the Chernobyl accident transfer coefficients for recently deposited radiocaesium were
reported to be lower than for plant-incorporated radiocaesium [47, 60, 61, 67]. The proportion
of soil-associated radionuclides is an important factor affecting overall transfer to animals.
The ingestion of soil adhered to vegetation can be the major source of radionuclide intake,
especially for those radionuclides that have low soil-plant transfer [68]. For radiocaesium,
although soil adhered to ingested vegetation often forms an important component of the total
radiocaesium intake [69, 70], it is generally not an important contribution to radiocaesium in
animal-derived products [71]. This is because the transfer of radiocaesium associated with
mineral soil to animal products is much lower than the transfer of radiocaesium from
vegetation [62].
However, for certain scenarios the ingestion of radiocaesium via soil/sedimentary adhesion
can be important. For example, animals grazing tidally inundated pastures near the Sellafield
reprocessing plant, can ingest over 90 % of their radiocaesium intake in the form of
contaminated silt particles deposited by the tide on vegetation surfaces, and roughly 60 % of
radiocaesium in the animal tissues can be estimated to be derived from the ingestion of
contaminated silt [72]. However, because of the low bioavailability of the sediment associated
radiocaesium, contamination of animals is lower than would be expected for plant-
incorporated sources [73].
6.1.4. Effect of age/body weight
Transfer coefficients of radionuclides are generally higher to animals with a lower body mass
[74]. Thus, for instance, transfer coefficients to lambs will generally be larger than those to
ewes. For food production purposes, the liveweight at slaughter will be the most relevant
basis for estimation.
6.1.5. Stable element
The clearest example of the effect of stable element analogue status on radionuclide transfer
coefficients is that for radiostrontium transfer with respect to Ca intake. A relationship
(Fig. 4) between the transfer coefficient for radiostrontium to milk and calcium intake has
been proposed [75, 76]:

F SrOR Ca
Im
milk diet milk
Ca
=
×−
[ ] (1)
where FmSr is the transfer coefficient of radiostrontium to milk; [Ca]milk the concentration of
calcium in milk; ICa the daily intake of calcium and ORmilk-diet the observed ratio between the
diet and milk. The observed ratio is a measure of the discrimination in the transfer of
strontium from the diet to milk compared with that of calcium [77], i.e.:
ORSr Ca
Sr Camilk diet
milk milk
diet diet
−
=
[ ] [ ]
[ ] [ ] (2)
1.E-04
1.E-03
1.E-02
1.E-01
0 50 100 150 200 250 300 350
Dietary calcium intake (g d-1
)
FmSr
Goat
Cattle
Sheep
Predicted 2.6 g/kg Ca
Predicted 1 g/kg Ca
FIG. 4. Comparison between calcium intake and Fm for strontium in ruminants based on Beresford et al. [76-78]. The lines represent predicted values from equation 6.2 based upon calcium contents in
milk of 1 g kg-1
for cows and goats and 2.6 g kg-1
and sheep.
6.2. Transfer to milk
Whilst compiling the database we did not use review values, in most cases the original data
were consulted. Source information for the database included Fm values derived from:
i. experiments with daily administration of radionuclides to animals, or stable elements
in the feed, for which the estimated plateau concentration could be divided by the
daily intake;
ii. experiments (of an adequate length) where following a single oral administration of an
isotope, the time-integrated activity concentration in milk could be estimated, for
instance, by measuring the fraction of the total activity recovered in milk and dividing
by the daily rate of milk secretion;
iii. for elements where we did not have Fm values we used the approach adopted
previously by Ng et al.[50] of comparing stable element concentrations in milk with
those in feeds reported by agricultural science review publications and assuming a
daily herbage intake (see detailed explanation below).
For some literature, critical information was missing from the document. Where we felt it was
justified to do so, we derived values using the following guidelines:
i. If daily herbage intake or daily milk output were not given we assumed values from
similar literature in the same decade (this was often taken from papers by the same
authors);
77 279
280
ii. Excluded low bioavailability sources for Cs Fm values (see text below);
iii. Excluded experimental data for animals where the diet was deficient in the element
considered (e.g. < 40 g Ca d-1
for cattle, where the information was provided, when
determining Sr Fm values);
iv. Excluded experimentally increased stable element intake data and only used data for
control animals. For some elements there is good evidence that increasing stable
element intakes does not lead to a proportional increase in the milk concentrations
(e.g. Cd, Zn). In situations where animals are ingesting higher than normal rates of the
elements of interest (e.g. heavy metals), then the transfer parameters we have derived
in the tables below will overestimate concentrations in milk.
Reports by Ng et al. [49-52] constituted a major source of information for Technical Reports
Series No. 364 [4]. Unfortunately, for many of the data reported for different elements it is not
possible to trace the reference sources used as only a bibliographic reference number is given
in the Ng et al.references. Therefore, where it was not possible to identify source material we
have largely confined our use of the Ng et al.information to comparisons with other sources.
The agricultural literature contains a wealth of data on many stable elements in milk and
herbage which can be used to derive transfer parameters.
We have used a number of key reviews [16, 25, 79-85] to identify typical concentrations of
elements within milk and herbage from which we have derived concentration ratios for cow,
sheep, goat and horse milk. By assuming dry matter intake rates of 16 kg d-1
DM for lactating
cows and 1.5 kg d-1
DM for sheep and goats, we have also estimated transfer coefficient
values. This may potentially overestimate transfer, as for some nutrient elements a
considerable proportion of the diet may be supplied in feed supplements within developed
farming systems (i.e. we may have underestimated the nutrient intake rate). There is
obviously variation in dry matter intake (DMI) but this is unlikely to influence the derived Fm
numbers by more than a factor of 2-3 (DMI is not required for the estimation of CR).
Many of the stable elements considered will be under homeostatic control and transfer will
therefore not be linear with intake rate. However, given the large databases we have based
these values on, they are likely to be representative of ‘typical values’ taking into account the
provisos above. Where this method has been used to select the recommended value of Fm it is
identified on the tables below.
6.2.1. Transfer coefficients
Tables 5, 6 and 7 give the Fm values for cow, sheep and goat milk. All data for Fm values
below are in units of d L-1
. The type of data source is specified for each element in the table.
For cow milk there were adequate data in the database to derive values for most of the
elements whereas for sheep and goat milk stable element compilation was used more often.
Where recommended values are derived from the database, summary statistics are provided in
the tables; if derived from stable element review data only the best estimate is presented. This
work has resulted in Fm values being recommended for a number of additional elements not
included in Technical Reports Series No. 364 [4]:
Cow – Be, Cd, Cl, Cu, P, Pb, Se, W and Zn
Goat – Ca, Cd, Ce, Co, Cr, Fe, Mn, Na, Ni, P, Pb, Pm, Po, S, Se, U, Y and Zn
Sheep – Ba, Ca, Cd, Co, Cr, Fe, Mn, Na, Ni, P, Pb, S, Te and Zn.
The review considered any isotope (including the stable element) for most radionuclides and
the recommended Fm values are based upon an analyses of values derived for all of these.

281
In some instances, Fm values derived from the database are based on stable element data only.
These have been used in preference to values derived from the stable element review as they
are based upon paired milk-feed samples. However, in most case values derived from both
stable element approaches are in close agreement with each other.
The only exception to the approaches used to derive Fm values in Tables 5-7 was the Pu Fm
value for cow milk which was taken from the critical review of Howard et al. [86] (see
below).
In many instances, the Fm values presented in Tables 5-7 are similar to those in Technical
Reports Series No. 364 [4] although often based on more data. Where there are substantial
variations (near or over an order of magnitude) between the geometric mean values presented
here and the recommended values in Technical Reports Series No. 364 [4] these differences
are discussed below.
Some elements in Technical Reports Series No. 364 milk tables [4] were not included in
Tables 5-7, in particular:
3H – It is recommended that Fm values are not used for this radionuclide, an alternative
approach is given below1.
Mg & Cu – Not selected for consideration in this work
Tc – The Technical Reports Series No. recommended isotope specific values for cow
and goat milk. Studies of the transfer of Tc to animals have tended to use the short-lived
gamma-emitting radioisotopes 99m
Tc and 95m
Tc. These studies have shown considerable
isotope-specific variation in transfer. Ennis et al. [87] report the transfer of 99m
Tc to the
milk of goats to be 1.5 × 10⁻⁴
d l-1
, compared with values of 8.5 × 10⁻⁴
d l-1
and 1.1 × 10-
2 d l
-1 for
95mTc and
99Tc respectively. Other reviewers have suggested that
99mTc and
95mTc data should not be used to model
99Tc [88]. The Fm values of Ennis et al. were
inversely proportional to the specific activity of the three Tc isotopes. The authors
suggested that this is due to the differential rates of reduction of pertechnate between the
three isotopes in the rumen. However, neither Ennis et al. nor the accompanying paper
of Johnson et al. [89] give details of the amount of Tc administered and it therefore
makes it difficult to comment on the relevance of their results for determining transfer at
likely environmental levels. Given this uncertainty we have not included recommended
values in the tables presented here. Data for the transfer of Tc isotopes for cattle and
goats can be found in Ennis et al. [87], Johnson et al. [89], Voigt et al. [90], Von
Wiechen et al. [91], Jones et al. [92] and Bondietti and Garten [93].
Cow Milk
In the case of Cr, the value derived here is more than an order of magnitude greater than in
Technical Reports Series No. 364 [4]. The latter was based upon a single reported value
(which is included in the database compiled here) whereas the revised value is based upon
three values. Additionally, the dietary source used in the studies quoted in Technical Reports
Series No. 364 [4] may have had comparatively low availability (the Cr source was
chromate).
The Fm value for Ni in Table 5 is over an order of magnitude lower than the Technical
Reports Series No. 364 [4] value. However, the Technical Reports Series No. 364 [4] value
1 See Davis et al. ‘Specific activity models and parameter values for tritium, 14C and 36Cl’ in this publication.
282
was based on a model prediction and did not consider any actual data; the value recommended
here derived from the database is similar to that which can be derived from stable element
reviews of 5 × 10⁻³
d kg-1
.
The Ca value reported here is almost an order of magnitude higher than that in Technical
Reports Series No. 364 [4]. The value recommended in Technical Reports Series No. 364 [4]
cannot be checked because it is wrongly referenced. We are confident that the value
recommended here is reasonable as it is approximately one order of magnitude higher than
that for Sr which is to be expected given that the observed ratio between the transfer of Ca
and Sr from the diet to milk is generally accepted to be circa 0.1 [76]. The Fm values
recommended in Technical Reports Series No. 364 [4] for Sr and Ca were approximately
equal and therefore unlikely to be reliable.
The value recommended here for Pu is nearly an order of magnitude higher than that in
Technical Reports Series No. 364 [4]. The value in Table 5 is based upon the finding of recent
experimental work and a recent critical evaluation [86].
The value for U transfer to cow milk of 1.8 × 10⁻³
d L-1
in Table 5, which is based on three
Russian language data sources, seems rather high taking into account the gastrointestinal
absorption value. The value can be compared with the value in Ng et al. [50] of 7.3 × 10⁻⁵
d L-
1 based on unpublished data obtained at a weapons test site and 6.1 × 10
-4 d L
-1 based on a
single unreferenced balance study of linked milk and vegetation assuming 10 kg d-1
(DW)
herbage intake. Thorne [94], in a recent review of the Ng et al. [50, 51] values and those of
Prister [22] (which contains the same information as one of the original data used in Table 5),
derived an Fm value of 2.0 × 10⁻⁴
d L-1
with a range of 6.0 × 10⁻⁵
–6.0 × 10⁻⁴
d L-1
. The Fm
value of 4.0 × 10⁻⁴
d L-1
recommended in Technical Reports Series No. 364 has an incorrect
data source attributed to it.
Table 5 does not give a value for Np, the Technical Reports Series No. 364 value for Np is
taken from Ng et al. [49], who refers to recommended review values from [55]. We have not
used review values in our compilation.
Goat milk
There were no substantial differences between the geometric mean values in Table 6 and the
recommended values given in Technical Reports Series No. 364 [4]. An Fm value for Pu given
for goat milk in Technical Reports Series No. 364 is based on a model derivation by
Coughtrey [10], but there are no supporting relevant data so it is not included in Table 6.
Sheep milk
The Pu Fm value given here (Table 7) is more than an order of magnitude higher than that in
Technical Reports Series No. 364 [4]. It is based upon the study of Beresford et al. [96] and
for sheep grazing a UK salt marsh contaminated by marine discharges from the Sellafield
reprocessing plant. Such data would not be used for Cs as the bioavailability is known to be
comparatively low. However, evidence is not available to suggest a low bioavailability of Pu
to animals for this area [9]. Furthermore, the recommended value is reasonable compared to
that in Table 5 for cow milk.
An Fm value for Am for sheep milk was recommended in Technical Reports Series No. 364
this was based on a model derivation by Coughtrey [10]. However, there are no supporting
data and hence it is not included in Table 7. The Technical Reports Series No. 364 value for
Ag was derived from milk activity concentrations reported as the limit of detection; such
values are not included in this review.

TA
BL
E 5
. T
RA
NS
FE
R C
OE
FF
ICIE
NT
S F
OR
RA
DIO
NU
CL
IDE
TR
AN
SF
ER
TO
CO
W M
ILK
d L
-1
Ele
men
t N
G
M
GS
D
AM
S
D
Min
M
ax
So
urc
e
Am
1
4.2
× 1
0-7
Dat
abas
e
Ba
15
1
.6 ×
10-4
2.7
2.5
× 1
0-4
2.4
× 1
0-4
3.8
× 1
0-5
7.3
× 1
0-4
D
atab
ase–
incl
udes
sta
ble
dat
a
Be
1
8.3
× 1
0-7
Dat
abas
e
Ca
15
1
.0 ×
10-2
1.7
1.2
× 1
0-2
5.9
× 1
0-3
4.0
× 1
0-3
2.5
× 1
0-2
D
atab
ase–
incl
udes
sta
ble
dat
a
Cd
8
1.9
× 1
0-4
15
1.9
× 1
0-3
3.4
× 1
0-3
1.8
× 1
0-6
8.4
× 1
0-3
D
atab
ase–
incl
udes
sta
ble
dat
a
Ce
6
2.0
× 1
0-5
5.8
4.7
× 1
0-5
4.9
× 1
0-5
2.0
× 1
0-6
1.3
× 1
0-4
D
atab
ase
Co
4
1.1
× 1
0-4
2.0
1.3
× 1
0-4
1.1
× 1
0-4
6.0
× 1
0-5
3.0
× 1
0-4
D
atab
ase
Cr
3
4.3
× 1
0-4
26
2.0
× 1
0-3
2.1
× 1
0-3
1.0
× 1
0-5
4.3
× 1
0-3
D
atab
ase–
incl
udes
sta
ble
dat
a
Cs
28
8
4.6
× 1
0-3
2.0
6.1
× 1
0-3
6.3
× 1
0-3
6.0
× 1
0-4
6.8
× 1
0-2
D
atab
ase–
incl
udes
sta
ble
dat
a
Fe
7
3.5
× 1
0-5
2.0
4.2
× 1
0-5
2.7
× 1
0-5
1.0
× 1
0-5
9.7
× 1
0-5
D
atab
ase–
incl
udes
sta
ble
dat
a
I 1
04
5
.4 ×
10-3
2.4
9.1
× 1
0-3
7.0
× 1
0-3
4.0
× 1
0-4
2.5
× 1
0-2
D
atab
ase–
incl
udes
sta
ble
dat
a
Mn
4
4.1
× 1
0-5
4.9
1.0
× 1
0-4
1.5
× 1
0-4
7.0
× 1
0-6
3.3
× 1
0-4
D
atab
ase
Mo
7
1.1
× 1
0-3
2.3
1.5
× 1
0-3
1.7
× 1
0-3
4.3
× 1
0-4
5.2
× 1
0-3
D
atab
ase–
incl
udes
sta
ble
dat
a
Na
7
1.3
× 1
0-2
2.0
1.6
× 1
0-2
1.5
× 1
0-2
5.0
× 1
0-3
5.0
× 1
0-2
D
atab
ase–
incl
udes
sta
ble
dat
a
Nb
1
4.1
× 1
0-7
Dat
abas
e
Ni
2
9.5
× 1
0-4
6.5
× 1
0-4
1.3
× 1
0-3
D
atab
ase–
stab
le d
ata
only
P
2.0
× 1
0-2
Fro
m s
table
ele
men
t re
vie
w d
ata
Pb
15
1
.9 ×
10-4
1.0
3.3
× 1
0-4
3.5
× 1
0-4
7.3
× 1
0-6
1.2
× 1
0-3
D
atab
ase–
incl
udes
sta
ble
dat
a
Po
4
2.1
× 1
0-4
1.8
2.3
× 1
0-4
9.7
× 1
0-5
8.9
× 1
0-5
3.0
× 1
0-4
D
atab
ase
Pu
1.0
× 1
0-5
Rec
ent
revie
w p
aper
Ra
11
3
.8 ×
10-4
2.3
5.1
× 1
0-4
3.8
× 1
0-4
9.0
× 1
0-5
1.4
× 1
0-3
D
atab
ase
Ru
6
9.4
× 1
0-6
8.5
3.6
× 1
0-5
5.3
× 1
0-5
6.7
× 1
0-7
1.4
× 1
0-4
D
atab
ase
S
1
7.9
× 1
0-3
Dat
abas
e
Sb
3
3.8
× 1
0-5
2.5
5.2
× 1
0-5
5.1
× 1
0-5
2.0
× 1
0-5
1.1
× 1
0-4
D
atab
ase
Se
12
4
.0 ×
10-3
2.1
5.2
× 1
0-3
4.5
× 1
0-3
1.5
× 1
0-3
1.6
× 1
0-2
D
atab
ase–
incl
udes
sta
ble
dat
a
Sr
15
4
1.3
× 1
0-3
1.7
1.5
× 1
0-3
8.1
× 1
0-4
3.4
× 1
0-4
4.3
× 1
0-3
D
atab
ase–
incl
udes
sta
ble
dat
a
Te
11
3.4
× 1
0-4
2.4
4.5
× 1
0-4
2.9
× 1
0-4
7.8
× 1
0-5
1.0
× 1
0-3
D
atab
ase
U
3
1.8
× 1
0-3
3.5
2.9
× 1
0-3
2.9
× 1
0-3
5.0
× 1
0-4
6.1
× 1
0-3
D
atab
ase
W
7
1.9
× 1
0-4
3.1
2.9
× 1
0-4
2.4
× 1
0-4
3.4
× 1
0-5
6.8
× 1
0-4
D
atab
ase
Zn
8
2.7
× 1
0-3
3.9
4.3
× 1
0-3
3.0
× 1
0-3
1.3
× 1
0-4
9.0
× 1
0-3
D
atab
ase–
incl
udes
sta
ble
dat
a
Zr
6
3.6
× 1
0-6
4.3
7.1
× 1
0-6
6.9
× 1
0-6
5.5
× 1
0-7
1.7
× 1
0-5
D
atab
ase
283

TA
BL
E 6
. T
RA
NS
FE
R C
OE
FF
ICIE
NT
S F
OR
RA
DIO
NU
CL
IDE
TR
AN
SF
ER
TO
GO
AT
MIL
K d
L-1
Ele
men
t N
G
M*
G
SD
A
M
SD
M
in
Max
S
ou
rce
Am
2
6.9
× 1
0-6
3.7
× 1
0-6
1.0
× 1
0-5
D
atab
ase
Ba
3
1.1
× 1
0-2
9.9
5.4
× 1
0-2
8.7
× 1
0-2
2.1
× 1
0-3
1.5
× 1
0-1
D
atab
ase–
incl
udes
sta
ble
dat
a
Ca
12
7
.3 ×
10-2
1.9
8.3
× 1
0-2
3.4
× 1
0-2
1.2
× 1
0-2
1.4
× 1
0-1
D
atab
ase–
incl
udes
sta
ble
dat
a
Cd
1
1.6
× 1
0-2
Dat
abas
e–st
able
dat
a only
Ce
1
4.0
× 1
0-5
Dat
abas
e
Co
1
5.0
× 1
0-3
Dat
abas
e–st
able
dat
a only
Cr
2
1.5
× 1
0-2
2.9
× 1
0-3
2.8
× 1
0-2
D
atab
ase–
stab
le d
ata
only
Cs
28
1
.1 ×
10-1
2.2
1.3
× 1
0-1
8.0
× 1
0-2
7.0
× 1
0-3
3.3
× 1
0-1
D
atab
ase–
stab
le d
ata
only
Fe
5.2
× 1
0-2
Fro
m s
table
ele
men
t re
vie
w d
ata
I 2
4
2.2
× 1
0-1
2.9
3.3
× 1
0-1
2.3
× 1
0-1
2.7
× 1
0-2
7.7
× 1
0-1
D
atab
ase
Mn
1
.0 ×
10-3
Fro
m s
table
ele
men
t re
vie
w d
ata
Mo
4
8.2
× 1
0-3
1.4
8.5
× 1
0-3
2.5
× 1
0-3
5.0
× 1
0-3
1.1
× 1
0-2
D
atab
ase–
incl
udes
sta
ble
dat
a
Na
1
.2 ×
10-1
Fro
m s
table
ele
men
t re
vie
w d
ata
Nb
1
6.4
× 1
0-6
Dat
abas
e
Ni
2
8.3
× 1
0-2
3.2
× 1
0-3
1.6
× 1
0-1
D
atab
ase–
stab
le d
ata
only
Np
1
5.3
× 1
0-5
Dat
abas
e
P
2
.9 ×
10-1
Fro
m s
table
ele
men
t re
vie
w d
ata
Pb
1
6.0
× 1
0-3
Dat
abas
e–st
able
dat
a only
Pm
1
2.7
× 1
0-5
Dat
abas
e
Po
2
2.3
× 1
0-3
1.8
× 1
0-3
2.7
× 1
0-3
D
atab
ase
S
12
3
.8 ×
10-2
1.7
4.3
× 1
0-2
1.9
× 1
0-2
1.6
× 1
0-2
6.8
× 1
0-2
D
atab
ase–
incl
udes
sta
ble
dat
a
Se
2
6.9
× 1
0-2
5.9
× 1
0-2
7.9
× 1
0-2
D
atab
ase–
stab
le d
ata
only
Sr
21
1
.6 ×
10-2
2.0
2.1
× 1
0-2
2.0
× 1
0-2
5.8
× 1
0-3
8.1
× 1
0-2
D
atab
ase–
incl
udes
sta
ble
dat
a
Te
1
4.4
× 1
0-3
Dat
abas
e
U
1
1.4
× 1
0-3
Dat
abas
e
Y
1
2.0
× 1
0-5
Dat
abas
e
Zn
6
.4 ×
10-2
Fro
m s
table
ele
men
t re
vie
w d
ata
Zr
1
5.5
× 1
0-6
Dat
abas
e
* W
here
the v
alu
e i
s d
eri
ved f
rom
a s
table
ele
ment
revie
w i
t is
not
a G
M
284
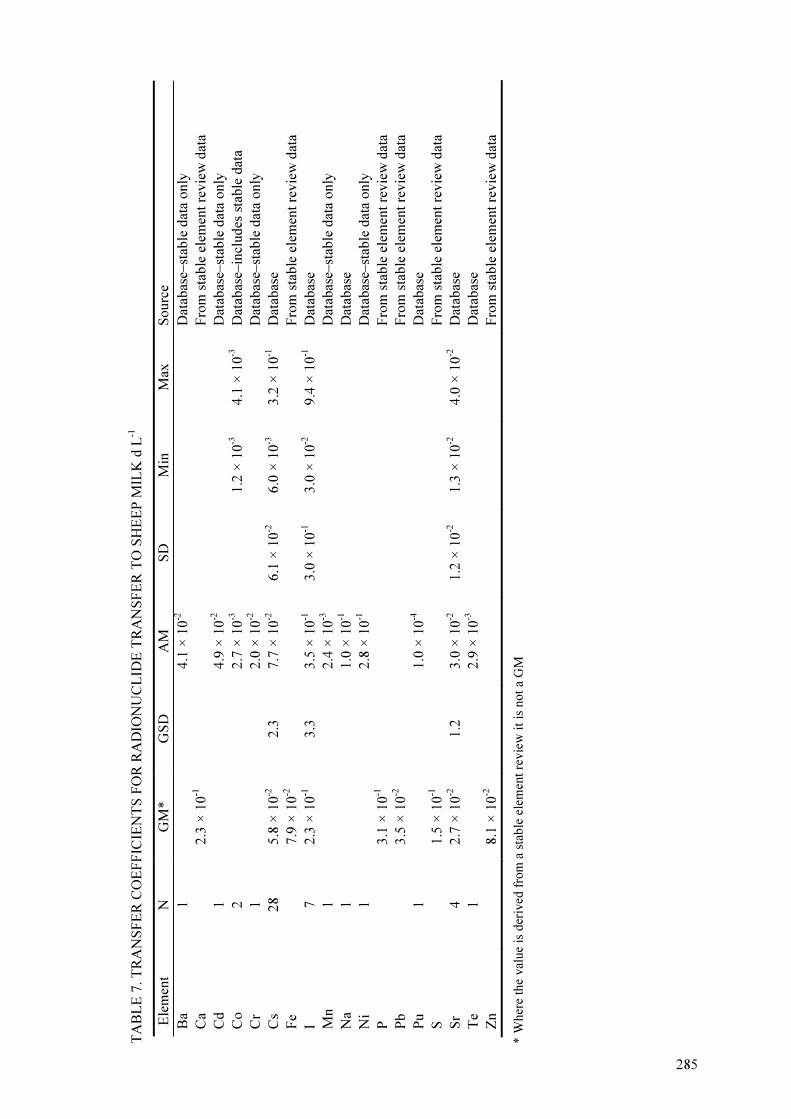
TA
BL
E 7
. T
RA
NS
FE
R C
OE
FF
ICIE
NT
S F
OR
RA
DIO
NU
CL
IDE
TR
AN
SF
ER
TO
SH
EE
P M
ILK
d L
-1
Ele
men
t N
G
M*
G
SD
A
M
SD
M
in
Max
S
ou
rce
Ba
1
4.1
× 1
0-2
Dat
abas
e–st
able
dat
a only
Ca
2.3
× 1
0-1
Fro
m s
table
ele
men
t re
vie
w d
ata
Cd
1
4.9
× 1
0-2
Dat
abas
e–st
able
dat
a only
Co
2
2.7
× 1
0-3
1.2
× 1
0-3
4.1
× 1
0-3
D
atab
ase–
incl
udes
sta
ble
dat
a
Cr
1
2.0
× 1
0-2
Dat
abas
e–st
able
dat
a only
Cs
28
5
.8 ×
10-2
2.3
7.7
× 1
0-2
6.1
× 1
0-2
6.0
× 1
0-3
3.2
× 1
0-1
D
atab
ase
Fe
7
.9 ×
10-2
Fro
m s
tab
le e
lem
ent
revie
w d
ata
I 7
2
.3 ×
10-1
3.3
3.5
× 1
0-1
3.0
× 1
0-1
3.0
× 1
0-2
9.4
× 1
0-1
D
atab
ase
Mn
1
2.4
× 1
0-3
Dat
abas
e–st
able
dat
a only
Na
1
1.0
× 1
0-1
Dat
abas
e
Ni
1
2.8
× 1
0-1
Dat
abas
e–st
able
dat
a only
P
3
.1 ×
10-1
Fro
m s
table
ele
men
t re
vie
w d
ata
Pb
3
.5 ×
10-2
Fro
m s
tab
le e
lem
ent
revie
w d
ata
Pu
1
1.0
× 1
0-4
Dat
abas
e
S
1
.5 ×
10-1
Fro
m s
table
ele
men
t re
vie
w d
ata
Sr
4
2.7
× 1
0-2
1.2
3.0
× 1
0-2
1.2
× 1
0-2
1.3
× 1
0-2
4.0
× 1
0-2
D
atab
ase
Te
1
2.9
× 1
0-3
Dat
abas
e
Zn
8
.1 ×
10-2
Fro
m s
tab
le e
lem
ent
revie
w d
ata
* W
here
the v
alu
e i
s d
eri
ved f
rom
a s
table
ele
ment
revie
w i
t is
not
a G
M
285

286
6.2.2. Concentration ratios – an alternate method of quantifying transfer to animal products
Over the last 40 years following the introduction of the transfer coefficient concept many
studies have been conducted to determine values for a range of radionuclide – animal
products. On the basis of these studies, it is generally accepted that transfer coefficients for
smaller animals are higher than those for larger animals, and that those for adults are lower
than those for (smaller) young livestock. Beresford et al. [97] suggest that much of this
difference could be because transfer coefficients incorporate dry matter intake which
increases with animal size.
Smith et al. [98] used the recommended milk and meat radiocaesium transfer coefficient
values for different farm animals from Technical Reports Series No. 364 [4] together with
recommended dry matter intake rates to estimate CR values (Table 8). Whilst the transfer
coefficient values for meat varied over three orders of magnitude from 10 d kg-1
(chicken) to
7.9 × 10⁻³
d kg-1
(beef) the range in estimated CR values was only two-fold. Similarly,
estimated CR values for milk varied approximately two-fold compared to the roughly order of
magnitude range in Fm values. Concentration ratio values for meat and milk, estimated from
the data given in Technical Reports Series No. 364 [4] for most other radionuclides would
also have a considerably lower variability between species than that seen for recommended
transfer coefficients. The similarity in CR values between species should perhaps not be
surprising given that the concentrations of many elements in meat or milk are similar across
species [99-100]; Table 8 demonstrates this for potassium (a chemical analogue of caesium).
The use of concentration ratios for radioisotopes of the macro-elements S, H and C rather than
transfer coefficients has been suggested by Howard et al. [101] and Galeriu et al. [102] as the
elemental contents of meat and milk do not vary significantly with factors, such as milk yield
and live-weight, which influence dry matter intake rates and hence estimated transfer
coefficients.
Differences in dry matter intake may also contribute to the higher transfer coefficients
observed for younger livestock compared with adults. For instance, Beresford et al. [96]
presents CR and Ff values for two groups of sheep, adult ewes and lambs, fed vegetation
contaminated with 60
Co, 95
Nb, 106
Ru, 134
Cs, 137
Cs, 238
Pu, 239,240
Pu and 241
Am. Transfer
coefficients suggested significantly higher transfer of radionuclides from the vegetation to the
tissues of lambs compared with ewes more frequently than did transfer expressed as CR; the
daily dry matter intake rate of the lambs was 0.6 kg d-1
compared with 0.9 kg d-1
for the ewes.
TABLE 8. RECOMMENDED TRANSFER COEFFICIENTS FOR RADIOCAESIUM AND DRY
MATTER FEED INTAKE RATES [4] AND ESTIMATED CONCENTRATION RATIOS,
TYPICAL POTASSIUM CONCENTRATIONS ARE ALSO SHOWN (ADAPTED FROM SMITH
ET AL. [98])
Animal Daily dry matter
intake (kg d-1)
Ff (d kg-1) or
Fm, (d l-1)
CR
[dimensionless]
Typical K concentration
(mg kg-1 FW)
Milk
Cow 16.1 7.9 × 10⁻³ 0.13 1430
Goat 1.3 1.0 x 10⁻¹ 0.13 1930
Sheep 1.3 5.8 × 10⁻² 0.075 1370
Meat
Beef 7.2 5.0 × 10⁻² 0.36 3040
Lamb 1.1 4.9 x 10⁻¹ 0.54 3060
Pork 2.4 2.4 x 10⁻¹ 0.58 3765
Chicken 0.07 1.0 x 101 0.7 2570
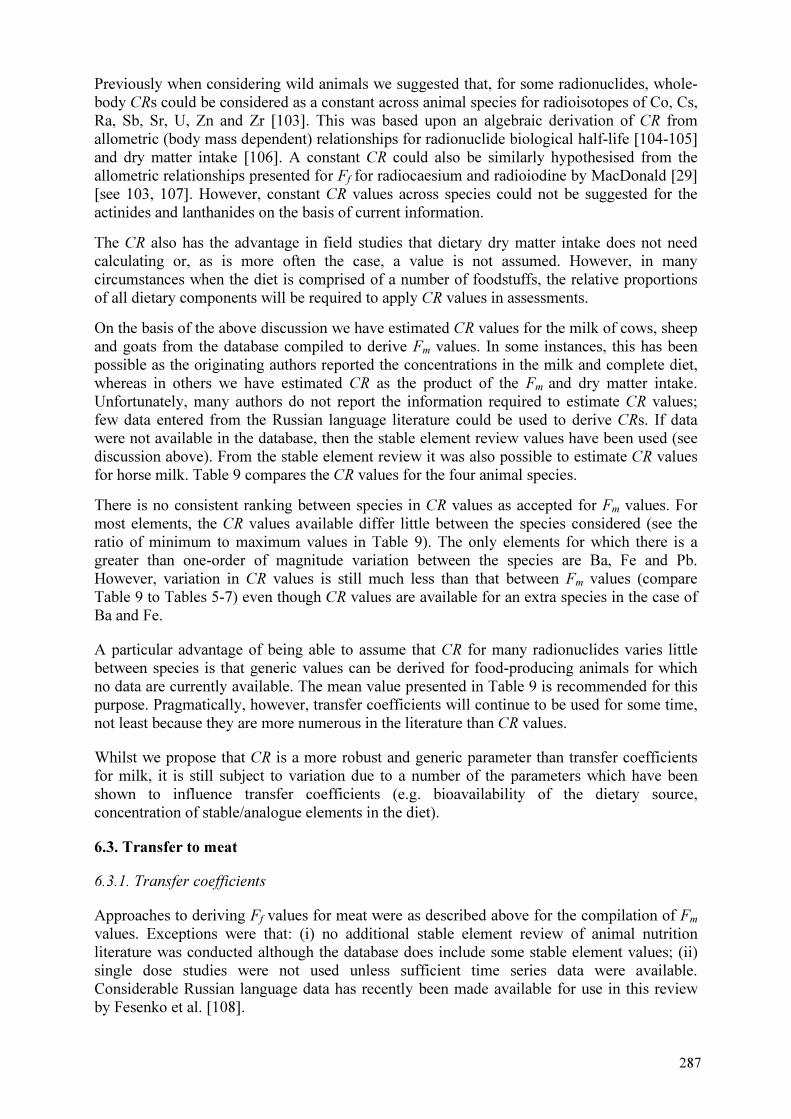
287
Previously when considering wild animals we suggested that, for some radionuclides, whole-
body CRs could be considered as a constant across animal species for radioisotopes of Co, Cs,
Ra, Sb, Sr, U, Zn and Zr [103]. This was based upon an algebraic derivation of CR from
allometric (body mass dependent) relationships for radionuclide biological half-life [104-105]
and dry matter intake [106]. A constant CR could also be similarly hypothesised from the
allometric relationships presented for Ff for radiocaesium and radioiodine by MacDonald [29]
[see 103, 107]. However, constant CR values across species could not be suggested for the
actinides and lanthanides on the basis of current information.
The CR also has the advantage in field studies that dietary dry matter intake does not need
calculating or, as is more often the case, a value is not assumed. However, in many
circumstances when the diet is comprised of a number of foodstuffs, the relative proportions
of all dietary components will be required to apply CR values in assessments.
On the basis of the above discussion we have estimated CR values for the milk of cows, sheep
and goats from the database compiled to derive Fm values. In some instances, this has been
possible as the originating authors reported the concentrations in the milk and complete diet,
whereas in others we have estimated CR as the product of the Fm and dry matter intake.
Unfortunately, many authors do not report the information required to estimate CR values;
few data entered from the Russian language literature could be used to derive CRs. If data
were not available in the database, then the stable element review values have been used (see
discussion above). From the stable element review it was also possible to estimate CR values
for horse milk. Table 9 compares the CR values for the four animal species.
There is no consistent ranking between species in CR values as accepted for Fm values. For
most elements, the CR values available differ little between the species considered (see the
ratio of minimum to maximum values in Table 9). The only elements for which there is a
greater than one-order of magnitude variation between the species are Ba, Fe and Pb.
However, variation in CR values is still much less than that between Fm values (compare
Table 9 to Tables 5-7) even though CR values are available for an extra species in the case of
Ba and Fe.
A particular advantage of being able to assume that CR for many radionuclides varies little
between species is that generic values can be derived for food-producing animals for which
no data are currently available. The mean value presented in Table 9 is recommended for this
purpose. Pragmatically, however, transfer coefficients will continue to be used for some time,
not least because they are more numerous in the literature than CR values.
Whilst we propose that CR is a more robust and generic parameter than transfer coefficients
for milk, it is still subject to variation due to a number of the parameters which have been
shown to influence transfer coefficients (e.g. bioavailability of the dietary source,
concentration of stable/analogue elements in the diet).
6.3. Transfer to meat
6.3.1. Transfer coefficients
Approaches to deriving Ff values for meat were as described above for the compilation of Fm
values. Exceptions were that: (i) no additional stable element review of animal nutrition
literature was conducted although the database does include some stable element values; (ii)
single dose studies were not used unless sufficient time series data were available.
Considerable Russian language data has recently been made available for use in this review
by Fesenko et al. [108].

TA
BL
E 9
. C
ON
CE
NT
RA
TIO
N R
AT
IOS
FO
R T
HE
MIL
K O
F D
IFF
ER
EN
T A
NIM
AL
S1
Co
w
Goat
S
hee
p
Hors
e M
ean
Rat
io
Ele
men
t C
R
SD
M
in
Max
N
C
R
SD
M
in
Max
N
C
R
SD
M
in
Max
N
C
R
All
spec
ies
Min
/ M
ax
Ba
1.3
× 1
0-2
1.6
× 1
0-3
1.2
× 1
0-2
1.5
× 1
0-2
3
1.2
× 1
0-1
1
.4 ×
10
-22
.3 ×
10
-1
2
6.1
× 1
0-2
1
3
.5 ×
10
-35
.0 ×
10
-2
2.9
× 1
0-2
Ca
2.5
× 1
0-1
2.0
× 1
0-1
8.3
× 1
0-2
1.3
× 1
0-1
2.9
× 1
0-1
4
3
.4 ×
10
-1
1
.5 ×
10
-12
.4 ×
10
-1
4.4
× 1
0-1
Cd
4
.3 ×
10
-27
.4 ×
10
-2 2
.7 ×
10
-5 1
.3 ×
10
-13
2
.4 ×
10
-2
1
7.4
× 1
0-2
1
4
.7 ×
10
-2
3.3
× 1
0-1
Cl
6.9
× 1
0-2
1
6
.9 ×
10
-2
Ce
3.2
× 1
0-3
1
3
.2 ×
10
-3
Co
2
.5 ×
10
-3
1
7.6
× 1
0-3
1
6
.2 ×
10
-3
1
5.4
× 1
0-3
3
.3 ×
10
-1
Cr
4.0
× 1
0-2
3
.7 ×
10
-2 4
.3 ×
10
-22
4
.1 ×
10
-2
1
3
.0 ×
10
-2
1
3.7
× 1
0-2
7
.2 ×
10
-1
Cs
1.1
× 1
0-1
1.2
× 1
0-1
3.6
× 1
0-3
6.9
× 1
0-1
11
91
.8 ×
10
-16
.5 ×
10
-26
.3 ×
10
-23
.0 ×
10
-1
12
1
.7 ×
10
-11
.3 ×
10
-12
.0 ×
10
-25
.8 ×
10
-11
7
1.5
× 1
0-1
6
.4 ×
10
-1
Fe
1.2
× 1
0-3
2.4
× 1
0-4
1.0
× 1
0-3
1.5
× 1
0-3
3
3.4
× 1
0-2
1
5
.2 ×
10
-2
1
9.3
× 1
0-3
2.4
× 1
0-2
2
.4 ×
10
-2
I 3.0
× 1
0-1
2.8
× 1
0-1
3.0
× 1
0-3
7.9
× 1
0-1
44
5
.0 ×
10
-15
.8 ×
10
-18
.4 ×
10
-21
.2
3
5.8
× 1
0-1
2.5
× 1
0-1
2.5
× 1
0-1
8.8
× 1
0-1
5
4.6
× 1
0-1
5
.2 ×
10
-1
Mn
4.5
× 1
0-3
8
.6 ×
10
-4 8
.2 ×
10
-32
1
.5 ×
10
-3
1
3.6
× 1
0-3
1
1.6
× 1
0-3
2.8
× 1
0-3
3
.2 ×
10
-1
Mo
2
.8 ×
10
-21
.3 ×
10
-2 1
.9 ×
10
-2 4
.3 ×
10
-23
2
.7 ×
10
-2
1
2.1
× 1
0-2
2.5
× 1
0-2
7
.5 ×
10
-1
Na
3.7
× 1
0-1
2
.3 ×
10
-1 5
.0 ×
10
-12
1
.8 ×
10
-1
1
.6 ×
10
-1
6.0
× 1
0-2
1.9
× 1
0-1
1
.6 ×
10
-1
Nb
1
.0 ×
10
-5
1
1.9
× 1
0-5
1
1.5
× 1
0-5
5
.3 ×
10
-1
Ni
8.2
× 1
0-2
2.5
× 1
0-1
1
4
.2 ×
10
-1
1
2.5
× 1
0-1
1
.9 ×
10
-1
P
3.1
× 1
0-1
4.3
× 1
0-1
4.7
× 1
0-1
1.8
× 1
0-1
3.5
× 1
0-1
3
.8 ×
10
-1
Pb
2
.4 ×
10
-31
.3 ×
10
-3 9
.9 ×
10
-4 4
.3 ×
10
-37
9
.0 ×
10
-3
1
3.0
× 1
0-2
1
1
.4 ×
10
-2
7.9
× 1
0-2
Po
2
.4 ×
10
-3
1
2.4
× 1
0-3
S
1.4
× 1
0-1
1
6
.1 ×
10
-23
.0 ×
10
-23
.5 ×
10
-21
.0 ×
10
-1
4
2.3
× 1
0-1
1.4
× 1
0-1
2
.7 ×
10
-1
Sb
2
.7 ×
10
-3
1
2.7
× 1
0-3
Se
5.7
× 1
0-2
4.5
× 1
0-2
2.6
× 1
0-2
1.5
× 1
0-1
7
3.5
× 1
0-2
4
.6 ×
10
-2
6.2
× 1
0-1
Sr
2.3
× 1
0-2
2.2
× 1
0-2
5.0
× 1
0-3
1.4
× 1
0-1
43
4
.4 ×
10
-24
.4 ×
10
-21
.6 ×
10
-21
.2 ×
10
-1
5
4
.4 ×
10
-23
.7 ×
10
-2
5.2
× 1
0-1
T
e 8
.0 ×
10
-3
4.8
× 1
0-3
1.1
× 1
0-2
2
1.2
× 1
0-2
1
1.0
× 1
0-2
6
.7 ×
10
-1
U
5.0
× 1
0-3
5.0
× 1
0-3
Zn
7.5
× 1
0-2
1.6
× 1
0-2
5.5
× 1
0-2
9.5
× 1
0-2
6
9.6
× 1
0-2
1.2
× 1
0-1
5.5
× 1
0-2
8.7
× 1
0-2
4
.6 ×
10
-1
Zr
1.4
× 1
0-5
1
1
.7 ×
10
-5
1
1.5
× 1
0-5
8
.3 ×
10
-1
1 S
had
ed c
ell
s d
eno
te CR
valu
es e
sti
mate
d f
rom
th
e s
tab
le e
lem
en
t re
vie
w.
288

289
In summarising Ff values we have only used results reported for pigs, sheep and goats of 6
months or older (where this information was given). For cattle, only data from animals aged 1
year or older were included whilst for poultry only data for animals older than 40 d were used.
However, if data for animals above these ages were totally lacking for an element, data for
younger animals were used; in the case of mammals data were not used for animals of less
than a few months in age. If data were not available for chicken but were for duck, these
values were used instead (only relevant for Na and Co).
Data from experiments of less than 20 d duration were not used for sheep, goats, pigs or
poultry whilst for cattle experiments of less than 60 d duration were not used (this greatly
reduced the number of data for Cs).
Beresford et al. [14, 109] and Crout et al. [18] report data from single administration studies
which they interpreted by fitting models to data for consecutive slaughter dates over circa one
year. Subsequent predictions of Ff were made for differing periods of continuous
administration; values incorporated into the database were the equilibrium or 1000 d
predictions. If required to convert reported dry weight values to fresh weight, it was assumed
that the dry matter content of meat for all animal types was 25%.
Tables 10-14 present Ff values for beef, sheep meat, goat meat, pork and poultry respectively
in the same manner as the summaries presented for milk in Table 5-7. All data for Ff values
below are in units of d kg-1
fresh weight. The tables include Ff values for a number of animal-
element combinations for which values were not available in Technical Reports Series No.
364 [4]:
Beef – La and Th
Sheep – Cd, Na and Pb
Goat – Y
Pork – Ca and P
Poultry – Na and Po
As for milk, all data for Tc were for isotopes other than 99
Tc and consequently Ff values are
not included in the tables below; values for the shorter lived Tc isotopes can be found in Jones
[92] and Johnson et al. [89].
A Russian language study by Taucin and Svilane 1962 [110] was used as the basis for a
number of values given in Technical Reports Series No. 364, specifically for Mn, Fe, Co and
Zn for sheep, cattle, poultry and pigs, as it was a key data source used by Ng et al.[52]. We
have carefully examined the source paper and compared the derived Ff values with other data.
Seven of the Ff values derived using this paper are substantially (order of magnitude) higher
than those of other sources. We have therefore decided not to include this paper in the
database and consequently there are fewer Ff values given for these elements in the meat (and
also subsequent egg) tables than in Technical Reports Series No. 364.
Where the values in the Tables 10-14 deviate from those in Technical Reports Series No. 364
[4] by approximately an order of magnitude or more, the reasons for the difference is
discussed below.
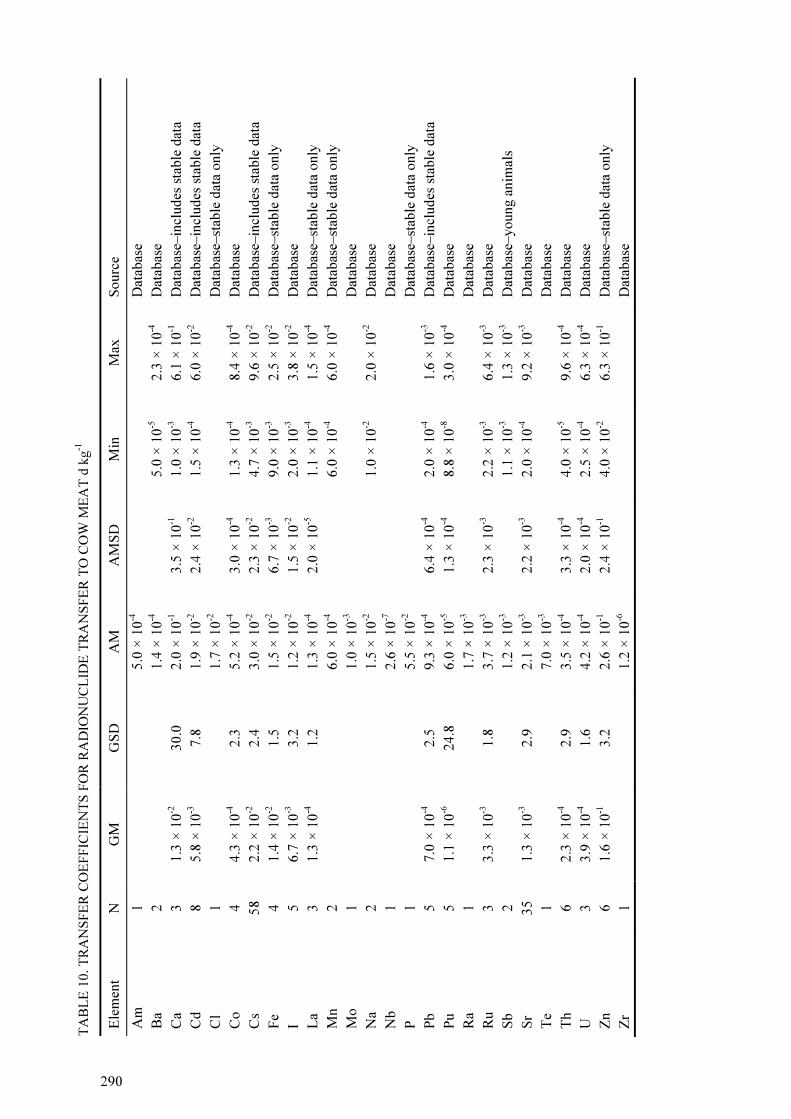
TA
BL
E 1
0. T
RA
NS
FE
R C
OE
FF
ICIE
NT
S F
OR
RA
DIO
NU
CL
IDE
TR
AN
SF
ER
TO
CO
W M
EA
T d
kg
-1
Ele
men
t N
G
M
GS
D
AM
A
MS
D
Min
M
ax
So
urc
e
Am
1
5.0
× 1
0-4
Dat
abas
e
Ba
2
1.4
× 1
0-4
5.0
× 1
0-5
2.3
× 1
0-4
D
atab
ase
Ca
3
1.3
× 1
0-2
30.0
2.0
× 1
0-1
3.5
× 1
0-1
1.0
× 1
0-3
6.1
× 1
0-1
D
atab
ase–
incl
udes
sta
ble
dat
a
Cd
8
5.8
× 1
0-3
7.8
1.9
× 1
0-2
2.4
× 1
0-2
1.5
× 1
0-4
6.0
× 1
0-2
D
atab
ase–
incl
udes
sta
ble
dat
a
Cl
1
1.7
× 1
0-2
Dat
abas
e–st
able
dat
a only
Co
4
4.3
× 1
0-4
2.3
5.2
× 1
0-4
3.0
× 1
0-4
1.3
× 1
0-4
8.4
× 1
0-4
D
atab
ase
Cs
58
2
.2 ×
10
-2
2.4
3.0
× 1
0-2
2.3
× 1
0-2
4.7
× 1
0-3
9.6
× 1
0-2
D
atab
ase–
incl
udes
sta
ble
dat
a
Fe
4
1.4
× 1
0-2
1.5
1.5
× 1
0-2
6.7
× 1
0-3
9.0
× 1
0-3
2.5
× 1
0-2
D
atab
ase–
stab
le d
ata
only
I 5
6
.7 ×
10
-3
3.2
1.2
× 1
0-2
1.5
× 1
0-2
2.0
× 1
0-3
3.8
× 1
0-2
D
atab
ase
La
3
1.3
× 1
0-4
1.2
1.3
× 1
0-4
2.0
× 1
0-5
1.1
× 1
0-4
1.5
× 1
0-4
D
atab
ase–
stab
le d
ata
only
Mn
2
6.0
× 1
0-4
6.0
× 1
0-4
6.0
× 1
0-4
D
atab
ase–
stab
le d
ata
only
Mo
1
1.0
× 1
0-3
Dat
abas
e
Na
2
1.5
× 1
0-2
1.0
× 1
0-2
2.0
× 1
0-2
D
atab
ase
Nb
1
2.6
× 1
0-7
Dat
abas
e
P
1
5.5
× 1
0-2
Dat
abas
e–st
able
dat
a only
Pb
5
7.0
× 1
0-4
2.5
9.3
× 1
0-4
6.4
× 1
0-4
2.0
× 1
0-4
1.6
× 1
0-3
D
atab
ase–
incl
udes
sta
ble
dat
a
Pu
5
1.1
× 1
0-6
24.8
6.0
× 1
0-5
1.3
× 1
0-4
8.8
× 1
0-8
3.0
× 1
0-4
D
atab
ase
Ra
1
1.7
× 1
0-3
Dat
abas
e
Ru
3
3.3
× 1
0-3
1.8
3.7
× 1
0-3
2.3
× 1
0-3
2.2
× 1
0-3
6.4
× 1
0-3
D
atab
ase
Sb
2
1.2
× 1
0-3
1.1
× 1
0-3
1.3
× 1
0-3
D
atab
ase–
yo
un
g a
nim
als
Sr
35
1
.3 ×
10
-3
2.9
2.1
× 1
0-3
2.2
× 1
0-3
2.0
× 1
0-4
9.2
× 1
0-3
D
atab
ase
Te
1
7.0
× 1
0-3
Dat
abas
e
Th
6
2.3
× 1
0-4
2.9
3.5
× 1
0-4
3.3
× 1
0-4
4.0
× 1
0-5
9.6
× 1
0-4
D
atab
ase
U
3
3.9
× 1
0-4
1.6
4.2
× 1
0-4
2.0
× 1
0-4
2.5
× 1
0-4
6.3
× 1
0-4
D
atab
ase
Zn
6
1.6
× 1
0-1
3.2
2.6
× 1
0-1
2.4
× 1
0-1
4.0
× 1
0-2
6.3
× 1
0-1
D
atab
ase–
stab
le d
ata
only
Zr
1
1.2
× 1
0-6
Dat
abas
e
2 90

TA
BL
E 1
1. T
RA
NS
FE
R C
OE
FF
ICIE
NT
S F
OR
RA
DIO
NU
CL
IDE
TR
AN
SF
ER
TO
SH
EE
P M
EA
T d
kg
-1
Ele
men
t N
G
M
GS
D
AM
S
D
Min
M
ax
So
urc
e
Ag
1
4.8
× 1
0-4
Dat
abas
e
Am
1
1.1
× 1
0-4
Dat
abas
e
Cd
1
1.2
× 1
0-3
Dat
abas
e
Ce
1
2.5
× 1
0-4
Dat
abas
e
Co
2
1.2
× 1
0-2
8.0
× 1
0-3
1.6
× 1
0-2
D
atab
ase
Cs
41
1
.9 ×
10
-1
2.2
2.7
× 1
0-1
2.6
× 1
0-1
5.3
× 1
0-2
1
.3
Dat
abas
e
I 1
3.0
× 1
0-2
Dat
abas
e
Mn
1
9.0
× 1
0-3
Dat
abas
e–st
able
dat
a only
Na
1
1.1
× 1
0-1
Dat
abas
e
Pb
2
7.1
× 1
0-3
4.0
× 1
0-3
1.0
× 1
0-2
D
atab
ase–
stab
le d
ata
only
Pu
2
5.3
× 1
0-5
2.0
× 1
0-5
8.5
× 1
0-5
D
atab
ase
Ru
2
2.1
× 1
0-3
6.3
× 1
0-4
3.6
× 1
0-3
D
atab
ase
S
3
1.7
1.3
1.7
4.7
× 1
0-1
1.2
2
.1
Dat
abas
e
Sr
25
1
.5 ×
10
-3
1.7
1.7
× 1
0-3
7.5
× 1
0-4
3.0
× 1
0-4
4.0
× 1
0-3
D
atab
ase
Zn
6
4.5
× 1
0-2
2.2
5.9
× 1
0-2
4.7
× 1
0-2
2.0
× 1
0-2
1.4
× 1
0-1
D
atab
ase
TA
BL
E 1
2. T
RA
NS
FE
R C
OE
FF
ICIE
NT
S F
OR
RA
DIO
NU
CL
IDE
TR
AN
SF
ER
TO
GO
AT
ME
AT
d k
g-1
Ele
men
t N
G
M
GS
D
AM
S
D
Min
M
ax
So
urc
e
Ba
1
1.3
× 1
0-5
Dat
abas
e
Cs
11
3
.2 ×
10
-1
2.5
4.8
× 1
0-1
5.3
× 1
0-1
1.2
× 1
0-1
1
.9
Dat
abas
e
Nb
1
6.0
× 1
0-5
Dat
abas
e
Sr
8
2.9
× 1
0-3
1.2
3.0
× 1
0-3
5.1
× 1
0-4
2.0
× 1
0-3
3.7
× 1
0-3
D
atab
ase
Te
1
2.4
× 1
0-3
Dat
abas
e
Y
1
5.4
× 1
0-2
Dat
abas
e
Zr
1
2.0
× 1
0-5
Dat
abas
e
291

TA
BL
E 1
3. T
RA
NS
FE
R C
OE
FF
ICIE
NT
S F
OR
RA
DIO
NU
CL
IDE
TR
AN
SF
ER
TO
PIG
ME
AT
d k
g-1
Ele
men
t N
G
M
GS
D
AM
S
D
Min
M
ax
So
urc
e
Ca
1
2.0
× 1
0-3
Dat
abas
e–st
able
dat
a only
Cs
22
2
.0 ×
10
-1
1.5
2.2
× 1
0-1
9.0
× 1
0-2
1.2
× 1
0-1
4.0
× 1
0-1
D
atab
ase
Fe
1
3.0
× 1
0-3
Dat
abas
e –
yo
un
g a
nim
als
I 2
4.1
× 1
0-2
1.5
× 1
0-2
6.6
× 1
0-2
D
atab
ase
Mn
1
5.3
× 1
0-3
Dat
abas
e–st
able
dat
a only
P
1
2.7
× 1
0-2
Dat
abas
e
Ru
1
3.0
× 1
0-3
Dat
abas
e
Se
1
3.2
× 1
0-1
Dat
abas
e–st
able
dat
a only
Sr
12
2
.5 ×
10
-3
2.7
3.6
× 1
0-3
2.7
× 1
0-3
5.0
× 1
0-4
8.0
× 1
0-3
D
atab
ase–
incl
udes
sta
ble
dat
a
U
2
4.4
× 1
0-2
2.6
× 1
0-2
6.2
× 1
0-2
D
atab
ase
Zn
2
1.7
× 1
0-1
1.3
× 1
0-1
2.0
× 1
0-1
D
atab
ase
292
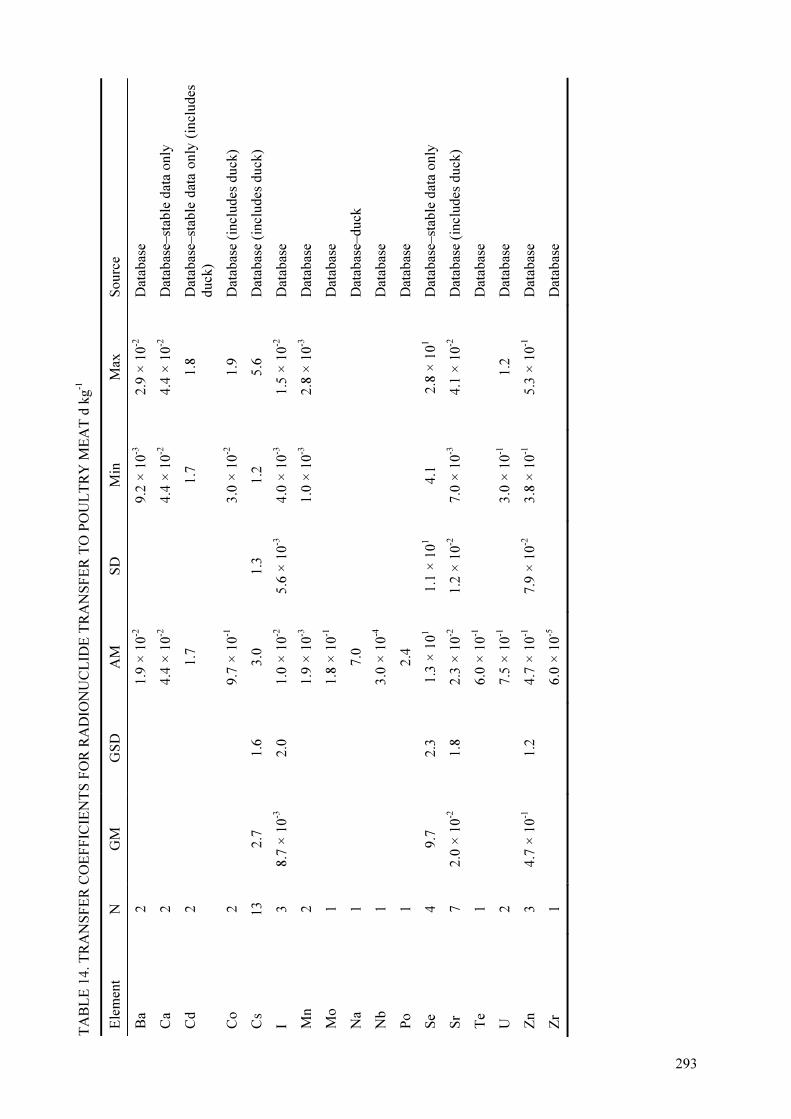
TA
BL
E 1
4. T
RA
NS
FE
R C
OE
FF
ICIE
NT
S F
OR
RA
DIO
NU
CL
IDE
TR
AN
SF
ER
TO
PO
UL
TR
Y M
EA
T d
kg
-1
Ele
men
t N
G
M
GS
D
AM
S
D
Min
M
ax
So
urc
e
Ba
2
1.9
× 1
0-2
9.2
× 1
0-3
2.9
× 1
0-2
D
atab
ase
Ca
2
4.4
× 1
0-2
4.4
× 1
0-2
4.4
× 1
0-2
D
atab
ase–
stab
le d
ata
only
Cd
2
1.7
1.7
1
.8
Dat
abas
e–st
able
dat
a o
nly
(in
clu
des
duck
)
Co
2
9.7
× 1
0-1
3.0
× 1
0-2
1
.9
Dat
abas
e (i
ncl
udes
du
ck)
Cs
13
2
.7
1.6
3.0
1.3
1.2
5
.6
Dat
abas
e (i
ncl
udes
du
ck)
I 3
8
.7 ×
10
-3
2.0
1.0
× 1
0-2
5.6
× 1
0-3
4.0
× 1
0-3
1.5
× 1
0-2
D
atab
ase
Mn
2
1.9
× 1
0-3
1.0
× 1
0-3
2.8
× 1
0-3
D
atab
ase
Mo
1
1.8
× 1
0-1
Dat
abas
e
Na
1
7.0
Dat
abas
e–du
ck
Nb
1
3.0
× 1
0-4
Dat
abas
e
Po
1
2.4
Dat
abas
e
Se
4
9.7
2.3
1.3
× 1
01
1.1
× 1
01
4.1
2
.8 ×
10
1
Dat
abas
e–st
able
dat
a only
Sr
7
2.0
× 1
0-2
1.8
2.3
× 1
0-2
1.2
× 1
0-2
7.0
× 1
0-3
4.1
× 1
0-2
D
atab
ase
(incl
udes
du
ck)
Te
1
6.0
× 1
0-1
Dat
abas
e
U
2
7.5
× 1
0-1
3.0
× 1
0-1
1
.2
Dat
abas
e
Zn
3
4.7
× 1
0-1
1.2
4.7
× 1
0-1
7.9
× 1
0-2
3.8
× 1
0-1
5.3
× 1
0-1
D
atab
ase
Zr
1
6.0
× 1
0-5
Dat
abas
e
293
294
Beef
The value for Sb reported in Technical Reports Series No. 364 [4] (4 × 10⁻⁵
d kg-1
) was based
upon a single administration study reported by van Bruwaene et al. [111] with meat being
measured after c. 102 d and the Ff being estimated based upon this measurement and the total
excretion of Sb. The higher value (1.2 × 10⁻³
d kg-1
) in Table 10 is based upon two continuous
feeding studies reported by Sirotkin et al. [25] and Sirotkin [112] although the animals were
either 6 months old or slightly younger. The latter value appears reasonable compared with
the CR value, which can be estimated from Boyer et al. [113] and, given the method of
calculation used by van Bruwaene et al. [111], we have excluded the latter from the database.
The Ff value for Cd in Technical Reports Series No. 364 [4] was based upon one stable
element data set and is an order of magnitude lower (at 4 × 10⁻⁴
d kg-1
) than the mean in Table
10. The Technical Reports Series No. 364 [4] value was based upon Ng et al. [52] and we
cannot replicate this value from the original paper [114]; a value of 5 × 10⁻³
d kg-1
is included
in the database estimated from the data of Nelmes et al. [114].
The Ff value for Ru in Technical Reports Series No. 364 of 5.0 × 10⁻²
d kg-1
is almost 10 fold
higher than that in Table 10 and comes from a review by Coughtrey [10]. Coughtrey quotes
two Russian sources (Annenkov 73 [115] and Sirotkin et al. 70 [25] and also values used in
various models. The geometric mean value of 3.3 × 10⁻³
d kg-1
in Table 10 is based on three
original Russian data sources; the value of Ff for sheep meat in Table 11 is also lower than
previous model based values.
The geometric mean Ff value in Table 10 for Ca is nearly an order of magnitude greater than
that in Technical Reports Series No. 364 [4]. The Ca Ff value in Table 10 is based on a
limited data set (3 studies) two of which report values of the order of 10-3
(which includes the
study used in Technical Reports Series No. 364 [4]) and one a value in the order of 10-1
.
Excluding the 10-1
value would result in a mean of 2.2 × 10⁻³
d kg-1
(similar to the Technical
Reports Series No. 364 [4] value). However, this would be lower than the Ff for Sr which is
based upon many data whereas we would expect the Ca value to be approximately an order of
magnitude higher (note the Sr Ff advised in Technical Reports Series No. 364 [4] was higher
than that for Ca). The comparative difference between the geometric mean values for Sr and
Ca in Table 10 is reflective of the difference expected.
The Ff value for Am of 5 × 10⁻⁴
d kg-1
in Table 10 is based on Sumerling et al. [116] and is
more than an order of magnitude higher than the Technical Reports Series No. 364 value of 4
× 10-5
which is a model-derived value for 100d from Coughtrey [10].
There is considerable variation in the values derived for Pu in Table 10. The Ff value for Pu in
Technical Reports Series No. 364 [4] of 1.0 × 10⁻⁵
d kg-1
comes from the review by Coughtrey
[10] and is approaching an order of magnitude higher than the value based on 5 data sources
in Table 10. Coughtrey refers to values derived by extrapolation from experimental data
reported by Stanley [117] which was not used in our database.
An Ff value for beef for W is recommended in Technical Reports Series No. 364 [4] based
upon a value derived by Ng et al. [52] from unassociated data, which is not referenced and is
not included in Table 10.
The Technical Reports Series No. 364 [4] value for Y was based on that suggested by Ng et
al. [52] derived from the comparative CR values of 88
Y and 137
Cs for reindeer. Whilst a Y
value of 1.0 × 10⁻⁶
d kg-1
is reported in the Sirotkin’s 1991 review [15] (i.e. three orders of
295
magnitude lower than that advised in Technical Reports Series No. 364 [4]) the source of this
value could not be identified and hence no Ff value for Y is suggested in Table 10. Similarly,
whilst Sirotkin [118] reports a beef Ff value of 1.0 × 10⁻⁶
for Ce its source and derivation
could not be confirmed and it is not included here. The value of 2.0 × 10⁻⁵
recommended for
Ce in Technical Reports Series No. 364 [4] appears to be a 100 d model prediction from CEC
1987 [119]. Consequently, Table 10 does not present a value for Ce.
Sheep meat
The Ff value for Ru derived here (2.1 × 10⁻³
d kg-1
) on the basis of two experimental studies is
approximately two orders of magnitude lower than the previous Technical Reports Series No.
364 [4] value. The Ff value for Ru in Technical Reports Series No. 364 [4] was based upon a
model prediction only [41].
The geometric mean value for the Ff for Sr is 1.5 × 10⁻³
d kg-1
for sheep meat in Table 11. The
value is based on data from the Russian language reported by Fesenko et al. [108] although
some data for short periods of Sr administration to sheep from time series experiment have
been excluded. The value recommended here is more than an order of magnitude lower than
that in Technical Reports Series No. 364 of 4 × 10⁻²
d kg-1
based on a model prediction for
equilibrium from Coughtrey [10].
The Ff value for Zn to sheep meat in Technical Reports Series No. 364 [4] was 4.1 d kg-1
taken from Ng et al. [52] which was based upon stable data reported by Taucin and Svilane
[110] which, as explained above, has not been used in this review. This is at least an order of
magnitude greater than any values within the database compiled here from stable Zn
measurements and radiotracer studies. The database value is considerably lower, with a
geometric mean of 4.5 × 10⁻²
d kg-1
.
Values of sheep meat Ff’s for Rb, Cu, Fe and Nb are recommended in Technical Reports
Series No. 364 [4] but not in Table 11. Rb and Cu were not included in this review. The value
for Nb in Technical Reports Series No. 364 [4] (3 × 10⁻⁴
d kg-1
) was based on a model
prediction by Coughtrey [10] and we have not included such values in the database. The value
for Fe (7.3 × 10⁻²
d kg-1
) in Technical Reports Series No. 364 was again taken from Ng et al.
[52] who based it upon stable element data of Taucin and Svilane [110] which we have not
used.
Goat meat
In the case of goat meat, Ff values in Table 6.12 are all similar to those in Technical Reports
Series No. 364 [4]. In part, this is because both reviews base a number of values on the work
of Johnson et al. [89]. However, the values for Sr and Cs are now based upon larger datasets.
Pork
The revised value for I in Table 13 is an order of magnitude higher than that in Technical
Reports Series No. 364 whereas that for Sr is an order of magnitude lower than that in
Technical Reports Series No. 364.
The value of Ff for Ru in Technical Reports Series No. 364 [4] was 6.6 × 10⁻¹
d kg-1
, more
than two orders of magnitude higher than the value based on two Russian language papers
presented here in Table 13. The data in Table 13 are for young animals and would therefore
be expected to be higher than for adults. The Technical Reports Series No. 364 [4] value was
296
cited as coming from Ng et al. [51], however, this reference does not give a value for pork.
Ng [49] gives a value of 6.8 × 10⁻³
d kg-1
(method of estimation unclear) which is similar to
the values in Table 13. Furthermore, the value presented here for pork appears reasonable
compared with those for other meats.
As for cow milk and poultry meat (see below) the value for U in the database appears rather
high. However, the source data for the pork value from Prister [22] has been rechecked and
appears valid; the Prister reference was also used to derive the Technical Reports Series No.
364 value.
Considerably more radionuclides have recommended Ff’s in Technical Reports Series No.
364 [4] for pork than we present in Table 13. The values for Am and Nb in Technical Reports
Series No. 364 [4] were both model derived and not based upon data. The values for Ag and
Ce in Technical Reports Series No. 364 [4] were derived from data for sheep and cattle. The
value for Pu in Technical Reports Series No. 364 [4] for pork is referenced as Ng et al. [52],
however, we cannot find these data in the cited report. The recommended Ff for Co to pork in
Technical Reports Series No. 364 [.4] was based upon a minimum detectable activity (i.e. a
‘less than’ value) from Voigt et al. [6.90] and has not been considered here. The Ff value for
Fe to pork was taken from Ng et al. [6.52] based upon stable data reported in Taucin and
Svilane [6.110] which we are not using. The value for Cd given in Technical Reports Series
No. 364 [6.4] was again taken from Ng et al. [6.52] based upon data from Cousins et al.
[6.120] but this study involved elevated dietary Cd concentration and hence has not been
included in this review.
Poultry meat
There are no order of magnitude differences between the Technical Reports Series No. 364
values and those in Table 14.
The Ff value of 10 d kg-1
for Cs in Technical Reports Series No. 364 [4] is c. three fold higher
than that derived from the database. The Technical Reports Series No. 364 [4] value refers to
Coughtrey [41], but, in this reference, Coughtrey derives a value of 12 d kg-1
for 100 days of
contamination, and the experimentally derived values (n=8) which he lists give values which
range from 1.4-9.5. These higher values are more consistent with our database value of 2.7
which is now based on a comparatively large number of data (n=13).
The Ff value of 1.0 d kg-1
for Mo is based on Ennis et al. [121] and Johnson and Ward [122].
In the latter reference, the weight basis is not clear and the value is an order of magnitude
higher than the other data source, so we have not used this value in the database, thereby
deriving a value five fold lower.
The value for U in the database is rather high. The source data for this value [25] have been
rechecked and appear valid; the same data were used for the recommended value in Technical
Reports Series No. 364 [4].
Values provided for La, Pr, Nd, Pm and Y in Technical Reports Series No. 364 [4] were
based on collateral data from Ng et al. [52] on the basis of data from a single dosing
experiment by Mraz et al. [124] where the Ff values for these elements were derived based on
normalising to that of Sr. The value of 8 d kg-1
for Ru in Technical Reports Series No. 364 [4]
is much higher than that justified from the quoted reference of Coughtrey [41]. The only
experimentally derived value of 7.0 × 10⁻³
d kg-1
listed by Coughtrey is, again, based on the
297
single dosing experiment used by Ng et al. [52]. Thus all these values have a high uncertainty
and have not been used in the database.
Values for Ag in Technical Reports Series No. 364 [4] were derived from model evaluations
using retention equations. There are no experimentally derived values quoted for comparison
with this data and the values are not used in the database. The value for Ce in Technical
Reports Series No. 364 [4] can be traced back to referring to CEC [119]. However, there are
no directly relevant data in this reference and the value has not been used in the database. The
Fe value in Technical Reports Series No. 364 [4] is derived from Taucin and Svilane [110]
which has not been used in the database. Technical Reports Series No. 364 [4] recommends
an Ff value for Pu based on predominantly model predictions from CEC 1987 [119]. Whilst
Ng [52] presents a value derived from the experimental data of Mullen et al. [123] this was
calculated using meat activity concentrations measured 12 d after the cessation of daily
administration of Pu and hence has not been used here.
6.3.2. Concentration ratio values for meat
As for milk in Table 9, we give values for CR for meat for a number of species in Table 15.
The data are only extensive for cow meat, and therefore comparisons across species for the
elements are fewer but still encouraging.
In addition to the data given, values for horse meat of 3.8 × 10⁻¹
for Fe and 5.3 × 10⁻¹
for Zn
can be derived using stable data from the agricultural sources described above. These are in
reasonable agreement with values for other species in Table 15.
6.4. Transfer to eggs
The Ff data for eggs have been compiled as described above for meat, including the use of
data cited in Ng et al. [52]; it has been possible to verify much of the Russian language data
cited by Ng et al. The compilation is largely for hens although there are a few data for duck.
Data are reported for a variety of whole egg (including shell), egg contents and occasionally
yolk only. By preference, egg contents data have been used although whole-egg (i.e. including
the shell) and in a few cases yolk values have been considered if data are sparse.
Whole-egg data were excluded from the review of data for Sr, Ca and Ba because of the high
content of these elements in shell. If Ff values were reported for yolk and egg-white separately
the average has been used (on the basis of studies for which it is possible to compare to
reported data on whole-egg contents, this approach gives reasonable estimates). Some
publications report the fraction of daily intake per egg, these have been converted to Ff values
using quoted egg weights; if egg weight was not available a value of 64 g has been assumed.
The Ff values for egg (data combined for all species) are presented in Table 16. Data for most
radionuclides is relatively sparse (no more than seven values for any radionuclide). The
values in Table 16 are generally similar to those proposed in Technical Reports Series No.
364 [4]. This is not surprising since many of the Technical Reports Series No. 364 values
were based upon Ng et al. [52] which is the major source of data for this review. The value for
U in the database is rather high. However, the source data for this value Prister [22] has been
rechecked and appears valid.

298
TA
BL
E 1
5.
CO
NC
EN
TR
AT
ION
RA
TIO
S F
OR
TH
E M
EA
T O
F D
IFF
ER
EN
T A
NIM
AL
S
Bee
f S
hee
p
Po
rk
Gen
eric
E
le-
men
t C
R
SD
M
in
Max
N
C
R
SD
M
in
Max
N
C
R
SD
M
in
Max
N
Ag
4
.3 ×
10-4
1
4.3
× 1
0-4
Am
1.1
× 1
0-4
1
1.1
× 1
0-4
Ca
2.3
×1
0-2
2
.1 ×
10-2
2.6
×1
0-2
2
1.4
× 1
0-2
1
.9 ×
10-2
Cd
1
.7 ×
10-1
1.5
×1
0-1
2.3
×1
0-3
3.5
×1
0-1
7
1.2
× 1
0-2
1
.3 ×
10-3
2.3
× 1
0-2
2
1.3
× 1
0-1
1
9
.2 ×
10-2
Ce
2
.2 ×
10-4
1
2.2
× 1
0-4
Cl
2.4
×1
0-1
4
.8 ×
10-2
4.3
×1
0-1
2
2.4
× 1
0-1
Co
3
.9 ×
10-1
7
.2 ×
10-3
7.8
×1
0-1
2
2.3
× 1
0-1
3
.1 ×
10-1
Cs
2.3
×1
0-1
1.7
×1
0-1
2.2
×1
0-2
7.3
×1
0-1
17
6
.4 ×
10-1
1.0
5
.3 ×
10-2
7.5
5
1
9.2
× 1
0-2
1.0
× 1
0-1
8.3
× 1
0-3
2.4
× 1
0-1
4
3.9
× 1
0-1*
Fe
2.2
×1
0-1
2.5
×1
0-1
6.0
×1
0-2
7.2
×1
0-1
6
2.7
× 1
0-1
1
2.5
× 1
0-1
I 9
.5 ×
10-2
8.2
×1
0-2
3.2
×1
0-2
1.9
×1
0-1
3
1
9.3
× 1
0-2
3
.5 ×
10-2
1.5
× 1
0-1
2
9.4
× 1
0-2
La
1.6
×1
0-3
2.4
×1
0-4
1.3
×1
0-3
1.8
×1
0-3
3
1.6
× 1
0-3
Mg
1.4
×1
0-1
9
.4 ×
10-2
1.9
×1
0-1
2
1.4
× 1
0-1
Mn
8
.0 ×
10-3
4
.6 ×
10-3
1.1
×1
0-2
2
8.0
× 1
0-3
Mo
9
.6 ×
10-2
2
.5 ×
10-2
1.7
×1
0-1
2
9.6
× 1
0-2
Na
9.7
×1
0-1
1
9
.7 ×
10-1
Nb
6
.5 ×
10-6
1
6
.5 ×
10-6
Ni
8.0
×1
0-2
1
8
.0 ×
10-2
P
1.3
1
.3
Pb
7
.7 ×
10-2
1.8
×1
0-1
1.0
×1
0-3
6.2
×1
0-1
11
1
.2 ×
10-2
4.0
× 1
0-3
9.2
× 1
0-3
1.6
× 1
0-2
3
6.6
× 1
0-1
2
.3 ×
10-1
1.1
2
2
.5 ×
10-1
Po
1
.4 ×
10-1
1.3
×1
0-1
3.7
×1
0-2
4.1
×1
0-1
7
1.4
× 1
0-1
Pu
3.9
× 1
0-5
2.4
× 1
0-5
1.5
× 1
0-5
6.3
× 1
0-5
3
3
.9 ×
10-5
Ra
1.8
×1
0-1
3.8
×1
0-1
1.3
×1
0-3
1.3
1
1
1.8
× 1
0-1
Rb
3
.0 ×
10-1
1
3
.0 ×
10-1
Ru
5.7
× 1
0-4
1
5.7
× 1
0-4
S
5
.0 ×
10-1
5
.0 ×
10-1
Sb
2
.7 ×
10-1
1
2
.7 ×
10-1
Se
1.1
1
1.1
Te
1.8
×1
0-1
1
1
.8 ×
10-1
Th
6
.2 ×
10-3
5.0
×1
0-3
1.7
×1
0-3
1.2
×1
0-2
3
6.2
× 1
0-3
U
3.3
×1
0-1
6.1
×1
0-1
3.0
×1
0-3
1.7
8
3
.3 ×
10-1
Zn
1
.7
1.1
4
.7 ×
10-1
3.2
9
2
.1
1
.3
2.9
2
1.9
* G
oat
val
ue
of
6.2
× 1
0-1
for
Cs
(n=
4)
is i
ncl
uded
in t
he
gen
eric
val
ue;
Shad
ed c
ells
den
ote
CR
val
ues
est
imat
ed f
rom
the
stab
le e
lem
ent
revie
w.

299
TA
BL
E 1
6 T
RA
NS
FE
R C
OE
FF
ICIE
NT
S F
OR
RA
DIO
NU
CL
IDE
TR
AN
SF
ER
TO
EG
G C
ON
TE
NT
S d
kg
-1
Ele
men
t N
G
M
GS
D
AM
S
D
Min
M
ax
So
urc
e
Am
1
3.0
× 1
0-3
Dat
abas
e
Ba
1
8.7
× 1
0-1
Dat
abas
e
Ca
1
4.4
× 1
0-1
Dat
abas
e–st
able
dat
a only
Ce
1
3.1
× 1
0-3
Dat
abas
e
Co
2
3.3
× 1
0-2
2.6
× 1
0-2
4.0
× 1
0-2
D
atab
ase
(du
ck)
Cs
11
4
.0 ×
10
-1
1.5
4.3
× 1
0-1
1.6
× 1
0-1
1.6
× 1
0-1
7.1
× 1
0-1
D
atab
ase
(incl
udes
du
ck)
Fe
2
1.8
8.5
× 1
0-1
2
.8
Dat
abas
e–in
clu
des
sta
ble
dat
a
I 4
2
.4
1.3
2.4
5.7
× 1
0-1
1.9
3
.2
Dat
abas
e
Mn
3
4.2
× 1
0-2
1.4
4.4
× 1
0-2
1.6
× 1
0-2
3.2
× 1
0-2
6.2
× 1
0-2
D
atab
ase–
stab
le d
ata
only
Mo
3
6.4
× 1
0-1
1.3
6.5
× 1
0-1
1.9
× 1
0-1
5.2
× 1
0-1
8.7
× 1
0-1
D
atab
ase–
incl
ud
es s
table
dat
a
Na
2
4.0
1.9
6
.0
Dat
abas
e–in
clu
des
st
able
d
ata
(incl
udes
du
ck)
Nb
1
1.0
× 1
0-3
Dat
abas
e
P
1
6.4
× 1
0-1
Dat
abas
e
Po
1
3.1
Dat
abas
e
Pu
2
1.2
× 1
0-3
9.9
× 1
0-6
2.3
× 1
0-3
D
atab
ase
Ru
1
4.0
× 1
0-3
Dat
abas
e
Se
4
1.6
× 1
01
1.9
1.8
× 1
01
1.0
× 1
01
8.8
2
.8 ×
10
1
Dat
abas
e–st
able
dat
a only
Sr
9
3.5
× 1
0-1
1.4
3.7
× 1
0-1
1.4
x 1
0-1
2.2
× 1
0-1
6.4
× 1
0-1
D
atab
ase–
incl
ud
es
stab
le
dat
a (i
ncl
udes
du
ck)
Te
1
5.1
Dat
abas
e
U
2
1.1
9.2
× 1
0-1
1
.2
Dat
abas
e
Zn
4
1.4
1.2
1.4
2.9
× 1
0-1
1.2
1
.9
Dat
abas
e–in
clu
des
sta
ble
dat
a
Zr
1
2.0
× 1
0-4
Dat
abas
e

300
TABLE 17. SUMMARY OF AVAILABLE TRANSFER COEFFICIENT DATA–SHADING DENOTES NO AVAILABLE DATA
Element Beef Sheep meat
Goat meat
Pork Poultry Egg Cow milk
Goat milk
Sheep milk
Ag 1
Am 1 1 1 1 2
Ba 2 1 2 1 15 3 1
Be 1
Ca 3 2 1 15 12 St
Cd 8 1 2 8 1 1
Ce 1 1 6 1
Cl 1
Co 4 2 2 2 4 1 2
Cr 3 2 1
Cs 58 41 11 22 13 11 288 28 28
Fe 4 1 2 7 St St
I 5 1 2 3 4 104 24 7
La 3
Mn 2 1 1 2 3 4 St 1
Mo 1 1 3 7 4
Na 2 1 1 2 7 St 1
Nb 1 1 1 1 1 1
Ni 2 2 1
Np 1
P 1 1 1 St St St
Pb 5 2 15 St
Po 1 1 4 2
Pu 5 2 2 n/a 1
Ra 1 11
Ru 3 2 1 1 6
S 3 1 12 St
Sb 2 3
Se 1 4 4 12 2
Sr 35 25 8 12 7 9 154 21 4
Te 1 1 1 1 11 1 1
Th 6 3
U 3 2 2 2 3 1
W 7
Y 1 1
Zn 6 6 2 3 4 8 St St
Zr 1 1 1 1 6 1
St – recommended value based on unassociated stable element data; n/a whilst limited Fm values available for Pu
transfer to cow milk recommended value is derived from review. NOTE: 14C and 3H are not considered above as
specific activity models have been used (see paper by Davis et al. in this document).

301
7. CONCLUSIONS
Table 17 summarises the availability of data on the transfer coefficient of radionuclides to
farm animal products. For approximately 50 % of the required radionuclide-animal product
combinations no transfer coefficient data were available. Of those combinations for which
values could be recommended less than 14 % were based upon more than five studies.
We have proposed that the CR would be a more robust and generic parameter than the transfer
coefficient. For most radionuclides, the concentration ratio data compiled varies little between
the species considered (sheep, goats, cattle, horses and poultry). Therefore, concentration
ratios derived for one species could be applied to another. However, unfortunately many
authors who report transfer coefficients do not provide the information required to estimate
concentration ratios. Further data collation to derive CR values for meat from agricultural
animals would be valuable to supplement the data in the Tables.
Currently, there is no equivalent critically evaluated international compilation of other
parameter values which are also important for modelling radionuclide transfer to animals,
notably on biological half-lives and transfer to tissue other than muscle.
A number of radionuclides have recently been identified for which there is currently
inadequate information for modelling or assessment including 36
Cl, 237
Np, 99
Tc, U-isotopes,
Th-isotopes, 241
Am, 59
Ni, 94
Nb and 60
Co. Some of these radionuclides have not been
considered (e.g. 252
Cf, 192
Ir) within the revised IAEA handbook. .
REFERENCES
[1] LIKHTAREV, I.A., GULKO, G., KAIRO, I.A., LOS, I.P., HENRICHS, K., PARETZKE, H.G., Thyroid doses resulting from the Ukraine Chernobyl accident–part 1: Dose estimates for the population of Kiev, Health Physics 66 (1994) 137-146.
[2] UN CHERNOBYL FORUM, EXPERT GROUP–ENVIRONMENT, Environmental consequences of the Chernobyl accident and their remediation: Twenty years of experience, International Atomic Energy Authority, Vienna (2006).
[3] GREEN, N., WOODMAN, R.F.M., Recommended transfer factors from feed to animal products, NRPB-W40, National Radiological Protection Board, Didcot, (2003) 63 pp.
[4] INTERNATIONAL ATOMIC ENERGY AGENCY, Handbook of Parameter Values for the Prediction of Radionuclide Transfer in Temperate Environments, Technical Report No 364, IAEA, Vienna (1994).
[5] FESENKO, S., ISAMOV, N., HOWARD, B.J.; VOIGT, G., BERESFORD, N.A., SANZHAROVA, N., Review of Russian language studies on radionuclide behaviour in agricultural animals: part 1. Gut absorption, Journal of Environmental Radioactivity 98
(2007a) 85-103. [6] FESENKO, S., HOWARD, B.J., ISAMOV, N., VOIGT, G., BERESFORD, N.A.,
SANZHAROVA, N., BARNETT, C.L., Review of Russian language studies on radionuclide behaviour in agricultural animals: part 2. Transfer to milk, Journal of Environmental Radioactivity 98 (2007b) 104-136.
[7] VOIGT, G., The transfer of Co-60 from feed into vitamin-B12 in cow liver, milk and beef, Journal of Environmental Radioactivity 8 (1988) 209-215.
[8] MAYES, R.W., BERESFORD, N.A., HOWARD, B.J., VANDECASTEELE, C.M., STAKELUM, G., Use of the true absorption-coefficient as a measure of bioavailability of radiocaesium in ruminants, Radiation and Environmental Biophysics 35 (1996) 101-109.
[9] BERESFORD, N.A., MAYES, R.W, COOKE, A.I., BARNETT, C.L, HOWARD, B.J., LAMB, C.S., NAYLOR, G.P.L., The importance of source-dependent bioavailability in determining the transfer of ingested radionuclides to ruminant-derived food products, Environmental Science & Technology 34 (2000a) 4455-4462.

302
[10] COUGHTREY, P.J., THORNE, M.C., Radionuclide distribution and transport in terrestrial and aquatic ecosystems, Volume 1, A.A. Balkema, Rotterdam (1983a).
[11] HARRISON, J.D., NAYLOR, G.P.L., STATHER, J.W., The gastrointestinal absorption of plutonium and americium in rats and guinea-pigs after ingestion of dusts from the former nuclear- weapons site at Maralinga–implications for human exposure, Science of the Total Environment 143 (1994) 211-220.
[12] GILBERT, R.O., ENGEL, D.W., ANSPAUGH, L.R., Transfer of aged 239+240Pu, 238Pu, 241Am, and 137Cs to cattle grazing a contaminated arid environment, Science of The Total Environment 85 (1989) 53-62.
[13] HAM, G.J., HARRISON, J.D., POPPLEWELL, D.S., CURTIS, E.J.C., The distribution of Cs-137 plutonium and americium in sheep, Science of the Total Environment 85 (1989) 235-244.
[14] HOWARD, B.J. BERESFORD, N.A., BARNETT, C.L., FESENKO, S.F., Revision of Technical Reports Series No. 364: gastrointestinal fractional absorption of radionuclides in adult ruminants. Journal of Environmental Radioactivity (submitted).
[15] BERESFORD, N.A., CROUT, N.M.J, MAYES, R.W., HOWARD, B.J, LAMB, C.S., Dynamic distribution of radioisotopes of cerium, ruthenium and silver in sheep tissues Journal of Environmental Radioactivity 38 (1998a) 317-338.
[16] SUTTON, W.W., et al., Metabolism of americium-241 in dairy animals. EMSL-LV-0539-22, US Environmental Protection Agency, Las Vegas, Nevada. (1978).
[17] NATIONAL RESEARCH COUNCIL (NRC), Nutrient requirements of dairy cattle, 7th Edition, National Academic press, Washington DC. (2001).
[18] CROUT, N.M.J., BERESFORD, N.A., DAWSON, J., SOAR, J., MAYES, R.W., The
transfer of 73
As, 109
Cd and 203
Hg to the milk and tissues of dairy cattle, Journal of
Agricultural Science 142 (2004) 203-212. [19] EKMAN, L., ABERG, B., Excretion of niobium-95, yttrium-91, cerium-144 and promethium-
147 in goats. Research in Veterinary Science 2, (1961) 100-105. [20] SQUIRE, H.M., MIDDLETON, L.J., SANSOM, B.F., COID, C.R., Experiments on the
metabolism of certain fission products in dairy cows. In: Radioisotopes in scientific research. Proceedings of first UNESCO international conference. Vol. 4. Pergamon Press, London. (1958).
[21] PANCHENKO I.IA., SARAPULTSEV I.A., “Distribution of radioactive isotopes depending on the way of administration”, Distribution and biological action of radioactive isotopes (Moscalev Yu.I. Ed.) Atomizdat, Moscow (1966) 9-23 (In Russian).
[22] PRISTER, B.S., About behaviour of U in some components of biological chain, Dokl. VASHNIL 1 (1967) 31-33 (In Russian).
[23] MARTYUSHOV, V.Z., BUROV, N.I., ANTAKOVA, N.N., 1984. Uranium metabolism in farm animals. In: Proceedings of the II all union conference on agricultural radiology. Vol. II. RIAR, Obninsk. 150-151 (in Russian).
[24] AGRICULTURAL RESEARCH COUNCIL (ARC), The nutrient requirements of ruminant livestock, C.A.B. International, Wallingford (1980).
[25] SIROTKIN, A.N., BUROV, N.I., TYUMENOV, L.N., GRISHKIN, A.I., On the behaviour of strontium-90, radiocaesium, cerium-144, ruthenium-106, antimony-125 and zirconium-95 in cattle, Radiobiologia 10 (1970) 629-643 (In Russian).
[26] MOSS, B.R., MILLER, J.K., Metabolism of sodium iodide, calcium iodate and pentacalcium orthoperiodate initially placed in the bovine rumen or abomasum, Journal of Dairy Science 53
(1970) 772-775. [27] VANDECASTEELE, C.M., VAN HEES, M., HARDEMAN, F., VOIGT, G., HOWARD,
B.J., The true absorption of I-131, and its transfer to milk in cows given different stable iodine diets, Journal of Environmental Radioactivity 47 (2000) 301-317.
[28] RUSSELL, R.S., "Radioactive strontium in food chains: General review," Radioactivity and human diet, (1966) 173-186.
[29] McDONALD, P., EDWARDS, R.A., GREENHALGH, J.F.D., MORGAN, C.A., Animal nutrition, 5th Edition, Longman Scientific and Technical, Harlow (1995).
303
[30] GILBERT, R.O., et al., Transfer of aged Pu to cattle grazing on a contaminated environment, Health Physics 54 (1988) 323-335.
[31] BUROV, R.I., ANTAKOVA, N.N., PANCHENKO, I.A., SARAPULTSEV, I.A., Accumulation and distribution of 90Sr in sheep and goats in a single and chronic uptake, Radioactive isotopes and organisms Medicina, Moscow, (1969) 9-23 (In Russian).
[32] BUROV, N.I., KORNEYEV, N.A., NIKITINA, Z.A., 90Sr metabolism in pigs, Dokl. VASHNIL 1 (1971) 33-35 (In Russian).
[33] PANCHENKO, I.Y., IVIN, I.S., BUROV, N.I., SIROTKIN, A.N., Accumulation of 90Sr in different animals, Sel’skohozyaistvennaya biologiya 9 (1974) 124-127 (In Russian).
[34] BUROV, N.I., Metabolism of strontium-90 in some species of farm animals, PhD thesis (biology), 1974, Moscow, 18 p. (In Russian).
[35] INTERNATIONAL COMMISSION ON RADIOLOGICAL PROTECTION (ICRP), Human alimentary tract model for radiological protection, Annals of the ICRP: Publication 100
(2006) [36] COUGHTREY, P.J., THORNE, M.C., Radionuclide distribution and transport in terrestrial
and aquatic ecosystems, Volume 2, A.A. Balkema, Rotterdam. (1983b). [37] COUGHTREY, P.J., JACKSON, D., THORNE, M.C., Radionuclide distribution and
transport in terrestrial and aquatic ecosystems, Volume 3, A.A. Balkema, Rotterdam. (1983c). [38] COUGHTREY, P.J., JACKSON, D., JONES, J.H., KANE, P., THORNE, M.C., Radionuclide
distribution and transport in terrestrial and aquatic ecosystems, Volume 4, A.A. Balkema, Rotterdam (1984a).
[39] COUGHTREY, P.J., JACKSON, D., JONES, J.H., THORNE, M.C., Radionuclide distribution and transport in terrestrial and aquatic ecosystems, Volume 5, A.A. Balkema, Rotterdam (1984b).
[40] BERESFORD, N.A., The transfer of Ag-110m to sheep tissues, Science of the Total Environment 85 (1989), 81-90.
[41] COUGHTREY, P.J., Radioactivity transfer to animal products, Commission of the European Communities, Luxembourg (1990) 145 pp.
[42] LENGEMANN, F.W., WENTWORTH, R.A., COMAR, C.L., "Physiological and biochemical aspects of the accumulation of contaminant radionuclides in milk", Lactation: a comprehensive treatise. Nutrition and biochemistry of milk/maintenance, Volume 3, (Larson, B.L., Smith, V.R., Eds.), Academic Press, London (1974) 159-215.
[43] WARD, G.M., JOHNSON, J.E., STEWART, H.F., "Cesium-137 passage from precipitation to milk", Proceedings of the second conference on radioactive fallout from nuclear weapons tests, (Klement, A.W., Ed.). National Technical Information Service, Springfield (1965) 703-710.
[44] WARD, G.M., JOHNSON, J.E., The caesium-137 content of beef from dairy and feed lot cattle, Health Physics 11 (1965) 95-100.
[45] STEWART, H.F., WARD, G.M., JOHNSON, J.E., Availability of fallout Cs-137 to dairy cattle from different types of feed, Journal of Dairy Science 48 (1965) 709–713.
[46] WARD, G.M., JOHNSON, J.E., WILSON, D.W., Deposition of fallout Cs-137 on forage and transfer to milk, Public Health Reports 81 (1966) 639-645.
[47] WARD, G.M., JOHNSON, J.E., Assessment of milk transfer coefficients for use in prediction models of radioactivity transport, Science of the Total Environment 85 (1989) 287-294.
[48] WARD, G.M., JOHNSON, J.E., Validity of the term transfer coefficient, Health Physics 50
(1986) 411-414. [49] NG, Y.C., A review of transfer factors for assessing the dose from radionuclides in
agricultural products, Nuclear Safety 23 (1982) 57-71. [50] NG, Y.C., COLSHER, C.S., QUINN, D.J., THOMPSON, S.E., Transfer coefficients for the
prediction of the dose to man via the forage-cow-milk pathway from radionuclides released to the biosphere, UCRL-51939, Lawrence Livermore National Laboratory, Livermore (1977) 139 pp.
[51] NG, Y.C., COLSHER, C.S., THOMPSON, S.E., "Transfer factors for assessing the dose from radionuclides in agricultural products", Proceedings of an international symposium on the

304
biological implications of radionuclides released from nuclear industries, 26-30 March, Vienna, International Atomic Energy Agency, Vienna (1979) 295-318.
[52] NG, Y.C., COLSHER, C.S., THOMPSON, S.E., Transfer coefficients for assessing the dose from radionuclides in meat and eggs, NUREG/CR-2976 UCID-19464, Lawrence Livermore National Laboratory, (1982) 118 pp.
[53] BROWN, J., SIMMONDS, J.R., Farmland: a dynamic model for the transfer of radionuclides through terrestrial foodchains (NRPB-R275), National Radiological Protection Board, Chilton (1995) 76 pp.
[54] MÜLLER, H., PRÖHL, G., ECOSYS-87. A dynamic model for assessing radiological consequences of nuclear accidents, Health Physics 64 (1993) 232-252.
[55] U.S. NUCLEAR REGULATORY COMMISSION (USNRC), Calculation of annual doses to man from routine releases of reactor effluents for the purpose of evaluating compliances with 10 CFR, Part 50, Appendix 1, US Government Printing Office, Washington, D.C. (1977).
[56] YU, C., ZIELEN, A.J., CHENG, J.J., LEPOIRE, D.J., GNANAPRAGASAM, E., KAMBOJ, S.A.J., WALLO, A., III, WILLIAMS, W.A., PETERSON, H., User's manual for RESRAD version 6, ANL/EAD-4, Argonne National Laboratory, Illinois (2001) 458 pp.
[57] CROUT, N.M.J., VOIGT, G., Modelling the dynamics of radioiodine in dairy cows, Journal of Dairy Science 79 (1996) 254-259.
[58] CROUT, N.M.J., BERESFORD, N.A., HOWARD, B.J., MAYES, R.W., HANSEN, H.S., A model of radiostrontium transfer in dairy goats based on calcium metabolism, Journal of Dairy Science 81 (1998a) 92-99.
[59] CROUT, N.M.J., MAYES, R.W., BERESFORD, N.A., LAMB, C.S., HOWARD, B.J., A metabolic approach to simulating the dynamics of C-14, H-3 and S-35 in sheep tissues, Radiation and Environmental Biophysics 36 (1998b) 243-250.
[60] HANSEN, H.S., HOVE, K., Radiocesium bioavailability–Transfer of Chernobyl and tracer radiocesium to goat milk, Health Physics 60 (1991) 665-673.
[61] HOWARD, B.J., MAYES, R.W., BERESFORD, N.A., LAMB, C.S., Transfer of radiocaesium from different environmental sources to ewes and suckling lambs, Health Physics 57 (1989) 579-586.
[62] BELLI, M., BLASI, M., CAPRA, E., DRIGO, A., MENEGON, S., PIASENTIER, E., SANSONE, U., I Ingested soil as a source of Cs-137 to ruminants, Science of the Total Environment 136 (1993) 243-249.
[63] VOIGT, G., MULLER, H., PARETZKE, H.G., BAUER, T., ROHRMOSER, G., Cs-137 transfer after Chernobyl from fodder into chicken meat and eggs, Health Physics 65 (1993) 141-146.
[64] BERESFORD, N.A., MAYES, R.W., BARNETT, C.L., MACEACHERN, P.J., CROUT, N.M.J., Variation in the metabolism of radiocaesium between individual sheep, Radiation and Environmental Biophysics 37 (1998a) 277-281.
[65] ASSIMAKOPOULOS, P.A., IOANNIDES, K.G., KARAMANIS, D., PAKOU, A.A., STAMOULIS, K.C., MANTZIOS, A.G., NIKOLAOU, E., Variation of the transfer-coefficient for radiocesium transport to sheeps milk during a complete lactation period, Journal of Environmental Radioactivity 22 (1994) 63-75.
[66] HANSEN, H.S., HOVE, K., The effect of exercise on Cs-134 retention in lambs, Journal of Environmental Radioactivity 19 (1993) 53-66.
[67] SELNÆS, T.D., STRAND, P., Comparison of the uptake of radiocaesium from soil to grass after nuclear weapons tests and the Chernobyl accident, The Analyst 117 (1992) 493-499.
[68] WILKINS, B.T., COOKE, A.I., GREEN, N., RIMMER, D.L., WEEKES, T.E.C., The availability of soil-associated radionuclides for uptake by ruminants: Implications for radiological assessment models, Radiation Protection Dosimetry 69 (1997) 111-116.
[69] BERESFORD, N.A., HOWARD, B.J., The importance of soil adhered to vegetation as a source of radionuclides ingested by grazing animals, Science of the Total Environment 107
(1991), 237-254. [70] RAFFERTY, B., DAWSON, D.E., COLGAN, P.A., Assessment of the role of soil adhesion
in the transfer of Cs-137 and K-40 to pasture grass, Science of the Total Environment 145
(1994) 135-141.

305
[71] CROUT, N.M.J., BERESFORD, N.A., HOWARD, B.J., Does soil adhesion matter when predicting radiocaesium transfer to animals, Journal of Environmental Radioactivity 20 (1993) 201-212.
[72] BERESFORD, N.A., MAYES, R.W., HOWARD, B.J., EAYRES, H.F., LAMB, C.S., BARNETT, C.L., SEGAL, G., The bioavailability of different forms of radiocesium for transfer across the gut of ruminants, Radiation Protection Dosimetry 41 (1992) 87-91
[73] HOWARD, B.J., LIVENS, F.R., WALTERS, C.B., A review of radionuclides in tide-washed pastures on the Irish sea coast in England and Wales and their transfer to food-products, Environmental Pollution 93 (1996) 63-74.
[74] NALEZINSKI, S., RUHM, W., WIRTH, E., Development of a general equation to determine the transfer-factor feed-to-meat for radiocaesium on the basis of the body mass of domestic animals, Health Physics 70 (1996) 717-721.
[75] HOWARD, B.J., et al., The use of dietary calcium intake of dairy ruminants to predict the transfer coefficient of radiostrontium to milk, Radiation and Environmental Biophysics 36
(1997) 39-43. [76] BERESFORD, N.A., et al., Generic relationship between calcium intake and radiostrontium
transfer to the milk of dairy ruminants, Radiation and Environmental Biophysics 37 (1998b) 129-131.
[77] COMAR, C.L., WASSERMAN, R.H., "Radioisotopes in the study of mineral Metabolism", Progress in Nuclear Energy Series 1 (1956) 153-196.
[78] BERESFORD, N.A., MAYES, R.W., COLGROVE, P.M., BARNETT, C.L., BRYCE, L., DODD, B.A. LAMB, C.S., A comparative assessment of the potential use of alginates and dietary calcium manipulation as countermeasures to reduce the transfer of radiostrontium to the milk of dairy animals, Journal of Environmental Radioactivity 51 (2000c) 321-334.
[79] MINISTRY OF AGRICULTURE FISHERIES AND FOOD (MAFF)–STANDING COMMITTEE ON TABLES OF FEED COMPOSITION, UK tables of nutritive value and chemical composition of feeding stuffs, Rowett Research Services Ltd., Aberdeen (1990) 420 pp.
[80] NATIONAL RESEARCH COUNCIL (NRC), Nutrient requirements of horses, 5th Revised Edition, National Academy Press, Washington D.C. (1989) 100 pp.
[81] NATIONAL RESEARCH COUNCIL (NRC), Mineral tolerance of animals, 2nd Revised Edition, National Academy Press, Washington D.C (2005) 496 pp.
[82] NATIONAL RESEARCH COUNCIL (NRC), Nutrient requirements of small ruminants : sheep; goats; cervids and new world camelids, National Acad/ Press, Washington, D.C. (2007) 362 pp.
[83] NATIONAL RESEARCH COUNCIL (NRC), Nutrient requirements of beef cattle, update 2000, 7th Revised Edition, National Academy Press, Washington DC. (1996) 232 pp.
[84] UNDERWOOD, E.J., Trace elements in human and animal nutrition, 4th Edition, Academic Press, New York (1977) 545 pp.
[85] CHURCH, D.C., "Digestive physiology and nutrition of ruminants–Practical nutrition", Volume 3 (1980) pp 416.
[86] HOWARD, B.J., BERESFORD, N.A., GASHCHAK, S., ARKHIPOV, A., MAYES, R.W., CABORN, J., STROMANN, G., WACKER, L., The transfer of 239/240Pu to cow milk, Journal of Environmental Radioactivity 98 (2007a) 191-204.
[87] ENNIS, M.E.J., JOHNSON, J.E., WARD, G.M., VOIGT, G.M., A specific activity effect in the metabolism of technetium., Health Physics 54 (1988) 157-160.
[88] BISHOP, G.P., BEETHAM, C.J., CUFF, Y.S., Review of literature for chlorine, technetium, iodine and neptunium, ANS 780-R2 and NSS/R193, Associated Nuclear Services Ltd, Epsom (1989).
[89] JOHNSON, J.E., WARD, G.M., ENNIS, M.E., JR., BOAMAH, K.N., Transfer coefficients of selected radionuclides to animal products. 1. Comparison of milk and meat from dairy cows and goats, Health Physics 54 (1988) 161-166.
[90] VOIGT, G., HENRICHS, K., PROHL, G., PARETZKE, H.G., Measurements of transfer coefficients for 137Cs, 60Co, 22NA, 131I, and 95mTc from feed into milk and beef, Radiation and Environmental Biophysics 27 (1988) 143-152.
306
[91] VON WIECHEN, A., HEINE, K., HAGEMEISTER, H., A contribution to the question of the transfer of technetium-99 into milk, Atomkernenergie Kerntechnik 42 (1983) 199-200 (in German).
[92] JONES, B.E.V., Technetium metabolism in goats and swine, Health Physics 57 (1989) 331-336.
[93] BONDIETTI, E.A., GARTEN, C.T.J., "Transfer of I-131 and Tc-95m from pasture to goat milk", Technetium in the environment, (Desmet, G., Myttenaere, C., Eds.), Elsevier Applied Science, London (1988) 339-347.
[94] THORNE, M., Estimation of animal transfer factors for radioactive isotopes of iodine, technetium, selenium and uranium, Science of the Total Environment, 70 (2003) 3-20.
[95] HAAS, G., SCHUPFNER, R., MULLER, A., Transfer of natural and man-made radionuclides from plants to roe deer and farm-animals, Journal of Radioanalytical and Nuclear Chemistry-Articles 194 (1995) 269-276.
[96] BERESFORD, N.A., HOWARD, B.J., MAYES, R.W., LAMB, C.S., The transfer of radionuclides from saltmarsh vegetation to sheep tissues and milk, Journal of Environmental Radioactivity 98 (2007a) 36-49.
[97] BERESFORD, N.A., MAYES, R.W., BARNETT, C.L., HOWARD, B.J., The transfer of radiocaesium to ewes through a breeding cycle–an illustration of the pitfalls of the transfer coefficient, Journal of Environmental Radioactivity 98 (2007b) 24-35.
[98] SMITH, J.T., BERESFORD, N.A. (Eds.), Chernobyl–catastrophe and consequences, Praxis Publishing/Springer, Chichester (2005) 310 pp.
[99] MERTZ, W., Trace elements in human and animal nutrition, 5th Edition, Volume 2, Academic Press Inc, London (1986) 499 pp.
[100] MERTZ, W., Trace Elements in human and animal nutrition, 5th Edition, Volume 1, Academic Press Inc, London (1987) 479 pp.
[101] HOWARD, B.J., BERESFORD, N.A., MAYES, R.W., LAMB, C.S., BARNETT, C.L., The transfer of different forms of 35S to goat milk, Journal of Environmental Radioactivity 98
(2007b) 177-190. [102] GALERIU, D., MELINTESCU, A., BERESFORD, N.A., CROUT, N.M.J., PETERSON,
R.H.T., Modelling 3H and 14C transfer to farm animals and their products under steady state conditions, Journal of Environmental Radioactivity 98 (2007) 205-217.
[103] BERESFORD, N.A., BROADLEY, M.R., HOWARD, B.J., BARNETT, C.L., WHITE, P.J., Estimating radionuclide transfer to wild species-data requirements and availability for terrestrial ecosystems, Journal of Radiological Protection 24 (2004) A89-A103.
[104] HIGLEY, K.A., DOMOTOR, S.L., ANTONIO, E.J., A kinetic-allometric approach to predicting tissue radionuclide concentrations for biota, Journal of Environmental Radioactivity 66 (2003) 61-74.
[105] U.S. DEPARTMENT OF ENERGY (US DOE), A graded approach for evaluating radiation doses to aquatic and terrestrial biota, U.S. Department of Energy, Washington D.C (2002) 226 pp.
[106] NAGY, K.A., Food requirements of wild animals: Predictive equations for free-living mammals, reptiles and birds, Nutrition abstracts and reviews. Series B: Livestock Feeds and Feeding 71 (2001) 1R-12R.
[107] BERESFORD, N.A., ‘Does size matter?’ International conference on the protection of the environment from the effects of ionizing radiation, Stockholm, IAEA, Stockholm (2003) 182-185.
[108] FESENKO, S., ISAMOV, N., HOWARD, B.J., VOIGT, G., BERESFORD, N.A., SANZHAROVA, N., Review of Russian studies on radionuclide behaviour in agricultural animals: 3. Transfer to muscle, Journal of Environmental Radioactivity (in press).
[109] BERESFORD, N.A., CROUT, N.M.J., MAYES, R.W., Interpretation of the results of a three year study to examine the dynamics of radionuclides in sheep tissue, RP0424, Institute of Terrestrial Ecology, Grange-over-Sands (1996) 59 pp.

307
[110] TAUCIN, E.Ya., SVILANE, A.B., Trace element content in tissues and products of livestock of the Latvian SSR, Trudy Sektor Fiziologii Zhivotnykh Akademiya Nauk Latv. (SSR Institute of Biology) 3 (1962) 165-205.
[111] VAN BRUWAENE, R., GERBER, G.B., KIRCHMANN, R., COLARD, J., Metabolism of Antimony-124 in lactating dairy cows, Health Physics 43 (1982) 733-738.
[112] SIROTKIN, A.N., “Transfer of radionuclides to animal products”, Foundations of radioecology of farm animals, Energoatomizdat, Moscow (1987) 100-140 (In Russian).
[113] BOYER, K.W., JONES, J.W, LINSCOTT, D., WRIGHT, S.K., STROUBE, W., CUNNINGHAM, W., Trace element levels in tissues from cattle fed a sewage sludge amended diet, Journal of Toxicology and Environmental Health 8 (1981) 281-295.
[114] NELMES, A.J., BUXTON, R.S.J., FAIRWEATHER, F.A., MARTIN, A.E., "Implication of the transfer of trace metals from sewage sludge to man", Trace substances in environmental health, Science Reviews Ltd., Northwood, US (1974) 145-153.
[115] ANNENKOV, B.N., DIBOBES, I.K., ALEKSAKHIN, R.M., Radiobiology and radioecology of farm animals, (1973) 220 pp.
[116] SUMERLING, T.J., GREEN, N., DODD, N.J., Uptake of radionuclides by farm animals close to a major nuclear installation, in: Kaul, A., Neider, R., Pensko, J., Stieve, F.E., Brunner, H., (Eds.), Radiation Risk Protection, Verlag tuv Rheinland gmbh, Koln, pp.156-160. (1984).
[117] STANLEY, R.E., BRETTHAUER, E.W., SUTTON, W.W., Absorption, distribution and excretion of plutonium by dairy cattle, USAEC report NVO-153, Nevada operations office, National Technical Information Service (NTIS), Springfield, Virginia (1975) 97-124 pp.
[118] SIROTKIN, A.N., Radionuclide uptake to animal stuffs, Sel’skohozyaistvenaya radioecologiya, (Alexakhin, R.M., Korneyev, N.A., Eds.), Ecologiya, Moscow (1991) 106-115 (In Russian).
[119] COMMISSION OF THE EUROPEAN COMMUNITIES, Radionuclide transfer factors for animal feeding stuffs and animal products, Commission of the European Communities, Luxembourg (1987) 26 pp.
[120] COUSINS, R.J., BARBER, A.K., TROUT, J.R., Cadmium toxicity in growing swine, Journal of Nutrition 103 (1973) 964-972.
[121] ENNIS, M.E., WARD, G.M., JOHNSON, J.E., BOAMAH, K.N., Transfer Coefficients of Selected Radionuclides to Animal Products .2. Hen Eggs and Meat, Health Physics 54 (1988) 167-170.
[122] JOHNSON, J.E., WARD, G.M., Screening models to predict food-chain transfer of environmental toxicants, DOE/ER/60531-1; ON: DE89016448, Colorado State University, Fort Collins (1989) 22 pp.
[123] MULLEN, A.A., LLOYD, S.R., MOSLEY, R.E., "Distribution of ingested transuranium nuclides in chickens and subsequent transport to eggs", Transuranium nuclides in the environment, International Atomic Energy Agency, Vienna (1975) 423-433.
[124] MRAZ, F.R., WRIGHT, P.L., FERGUSON, T.M., ANDERSON, D.L., Fission product metabolism in hens and transference to eggs, Health Physics 10 (1964) 777-782.


AGRICULTURAL ECOSYSTEMS: TRANSFER TO FRUITS

311
TRANSFER TO FRUITS
F. CARINI Institute of Agricultural & Environmental Chemistry, Università Cattolica del Sacro Cuore,
Piacenza, Italy
Abstract
The paper describes the key transfer processes, concepts and conceptual models regarded as important for dose assessment,
as well as relevant parameters for modelling radionuclide transfer in fruits. Information relate to fruit plants grown in
agricultural ecosystems of temperate regions. The relative significance of each pathway after release of radionuclides
depends upon the radionuclide, the kind of crop, the stage of plant development and the season at time of deposition. Fruit
intended as a component of the human diet is borne by plants that are heterogeneous in habits, and morphological and
physiological traits. Information on radionuclides in fruit systems has therefore been rationalised by characterising plants in
three groups: woody trees, shrubs, herbaceous plants. Parameter values have been collected from open literature, conference
proceedings, institutional reports, books and international databases. Given the scarce information available on the subject,
the choice has been made to not reject any information. Data on root uptake are reported as transfer factor values related to
fresh weight, being consumption data for fruits usually given in fresh weight. Recommendations are given for research and
modelling.
1. INTRODUCTION
Botanically, fruit is the structure of angiosperms that develops from the ovary wall after
fecundation as the enclosed seed or seeds mature. In this context, the term ‘‘fruit’’ refers not
to a well defined botanical plant part, called pericarp, but in the horticultural sense, to a
component of the human diet generally consumed as a dessert item [1].
Plants bearing fruits occur in a vast range of habits (size and shape), and morphological and
physiological traits, and can be woody trees, bushes, or herbaceous plants, evergreen or
deciduous, perennial or annual. Herbaceous annuals usually blossom once and then die,
having set fruit and seed. Some perennials, like the monocarp banana and pineapple, also
flower once and then die. However, woody fruit crops are polycarps, they bloom year after
year. Some trees are deciduous; e.g. apples shed their leaves in winter. Others, like citrus,
mango, avocado, are evergreen and retain their leaves for two or more years.
Fruit contamination following a release to atmosphere can be the result of various processes:
(i) direct deposition to exposed fruit surfaces, absorption by the fruit skin and transport to the
interior; (ii) deposition to exposed plant surfaces (directly from the atmosphere or as a result
of resuspension), absorption to interior and translocation to fruit; (iii) for perennial plants:
remobilisation of radionuclides from the leaves to the over-wintering organs prior to leaf
drop, followed by retranslocation from storage organs to other plant components at the
resumption of growth; (iv) deposition to soil, vertical migration in the soil profile, root uptake
and transfer to the fruit. The main processes involved in the transfer of radionuclides to fruits
are shown in Figure 1 [2].
The relative significance of each pathway after release of radionuclides depends upon the
radionuclide, the kind of crop, the stage of plant development and the season at time of
deposition. Furthermore, in agricultural ecosystems, the transfer of radionuclides to fruit is
generally affected by human intervention, which includes horticultural practices, intended to
modify physiology and translocation of nutrients, to achieve early cropping, high, early and
sustained yield, and high fruit quality. The published literature that describes the phenological
development of above- and below-ground organs of temperate tree fruit, and hence the
potential for uptake of radionuclides directly from the atmosphere and via the soil, has been
reviewed by Atkinson and Webster [3].
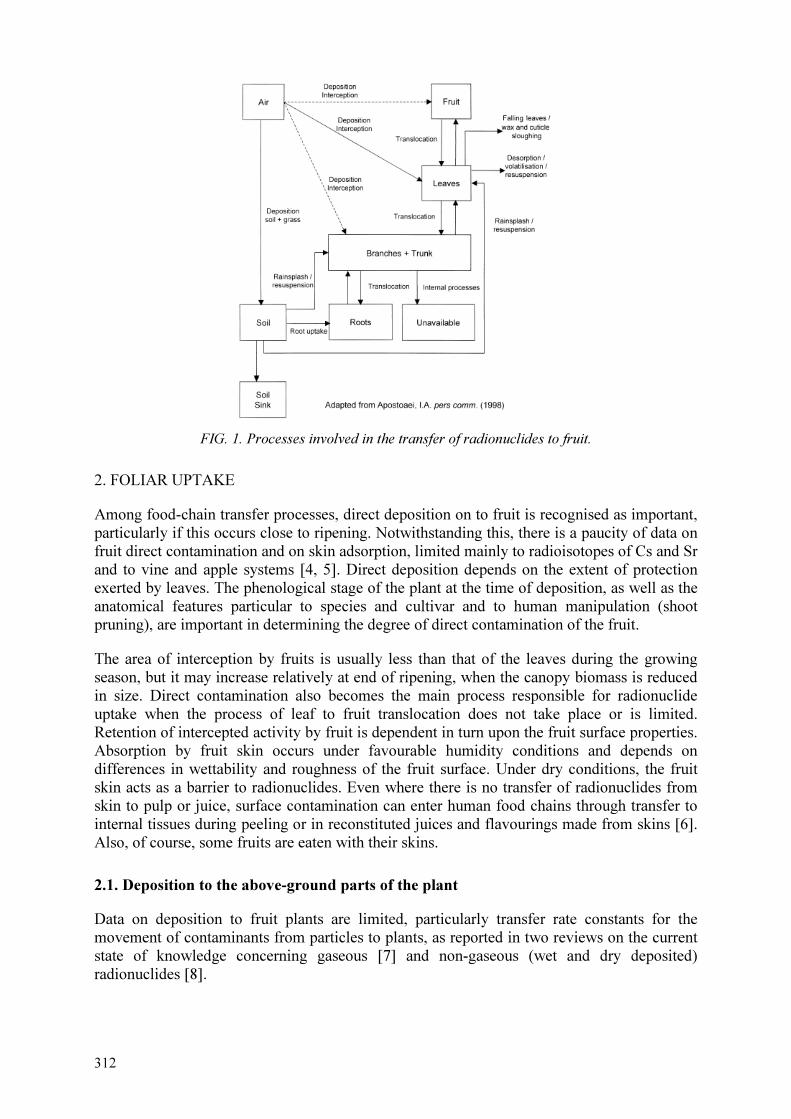
312
FIG. 1. Processes involved in the transfer of radionuclides to fruit.
2. FOLIAR UPTAKE
Among food-chain transfer processes, direct deposition on to fruit is recognised as important,
particularly if this occurs close to ripening. Notwithstanding this, there is a paucity of data on
fruit direct contamination and on skin adsorption, limited mainly to radioisotopes of Cs and Sr
and to vine and apple systems [4, 5]. Direct deposition depends on the extent of protection
exerted by leaves. The phenological stage of the plant at the time of deposition, as well as the
anatomical features particular to species and cultivar and to human manipulation (shoot
pruning), are important in determining the degree of direct contamination of the fruit.
The area of interception by fruits is usually less than that of the leaves during the growing
season, but it may increase relatively at end of ripening, when the canopy biomass is reduced
in size. Direct contamination also becomes the main process responsible for radionuclide
uptake when the process of leaf to fruit translocation does not take place or is limited.
Retention of intercepted activity by fruit is dependent in turn upon the fruit surface properties.
Absorption by fruit skin occurs under favourable humidity conditions and depends on
differences in wettability and roughness of the fruit surface. Under dry conditions, the fruit
skin acts as a barrier to radionuclides. Even where there is no transfer of radionuclides from
skin to pulp or juice, surface contamination can enter human food chains through transfer to
internal tissues during peeling or in reconstituted juices and flavourings made from skins [6].
Also, of course, some fruits are eaten with their skins.
2.1. Deposition to the above-ground parts of the plant
Data on deposition to fruit plants are limited, particularly transfer rate constants for the
movement of contaminants from particles to plants, as reported in two reviews on the current
state of knowledge concerning gaseous [7] and non-gaseous (wet and dry deposited)
radionuclides [8].
313
Perennial species in orchards do not form a continuous canopy, but consist either of round-
headed trees with individual access to each from all sides or as vertical hedgerows with trees
contiguous in rows separated by alleyways. For the same species, the plantation density can
vary widely. Fruit trees in hedgerows can be trained to different shapes, with different spatial
arrangements of leaves, so that trees with the same Leaf Area Index (LAI), but different
growth shapes have different specific interception capacities [9]. Interception by fruit trees
with discontinuous canopies has to take into account the leaf area distribution in both the
horizontal and vertical dimensions over the entire orchard surface.
Studies comparing interception and deposition of ozone on peach orchards and soybean crops
indicate that fruit trees of this type constitute a three-fold greater sink for gaseous pollutants
than herbaceous crops, as a consequence of the structural and architectural characteristics and
the biological activity of the vegetative surfaces of the two crops [10]. Other studies
demonstrate that the deposition velocity calculated per unit plant mass ( w
gV : cm
3 g
-1 s
-1)
exhibits significant differences between different fruit plants (apple, strawberry, blackcurrant
and raspberry) for deposition of gaseous 14
CO2 and CO35
S [11]. However, the deposition
velocities calculated per unit area of the plant ( a
gV : cm s
-1) were of the same magnitude as
those observed for other crops. The authors suggested that a single deposition velocity for all
crops should be used in assessment studies and that this should be the highest value, unless a
probabilistic approach was being pursued. Other authors have proposed the use of canopy
fractal dimension, the parameter which describes tree-crown structure including information
on spatial distribution of the leaf area [12], instead of the LAI, to seek correlations with
interception of airborne contaminants [8].
For non-gaseous airborne contaminants, experimental studies show that the water-storage
capacity of plants is the major contributor to a plant’s total wet deposited contaminant
loading, following a single rainfall event [13]. The factors affecting the number of leaves and
the total leaf area per tree, at least for top fruit -such as apple (Malus)- and temperate climates,
are the scion species/cultivar, the rootstock, the age of the tree, environmental conditions, the
level of cropping, and management practices such as pruning, irrigation and nutrition [14, 15
cited by Ref. [3].
Evergreen species, such as citrus and olives, are constantly exposed to the risk of
contamination, whereas deciduous species have a reduced epigeous interception capacity
during winter. For deciduous species, the phenological stage at time of fallout is the main
parameter determining canopy interception. Growth curves, in particular times of anthesis and
leafing, are therefore significant for modelling radionuclide intake from different fruit species.
Values showing the time dependence of LAI are available for some fruit types [14-16].
2.2. Absorption
Absorption of soluble radionuclides in fruit plants can occur into leaves, blossom and
branches. Blossom should behave like leaves, although experimental evidence for this
suggestion is limited to cereals [17]. The bark of the trunk and branches probably has low
permeability to radionuclides, although experiments on young apple trees have shown
penetration under wet conditions [18].
Swietlik and Faust [19] reported models on diffusion through isolated cuticles. According to
the authors, the most plausible model, developed by Schönherr and Huber [20], on the basis
of citrus, pear and apricot studies, assumed that above pH 3 cuticles are more permeable to

314
cations, whereas below pH 3 they are more permeable to anions. The rate of penetration of
cations through the cuticle is inversely related to the radius of the hydrated ion and occurs in
the following order: Cs+> Rb
+> K
+> Na
+> Li
+> Mg
2+> Sr
2+> Ca
2+ [21-23 cited by Ref. 19].
Absorption is rarely represented in literature as a net flux of contaminants from external to
internal leaf, but rather as data on the releasable fraction upon rinsing. Data are often reported
as translocation, which includes absorption and loss processes. In a few cases, it has been
possible to derive absorption from the published data as the sum of ‘not removable from
leaves + translocated to other plant components + already absorbed, but lost through
weathering and spontaneous shedding of superficial particles’ [4]. Data are reported in Table
1, expressed as percentage of the applied activity, and relate to foliar application of 134
Cs and 85
Sr in soluble form on apples, strawberries and grapevines.
The rate of foliar absorption depends on radionuclide, plant species and even cultivar. Data
reported in Table 1 indicate that adsorption is larger for 134
Cs than for 85
Sr and that it follows
the order: apple ≥ strawberry > grapevine. In general, comparative data on the absorption
rates of different species are lacking. Results collected on absorption in various fruit trees
following foliar application of fertilizers show that Prunus leaves are less efficient in foliar
absorption than are apples or citrus leaves [19].
Available data indicate that foliar absorption is time dependent: the longer a contaminant is
retained on a leaf surface the more likely it is to be absorbed. Therefore, weathering
processes, in addition to spontaneous shedding of cuticular wax, will affect absorption due to
reduction in the pool of external radionuclide available for absorption. Translocation to other
plant organs removes absorbed activity from the leaf and may be of significance for a high
rate of absorption. Temperature and humidity, as well as foliar irrigation, influence
absorption. Foliar irrigation by sprinkling over or under the canopy is a common practice in
orchards: in winter-spring to increase the freeze resistance of fruit trees and protect the buds
from the frost, in summer to reduce the temperature of the canopy.
2.3 Translocation to fruit
The above-ground part to fruit translocation factor is an aggregated parameter that describes a
net flux from leaf to fruit as a result of all the processes of deposition, interception, retention,
absorption and translocation, measured at a single point in time.

315
TABLE 1. ACTIVITY ABSORBED BY APPLES, STRAWBERRIES AND GRAPEVINES AT VARIOUS TIMES AFTER FOLIAR APPLICATION OF 134Cs AND 85Sr
Fruit Element Number of entries, N
Year Time after contamination, d
Absorbed activity (% of the applied)
Reference
Apple Cs 1 1 60 [24]
1 41 76 [24]
1 84 65 [24]
Grapevine Cs 2 1991 30 29 [25]
2 45 31 [25]
2 60 47 [25]
2 75 34 [25]
2 90 29 [25]
2 120 40 [25]
2 150 36 [25]
Cs 2 1992 30 34 [25]
2 45 38 [25]
2 60 40 [25]
2 75 39 [25]
2 90 45 [25]
2 105 48 [25]
2 135 60 [25]
Strawberry Cs 3 1 34 [26]
3 7 58 [26]
3 21 48 [26]
3 35 71 [26]
3 49 77 [26]
3 56 67 [26]
Apple Sr 1 1 51 [24]
1 41 60 [24]
1 84 52 [24]
Grapevine Sr 2 1990 30 3 [25]
2 60 3 [25]
2 90 7 [25]
2 120 8 [25]
Strawberry Sr 3 1 18 [26]
3 7 26 [26]
3 21 22 [26]
3 35 27 [26]
3 49 36 [26]
3 56 37 [26]
316
2.3.1 Data from experiments
In the literature, there is no uniformity in the mathematical description of the process of
above-ground part to fruit translocation, due to the lack of a generally adopted experimental
protocol: data have been produced in a variety of experimental conditions, fruit plants have
been contaminated at various phenological stages, and different methodologies of
radionuclide application have been used. Therefore, published data are not always
comparable.
Much of the information on non-gaseous radionuclides concerns caesium and strontium.
Experiments have generally been carried out simulating wet deposition, except for the data of
Madoz-Escande et al. [27], where dry deposition of 137
Cs and 90
Sr has been studied. The
activity of fruits for non-gaseous radionuclides has been calculated from fractions of
recovered activity and expressed as fraction of the applied or intercepted activity [4, 5]. Data
are summarised in Tables 2 for Cs, 3 for Sr and 4 for Ca.
Information on gaseous radionuclides relates to 14
CO2, CO35
S and HTO (tritiated water). Data
produced by Ref. [11] are expressed as % of the activity in the whole plant at harvest and are
reported in Table 5.
Data reported in Tables 2, 3 and 4 are not directly comparable with data in Table 5. However
some general conclusions can be drawn.
Translocation, like absorption, continues with time and depends on the chemical element. In
general, radiocaesium is readily translocated to fruits, whereas absorbed radiostrontium and
calcium, on the basis of the few available data, remain at the site of application or are
translocated to an extent that is one order of magnitude less than radiocaesium. For gaseous
radionuclides, when the contamination process occurs at flowering, 35
S and 3H are
subsequently translocated to fruits, 27 and 32% respectively, whereas very little 14
C, 7%, is
remobilised from leaves to fruits late in the growing season.
There are large differences in the degree of translocation of radionuclides to fruits of different
species, depending upon physiological characteristics of the plants. The highest experimental
values for radiocaesium are observed in apple, strawberry and pear, and the lowest in orange.
Among the shrubs, gooseberry shows the highest translocation and blueberry the lowest [31].
Differences in leaf-to-fruit translocation depend not only on the scion species, but also on the
cultivar, as discussed by Ref. [3] and demonstrated for different varieties of apples by Ref.
[18].
Translocation of radionuclides from leaf to fruit (or to other parts of the plant) depends on the
phenological stage of the plant at the time of deposition. The highest values in fruit at harvest
occur following deposition between fruit development and beginning of ripening. This
interval is regarded by horticulturists as the stage of the higher demand of fruits for
photosynthetic products from leaves, and that could explain the higher transport of C and of
Cs, analogous to potassium, from leaves to fruits [11, 27, 36, 37].

317
TABLE 2. FRUIT ACTIVITY OF Cs RESULTING FROM TRANSLOCATION AFTER SUPERFICIAL CONTAMINATION
Fruit species
(Variety)
Experimental
conditions
Phenological stage
at time of
contamination
Time between
contamination and
harvest, d
Fruit activity (% of
applied/intercepted)
Ref.
Apple (Golden) greenhouse - - 17 (of recovered) [28]
Apple (Golden) greenhouse - - 0.15 L/kg w.w. [29]
Apple (Gloster) leaf droplet,
precipitation-free
beginning of fruit
development
70
(fruit maturity)
39 [18]
Apple (Jonagold)
42 [18]
Apple (Gloster) foliar shoot
dipping,
precipitation-free
19 [18]
Apple (Jonagold)
29 [18]
Apple (Jonagold) bark,
precipitation-free
beginning of fruit
development
49 0.2–
1.8
(of the amount
absorbed by the bark)
[18]
Apple (Aroma) precipitation-free mature fruit, mass
73 g
1 1
[24]
Apple (Aroma)
fruit mass 46.5 g 41 16 [24]
Apple (Aroma)
green fruit,
mass 8.4 g
84 29
[24]
Apple (Golden
Delicious)
open field green fruit 50 47 [30]
Blueberry greenhouse - - 0.7 [31]
Gooseberry greenhouse
- - 3.4 [31]
Grapevine
(Riesling)
greenhouse
- 150 8 [25]
- 365 1.5 [25]
Grapevine
(Pinot Blanc)
open field beginning of
ripening
30 1.8 [32]
Grapevine
(Pinot Blanc)
open field beginning of
ripening
365 0.2 [32]
Grapevine
(Pinot Blanc)
open field beginning of
ripening
35 3.7 [33]
Grapevine
(Pinot Blanc)
open field beginning of
ripening
30 9.6 [34]
Grapevine
(Chardonnay)
open field green fruit 50 5.5 [30]
Grapevine greenhouse late flowering 30 2.9 [27]
Grapevine greenhouse beginning of
ripening
2 3.0 [27]
Grapevine greenhouse beginning of
ripening
7 3.8 [27]
Grapevine greenhouse beginning of
ripening
20 3.8 [27]
Grapevine greenhouse beginning of
ripening
30 6.9 [27]
Orange open field - - 0.1
[35]
Pear
(Conference)
open field green fruit 50 1.28 [30]
Redcurrant greenhouse - - 2 [31]
Strawberry greenhouse - - 20 [31]
Strawberry greenhouse - 21-105 20-36 [26]
Strawberry
(Miss)
tunnel anthesis 22 – 48 15 [36]
Strawberry
(Miss)
tunnel ripening 1 – 27 6.5 [36]

318
TABLE 3. FRUIT ACTIVITY OF Sr BY TRANSLOCATION AFTER SUPERFICIAL
CONTAMINATION, EXPRESSED AS FRACTION OF THE APPLIED OR INTERCEPTED ACTIVITY
Fruit species (Variety)
Experimental conditions
Phenological stage at time of
contamination
Time between contamination
and harvest, d
Fruit activity by translocation (% of
applied/intercepted)
Ref.
Apple
(Golden)
greenhouse - - 2.2 of recovered
activity in plant
[28]
Apple (Aroma)
precipitation-free
mature fruit, mass 73 g
1 0
[24]
fruit mass 46.5 g 41 0
green fruit, mass 8.4 g
84 0
Apple (Golden Delicious)
open field green fruit 50 0.80 [30]
Blueberry greenhouse - - 0.02 [31] Gooseberry greenhouse - - 2.1 [31]
Grapevine (Riesling
Sylvaner: Müller-
Thurgau)
greenhouse - 120 <2.5 [25]
Grapevine (Pinot Blanc)
open field beginning of ripening
30 0.73 [34]
Grapevine (Chardonnay)
open field green fruit 50 0.09 [30]
Grapevine greenhouse late flowering 30 1.1 [27]
Grapevine greenhouse beginning of ripening
2 3.7 [27]
Grapevine greenhouse beginning of ripening
7 3.0 [27]
Grapevine greenhouse beginning of
ripening
20 2.7 [27]
Grapevine greenhouse beginning of
ripening
30 4.0 [27]
Orange open field - - 0.004
[35]
Pear (Conference)
open field green fruit 50 0.98 [30]
Redcurrant greenhouse - - 0.003 [31] Strawberry greenhouse - - 0.3 [31] Strawberry
(Miss)
tunnel anthesis 22 – 48 1.6 [36]
Ripening 1 – 27 2.2 [36]

319
TABLE 4. FRUIT ACTIVITY OF Ca BY TRANSLOCATION AFTER SUPERFICIAL
CONTAMINATION, EXPRESSED AS FRACTION OF THE APPLIED OR INTERCEPTED ACTIVITY [31]
Fruit species
(Variety)
Experimental conditions
Phenological stage at time of
contamination
Time between contamination
and harvest, d
Fruit activity by translocation (% of applied/intercepted)
Blueberry greenhouse - - 0.02
Gooseberry greenhouse - - 2.7
Redcurrant greenhouse - - 0.2
TABLE 5. FRUIT ACTIVITY AFTER SUPERFICIAL CONTAMINATION OF GASEOUS 14
CO2,
CO35S AND HTO, EXPRESSED AS % OF THE ACTIVITY IN THE WHOLE PLANT AT
HARVEST TIME. ALL THE DATA ARE FOR APPLE CONTAMINATED IN A WIND TUNNEL
[11]
Radionuclide Phenological stage at time of contamination
Time between contamination and
harvest, d
Fruit activity (%)
14C flowering 127 7
14C fruitlet formation 84 21
14C fruit development 32 61
14C
fruit ripening 5 38
3H
flowering 127 32
3H
fruitlet formation 84 18
3H
fruit development 32 43
3H fruit ripening 5 42
35S flowering 127 27
35S fruitlet formation 84 9
35S fruit development 32 25
35S fruit ripening 5 6
The fruit activity at harvest after an acute release is also determined by growth: the
concentration of a radionuclide in fruit can increase or decrease during the growth period,
depending upon the rate of translocation relative to the growth rate. The growth effect has
been studied for radioisotopes of Cs, Sr and Ca in redcurrants, gooseberries and blueberries
[31], and for Cs in grapes [25] and in apples [24]. Due to the growth effect, a reduced yield
due to a period of drought can result in a higher concentrations of radionuclides in fruits and
vice versa, as ascertained for Cs and Sr in strawberries [36] and in grapevines [25, 33].
2.3.2 Chernobyl data
When radionuclides are introduced into an agricultural system it is often difficult to evaluate
the initial deposited activity. After Chernobyl deposition, some authors assumed the
deposition on leaves to be the same as on soil and expressed the ‘translocation coefficient’ as
the ratio between the radionuclide concentration in fruit and the total deposition to the ground
(Table 6) [38].
Other authors calculated a fruit: leaf activity ratio (Table 7) [9; 4 calculated from Ref. 39].
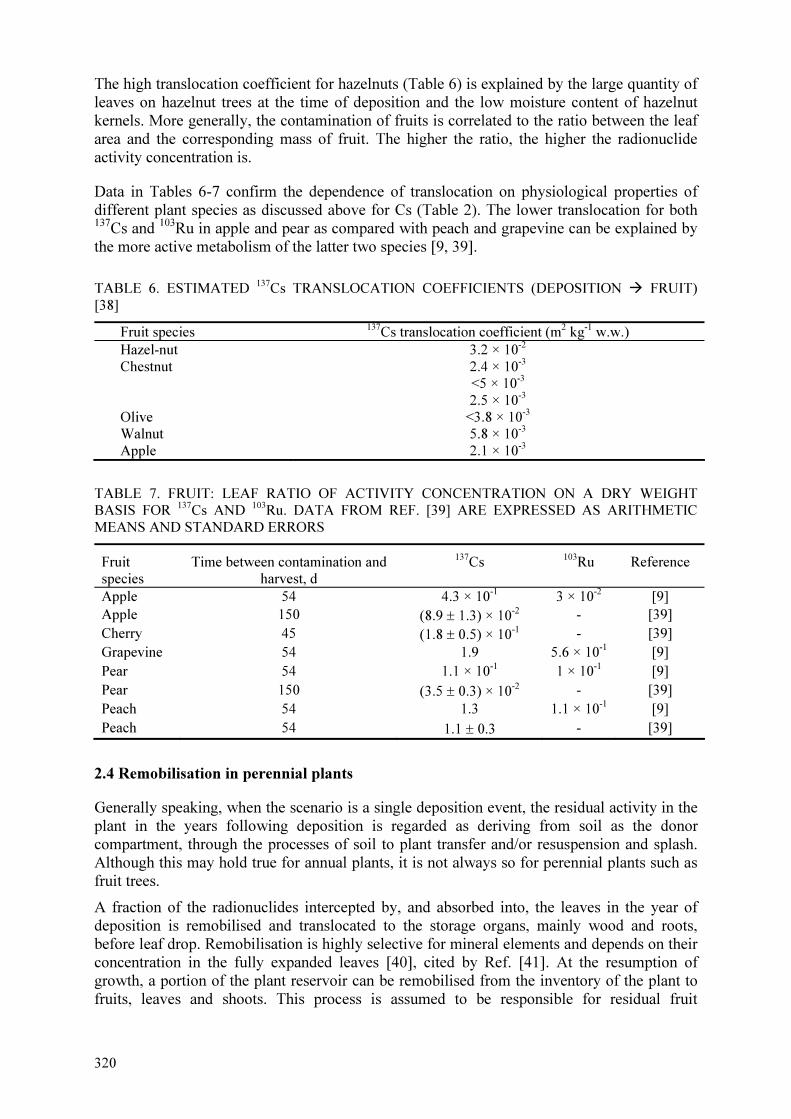
320
The high translocation coefficient for hazelnuts (Table 6) is explained by the large quantity of
leaves on hazelnut trees at the time of deposition and the low moisture content of hazelnut
kernels. More generally, the contamination of fruits is correlated to the ratio between the leaf
area and the corresponding mass of fruit. The higher the ratio, the higher the radionuclide
activity concentration is.
Data in Tables 6-7 confirm the dependence of translocation on physiological properties of
different plant species as discussed above for Cs (Table 2). The lower translocation for both 137
Cs and 103
Ru in apple and pear as compared with peach and grapevine can be explained by
the more active metabolism of the latter two species [9, 39].
TABLE 6. ESTIMATED 137
Cs TRANSLOCATION COEFFICIENTS (DEPOSITION � FRUIT)
[38]
Fruit species 137Cs translocation coefficient (m
2 kg
-1 w.w.)
Hazel-nut 3.2 × 10⁻²
Chestnut 2.4 × 10⁻³
<5 × 10⁻³
2.5 × 10⁻³
Olive <3.8 × 10⁻³
Walnut 5.8 × 10⁻³
Apple 2.1 × 10⁻³
TABLE 7. FRUIT: LEAF RATIO OF ACTIVITY CONCENTRATION ON A DRY WEIGHT BASIS FOR 137
Cs AND 103
Ru. DATA FROM REF. [39] ARE EXPRESSED AS ARITHMETIC
MEANS AND STANDARD ERRORS
Fruit species
Time between contamination and harvest, d
137Cs
103Ru Reference
Apple 54 4.3 × 10⁻¹
3 × 10⁻²
[9]
Apple 150 (8.9 ± 1.3) × 10-2 - [39]
Cherry 45 (1.8 ± 0.5) × 10-1
- [39]
Grapevine 54 1.9 5.6 × 10⁻¹
[9]
Pear 54 1.1 × 10⁻¹ 1 × 10
-1 [9]
Pear 150 (3.5 ± 0.3) × 10-2
- [39]
Peach 54 1.3 1.1 × 10⁻¹
[9]
Peach 54 1.1 ± 0.3 - [39]
2.4 Remobilisation in perennial plants
Generally speaking, when the scenario is a single deposition event, the residual activity in the
plant in the years following deposition is regarded as deriving from soil as the donor
compartment, through the processes of soil to plant transfer and/or resuspension and splash.
Although this may hold true for annual plants, it is not always so for perennial plants such as
fruit trees.
A fraction of the radionuclides intercepted by, and absorbed into, the leaves in the year of
deposition is remobilised and translocated to the storage organs, mainly wood and roots,
before leaf drop. Remobilisation is highly selective for mineral elements and depends on their
concentration in the fully expanded leaves [40], cited by Ref. [41]. At the resumption of
growth, a portion of the plant reservoir can be remobilised from the inventory of the plant to
fruits, leaves and shoots. This process is assumed to be responsible for residual fruit
321
contamination in perennial fruit trees in the first few years after contamination, a hypothesis
supported by data from various authors [9, 42-44].
Therefore, the components involved in the contamination of fruit in the years following a
single, acute deposition are both the soil reservoir and the plant reservoir. The relative
importance of these reservoirs will change with time. However, their respective contributions
have not yet been clearly defined. Nevertheless, it is known that root uptake is negligible in
the first few years after contamination, with most of the activity coming from translocation
from the sinks of aerial deposition [45]. The process of translocation of Cs from foliage to
perennial organs such as wood and bark and subsequent reallocation to the foliage has also
been investigated in various studies on evergreen forest trees (Pinus sylvestris L.)
contaminated by the Chernobyl accident [46].
3. ROOT UPTAKE
2.1 Derived transfer factor values
Data presented in this section (Tables 8-16) relate to fruit plants grown in agricultural
ecosystems of temperate regions. Data on fruits that grow in tropical and sub-tropical
environments are reported in the paper by Velasco and Juri Ayub presented in this
document11
. Data have been collected from open literature, conference proceedings,
institutional reports, books and international databases. Given the scarce information available
on the subject, the choice has been made to not reject any information. More details on the
information sources are reported in [47].
Data on root uptake are reported as Fv values related to fresh weight, because consumption
data for fruits are usually given in fresh weight:
weightsoildryBq
weightfruitfreshBqFv
=
Where Fv values have been expressed in the literature on dry weight basis they have been
converted into fresh weight according to the water content reported by the authors. In the
absence of this information, a literature value has been used12
or an average water content of
80% has been assumed, as proposed by Ref. [48].
11 See Velasco and Juri Ayub ‘Root uptake: tropical and sub-tropical environments’ in this publication. 12 See Fesenko et al. ‘Radioecological definitions, soil, plant classifications and reference ecological data for
radiological assessments’ in this publication.
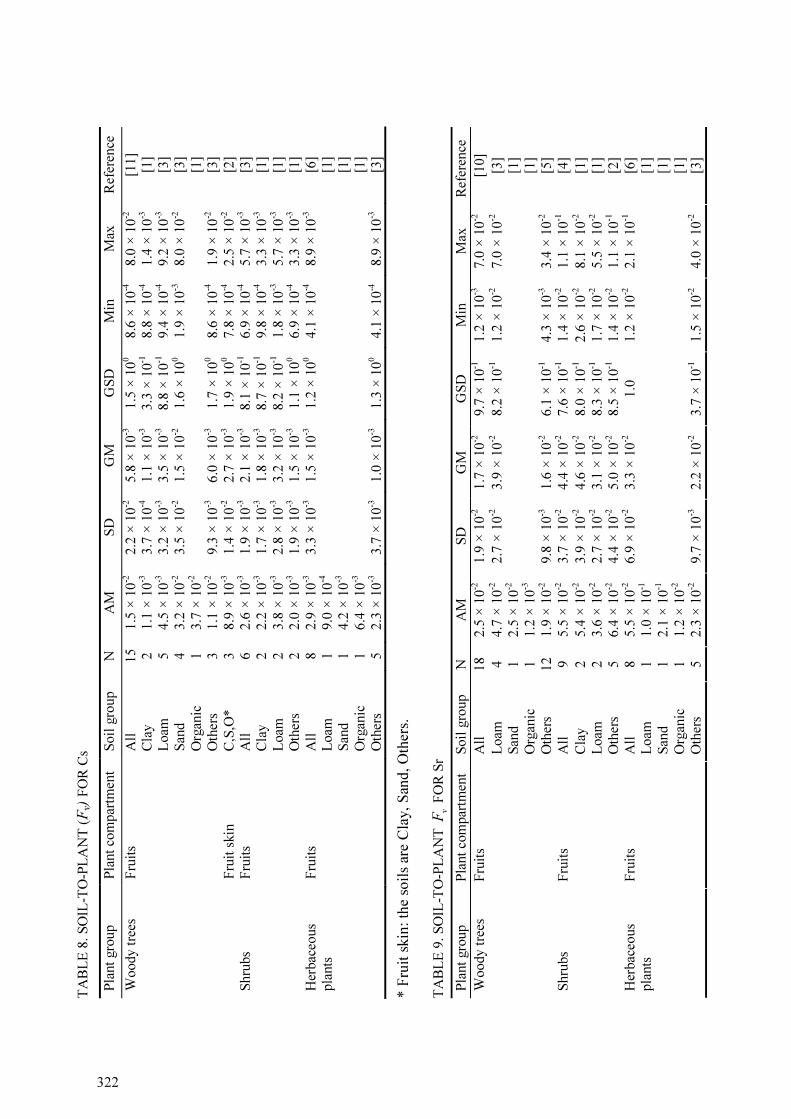
TA
BL
E 8
. S
OIL
-TO
-PL
AN
T (Fv)
FO
R C
s
Pla
nt
gro
up
Pla
nt
com
par
tmen
t S
oil
gro
up
N
AM
S
D
GM
G
SD
M
in
Max
R
efer
ence
All
15
1.5
× 1
0-2
2.2
× 1
0-2
5.8
× 1
0-3
1.5
× 1
00
8.6
× 1
0-4
8.0
× 1
0-2
[11]
Cla
y
2
1.1
× 1
0-3
3.7
× 1
0-4
1.1
× 1
0-3
3.3
× 1
0-1
8.8
× 1
0-4
1.4
× 1
0-3
[1]
Loam
5
4.5
× 1
0-3
3.2
× 1
0-3
3.5
× 1
0-3
8.8
× 1
0-1
9.4
× 1
0-4
9.2
× 1
0-3
[3]
San
d
4
3.2
× 1
0-2
3.5
× 1
0-2
1.5
× 1
0-2
1.6
× 1
00
1.9
× 1
0-3
8.0
× 1
0-2
[3]
Woody t
rees
F
ruit
s
Org
anic
1
3.7
× 1
0-2
[1
]
O
ther
s 3
1.1
× 1
0-2
9.3
× 1
0-3
6.0
× 1
0-3
1.7
× 1
00
8.6
× 1
0-4
1.9
× 1
0-2
[3]
F
ruit
skin
C
,S,O
*
3
8.9
× 1
0-3
1.4
× 1
0-2
2.7
× 1
0-3
1.9
× 1
00
7.8
× 1
0-4
2.5
× 1
0-2
[2]
All
6
2.6
× 1
0-3
1.9
× 1
0-3
2.1
× 1
0-3
8.1
× 1
0-1
6.9
× 1
0-4
5.7
× 1
0-3
[3]
Cla
y
2
2.2
× 1
0-3
1.7
× 1
0-3
1.8
× 1
0-3
8.7
× 1
0-1
9.8
× 1
0-4
3.3
× 1
0-3
[1]
Shru
bs
Fru
its
Loam
2
3.8
× 1
0-3
2.8
× 1
0-3
3.2
× 1
0-3
8.2
× 1
0-1
1.8
× 1
0-3
5.7
× 1
0-3
[1]
Oth
ers
2
2.0
× 1
0-3
1.9
× 1
0-3
1.5
× 1
0-3
1.1
× 1
00
6.9
× 1
0-4
3.3
× 1
0-3
[1]
All
8
2.9
× 1
0-3
3.3
× 1
0-3
1.5
× 1
0-3
1.2
× 1
00
4.1
× 1
0-4
8.9
× 1
0-3
[6]
Loam
1
9.0
× 1
0-4
[1
] S
and
1
4.2
× 1
0-3
[1
]
Her
bac
eous
pla
nts
F
ruit
s
Org
anic
1
6.4
× 1
0-3
[1
]
Oth
ers
5
2.3
× 1
0-3
3.7
× 1
0-3
1.0
× 1
0-3
1.3
× 1
00
4.1
× 1
0-4
8.9
× 1
0-3
[3]
* F
ruit
skin
: th
e so
ils
are
Cla
y,
San
d,
Oth
ers.
TA
BL
E 9
. S
OIL
-TO
-PL
AN
T
vF
FO
R S
r
Pla
nt
gro
up
Pla
nt
com
par
tmen
t S
oil
gro
up
N
AM
S
D
GM
G
SD
M
in
Max
R
efer
ence
All
18
2.5
× 1
0-2
1.9
× 1
0-2
1.7
× 1
0-2
9.7
× 1
0-1
1.2
× 1
0-3
7.0
× 1
0-2
[10]
Loam
4
4.7
× 1
0-2
2.7
× 1
0-2
3.9
× 1
0-2
8.2
× 1
0-1
1.2
× 1
0-2
7.0
× 1
0-2
[3]
San
d
1
2.5
× 1
0-2
[1
]
Org
anic
1
1.2
× 1
0-3
[1
]
Woody t
rees
F
ruit
s
Oth
ers
12
1.9
× 1
0-2
9.8
× 1
0-3
1.6
× 1
0-2
6.1
× 1
0-1
4.3
× 1
0-3
3.4
× 1
0-2
[5]
All
9
5.5
× 1
0-2
3.7
× 1
0-2
4.4
× 1
0-2
7.6
× 1
0-1
1.4
× 1
0-2
1.1
× 1
0-1
[4]
Cla
y
2
5.4
× 1
0-2
3.9
× 1
0-2
4.6
× 1
0-2
8.0
× 1
0-1
2.6
× 1
0-2
8.1
× 1
0-2
[1]
Loam
2
3.6
× 1
0-2
2.7
× 1
0-2
3.1
× 1
0-2
8.3
× 1
0-1
1.7
× 1
0-2
5.5
× 1
0-2
[1]
Shru
bs
Fru
its
Oth
ers
5
6.4
× 1
0-2
4.4
× 1
0-2
5.0
× 1
0-2
8.5
× 1
0-1
1.4
× 1
0-2
1.1
× 1
0-1
[2]
All
8
5.5
× 1
0-2
6.9
× 1
0-2
3.3
× 1
0-2
1.0
1.2
× 1
0-2
2.1
× 1
0-1
[6]
Loam
1
1.0
× 1
0-1
[1
]
San
d
1
2.1
× 1
0-1
[1
]
Org
anic
1
1.2
× 1
0-2
[1
]
Her
bac
eous
pla
nts
F
ruit
s
Oth
ers
5
2.3
× 1
0-2
9.7
× 1
0-3
2.2
× 1
0-2
3.7
× 1
0-1
1.5
× 1
0-2
4.0
× 1
0-2
[3]
322

TA
BL
E 1
0. S
OIL
-TO
-PL
AN
T
vF
FO
R P
u
Pla
nt
gro
up
Pla
nt
com
par
tmen
t S
oil
gro
up
N
AM
S
D
GM
G
SD
M
in
Max
R
efer
ence
All
10
2.6
× 1
0-3
6.6
× 1
0-3
1.4
× 1
0-4
2.9
× 1
00
1.3
× 1
0-6
2.1
× 1
0-2
[7]
Loam
1
8.0
× 1
0-6
[1
]
San
d
1
2.0
× 1
0-5
[1
]
Org
anic
1
1.0
× 1
0-6
[1
]
Woody t
rees
F
ruit
s
Oth
ers
7
3.7
× 1
0-3
7.7
× 1
0-3
5.5
× 1
0-4
2.2
× 1
00
2.8
× 1
0-5
2.1
× 1
0-2
[4]
Shru
bs
Fru
its
Oth
ers
2
1.7
× 1
0-4
1.5
× 1
0-4
1.3
× 1
0-4
1.0
× 1
00
6.4
× 1
0-5
2.7
× 1
0-4
[1]
All
9
2.4
× 1
0-4
3.1
× 1
0-4
1.2
× 1
0-4
1.2
× 1
00
2.7
× 1
0-5
8.3
× 1
0-4
[7]
Loam
1
8.8
× 1
0-5
[1
]
San
d
1
1.6
× 1
0-4
[1
]
Org
anic
1
7.3
× 1
0-5
[1
]
Her
bac
eous
pla
nts
Fru
its
Oth
ers
6
3.0
× 1
0-4
3.8
× 1
0-4
1.3
× 1
0-4
1.5
× 1
00
2.7
× 1
0-5
8.3
× 1
0-4
[4]
TA
BL
E 1
1. S
OIL
-TO
-PL
AN
T
vF
FO
R A
m
Pla
nt
gro
up
Pla
nt
com
par
tmen
t S
oil
gro
up
N
AM
S
D
GM
G
SD
M
in
Max
R
efer
ence
All
6
1.8
× 1
0-4
2.7
× 1
0-4
3.1
× 1
0-5
2.4
× 1
00
1.3
× 1
0-6
6.2
× 1
0-4
[5]
Loam
1
8.0
× 1
0-6
[1
]
San
d
1
1.5
× 1
0-5
[1
]
Org
anic
1
1.3
× 1
0-6
[1
]
Woody t
rees
F
ruit
ss
Oth
ers
3
3.6
× 1
0-4
3.1
× 1
0-4
1.8
× 1
0-4
1.8
× 1
00
2.2
× 1
0-5
6.2
× 1
0-4
[2]
Shru
bs
Fru
its
Oth
ers
2
1.5
× 1
0-4
1.2
× 1
0-4
1.2
× 1
0-4
8.9
× 1
0-1
6.5
× 1
0-5
2.3
× 1
0-4
[1]
All
8
1.8
× 1
0-4
2.3
× 1
0-4
1.1
× 1
0-4
1.0
× 1
00
4.1
× 1
0-5
7.2
× 1
0-4
[6]
Loam
1
7.3
× 1
0-5
[1
]
San
d
1
1.7
× 1
0-4
[1
]
Org
anic
1
6.8
× 1
0-5
[1
]
Her
bac
eous
pla
nts
Fru
its
Oth
ers
5
2.3
× 1
0-4
2.9
× 1
0-4
1.2
× 1
0-4
1.3
× 1
00
4.1
× 1
0-5
7.2
× 1
0-4
[3]
223

TA
BL
E 1
2. S
OIL
-TO
PL
AN
T
vF
FO
R I
Pla
nt
gro
up
Pla
nt
com
par
tmen
t S
oil
gro
up
NA
M
SD
G
M
GS
D
Min
M
ax
Ref
eren
ce
Woody t
rees
F
ruit
s O
ther
s 5
1.2
× 1
0-2
1.2
× 1
0-2
6.3
× 1
0-3
1.6
× 1
00
4.1
× 1
0-4
3.1
× 1
0-2
[2]
Her
bac
eous
pla
nts
Fru
its
Oth
ers
1
1.5
× 1
0-2
[1
]
TA
BL
E 1
3. S
OIL
-TO
PL
AN
T
vF
FO
R C
e
Pla
nt
gro
up
Pla
nt
com
par
tmen
t S
oil
gro
up
N
AM
S
D
GM
G
SD
M
in
Max
R
efer
ence
Woody t
rees
F
ruit
s O
ther
s 2
5.3
× 1
0-4
1.3
× 1
0-4
4.4
× 1
0-4
6.2
× 1
0-4
[1]
Her
bac
eous
pla
nts
F
ruit
s O
ther
s 1
3.0
× 1
0-4
[1
]
TA
BL
E 1
4. S
OIL
-TO
PL
AN
T
vF
FO
R C
m
Pla
nt
gro
up
Pla
nt
com
par
tmen
t S
oil
gro
up
NA
M
SD
G
M
GS
D
Min
M
ax
Ref
eren
ce
Woody t
rees
F
ruit
s O
ther
s 2
5.3
× 1
0-4
1.3
× 1
0-4
4.4
× 1
0-4
6.2
× 1
0-4
[1]
Her
bac
eous
pla
nts
F
ruit
s O
ther
s 1
3.0
× 1
0-4
[1
]
TA
BL
E 1
5. S
OIL
-TO
PL
AN
T
vF
FO
R R
u
Pla
nt
gro
up
Pla
nt
com
par
tmen
t S
oil
gro
up
NA
M
SD
G
M
GS
D
Min
M
ax
Ref
eren
ce
Woody t
rees
F
ruit
s O
ther
s 2
1.3
× 1
0-3
3.3
× 1
0-4
1.1
× 1
0-3
1.6
× 1
0-3
[1]
Her
bac
eous
pla
nts
F
ruit
s O
ther
s 1
7.4
× 1
0-4
[1
]
TA
BL
E 1
6. S
OIL
-TO
-PL
AN
T
vF
FO
R C
o, C
u, M
n, N
a
Pla
nt
gro
up
Pla
nt
com
par
tmen
t E
lem
ent
Soil
gro
up
N
AM
S
D
GM
G
SD
M
in
Max
R
efer
ence
Woody t
ree
Fru
its
Co
Loam
1
4.8
× 1
0-3
[1
]
Her
bac
eous
pla
nt
Fru
its
Cu
Oth
ers
1
6.6
× 1
0-5
[1
]
Fru
its
F
ruit
s M
n
Oth
ers
1
3.9
× 1
00
[1
]
Woody t
ree
Fru
its
Na
Loam
1
2.4
× 1
0-2
[1
]
324
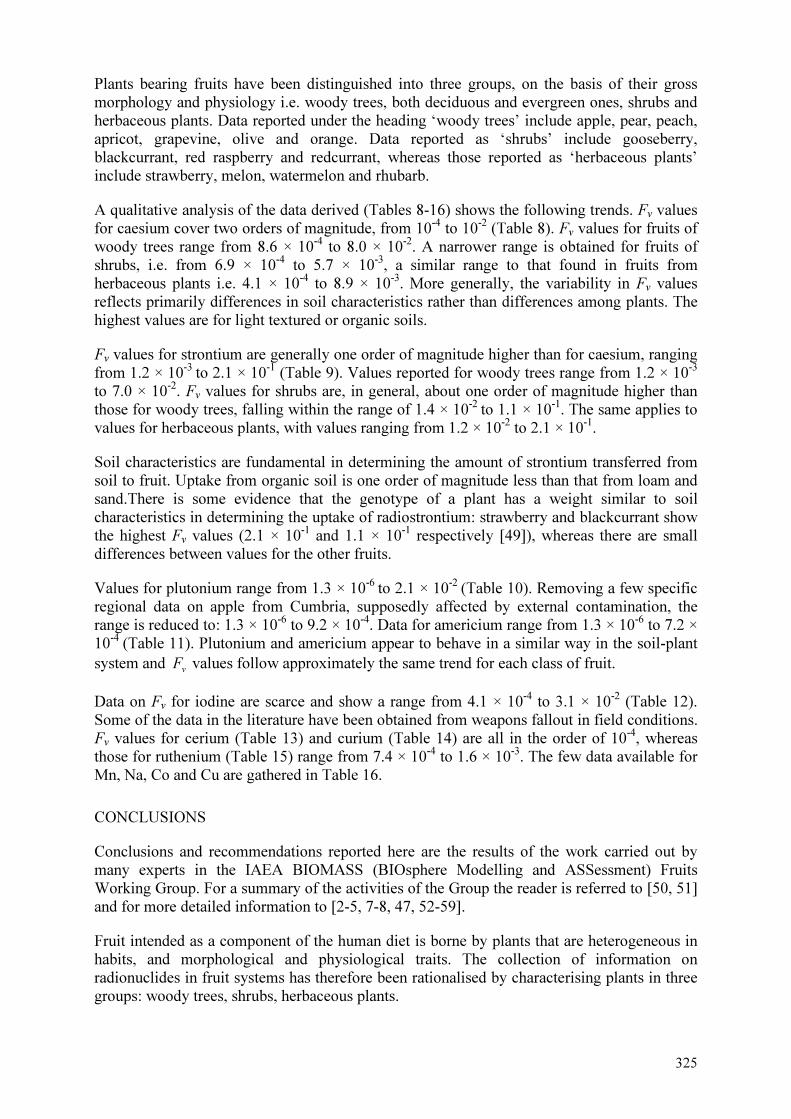
325
Plants bearing fruits have been distinguished into three groups, on the basis of their gross
morphology and physiology i.e. woody trees, both deciduous and evergreen ones, shrubs and
herbaceous plants. Data reported under the heading ‘woody trees’ include apple, pear, peach,
apricot, grapevine, olive and orange. Data reported as ‘shrubs’ include gooseberry,
blackcurrant, red raspberry and redcurrant, whereas those reported as ‘herbaceous plants’
include strawberry, melon, watermelon and rhubarb.
A qualitative analysis of the data derived (Tables 8-16) shows the following trends. Fv values
for caesium cover two orders of magnitude, from 10-4
to 10-2
(Table 8). Fv values for fruits of
woody trees range from 8.6 × 10⁻⁴
to 8.0 × 10⁻²
. A narrower range is obtained for fruits of
shrubs, i.e. from 6.9 × 10⁻⁴
to 5.7 × 10⁻³
, a similar range to that found in fruits from
herbaceous plants i.e. 4.1 × 10⁻⁴
to 8.9 × 10⁻³
. More generally, the variability in Fv values
reflects primarily differences in soil characteristics rather than differences among plants. The
highest values are for light textured or organic soils.
Fv values for strontium are generally one order of magnitude higher than for caesium, ranging
from 1.2 × 10⁻³
to 2.1 × 10⁻¹
(Table 9). Values reported for woody trees range from 1.2 × 10⁻³
to 7.0 × 10⁻²
. Fv values for shrubs are, in general, about one order of magnitude higher than
those for woody trees, falling within the range of 1.4 × 10⁻²
to 1.1 × 10⁻¹
. The same applies to
values for herbaceous plants, with values ranging from 1.2 × 10⁻²
to 2.1 × 10⁻¹
.
Soil characteristics are fundamental in determining the amount of strontium transferred from
soil to fruit. Uptake from organic soil is one order of magnitude less than that from loam and
sand.There is some evidence that the genotype of a plant has a weight similar to soil
characteristics in determining the uptake of radiostrontium: strawberry and blackcurrant show
the highest Fv values (2.1 × 10⁻¹
and 1.1 × 10⁻¹
respectively [49]), whereas there are small
differences between values for the other fruits.
Values for plutonium range from 1.3 × 10⁻⁶
to 2.1 × 10⁻²
(Table 10). Removing a few specific
regional data on apple from Cumbria, supposedly affected by external contamination, the
range is reduced to: 1.3 × 10⁻⁶
to 9.2 × 10⁻⁴
. Data for americium range from 1.3 × 10⁻⁶
to 7.2 ×
10-4
(Table 11). Plutonium and americium appear to behave in a similar way in the soil-plant
system and v
F values follow approximately the same trend for each class of fruit.
Data on Fv for iodine are scarce and show a range from 4.1 × 10⁻⁴
to 3.1 × 10⁻²
(Table 12).
Some of the data in the literature have been obtained from weapons fallout in field conditions.
Fv values for cerium (Table 13) and curium (Table 14) are all in the order of 10-4
, whereas
those for ruthenium (Table 15) range from 7.4 × 10⁻⁴
to 1.6 × 10⁻³
. The few data available for
Mn, Na, Co and Cu are gathered in Table 16.
CONCLUSIONS
Conclusions and recommendations reported here are the results of the work carried out by
many experts in the IAEA BIOMASS (BIOsphere Modelling and ASSessment) Fruits
Working Group. For a summary of the activities of the Group the reader is referred to [50, 51]
and for more detailed information to [2-5, 7-8, 47, 52-59].
Fruit intended as a component of the human diet is borne by plants that are heterogeneous in
habits, and morphological and physiological traits. The collection of information on
radionuclides in fruit systems has therefore been rationalised by characterising plants in three
groups: woody trees, shrubs, herbaceous plants.
326
Main finding from the data reported here can be summarized as follows:
• There are large differences in the degree of translocation of radionuclides from the
aboveground part to fruit of different species, depending upon physiological habits of
the plants. Differences also occur between different varieties.
• Translocation occurs to a greater extent during the time from fruit development to
beginning of ripening for those radionuclides mobile in the phloem.
• Direct deposition to fruit is connected with the phenological stage of the plant at the
time of deposition, with the extent of protection exerted by the leaves on the fruits,
and indirectly with the ability of pollutants to translocate from leaves to fruits.
• Soil-to-fruit transfer is radionuclide specific. The variability in transfer factors for a
given radionuclide is attributable primarily to the different properties of soils. For
example, the highest transfer factors for caesium are specific to peat or light textured
soils. The lowest transfer factors for strontium are specific to organic soils, such as
peat, and to soils with high calcium content. The transfer of both plutonium and
americium is lower in loam, organic and calcareous soils.
• A smaller contribution to the variability of transfer factors depends on the type of
plant. Given the paucity of data, it is difficult to determine which class or species
generally has the largest soil-to-fruit transfer of radionuclides.
• The contamination of fruits borne by woody trees in the years following the initial
deposition can occur by remobilisation of reserves from the storage organs of the tree.
However, the relative importance of the processes of transfer from soil to plant and
retranslocation from storage organs has not yet been well determined.
• Generally the activity in fruit in the years following that of deposition shows a
decrease of various orders of magnitude, depending not only on the kind of
radionuclide and the kind of plant, but also, presumably, on different human
interventions in the soil-plant system.
• Some of the information sources used in this review are for the temperate climate of
Northern Europe, a relatively minor fruit-producing area. Large quantities of fruit and
related products may be imported. It is important to take the contribution of imported
fruit into account when considering the radiation exposure of a population due to
contaminated fruit. It is also important that consideration should be given to the full
range of fruits grown in all countries; in particular, grapes, olives, citrus fruits and
bananas.
• Radionuclide concentrations in fruit depend on the yield. Low yield correlates with
high concentrations of radionuclides. The radionuclide concentration in fruit varies
with time to ripening. It may increase because of leaf-to-fruit translocation or soil-to-
fruit transfer, decrease because of growth dilution, and then increase again towards
ripening because of water loss by aging.
• The uptake and transfer of radionuclides to fruit crops are influenced by the chemical
form of the radionuclide (speciation). Current information on the effects of speciation
is limited in regard to the uptake and retention of radionuclides in fruit crops. For 14
C, 129,131
I, 3H and
35S, there is some relevant information on speciation with respect to
exposure of fruit via the atmosphere. For exposure via soil pathways there is also
some information but this is generally not relevant to current models. At present,
however, there are no published studies on the consequences of radionuclide
speciation for foliar or root uptake of radionuclides by fruit.

327
• Although the behaviour of radionuclides in fruit can be predicted from current
knowledge of the behaviour of radionuclides in other crops, there are many associated
uncertainties and much scope for validation of models and principles of interpretation
of data for fruit specifically.
There is a need to standardise the methodology of carrying out experiments on foliar uptake
and to standardise the mathematical description of the processes.
There is also a need for research on the behaviour of radionuclides in fruit crops to drive
model development, not simply to parameterise existing models. Research should focus on
understanding the key processes. Experiments undertaken to validate existing models should
be directed towards the provision of time-dependent data on the distribution of radionuclides
in fruit crops rather than to the provision of data sets comprising single end-points such as
concentration in fruit.
In particular, for modelling the transfer of radionuclides to fruit, there is a general need for
composite data sets that provide the following information: deposition/interception,
distribution in the plant-soil system, and change in distribution with time. Also, the age and
growth stage of fruit at the time of contamination is an important factor in modelling the
transfer of radionuclides to fruit.
In addition, there is a need to compile a database of growth details for important fruit. The
database should include leaf area index and herbage density over a growing season.
There are specific needs for data on shrub-type fruits and for research on the deposition and
transfer of 129
I to food crops, including fruits.
REFERENCES
[1] DESAI, B. B., SALUNKHE, D. K., “Fruits and vegetables”, Foods of Plant Origin, (SALUNKHE, D. K., DESHPANDE, S. S., Eds.) Van Nostrand Reinhold, New York (1991).
[2] MITCHELL, N. G., Models for radionuclide transfer to fruits and data requirements, Journal of Environmental Radioactivity 52 (2-3) (2001) 291.
[3] ATKINSON, C. J., WEBSTER, A. D., The influence of the development of temperate fruit tree species on the potential for their uptake of radionuclides, Journal of Environmental Radioactivity 52 (2-3) (2001) 131.
[4] CARINI, F., BENGTSSON, G., Post-deposition transport of radionuclides in fruit, Journal of Environmental Radioactivity 52 (2-3) (2001) 215.
[5] CARINI, F., GREEN, N., SPALLA, S., Radionuclides in fruit systems: a review of experimental studies, The Science of the Total Environment 359 (1-3) (2006) 188.
[6] PINDER III, J. E., ADRIANO, D. C., CIRAVOLO, T. G., DOSWELL, A. C., YEHLING, D. M., The interception and retention of 238Pu deposition by orange trees, Health Physics 52 (6) (1987) 707.
[7] STEWART, A., BRUDENELL, A., COLLINS, C. D., Deposition of gaseous radionuclides to fruit, Journal of Environmental Radioactivity 52 (2-3) (2001) 175.
[8] KINNERSLEY, R. P., SCOTT, L. K., Aerial contamination of fruit through wet deposition and particulate dry deposition, Journal of Environmental Radioactivity 52 (2-3) (2001) 191.
[9] BALDINI, E., BETTOLI, M. G., TUBERTINI, O., Effects of the Chernobyl pollution on some fruit trees, Advances in Horticultural Science 1 (2) (1987) 77.
[10] GEORGIADIS, T., ROSSI, F., NEROZZI, F., Inferring ozone deposition on agricultural surfaces: an application to herbaceous and tree canopies. Water, Air and Soil Pollution 84 (1995) 117.
328
[11] STEWART, A., The deposition of 14C, 35S and 3H to Fruit Crops, PhD Thesis, Department of Environmental Science and Technology, Imperial College, London (2002).
[12] ZEIDE, B., Primary unit of the tree crown, Ecology 74 (5) (1993)1598. [13] KINNERSLEY, R. P., GODDARD, A. J. H., MINSKI, M. J., SHAW, G., Interception of
caesium-contaminated rain by vegetation, Atmospheric Environment 31 (1997) 1137. [14] PALMER, J. W., JACKSON, J. E., Seasonal light interception and canopy development in
hedgerow and bed system apple orchards, Journal of Applied Ecology 14 (1977) 539. [15] PALMER, J. W., The effects of row orientation, tree height, time of year and latitude on light
interception and distribution in model apple hedgerow canopies, Journal of Horticultural Science 64 (1987) 137.
[16] PALMER, J. W., Annual dry matter production and partitioning over the first five years of a bed system of Crispin/M.27 apple trees at four spacings. J. of Applied Ecology 25 (1988) 569.
[17] RUSSEL, R. S., An introductory review: Interception and retention of airborne material on plants, Health Physics 11 (1965) 1305.
[18] KATANA, H., BUNNENBERG, C., KUHN, W., “Studies on the translocation of 134Cs from leaves to fruit of apple trees”, In IV symposium international de radioecologie de Cadarache: Impact des accidents d'origine nucleaire sur l'environment, vol. 2. DERS-SERE, Cadarache, France, (1988) E-72.
[19] SWIETLIK, D., FAUST, M., Foliar nutrition of fruit crops, Horticultural Reviews 6 (1984) 299. [20] SCHÖNHERR, J., HUBER, R., Plant cuticles are polyelectrolytes with isoelectric points around
three, Plant Physiology 59 (1977) 145. [21] HAILE-MARIAM, S. N., WITTWER, S. H., Comparative permeability of Na, K, Rb and Cs
ions through isolated cuticolar membranes of Eunymus japonicus, Plant Physiology (Supplement) 40 (1965) 12.
[22] WITTWER, S. H., JYUNG, W. H., YAMADA, Y., BUKOVAC, M. J., KANNAN, R., RASMUSSEN, H. P., HAILE-MARIAM, S. N., “Pathway and mechanism for foliar absorption of mineral nutrients as revealed by radioisotopes”. In: Isotopes and radiation in soil-plant nutrition studies, Proceedings of Symposium IAEA-FAO, Vienna. (1965) 387.
[23] MCFARLANE, J. C., BERRY, W. L., Cation penetration through isolated leaf cuticles, Plant Physiology, 53, (1974) 723.
[24] BENGTSSON, G. B., Mobility of superficially applied caesium-134 and strontium-85 in apple branches under precipitation-free conditions, Analyst 117 (1992) 1193.
[25] ZEHNDER, H. J., KOPP, P., EIKENBERG, J, FELLER, U., OERTLI, J. J., Uptake and transport of radioactive caesium and strontium into grapevines after leaf contamination, Radiation Physics and Chemistry, 46(1) (1995) 61.
[26] ZEHNDER, H. J., KOPP, P., OERTLI, J. J., FELLER, U., Uptake and transport of radioactive caesium and strontium into strawberries after leaf contamination, Gartenbauwissenschaft 58 (5) (1993) 209.
[27] MADOZ-ESCANDE, C., COLLE, C., BRECHIGNAC, F., JOUGLET, H., FERNANDEZ, V., Time dependent evolution of 137Cs and 90Sr deposited as aerosols on vine, 8th Annual Meeting of SETAC-Europe, Bordeaux, 14-18 April (1998).
[28] DELMAS, J., DISDIER, R., GRAUBY, A., BOVARD, P., Radiocontamination experimentale de quelque especes cultivees soumises a l'rrigation par aspersion. In Symposium international de radioecologie, Cadarache, France (1969) 707.
[29] DELMAS, J., GRAUBY, A., DISDIER, R., “Etudes experimentales sur le trasfert dans les cultures de quelques radionucleides presents dans les effluents des centrales electro-nucleaires”, Proc. Environmental Behaviour of Radionuclides Released in the Nuclear Industry, IAEA, Vienna (1973) 321.
[30] CARINI, F., Radionuclides in plants bearing fruit: an overview, Journal of Environmental Radioactivity 46 (1999) 77.
[31] KOPP, P., GÖRLICH, W., BURKART, W., ZEHNDER, H. J., “Foliar uptake of radionuclides and their distribution in the plant”, Proceedings of environmental contamination following a major nuclear accident, IAEA, Vienna, vol. 2 (1990) 37.
[32] CARINI, F., MONTRUCCOLI, M., ANGUISSOLA SCOTTI, I., SILVA, S., “Uso della defoliazione non letale per ridurre la traslocazione di radiocesio all'uva ed al vino”, S.IT.E., Atti 16 (1995) 547.

329
[33] CARINI, F., ANGUISSOLA SCOTTI, I., MONTRUCCOLI, M., SILVA, S., “134Cs foliar contamination of vine: translocation to grapes and transfer to wine”, Proceedings of the international symposium on radioecology ten years terrestrial radioecological research following the Chernobyl accident, (GERZABEK M., Ed) Vienna, Austria (1996) 163.
[34] CARINI, F., LOMBI, E., Foliar and soil uptake of 134Cs and 85Sr by grape vines, Science of the Total Environment 207 (1997) 157.
[35] DELMAS, J., BOVARD, P., GRAUBY, A., DISDIER, R., BLONDEL, L., GUENNELON, R., “Contamination directe experimentale de l'oranger par le Sr-90 et Cs-137”. In: International symposium on radioecology applied to the protection of man and his environment, (COPPE A. Ed.) Commission of the European Communities, Rome, Italy, September 7-10 (1971) 1081.
[36] CARINI, F., BRAMBILLA, M., OULD-DADA, Z., MITCHELL, N. G., 134Cs and 85Sr in strawberry plants following wet aerial deposition, Journal of Environmental Quality 32 (2003) 2254.
[37] MADOZ-ESCANDE, C., COLLE, C., ADAM, C., Evolution of caesium and strontium contamination deposited on vines. Radioprotection – Colloques 37 (2002) C1-515.
[38] MONTE, L., QUAGGIA, S., POMPEI, F., FRATARCANGELI, S., The behaviour of 137Cs in some edible fruits, Journal of Environmental Radioactivity 11 (1990) 207.
[39] ANGUISSOLA SCOTTI, I., SILVA, S., Foliar absorption and leaf-fruit transfer of 137Cs in fruit trees, Journal of Environmental Radioactivity 16 (1992) 97.
[40] LONERAGAN, J. F., SNOWBALL, K., ROBSON, A. D., “Remobilization of nutrients and its significance in plant nutrition”, In: Transport and Transfer Process in Plants, (WARDLAW, I F, PASSIOURA, J B, Eds.) Academic Press, London (1976) 463–469.
[41] MARSCHNER, H., Mineral nutrition in higher plants, second edition, Academic Press, London (1995).
[42] ANTONOPOULOS-DOMIS, M., CLOUVAS, A., TERVISIDIS, F., GAGIANAS, A., “A correlation study between radiocaesium deposition and contamination in a variety of Mediterranean agricultural products”, Environmental Radioactivity in the Mediterranean area, Proc. of an International Conference organized by the Spanish Nuclear Society and cosponsored by the European Nuclear Society, Barcelona (1988) 503.
[43] ANTONOPOULOS-DOMIS, M., CLOUVAS, A., GAGIANAS, A., Compartment model for long-term contamination prediction in deciduous fruit trees after a nuclear accident, Health Physics 58 (6) (1990) 737.
[44] FRISSEL, M. J., “A report of the IAEA-IUR joint project Transfer of radionuclides from air, soil, and freshwater to the foodchain of man in tropical and subtropical environments”, Proc. of the XXVII annual meeting of ESNA, WG 3, (GERZABEK, M H, Ed.), Vienna (1997) 189.
[45] ANTONOPOULOS-DOMIS, M., CLOUVAS, A., GAGIANAS, A., Radiocaesium dynamics in fruit trees following the Chernobyl accident, Health Physics 61 (6) (1991) 837.
[46] GOOR, F., THIRY, Y., Processes, dynamics and modelling of radiocaesium cycling in a chronosequence of Chernobyl-contaminated Scots pine (Pinus sylvestris L.) plantations, Science of the Total Environment 325 (2004) 163.
[47] CARINI, F., Radionuclide transfer from soil to fruit, Journal of Environmental Radioactivity 52 (2-3) (2001) 237.
[48] MAYALL, A., “FARMLAND: transfer of radionuclides to fruit”, Rep. NRPB-M545, National Radiological Protection Board, Didcot (1995).
[49] GREEN, N., WILKINS, B. T., HAMMOND, D. J., Transfer of radionuclides to fruit, Journal of Radioanalytical and Nuclear Chemistry 226 (1-2) (1997) 195.
[50] CARINI, F., ATKINSON, C. J., COLLINS, C., COUGHTREY, P. J., EGED, K., FULKER, M, GREEN, N., KINNERSLEY, R., LINKOV, I., MITCHELL, N. G., MOURLON, C., OULD-DADA, Z., QUINAULT, J. M., ROBLES, B., STEWART, A., SWEECK, L., VENTER, A., Modelling and experimental studies on the transfer of radionuclides to fruit, Journal of Environmental Radioactivity 84 (2) (2005) 271.
[51] INTERNATIONAL ATOMIC ENERGY AGENCY, Modelling the Transfer of Radionuclides to Fruit, “Report of the Fruits Working Group of BIOMASS Theme 3, BIOsphere Modelling and ASSessment Programme, IAEA-BIOMASS-5” Vienna (2003).
[52] CARINI, F., COUGHTREY, P. J., KINNERSLEY, R. P., Introduction, Journal of Environmental Radioactivity 52 (2-3) (2001) 123.
330
[53] COUGHTREY, P. J., CARINI, F., VENTER, A., Conclusions and recommendations, Journal of Environmental Radioactivity 52 (2-3) (2001) 309.
[54] VENTER, A., COUGHTREY, P. J., CARINI, F., INOUE, Y., Foreword, Journal of Environmental Radioactivity 52 (2-3) (2001) 117.
[55] FULKER, M. J., The role of fruit in the diet, Journal of Environmental Radioactivity 52 (2-3) (2001) 147.
[56] OULD-DADA, Z., FAIRLIE, I., READ, C., Transfer of radioactivity to fruit: significant radionuclides and speciation, Journal of Environmental Radioactivity 52 (2-3) (2001) 159.
[57] GREEN, N., The effect of storage and processing on radionuclide content of fruit, Journal of Environmental Radioactivity 52 (2-3) (2001) 281.
[58] LINKOV, I., CARINI, F., COLLINS, C., EGED, K., MITCHELL, N. G., MOURLON, C., OULD-DADA, Z., ROBLES, B., SWEECK, L., VENTER, A., Radionuclides in fruit systems: model-model intercomparison study, Science of the Total Environment 364 (2-3) (2006) 124.
[59] OULD-DADA, Z., CARINI, F., EGED, K., KIS, Z., LINKOV, I., MITCHELL, N. G., MOURLON, C., ROBLES, B., SWEECK, L., VENTER, A., Radionuclides in fruit systems: model prediction-experimental data intercomparison study, Science of the Total Environment 366 (2-3) (2006) 514.

NATURAL AND SEMI NATURAL ECOSYSTEMS

333
RADIONUCLIDE TRANSFER IN FOREST ECOSYSTEMS
P. CALMON
Institut de Radioprotection et de Sûreté Nucléaire (IRSN), Centre de Cadarache,
Saint Paul-lez-Durance, France
Y. THIRY
Belgium Nuclear Research Centre (SCK•CEN ), Mol, Belgium
G. ZIBOLD
Hochschule Ravensburg-Weingarten, Germany
A. RANTAVAARA
Radiation and Nuclear Safety Authority (STUK), Finland
S FESENKO
International Atomic Energy Agency, Vienna
O. ORLOV
Polisky Branch of Ukrainian Scientific Research Institute
of Forestry and Agro-Forest Amelioration, Zhytomyr, Ukraine
Abstract
The behaviour of radionuclides in forest ecosystems differs substantially from the other ecosystems. The contamination of
various forest products is commonly quantified using the Aggregated Transfer Factor (Tag in m2 kg-1) which integrates
various environmental parameters including soil and plant type, root distribution as well as nature and vertical distribution of
the deposits. This review aims at compiling the most relevant quantitative information on radionuclide transfers to forest
biota including trees, understorey vegetation, mushrooms, berries and game animals. For both radiocaesium and
radiostrontium in trees, the order of magnitude of mean Tag values is 10-3 m2.kg-1(dry weight). The transfer of radionuclides
to mushrooms and berries is high, in comparison with foodstuffs grown in agricultural systems. Concerning caesium uptake
by mushrooms, the transfer is characterized by a very large variability of Tag, from 10-3 to 101 m2.kg-1(dry weight). For
berries, typical values are around 0.01 to 0.1 m2.kg-1 (dry weight). Transfer of radioactive caesium to game animals and
reindeer and the rate of activity reduction, quantified as an ecological half-life, reflect the soil and pasture conditions at
individual locations. Even if, the importance of radioactive contamination of forests as a significant source of the population
exposure is recognized, most of the data refer to caesium and to a lesser extent, strontium. Data for other radionuclides are
rather limited.
1. INTRODUCTION
The behaviour of radionuclides in forest ecosystems has to be given specific consideration
because such ecosystems differ substantially in radionuclide biogeochemistry and exposure
pathways from the agricultural ecosystems that are more generally considered in assessments.
In particular, radionuclides can be efficiently trapped and recycled in forests, implying long
residence times and the potential for enhanced external and internal exposures over timescales
of decades to centuries.
The importance of radioactive contamination of forests as a significant source of the
population exposure was recognized after at least two major radiation accidents–the Kyshtym
accident, Ural, USSR (now Russian Federation), in 1957 and the Chernobyl accident, USSR
(now Ukraine), in 1986. A substantial amount of the recent research on radionuclide
behaviour in semi-natural ecosystems has been undertaken in those contexts. While the
Chernobyl signal was mainly 137
Cs and that of Kyshtym, 90
Sr, other local ecological insults
have been the source of forest contamination by other radionuclides (e.g. 239,240
Pu, 99
Tc) but
334
the database on parameters that can be used for the modelling of contaminated forests is, as
yet, substantially incomplete. In particular, most of the data that are available relate to the
behaviour of radioisotopes of caesium and of strontium to a lesser extent, and this is reflected
in the emphasis of the material presented below. However, the more limited information on
radioisotopes of other elements is also discussed, as appropriate.
2. TRANSFER TO TREES
2.1. Processes and dynamics of tree contamination
In addition to the forest zone contaminated following the Kyshtym accident, the vast extent of
semi-natural areas affected by the Chernobyl deposits and the corresponding radiological
impact on various local populations has initiated a new interest in forest radioecology. In the
two last decades in particular, numerous studies of radiocaesium and radiostrontium transfers
have been conducted in a wide range of forest types located at various sites in the CIS and in
Western Europe. This extensive set of research activities has led to the accumulation of a
considerable amount of new data and increased understanding of processes of relevance.
Following deposition of atmospheric radioactive fallout, the primary source of tree
contamination is direct dry or wet interception of aerosol-derived radionuclides by the
canopy, followed by further translocation from foliar surfaces to structural components of the
tree. Further changes in tree contamination after the initial fallout are due to two main
processes. The first of these is a dominant self-decontamination process of the tree canopy,
affected by weathering of intercepted radioactive material, through fall and litter fall. These
processes are followed by or accompanied by root uptake which is the predominant route of
contamination over the longer term. In terms of dynamics of contamination of the system, two
stages can be distinguished: 1. the "early’ phase lasting 4-5 years and characterized by a rapid
redistribution of the initial deposits between the soil and the trees, 2. a ‘steady state’ phase
characterized by slow changes in biological availability, with root uptake determining the
degree of contamination of the trees.
2.1.1 The early phase
Because of high biomass density of forest canopy, interception of atmospheric radioactive
fallout by the forest cover may be very efficient as well but depends on a great number of
local factors: vegetation biomass per unit area, plant surface nature, radioactive particle
dispersion, meteorological conditions. A summary of the information on radionuclide
interception by forest canopies from the research performed before the Chernobyl accident is
given in Table 1. Subsequent to the interception of radioactivity, variations in the intensity of
tree crown self clearing may be large; the main influencing factors are as follows: species
composition, age, physiological state and density of stocking, as well as the season when
radioactive fallout happens. The ecological half life of clearing after the deposition event and
in the course of active growth of trees varies from 3–4 weeks to 3 months depending on the
type and age of trees. In the phase of physiological dormancy (autumn and winter), the half-
life is 4–6 months [2].
As illustrated in Figure 1, 90
Sr concentrations in crowns of deciduous forests can decrease to
several per cent of the total amount present in the forest within a year after a single deposition
event. In coniferous forests, the process of crown self-clearing is much slower; it may take 3–
4 years [1].

335
TABLE 1. INTERCEPTION FRACTIONS FOR DIFFERENT TYPES OF FORESTS [1].
Forest type Deposition type Interception, % Pine forest, age 6-10 years
Artificial injection of 89Sr in a water-soluble form into the crowns of trees
90-100
Pine forest, age 60 years Deposition of radioactive particles with the size less than 50 µm
80-100
Pine forest, age 25 years Deposition of radioactive particles with the size less than 100 µm
70-90
Pine forest, age 30 years Deposition of resuspended radioactive particles.
40-60
Birch forest, age 40 years, winter period
Deposition of resuspended radioactive particles.
20-25
Birch forest, age 35-40 years, summer period
Global fallout 20-60
Pine forest, age 50-60 years Global fallout 50-90 Tropical rain forest Global fallout 100
0 1 2 3 4 5
Time after deposition, years
0
40
80
120
Co
nte
nt
of
90S
r o
n t
ree c
row
ns, %
of
init
ial d
ep
osit
ion
- Pine forest
- Birch forest
FIG. 1. Self-clearing of overground part of tree layers of pine and birch phytocenoses after a single artificial introduction of 90Sr in a water-soluble form into the crowns late in summer [1].
Over the first few days of radioactive discharges from the Chernobyl NPP, about 70–80% of
all the radioactive fallout was retained by the aboveground parts of trees. Over this period,
coniferous trees trapped radioactivity 2–3 times as effectively as did deciduous forests and 7–
10 times more than other types of natural cenoses (meadow, mire) [3].
The size and solubility of the Chernobyl fallout particles were the foremost factors
influencing the initial distribution of Cs between tree components. The acute phase lasting 4-5
years was further a period of great differences in Cs recycling in the system as a function of
the distance from the accident. In the near zone (< 30 km), characterized by greater particle
size in the deposits, limited initial contamination of pine trees was associated with rapid
wash-off of the intercepted contamination followed by a progressive increase in root uptake
and tree contamination due to the solubilisation of the particles in the soil. In the remote zone
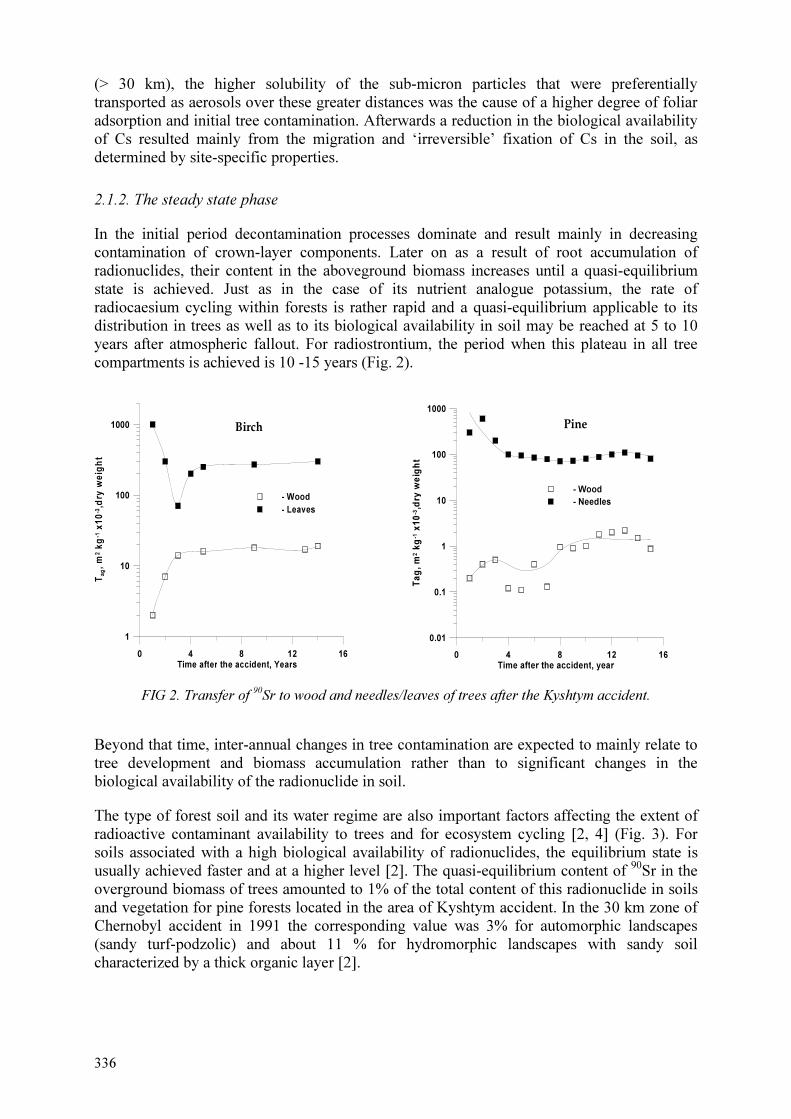
336
(> 30 km), the higher solubility of the sub-micron particles that were preferentially
transported as aerosols over these greater distances was the cause of a higher degree of foliar
adsorption and initial tree contamination. Afterwards a reduction in the biological availability
of Cs resulted mainly from the migration and ‘irreversible’ fixation of Cs in the soil, as
determined by site-specific properties.
2.1.2. The steady state phase
In the initial period decontamination processes dominate and result mainly in decreasing
contamination of crown-layer components. Later on as a result of root accumulation of
radionuclides, their content in the aboveground biomass increases until a quasi-equilibrium
state is achieved. Just as in the case of its nutrient analogue potassium, the rate of
radiocaesium cycling within forests is rather rapid and a quasi-equilibrium applicable to its
distribution in trees as well as to its biological availability in soil may be reached at 5 to 10
years after atmospheric fallout. For radiostrontium, the period when this plateau in all tree
compartments is achieved is 10 -15 years (Fig. 2).
0 4 8 12 16
Time after the accident, Years
1
10
100
1000
Tag,
m2 k
g-1
x1
0-3
,dry
we
igh
t
- Wood
- Leaves
Birch
0 4 8 12 16Time after the accident, year
0.01
0.1
1
10
100
1000T
ag
, m
2 k
g-1
x1
0-3,d
ry w
eig
ht
- Wood
- Needles
Pine
FIG 2. Transfer of 90
Sr to wood and needles/leaves of trees after the Kyshtym accident.
Beyond that time, inter-annual changes in tree contamination are expected to mainly relate to
tree development and biomass accumulation rather than to significant changes in the
biological availability of the radionuclide in soil.
The type of forest soil and its water regime are also important factors affecting the extent of
radioactive contaminant availability to trees and for ecosystem cycling [2, 4] (Fig. 3). For
soils associated with a high biological availability of radionuclides, the equilibrium state is
usually achieved faster and at a higher level [2]. The quasi-equilibrium content of 90
Sr in the
overground biomass of trees amounted to 1% of the total content of this radionuclide in soils
and vegetation for pine forests located in the area of Kyshtym accident. In the 30 km zone of
Chernobyl accident in 1991 the corresponding value was 3% for automorphic landscapes
(sandy turf-podzolic) and about 11 % for hydromorphic landscapes with sandy soil
characterized by a thick organic layer [2].

337
0 2 4 6 8Time after the Chernobyl Accident, years
0
0.02
0.04
0.06
Ta
g, m
2 k
g-1
dry
weig
ht
Peaty soil (Hydromorphic)
Soddy podzolic soil (Automorphic)
FIG. 3. Transfer of 137
Cs to pine wood on soils with contrasting properties
2.2 Long term effect of ecological factors on aggregated transfer factor
In the long term, the soil is the dominant radionuclide reservoir in forest systems and root
uptake governs further accumulation in standing biomass at a rate that depends on a
combination of several abiotic and biotic factors like soil type, moisture regime, stand
composition, stand age and tree species. A tentative hierarchy of the mentioned environmental
factors was proposed by [4] based on their respective significance on the potential variability
in the average radiocaesium accumulation by trees (Table 2). The indicative significance of
each factor is illustrated in Table 2 by a ‘variability’ index which reflects the possible
magnitude of observed differences in tree contamination between two sites due to one specific
factor) [4].
TABLE 2. ENVIRONMENTAL FACTORS GOVERNING THE EXTENT OF TREE CONTAMINATION BY RADIOCAESIUM
Influencing factors Index Examples of ag
T hierarchy for trees
Soil type 100
(10-200)
peat-gley > peat-podzolic > soddy-podzolic > podzolized chernozems
Moisture regime 10
(3-70)
central depression > terrace basement > terrace slope > slope upper part > watershed top
Stand composition 4
(5-10)
Monospecific coniferous stand > mixed coniferous-deciduous forest
Stand age 4
(3-8)
0-30 > 30-60 > 60-90 > +90
Tree species 2
(2-3)
aspen > oak > birch > pine > lime > spruce

338
Since certain combinations of influential properties of the forest system (soil and humus type,
soil profile development, vegetation association, moisture regime) are inherent to a limited
number of forest eco-types, a preliminary basic ecological classification of forest ecosystems
can also contribute to the minimization of the variability of ag
T coefficients for trees in those
particular forest systems.
Examples given by [4] and [5] are shown in Tables 3 and 4, respectively, while additional
information on the relationship between the degrees of contamination of different tree organs
can be extracted from the same tables.
TABLE 3. IMPACT OF MOISTURE CONDITIONS ON VARIATIONS IN RADIOCAESIUM
AGGREGATED TRANSFER FACTORS (Tag in 10-3
m2 kg
-1, DW) TO FOREST TREES.
Assimilative organs Tree species
Moisture conditions
One-year-old needles (leaves)
Two-year-old needles
One-year-old shoots
Stem bark Wood
Pine Automorphic 9.8 4.1 1.1 × 101
7.8 3.2 × 10⁻¹
Semi-
hydromorphic
3.8 × 101 1.4 × 10
1 3.2 × 10
1- 1.2
Birch Automorphic 1.6 - 2.2 6.5 3.5 × 10⁻¹
Semi-
hydromorphic
3.6 × 101 - 3.2 × 10
1- 1.4
Aspen Automorphic - - - - 4.8 × 10⁻¹
Semi-hydromorphic
7.5 - 7.8 1.0 × 101 1.7
Alder Not specified 7.7 - 7.2 1.2 × 101 1.4
Oak Not specified 8.4 - 8.8 1.6 × 101 2.3
TABLE 4. VARIATIONS IN RADIOCAESIUM AGGREGATED TRANSFER FACTORS (Tag in
10-3
m2 kg
-1, DW) TO DIFFERENT PINE AND BIRCH COMPARTMENTS (REPRODUCED
FROM [8.5])
Eco-type Tree organs
Wood Bark Branches Foliage
Inner Outer Large Small Current/older
Pine
Automorphic 7 × 10⁻²
5.6 × 10⁻¹
1.1 2.6 × 10⁻¹
4 × 10⁻¹
1.1 × 100/1.7 × 10
-1
Hydromorphic 4.0 4.4 × 101 1.1 × 10
1 8.0 1.8 × 10
1 4.9 10
1/1.5 × 10
1
Birch
Automorphic 1.1 ×10⁻¹
3.8 × 10⁻¹
6.0 9.5 × 10⁻¹
1.5 1.7
Hydromorphic 7.4 2.3 × 101 8.5 1.0 × 10
1 3.4 × 10
1 6.7 × 10
1

339
2.3 Radiocaesium and radiostrontium transfer to foliage and stem wood of forest trees
It is of relevance to define those components and tissues that can be considered most
representative of radionuclide accumulation in trees. For radiocaesium, the best indicative
organs are usually the most physiologically active ones such as leaves or 1 year-old needles,
since they show the best correlation with radiocaesium concentrations in the other
components.
Stem wood, which is the largest pool of aboveground tree biomass, was identified in many
situations as the main long-term reservoir for radiocaesium in forest vegetation. Table 5 make
a list of the Tag values for 137
Cs in foliage and wood as recorded in different ecological
conditions for various ages and species of trees, while Table 6 similarly presents Tag values
across some contaminated regions for 90
Sr.
It can be seen from Tables 2-6 [6-21] that deciduous trees are characterised by a higher
absorption of 90
Sr and 137
Cs than are coniferous ones [21]. Among the woody plants the
maximum transfer factors were observed in aspen both in areas close to and far from the
Chernobyl accident. This agrees with a high demand of aspen for potassium as compared with
other species of woody plants. Because of higher nutrient demand, higher concentrations of 137
Cs are also usually observed in organs of young plants as compared with those of middle-
aged and mature trees [1, 4]. Most analyses of radionuclide distributions in trees show that
they are accumulated to the greatest extent in roots [1]. The exception is 90
Sr, which actively
moves from roots into the over-ground parts of trees and is accumulated predominantly in
vegetative parts of forest herbaceous and woody plants [21].
TABLE 5. RADIOCAESIUM AGGREGATED TRANSFER FACTORS (Tag in 10-3
m2 kg
-1, DW) TO
FOREST TREES, MEASURED IN APPARENT STEADY STATE CONDITIONS [6]
Site Species Age(y) Soil type ag
T (10-3
m2 kg
-1, DW)
Wood Needles/Leaves
Current Old
Lady Wood (UK) Spruce 40 Juvenile iron pan podzol
2.8 × 10⁻¹
5.7 × 10⁻¹
Clogheen Wood (Ireland)
Pine 60 Peaty podzol on sandstone
1.4 2.1 × 101
Shanrahan Wood
(Ireland)
Pine 50 Peaty podzol on
sandstone
3.2 × 10⁻¹
1.0 × 101
Ballyporeen 1976
(Ireland)
Pine 33 Peaty podzol on
sandstone
1.4 5.1
Ballyporeen 1965
(Ireland)
Pine 22 Peaty podzol on
sandstone
2.3 5.2
Roundwood (Ireland)
Spruce 40 Peaty podzol on schist
9.3 × 10⁻¹
5.0
Tarvisio (Italy)
Spruce 60-100 Brown earth on calcareous moraine
1.7 9.1
Novaggio (Switzerland)
Oak na Crypto podzol 3.8 12
Weinsberger
(Austria)
Beech na Dystric cambisol 1.3 2.3
Kobermausser
(Austria)
Spruce 60-70 Dystric cambisol 2.1 1.7 × 101
Kobermausser (Austria)
Beech na Dystric cambisol 1.6 2.7

340
TABLE 5. RADIOCAESIUM AGGREGATED TRANSFER FACTORS (Tag in 10-3
m2 kg
-1, DW) TO
FOREST TREES, MEASURED IN APPARENT STEADY STATE CONDITIONS (Cont.)
agT (10-3 m2 kg-1, DW)
Wood Needles/Leaves Site Species Age(y) Soil type
Current Old
Refer.
Bryansk
(Russian
Federation)
Pine 11-50 Soddy-podzolic
loamy sand
(automorphic)
5.9 × 10⁻¹ 1.9 × 101 4.3
(2-3 y)a
[7]
Bryansk
(Russian
Federation)
Pine 45-55 Humic podzolic
gley loamy sand
(semi-
hydromorphic)
5.6 × 10⁻¹ 1.9 × 101 3.6
(2-3 y)
[7]
Bryansk
(Russian
Federation)
Pine 10-30 Humic-peat
(hydromorphic)
5.2 6.4 × 101 6.4
(2-3 y)
[7]
Bryansk
(Russian
Federation)
Birch 8-40 Humic podzolic
gley loamy sand
(semi-
hydromorphic)
9.0 × 10⁻¹ 3.0 × 101 [7]
Bryansk
(Russian
Federation)
Birch 30-40 Soddy-podzolic
loamy sand
(automorphic)
2.4 × 10⁻¹ 2.8 [7]
Zaborie
(Russian
Federation)
Pine 45 Sandy 1.95
(1m)b
1.9 × 101 4.2
(3 y)
[8]
Zaborie
(Russian
Federation) Pine 10
Sandy
(deep ploughing)
1.1 x 10⁻¹
(1m) 1.7 - [8]
Novo
Bobovichi
(Russian
Federation) Pine 21 Sandy
7.5 x 10⁻¹
(1m) 1.1 2.4 × 10⁻¹ [8]
Guta
Muravinka
(Russian
Federation) Oak 13 Sandy
1.53
(1m)
1.1 × 101 [8]
Mol
(Belgium) Willow 1
Orthic podzol
(sandy) 2.4 × 10⁻² - [9]
Mol
(Belgium) Willow 1
Orthic luvisol
(loamy) 1.0 × 10⁻² - [9]
Vetka
(Belarus) Pine 17
Dystric cambisol
(sandy) 3.5 2.5 × 101 1.1 × 101 [10]
Vetka
(Belarus) Pine 37
Dystric cambisol
(sandy) 1.6 1.0 × 101 4.1 [10]
Vetka
(Belarus) Pine 57
Dystric cambisol
(sandy) 2.0 1.2 × 101 5.0 [10]
Belarus
polesye Pine 0-20
Soddy podzolic
soil (sandy)
3.46± 1.03c
- - [4]
Belarus
polesye Pine 21-40
Soddy podzolic
soil (sandy)
3.00± 0.48
- - [4]
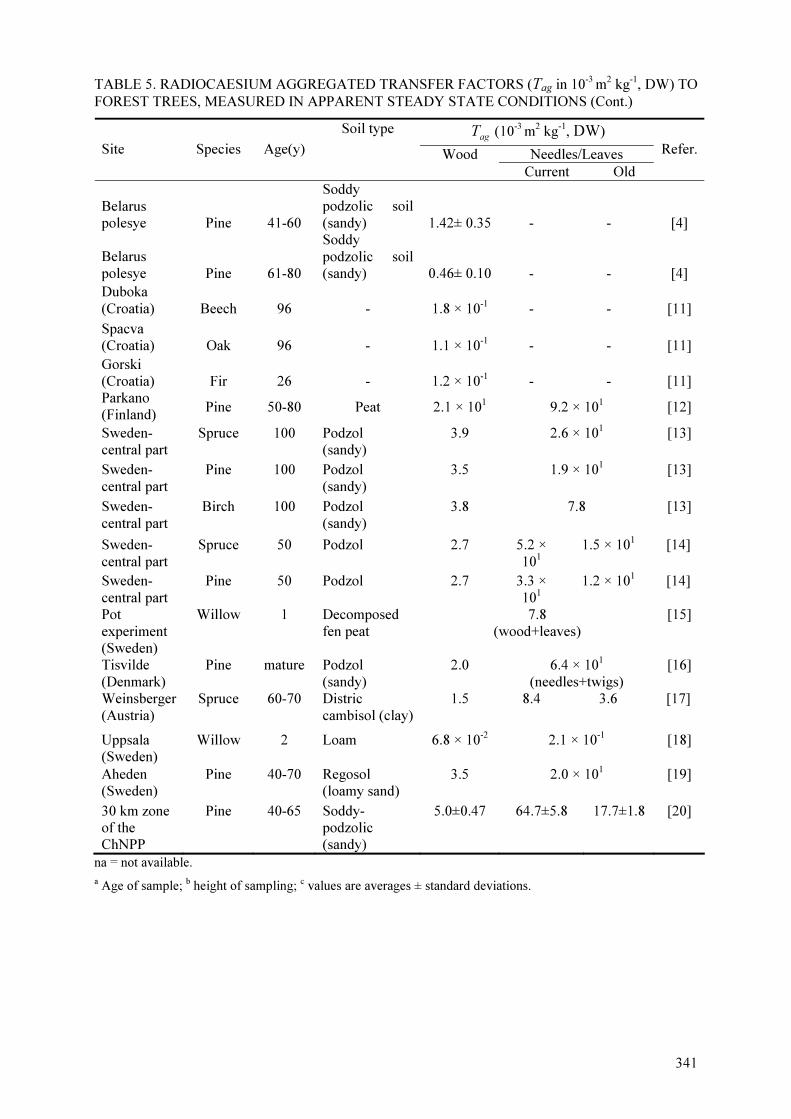
341
TABLE 5. RADIOCAESIUM AGGREGATED TRANSFER FACTORS (Tag in 10-3
m2 kg
-1, DW) TO
FOREST TREES, MEASURED IN APPARENT STEADY STATE CONDITIONS (Cont.)
Soil type ag
T (10-3
m2 kg
-1, DW)
Wood Needles/Leaves Site Species Age(y)
Current Old
Refer.
Belarus polesye Pine 41-60
Soddy podzolic soil
(sandy) 1.42± 0.35 - - [4]
Belarus
polesye Pine 61-80
Soddy
podzolic soil (sandy) 0.46± 0.10 - - [4]
Duboka
(Croatia) Beech 96 - 1.8 × 10⁻¹ - - [11]
Spacva (Croatia) Oak 96 - 1.1 × 10
-1 - - [11]
Gorski (Croatia) Fir 26 - 1.2 × 10
-1 - - [11]
Parkano (Finland)
Pine 50-80 Peat 2.1 × 101 9.2 × 10
1 [12]
Sweden-central part
Spruce 100 Podzol (sandy)
3.9 2.6 × 101 [13]
Sweden-
central part
Pine 100 Podzol
(sandy)
3.5 1.9 × 101 [13]
Sweden-
central part
Birch 100 Podzol
(sandy)
3.8 7.8 [13]
Sweden-
central part
Spruce 50 Podzol 2.7 5.2 ×
101
1.5 × 101 [14]
Sweden-
central part
Pine 50 Podzol 2.7 3.3 ×
101
1.2 × 101 [14]
Pot
experiment (Sweden)
Willow 1
Decomposed
fen peat
7.8
(wood+leaves)
[15]
Tisvilde
(Denmark)
Pine mature Podzol
(sandy)
2.0 6.4 × 101
(needles+twigs)
[16]
Weinsberger
(Austria)
Spruce 60-70 Distric
cambisol (clay)
1.5 8.4 3.6 [17]
Uppsala (Sweden)
Willow 2 Loam 6.8 × 10⁻²
2.1 × 10⁻¹
[18]
Aheden (Sweden)
Pine 40-70 Regosol (loamy sand)
3.5 2.0 × 101 [19]
30 km zone of the ChNPP
Pine 40-65 Soddy-podzolic (sandy)
5.0±0.47 64.7±5.8 17.7±1.8 [20]
na = not available.
a Age of sample; b height of sampling; c values are averages ± standard deviations.

342
TABLE 6. Tag VALUES FOR RADIOSTRONTIUM TRANSFER TO FOLIAGE AND WOOD OF
DIFFERENT FOREST TREE SPECIES. MEASURED FOLLOWING THE CHERNOBYL (1991-
1992) AND KYSHTYM (1966-1972) ACCIDENTS
Soil type Tag (10-3 m2 kg-1, DW)
Wood Needles/Leaves Site Species Age(y)
Current Old
Refer.
Tula
(Russian
Federation) Pine 50-55 Chernozem 5.7 x 10⁻¹ 1.5 3.3 [20]
Bryansk
(Russian
Federation) Pine 40-65
Soddy-podzolic
(sandy) 2.0±0.91 4.4±2.3 3.3±1.5 [20]
Kiev
(Ukraine) Pine 55-65
Soddy-podzolic
(sandy) 1.20±1.08 2.25±3.23 2.60±2.75 [20]
Kiev
(Ukraine) Pine 55-65
Humic podzolic
(hydromorphic) 10.3± 2.4 21.2 29.5± 6.3 [20]
Kyshtym
(Russian
Federation) Pine 55-70 Chernozem 0.7±0.4 6.2±3.2 [21]
Tula
(Russian
Federation) Birch 50-55 Chernozem 3.7 6.8 [20]
Bryansk
(Russian
Federation) Birch 40-60
Soddy-podzolic
(sandy) 6.2±5.5 44.0±20 [20]
Kiev
(Ukraine) Birch 35-55
Humic podzolic
(semi-
hydromorphic) 2.19±0.08 19.2±0.9 [20]
Kiev
(Ukraine) Birch 50-55
Podzol
(sandy) 0.58±0.13 4.3±1.6 [20]
Kyshtym
(Russian
Federation) Birch 55-70 Chernozem 2.8±1.7 78±34 [21]
Tula
(Russian
Federation) Oak 45-50
Chernozen
(Loam) 1.71 4 [20]
Bryansk
(Russian
Federation) Oak 35-45
Soddy-podzolic
(sandy) 2.78±0.05 9.96±1.75 [20]
Kiev
(Ukraine) Oak 40-45
Podzol
(sandy) 0.47±0.17 1.85±0.79 [20]
Bryansk
(Russian
Federation) Fur-tree 50-55
Podzol
(sandy) 4.39 12.9 13.4 [20]
Kiev
(Ukraine) Alder 40-55
Podzol
(sandy) 0.946 5.73 [20]
Kiev
(Ukraine) Aspen 40-55
Podzol
(sandy) 2.1±1.4 17.3±11.9 [20]
1Values are arithmetic means ± standard deviations.

343
2.4 Recommendations on use of Tag
During the early phase, varying dynamics of initial redistribution processes mainly influenced
by the nature of radioactive deposit and the type of forest greatly reduce the correlation
between the radionuclide content in plant and soil. Even in the long-term (steady state phase)
the long-lasting radionuclide recycling in forest ecosystems is far from implying a simple
relationship between concentrations in soil and tree. These complexities can affect the
usefulness of Tag for a holistic spatial and temporal ranking of forest systems in terms of risks
of radionuclide transfer. The most realistic use of the Tag coefficient is for forest systems
where radionuclide fluxes have stabilized and in that case, it remains a satisfactory tool for
simple screening models.
3. TRANSFER TO UNDERSTOREY VEGETATION
The understorey in forests is composed of fungi and plants growing beneath the tree canopy.
The understorey vegetation can be divided into layers according to the height of plants [22]:
• shrub layer (only ligneous, including climbers) > 0.5 m height
• herb layer (all non-ligneous, and ligneous < 0.5 m height)
• moss layer (i.e. terricolous bryophytes and lichens).
The carbon content of understorey vegetation in a boreal subarctic forest is typically 0.5 tons
per hectare, corresponding to 1.4 percent of the carbon content of forest vegetation, when both
below-ground and above-ground biomass are considered [23]. Species composition and
biomass of understorey vegetation are related to the fertility and humidity of forest soil and
also to the structure of the tree stand. The species may also vary by season; in spring the
composition is different from that in midsummer.
Forest types have traditionally been defined through species of trees and dominant or
indicator plants of ground vegetation in a forest ready for felling, thus avoiding
characterisation during temporary disturbances of the understorey. Rich grass and herb
vegetation is typical of, for instance, a spruce forest of Oxalis–Maianthemum type. In dry,
nutrient poor heath forests of Cladonia type (ClT), dominant species are lichens, their
coverage being more than 75% [24]. For selected forest types, such as beech forests and
eastern mesophytic deciduous forests, the type definition in a current European system may
be detailed also from floristic point of view and the herb layer can be an additional but
relevant criterion for forest type discrimination [25].
The development stage of a tree stand has an effect on the nutrient dynamics and growth
conditions of understorey plants. During forest regeneration and in the stage of emergence of
seedlings, the soil contains nutrients and water in abundance and surface vegetation is lush. At
this stage, the understorey vegetation will reduce the washout of nutrients from the soil. When
the biomass of trees increases, the amount of surface vegetation may decrease and nutrients
become available for the growth of trees [23], particularly in spruce and broad-leaved forests.
After crown closure, if tree canopies are dense, lack of light at the ground layer may reduce or
eliminate the understorey growth in certain oak, hornbeam and spruce forests.
During atmospheric deposition of radioactive material, radionuclides are partially intercepted
by the understorey plants, either in dry conditions or during rain. Maximum interception of
radionuclides deposited wet has been suggested to occur when rainfall is of the order of the
saturation capacity of the plant [26]. Both dry and wet deposition result in primary
contamination of vegetation. Weathering is same removal process of intercepted radionuclides
as for tree canopies. Radionuclides on surfaces of plants, if in water-soluble form penetrate
344
surfaces of leaves and enter the plant. Metabolised radionuclides are translocated to different
parts of a plant, for instance to the fruit or berries. Of importance for human ingestion dose is
the fraction of intercepted activity that is found in edible parts during harvest.
After radionuclide contamination of the forest floor, a fraction of deposited activity is retained
in moss and lichen patches. Such retention will delay the contamination of soil below bottom
vegetation, and contribute to the uneven pattern of surface activity density [26]. In natural
conditions, i.e. in undisturbed forest soils, the water-soluble fraction of deposited
radionuclides is effectively incorporated into the nutrient pools of mineral elements.
Generally the response of understorey plants to additional radionuclide contamination of the
forest floor is fast.
Certain understorey species are used as indicator organisms for environmental radionuclides.
For instance, mosses and lichens can indicate deposition of airborne radionuclides, and ferns
and ericoid species, radionuclides accumulated in soil.
Concerning dose pathways from forest to people, understorey vegetation and fungi transfer
radionuclides through wild food to man. Contributions of animal products to ingestion dose
are received from ruminants grazing in forests, and big and small mammals and terrestrial
birds taken as game. Wild berries, herbs and mushrooms can also be considerable dietary
sources of radionuclides.
On two natural coniferous sites located in south Bavaria and showing a rich flora, 137
Cs and 134
Cs uptake by understorey plants was studied by Wirth et al. in 1991 [27]. Stands on these
mineral soil sites were 120 year old mixed Scots pine and Norway spruce, and a 100 years old
Norway spruce stand. Soil horizons and mineral contents showed some differences. Plants
take up nutrients and radioactive caesium from O-horizons mainly, and the caesium in deeper
mineral layers A and B was strongly adsorbed in those layers. On a site where a mineral
component was present in the O-horizon, a considerably lower uptake of 134
Cs and 137
Cs in
leaves and stems was found than on a site without a mineral component in the O-horizon. The
concentration ratios (for dry weights) of plants and forest litter horizons Of plus Oh were 4-
and 17- fold larger in dwarf shrubs bearing berries and ferns on the site where these layers
were not mixed with the underlying mineral horizon compared with another site where these
layers were mixed [27]. In general, in the boreal forest vegetation zone, adsorption of
radioactive caesium to soil minerals is mostly lower than in the temperate zone, due to lack of
clay.
Significant differences in uptake of radionuclides were found between understorey species,
sites and soil types, when 137
Cs concentrations in annual herbs, grasses and perennial dwarf
shrubs were compared on seven sites in northern and central Europe. Plant samples were
taken twelve years after the Chernobyl accident [28]. The aggregated transfer factors (m2 kg
-1
dry weight) for vascular plants grown in forests on mineral soils were generally lower than in
a peat-land forest or for plants grown on a thick layer of organic soil. Both perennial and
annual plants differed by species in uptake of 137
Cs. The highest values of Tag were found for
Dryopteris carthusiana (0.090-0.434, two sites), Calluna vulgaris (0.025-0.241, four sites),
and Melampyrum pratense (0.091-0.125, one site).
The contribution of mycorrhizal fungi in the uptake, bioavailability and recycling of
radionuclides by understorey plants is essential, but can not be quantified at the moment [29,
30, 31]. Also, the wide variety of forest types in various climatic conditions necessitates
diverse analyses of radionuclide dynamics and substantial differences in quantification of
radionuclide uptake by understorey plants.
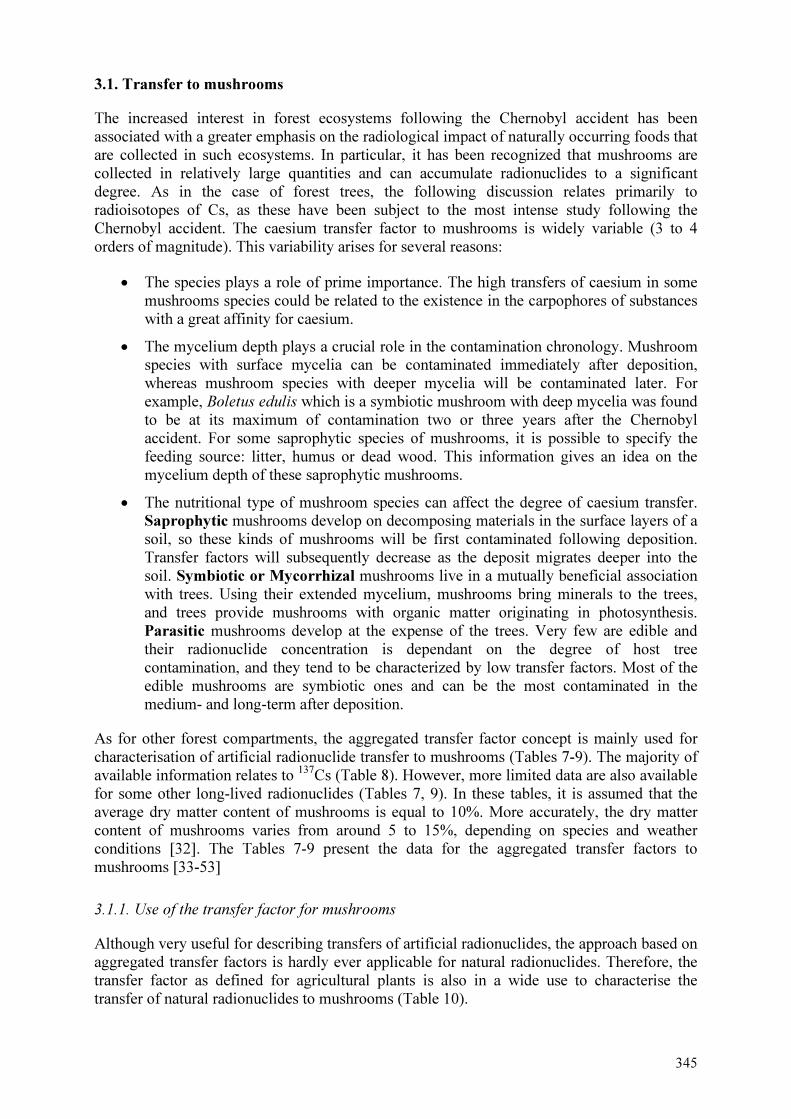
345
3.1. Transfer to mushrooms
The increased interest in forest ecosystems following the Chernobyl accident has been
associated with a greater emphasis on the radiological impact of naturally occurring foods that
are collected in such ecosystems. In particular, it has been recognized that mushrooms are
collected in relatively large quantities and can accumulate radionuclides to a significant
degree. As in the case of forest trees, the following discussion relates primarily to
radioisotopes of Cs, as these have been subject to the most intense study following the
Chernobyl accident. The caesium transfer factor to mushrooms is widely variable (3 to 4
orders of magnitude). This variability arises for several reasons:
• The species plays a role of prime importance. The high transfers of caesium in some
mushrooms species could be related to the existence in the carpophores of substances
with a great affinity for caesium.
• The mycelium depth plays a crucial role in the contamination chronology. Mushroom
species with surface mycelia can be contaminated immediately after deposition,
whereas mushroom species with deeper mycelia will be contaminated later. For
example, Boletus edulis which is a symbiotic mushroom with deep mycelia was found
to be at its maximum of contamination two or three years after the Chernobyl
accident. For some saprophytic species of mushrooms, it is possible to specify the
feeding source: litter, humus or dead wood. This information gives an idea on the
mycelium depth of these saprophytic mushrooms.
• The nutritional type of mushroom species can affect the degree of caesium transfer.
Saprophytic mushrooms develop on decomposing materials in the surface layers of a
soil, so these kinds of mushrooms will be first contaminated following deposition.
Transfer factors will subsequently decrease as the deposit migrates deeper into the
soil. Symbiotic or Mycorrhizal mushrooms live in a mutually beneficial association
with trees. Using their extended mycelium, mushrooms bring minerals to the trees,
and trees provide mushrooms with organic matter originating in photosynthesis.
Parasitic mushrooms develop at the expense of the trees. Very few are edible and
their radionuclide concentration is dependant on the degree of host tree
contamination, and they tend to be characterized by low transfer factors. Most of the
edible mushrooms are symbiotic ones and can be the most contaminated in the
medium- and long-term after deposition.
As for other forest compartments, the aggregated transfer factor concept is mainly used for
characterisation of artificial radionuclide transfer to mushrooms (Tables 7-9). The majority of
available information relates to 137
Cs (Table 8). However, more limited data are also available
for some other long-lived radionuclides (Tables 7, 9). In these tables, it is assumed that the
average dry matter content of mushrooms is equal to 10%. More accurately, the dry matter
content of mushrooms varies from around 5 to 15%, depending on species and weather
conditions [32]. The Tables 7-9 present the data for the aggregated transfer factors to
mushrooms [33-53]
3.1.1. Use of the transfer factor for mushrooms
Although very useful for describing transfers of artificial radionuclides, the approach based on
aggregated transfer factors is hardly ever applicable for natural radionuclides. Therefore, the
transfer factor as defined for agricultural plants is also in a wide use to characterise the
transfer of natural radionuclides to mushrooms (Table 10).
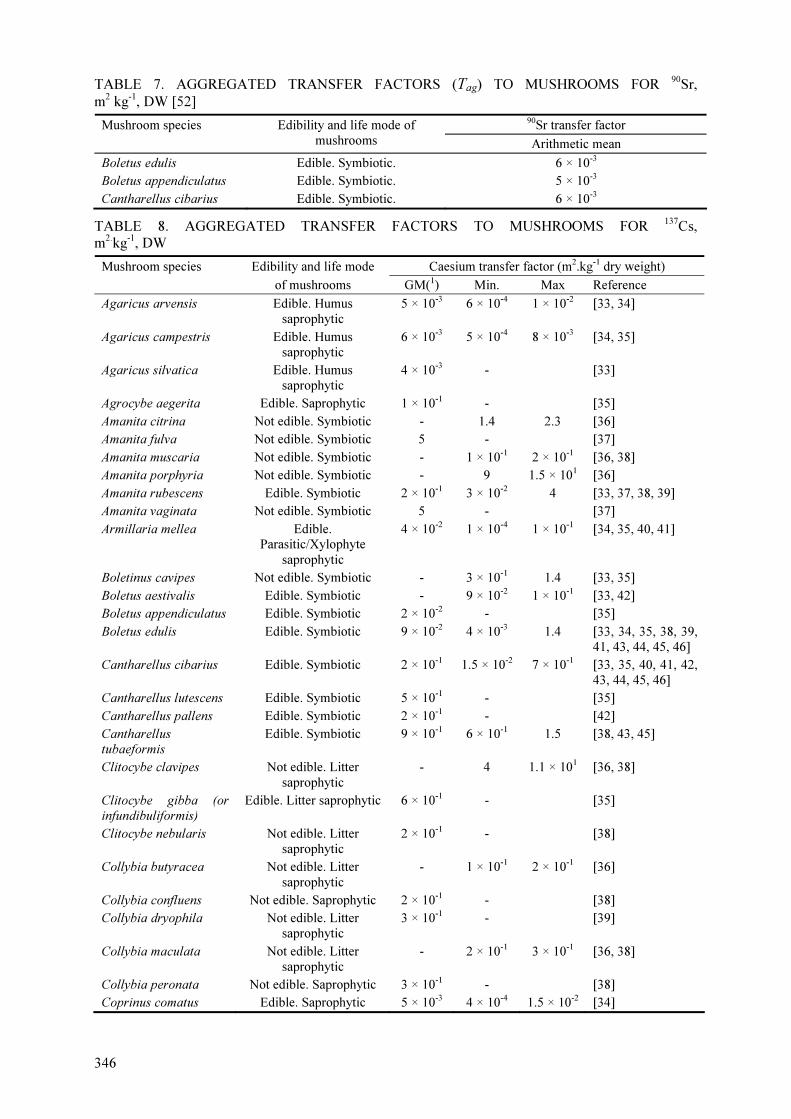
346
TABLE 7. AGGREGATED TRANSFER FACTORS (Tag) TO MUSHROOMS FOR 90
Sr,
m2 kg
-1, DW [52]
90Sr transfer factor Mushroom species Edibility and life mode of
mushrooms Arithmetic mean
Boletus edulis Edible. Symbiotic. 6 × 10⁻³
Boletus appendiculatus Edible. Symbiotic. 5 × 10⁻³
Cantharellus cibarius Edible. Symbiotic. 6 × 10⁻³
TABLE 8. AGGREGATED TRANSFER FACTORS TO MUSHROOMS FOR 137
Cs, m2.
kg-1
, DW
Edibility and life mode Caesium transfer factor (m2.kg-1 dry weight) Mushroom species
of mushrooms GM(1) Min. Max Reference
Agaricus arvensis Edible. Humus
saprophytic
5 × 10⁻³ 6 × 10⁻⁴ 1 × 10⁻² [33, 34]
Agaricus campestris Edible. Humus
saprophytic
6 × 10⁻³ 5 × 10⁻⁴ 8 × 10⁻³ [34, 35]
Agaricus silvatica Edible. Humus
saprophytic
4 × 10⁻³ - [33]
Agrocybe aegerita Edible. Saprophytic 1 × 10⁻¹ - [35]
Amanita citrina Not edible. Symbiotic - 1.4 2.3 [36]
Amanita fulva Not edible. Symbiotic 5 - [37]
Amanita muscaria Not edible. Symbiotic - 1 × 10⁻¹ 2 × 10⁻¹ [36, 38]
Amanita porphyria Not edible. Symbiotic - 9 1.5 × 101 [36]
Amanita rubescens Edible. Symbiotic 2 × 10⁻¹ 3 × 10⁻² 4 [33, 37, 38, 39]
Amanita vaginata Not edible. Symbiotic 5 - [37]
Armillaria mellea Edible.
Parasitic/Xylophyte
saprophytic
4 × 10⁻² 1 × 10⁻⁴ 1 × 10⁻¹ [34, 35, 40, 41]
Boletinus cavipes Not edible. Symbiotic - 3 × 10⁻¹ 1.4 [33, 35]
Boletus aestivalis Edible. Symbiotic - 9 × 10⁻² 1 × 10⁻¹ [33, 42]
Boletus appendiculatus Edible. Symbiotic 2 × 10⁻² - [35]
Boletus edulis Edible. Symbiotic 9 × 10⁻² 4 × 10⁻³ 1.4 [33, 34, 35, 38, 39,
41, 43, 44, 45, 46]
Cantharellus cibarius Edible. Symbiotic 2 × 10⁻¹ 1.5 × 10⁻² 7 × 10⁻¹ [33, 35, 40, 41, 42,
43, 44, 45, 46]
Cantharellus lutescens Edible. Symbiotic 5 × 10⁻¹ - [35]
Cantharellus pallens Edible. Symbiotic 2 × 10⁻¹ - [42]
Cantharellus
tubaeformis
Edible. Symbiotic 9 × 10⁻¹ 6 × 10⁻¹ 1.5 [38, 43, 45]
Clitocybe clavipes Not edible. Litter
saprophytic
- 4 1.1 × 101 [36, 38]
Clitocybe gibba (or
infundibuliformis)
Edible. Litter saprophytic 6 × 10⁻¹ - [35]
Clitocybe nebularis Not edible. Litter
saprophytic
2 × 10⁻¹ - [38]
Collybia butyracea Not edible. Litter
saprophytic
- 1 × 10⁻¹ 2 × 10⁻¹ [36]
Collybia confluens Not edible. Saprophytic 2 × 10⁻¹ - [38]
Collybia dryophila Not edible. Litter
saprophytic
3 × 10⁻¹ - [39]
Collybia maculata Not edible. Litter
saprophytic
- 2 × 10⁻¹ 3 × 10⁻¹ [36, 38]
Collybia peronata Not edible. Saprophytic 3 × 10⁻¹ - [38]
Coprinus comatus Edible. Saprophytic 5 × 10⁻³ 4 × 10⁻⁴ 1.5 × 10⁻² [34]

347
TABLE 8. AGGREGATED TRANSFER FACTORS TO MUSHROOMS FOR 137
Cs,
m2.kg
-1, DW (Cont.)
Mushroom species Edibility and life mode Caesium transfer factor (m2.kg-1 DW)
of mushrooms GM(1) Min. Max Reference
Cortinarius sp. Symbiotic 6 - [47]
Cortinarius alboviolaceus Not edible. Symbiotic 6 - [38]
Cortinarius armillatus Not edible. Symbiotic 3.8 1.2 12 [33, 37, 38, 42,
48]
Cortinarius brunneus Not edible. Symbiotic 6 - [38]
Cortinarius cinnamomeus Not edible. Symbiotic - 1 9 [49]
Cortinarius delibutus Not edible. Symbiotic - 2.6 3.0 [33, 38]
Cortinarius glandicolor Not edible. Symbiotic 9 - [33]
Cortinarius mucifluus Not edible. Symbiotic 2 × 10⁻² - [33]
Cortinarius praestans Edible. Symbiotic 2 × 10⁻² - [48]
Cortinarius traganus Not edible. Symbiotic - 5 × 10⁻¹ 1.4 [33, 48]
Craterellus
cornucopioides
Edible. Symbiotic 3 × 10⁻² - [35]
Dermocybe sp. Not edible. Symbiotic - 4 1.0 × 101 [36, 38]
Hebeloma sp. Not edible. Symbiotic - 1.5 × 101 2.5 × 101 [36]
Hydnum repandum Edible. Symbiotic 4 × 10⁻¹ - [38]
Hygrophorus sp. Symbiotic 2 - [44]
Hygrophorus
olivaceoalbus
Not edible. Symbiotic 5 - [38]
Hypholoma fasciculare Not edible. Humus
saprophytic
8 × 10⁻² - [39]
Kuehneromyces mutabilis Edible. Saprophytic
3 × 10⁻¹ - [38]
Laccaria amethystea Edible. Symbiotic/Humus
saprophytic
4.9 2.1 8.1 [33, 38, 42, 48]
Laccaria laccata Edible. Symbiotic/Humus
saprophytic
7 5.2 8 [33, 38]
Laccaria proxima Edible. Symbiotic/Humus
saprophytic
- 2 4 [36]
Lactarius sp. Symbiotic 3.9 5 × 10⁻¹ 9 [47, 49]
Lactarius camphoratus Not edible. Symbiotic 2 - [33]
Lactarius deliciosus Edible. Symbiotic 2 × 10⁻¹ 8 × 10⁻⁴ 5 × 10⁻¹ [34, 46]
Lactarius deterrimus Edible. Symbiotic - 1 × 10⁻¹ 4 × 10⁻¹ [33, 37]
Lactarius helvus Not edible. Symbiotic 3 × 10⁻¹ - [33]
Lactarius lignyotus Edible. Symbiotic 9 × 10⁻¹ - [33]
Lactarius necator or
turpis
Edible. Symbiotic 1.5 7 × 10⁻¹ 3 [33, 38, 40]
Lactarius odoratus Not edible. Symbiotic 1 × 10⁻¹ - [33]
Lactarius picinus Not edible. Symbiotic 3 × 10⁻¹ - [33]
Lactarius porninsis Edible. Symbiotic 6.0 - [33]
Lactarius quietus Not edible. Symbiotic 8 × 10⁻¹ - [33]
Lactarius rufus Not edible. Symbiotic 1.5 6 × 10⁻¹ 7 [33, 36, 38, 40,
42, 43]

348
TABLE 8. AGGREGATED TRANSFER FACTORS TO MUSHROOMS FOR 137
Cs,
m2.kg
-1, DW (Cont.)
Mushroom species Edibility and life mode Caesium transfer factor (m2.kg-1 DW)
of mushrooms GM(*) Range Reference
Lactarius theiogalus Not edible. Symbiotic 11 - [38]
Lactarius torminosus Edible. Symbiotic - 4 × 10⁻¹ 8 × 10⁻¹ [37, 43]
Lactarius trivialis Not edible. Symbiotic - 1.3 1.8 [43, 45]
Leccinum sp. Symbiotic 4 × 10⁻¹ 5 × 10⁻³ 7 × 10⁻¹ [47, 49]
Leccinum aurantiacum Edible. Symbiotic 2 × 10⁻² - [33]
Leccinum rotundifoliae Edible. Symbiotic 3 × 10⁻¹ - [37]
Leccinum scabrum Edible. Symbiotic 3 × 10⁻¹ 8 × 10⁻⁴ 1.1 [33, 34, 37, 38, 41,
42, 45, 46]
Leccinum versipelle Edible. Symbiotic 9 × 10⁻² 7 × 10⁻² 1.2 × 10⁻¹ [37, 43, 45]
Leucoagaricus
leucothites or Lepiota
naucina
Not edible. Humus
saprophytic
1 × 10⁻¹ - [35]
Macrolepiota procera Edible. Humus
saprophytic
8 × 10⁻³ 7 × 10⁻⁵ 4 × 10⁻² [34, 35, 39]
Macrolepiota rhacodes Edible. Humus
saprophytic
3 × 10⁻³ 3 × 10⁻⁴ 1 × 10⁻² [34]
Lepista nuda Edible. Litter saprophytic 1 × 10⁻² 2.5 × 10⁻⁴ 1 × 10⁻¹ [33, 34, 38]
Lepista saeva Edible. Litter saprophytic 1 × 10⁻² - [33]
Lycoperdon perlatum Edible. Humus
saprophytic
- 3 × 10⁻³ 7 × 10⁻² [35, 39]
Oudemansiella sp. 1 × 10⁻¹ - [39]
Oudemansiella radicata Not edible. 2 × 10⁻¹ - [39]
Paxillus atrotomentosus Not edible. Xylophyte
saprophytic
1 × 10⁻¹ - [33]
Paxillus involutus Not edible.
Symbiotic/Humus
saprophytic
2.1 6 × 10⁻¹ 13 [33, 36, 38, 39, 40,
42, 46, 50]
Rozites caperatus Edible. Symbiotic 2.3 4 × 10⁻¹ 8 [33, 36, 37, 45, 47,
48, 49]
Russula sp. Symbiotic 6 × 10⁻¹ 3 × 10⁻² 4.2 [39, 41, 46, 47, 49]
Russula badia Not edible. Symbiotic - 2 3 [36]
Russula decolorans Not edible. Symbiotic 4 × 10⁻¹ - [44]
Russula erythropoda Edible. Symbiotic - 2 3 [36]
Russula nigricans Not edible. Symbiotic 7 × 10⁻¹ - [38]
Russula ochroleuca Not edible. Symbiotic - 1.4 2 [36, 38]
Russula turci Not edible. Symbiotic - 8 × 10⁻¹ 1.3 [36]
Sarcodon imbricatum Edible. Symbiotic 3 × 10⁻² - [35]
Suillus bovinus Not edible. Symbiotic - 2 3 [36]
Suillus elegans or S.
grevillei
Edible. Symbiotic 4 × 10⁻¹ 7 × 10⁻² 9 × 10⁻¹ [33, 35, 42]

349
TABLE 8. AGGREGATED TRANSFER FACTORS TO MUSHROOMS FOR 137Cs, m2.kg-1, DW (Cont)
Mushroom species Edibility and life mode Caesium transfer factor (m2.kg-1 DW)
of mushrooms GM(1) Min. Max. Reference
Suillus granulatus Not edible. Symbiotic - 1 2 [36]
Suillus luteus Edible. Symbiotic - 8 × 10⁻¹ 1.4 [36, 41]
Suillus variegatus Edible. Symbiotic 9 × 10⁻¹ 5 × 10⁻¹ 3 [36, 43, 44]
Tricholoma album Not edible. Symbiotic 7 - [47]
Tricholoma auratum Not edible. Symbiotic - 4 × 10⁻¹ 6 × 10⁻¹ [36]
Tricholoma fulvum Not edible. Symbiotic 2 - [47]
Tricholoma imbricatum Not edible. Symbiotic 1 × 10⁻¹ - [47]
Tricholoma
pessundatum
Not edible. Symbiotic 1 × 10⁻¹ - [47]
Tricholoma
saponaceum
Not edible. Symbiotic 1 × 10⁻¹ - [39, 47]
Trichomolopsis
rutilans
Not edible. Xylophyte
saprophytic
- 7 × 10⁻¹ 1.0 [36]
Tylopilus felleus Not edible. Symbiotic 2.5 8 × 10⁻¹ 8 [33, 36, 38, 42]
Xerocomus badius Edible. Symbiotic 1.3 2 × 10⁻³ 7 [33, 34, 36, 38, 39,
40, 41, 42, 45, 48,
50, 51]
Xerocomus
chrysenteron
Edible. Symbiotic 1.4 3 × 10⁻¹ 5 [33, 38, 39, 40, 42,
45, 51]
Xerocomus
subtomentosus
Edible. Symbiotic 4 × 10⁻¹ 2 × 10⁻¹ 1.8 [37, 38, 40]
1In case of only one value, it is given as a best estimate, if two values, a range is presented, in case of three
values or more, a geometric mean is calculated.
TABLE 9. AGGREGATED TRANSFER FACTORS TO MUSHROOMS FOR Pu, m2 kg-1, DW [53]
239+240Pu transfer factor Mushroom species
Edibility and life
mode of mushrooms N AM Min. Max
Armillaria mellea Edible.
Parasitic/Xylophyte
saprophytic
1 9 × 10⁻⁵ -
Boletus edulis Edible. Symbiotic 4 3 × 10⁻⁴ 1.4 × 10⁻⁴
4.5 × 10⁻⁴
Cantharellus
cibarius
Edible. Symbiotic 1 2 × 10⁻² -
Lactarius vellereus Not edible. Symbiotic 3 3 × 10⁻³ 2.7 × 10⁻³
4 × 10⁻³
Macrolepiota
procera
Edible. Humus
saprophytic 2 4 × 10
-4 3.2 × 10⁻⁴ 5.7 × 10
-4
Paxillus involutus Not edible.
Symbiotic/Humus
saprophytic
1 8 × 10⁻⁴ -
Suillus luteus Edible. Symbiotic 1 9 × 10⁻⁴ -
Xerocomus badius Edible. Symbiotic 6 1 × 10⁻³ 8 × 10⁻⁵ 3.8 × 10⁻²

350
TA
BL
E 1
0. T
RA
NS
FE
R F
AC
TO
RS
FR
OM
FO
RE
ST
SO
IL T
O M
US
HR
OO
MS
FO
R N
AT
UR
AL
LY
OC
CU
RIN
G R
AD
ION
UC
LID
ES
(B
q k
g-1)/
(B
q k
g-1
), D
W
[54]
234U
238U
228T
h
230T
h
232T
h
226R
a
Mush
room
sp
ecie
s1
AM
S
D
AM
S
D
AM
S
D
AM
S
D
AM
S
D
AM
S
D
Am
anit
a c
urt
ipes
(M
,
NE
)
7 ×
10
-1
4 ×
10
-1
Am
anit
a m
usc
ari
a
(M, N
E)
3.6
× 1
0-1
5 ×
10
-2
3.3
× 1
0-1
5 ×
10
-2
2.3
× 1
0-1
4 ×
10
-2
1.2
× 1
0-1
3 ×
10
-2
3.2
× 1
0-1
5 ×
10
-2
1.1
1
.0
Heb
elom
a c
ylin
dro
-
sporu
m (
M,
NE
)
4.9
× 1
0-1
6 ×
10
-2
4.6
× 1
0-1
5 ×
10
-2
3.8
× 1
0-1
2 ×
10
-2
2.2
× 1
0-1
2 ×
10
-2
6.2
× 1
0-1
4 ×
10
-2
2.2
×1
0-1
1 ×
10
-1
Tri
cholo
ma e
qu
estr
e
(M, E
)
1.4
× 1
0-1
1 ×
10
-2
1.3
× 1
0-1
1 ×
10
-2
1.4
× 1
0-1
1 ×
10
-2
5 ×
10
-2
3 ×
10
-2
1.3
× 1
0-1
1 ×
10
-2
2.5
×1
0-2
7 ×
10
-3
Tri
cholo
ma
pes
sandatu
m (
M, N
E)
2.4
× 1
0-1
3 ×
10
-2
2.3
× 1
0-1
3 ×
10
-2
1.5
× 1
0-1
2 ×
10
-2
8 ×
10
-2
1 ×
10
-2
2.2
× 1
0-1
2 ×
10
-2
Tri
cholo
ma t
erre
um
(M, E
)
2.4
× 1
0-1
6 ×
10
-2
2.7
× 1
0-1
7 ×
10
-2
3.9
× 1
0-1
1 ×
10
-2
1.9
× 1
0-1
3 ×
10
-2
4.7
× 1
0-1
7 ×
10
-2
Lact
ari
us
del
icio
sus
(M, E
)
6 ×
10
-2
2 ×
10
-2
6 ×
10
-2
2 ×
10
-2
3 ×
10
-2
4 ×
10
-3
3 ×
10
-2
2 ×
10
-2
3 ×
10
-2
1 ×
10
-2
Rhiz
opogon r
ose
ou
lus
(M, E
)
4 ×
10
-2
1 ×
10
-2
4 ×
10
-2
1 ×
10
-2
3 ×
10
-2
1 ×
10
-2
3 ×
10
-2
2 ×
10
-2
3 ×
10
-2
2 ×
10
-2
Russ
ula
ces
sans
(M,
NE
)
3.4
× 1
0-1
7 ×
10
-2
3.1
× 1
0-1
6 ×
10
-2
1.8
× 1
0-1
4 ×
10
-2
2.1
× 1
0-1
5 ×
10
-2
1.7
× 1
0-1
4 ×
10
-2
1.4
9
× 1
0-1
1E
=ed
ible
, N
E=
not
edib
le,
(P)
= p
aras
itic
, (
S)
= s
apro
phyti
c, (
M)
= m
yco
rrhiz
al o
r sy
mbio
tic.
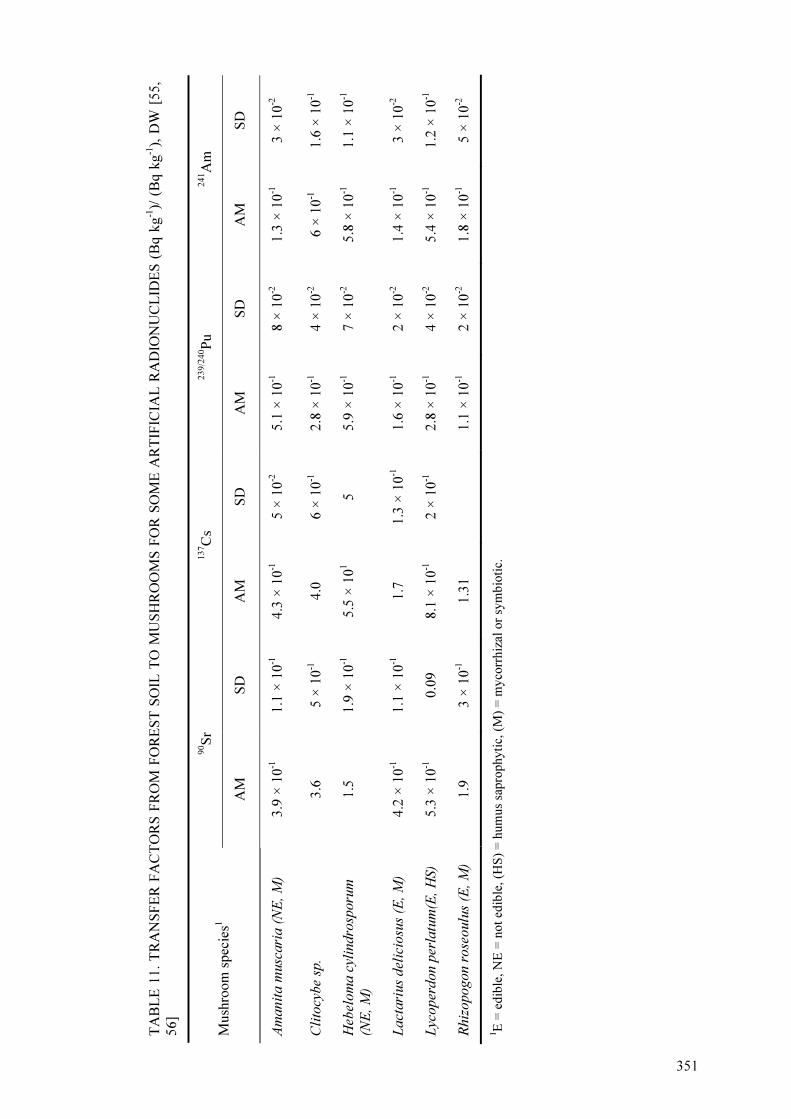
TA
BL
E 1
1.
TR
AN
SF
ER
FA
CT
OR
S F
RO
M F
OR
ES
T S
OIL
TO
MU
SH
RO
OM
S F
OR
SO
ME
AR
TIF
ICIA
L R
AD
ION
UC
LID
ES
(B
q k
g-1
)/ (
Bq
kg
-1),
DW
[5
5,
56]
90S
r 137C
s 239/2
40P
u
241A
m
Mush
room
spec
ies1
A
M
SD
A
M
SD
A
M
SD
A
M
SD
Am
anit
a m
usc
ari
a (
NE
, M
) 3.9
× 1
0-1
1.1
× 1
0-1
4.3
× 1
0-1
5 ×
10
-2
5.1
× 1
0-1
8 ×
10
-2
1.3
× 1
0-1
3 ×
10
-2
Cli
tocy
be
sp.
3.6
5 ×
10
-1
4.0
6 ×
10
-1
2.8
× 1
0-1
4 ×
10
-2
6 ×
10
-1
1.6
× 1
0-1
Heb
elom
a c
ylin
dro
sporu
m
(NE
, M
)
1.5
1.9
× 1
0-1
5.5
× 1
01
5
5.9
× 1
0-1
7 ×
10
-2
5.8
× 1
0-1
1.1
× 1
0-1
Lact
ari
us
del
icio
sus
(E, M
) 4.2
× 1
0-1
1.1
× 1
0-1
1.7
1.3
× 1
0-1
1.6
× 1
0-1
2 ×
10
-2
1.4
× 1
0-1
3 ×
10
-2
Lyc
oper
don p
erla
tum
(E, H
S)
5.3
× 1
0-1
0.0
9
8.1
× 1
0-1
2 ×
10
-1
2.8
× 1
0-1
4 ×
10
-2
5.4
× 1
0-1
1.2
× 1
0-1
Rhiz
opogon r
ose
ou
lus
(E, M
)
1.9
3 ×
10
-1
1.3
1
1
.1 ×
10
-1
2 ×
10
-2
1.8
× 1
0-1
5 ×
10
-2
1E
= e
dib
le,
NE
= n
ot
edib
le, (H
S)
= h
um
us
sapro
phyti
c, (
M)
= m
yco
rrhiz
al o
r sy
mbio
tic.
351

352
It is noted that information on transfer factors to mushrooms is also available for some artificial radionuclides giving the opportunity for a screening evaluation when only information on radionuclide activity concentrations in forest soil is available (Table 11).
Mycelia of some mushroom species exploit specific soil layers for their nutrition and the dynamics of contamination of such species has been related to the contamination of these specific layers [46, 57]. Contamination of wood degrading mushrooms has been related to radionuclide activity concentrations in ‘living wood’. These distinctions in nutrient substrate imply different patterns of contamination of different mushrooms species after a deposition. To illustrate the above affect, some examples for contamination of selected mushroom species by 137Cs sampled in a pine forest located in the Zhytomyr region (Ukraine) at a distance of around 137 km SW from the ChNPP are shown in Fig.4
1990 1992 1994 1996 1998Year
0
2E+006
4E+006
6E+006
137C
s a
cti
vit
y c
on
cen
tratio
n, B
q k
g-1, d
ry w
eig
ht Xerocomus badius
Russula paludosa
Suillus luteus
Cantharellus cibarius
Boletus edulis
FIG. 4. Cs-137 activity concentrations (Bq/kg DW) in selected mushroom species. Cs-137 soil deposition at the site in 1986 was 555 kBq m-2
[58].
Changes with time in the contamination of mushrooms reflect the bioavailability of 137Cs in the various relevant nutrient sources utilised by different species and Fig 4 indicates the tendency for a slow decrease in mushroom contamination during the 1990s and associated ecological half-lives can be ranked as follows: Cantharellus cibarius ~ Xerocomus badius
(22.4 y) < Russula paludosa (34 y) < Suillus luteus (46.2 y)< Boletus edulis (~800 y).
2.2 Transfer to berries
As with mushrooms, berries are an important natural food collected in forest ecosystems. Uptake of radiocaesium by forest berries is high in comparison with foodstuffs grown in agricultural systems. Aggregated transfer factors (dry weight) of around 1 to 10 × 10-2 m2.kg-1 were typically observed for various species of forest berries [59]. Tag values for radiocaesium in different berry species have been reviewed [60, 61]. A summary of Tag values collated during the course of this review is presented by individual species in Table 12. The different species appear to fall into one of the three categories on the basis of their Tag values (although there is considerable within-species variability):

353
• Predominantly non-forest berries – F. vesca, R. idaeus and R. fruticosus – with a mean
agT value of 7.5 × 10⁻³ m2.kg-1 (DW)
• Berries that grow in wet (and forest) ecosystems – R. chamaemorus and V. oxycoccus – with a mean
agT value of 1.0 × 10⁻¹ m2.kg-1 (DW)
• Other Vaccinium species growing within forests – V. myrtillus and V. vitis-idaea – with a mean
agT value of 5.5 × 10⁻² m2.kg-1 (DW)
After the Chernobyl accident, the evolution of the 137Cs content in all plant organs of all berry species shows a clear decreasing trend, as seen in Figures 5 and 6.
0
2000
4000
6000
8000
10000
12000
14000
16000
18000
20000
1991
1992
1993
1994
1995
1996
1997
1998
1999
2000
2001
2002
2003
2004
2005
2006
13
7C
s sp
eci
fic a
ctiv
ity
, B
q*
kg
-1
Berries, fresh weight Aboveground phytomass, dry weight
FIG. 5. Multiyear dynamics of 137
Cs activity concentrations in cranberry phytomass on an experimental plot in an automorphic landscape (density of 137Cs ground deposition was 75 kBq m
-2 in
1991) [62].
0
5000
10000
15000
20000
25000
30000
1991
1992
1993
1994
1995
1996
1997
1998
1999
2000
2001
2002
2003
2004
2005
2006
137C
s sp
ecif
ic a
ctiv
ity
, B
q*
kg-1
Berries, fresh weight Aboveground phytomass, dry weight
FIG. 6. Multiyear dynamics of 137
Cs activity concentrations in bilberry phytomass on an experimental
plot in a hydromorphic landscape (density of 137Cs ground deposition was 250 kBq m-2
in 1991) [62].
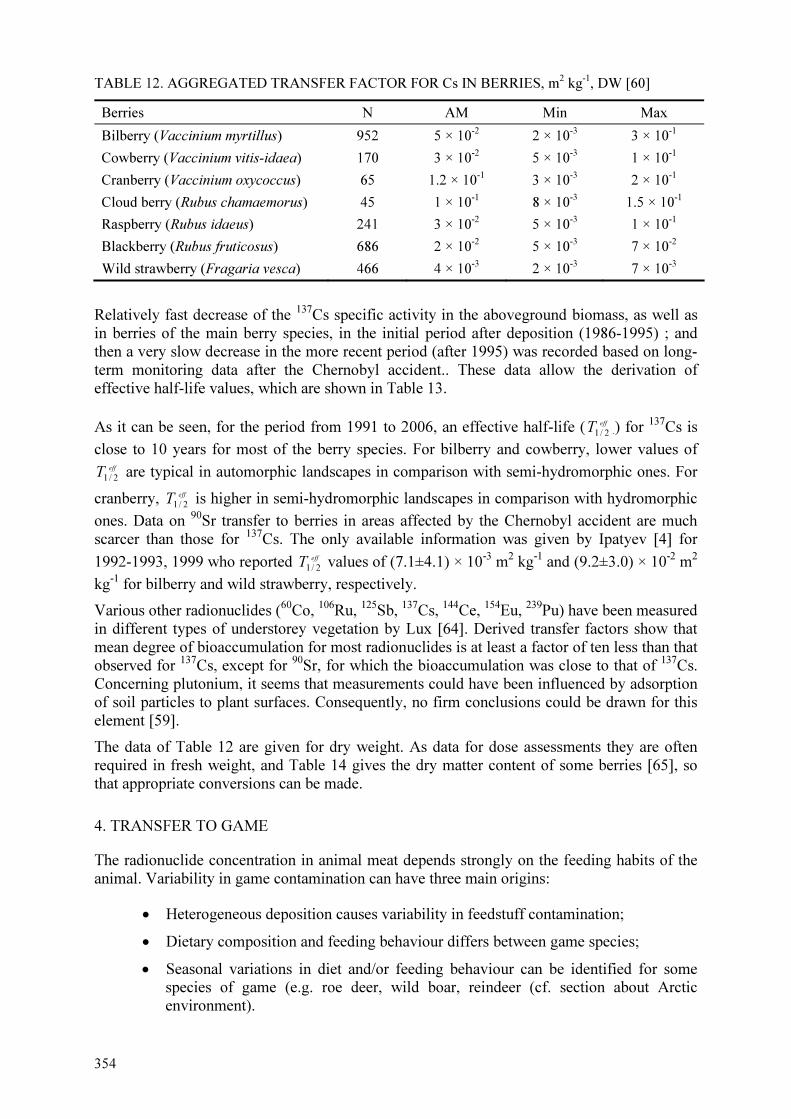
354
TABLE 12. AGGREGATED TRANSFER FACTOR FOR Cs IN BERRIES, m2 kg
-1, DW [60]
Berries N AM Min Max
Bilberry (Vaccinium myrtillus) 952 5 × 10⁻²
2 × 10⁻³
3 × 10⁻¹
Cowberry (Vaccinium vitis-idaea) 170 3 × 10⁻²
5 × 10⁻³
1 × 10⁻¹
Cranberry (Vaccinium oxycoccus) 65 1.2 × 10⁻¹
3 × 10⁻³
2 × 10⁻¹
Cloud berry (Rubus chamaemorus) 45 1 × 10⁻¹
8 × 10⁻³
1.5 × 10⁻¹
Raspberry (Rubus idaeus) 241 3 × 10⁻²
5 × 10⁻³
1 × 10⁻¹
Blackberry (Rubus fruticosus) 686 2 × 10⁻²
5 × 10⁻³
7 × 10⁻²
Wild strawberry (Fragaria vesca) 466 4 × 10⁻³
2 × 10⁻³
7 × 10⁻³
Relatively fast decrease of the 137
Cs specific activity in the aboveground biomass, as well as
in berries of the main berry species, in the initial period after deposition (1986-1995) ; and
then a very slow decrease in the more recent period (after 1995) was recorded based on long-
term monitoring data after the Chernobyl accident.. These data allow the derivation of
effective half-life values, which are shown in Table 13.
As it can be seen, for the period from 1991 to 2006, an effective half-life ( effT
2/1 .) for 137
Cs is
close to 10 years for most of the berry species. For bilberry and cowberry, lower values of eff
T2/1 are typical in automorphic landscapes in comparison with semi-hydromorphic ones. For
cranberry, effT
2/1 is higher in semi-hydromorphic landscapes in comparison with hydromorphic
ones. Data on 90
Sr transfer to berries in areas affected by the Chernobyl accident are much
scarcer than those for 137
Cs. The only available information was given by Ipatyev [4] for
1992-1993, 1999 who reported effT
2/1 values of (7.1±4.1) × 10
-3 m
2 kg
-1 and (9.2±3.0) × 10
-2 m
2
kg-1
for bilberry and wild strawberry, respectively.
Various other radionuclides (60
Co, 106
Ru, 125
Sb, 137
Cs, 144
Ce, 154
Eu, 239
Pu) have been measured
in different types of understorey vegetation by Lux [64]. Derived transfer factors show that
mean degree of bioaccumulation for most radionuclides is at least a factor of ten less than that
observed for 137
Cs, except for 90
Sr, for which the bioaccumulation was close to that of 137
Cs.
Concerning plutonium, it seems that measurements could have been influenced by adsorption
of soil particles to plant surfaces. Consequently, no firm conclusions could be drawn for this
element [59].
The data of Table 12 are given for dry weight. As data for dose assessments they are often
required in fresh weight, and Table 14 gives the dry matter content of some berries [65], so
that appropriate conversions can be made.
4. TRANSFER TO GAME
The radionuclide concentration in animal meat depends strongly on the feeding habits of the
animal. Variability in game contamination can have three main origins:
• Heterogeneous deposition causes variability in feedstuff contamination;
• Dietary composition and feeding behaviour differs between game species;
• Seasonal variations in diet and/or feeding behaviour can be identified for some
species of game (e.g. roe deer, wild boar, reindeer (cf. section about Arctic
environment).

355
TABLE 13. EFFECTIVE HALF-LIVES ( effT
2/1, YEARS) OF
137CS IN BERRIES OF THE MAIN
BERRY SPECIES OF BOREAL FORESTS IN UKRAINE IN THE YEARS FROM 1991 TO 2006
[62, 63]
effT
2/1
Berries Type of forest
landscape AM
Min. Max.
automorphic 7.5 5.4 8.5 Bilberry (Vaccinium myrtillus)
semi-hydromorphic 12.6 10.8 14.6
automorphic 7.1 4.7 9.8 Cowberry (Vaccinium vitis-idaea)
semi-hydromorphic 11.4 11.1 11.7
semi-hydromorphic 7.7 6.2 10.1 Cranberry (Oxycoccus palustris)
hydromorphic 5.5 4.6 6.6
TABLE 14. DRY MATTER CONTENT OF SOME WILD BERRIES, %
English name Latin name N AM SD Max Min
Bilberry Vaccinium myrtillus 307 13.2 1.1 × 10⁻¹ 21 8.6
Lingonberry Vaccinium vitis-idaea 254 14.1 7.8 × 10⁻² 18.8 11.3
Cranberry Vaccinium oxycoccus 16 10.8 2.3 × 10⁻¹ 12.1 9.3
Bog bilberry Vaccinium uliginosum 6 12.1 4.5 × 10⁻¹ 13.5 10.5
Black crowberry Empetrum nigrum 1 7.4 - -
Cloudberry Rubus chamaemorus 26 14.0 3.2 × 10⁻¹ 18 9
Wild raspberry Rubus idaeus 21 17.3 4.0 × 10⁻¹ 21.9 14.4
Wild strawberry Fragaria vesca 1 15.4 - -
This variability is emphasized for caesium because of the great variability in its transfers to
plants and mushrooms. With radionuclides other than caesium, such large variations have not
been reported.
As to modelling transfers to game, the variability originating from various factors for
caesium, means that the use of a single aggregated transfer factor may substantially under- or
over- estimate game contamination at some periods and in some ecological contexts. In order
to address the issue of temporal variability, two aggregated transfer factors specific to two
different feeding seasons can be adopted. The use of a more elaborate model, taking into
account a time-varying diet with a limited number of typical feedstuffs, allows more accurate
estimation of the contamination of each species of game. This improvement depends, of
course, on a suitable knowledge of the feeding habits of game (i.e. rates of consumption of
each feedstuff and their average radionuclide concentrations).
Early reports described relationships between radionuclide concentrations or amounts in
precipitation, soil and animals [66, 67] and their intake by humans [68]. A review of studies
conducted before and after the Chernobyl accident on the transfer of radiocaesium to
ruminants provides an overview of such information for that radionuclide [69]. As
background, a comparative review of the digestive system of ruminants is given in [70].
Parameter values for radionuclide transfers from soil to game are collected in [45, 69]. The
biological transport of radiocaesium in invertebrates and small (non-game) mammals is
covered by [71, 72].
356
Once an animal is no longer eating a contaminated diet, the biological half-life bioT is the time
required for the radionuclide content in an animal (either in the whole body or in a specific
organ or tissue) to be reduced by one half, excluding the effects of radioactive decay.
Particularly in the first year after the deposition, the feed of herbivorous game animals may
contain plant material contaminated directly from the initial deposition. The aggregated
transfer factors for game animals compiled here are sometimes derived from samples of
animal tissues taken in years of non-negligible atmospheric deposition from an accident or
from nuclear weapon tests.
4.1 Transfer to humans: assessment of radionuclide intake through game meat and offal
For assessment of ingestion doses received by people through meat and other tissues of game
animals, concentrations of radionuclides in edible parts of carcasses are needed. Regionally,
the amounts of consumed game meat can be derived from the annual game bag, when edible
fractions of live or carcass weights are available.
The annual game bag is related to the density of animal populations; which tends to have
annual fluctuations and substantial regional variations. Part of the annual variation is due to
the licensing of big game hunting, where the objectives of game management are considered.
Annual hunting statistics rather than population densities, not published annually, are
applicable for assessments for human intake of game meat. Individual or per capita doses can
also be based on a regional consumption survey.
The intensity of hunting varies in different countries, as well as in different regions of a single
country and with time. Such variations in intensity have an effect on the degree of
radionuclide transfer to humans after radionuclide contamination of the animals. The numbers
of some game animals harvested per year in some European countries and Canada are listed
in Table 15. [73-80]
Information on various game animal species regarding description, classification, feed habits,
geographic distribution etc. is found for instance on Animal Diversity Web, an online
database of the University of Michigan1.
In Central Europe, the mean weight (eviscerated animal with head) of roe deer is 12.5 kg, red
deer 65 kg, wild boar 41 kg and chamois 15 kg [77, 81]. This weight has to be multiplied by
about a factor 0.6 to get approximately the weight of the meat to be consumed. Also, often
used is carcass weight, defined for various groups of animals. For certain big mammals it
includes weight of the slaughtered animal’s cold body after having been bled, skinned and
eviscerated, and after removal of the head, tail, udders and part of the limbs. Kidneys, kidney
fats and butcher’s fat are included in the carcass. Slaughter grease is not [81]. The fraction of
edible meat included in carcass weight can be derived by subtraction of the weight of bones
and other not edible parts from carcass weights (Table 16) [82-84].
Tissues other than muscle, such as liver, kidney and heart, and also blood, have traditionally
been used for human food by for instance reindeer-herding populations in Fennoscandia [80],
aboriginals of northern America [80] and hunters elsewhere [68]. Currently, the
contamination by toxic heavy metals, particularly cadmium, restricts the use of liver and
kidney of big game animals for food in some regions.
1 Conditions of use, copyright owners and recommendations for citing are given in
http://animaldiversity.ummz.umich.edu/site/about/overview.html.

357
TABLE 15. NUMBER OF GAME ANIMALS HARVESTED PER YEAR1
Country Game animal Year Killed per year Reference
Sweden Roe deer Roe deer
Moose Red deer Fallow deer
Wild boar Arctic hare
Brown hare Goldeneye Pheasant
Black grouse Wood pigeon
1986/95 2004
2004 2004 2004
2004 2004
2004 2004 2004
2004 2004
1.2 × 10⁵-3.8 × 10
5
1.5 × 10⁵
9.7 × 10⁴
2.8 × 10³
1.7 × 10⁴
1.9 × 10⁴
3.5 × 10⁴
5.6 × 10⁴
9 × 10³
2.8 × 10⁴
2.6 × 10⁴
8.1 × 10⁴
[73, 74]
Norway Moose Red deer
Roe deer Wild reindeer
Hare Grouse Wood pigeon
Ducks Geese
2004 2004
2003 2004
2003/04 2003/04 2003/04
2003/04 2003/04
3.7 × 10⁴
2.6 × 10⁴
2.9 × 10⁴
4 × 10³
2.9 × 10⁴
4.4 × 10⁵
5.9 × 10⁴
5.7 × 10⁴
1.5 × 10⁴
[75]
Finland Moose White-tailed deer Roe deer
Brown hare Arctic hare
Grouse Waterfowl Wood pigeon
Pheasant
2001/05 2001/05 2001/04
2001/02 2001/02
2001/02 2001/02 2001/02
2001/02
(6.7-7.6) × 104
(1.7-2.3) × 104
(1.1-3.4) × 103
(6.2-7.2) × 104
(1.9-2.0) × 105
(3.0-3.2) × 105
(4.4-5.5) × 105
1.4 × 10⁵
(2.4-3.1) × 104
[76]
1987/88 8.8 × 10⁵ Roe deer
8.9 × 10⁵
Red deer 6.0 × 10⁴
Wild boar 4.6 × 10⁵
Germany
Chamois
2003/2004
5.9 × 10³
[77]
Baden-
Württemberg
Roe deer 1987/88 1.5 × 10⁵ [78]
Czech
Republic
Roe deer and deer 1992 >3.0 × 10⁶ (1)
[40]
Roe deer 2.8 × 10⁵
Red deer
Wild boar Chamois
4.9 × 10⁴
3.3 × 10⁴
2.5 × 10⁴
Austria
Canada Caribou
2004/2005
1986 ≈105
[79]
[80]a
1Kilograms.

358
TABLE 16. CARCASS WEIGHT AND MEAT FRACTION FOR GAME ANIMALS
Species of animal Carcass weight, kg Fraction of meat in carcass weight
Moose, adult 1.9 × 10² 0.80 Moose, calf 8.3 × 101 0.78 White-tailed deer 5.0 × 101 0.78 Fallow deer 3.3 × 101 0.78 Roe deer 1.8 × 101a 0.78 Brown hare 2.4 0.90 Arctic hare 1.8 0.90 Capercaillie 1.9 0.90 Black grouse 6.6 × 10⁻¹ 0.90 Hazel grouse 2.4 × 10⁻¹ 0.90 Willow grouse 3.6 × 10⁻¹ 0.90 Partridge 2.4 × 10⁻¹ 0.90 Pheasant 6.9 × 10⁻¹ 0.90 Goose 2.3 0.90 Eider 1.3 0.90 Long-tailed duck 3.8 × 10⁻¹ 0.90 Mallard 6.6 × 10⁻¹ 0.90 Goldeneye 4.5 × 10⁻¹ 0.90 Teal 1.8 × 10⁻¹ 0.90
aRoe deer gains more weight in Northern than in Central Europe.
Wild terrestrial food chains provide information on the uptake and distribution of radionuclides in large mammals. Various soft tissues and bone of deer have been extensively studied for their radionuclide contents in North America during the nuclear fallout era. Concentrations of 137Cs in white-tailed deer decreased in the order: tongue or body muscle and kidney ≥ heart and spleen ≥ liver [85]. Liver contained on average fifty per cent of the 137Cs concentration found in the body muscle of caribou, whereas kidney, heart and muscle did not differ substantially in a compilation of long-term data [80]. Soft tissues also concentrate 22Na, 55Fe, 65Zn, 110mAg and 210Po. In contrast bone is the main site of deposition and accumulation of 54Mn, 90Sr, 210Pb and 226Ra [86]. 90Sr has been analysed in bones, and 144Ce, 137Cs, 54Mn and 106Ru in liver of mule deer by [68]. Plutonium (239, 240Pu, 238Pu) concentrations in soft tissues and bone of white-tailed deer decreased in the order: bone ≥ liver ≥ lungs ≥ muscle [87].
Seasonal changes in bone, muscle and rumen contents of 210Po, 210Pb, 226Ra and 137Cs in Alaskan reindeer and caribou were studied by [88]. They found variations in muscle concentrations of 210Po with season; a fourfold increase from fall to spring, which is similar to the seasonal variation of 137Cs concentrations. Concentrations of 226Ra in bone were lower than concentrations of other radionuclides studied, and muscle contents were hardly detectable. The results clearly showed the contribution of lichen to both rumen and body content of 137Cs, 210Pb and 210Po, whereas most of the 226Ra originated in vascular plants. The radionuclide content and composition of feed were compared with 90Sr in bone and 137Cs in muscle of reindeer, caribou and moose by [67]. They analysed also rumen content and showed the significance of availability of lichen and the use of old growth of sedges as winter feed for 90Sr and 137Cs concentrations in animals. They concluded that absence of lichen and possibly plant litter in the diet of moose are likely reasons for the lower 90Sr and 137Cs burdens.

359
4.2 Transfer to roe deer (Capreolus capreolus)
Roe deer consume a wide variety of herbs, grasses and also fungi when they are available. Radiocaesium levels in roe deer peak in August and September when fungi are abundant. The population density is 25–50 animals per km² in Central Europe and, because of management of hunting, 0.03 animals per km² in Ukraine, Zhitomir region [58, 89, 90].
The spectrum of dietary plants and the seasonality of the diet are described in [91, 92, 93, 94]. Herbs form 80% of the food in spring and summer, and about 65 % in winter. Leaf buds, and small twigs of trees and shrubs form 11-12 % in spring and early summer and 23 % in autumn and winter. Fungi and lichens are found in analyses of rumen content–about 1.4 % dry mass as the highest fraction in autumn. No differences were found in the quality of food consumed by young and adult animals [95]. In 114 rumen of roe deer, an average fraction of fungi of 3.3 % was found for the period June to December, and a maximum of 15 % for October [93]. In some individual roe deer [91], the fraction of fungi in the rumen was found to be up to 76 % of the total content.
Fern, blackberry, bilberry, and raspberry are relevant as grazing plants of roe deer [93]. Intakes by roe deer were found to be 350 g dry mass intake per day in winter and up to 600 g dry mass intake per day in summer [92, 96]. 137Cs activity concentrations and seasonality of intakes are described in [90, 97 – 108]. There is quantitative evidence that the observed increase in summer and autumn of the 137Cs activity concentration in roe deer meat is due to higher rates of ingestion of mushrooms during this period of the year [109, 110, 111].
The availability of mushrooms can depend on the amount of rain just before the mushroom season [90, 100, 112]. Data concerning the time-dependency of Tag are given in Table 17. All Tag values are calculated with respect to fresh mass of game meat.
Table 18 gives the ecological half-lives for samples from forest ecosystems in Germany and Austria. The ecological half-lives given were calculated for time series of aggregated transfer factors (ratio of the activity concentration [Bq kg-1] in a product and the total radionuclide deposition [Bq m-2] of the area where the product has been sampled).
As can be seen for Ochsenhausen, the time-dependence of Tag during the whole year can be described using 1 exponential function with eco
T2/1
= (5.7 ± 0.13) years. In the case of roe deer
in Pfrunger Ried, the time-dependence of Tag during the whole year can be described by 1 exponential function with eco
T2/1
= (13 ± 1.8) years [108, 116].
For comparison, the other ecological half-lives were derived from data sets giving activity concentrations in the samples. Table 18 also contains data sets from the Ukraine. Although there is considerable variability and from some of the data sets ecological half-lives ( eco
T2/1
)
could be derived with large statistical uncertainties only, some general trends are apparent from Table 18.
Ecological half-lives of roe deer meat vary between 6 and 13 years. It can be seen from Table 18 that soil properties provide a significant influence (e.g. organic matter fraction in peat or spruce forest), and that with increasing length of the time interval of observation eco
T2/1
values
are larger. This is an indication that different processes determine the availability of 137Cs for roe deer as compared with those processes acting soon after the start of the contamination in 1986 (e.g. fixation, migration into the rooting zone).Thus, use of a single exponential may be an over-simplification in long-term assessment studies.

360
TABLE 17. AGGREGATED TRANSFER FACTOR VALUES FOR 137Cs TO MEAT OF ROE DEER (m² kg-1 FW)
Site Years after
deposition
Period,
month
N GM GSD Site description Reference
General
5.0 × 10⁻²
[45] 3 35 2.6 × 10
-2
4 59 2.8 × 10⁻²
5 65 1.8 × 10
-2
6 49 2.0 × 10⁻²
7 35 3.0 × 10
-2
Harbo/Sweden
8
1-6
36 2.3 × 10⁻²
Coniferous forest; mean
deposition 35 – 40 kBq/m²
1.05.1986
[109]
2 36 1.7 × 10⁻²
1.9
3 57 1.7 × 10⁻²
1.8
4 48 1.0 × 10⁻²
2.0
5 59 7.6 × 10⁻³
2.4
6 55 8.2 × 10⁻³
1.9
7 59 5.7 × 10⁻³
1.9
8 63 5.2 × 10⁻³
1.9
Ochsenhausen/
Germany
9
1-6
53 4.8 × 10⁻³
2.0
Spruce forest;
mean deposition 39 kBq/m² 1.05.1986
[108, 112,
113]
2 6 8.1 × 10⁻²
1.1
3 20 2.3 × 10⁻²
3.5
4 16 1.6 × 10⁻²
3.2
5 29 2.5 × 10⁻²
3.9
6 14 2.4 × 10⁻²
3.4
7 14 4.0 × 10⁻²
2.1
8 10 4.0 × 10⁻²
1.6
9 15 2.3 × 10⁻²
3.9
10 17 2.5 × 10⁻²
3.0
11 17 2.9 × 10⁻²
2.1
12 25 2.2 × 10⁻²
2.2
13 23 2.6 × 10⁻²
1.9
14 31 2.0 × 10⁻²
2.8
15 40 1.2 × 10⁻²
3.0
16 32 1.8 × 10⁻²
3.1
17 25 2.7 × 10⁻²
2.0
Pfrunger Ried
Germany
18
1-6
25 2.3 × 10⁻²
1.8
Peat bog, pine;
mean deposition 22 kBq/m²
1.05.1986
Bodenmais. Germany
3/4 2.7 × 10⁻²
Spruce, mean deposition 98 kBq/m², 1.05.1986
[114]
Sumava Czech Rep.
0/5 2.7 × 10⁻²
Spruce, forest. mean deposition 10.5 kBq/m²,
June 1986
[40]
Temelin
Czech Rep.
0/5 3.8 × 10⁻²
Spruce/agricultural land,
mean deposition 3 kBq/m², 1991/93
[40]
0 5 4.6 × 10⁻²
1.8
1 9 3.9 × 10⁻²
2.4
2 31 4.0 × 10⁻²
2.4
3 44 2.7 × 10⁻²
2.7
4 48 2.3 × 10⁻²
2.3
5 177 2.0 × 10⁻²
2.5
6 143 1.2 × 10⁻²
2.5
7 87 1.6 × 10⁻²
2.2
8 91 1.8 × 10⁻²
2.7
9 17 2.0 × 10⁻²
2.4
10 25 1.3 × 10⁻²
1.7
11 25 1.7 × 10⁻²
2.0
12 19 9 × 10⁻³
2.4
13 12 1.0 × 10⁻²
1.6
14 11 1.1 × 10⁻²
1.7
15 27 1.4 × 10⁻²
2.4
16 7 1.1 × 10⁻²
1.8
Weinsberger
Forest Austria
17
1-12
12 8 × 10⁻³
2.1
Spruce forest,
mean deposition (median) 52.2 kBq/m² at n = 218 sites, 1.05.1986
[115]
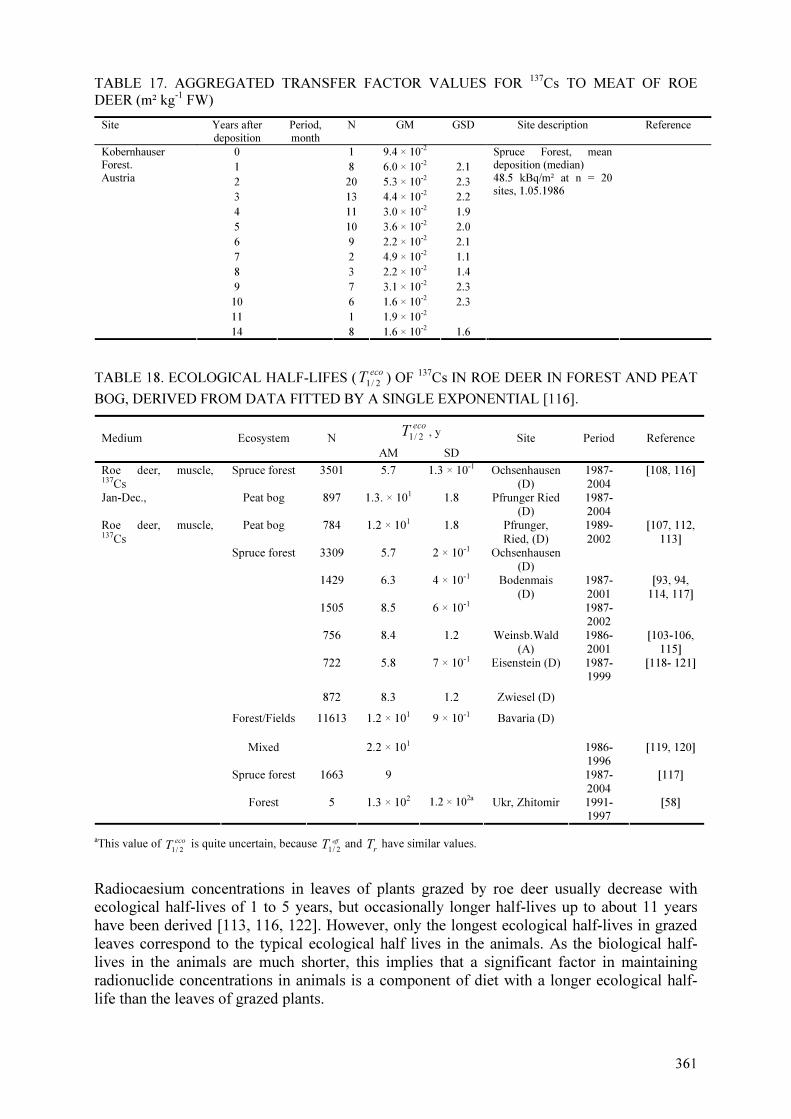
361
TABLE 17. AGGREGATED TRANSFER FACTOR VALUES FOR 137Cs TO MEAT OF ROE DEER (m² kg-1 FW)
Site Years after
deposition
Period,
month
N GM GSD Site description Reference
0 1 9.4 × 10⁻²
1 8 6.0 × 10⁻²
2.1
2 20 5.3 × 10⁻²
2.3
3 13 4.4 × 10⁻²
2.2
4 11 3.0 × 10⁻²
1.9
5 10 3.6 × 10⁻²
2.0
6 9 2.2 × 10⁻²
2.1
7 2 4.9 × 10⁻²
1.1
8 3 2.2 × 10⁻²
1.4
9 7 3.1 × 10⁻²
2.3
10 6 1.6 × 10⁻²
2.3
11 1 1.9 × 10⁻²
Kobernhauser Forest.
Austria
14
8 1.6 × 10⁻²
1.6
Spruce Forest, mean deposition (median)
48.5 kBq/m² at n = 20 sites, 1.05.1986
TABLE 18. ECOLOGICAL HALF-LIFES ( eco
T2/1
) OF 137Cs IN ROE DEER IN FOREST AND PEAT
BOG, DERIVED FROM DATA FITTED BY A SINGLE EXPONENTIAL [116].
eco
T2/1
, y Medium Ecosystem N
AM SD
Site Period Reference
Spruce forest 3501 5.7 1.3 × 10⁻¹ Ochsenhausen
(D)
1987-
2004
Roe deer, muscle, 137Cs
Jan-Dec., Peat bog 897 1.3. × 101 1.8 Pfrunger Ried
(D)
1987-
2004
[108, 116]
Peat bog 784 1.2 × 101 1.8 Pfrunger,
Ried, (D)
3309 5.7 2 × 10⁻¹ Ochsenhausen
(D)
1989-
2002
[107, 112,
113]
1429 6.3 4 × 10⁻¹ 1987-
2001
1505 8.5 6 × 10⁻¹
Bodenmais
(D)
1987-
2002
[93, 94,
114, 117]
756 8.4 1.2 Weinsb.Wald
(A)
1986-
2001
[103-106,
115]
722 5.8 7 × 10⁻¹ Eisenstein (D)
Spruce forest
872 8.3 1.2 Zwiesel (D)
Forest/Fields 11613 1.2 × 101 9 × 10⁻¹
1987-
1999
[118- 121]
Mixed 2.2 × 101 1986-
1996
[119, 120]
Spruce forest 1663 9
Bavaria (D)
1987-
2004
[117]
Roe deer, muscle, 137Cs
Forest 5 1.3 × 10² 1.2 × 10²a
Ukr, Zhitomir 1991-
1997
[58]
aThis value of eco
T2/1
is quite uncertain, because effT
2/1 and r
T have similar values.
Radiocaesium concentrations in leaves of plants grazed by roe deer usually decrease with
ecological half-lives of 1 to 5 years, but occasionally longer half-lives up to about 11 years
have been derived [113, 116, 122]. However, only the longest ecological half-lives in grazed
leaves correspond to the typical ecological half lives in the animals. As the biological half-
lives in the animals are much shorter, this implies that a significant factor in maintaining
radionuclide concentrations in animals is a component of diet with a longer ecological half-
life than the leaves of grazed plants.
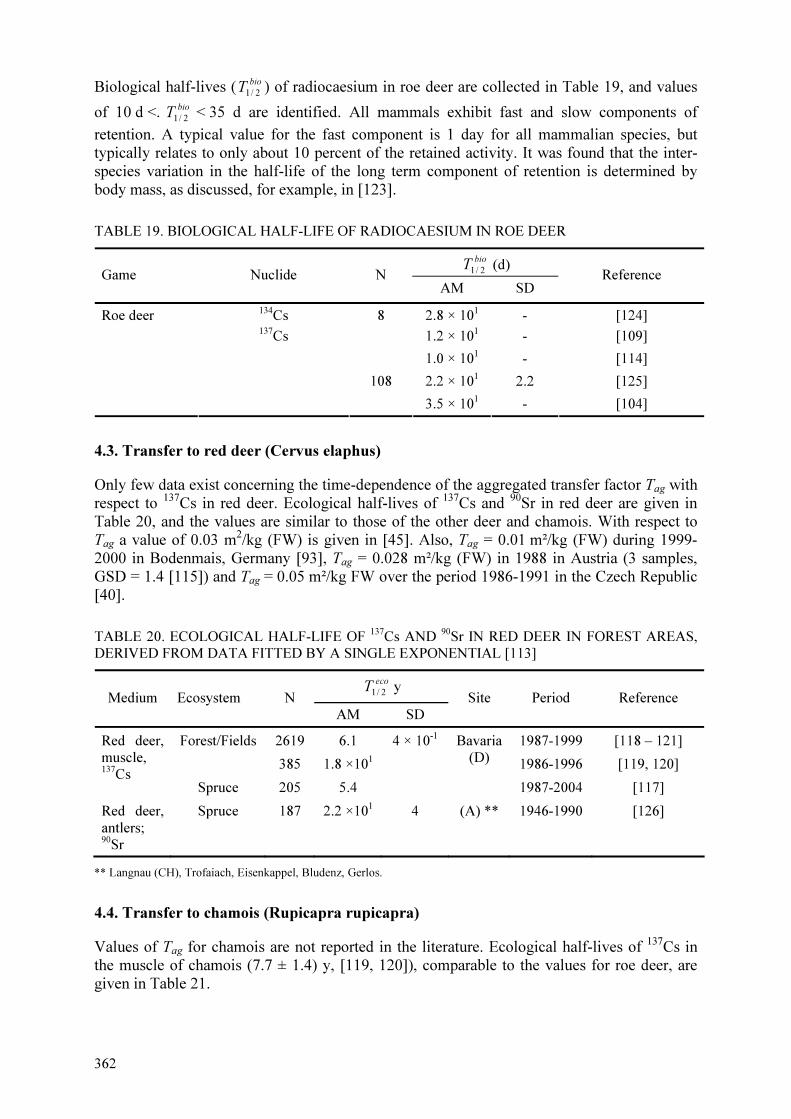
362
Biological half-lives ( bioT
2/1) of radiocaesium in roe deer are collected in Table 19, and values
of 10 d <. bioT
2/1 < 35 d are identified. All mammals exhibit fast and slow components of
retention. A typical value for the fast component is 1 day for all mammalian species, but
typically relates to only about 10 percent of the retained activity. It was found that the inter-
species variation in the half-life of the long term component of retention is determined by
body mass, as discussed, for example, in [123].
TABLE 19. BIOLOGICAL HALF-LIFE OF RADIOCAESIUM IN ROE DEER
bioT
2/1 (d)
Game Nuclide N AM SD
Reference
134Cs 8 2.8 × 101 - [124]
1.2 × 101 - [109]
1.0 × 101 - [114]
108 2.2 × 101 2.2 [125]
Roe deer 137Cs
3.5 × 101 - [104]
4.3. Transfer to red deer (Cervus elaphus)
Only few data exist concerning the time-dependence of the aggregated transfer factor Tag with
respect to 137
Cs in red deer. Ecological half-lives of 137
Cs and 90
Sr in red deer are given in
Table 20, and the values are similar to those of the other deer and chamois. With respect to
Tag a value of 0.03 m2/kg (FW) is given in [45]. Also, Tag = 0.01 m²/kg (FW) during 1999-
2000 in Bodenmais, Germany [93], Tag = 0.028 m²/kg (FW) in 1988 in Austria (3 samples,
GSD = 1.4 [115]) and Tag = 0.05 m²/kg FW over the period 1986-1991 in the Czech Republic
[40].
TABLE 20. ECOLOGICAL HALF-LIFE OF 137Cs AND 90Sr IN RED DEER IN FOREST AREAS, DERIVED FROM DATA FITTED BY A SINGLE EXPONENTIAL [113]
eco
T2/1 y
Medium Ecosystem N AM SD
Site Period Reference
2619 6.1 4 × 10⁻¹ 1987-1999 [118 – 121] Forest/Fields
385 1.8 ×101 1986-1996 [119, 120]
Red deer, muscle, 137Cs
Spruce 205 5.4
Bavaria (D)
1987-2004 [117]
Red deer, antlers; 90Sr
Spruce 187 2.2 ×101 4 (A) ** 1946-1990 [126]
** Langnau (CH), Trofaiach, Eisenkappel, Bludenz, Gerlos.
4.4. Transfer to chamois (Rupicapra rupicapra)
Values of Tag for chamois are not reported in the literature. Ecological half-lives of 137
Cs in
the muscle of chamois (7.7 ± 1.4) y, [119, 120]), comparable to the values for roe deer, are
given in Table 21.

363
TABLE 21. ECOLOGICAL HALF-LIFE OF 137CS IN THE MUSCLE OF CHAMOIS FROM FORESTED AREAS, DERIVED FROM DATA FITTED BY A SINGLE EXPONENTIAL [116]
eco
T2/1 (y)
Medium Ecosystem N AM SD
Site Period Reference
Forest 1059 7.7 1.4 1987-1999 [118-120] Chamois, muscle, 137Cs Spruce 2.6 × 101
Bavaria (D) 1986-1996 [119, 120]
4.5 Transfer to reindeer and caribou
Domesticated reindeer (Rangifer tarandus) belongs to the deer family (Cervidae). The live
weight of reindeer varies; females over three years weigh around 60–100 kilos and males over
three years as well as castrated males weigh about 90–180 kilos [127]. The size of reindeer
stock varies by country (Table 22). The percentage of the surface area under reindeer herding
ranges in Fennoscandian countries from 33% to 40% [128]. The annual per capita
consumption of reindeer meat may be low, 0.2 kg in Sweden in the late 1990’s [129], 0.4 kg
in Norway in reindeer management year 2005/06 [127] and 0.5 kg per year in Finland in 2004
[130], whereas a minor population group based on reindeer husbandry may consume reindeer
meat daily. In the Kola region, RU, the reindeer breeders consumed 0.3 kg reindeer meat per
day in 1998-1999 [131].
TABLE 22. THE DOMESTICATED REINDEER STOCK IN SOME COUNTRIES [128]
Country Size of the stock /year Pasture area, km2/per percent of the surface area of the country
Alaska 1.9 × 10⁴/1999
Finland 1.9 × 10⁵/2000
Norway 1.7 × 10⁵/2001
Sweden 2.3 × 10⁵/1998
Mongolia 7.0 × 10²/2001
Russian Federation
1.2 × 10⁶/2001
1.1 × 10⁵ /36%
1.4 × 10⁵ /40%
1.6 × 10⁵ /34%
Wide areas of (forest) tundra and taiga
Reindeer uses wild feed, particularly lichen in winter and green vascular plants and possibly
fungi [132] during the growth period. Reindeer lichens are Cladonia stellaris, Cladonia
rangiferina, Bryoria spp., Alectoria spp.) [133] and others. Herded reindeer find their natural
feed in large forested or mountainous areas, including the tundra and taiga of Fennoscandia,
Russian Federation, Canada and Alaska throughout the year. The spectrum of wild vascular
plants in the feed of reindeer is broad and includes some 450 species of feeding plants. They
are dwarf shrubs (17%–68%) Vaccinium myrtillus, Empetrum hermaphroditum, Calluna
vulgaris; Graminids: wavy hairgrass; Water horsetail; and buds, shoots and leaves from
birches and willows [133 to 138]. In some of the pasture areas in Fennoscandia,
supplementary feeding is needed and provided in winter. Feeding stuffs can be, for instance,
grain-based fodders and grass silage or hay, and also bunches of leaf fodder and common reed
(Phragmites australis).
Because of the nomadic behaviour of reindeer it is, in principle, difficult to derive an
aggregated transfer parameter for reindeer meat (Table 23). The VAMP report [139] mentions
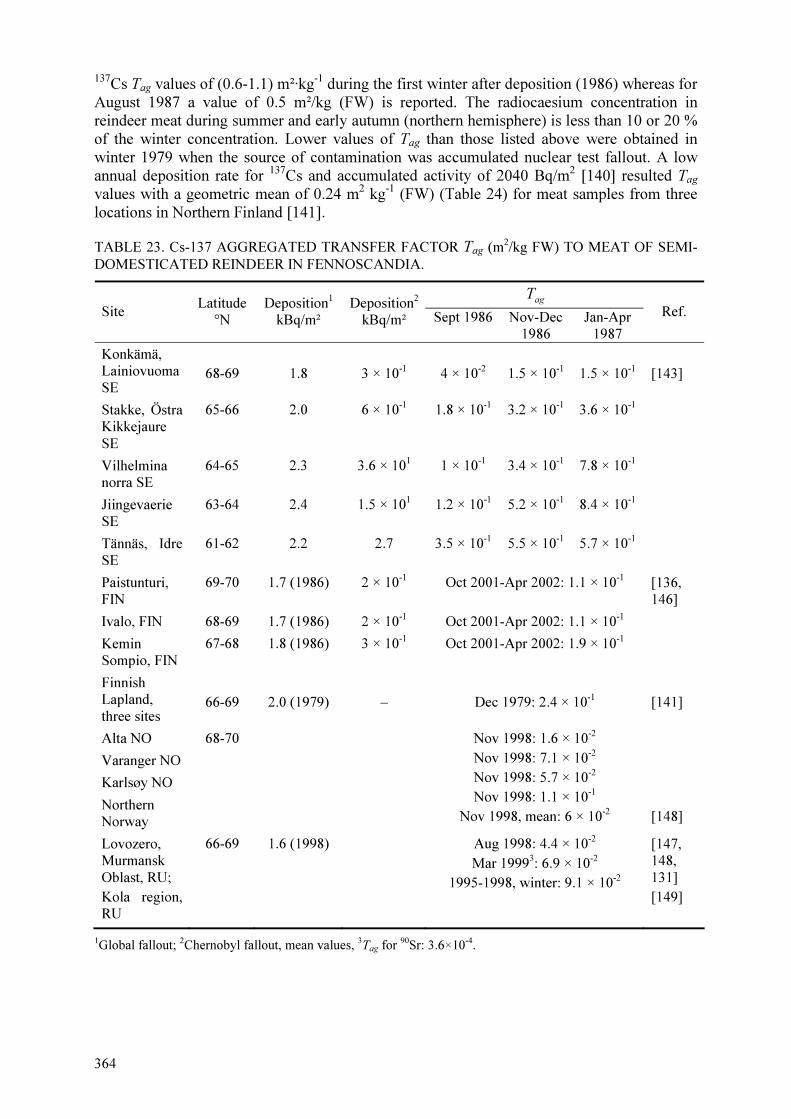
364
137Cs Tag values of (0.6-1.1) m²·kg
-1 during the first winter after deposition (1986) whereas for
August 1987 a value of 0.5 m²/kg (FW) is reported. The radiocaesium concentration in
reindeer meat during summer and early autumn (northern hemisphere) is less than 10 or 20 %
of the winter concentration. Lower values of Tag than those listed above were obtained in
winter 1979 when the source of contamination was accumulated nuclear test fallout. A low
annual deposition rate for 137
Cs and accumulated activity of 2040 Bq/m2 [140] resulted Tag
values with a geometric mean of 0.24 m2 kg
-1 (FW) (Table 24) for meat samples from three
locations in Northern Finland [141].
TABLE 23. Cs-137 AGGREGATED TRANSFER FACTOR Tag (m2/kg FW) TO MEAT OF SEMI-
DOMESTICATED REINDEER IN FENNOSCANDIA.
agT
Site Latitude
°N Deposition1
kBq/m² Deposition2
kBq/m² Sept 1986 Nov-Dec 1986
Jan-Apr 1987
Ref.
Konkämä, Lainiovuoma SE
68-69
1.8
3 × 10⁻¹
4 × 10⁻²
1.5 × 10⁻¹
1.5 × 10⁻¹
Stakke, Östra Kikkejaure SE
65-66 2.0 6 × 10⁻¹ 1.8 × 10⁻¹ 3.2 × 10⁻¹ 3.6 × 10⁻¹
Vilhelmina norra SE
64-65 2.3 3.6 × 101 1 × 10⁻¹ 3.4 × 10⁻¹ 7.8 × 10⁻¹
Jiingevaerie SE
63-64 2.4 1.5 × 101 1.2 × 10⁻¹ 5.2 × 10⁻¹ 8.4 × 10⁻¹
Tännäs, Idre SE
61-62 2.2 2.7 3.5 × 10⁻¹ 5.5 × 10⁻¹ 5.7 × 10⁻¹
[143]
Paistunturi, FIN
69-70 1.7 (1986) 2 × 10⁻¹ Oct 2001-Apr 2002: 1.1 × 10⁻¹
Ivalo, FIN 68-69 1.7 (1986) 2 × 10⁻¹ Oct 2001-Apr 2002: 1.1 × 10⁻¹
[136, 146]
Kemin Sompio, FIN
67-68 1.8 (1986) 3 × 10⁻¹ Oct 2001-Apr 2002: 1.9 × 10⁻¹
Finnish Lapland, three sites
66-69
2.0 (1979)
–
Dec 1979: 2.4 × 10⁻¹
[141]
Alta NO
Varanger NO
Karlsøy NO
Northern Norway
68-70
Nov 1998: 1.6 × 10⁻²
Nov 1998: 7.1 × 10⁻²
Nov 1998: 5.7 × 10⁻²
Nov 1998: 1.1 × 10⁻¹
Nov 1998, mean: 6 × 10⁻²
[148]
Lovozero, Murmansk Oblast, RU;
Kola region, RU
66-69 1.6 (1998) Aug 1998: 4.4 × 10⁻²
Mar 19993: 6.9 × 10⁻²
1995-1998, winter: 9.1 × 10⁻²
[147, 148, 131]
[149]
1Global fallout; 2Chernobyl fallout, mean values, 3Tag for 90Sr: 3.6×10⁻⁴.

365
TABLE 24. ECOLOGICAL ( eco
T2/1
) AND EFFECTIVE ( effT
2/1) HALF-LIFES OF RADIOCAESIUM
IN SEMI-DOMESTIC REINDEER (Derived from data on 137Cs activity concentrations in meat. Short and long components are given as available.)
Ecosystem
eco
T2/1
(y) effT
2/1 (y) Site Period Referen
ce 6 to 15 5-10 [45] Spruce forest/ mountains
5.6 Sweden
9.3 < eco
T <17.4 Northern
4 < eco
T < 4.4 Other
1986/2000 [143]
6 Finnish Lapland 1966/77 [144] Short: 1 to 3;
long: 6 to 8 Finnish Lapland,
three pasture areas 1986/2000 [136]
3.95 ± 0.56 1986/951 autumn 3.63 ± 0.15
Vaga (NO) 1986/981 winter
[148]
6.0 ± 1.7 1986/951 autumn 3.13 ± 0.27
Ostre Namdal (NO) 1986/951 winter
[148]
Short: 1.2; long: 18
Short 1.2; long 11
Kautokeino NO
Short: 2.0; long 18
Short 1.2; long 18
Kola Peninsula, RU
Short: 1.8; long: 16
Short 1.5; long 10
Nenets AO, RU2
[73, 149]
1 No significant decline after the specified period; 2Autonomous Okrug.
The bioavailability of caesium depends on local conditions. The effective half-life typically
varies from 5 to 10 years, but both lower and higher values have been reported [139]. Activity
concentrations of 137
Cs and seasonality are described in [80, 136, 137, 142-144]. The effect of
seasonality on ag
T for 137
Cs in the meat of reindeer is shown in Table 23. Ecological half-lives
of 137
Cs in reindeer are given in Table 24. Values for biological half-life of radiocaesium in
reindeer are given in Table 25. Data for semi-domesticated reindeer show variability in eco
T2/1
that reveals a significant dependence on the type and condition of pastures, and also the need
to consider seasons with their specific values of ag
T .
Caribou (Rangifer tarandus) is the same species as reindeer, and there are seven subspecies.
Caribou lives wild in the arctic tundra, mountain tundra, and northern forests of North
America, Russian Federation, and Scandinavia. The world stock is about 5 million [145].
Caribou is extensively hunted by aboriginals in the central Arctic of northern Canada. Data
for 137
Cs in the muscle samples of caribou of major herds living in Alaska and northern
Canada were compiled from 1960’s to late 1980’s [80]. The effective half-life for a single
injection of 137
Cs to atmosphere was estimated as 6 years. The observed ecological half-life of
8 years was reported to include a contribution from the ongoing fallout over the study period.
Chernobyl-derived 137
Cs contributed 6 to 40% of activity concentrations in muscle of caribou
after spring 1986, varying by region. A best fit for a long-term rate of uptake normalised to
the deposition was 0.68 m2·a
-1·kg
-1 wet weight.

366
TABLE 25. BIOLOGICAL HALF-LIFE OF RADIOCAESIUM IN REINDEER, DAYS
bioT
2/1 (d)Nuclide
AM1 SD Min. Max. Comment Reference
134Cs 8.4 × 10⁻¹ 1.2 × 10⁻¹ - - Fast component
134Cs 1.7 × 101 1.4 - - Slow component
[150]
137Cs - - 2.0 × 101 3.3 × 101 Slow component [151,152]
1Reduced 2–3 fold during summer months as compared to autumn-winter.
4.6 Transfer to moose (Alces alces) and white-tailed deer (Odocoileus virginianus)
Moose, the largest of the cervids, is typical of boreal and mixed deciduous forests of the Northern Hemisphere in temperate and sub-arctic environments. Moose has seven subtypes, one of them is European elk, or moose (Alces alces alces); four types of moose live in North America, and two in northeast Asia. In the Fennoscandian countries, Norway, Sweden, and Finland, are currently found the most productive and heavily harvested moose populations in the world; about 200 000 animals were killed in this area in 2000 [153]. Also, there are substantial stocks in various Baltic countries and Russian Federation.
Moose is the largest mammal in Northern Europe. It stands 2 m high at the withers. Its length can be about 2.8 m. The live weight of an adult buck can be almost 700 kg and of a cow about 350 kg [83].
In Finland, the number of hunted moose per year varied between 60 000 and 80 000 in the early 2000’s. In addition, 20 000 white-tailed deer, a medium-sized cervid, were harvested. Moose and other wild deer species contribute annually 10 million kg of game meat to the diet of the Finnish people, corresponding to 2 kg per capita consumption and 90% of the consumption of game meat [76]. In Sweden, 1.3 kg moose meat and 0.4 kg roe deer meat was consumed per person [129]. Outside the Fennoscandian countries, the intensity of hunting and consumption of game meat are considerably lower.
For moose and other deer, the availability of feed plants, dry matter and nutrient content of the diet, and metabolism change with season. Accumulation of a radionuclide in meat and other tissues varies by intake rate, composition of feed, uptake from the gut and secretion from the body, and most of these factors are not constant throughout the year, particularly when arctic or sub-arctic conditions prevail.
The digestive system of the moose shows physiological changes that are adaptive to the period of rapid and non-selective intake of non-fragmented mature forage [154]. The effect of season should be considered and data specific to the hunting season used when assessments are made of activity concentrations in meat for human consumption.
Moose calves need considerable amounts of fresh plants during their first summer when the body weight is increasing from 8-13 kg up to 120-140 kg in a few months [155]. In winter, the demand for feed by a moose is 10-15 kg of branches or twigs per day. The most heavily consumed species are pine (Pinus sp.) and birch (Betula sp.), but the moose favours most mountain ash (Sorbus rowan), osier (Salix sp.), aspen (Populus tremula), and juniper (Juniperus). In summer, the moose eats mostly leaves of trees and bushes, various grasses,

367
and also large amounts of aquatic plants and plants from mires (horsetail (Equisetum
palustre), yellow water lily (Nuphar luteum), species of the pondweed family (Potamogetonaceae), bogbean (Menyanthes trifoliata).
When plenty of green feed is available in summer, the moose can eat several tens of kilograms during a day. In autumn, the main part of the diet is composed of green parts of bilberry (Vaccinium myrtillys), lingonberry and dwarf birch. Mushrooms can be a seasonal component of the diet of the moose. In addition, the moose may visit oat fields and consume oats and other cultivated plants. White-tailed deer is occasionally given supplementary feeding in sub-arctic conditions in winter.
In Mid-Sweden, during the period July to October, three plant species – rosebay willow herb (Chamaerion angustifolium), birch and bilberry – constitute more than 70 % of the rumen content. The daily intake of food is estimated as 7.5 kg dry weight during July and August, and 6 kg dry weight during September [156]. During fall, deciduous trees, conifers, dwarf shrubs and fungi (in October) provide 137Cs [97].
Because of the varying composition of feed, the 137Cs level in moose throughout the year varies slightly with time and may be highest in autumn due to availability of mushrooms or feeding on mineral-rich wetland vegetation. The aggregated transfer factor Tag with respect to 137Cs in Technical Reports Series No. 364 was Tag = 0.02 m2/kg, FW [45].
In Table 26, data from Fennoscandia suggest a lower value during the hunting season, about 0.01 m2/kg (FW) for adult moose and 0.013-0.02 m2/kg (FW) for calves [43. 65, 157; 158]. The bioavailability of radiocaesium in ecosystems grazed by moose seems to be rather constant and, therefore, the physical half-life determines the effective half-life [97, 98, 158, 43].
TABLE 26. 137Cs AGGREGATED TRANSFER FACTOR Tag (m² kg-1 FW) TO MEAT OF MOOSE (Samples were taken during the hunting seasons, if months are not given.)
Site Year/months of
sampling Number of
samples ag
T , Mean/ST deviation or
range, as indicated Reference
Northern Sweden May1986 to
Apr. 1987
3661 1 × 10⁻² a
adults
2 × 10⁻² a
calves
[157, 158]
Central Sweden,
Harbo
1986-1991 1307 2.1 × 10⁻² b
, (1.8–2.4 × 10⁻²
) c
Calculated as annual means
[97, 160]
Finland, seven sites
1979 121 1.2 × 10⁻² d
; adults
2.0 d calves
[141]
Finland,
nationwide sampling
1986-1996
Adults
Calves
1051
365
9.5 × 10⁻³ b
; 5.8 × 10⁻³ e
1.3 × 10⁻² b
; 8.5 × 10⁻³ e
[65, 43]
– – – 2 × 10⁻² b
; (6 × 10⁻³
–3 × 10⁻²
)c [45]
aDerived with linear regression between ground contamination and activity concentration of caesium-137 in moose; bArithmetic mean; cRange; dGeometric mean and standard deviation (GSD); eStandard deviation of arithmetic mean
However, data for moose, or elk, from Poland show a gradual decline of 137Cs concentrations during 1986–1991, thus implying processes that reduce the bioavailability of 137Cs in soil in regions south of the boreal forest zone [159]. Values of Tag for white-tailed deer are often higher than those for moose (Table 27).

368
TABLE 27. AGGREGATED TRANSFER FACTORS FROM SOIL TO MEAT OF WHITE-TAILED DEER, m2 kg-1 FW
agT
Year/Month Site N GM GSD
Reference
1986 Jun-Aug September
South of Finland
18 9
8.4 × 10⁻³ 2.6 × 10⁻²
1.7 1.5
[43, 82]
4.7 Transfer to wild boar (Sus scrofa)
Wild boar is characterized by a very large area of feeding. Wild boar can cover a distance of 80 kilometres a day to feed and come back to its usual rest area in the evening. Omnivorous, the wild boar changes its diet with the seasons. Nearly totally herbivorous in spring and summer, it behaves mainly as a burrower when grass is rare in winter and feeds on roots, tubers, larva, earthworms, etc. for which the transfers for caesium are much higher. Hence increased levels of contamination (by of the order of 50%) are usually observed from October to March.
Over the first 18 years after the accident in Chernobyl, wild boar exhibited the highest 137Cs contamination of any type of game in Bavaria, Germany; as compared with concentrations in other game: wild boar > roe deer > chamois > deer [121].
In wild boar from Bavaria, Germany, during the years 1986 to 1999, the median activity concentration for each year decreased with eco
T2/1
= (10.5 ± 1.6) years, but the variability within
the year increased to about four orders of magnitude e. g. in 1998 the values varied between 80 kBq kg-1 fresh meat and 2 Bq kg-1 [108].
In Croatia, over the period of 2000 to 2002, in areas with approximately equal contamination levels, 137Cs concentrations in wild boar meat varied by over two orders of magnitude [161]. Hecht [121] and Fielitz [117] have reported on the fungus deer truffle, Elaphomyces
granulatus Fr., which substantially accumulates 137Cs and is dug out from the forest soil by wild boar.
This fungus belongs to Ascomycetes and is considered to be inedible for people, but it was found [93] in the rumens of highly contaminated wild boar from the Bavarian Forest. This fungus was also considered responsible for the high degree of 137Cs contamination in wild boar of southern Germany [162].
In Germany 123,165 wild boars were shot during the hunting year 1982/83, whereas in 2001/02 about 498,640 were shot and the trend is for further increases [117]. Values of Tag for 137Cs from soil to meat of wild boar are listed in Table 28. Ecological half-lives are given in Table 29.
The concentrations of 137Cs in wild boar increased with time from 1987 to 2004 because of its special feeding habits [117, 121] as discussed above.

369
TABLE 28. 137Cs AGGREGATED TRANSFER FACTOR Tag TO MEAT OF WILD BOAR (m² kg-
1 FW)
Site Years after
fallout
N GM GSD Site description Reference
Bodenmais (G) 13/14
2.1 × 10⁻¹
Spruce forest, mean
deposition 98 kBq m-²
at 1.05.1986
Göttingen (G) 13/14
5 × 10⁻⁴
Beech forest
[94]
Sumava
Temelin
(Czech R.)
0/5
9.8 × 10⁻³
Spruce/mountain
Spruce/agriculture
[40]
1 1 4 × 10⁻³
2 4 8 × 10⁻³ 4.6
4 5 3.5 × 10⁻² 2.4
5 12 1.3 × 10⁻² 1.8
6 9 3.9 × 10⁻² 2.2
7 19 2.9 × 10⁻² 3.3
8 15 2.0 × 10⁻² 3.2
9 10 3.7 × 10⁻² 3.1
10 2 4.6 × 10⁻² 1.7
11 5 2.7 × 10⁻² 3.9
12 26 1.4 × 10⁻² 7.0
13 7 2.8 × 10⁻² 3.4
16 11 3.7 × 10⁻² 3.4
Weinsberger forest
(A)
17 12 4.2 × 10⁻² 1.9
Spruce forest, median
deposition 52.2 kBq
m-²
at n = 218 sites,
1.05.1986
2 13 6.7 × 10⁻² 2.8
3 2 4.9 × 10⁻² 3.0
6 1 1.6 × 10⁻¹
Kobernausser
forest (A)
14 1 3.1 × 10⁻²
Spruce forest, median
deposition 48.5 kBq
m-² at n = 20 sites,
1.05.1986
[115]
TABLE 29. ECOLOGICAL HALF-LIFE OF 137Cs IN WILD BOAR MUSCLES IN FOREST AREAS DERIVED FROM DATA FITTED BY A SINGLE EXPONENTIAL [116].
Ecosystem eco
T2/1 y N Site Period Reference
Forest/Fields 10.5 ± 1.6 4077 Bavaria (G) 1987-1999 [108, 118, 121]
no decrease 314 1986-1996 [119, 120]
Spruce no decrease 321 1987-2004 [117]
4.8 Transfer to brown bear (Ursus arctos)
Bear stocks have decreased with time and the species has disappeared from many European
countries, although considerable stocks are still found in the coniferous forest zone of the
Northern hemisphere. The largest stocks are in Russian Federation (36,000), Alaska and
Canada. The bear stock in Finland (1000) is densest in the eastern and south-eastern part of
the country [76, 163]. Bear meat has been surveyed for 137
Cs since the mid-1980’s [144, 146,
164]. The Tag values from deposited radioactivity to meat have been derived using these data
(Table 30).

370
The brown bear is a species of bear that can reach masses of 130–700 kg. Brown bears have a
large hump of muscle over their shoulders, which give strength to the forelimbs for digging.
The normal range of physical dimensions for a brown bear is a head-and-body length of 1.7 to
2.8 m and a shoulder height 90 to 150 cm.
Being omnivores, brown bear feed on a variety of plants and berries including roots or sprouts
and fungi, as well as insects and small mammals; what is eaten depends largely on the time of
year and precise location. The larger bears have been known to prey on large mammals such
as moose, sheep, and caribou. In preparation for winter, bears will gain hundreds of kilograms
of fat before going into a state of false hibernation.
TABLE 30. AGGREGATED TRANSFER FACTORS FOR 137Cs FROM DEPOSITED RADIOACTIVITY TO MEAT OF BEAR (Tag, m
2 kg-1 FW) IN NORTHERNMOST FINLAND
Year of sampling N GM GSD Reference
September1984; May 1985 6 4.3 × 10⁻² 2.2 [144]
May-September 1986
Jun.-September 1987
May-November 1988-2001
9
8
61
7.1 × 10⁻²
6.6 × 10⁻²
4.5 × 10⁻²
1.8
2.4
1.8
[146]
[164]
a Recalculated from primary data.
4.9 Transfer to small game
Activity concentrations and seasonality with respect to 137
Cs concentrations are described in
[98]. Information on the time-dependence of Tag for 137
Cs from soil to meat (or, for waterfowl,
from deposited activity to meat) of small game is given in Table 31. A comparison with
values for roe deer in Table 17 shows a faster decline for the Tag of 137
Cs with time in small
game, particularly in waterfowl. Activity contents of 137
Cs in waterfowl follow the dynamics
of 137
Cs in aquatic ecosystems. Variation in the values of Tag for 137
Cs in waterfowl may be
larger than with other birds because of migration of birds from their summer habitat after the
beginning of hunting in August. Despite the fact that the birds were shot in inland locations,
some birds from the coast of Gulf of Finland or Gulf of Bothnia may be represented in the
data. Brackish water ecosystems result in lower uptake of 137
Cs to aquatic birds than is the
case for freshwater ecosystems.
There is a distinct difference in uptake of caesium between herbivores feeding mostly in
forest and those visiting agricultural fields for feed. Examples that exhibit lower intakes due
to partly or mostly depending on cultivated feed are brown hare and pheasant.
The ecological half-time of 137
Cs was determined for red grouse (Lagopus lagopus scoticus)
living in a heather dominated upland ecosystem [165]. A value of 10-11 days was obtained
for captive birds.
Transfer of radioactive caesium to game animals and reindeer and the rate of activity
reduction, given as ecological half-life, reflect the soil and pasture conditions. In arctic and
subarctic regions there is practically no ecological decrease in activity concentration of 137
Cs
in terrestrial game.

371
TABLE 31. AGGREGATED TRANSFER FACTORS ag
T (m² kg-1 FW) FOR 137Cs FROM SOIL TO
MUSCLES OF SMALL GAME (Samples were taken in Finland during hunting seasons. For certain species, the hunting year may last until Jan-Feb in the next calendar year)
agT , (m2 kg-1 FW) Species or group
Year
Site
Number of samples AM Min. Max Ref.
Arctic hare Brown hare
− −
3 × 10⁻² 4 × 10⁻³
9 x10⁻³ 2 x10⁻³
1 x10⁻¹ 5 x10⁻²
[45]
Willow grouse (Lagopus lagopus) Aug.-Sep. 1986
Northern Finland
31
2.7 × 10⁻²
1.1 × 10⁻²
4.6 × 10⁻²
[144] Black grouse (Tetrao tetrix) 2003
Northern Finland 2
–
1.1 × 10⁻²
1.3 × 10⁻²
[164] Brown hare (Lepus europaeus) 1986
Southern Finland
10
1.1 × 10⁻²
1.6 × 10⁻² (SD)
1988 2 9.1 × 10⁻⁴ 5.4 × 10⁻⁴ 1.3 × 10⁻³
GM GSD Arctic hare (Lepus
timidus) 1986 1988 1989
Southern Finland
11 20 29
2.9 × 10⁻² 2.4 × 10⁻²
3.2 × 10⁻²
1.9 2.4 2.3
Terrestrial birds1 1986 1988 1989 Pheasant (Phasianus colchicus)
1989
Finland 11 16 23
3
8.9 × 10⁻³ 1.6 × 10⁻² 1.2 × 10⁻²
3.2 × 10⁻⁴
2.4 1.7 2.1
1.3 Waterfowl2 1986 1988 1989
Southern Finland 31 6 14
1.3 × 10⁻² 5.3 × 10⁻³ 2.4 × 10⁻³
3.8 5.2 2.8
[43]
Willow grouse 1996-2004
Northern Finland 26
1.5 × 10⁻²
2.1
[164]
1Species in decreasing order of numbers of samples: black grouse (Tetrao tetrix), hazelhen (Bonasia bonasia), wood pigeon
(Columba palumbus), willow grouse (Lagopus lagopus), capercaillie (Tetrao urogallus); 2Species: mallard (Anas
platyrhynchos) (33 samples) and goldeneye (Bucephala clangula) (18 samples).
Forests in temperate and boreal regions differ by soil type and vegetation, and a faster decline
of muscle activity concentration of deer animals occurs in temperate zone. In wild boar the
caesium activity concentration shows no decline because of its special feeding habits. In
waterfowl a relatively fast decline in uptake of 137
Cs has been found, determined by the
dynamics of 137
Cs in aquatic ecosystems.
372
5. CONCLUSIONS
The parameter most widely used to quantify radionuclide transfers to wild foodstuffs in forests is the aggregated transfer coefficient (Tag). This simplistic approach is adopted because of the complexity of transfer pathways in forests. Unlike domestic animals, game animals have complex diets which are difficult to identify because they vary between locations and between seasons.
Edible fungi are an ecologically complex group of organisms which obtain their nutrition from widely different locations and with highly variable rates. Similarly, understorey plants producing edible berries can have complex root distributions which make it difficult to understand exactly where they absorb radionuclides in the soil profile.
The simplicity of the Tag approach may lead to inappropriate application of Tag values in dose assessment calculations. Tag values should only be used in calculations for forest systems in which radionuclide fluxes have stabilized, in the medium to long term. Where effective or ecological half life data are available, Tag values should not be considered to be constant with time. Finally, in all cases Tag values should be considered as a means of carrying out screening calculations, rather than providing a definitive method of calculating transfers in forests under all conditions. Detailed, site-specific dose assessments will require careful consideration of local transfer processes, pathways and rates than Tag values can provide.
The behaviour of radionuclides in forest ecosystems is specific and differs substantially from the agricultural ecosystems. Even if, the importance of radioactive contamination of forests as a significant source of the population exposure is now recognized, most of the data refer to caesium and strontium to a lesser extent. Some limited information is also available for plutonium and other radionuclide. But, practically no other data are available on other radionuclides.
REFERENCES
[1] ALEXAKHIN, R.M., NARYSHKIN M.A., Radionuclide migration in forest biogeocenoses, Nauka, Moscow (1977) (in Russian).
[2] TIKHOMIROV, F.A., SHCHEGLOV A.I., Main investigation results on the forest radioecology in the Kyshtym and Chernobyl accident zones, Science of the Total Environment 157 (1994) 45-57.
[3] TIKHOMIROV, F.A., SHCHEGLOV, A.I., TSVETNOVA, O.B., KLYASHTORIN, A.L., Geochemical migration of radionuclides in forest ecosystems of contaminated area of the Chernobyl NPP, Pochvovedeniye 10 (1990) 41–50 (in Russian).
[4] IPATYEV, V., BULAVIK, I., BAGINSKY, V., GONCHARENKO, G. AND DVORNIK, A., Forest and Chernobyl: Forest ecosystems after the Chernobyl nuclear power plant accident: 1986-1994, Journal of Environmental Radioactivity 42 (1999) 9-38.
[5] SHCHEGLOV A.I., TSVETNOVA O.B., KLYASHTORIN A.L., Biogeochemical migration of man-made radionuclides in forest ecosystems, Moscow Nauka, Moscow (2001) 235 (in Russian).
[6] BELLI., M. (Ed.). SEMINAT Long term dynamics of radionuclides in semi-natural environments: derivation of parameters and modelling. Agenzia Nazionale per la Protezione dell’Ambiente, (2000) 105.
[7] FESENKO S.V., SOUKHOVA N.V., SANZHAROVA N. I., AVILA R., SPIRIDONOV S.I., KLEIN D., LUCOT E. AND BADOT P.M., Identification of processes governing long-term accumulation of 137Cs in forest trees following the Chernobyl accident. Radiat. Environ. Biophys. 40 (2001) 105-113.

373
[8] FOGH., C. L., ANDERSSON, K. G., Dynamic behaviour of 137Cs contamination in trees of the Briansk region, Russia, Science of the Total Environment 269 (2001) 105-115.
[9] GOMMERS, A., THIRY, Y., VANDENHOVE, H., VANDECASTEELE, C. M., SMOLDERS, E. MERCKX, R., Radiocaesium uptake in one-year-old willows planted as short rotation coppice, Journal of Environmental Quality 29 (2000) 1384-1390.
[10] GOOR F. AND THIRY Y., Processes, dynamics and modelling of radiocaesium cycling in a chronosequence of Chernobyl-contaminated Scots pine (Pinus Sylvestris L.) plantations, Science of the Total Environment 325 (2004) 163-180.
[11] HUS, M., KOSUTIC, K. AND LULIC, S., Radioactive contamination of wood and its products. Journal of Environmental Radioactivity 55 (2001) 179-186.
[12] KAUNISTO, S., ARO, L., RANTAVAARA, A., Effect of fertilisation on the potassium and radiocaesium distribution in tree stands (Pinu Sylvestris L.) and peat on a pine mire, Environmental Pollution 117 (2002) 111-119.
[13] MCGEE E.J., SYNNOTT H.J., JOHANSON K.J., FAWARIS B.H., NIELSEN S.P., HORRILL A.D., KENNEDY V.H., BARBAYIANNIS N., VERESOGLOU D.S., DAWSON D.E., COLGAN P.A. AND MCGARRY A.T., Chernobyl fallout in a Swedish spruce forest ecosystem, Journal of Environmental Radioactivity 48 (2000) 59-78.
[14] MELIN J., WALLBERG L. AND SUOMELA J., Distribution and retention of caesium and strontium in Swedish boreal forest ecosystems, The Science of the Total Environment 157 (1994) 93-105.
[15] SENNERBY-FORSSE L., MELIN J., ROSEN K. AND SIREN G., Uptake and distribution of radiocaesium in fast-growing Salix Viminalis L. Journal of Sustainable Forestry 1 (1993) 93-103.
[16] STRANDBERG M., Radiocaesium in a Danish pine forest ecosystem, Science of the Total Environment 157 (1994) 125-132.
[17] STREBL F., GERZABEK M. H., BOSSEW P. AND KIENZL K., Distribution of radiocaesium in an Austrian forest stand, Science of the Total Environment 226 (1999) 75-83.
[18] VON FIRCKS Y., ROSEN K. AND SENNERBY-FORSSE L., Uptake and distribution of 137Cs and 90Sr in Salix Viminalis plants, Journal of Environmental Radioactivity 63 (2002) 1-14.
[19] PLAMBOECK A. H., NYLEN T. GRIP H., Uptake of cations under two different water regimes in a boreal Scots pine forest, Science of the Total Environment 256 (2000) 175-183.
[20] SHCHEGLOV, A.I., Biogeochemistry of anthropogenic radionuclides in forest ecosystems of central part of south-European plain, Doctor of Science Thesis, Moscow State University. Moscow, Moscow, 1997 (in Russian).
[21] ALEXAKHIN, R.M., BULDAKOV, L.A., GUBANOV, V.A. et al., Radiation Accidents, Izdat Publisher, Moscow (2004) 546.
[22] Forests manual, Manual on methods and criteria for harmonized sampling, assessment, monitoring and analysis of the effects of air pollution on forests, Part VIII: Assessment of ground vegetation, (International Co-operative Programme on Assessment and Monitoring of Air Pollution effects on Forests) Last update 2002.
[23] HANNELIUS, S., KUUSELA, K., Finland the country of evergreen forest, Metsäkuva-arkisto Ky, Forssa, (1995) 192.
[24] CAJANDER, A. K., The theory of forest types. Acta Forestalia Fennica 29(3) (1926) 1-108. [25] EUROPEAN ENVIRONMENT AGENCY, European forest types, Categories and types for
sustainable forest management reporting and policy, EEA Technical Report No 9/2006. Office for Official Publications of the European Communities, Luxembourg (2006).
[26] NIMIS., P. L., Radiocaesium in plants of forest ecosystems, Studia Geobotanica 15 (1996) 3-49. [27] WIRTH, E., HIERSCHE, L., KAMMERER, L., KRAJEWSKA, R., KRESTEL, R., MAHLER,
S., RÖMMELT, R., Transfer equations for caesium-137 for coniferous forest understorey plant species, Science of the Total Environment 157 (1994) 163-170.
[28] MOBERG, L., HUBBARD, L., AVILA, R., WALLBERG, L., FEOLI, E., SCIMONE, M., MILESI, C., MAYES, B., IASON, G., RANTAVAARA, A., VETIKKO, V., BERGMAN, R., NYLÉN, T., PALO, T., WHITE, N., RAITIO, H., ARO, L., KAUNISTO, S., GUILLITTE, O., An integrated approach to radionuclide flow in semi-natural ecosystems underlying exposure pathways to man (LANDSCAPE), Final Report, Research Contract no F14P-CT96-0039,
374
European Commission Nuclear Fission Safety Programme, Report SSI: 19. Stockholm: Swedish Radiation Protection Institute, (1999) 104
[29] JOHANSON K.J., NIKOLOVA I. The role of fungi in transfer of 137Cs in the forest ecosystem. Proc of the International Symposium of radioecology 1996 “Ten years terrestrial radioecological research following the Chernobyl accident”. (GERZABECK, M., DESMET G., HOWARD J., et al. – Vienna 1996, p. 259-265.
[30] CLINT G.M., DIGHTON J. Uptake and accumulation of radiocaesium by mycorrhizal and non-mycorrhizal heather plants. New Phytology – 1992, vol. 121, p. 555-561.
[31] DIGHTON J., CLINT G.M., POSKITT J. Uptake and accumulation of 137Cs by grassland soil fungi : a potential pool of caesium immobilization. Mycological researches – 1991, vol. 95, n°9, p. 1052-1056.
[32] KRASNOV V.P., ORLOV A.A., BUZUN V.A., LANDIN V.P., SHELEST Z.M. Applied Radioecology of forest. (KRASNOV V.P. Ed.), Zhytomyr, POLISSYA, 2007. 679 pages.
[33] RANDA Z., BENADA J., HORYNA J., KLAN J., “Mushrooms: significant source of internal contamination by radiocaesium”, (DESMET, G., NASSIMBENI, P., BELLI, M. Eds.), Transfer of Radionuclides in Natural and Semi-natural Environments. Elsevier, London (1990) 169-78.
[34] BARNETT C.L., BERESFORD N.A., SELF P.L., HOWARD B.J., FRANKLAND J.C., FULKER M.J., DODD B.A., MARRIOTT J.V.R., Radiocaesium activity concentrations in the fruit-bodies of macrofungi in Great Britain and an assessment of dietary intake habits, Science of the Total Environment 231 (1999) 67-83.
[35] BATTISTON G.A., DEGETTO S., GERBASI R., SBRIGNADELLO G., Radioactivity in mushrooms in Northeast Italy following the Chernobyl accident, Journal of Environmental Radioactivity 9 (1989) 53-60.
[36] RÖMMELT R., HIERSCHE L., SCHALLER G., WIRTH E., “Influence of soil fungi (basidiomycetes) on the migration of 134+137Cs and 90Sr in coniferous forest soils” (DESMET, G., NASSIMBENI, P., BELLI, M. Eds.), Transfer of Radionuclides in Natural and Semi-natural Environments, Elsevier, London (1990) 152-160.
[37] AMUNDSEN I., GULDEN G., STRAND P., Accumulation and long term behaviour of radiocaesium in Norwegian fungi, Science of the Total Environment 184 (1996) 163-171.
[38] LAMBINON J., FRAITURE A., GASIA M.C., GUILLITTE O., “La radiocontamination des champignons sauvages en Wallonie (Belgique) suite à l'accident de Tchernobyl”, Impact des accidents d'origine nucléaire sur l'environnement. IVe Symposium international de Radioécologie de Cadarache, Centre d'études nucléaires de Cadarache (France), 14-18 mars 1988, tome 2, E 37-44.
[39] BLOCK J.,PIMPL M., “Cycling of radiocaesium in two forest ecosystems in the state of Rhineland-Palatinate”, (DESMET, G., NASSIMBENI, P., BELLI, M. Eds.), Transfer of radionuclides in natural and semi-natural environments, Elsevier, London (1990) 450-458.
[40] SVADLENKOVA M., KONECNY J., SMUTNY V., Model calculation of radiocaesium transfer into food products in semi-natural forest ecosystems in the Czech Republic after a nuclear reactor accident and an estimate of the population dose burden, Environmental Pollution 92 (1996) 173-184.
[41] KENIGSBERG Y.E., BUGLOVA E.E., SHEVCHUK V.E., RENAUD PH., MAUBERT H., Activity in foodstuffs from natural environments and activity changes due to culinary practices: Joint Study Project 5 (JSP-5). Pathway Analysis and Dose Distributions, Final report for the contracts COSU-CT93-0053 and COSU-CT94-0091 of the European Commission: 63-86; (1995).
[42] HORYNA J., RANDA Z., Uptake of radiocaesium and alkali metals by mushrooms, Journal of Radioanalytical and Nuclear Chemistry, 127 (2) (1988) 107-120.
[43] RANTAVAARA A.H., “Transfer of radiocaesium through natural ecosystems to foodstuffs of terrestrial origin in Finland”, (DESMET, G., NASSIMBENI, P., BELLI, M. Eds.), Transfer of Radionuclides in Natural and Semi-natural Environments, Elsevier, London, (1990) 202-209.
[44] MASCANZONI D., “Uptake of 90Sr and 137Cs by mushrooms following the Chernobyl accident”, (DESMET, G., NASSIMBENI, P., BELLI, M. Eds.), Transfer of radionuclides in natural and semi-natural environments, Elsevier, London, (1990) 459-67.

375
[45] INTERNATIONAL ATOMIC ENERGY AGENCY, Handbook of Parameter Values for the Prediction of Radionuclide Transfer in Temperate Environments. Technical Report Series N°364, Vienna (1994).
[46] FESENKO S.V., SOUKHOVA N.V., SANZHAROVA N.I., AVILA R., SPIRIDONOV S.I., KLEIN D., BADOT P.M., 137Cs availability for soil to understory transfer in different types of forest ecosystems, Science of the Total Environment 269 (2001) 87-103.
[47] BAKKEN L.R., OLSEN R.A., “Accumulation of radiocaesium in fruit bodies of fungi”, (DESMET, G., NASSIMBENI, P., BELLI, M. Eds.), Transfer of Radionuclides in Natural and Semi-natural Environments, Elsevier, London (1990) 664-668.
[48] BYRNE A.R., Radioactivity in fungi in Slovenia, Yugoslavia, following the Chernobyl accident, Journal of Environmental Radioactivity 6 (1988) 177-83.
[49] HOVE K., PEDERSEN O., GARMO T.H., HANSEN H.S., STAALAND H., Fungi: a major source of radiocaesium contamination of grazing ruminants in Norway, Health Physics 59 (1990) 189-192.
[50] PIETRZAK-FLIS Z., RADWAN I., ROSIAK L., WIRTH E., Migration of 137Cs in soils and its transfer to mushrooms and vascular plants in mixed forest, Science of the Total Environment 186 (1996) 243-250.
[51] HENRICH E., FRIEDRICH M., HAIDER W., KIENZL K., HIESEL E., BOISITS A., HEKERLE G., “The contamination of large Austrian forest systems after the Chernobyl nuclear reactor accident: studies 1988 and further”, (DESMET, G., NASSIMBENI, P., BELLI, M. Eds.), Transfer of Radionuclides in Natural and Semi-natural Environments, Elsevier, London (1990) 217-25.
[52] ASLANOGLOU X., ASSIMAKOPOULOS P.A., AVERIN V., HOWARD B.J., HOWARD D.C., KARAMANIS D.T., STAMOULIS K., “Impact of the Chernobyl accident on a rural population in Belarus”, (KARAOGLOU, A., DESMET, G., KELLY, G.N., MENZEL, H.G. Eds.), The Radiological Consequences of the Chernobyl Accident, European Commission, Brussels (1996) 363-378.
[53] MIETELSKI J.W., BAEZA A.S., GUILLEN J., BUZINNY M., TSIGANKOV N., GACA P., JASINSKA M., TOMANKIEWICZ E., Plutonium and other alpha emitters in mushrooms from Poland, Spain and Ukraine, Applied Radiation and Isotopes 56 (2002) 717-729.
[54] BAEZA, A., GUILLEN, J., Influence of the soil bioavailability of radionuclides on the transfer of uranium and thorium to mushrooms, Applied Radiation and Isotopes 64 (2006) 1020–1026.
[55] BAEZA, A., GUILLEN, J., BERNEDO, J.M., Soil-fungi transfer coefficients: importance of the location of mycelium in soil and of the differential availability of radionuclides in soil fractions, Journal of Environmental Radioactivity 81 (2005) 89–106.
[56] BAEZA, A., GUILLEN, J., MIETELSKI, J.W., GACA, P., Soil-to-fungi transfer of 90Sr, 239+240Pu, and 241Am, Radiochimica Acta 94 (2006) 75–80.
[57] RÜHM, W., KAMMERER, L., HIERSCHE, L. AND WIRTH, E., The 137Cs/134Cs ratio in fungi as an indicator of the major mycelium location in forest soil, Journal of Environmental Radioactivity 35 (1997) 129-148.
[58] INTERNATIONAL ATOMIC ENERGY AGENCY, Modelling the migration and accumulation of radionuclides in forest ecosystems. IAEA-BIOMASS-1, IAEA, Vienna (2002).
[59] SMITH J., BERESFORD N., Chernobyl catastrophe and consequences, Springer-Praxis books in environmental sciences, Praxis Publishing Ltd, Chichester, UK (2005).
[60] BERESFORD N.A., VOIGT G., WRIGHT S.M., HOWARD B.J., BARNETT C.L., PRISTER B., BALONOV M., RATNIKOV A., TRAVNIKOVA I., GILLETT A.G., et al., Self-help countermeasure strategies for populations living within contaminated areas of Belarus, Russia and the Ukraine, Journal of Environmental Radioactivity 56 (2001) 215-239.
[61] HOWARD B.J., SMOLDERS E., GIL J.M., VOIGT G., STRAND P., CROUT N.M.J., Spatial analysis of vulnerable ecosystems in Europe : Spatial and dynamic prediction of radiocaesium fluxes into European foods (SAVE), Annual report to Commission of the European Communities : January-December 1998. Institute of Terrestrial Ecology, Grange-over-Sands (1999).
[62] KRASNOV V., ORLOV A. Multiyear monitoring of radiocontamination of wild berry plants from the Ericaceae family in Ukraine, Botanica Lithuanica 10(3) (2004) 209-215.

376
[63] KRASNOV V.P., ORLOV A.A. Radioecology of berry plants. Zhytomyr, Volyn’ Publishers (2004 (in Russian).
[64] LUX D., KAMMERER L., RÜHM W., WIRTH E., Cycling of Pu, Sr, Cs and other long living radionuclides in forest ecosystems of the 30-km zone around Chernobyl, Science of the Total Environment 173/174 (1995) 375-384.
[65] RANTAVAARA A.H., Radiation and Nuclear Safety Authority, Finland, Personal communication for IAEA/EMRAS Programme (2006).
[66] HVINDEN, T., LILLEGRAVEN, A., 137Cs and 90Sr in precipitation, soil and animals in Norway, Nature 192 (1962) 1144-1146.
[67] WATSON, D. G., EBERHARDT, L. L., HANSON, W. C., Radioactivity in Alaskan animals and forage plants (THOMSON, R. C., WOODS, S. W., Eds) Hanford Biology Research Annual Report for 1964, BNWL-122, Pacific Northwest Laboratory, Richland WA (1965) 176-180.
[68] WHICKER, F.W., FARRIS, G.C., DAHL, A.H., “Wild deer as a source of radionuclide intake by humans and as indicators of fallout hazards”, Radiation Protection, Part 2. (SNYDER,.W., ABEE, H. H., BURTON, L. K., MAUSHART, R., BENCO, A., DUHAMEL, F., WHEATLEY, B. M., Eds), Oxford, Pergamon Press (1967) 1105-1110.
[69] HOWARD, B.J., BERESFORD, N.A., HOVE, K., Transfer of radiocaesium to ruminants in natural and semi-natural ecosystems and appropriate countermeasures, Health Physics 61 (1991) 715-725.
[70] HOFMANN, R. R., Evolutionary steps of ecophysiological adaptation and diversification of ruminants: a comparative view of their digestive system, Oecologia, 78 (1989) 443-457.
[71] RUDGE, S.A., JOHNSON, M.S., LEAH, R.T., JONES, S.R., Biological transport of radiocaesium in a semi-natural grassland ecosystem, 1. Soils, vegetation and invertebrates, Journal of Environmental Radioactivity 19 (1993) 173-198.
[72] RUDGE, S.A., JOHNSON, M.S., LEAH, R.T., JONES, S.R., Biological transport of radiocaesium in a semi-natural grassland ecosystem. 2. Small mammals. Journal of Environmental Radioactivity 19 (1993) 199-212.
[73] AMAP Assessment 2002, Radioactivity in the Arctic, Arctic Monitoring and Assessment Programme (AMAP), AMAP, Oslo (2004) xi, 100.
[74] SWEDISH HUNTER’S ASSOCIATION, Annual Report for 2003-2004 (in Swedish). [75] STATISTICAL YEARBOOK OF NORWAY 2005, 2005©Statistics Norway. Retrieved from
http://www.ssb.no (2006). [76] GAME AND FISHERIES RESEARCH, Finland, www.rktl.fi & www.RiistaWeb.riista.fi,
(2006). [77] DEUTSCHER JAGDSCHUTZ VERBAND (DJV) Handbuch 2005, Hoffmann Verlag, Mainz,
Germany. [78] WILDFORSCHUNGSSTELLE DES LANDES BADEN-WÜRTTEMBERG, Aulendorf,
www.lvvg-bw.de. [79] JAGDSTATISTIK FÜR ÖSTERREICH, www.weidwerk.at, (2004). [80] MacDONALD, C. R., ELKIN, B. T., TRACY, B. L., Radiocaesium in caribou and reindeer in
northern Canada, Alaska and Greenland from 1958 to 2000, Journal of Environmental Radioactivity 93 (2007) 1-25.
[81] http://europa.eu.int/estatref/info/sdds/en/apro/apro_mt_sm.htm. [82] RANTAVAARA, A., NYGRÉN, T., NYGRÉN, K., HYVÖNEN, T., Radioactivity of game
meat in Finland after the Chernobyl accident in 1986, Report STUK-A62. Radiation and Nuclear Safety Authority (Previous name: Finnish Centre for Radiation and Nuclear Safety), Helsinki (1987).
[83] HUNTERS ASSOCIATION, FINLAND, www. riista.fi (2006). [84] JOKELAINEN, A., PEKKARINEN, M., ROINE, P., MIETTINEN, J. K., The diet of Finnish
Lapps, Zeitschrift für Ernährungswissenschaft 3 (1962)110-117. [85] PLUMMER, G. L., PULLEN, T. M. Jr., PROVOST, E. E., “Caesium-137 and a population of
Georgia white-tailed deer”, Proc. Second National symposium Ann Arbor, Michigan, 1967, CONF-670503 (1967) 609-615.
[86] JENKINS, C. E., HEDLUND, J. D., Fallout radionuclide distribution in the Alaskan Arctic environment–Transport through food chains to man, (NIELSEN, J.M. Ed) Pacific Northwest
377
Laboratory annual report for 1972 to the USAEC Division of Biomedical and Environmental Research. Vol. 2, Pt. 2, BNWL-1751 (1973) 10.
[87] KIRKHAM, M. B., ADRIANO, D. C., COREY, J. C. Comparison of plutonium concentrations in deer from the Southeastern United States and in deer from an integrated nuclear fuel cycle facility, Health Physics 36 (1978) 516-518.
[88] BLANCHARD, R. L., KEARNEY, J. W., Natural radioactivity and 137Cs in Alaskan Caribou and Reindeer samples, Environmental Science and Technology 1 (1967) 932-939.
[89] SEPULCHRE-DE-BIE, C., RONNEAU, C., CARA, J., COLLIN, B., Contamination des reins de chevreuils par le radiocaesium de Tchernobyl, Annales Médecine Vétérinaire. 132 (1988) 497-504.
[90] ZIBOLD, G., DRISSNER, J., KAMINSKI, S., KLEMT, E., MILLER, R., Time-dependency of the radiocaesium contamination of roe deer: measurement and modelling, Journal of Environmental Radioactivity 55 (1) (2001) 5-27.
[91] CEDERLUND, G., LJUNGQVIST, H., MARKGEN, G., STALFELT, F., Foods of moose and roe deer at Grimsö in central Sweden, results of rumen content analysis, Swedisch Wildlife Research 11 (1980) 171–247.
[92] DROZDZ, A., OSIECKI, A., Intake and digestibility of natural feeds by roe-deer, Acta Theriologica 18(3) (1973) 81-90.
[93] FIELITZ, U., Nahrungsspektrum von Reh und Wildschwein im Bayerischen Wald, Radiocäsium in Wald und Wild (HECHT, H., HONIKEL, K.O., Eds) Bundesanstalt für Fleischforschung, Kulmbach, (1997) 65-75.
[94] FIELITZ, U., Überprüfung von Ökosystemen nach Tschernobyl hinsichtlich der Strahlenbelastung der Bevölkerung, Abschlussbericht Forschungsvorhaben StSCH 4206 im Auftrag des BMU (2001), [email protected].
[95] GEBCZYNSKA, Z., Food of roe deer and red deer in the Bialowieza Primeval Forest, Acta Theriologica 25(40) (1980) 487-500.
[96] KESZTHELYI, Z. et al., “Transfer of 137Cs from Chernobyl fallout to meat and milk in Hungary”, Environmental contamination following a major nuclear accident, (FLITTON, S., KATZ, E.W., Eds.) Proc. IAEA Conf. Vienna, IAEA-SM-306/104, Vol.1 (1990) 173-180.
[97] JOHANSON, K.J., BERGSTRÖM, R., Radiocaesium transfer to man from moose and roe deer in Sweden, Science of the Total Environment 157 (1994) 309-316.
[98] JOHANSON, K.J., BERGSTRÖM, R., VON BOTHMER, S., KARLEN, G., “Radiocaesium in wildlife of a forest in central Sweden” Transfer of radionuclides in natural and semi-natural environments (DESMET, G., NASSIMBENI, P., BELLI, M., Eds.) Elsevier, London (1990) 183-93.
[99] KARLÈN, G., JOHANSON, K. J., BERGSTRÖM, R., Seasonal variation in the activity concentration of 137Cs in Swedish roe deer and in their daily intake, Journal of Environmental Radioactivity 14 (1991) 91–103.
[100] KIEFER, P., PRÖHL, G., MÜLLER, H., LINDNER, G., DRISSNER, J., ZIBOLD, G., Factors affecting the transfer of radiocaesium from soil to roe deer in forest ecosystems of Southern Germany. Science of the Total Environment 192 (1996) 49-61.
[101] KREUZER, W., HECHT, H., Radioactivity in Bavarian game from the reactor accident at Chernobyl. Archiv für Lebensmittelhygiene 39 (1988) 57-84.
[102] LINDNER, G., DRISSNER, J., HERRMANN, T., HUND, M., ZECH, W., ZIBOLD, G., ZIMMERER, R., Seasonal and regional variations in the transfer of caesium radionuclides from soil to roe deer and plants in a prealpine forest, Science of the Total Environment 157 (1994) 189-196.
[103] SCHÖNHOFER, F., TATARUCH, F., “Contamination of game in Austria after the Chernobyl accident”. Proc. ESNA XIX (1988) 53-86.
[104] STREBL, F., GERZABEK, M. H., KARG, V., TATARUCH, F., 137Cs migration in soils and its transfer to roe deer in an Austrian forest stand, Science of the Total Environment 181 (1996) 237-247.
[105] TATARUCH, F., SCHÖNHOFER, F., KLANSEK, E., “Studies in levels of radioactivity in wildlife in Austria”, Transfer of radionuclides in natural and semi-natural environments (DESMET, G., NASSIMBENI, P., BELLI, M., Eds.) Elsevier, London (1990) 210-215.

378
[106] TATARUCH, F., SCHÖNHOFER, F., Der Verlauf der Cäsiumbelastung von Rehwild in Niederösterreich von 1986 bis 1992, Conference 23./24. 06. 1992 St. Oswald; in Radiocäsium in Wald und Wild (HONIKEL, K.O., HECHT, H. Eds.) Bundesanstalt für Fleischforschung, Kulmbach, (1993) 153-160.
[107] ZIBOLD, G., GEISSLER, A., KISSLING, S., NIEBUHR, J., WILHELM, C., “Radiocaesium in roe deer from the South of W-Germany”, Proc. The Radioecology of Natural and and Artificial Radionuclides, XVth Regional Congress of IRPA, Visby, Gotland, Sweden, (FENDT W., Ed.), Verlag TÜV Reinland GmbH, Köln, (1989) 268-273.
[108] ZIBOLD, G., KLEMT, E., “Ecological half-time of 137Cs and 90Sr in forest and freshwater ecosystems”, Proc. ECORAD Conference 2004, Aix, France (BARESCUT, J.C., GARIEL, J.C., PÉRES, J. M., Eds.) Radioprotection, Suppl. 1, 40 (2005) S497-S502.
[109] AVILA, R., JOHANSON, K.J., BERGSTRÖM, R., Model of the seasonal variations of fungi ingestion and 137Cs activity concentration in roe deer, Journal of Environmental Radioactivity 46 (1999) 99-112.
[110] JOHNSON, W., NAYFIELD, C.L., Elevated levels of caesium–137 in common mushrooms (Agaricaceae) with possible relationship to high levels of caesium-137 in whitetail deer, 1968-1969, Radiological Health Data Report 11 (1970) 527-531.
[111] STRANDBERG, M., KNUDSEN, H., Mushroom spores and 137Cs in faeces of the roe deer, Journal of Environmental Radioactivity 23 (1994) 189–203.
[112] KLEMT, E., ZIBOLD, G., Datenerhebung zur Radiocäsium-Kontamination im Jahr 2005, Abschlußbericht zum Forschungsvorhaben Nr. 9008714/32 im Auftrag des MUF-BW (2005).
[113] DRISSNER, J., F L Ü G E L , V . , K L E M T , E . , M I L L E R , R . , S C H I C K , G . , Z I B O L D , G . , “Transfer of radiocaesium in prealpine forest ecosystems, In: International Symposium on Ionizing Radiation” Protection of the Natural Environment, Proc. symp. Stockholm, Schweden (1996) 218-223.
[114] FIELITZ, U., Ausbreitung und Transfer von Radiocaesium entlang des Pfades Boden-Pflanze-Reh in zwei unterschiedlichen Ökosystemen. Dissertation Universität Göttingen (1992).
[115] STREBL, F., TATARUCH, F., Time trends (1986-2003) of radiocaesium transfer to roe deer and wild boar in two Austrian forest regions, Journal of Environmental Radioactivity 98 (2007) 137 – 152.
[116] PRÖHL G., EHLKEN, S., FIEDLER, I., KIRCHNER, G.,. KLEMT, E., ZIBOLD, G., Ecological half-lives of 90Sr and 137Cs in terrestrial and aquatic ecosystems, Journal of Environmental Radioactivity 91 (2006) 41-72.
[117] FIELITZ, U., Untersuchungen zum Verhalten von Radiocäsium in Wildschweinen und anderen Biomedien des Waldes, Abschlussbericht Forschungsvorhaben StSch 4324 (2005) im Auftrag des BMU. [email protected].
[118] HECHT, H., Long time trends of the radiocaesium contamination of venison in Germany after the Chernobyl accident, Umweltradioaktivität Radioökologie Strahlenwirkungen, (WINTER, M., WICKE, A., Eds.), Verlag TÜV Rheinland, (1993) 738-743.
[119] HECHT, H., 11 Jahre nach dem Unfall von Tschernobyl – zeitliche Entwicklung der Radiocäsiumkontamination des Wildbrets von 4 Wildarten in Bayern, Radiocäsium in Wald und Wild (HECHT, H., HONIKEL, K.O., Eds), Bundesanstalt für Fleischforschung, Kulmbach (1997) 127-141.
[120] HECHT, H., Raümliche Verteilung der Radiocäsiumkontamination des Wildbrets in Bayern- 10 Jahre nach dem Unfall von Tschernobyl, Radiocäsium in Wald und Wild (HECHT, H., HONIKEL, K.O., Eds) Bundesanstalt für Fleischforschung, Kulmbach (1997) 87-102.
[121] HECHT H., Der lange Schatten von Tschernobyl, Forschungsreport, Senat der Bundesforschungsanstalten (Ed.) ISSN 0931-2277, 23, 1 (2001) 19-23.
[122] MÜLLER, H., PRÖHL, G., ECOSYS-87: A dynamic model for assessing radiological consequences of nuclear accidents, Health Physics 64(3) (1993) 232-252.
[123] COUGHTREY, P. J. and THORNE, M.C. Radionuclide distribution and transport in terrestrial and aquatic ecosystems. A critical review of data. Vol. 1, A.A. Balkema Publishers (1983) 495.
[124] LOWE, P.V., HORRILL, A.D., Ecological half-life of caesium in roe deer (Capreolus Capreolus). Environmental Pollution 54 (1988) 81–87.
[125] VON MOLZAHN, D. et al., Untersuchungen zur biologischen Halbwertszeit von Caesium in Rehwild, Zeitung fuer Jagdwissenschaft 33 (1987) 89–97.

379
[126] SCHÖNHOFER, F., TATARUCH, F., FRIEDRICH M., Strontium-90 in antlers of red deer: an indicator of environmental contamination by strontium-90, Science of the Total Environment 157 (1994) 323-332.
[127] REINDRIFTSFORVALTNINGEN, Totalregnskap 2005 och budget 2006 (Retrieved from www.reindrift.no 16th April 2007.)
[128] JERNSLETTER, J.-L. L., KLOKOV K., Sustainable reindeer husbandry, Arctic Council 2000–2002, Centre for Saami Studies, University of Tromsø (2002) 157.
[129] WIKLUND, E., MALMFORS, G., SLU Fakta Jordbruk 2000 (8). [130] Balance sheet for food commodities 2004 and 2005 (preliminary) (2006), www.mmmtike.fi. [131] TRAVNIKOVA, I. G., SHUTOV, V. N., BRUK, G. YA., BALONOV, M. I., SKUTERUD, L.,
STRAND, P., POGORELY, JU. A., BURKOVA, T. F., Assessment of current exposure levels in different population groups of the Kola Peninsula, Journal of Environmental Radioactivity 60 (2002) 235–248.
[132] HOVE, K., PEDERSEN, O., GARMO, T.H., HANSEN, H.S., STAALAND, H., Fungi: a major source of radiocaesium contamination of grazing ruminants in Norway, Health Physics 59 (1990) 189-192.
[133] GAARE, E., “Lichen content of radiocaesium after the Chernobyl accident in mountains in southern Norway”, Transfer of radionuclides in natural and semi-natural environments (DESMET, G., NASSIMBENI, P., BELLI, M., Eds.) Elsevier, London (1990) 492-501.
[134] ERIKSSON, O., “137Cs in forage plants vital to reindeer (Rangifer Tarandus Taradus L.) in northern Sweden”, Transfer of Radionuclides in Natural and Semi-natural Environments (G. DESMET, P. NASSIMBENI, M. BELLI eds.) Elsevier, London. (1990) 194 – 199.
[135] LIDEN, K., Caesium–137 burden in Swedish Lapplanders and reindeer, Acta Radiologica 56 (1961) 237.
[136] RISSANEN, K., YLIPIETI, J., NISKALA, P., 137Cs concentrations in reindeer meat in the Paistunturi, Ivalo and Kemin Sompio reindeergrazing co-operatives during 1986-2000, In: PAILE, W., Radiation Protection in the 2000s – Theory and Practice, Nordic Society for Radiation Protection. Proceedings of the XIII ordinary meeting. Turku/Åbo, Finland. August 25-29, 2002. STUK-A195. Helsinki (2003) 498-501.
[137] RISSANEN, K., RAHOLA, T., 137Cs concentration in reindeer and its fodder plants, Science of the Total Environment 85 (1989) 199-206.
[138] STAALAND, H., GARMO, T.H., HOVE, K., PEDERSEN, Ø., Feed selection and radiocaesium intake by reindeer, sheep and goats grazing alpine summer habitats in southern Norway, Journal of Environmental Radioactivity 29 (1995) 39-56.
[139] INTERNATIONAL ATOMIC ENERGY AGENCY, Modelling of radionuclide interception and loss processes in vegetation and of transfer in semi-natural ecosystems: Second report of the VAMP terrestrial working group, IAEA-TECDOC-857, IAEA, Vienna, (1996).
[140] SALO, A., SAXÉN, R., PUHAKAINEN, M., Transport of airborne 90Sr and 137Cs deposited in the basins of the five largest rivers in Finland, Aqua Fennica 14(1) (1984) 21-31.
[141] RANTAVAARA, A., Caesium in moose meat in Finland, Suomen Riista 29 (1982) 5-13 (in Finnish with English summary).
[142] AHMAN, B., Effect of bentonite and ammonium-ferric (III)-hexacyanoferrate (II) on uptake and elimination of radiocaesium in reindeer, Journal of Environmental Radioactivity 31 (1996) 29.
[143] AHMAN, B., WRIGHT, S.M., HOWARD, B.J., Effect of origin of radiocaesium on the transfer from fallout to reindeer meat, Science of the Total Environment 278 (2001) 171.
[144] RISSANEN, K., RAHOLA, T., ILLUKKA, E., ALFTHAN, A., Radioactivity of Reindeer, Game and Fish in Finnish Lapland after the Chernobyl accident in 1986, Report STUK-A63, Radiation and Nuclear Safety Authority, Helsinki (1987) 33.
[145] VALKENBERG, P., Alaska Department of Fish and Game’s Notebook Series. Retrieved on 19 March, 2007 from http://www.adfg.state.ak.us/pubs/notebook/biggame/ caribou.php
[146] RISSANEN, K., RAHOLA T., ILLUKKA, E., “Radioactivity in plants and foodstuffs in Lapland 1979-1986”, Studies on environmental radioactivity in Finland in 1986, Report STUK-A55, Annual Report, Helsinki, STUK (1987).
[147] JOINT RUSSIAN-NORWEGIAN EXPERT GROUP FOR INVESTIGATION OF RADIOACTIVE CONTAMINATION IN THE NORTHERN AREAS, Long-term

380
consequences of potential radioactive contamination in the Northern areas: northern Norway and Murmansk Oblast, Summary Report, Stralevern Rapport 2002:5, Osteras: Norwegian Radiation Protection Authority (2002).
[148] SKUTERUD, L., GAARE, E., EIKELMAN, I.M., HOVE, K., STEINNES, E., Chernobyl radioactivity persists in reindeer, Journal of Environmental Radioactivity 83 (2005) 231–252.
[149] GOLIKOV, V., LOGACHEVA, I., BRUK, G., SHUTOV, V., BALONOV, M., STRAND, P., BORGHUIS, S., HOWARD, B., WRIGHT, S., Modelling long-term behaviour of caesium and strontium radionuclides in the Arctic environment and human exposure, Journal of Environmental Radioactivity 74 (2004) 159-169.
[150] HOLLEMAN, D.F., LUICK J.R., WHICKER F.W., Transfer of radiocaesium from lichen to reindeer, Health Physics 21 (1971) 657-666.
[151] NEVSTRUEVA, M. A. , RAMZAEV, P. V., MOISER, A.A., TEPLYKH, L. A., The nature of 137Cs AND 90Sr transport over the Lichen–reindeer–man food chain. In: Åberg, B., Hungate, P. (Eds.) Radioecological concentration Processes, Pergamon Press, London, 1967, pp. 209-215.
[152] EKMAN, L., GREITZ, U., Distribution of radiocesium in reindeer. In: Åberg, B., Hungate, P. (Eds.) Radioecological concentration Processes, Pergamon Press, London, 1967, pp. 655-661.
[153] LAVSUND, S., NYGRÉN, T., SOLBERG E. J., Status of moose populations and challenges to moose management in Fennoscandia, Alces 39 (2003) 109-130.
[154] NYGRÉN, K. F. A., LECHNER-DOLL, M., HOFMANN, R. R., Influence of papillae on post-ruminal regulation of ingesta passage in moose (Alces alces L.), Journal Zoology 254 (2001) 375-380.
[155] NYGRÉN, T., PESONEN, M., Hirvisaaliit ja hirvenlihantuotanto Suomessa vuosina 1964-87 (Moose bag and annual production of moose meat in Finland in 1964-87) Suomen Riista 35 (1989) 128-153 (in Finnish with English summary.)
[156] JOHANSON, K. J., BERGSTRÖM, R., ERIKSSON, O., ERIXON, A., Activity concentration of 137Cs in moose and their forage plants in mid-Sweden, Journal of Environmental Radioactivity 22 (1994) 251-267.
[157] DANELL, K., NELIN, P., WICKMAN, G., 137Caesium in Northern Swedish Moose: The first year after the Chernobyl accident, Ambio 18 (2) (1989) 108-111.
[158] BERGMAN, R., NYLÉN, T., PALO, T., LIDSTRÖM, K., The behaviour of radioactive caesium in a boreal forest ecosystem, In: The Chernobyl fallout in Sweden (MOBERG, L. Ed.), The Swedish Radiation Protection Institute, Stockholm (1991) 425-456.
[159] GRABOWSKI, D., MUSZYNSKI, W., PETRYKOWSKA, M., RUBEL B., SMAGALA, G., LADA, W., Activity of caesium-134 and caesium-137 in game and mushrooms in Poland, Science of the Total Environment 157 (1994) 227-229.
[160] JOHANSON, K.J., BERGSTRÖM, R., Radiocaesium from Chernobyl in Swedish moose, Environmental Pollution 61 (1989) 249-260.
[161] VILIC, M., BARISIC, D., KRALJEVI, P., LULIC, S., 137Cs concentration in meat of wild boars (Sus scrofa) in Croatia a decade and half after the Chernobyl accident, Journal of Environmental Radioactivity 81 (2005) 55–62.
[162] PUTYRSKAYA, V., KLEMT, E., PALIACHENKA, H., ZIBOLD, G., “Accumulation of 137Cs in Elaphomyces granulatus fr. and its transfer to wild boar”, XXXIII ESNA Conference Proc., Viterbo, Italy 27.08.03- 31.08.03 Working Group 3: Soil-to-Plant-Relationships, (MITCHELL, N., LICINA, V., ZIBOLD, G., Eds.) ISSN 1611-9223, Weingarten (2003) 1-5.
[163] SUOMEN LUONTOTIETO, I., Helsinki, Weilin+Göös, 2005, 311-312 (In Finnish). [164] RISSANEN, K., SOLATIE, D., Radiation and Nuclear Safety Authority, Finland, 2006,
unpublished data. [165] MOSS, R., HORRILL, A.D., Metabolism of Radiocaesium in red grouse, Journal of
Environmental Radioactivity 33 (1996) 49-62.
381
RADIONUCLIDE TRANSFER IN ARCTIC ECOSYSTEMS
S.E. PALSSON
Icelandic Radiation Protection Institute, Reykjavík, Iceland
L. SKUTERUD
Norwegian Radiation Protection Authority, Orkanger, Norway
S. FESENKO
International Atomic Energy Agency,
V. GOLIKOV
Institute of Radiation Hygiene, St. Petersburg, Russian Federation
Abstract
Arctic ecosystems show a considerable variability in radionuclide transfer parameters, which can be explained by site-
scpecific factors. The paper provides basic modelling approaches based on usage of agrigated transfer factors that are in used
for radiological assessments in Arctic environments. Parameter values that can be used in environmental models (Tags and
ecological half lives) are provided for 90Sr and 137Cs transfer to lichen and reindeer and to locally produced food products.
1. INTRODUCTION
There are some environments, in particular, the Arctic and Alpine ecosystems where the
behaviour of radionuclides differs from that in a temperate environment and both of them are
very vulnerable to radioactive contamination due to the specific environmental conditions.
Numerous studies have shown that, in terms of radiocaesium transfer to man, the Arctic
ecosystems are much more vulnerable to fallout than temperate ecosystems [1-3]). This is due
to generally higher early, as well as long-term concentrations in the vegetation per unit fallout
than prevalent south of the arctic zones. The rate of litter decomposition is slower in arctic
ecosystems than in ecosystems of temperate regions. Biogeochemical processes are generally
slower, too; hence, a contaminant resides for a longer period in the biota of an arctic
ecosystem. Moreover, high utilisation of semi-natural ecosystems for foodstuffs and local
dietary habits will lead to cumulative doses with significant contributions persisting for a long
time after the initial environmental contamination.
The food chain lichen–reindeer–man has been the main object of study within terrestrial
arctic radioecological research. The high interception by lichen of radionuclides, particularly
radiocaesium, is most important, and is one of the key factors contributing to probably the
most vulnerable arctic food pathway. Lichen represents the main accessible reservoir of
radionuclides in the Arctic environment and 65% of the overall radionuclide burden is
accumulated in the top three cm of lichen which is consumed by reindeer [4]). This results in
the elevated concentrations of 137
Cs and 90
Sr in the food chain ‘lichen–reindeer–reindeer-
herder’ and this phenomenon has been intensively studied in different Arctic regions since the
1960s [1, 5-7]).
Vienna
382
Usually ammonium, which is formed during decomposition of organic matter, is oxidised to
nitrates, but in arctic regions ammonium may not be completely oxidised, leaving it available
for competition with radionuclide cations. Ammonium has a five fold higher affinity than
potassium for illitic adsorption sites; this influences the fixation of caesium in Arctic
ecosystems [2].
Some of these factors provide also great impact on behaviour of radionuclides in Alpine
ecosystems. Alpine ecosystems show a very distinct behaviour with respect to nutrient
cycling and also are very sensitive against contamination due to the specific prevailing
climatic and environmental conditions. So, high altitudes typical for alpine ecosystems,
provide rather cold climatic conditions with high amounts of precipitation, a long-lasting
snow cover and well frozen soils in winter. This results in slow decomposition of soil organic
matter, leading to low pH-values in soil, nutrient deficiency and very specific composition of
plant species [8].
2. ENVIRONMENTAL FACTOR GOVERNING BEHAVIOUR OF RADIONUCLIDES IN
ARCTIC ECOSYSTEMS
The Arctic is more vulnerable to radioactive contamination than temperate regions [1, 9, 10]).
The rates of biogeochemical processes are generally slower in the Arctic; hence, a
contaminant can reside for a longer period in the biota of an arctic ecosystem. High utilisation
of semi-natural ecosystems for foodstuffs is typical in many arctic areas, and agricultural
practises are less intensive than in temperate regions. Local dietary habits can lead to
relatively high doses accumulating over a long time after the initial environmental
contamination. The Arctic is also characterised by a pronounced diversity in environmental
conditions, types of land use and dietary habits. E.g., although reindeer/caribou meat may be
the most vulnerable food product to contamination following a radioactive release,
contamination in cow milk and lamb meat may be a larger problem in some Arctic areas.
Mushrooms, freshwater fish and berries may also be important exposure pathways. Therefore,
care must be taken not to assume that results from one region must be applicable for another.
The concentration in foodstuffs can depend on many factors such as local deposition rates,
soil and vegetation types and availability, dietary preferences of animals and the presence of
forests. Production of some foodstuffs can be highly skewed toward a comparatively small
and atypical part of the region as a whole.
The mechanisms of uptake and transfer of radionuclides to animals and plants in the Arctic
are generally similar to those in other regions. Information on transfer to wild berry species
which are collected in large quantities also in the subarctic and arctic regions is given earlier.
This paper gives a general introduction to the most important food products in the Arctic,
reindeer meat, lamb meat and milk, and focuses on aspects of transfer of radionuclides to
products that are specific to the Arctic region.
For example, the considerable range in observed concentration values of 137
Cs in food
products in the Arctic is given in the AMAP reports [1, 9]. The Nordic countries (Sweden,
Norway, Finland, Iceland and Denmark, including the Faroe Islands) have also cooperated for
many years on radioecological studies within the framework of NKS (Nordic Nuclear Safety
Research). This research has included coordinated studies on the transfer of radionuclides to
cow milk and sheep meat [11, 12].
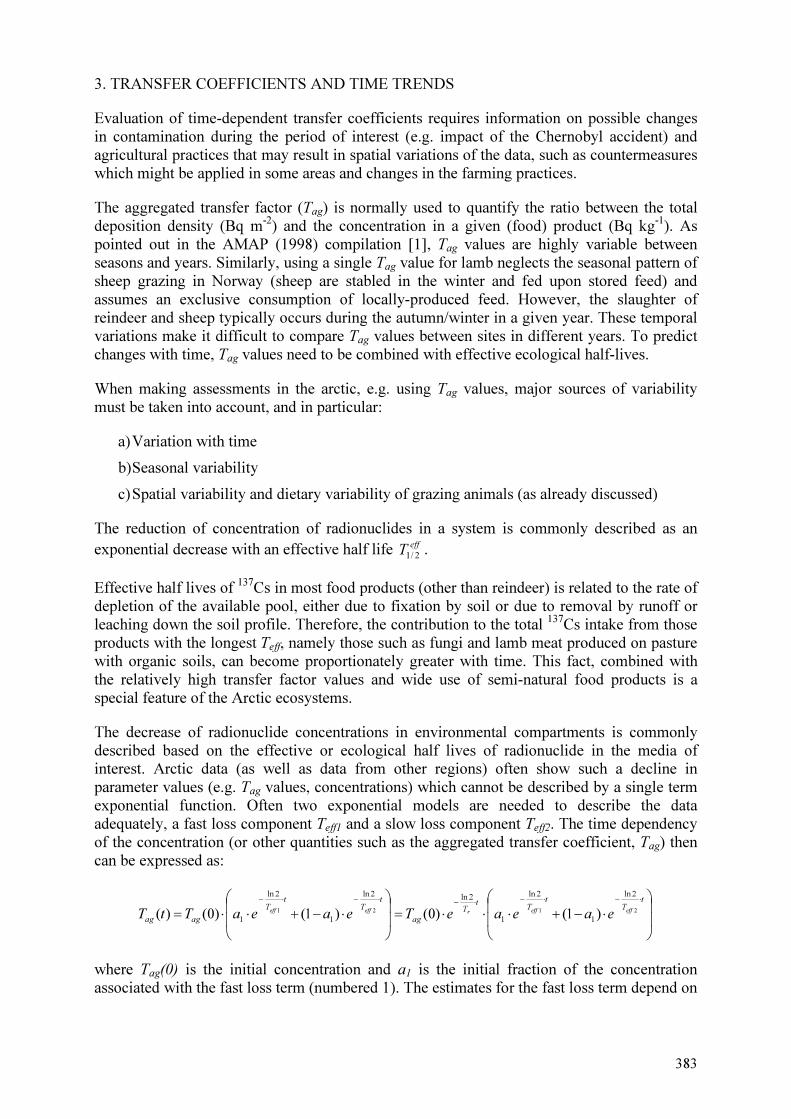
383
3. TRANSFER COEFFICIENTS AND TIME TRENDS
Evaluation of time-dependent transfer coefficients requires information on possible changes in contamination during the period of interest (e.g. impact of the Chernobyl accident) and agricultural practices that may result in spatial variations of the data, such as countermeasures which might be applied in some areas and changes in the farming practices.
The aggregated transfer factor (Tag) is normally used to quantify the ratio between the total deposition density (Bq m-2) and the concentration in a given (food) product (Bq kg-1). As pointed out in the AMAP (1998) compilation [1], Tag values are highly variable between seasons and years. Similarly, using a single Tag value for lamb neglects the seasonal pattern of sheep grazing in Norway (sheep are stabled in the winter and fed upon stored feed) and assumes an exclusive consumption of locally-produced feed. However, the slaughter of reindeer and sheep typically occurs during the autumn/winter in a given year. These temporal variations make it difficult to compare Tag values between sites in different years. To predict changes with time, Tag values need to be combined with effective ecological half-lives.
When making assessments in the arctic, e.g. using Tag values, major sources of variability must be taken into account, and in particular:
a) Variation with time
b) Seasonal variability
c) Spatial variability and dietary variability of grazing animals (as already discussed)
The reduction of concentration of radionuclides in a system is commonly described as an exponential decrease with an effective half life eff
T2/1
.
Effective half lives of 137Cs in most food products (other than reindeer) is related to the rate of depletion of the available pool, either due to fixation by soil or due to removal by runoff or leaching down the soil profile. Therefore, the contribution to the total 137Cs intake from those products with the longest Teff, namely those such as fungi and lamb meat produced on pasture with organic soils, can become proportionately greater with time. This fact, combined with the relatively high transfer factor values and wide use of semi-natural food products is a special feature of the Arctic ecosystems.
The decrease of radionuclide concentrations in environmental compartments is commonly described based on the effective or ecological half lives of radionuclide in the media of interest. Arctic data (as well as data from other regions) often show such a decline in parameter values (e.g. Tag values, concentrations) which cannot be described by a single term exponential function. Often two exponential models are needed to describe the data adequately, a fast loss component Teff1 and a slow loss component Teff2. The time dependency of the concentration (or other quantities such as the aggregated transfer coefficient, Tag) then can be expressed as:
⎟⎟
⎠
⎞
⎜⎜
⎝
⎛⋅−+⋅⋅⋅=⎟
⎟
⎠
⎞
⎜⎜
⎝
⎛⋅−+⋅⋅=
⋅−⋅−
⋅−
⋅−⋅− tT
tT
tT
ag
tT
tT
agag
effeffreffeffeaeaeTeaeaTtT
2121
2ln
1
2ln
1
2ln2ln
1
2ln
1)1()0()1()0()(
where Tag(0) is the initial concentration and a1 is the initial fraction of the concentration associated with the fast loss term (numbered 1). The estimates for the fast loss term depend on

384
the definition of time zero and care must thus be taken when comparing results from different studies.
The value of a1 determines if and how long the fast term is dominant in the decrease. The value of a1 needs to be greater than 0.5 for the fast term to become dominating and the following equation can be used for calculating how long it will be dominating:
2
2/1
1
2/1
1
1
)2ln()2ln(
1ln
TT
a
a
teq
−
⎟⎟⎠
⎞⎜⎜⎝
⎛
−=
It does not matter in the equation whether the fast and slow loss components are described in terms of the effective half life or the ecological one, as the result only depends on the difference between the fast and the slow removal rates.
It can be difficult to get reliable estimates for the environmental half lives, and parameters found to be applicable at one region under given conditions need not be applicable elsewhere and/or under other conditions.
3.1. Radionuclide transfer to lichen and reindeer
Reindeer and caribou are the same species (Rangifer tarandus) and together they have a circumpolar distribution. As described in Chapter 8, there is a potential for high radionuclide concentrations in reindeer, and high consumption of reindeer meat by indigenous population groups in Europe, Asia and Northern America make these people vulnerable to radioactive contamination. General aspects of uptake and metabolism of radionuclides in animals are given in Chapter 6.
Following radioactive contamination of their pastures reindeer and caribou attain higher radionuclide concentrations than other game species because of their extensive intake of lichens during winter. The autumn change towards a lichen diet deficient in mineral elements like potassium is accompanied by a 2-3 fold increase in biological half-life of radiocaesium from about 7 to about 20 days [13-16]. This increase in biological half-life will also contribute significantly to increasing radiocaesium concentrations in reindeer.
3.3.1 Lichens
Lichens have no rooting system and take up nutrients and contamination from air and precipitation. The deposited radionuclides are retained by the lichen and the contamination level is thereafter reduced through dilution by fresh lichen growth, removal by grazing or leaching. Depending on the physical and chemical properties radionuclides may also be translocated to fresh growth. Sr-90 has been found to be more mobile than 137Cs in lichens, and is washed out from lichens more rapidly than 137Cs [17].
Table 1 gives examples of mass interception fractions (fl) estimated for lichens at the Kola Peninsula on the basis of annual data during the period 1961-1999 (see Fig. 1) [18]. In a situation with deposition onto snow (in winter), lichen will only become contaminated during snowmelt, with some of the deposited radioactivity lost via runoff and effectively decreasing the lichen interception fraction. In contrast, if radionuclide deposition occurs as a single pulse dry deposition then the interception fraction may exceed the annual values. If the season when

385
deposition occurs and the type of deposition (dry or wet) are not considered, significant underestimation and overestimation, respectively, can influence radiological assessments [18].
Post-Chernobyl studies of radiocaesium in lichens indicate effective half-lives of 3-6 years [19-22]. These studies do not report decreasing concentrations comparable to a double exponential process. The estimated half-lives in lichens after the Chernobyl fallout are in agreement with estimated half-lives for radiocaesium in reindeer in the same period (see below). The results in Table 1 may therefore not be generally applicable and have to be interpreted with some caution.
TABLE 1. 137Cs AND 90Sr LICHEN MASS INTERCEPTION FRACTIONS (fL, DRY WEIGHT) FOR THE KOLA PENINSULA AND ECOLOGICAL HALF LIVES (T1, T2) FOR THE LICHEN [18]
Radionuclide fl, m2 kg-1 a1
1 Teff1, y Teff2, y
137Cs 1.4 8.0 × 10⁻¹ 2.0 20 90Sr 7 × 10⁻¹ 7.2 × 10⁻¹ 1.0 20
1a1 gives the fraction of the initial concentration in lichen declining with the short half-life T1.
Kola Peninsula
Calendar year
Con
cen
trati
on
of 137C
s, k
Bq
/kg
0.0
0.5
1.0
1.5
2.0
2.5
3.0
3.5
4.0
1959 1964 1969 1974 1979 1984 1989 1994 1999
Reindeer (measurements)
Reindeer (model prediction)
Lichen (model prediction)
Lichen (measurements)
FIG. 1. Time variation of 137
Cs concentrations in lichen and reindeer meat in the Kola peninsula (Russian Federation). the curve is model prediction and symbols are measured values [18].
386
3.3.2. Reindeer
The reindeer diet change from a summer diet of a wide range of plants to a lichen based diet during winter1. This generally causes seasonal variability in contamination levels in reindeer with maximum concentrations during winter. However, the seasonal variability also depends on the variable deposition levels in the various seasonal grazing areas of these nomadic animals. The seasonal variability will also depend on the amount of lichens in the winter diet, which depends on the lichen abundance and availability in the grazing area. Furthermore, in autumn reindeer can eat large quantities of mushrooms and attain radiocaesium levels comparable to those during winter [22, 23]. Estimated Tag values for reindeer are therefore expected to be highly site and season specific.
A particular example is the low transfer to reindeer in Iceland due to consumption of herbaceous vegetation and a species of lichen (Cetaria islandica) less efficient at trapping and retaining radiocaesium than e.g. Cladonia species preferred by reindeer in other regions [24]. Care must also be taken when estimating concentration of radionuclides in free ranging flocks of reindeer moving in a heterogeneous environment.
A study in Iceland showed no significant reduction in 137Cs concentration beyond physical decay during a three decade period, but more than an order of magnitude reduction in concentration in samples from a flock grazing in a different environment one autumn (all samples below 1 Bq kg-1 FW) [9, 24]. In case of relatively uniform deposition, like the nuclear weapons tests fallout, there may be less variability in lichen – reindeer transfer than for food-chains involving variable soil – plant transfer [1]. When assessing initial Tag values for reindeer after single deposition events the above information on variable interception in lichen should also be properly considered.
A review of radionuclide contamination levels in reindeer and caribou due to the nuclear weapons tests fallout is given by AMAP [1]. Maximum 137Cs activity concentrations in reindeer in all Arctic countries were reached in the middle of the 1960s (see example in Fig. 1), and were generally much lower than those observed in central Sweden and Norway due to the higher Chernobyl fallout. Figure 2 gives an example on seasonal variability and long-term trends in 137Cs concentrations in a Swedish reindeer herd in the years after the Chernobyl fallout, whereas Fig. 3 gives similar information for a Norwegian herd.
Reindeer consume lichens during all seasons and reductions in contamination levels in reindeer will therefore follow the reduction of 137Cs in lichens if lichens are much more contaminated than other parts of the reindeer’s diet. Post-Chernobyl observations of faster decline in radiocaesium levels in lichens than in plants lead Gaare and Staaland [3] to hypothesize that the seasonal difference in radiocaesium concentrations in reindeer would decline, and that the concentrations in reindeer during winter would ultimately become lower than during summer. Observations in Norway, exemplified in Fig. 3, illustrates that the seasonal difference has faded out in some reindeer herds. In the Swedish herds studied by Åhman [13] there are still pronounced seasonal variations.
1 See paper ‘Radionuclide transfer in forest ecosystems’ by Calmon et al. in this publication.

387
FIG. 2. Comparison of simulated and observed activity concentrations of
137Cs in reindeer from Vilhelmina
norra reindeer herding district in Sweden. Dots are observed values (each representing 10 or more, mostly
≥30, individual reindeer) and the line is a modelled curve [13].
Vågå
1986 1988 1990 1992 1994 1996 1998 2000 2002 2004 2006 2008
137C
s c
on
sen
tra
tio
n,
Bq
kg-1
0
5000
10000
15000
20000
25000
30000
35000
40000
Summer/autumn
Winter
Single exp., Nov.-Jan.
Double exp., Nov.-Jan.
Single exp., September
FIG. 3. Observed activity concentrations of 137
Cs in reindeer from Vågå reindeer herding districts in
Norway. • indicates observed concentrations during July-October; ο indicates concentrations
observed during November-May. the curves are fitted single and double exponential models to values observed during September and November-January, respectively (see text below and table 3)
(Skuterud, unpublished. results for the period up to 2003 were presented in Skuterud et al. [23]).
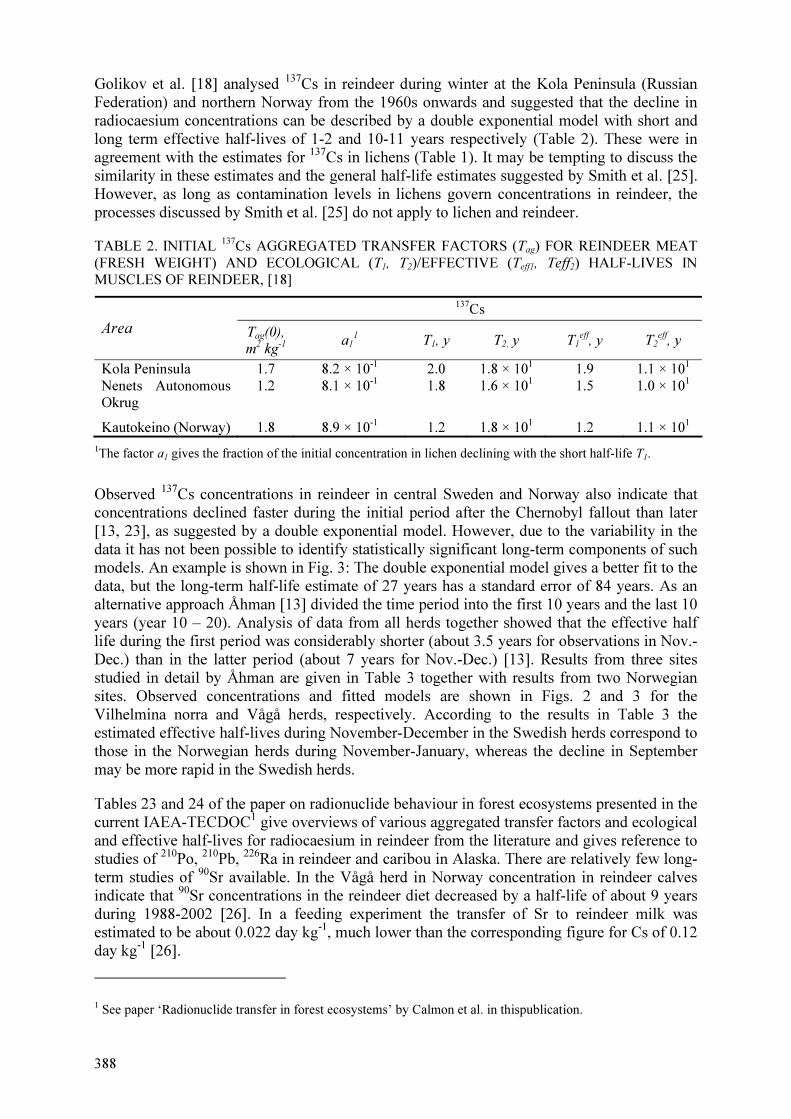
388
Golikov et al. [18] analysed 137Cs in reindeer during winter at the Kola Peninsula (Russian Federation) and northern Norway from the 1960s onwards and suggested that the decline in radiocaesium concentrations can be described by a double exponential model with short and long term effective half-lives of 1-2 and 10-11 years respectively (Table 2). These were in agreement with the estimates for 137Cs in lichens (Table 1). It may be tempting to discuss the similarity in these estimates and the general half-life estimates suggested by Smith et al. [25]. However, as long as contamination levels in lichens govern concentrations in reindeer, the processes discussed by Smith et al. [25] do not apply to lichen and reindeer.
TABLE 2. INITIAL 137Cs AGGREGATED TRANSFER FACTORS (Tag) FOR REINDEER MEAT (FRESH WEIGHT) AND ECOLOGICAL (T1, T2)/EFFECTIVE (Teff1, Teff2) HALF-LIVES IN MUSCLES OF REINDEER, [18]
137Cs Area Tag(0),
m2 kg
-1
a11 T1, y T2, y T1
eff, y T2eff, y
Kola Peninsula 1.7 8.2 × 10⁻¹ 2.0 1.8 × 101 1.9 1.1 × 101 Nenets Autonomous Okrug
1.2 8.1 × 10⁻¹ 1.8 1.6 × 101 1.5 1.0 × 101
Kautokeino (Norway) 1.8 8.9 × 10⁻¹ 1.2 1.8 × 101 1.2 1.1 × 101 1The factor a1 gives the fraction of the initial concentration in lichen declining with the short half-life T1.
Observed 137Cs concentrations in reindeer in central Sweden and Norway also indicate that concentrations declined faster during the initial period after the Chernobyl fallout than later [13, 23], as suggested by a double exponential model. However, due to the variability in the data it has not been possible to identify statistically significant long-term components of such models. An example is shown in Fig. 3: The double exponential model gives a better fit to the data, but the long-term half-life estimate of 27 years has a standard error of 84 years. As an alternative approach Åhman [13] divided the time period into the first 10 years and the last 10 years (year 10 – 20). Analysis of data from all herds together showed that the effective half life during the first period was considerably shorter (about 3.5 years for observations in Nov.-Dec.) than in the latter period (about 7 years for Nov.-Dec.) [13]. Results from three sites studied in detail by Åhman are given in Table 3 together with results from two Norwegian sites. Observed concentrations and fitted models are shown in Figs. 2 and 3 for the Vilhelmina norra and Vågå herds, respectively. According to the results in Table 3 the estimated effective half-lives during November-December in the Swedish herds correspond to those in the Norwegian herds during November-January, whereas the decline in September may be more rapid in the Swedish herds.
Tables 23 and 24 of the paper on radionuclide behaviour in forest ecosystems presented in the current IAEA-TECDOC1 give overviews of various aggregated transfer factors and ecological and effective half-lives for radiocaesium in reindeer from the literature and gives reference to studies of 210Po, 210Pb, 226Ra in reindeer and caribou in Alaska. There are relatively few long-term studies of 90Sr available. In the Vågå herd in Norway concentration in reindeer calves indicate that 90Sr concentrations in the reindeer diet decreased by a half-life of about 9 years during 1988-2002 [26]. In a feeding experiment the transfer of Sr to reindeer milk was estimated to be about 0.022 day kg-1, much lower than the corresponding figure for Cs of 0.12 day kg-1 [26].
1 See paper ‘Radionuclide transfer in forest ecosystems’ by Calmon et al. in thispublication.
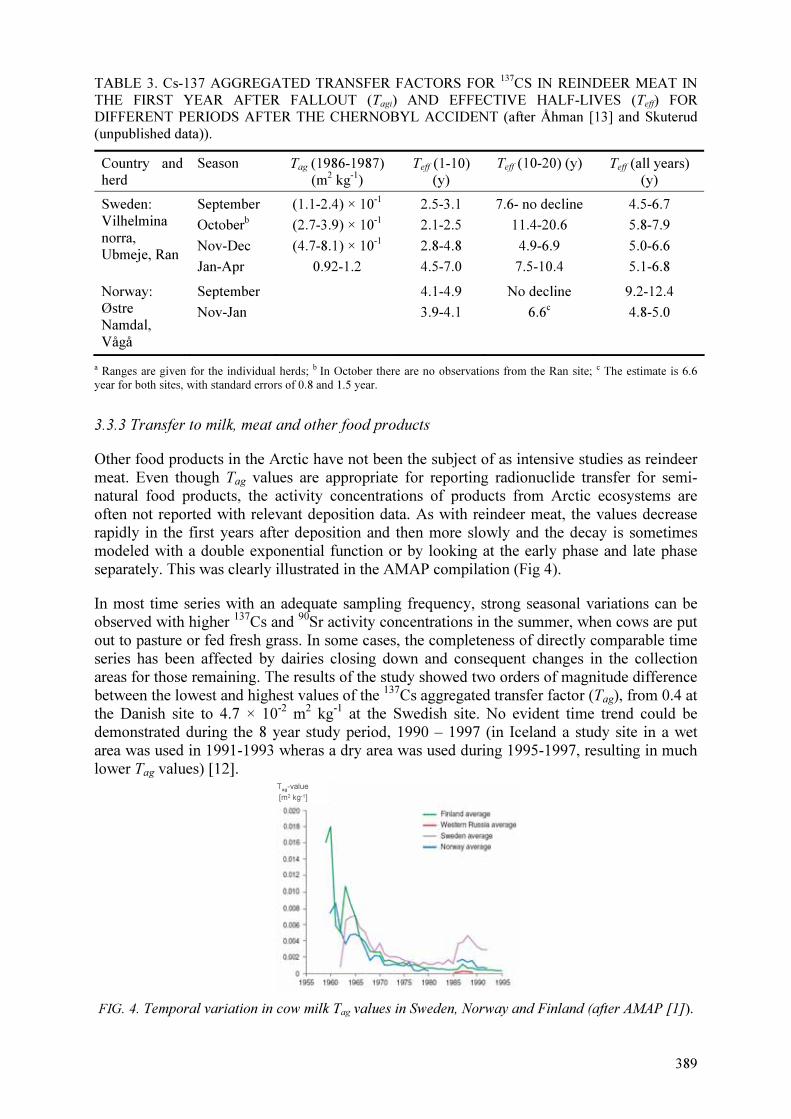
389
TABLE 3. Cs-137 AGGREGATED TRANSFER FACTORS FOR 137CS IN REINDEER MEAT IN THE FIRST YEAR AFTER FALLOUT (Tagi) AND EFFECTIVE HALF-LIVES (Teff) FOR DIFFERENT PERIODS AFTER THE CHERNOBYL ACCIDENT (after Åhman [13] and Skuterud (unpublished data)).
Country and herd
Season Tag (1986-1987) (m2 kg-1)
Teff (1-10) (y)
Teff (10-20) (y) Teff (all years) (y)
Sweden: Vilhelmina norra, Ubmeje, Ran
September
Octoberb
Nov-Dec
Jan-Apr
(1.1-2.4) × 10-1
(2.7-3.9) × 10-1
(4.7-8.1) × 10-1
0.92-1.2
2.5-3.1
2.1-2.5
2.8-4.8
4.5-7.0
7.6- no decline
11.4-20.6
4.9-6.9
7.5-10.4
4.5-6.7
5.8-7.9
5.0-6.6
5.1-6.8
Norway: Østre Namdal, Vågå
September
Nov-Jan
4.1-4.9
3.9-4.1
No decline
6.6c
9.2-12.4
4.8-5.0
a Ranges are given for the individual herds; b In October there are no observations from the Ran site; c The estimate is 6.6
year for both sites, with standard errors of 0.8 and 1.5 year.
3.3.3 Transfer to milk, meat and other food products
Other food products in the Arctic have not been the subject of as intensive studies as reindeer meat. Even though Tag values are appropriate for reporting radionuclide transfer for semi-natural food products, the activity concentrations of products from Arctic ecosystems are often not reported with relevant deposition data. As with reindeer meat, the values decrease rapidly in the first years after deposition and then more slowly and the decay is sometimes modeled with a double exponential function or by looking at the early phase and late phase separately. This was clearly illustrated in the AMAP compilation (Fig 4).
In most time series with an adequate sampling frequency, strong seasonal variations can be observed with higher 137Cs and 90Sr activity concentrations in the summer, when cows are put out to pasture or fed fresh grass. In some cases, the completeness of directly comparable time series has been affected by dairies closing down and consequent changes in the collection areas for those remaining. The results of the study showed two orders of magnitude difference between the lowest and highest values of the 137Cs aggregated transfer factor (Tag), from 0.4 at the Danish site to 4.7 × 10⁻² m2 kg-1 at the Swedish site. No evident time trend could be demonstrated during the 8 year study period, 1990 – 1997 (in Iceland a study site in a wet area was used in 1991-1993 wheras a dry area was used during 1995-1997, resulting in much lower Tag values) [12].
Tag
-value
[m2 kg-1]
Tag
-value
[m2 kg-1]
FIG. 4. Temporal variation in cow milk Tag values in Sweden, Norway and Finland (after AMAP [1]).

390
Unlike for reindeer, the dominant mechanism for lowering the rate for transfer to milk is
fixation of radiocaesium in the soil, type of fodder and its sources can also be important
sources. Much of the fodder is likely to be produced locally, concentrates, however, may have
been imported.
Tables 4 and 5 give available data on Tag values (for early and late periods after the
depositions) and appropriate information on variability of the effective ecological half lives in
milk.
Similar effective half lives were also found in a Nordic NKS study using 137
Cs and 90
Sr time
series (the oldest starting in 1959) from Denmark, the Faroe Islands and Finland [27]. The fast
component of the effective half life was around 1 year for both radionuclides. The slow
component for 137
Cs was 6-7 years for the nuclear weapons testing fallout whereas there was
considerable geographical variation in the post-Chernobyl period: around 7 years for the
Danish Islands to 13 years for western Finland. The slow component for 90
Sr showed also
considerable variation, from around 4 years in the Faroe Islands to around 12 years in Finland
(Kursu).
A recent study in Iceland using data from 2001-2004 gave 137
Cs geometric mean Tag values to
milk, ranging from 0.00073 – 0.0012 m2 kg
-1 [28]. Estimated values for 1966 were, however,
in the range 0.0024 – 0.01 m2 kg
-1, which in agreement with values recommend in Table 2 for
Tag(0).
Although, it is not feasible to estimate Tag(0) and effective half lives from these values, they
do not contradict the estimates for the parameters given earlier.
TABLE 4.SUMMARY OF Tag VALUES FOR COW MILK, m2 kg
-1 FW
Phase Region Year(s) Tag Reference
Early period (Tag(0))
Fennoscandia and NW Russian Federation 1.0 × 10⁻² [29]
Arctic regions (esp. Norway) 1.0 × 10⁻² [30]
Finnmark (Norway) 2.0 × 10⁻² [1]
Troms (Norway) 9.0 × 10⁻³ [1]
Nordland (Norway) 1.4 × 10⁻² [1]
Iceland 1965 7.6 × 10⁻³ (Palsson, unpublished)
Late period
Lovozero (Russian Federation) 1998-1999 0.24 × 10⁻³ [31]
Kola region (Russian Federation) 1998-1999 0.15 × 10⁻³ [31]
Kola region (Russian Federation) 1974-1978 0.14 × 10⁻³ [2]
Nenets AO (Russian Federation) 1974-1978 0.12 × 10⁻³ [2]
Kola region (Russian Federation) 1978-1985 0.082 × 10⁻³ [2]
Nenets AO (Russian Federation) 1978-1985 0.062 × 10⁻³ [2]
Iceland 2001-2004 1.1 x 10⁻³ (Palsson, unpublished)

391
TABLE 5. EFFECTIVE HALF-LIVES VALUES (YEARS, AM±SD) FOR 137Cs AND
90Sr
ACTIVITY CONC. IN MILK FROM VARIOUS ARCTIC AREAS ([9])
Area/Source Nuclide Sites
Faroe Islands Klaksvik Tỏrshavn Tvǿroyri
AM SD AM SD AM SD
Global fallout 137Cs Teff1 1.5 1 × 10⁻¹ 1.0 1 × 10⁻¹ 1.8 2 × 10⁻¹
137Cs Teff2 7.1 5 × 10⁻¹ 6.5 4 × 10⁻¹ 8.8 7 × 10⁻¹
Chernobyl
fallout
137Cs Teff 1.3 1 × 10⁻¹ 1.8 1 × 10⁻¹ 1.8 2 × 10⁻¹
90Sr Teff1 1.0 1 × 10⁻¹ 1.4 1 × 10⁻¹
90Sr Teff2 5.2 1 × 10⁻¹ 5.5 1 × 10⁻¹
Finland Apukka Kusu Rovaniemi
AM SD AM SD AM SD
Global fallout 137Cs Teff1 1.0 1 × 10⁻¹
137Cs Teff2 4.5 7 × 10⁻¹
Chernobyl
fallout
137Cs Teff 0.7 1 × 10⁻¹ 3.4 1 × 10⁻¹
90Sr Teff1 1.3 1 × 10⁻¹
90Sr Teff2 8.4 3 × 10⁻¹
Norway Bodǿ Vadsǿ Mǎlselv Kautokeino
AM SD AM SD AM SD AM SD
Global fallout 137Cs Teff1 1.9 6 × 10⁻¹ 1.6 4 × 10⁻¹ 1.5 3 × 10⁻¹ 1.1 3 × 10⁻¹
137Cs Teff2 4.5 1.2 5.1 1.3 6.1 1.2 6.0 2.0
Chernobyl
fallout
137Cs Teff
90Sr Teff1 1.8 6 × 10⁻¹ n.a.1 n.a. 1.5 4 × 10⁻¹
90Sr Teff2 4.0 1.0 n.a. n.a. 4.6 1.3
Sweden Tärnaby Vittiangi
AM SD AM SD
Global fallout 137Cs Teff1 1.4 4 × 10⁻¹ 1.8 6 × 10⁻¹
137Cs Teff2 9.1 1.1 6.2 1.0
Chernobyl
fallout
137Cs Teff
90Sr Teff1 3.0 1.0 1.4 3 × 10⁻¹
90Sr Teff2 9.0 2.0 8.5 1.0
1n.a. – no statistically valid half-life could be calculated.
Information on some other food products, based on extensive literature search is given in
Table 6 [30]. Transfer values and effective half-lives were preferentially based on Arctic data,
and especially on data derived from Norway.
The reference values given in Table 6 for cow milk suggest that the slow removal process is
associated with 20% of the initial value. The values in Table 4 are generally lower and
Table 4 indicates faster removal processes. The corresponding reference value for sheep meat
suggests that all the reduction is associated with a relatively fast process of a 7.6 year
effective ecological half life and this seems to agree well with results from some of the study
sites in the NKS study, whereas other (e.g. in Sweden and Iceland) clearly seem to have a
slower removal process. A compilation of Tag values for lamb meat is shown in Fig. 5 and
average values for the first years are given in Table 7.
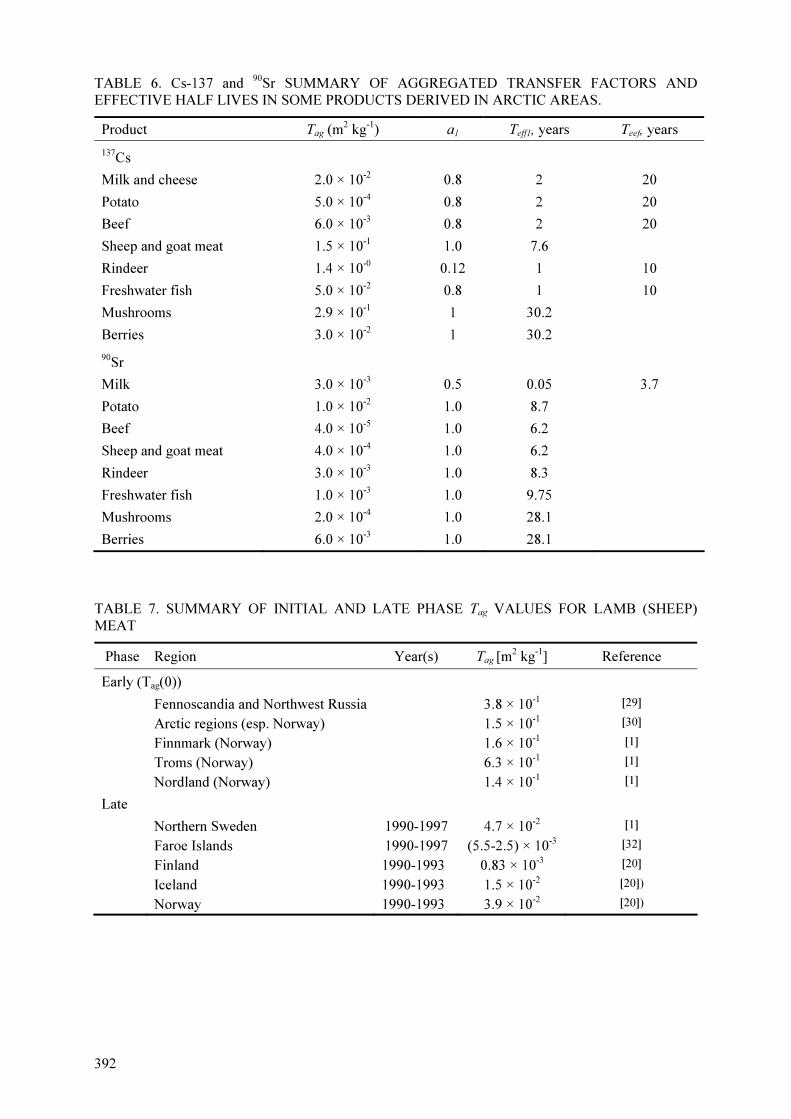
392
TABLE 6. Cs-137 and 90Sr SUMMARY OF AGGREGATED TRANSFER FACTORS AND
EFFECTIVE HALF LIVES IN SOME PRODUCTS DERIVED IN ARCTIC AREAS.
Product Tag (m2 kg
-1) a1 Teff1, years Teef, years
137Cs
Milk and cheese 2.0 × 10⁻²
0.8 2 20
Potato 5.0 × 10⁻⁴
0.8 2 20
Beef 6.0 × 10⁻³
0.8 2 20
Sheep and goat meat 1.5 × 10⁻¹
1.0 7.6
Rindeer 1.4 × 10-0
0.12 1 10
Freshwater fish 5.0 × 10⁻²
0.8 1 10
Mushrooms 2.9 × 10⁻¹
1 30.2
Berries 3.0 × 10⁻²
1 30.2
90Sr
Milk 3.0 × 10⁻³
0.5 0.05 3.7
Potato 1.0 × 10⁻²
1.0 8.7
Beef 4.0 × 10⁻⁵
1.0 6.2
Sheep and goat meat 4.0 × 10⁻⁴
1.0 6.2
Rindeer 3.0 × 10⁻³
1.0 8.3
Freshwater fish 1.0 × 10⁻³
1.0 9.75
Mushrooms 2.0 × 10⁻⁴
1.0 28.1
Berries 6.0 × 10⁻³
1.0 28.1
TABLE 7. SUMMARY OF INITIAL AND LATE PHASE Tag VALUES FOR LAMB (SHEEP)
MEAT
Phase Region Year(s) Tag [m2 kg
-1] Reference
Early (Tag(0))
Fennoscandia and Northwest Russia 3.8 × 10⁻¹
[29]
Arctic regions (esp. Norway) 1.5 × 10⁻¹
[30]
Finnmark (Norway) 1.6 × 10⁻¹
[1]
Troms (Norway) 6.3 × 10⁻¹
[1]
Nordland (Norway) 1.4 × 10⁻¹
[1]
Late
Northern Sweden 1990-1997 4.7 × 10⁻²
[1]
Faroe Islands 1990-1997 (5.5-2.5) × 10-3
[32]
Finland 1990-1993 0.83 × 10⁻³
[20]
Iceland 1990-1993 1.5 × 10⁻²
[20])
Norway 1990-1993 3.9 × 10⁻²
[20])
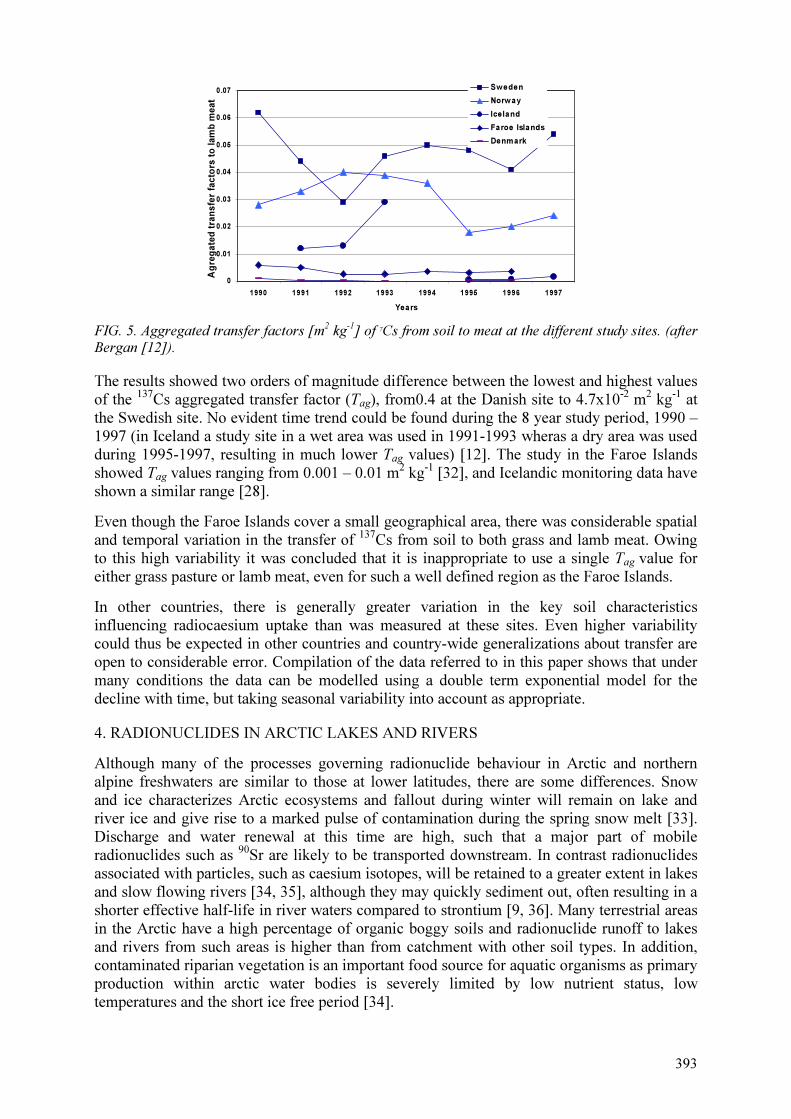
393
0
0.01
0.02
0.03
0.04
0.05
0.06
0.07
1990 1991 1992 1993 1994 1995 1996 1997
Years
A
gre
ga
ted
tra
ns
fer
fac
tors
to
la
mb
me
at
Sweden
Norw ay
Iceland
Faroe Islands
Denmark
FIG. 5. Aggregated transfer factors [m2 kg
-1] of 7Cs from soil to meat at the different study sites. (after
Bergan [12]).
The results showed two orders of magnitude difference between the lowest and highest values
of the 137
Cs aggregated transfer factor (Tag), from0.4 at the Danish site to 4.7x10⁻²
m2 kg
-1 at
the Swedish site. No evident time trend could be found during the 8 year study period, 1990 –
1997 (in Iceland a study site in a wet area was used in 1991-1993 wheras a dry area was used
during 1995-1997, resulting in much lower Tag values) [12]. The study in the Faroe Islands
showed Tag values ranging from 0.001 – 0.01 m2 kg
-1 [32], and Icelandic monitoring data have
shown a similar range [28].
Even though the Faroe Islands cover a small geographical area, there was considerable spatial
and temporal variation in the transfer of 137
Cs from soil to both grass and lamb meat. Owing
to this high variability it was concluded that it is inappropriate to use a single Tag value for
either grass pasture or lamb meat, even for such a well defined region as the Faroe Islands.
In other countries, there is generally greater variation in the key soil characteristics
influencing radiocaesium uptake than was measured at these sites. Even higher variability
could thus be expected in other countries and country-wide generalizations about transfer are
open to considerable error. Compilation of the data referred to in this paper shows that under
many conditions the data can be modelled using a double term exponential model for the
decline with time, but taking seasonal variability into account as appropriate.
4. RADIONUCLIDES IN ARCTIC LAKES AND RIVERS
Although many of the processes governing radionuclide behaviour in Arctic and northern
alpine freshwaters are similar to those at lower latitudes, there are some differences. Snow
and ice characterizes Arctic ecosystems and fallout during winter will remain on lake and
river ice and give rise to a marked pulse of contamination during the spring snow melt [33].
Discharge and water renewal at this time are high, such that a major part of mobile
radionuclides such as 90
Sr are likely to be transported downstream. In contrast radionuclides
associated with particles, such as caesium isotopes, will be retained to a greater extent in lakes
and slow flowing rivers [34, 35], although they may quickly sediment out, often resulting in a
shorter effective half-life in river waters compared to strontium [9, 36]. Many terrestrial areas
in the Arctic have a high percentage of organic boggy soils and radionuclide runoff to lakes
and rivers from such areas is higher than from catchment with other soil types. In addition,
contaminated riparian vegetation is an important food source for aquatic organisms as primary
production within arctic water bodies is severely limited by low nutrient status, low
temperatures and the short ice free period [34].
394
Lakes and rivers at northern latitudes are typically nutrient poor and have a low biomass. This increases the uptake of radionuclides in the food chain, compared to more eutrophic lowland freshwaters. This has been particularly apparent with caesium and strontium, analogues of potassium and calcium, respectively. This is reflected in the inverse relationship between radioactivity activity concentrations in fish and the respective concentrations of potassium and calcium in lake waters [37, 38]. Thus, radionuclide activity concentrations can be higher and effective half-lives longer in the Arctic and northern alpine areas [9, 34, 39, 40].
In addition to atmospheric fallout, the headwaters of many Arctic rivers, such as the Yenisey, Ob and Lena have been directly contaminated by nuclear processing facilities and levels well above background are still being measured even near the river mouth [9].
5. CONCLUSIONS
Arctic ecosystems show a considerable variability of radioecological parameters, which can be explained by seasonal effects, small-scale heterogeneity in soil and climate parameters, and specific habits of free-ranging animals. Nevertheless, the use of aggregated transfer factors seems to be the most practical approach for the prediction of contamination levels in food-products from such environments. Also, the long-term development of radionuclide concentration in food-stuffs can be estimated by two-fold exponential models.
In Arctic environments, the greatest amount of presently accumulated data for 90Sr and 137Cs belongs to the period of global deposition, i.e. deposition that lasted for many years though with time-varying intensity. In spite of the fact that significant levels of the naturally-occurring radioactive isotopes such as 210Po and 210Pb were found in northern Canada, Alaska and Russian Federation, information for radionuclides other than 90Sr and 137Cs is rather sparse and cannot readily be used for predictive purposes.
According to current literature, arctic ecosystems are especially sensitive to climate change phenomena. Increase of temperature will also influence all other driving factors like the organic matter decay velocities, vertical migration of radionuclides, plant uptake etc. Therefore, the radioecological future of arctic regions cannot be predicted with high accuracy and further investigation of processes for the distribution of radionuclides in food-chains of such ecosystems is recommended.
REFERENCES
[1] ARCTIC MONITORING AND ASSESSMENT PROGRAMME, AMAP Assessment Report: Arctic Pollution Issues, Arctic council, Oslo (1998) 859 pp.
[2] BORGHUIS, A.M., LILAND, A., STRAND, P. (Eds.), Arctic Vulnerability to Radioactive Contamination), Final Report (Contract number: IC15-CT98-0201), Norwegian Radiation Protection Authority, Oslo, 2002.
[3] GAARE, E., STAALGARD, H., “Pathways of fallout radiocaesium via reindeer to man”, Nordic Radioecology: The Transfer of Radionuclides through Nordic Ecosystems to Man (DAHLGAARD, H., Ed.), Elsevier Science B.V. Studies in Environmental Science 62, Amsterdam (1994) 303-334.
[4] LIDÉN, K., GUSTAFSSON, M.,. “Relationship and seasonal variation of 137Cs in lichen, reindeer and man in northern Sweden 1961 to 1965”, Radioecological Concentration Processes, Pergamon Press, Oxford (1967) p.193.
[5] RAMZAEV, P.V. Hygienic investigation of radiation situation in the Far North of the USSR attributed to the global fallout, Dissertation of doctor of medical science, Institute of Radiation Hygiene, Leningrad (1967) (in Russian).
[6] ÅHMAN, B., ÅHMAN, G., Radiocaesium in Swedish reindeer after the Chernobyl fallout: Seasonal variations and long-term decline, Health Physics 66(5) 1994. 503-512.
395
[7] AARKROG, A., DAHLGAARD, H., et al., Environmental radioactive contamination in Greenland: a 35 years retrospect., The Science of the Total Environment 245(1-3) (2000) 233-248.
[8] FRISSEL, M., NOORDIJK, H., VAN BERGEIJK, K.E., “The impact of extreme environmental condition, as occurring in natural ecosystems, on the soil-to-plant transfer of radionuclides”, Transfer of Radionuclides in Natural and Semi-natural Environments (DESMET, G., NASSIMBENI, P., BELLI, M. Eds.) Elsevier, Amsterdam (1990) 40-47.
[9] ARCTIC MONITORING AND ASSESSMENT PROGRAMME, AMAP Assessment 2002: Radioactivity in Arctic, Arctic council, Oslo (2004) 100 pp.
[10] STRAND, P., BALONOV, M., BEWERS, M., HOWARD, B.J., TSATUROV, Y.S., SALO, A., AARKROG, A. (Eds.), Arctic Pollution Issues. Radioactive Contamination, A Report from an International Expert Group to the Arctic Monitoring and Assessment Programme. Norwegian Radiation Protection Authority, Oslo (1997) 160 pp.
[11] HOVE, K., LÖNSJÖ, H., ANDERSSON, I., SORMUNEN-CRISTIAN, R., SOLHEIM H., et al., ”Radiocaesium transfer to grazing sheep in Nordic environments”, Nordic Radioecology: The Transfer of Radionuclides through Nordic Ecosystems to Man (DAHLGAARD, H., Ed.), Elsevier Science B.V. Studies in Environmental Science 62, Amsterdam (1994) 211-227.
[12] BERGAN, T. (Ed.), Ecological Half-Lives of Radioactive Elements in Semi-Natural Systems. NKS, Risø National Laboratory NKS(97)FR5, Roskilde (2000) 218 pp.
[13] ÅHMAN, B., Modelling radiocaesium transfer and long-term changes in reindeer, Journal of Environmental Radioactivity 98(1-2) (2007) 153-165.
[14] HOLLEMAN, D.F., LUICK, J.R., et al., Transfer of Radiochesium Form Lichen to Reindeer, Health Physics 21(5) (1971) 657.
[15] HOLLEMAN, D.F., LUICK, J.R., “Radiocesium cycling in reindeer/caribou”, Proceedings of the first international reindeer and caribou symposium. 9 Aug 1972 (LUICK, J.R., Ed.) University of Alaska, Fairbanks (1975a) 64-70.
[16] HOLLEMAN, D. F., J. R. LUICK., “Relationship between potassium intake and radiocesium retention in the reindeer” Mineral Cycling in Southeastern Ecosystems. (HOWELL, F.G., GENTRY, J.B., SMITH, M.H., Eds.), Proceedings of a symposium held at Augusta, Georgia, May 1-3, 1974. Energy research and development administration, Technical Information Center (1975) 557-563.
[17] NEVSTRUEVA, M. A., RAMZAEV, P.V., MOISEER, A.A., IBATULLIN, M.S., TEPLYKH, L.A. “The nature of 137Cs and 90Sr transport over the lichen-reindeer-man food chain”, Radioecological Concentration Processes. Proceedings of an International Symposium, Stockholm 25-29 April, 1966. B. Åberg, Hungate, F.P. Pergamon Press, Oxford (1967) 209-215.
[18] GOLIKOV, V., LOGACHEVA, I., BRUK, G., SHUTOV, V., BALONOV, M. et al., Modelling of long-term behaviour of caesium and strontium radionuclides in the Arctic environment and human exposure, Journal of Environmental Radioactivity, 73(1-3) (2004) 159-169.
[19] MACHART, P., HOFMANN, W., TÜRK, R., STEGER, F., Ecological half-life of 137Cs in lichens in an alpine region, Journal of Environmental Radioactivity, 97 (2007) 70-75.
[20] GAARE, E., SKOGEN, A., STRAND O., Monitoring 137Cs in the Dovre-Rondane region 1997-1999, Norwegian Institute for Nature Research, Trondheim. NINA Oppdragsmelding 616, (2000). 43 pp (in Norwegian with English abstract).
[21] SYNNOTT, H.J., MCGEE, E.J., RAFFERTY, B., DAWSON, D.E., Long-term trends of radiocaesium activity concentrations in vegetation in Irish semi-natural ecosystems, Health Physics 79 (2) (2000) 154-161.
[22] HOVE, K.,, PEDERSEN, Ø., GARMO, T.H., HANSEN, H.S., STAALAND, H., Fungi: A major source of radiocaesium contamination of grazing ruminants in Norway, Health Physics 59(2) (1990).189-192.
[23] SKUTERUD, L., E. GAARE, et al., Chernobyl radioactivity persists in reindeer, Journal of Environmental Radioactivity 83(2) (2005) 231-252.
[24] PALSSON, S.E., EGILSSON, K., et al. Transfer of Radiocaesium from Soil and Plants to Reindeer in Iceland, Journal of Environmental Radioactivity 24(2) (1994) 107-125.
396
[25] SMITH, J.T., FESENKO S.V., HOWARD, B.J., HORRIL, A.D., SANZHAROVA, N.I., ALEXAKHIN, R.M., ELDER, D.G., NAYLOR, C., Temporal Change in Fallout 137Cs in Terrestrial and Aquatic Systems: A Whole Ecosystem Approach, Environmental Science and Technology 33 (1999) 49-54.
[26] SKUTERUD, L., GWYNN, J.P., et al., Sr-90, Po-210 and Pb-210 in lichen and reindeer in Norway, Journal of Environmental Radioactivity 84(3) (2005) 441-456.
[27] THØRRING, H., "Radioactive contamination of milk from the Nordic countries“, Impact Assessment within the IAEA Arctic Assessment Project (IASAP), (Ilus E. Ed.), Proceedings of the Summary Seminar within the NKS-B Programme 2002-2005. 24-25 October 2005, Tartu, Estonia, NKS, Risø. NKS-143 (2006) 152-158.
[28] SIGURGEIRSSON, M.Á, PÁLSSON, S.E., GUÐNASON K., ÓLAFSDÓTTIR, E.D., GUNNARSDÓTTIR, S., “Geislavirk efni í umhverfi og matvælum 1989-2003–Radioactivity in the environment and food in Iceland 1989-2003”, Icelandic Radiation Protection Institute GR 05:03, Reykjavik (2005) 46 pp.
[29] HOWARD, B.J., WRIGHT, S.M., BARNETT, C., SALBU, B., LOE R,B., LIND, O.C., HOVE, K., SKUTERUD, L., Long-term consequences of potential radioactive contamination in the Northern areas: Northern Norway. Grange-over-Sands, UK: Centre for Ecology and Hydrology-Merlewood (2002)
[30] HOWARD, B.J., WRIGHT, S.M., SALBU B., SKUTERUD, L., HOVE, K., LOE, R., Long-term consequences for Northern Norway of a hypothetical release from the Kola nuclear power plant, Science of the Total Environment 327 (2004) 53–68.
[31] TRAVNIKOVA, I.G., SHUTOV, V.N. , BRUK, G. Ya, BALONOV, M.I., SKUTERUD, L. , STRAND, P., POGORELY, Ju.A., BURKOVA, T.F., Assessment of current exposure levels in different population groups of the Kola Peninsula, Journal of Environmental Radioactivity 60 (2002) 235–248
[32] JOENSEN, H.P., Long-term variation of radiocaesium in the food chain of lamb in the Faroe Islands, Journal of Environmental Radioactivity, 46 (1999) 345-360.
[33] BRITTAIN, J.E., STORRUSTE, A. & LARSEN, E. Radiocesium in brown trout (Salmo trutta) from a subalpine lake ecosystem after the Chernobyl reactor accident. Journal of Environmental Radioactivity 14 (1991) 181-191.
[34] BRITTAIN, J.E., BJØRNSTAD, H.E., SALBU, B. & OUGHTON, D. H. Winter transport of Chernobyl radionuclides from a montane catchment to an ice-covered lake. Analyst 117 (1992) 515- 519.
[35] SALBU, B., BJØRNSTAD, H.E.& BRITTAIN, J.E. 1992. Fractionation of Cs-isotopes and 90-Sr in snowmelt run-off and lake waters from a contaminated Norwegian mountain catchment. Journal of Radioanalytical and Nuclear Chemistry 156 (1992) 7-20.
[36] SAXÉN, R. Long-term behaviour of 90Sr and 137Cs in surface waters in Finland.. In Paile, V. (ed.) Radiological Protection in the 2000s – Theory and Practice, Turku, Finland, August 25-29 2002. Nordic Society for Radiation Protection, Roskilde (2003). Pp. 479-483.
[37] BLAYLOCK, B.G.. Radionuclide data bases available for bioaccumulation factors for freshwater biota. Nuclear Safety 23 (1982) 427-438.
[38] SÄRKKÄ, J., JÄMSLÄ, A., LUUKKO, A. Chernobyl-derived radiocesium in fish as dependent on water quality and lake morphometry. Journal of Fish Biology 46 (1995) 227-240.
[39] BRITTAIN, J.E., BERGSTRÖM, U., HÅKANSON, L., HELING, R., MONTE, L., SUOLANEN, V. Estimation of ecological half-lives for Cs-137 in lakes contaminated by Chernobyl fallout. International Symposium on Environmental Impact of Radioactive Releases, IAEA, May 1995. pp. 291-298.
[40] HESSEN, D.O., SKURDAL, J., HEGGE, O., HESTHAEN, T. Radiocaesium decay in populations of brown trout and Arctic char in the alpine Atna area, south-eastern Norway. Hydrobiologia 489 (2002) 55-62.

397
RADIONUCLIDE TRANSFER IN ALPINE ECOSYSTEMS
F. STREBL
Austrian Research Centers – ARC, Dept. Radiation Safety and Applications,
Seibersdorf, Austria
H. LETTNER, A.K. HUBMER
University of Salzburg, Institute of Physics and Biophysics, Salzburg, Austria
P. BOSSEW
European Commission (EC), Joint Research Centre (JRC),
Institute for Environment and Sustainability (IES), Ispra, Italy
Abstract
Although alpine ecosystems are only of limited extent in Europe and the world, they serve as an important socio-economic
basis for food production and tourism for the local population. The specific climate conditions and agricultural practice do
have influence on radionuclide transfer in Alpine regions. The paper describes basic proceses governing radionuclide
behaviour in Alpine ecosystems and gives parameters for vertical migration of radionuclide in soil, for soil-plant transfer as
well as transfer of radionuclide to cow milk.
1. ENVIRONMENTAL FACTOR GOVERNING BEHAVIOUR OF RADIONUCLIDES IN
ALPINE ECOSYSTEMS
Alpine ecosystems show a very distinct behaviour with respect to nutrient cycling and are
very sensitive against contamination due to the specific prevailing climatic and environmental
conditions. In general Alpine ecosystems are characterized by:
• high altitudes leading to extreme climatic conditions with high amounts of
precipitation, (at least in Europe) a long-lasting snow cover and frozen soils in
winter. When melting, big amounts of water rush down the slope immediately (too
much for infiltration, leading to erosion, wash off) and a short vegetation period
• derived from these conditions slow soil building processes and slow
decomposition of soil organic matter leading to low pH-values in soil, litter
accumulation
• nutrient deficiency (no fertilisation, input of organic matter only via browsing
animals, slow litter decay)
• plant species/communities adapted to such conditions with deep or widely
extended rooting systems, nutrient storage in the root or litter layer, nutrient
recycling from decaying plant parts
• shallow soil profiles on slopes and disturbed soil profiles with accumulation of
eroded material in foothill positions; variable soil texture composition dependent
on the position at the slope (fine material accumulated at foot-hills)
• driven by soil properties, alpine soils have a very specific soil microbiology with
high amount of fungal biomass (in acid soils), high capacity to store Cs in
superficial soil layers [1]
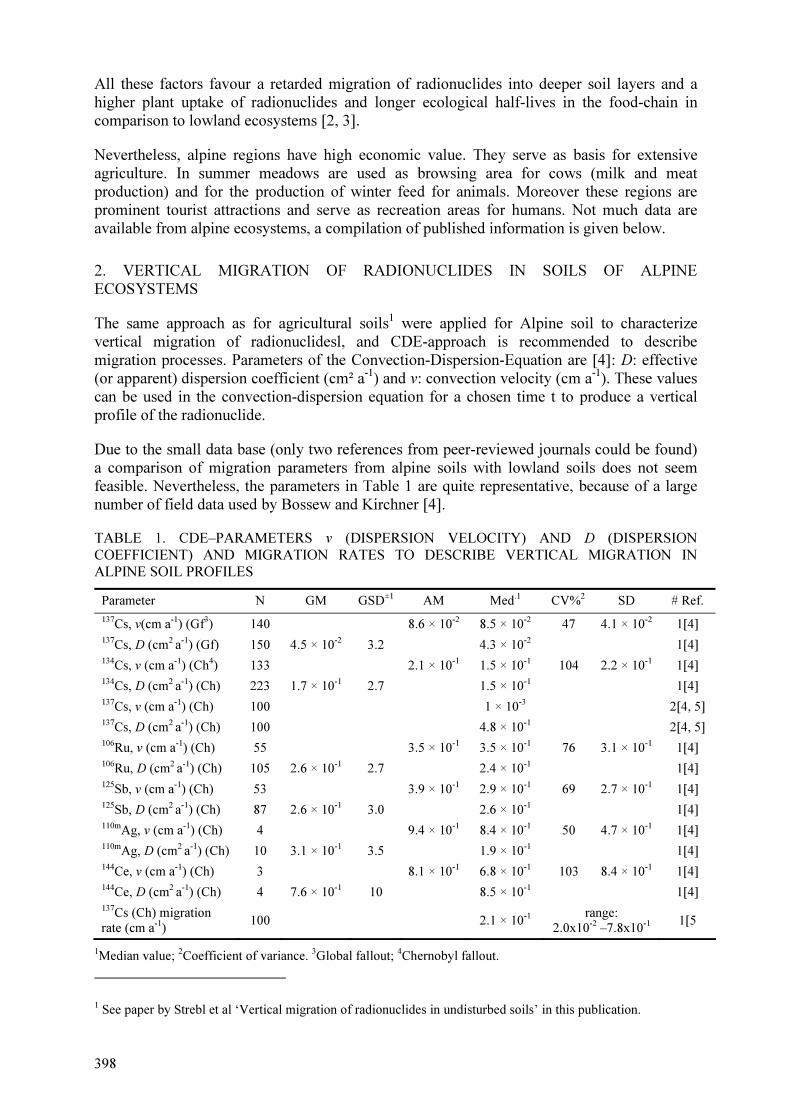
398
All these factors favour a retarded migration of radionuclides into deeper soil layers and a
higher plant uptake of radionuclides and longer ecological half-lives in the food-chain in
comparison to lowland ecosystems [2, 3].
Nevertheless, alpine regions have high economic value. They serve as basis for extensive
agriculture. In summer meadows are used as browsing area for cows (milk and meat
production) and for the production of winter feed for animals. Moreover these regions are
prominent tourist attractions and serve as recreation areas for humans. Not much data are
available from alpine ecosystems, a compilation of published information is given below.
2. VERTICAL MIGRATION OF RADIONUCLIDES IN SOILS OF ALPINE
ECOSYSTEMS
The same approach as for agricultural soils1 were applied for Alpine soil to characterize
vertical migration of radionuclidesl, and CDE-approach is recommended to describe
migration processes. Parameters of the Convection-Dispersion-Equation are [4]: D: effective
(or apparent) dispersion coefficient (cm² a-1
) and v: convection velocity (cm a-1
). These values
can be used in the convection-dispersion equation for a chosen time t to produce a vertical
profile of the radionuclide.
Due to the small data base (only two references from peer-reviewed journals could be found)
a comparison of migration parameters from alpine soils with lowland soils does not seem
feasible. Nevertheless, the parameters in Table 1 are quite representative, because of a large
number of field data used by Bossew and Kirchner [4].
TABLE 1. CDE–PARAMETERS v (DISPERSION VELOCITY) AND D (DISPERSION COEFFICIENT) AND MIGRATION RATES TO DESCRIBE VERTICAL MIGRATION IN ALPINE SOIL PROFILES
Parameter N GM GSD±1 AM Med.1 CV%2 SD # Ref.
137Cs, v(cm a-1) (Gf3) 140 8.6 × 10⁻² 8.5 × 10⁻² 47 4.1 × 10⁻² 1[4] 137Cs, D (cm2 a-1) (Gf) 150 4.5 × 10⁻² 3.2 4.3 × 10⁻² 1[4] 134Cs, v (cm a-1) (Ch4) 133 2.1 × 10⁻¹ 1.5 × 10⁻¹ 104 2.2 × 10⁻¹ 1[4] 134Cs, D (cm2 a-1) (Ch) 223 1.7 × 10⁻¹ 2.7 1.5 × 10⁻¹ 1[4] 137Cs, v (cm a-1) (Ch) 100 1 × 10⁻³ 2[4, 5] 137Cs, D (cm2 a-1) (Ch) 100 4.8 × 10⁻¹ 2[4, 5] 106Ru, v (cm a-1) (Ch) 55 3.5 × 10⁻¹ 3.5 × 10⁻¹ 76 3.1 × 10⁻¹ 1[4] 106Ru, D (cm2 a-1) (Ch) 105 2.6 × 10⁻¹ 2.7 2.4 × 10⁻¹ 1[4] 125Sb, v (cm a-1) (Ch) 53 3.9 × 10⁻¹ 2.9 × 10⁻¹ 69 2.7 × 10⁻¹ 1[4] 125Sb, D (cm2 a-1) (Ch) 87 2.6 × 10⁻¹ 3.0 2.6 × 10⁻¹ 1[4] 110mAg, v (cm a-1) (Ch) 4 9.4 × 10⁻¹ 8.4 × 10⁻¹ 50 4.7 × 10⁻¹ 1[4] 110mAg, D (cm2 a-1) (Ch) 10 3.1 × 10⁻¹ 3.5 1.9 × 10⁻¹ 1[4] 144Ce, v (cm a-1) (Ch) 3 8.1 × 10⁻¹ 6.8 × 10⁻¹ 103 8.4 × 10⁻¹ 1[4] 144Ce, D (cm2 a-1) (Ch) 4 7.6 × 10⁻¹ 10 8.5 × 10⁻¹ 1[4] 137Cs (Ch) migration
rate (cm a-1)
100 2.1 × 10⁻¹
range:
2.0x10⁻² –7.8x10⁻¹
1[5
1Median value; 2Coefficient of variance. 3Global fallout; 4Chernobyl fallout.
1 See paper by Strebl et al ‘Vertical migration of radionuclides in undisturbed soils’ in this publication.

399
3. SOIL-PLANT TRANSFER IN ALPINE ECOSYSTEMS
Similar like for other semi-natural systems the use of aggregated transfer factors has become
popular for alpine ecosystems. This is due to the fact that variability of transfer factors is
extremely high. Influencing factors are e.g. high variability of microclimatic conditions,
small-scale variability of soil properties, and changing hydrological conditions. Available
peer-reviewed data are given in Table 2.
TABLE 2. AGGREGATED TRANSFER FACTORS (Tag; m2 kg-1) FOR 137Cs AND 90Sr FROM SOIL
TO GRASSLAND VEGETATION IN ALPINE ECOSYSTEMS
Soil type N GM GSD AM SD Min Max Ref.
137Cs
Sandy 8 1.4 × 10⁻² 3.1 2.1 × 10⁻² 1.5 × 10⁻² 2 × 10⁻³ 4.3 × 10⁻² [1, 6, 7])
Loamy 4 3 × 10⁻³ 2.9 4 × 10⁻³ 6 × 10⁻³ 1 × 10⁻³ 1.3 × 10⁻² [6, 8, 9]
Unspec. 1 6 × 10⁻³ [8]
All soils 13 8 × 10⁻³ 3.7 1.5 × 10⁻² 1.5 × 10⁻² 1 × 10⁻³ 4.3 × 10⁻² _
90Sr
All soils 3 2.6 × 10⁻² 2.1 3.0 × 10⁻² 1.8 × 10⁻² 1.1 × 10⁻² 4.7 × 10⁻² [6, 10]
TABLE 3 MILK FEED TRANSFER COEFFICIENTS Fm [d l-1] FOR 137Cs AND 90Sr.
Site AM SDa Min Max Reference
137Cs
Lowland 9 × 10⁻⁴ 8 × 10⁻⁴ - - [12]
Silicate bedrock 7.1 × 10⁻³ 9 × 10⁻⁴ 3.5 × 10⁻³ 1.1 × 10⁻² [12, 13]
Calcareous bedrock 6.9 × 10⁻³ 1.3 × 10⁻³ 2.5 × 10⁻³ 2 × 10⁻² [11-13]
90Sr
Lowland 8 × 10⁻⁴ 3 × 10⁻⁴ - - [12]
Silicate bedrock 1.1 × 10⁻³ 4 × 10⁻⁴ 5 × 10⁻⁴ 1.7 × 10⁻³ [12, 13]
Calcareous bedrock 1.0 × 10⁻³ 8 × 10⁻⁴ 5 × 10⁻⁴ 1.0 × 10⁻³ [12, 13]
a SD = standard deviation derived from error propagation.
4. FOOD-CHAIN TRANSPORT IN ALPINE ECOSYSTEMS
In the peer reviewed literature available data for the food chain transport of radionuclides in
alpine ecosystems are restricted to the transfer from plant-to-milk, and only three (3) peer
reviewed articles on the topic were available at the time of the data assessment.
For the transfer of radionuclides from feed to milk, the parameter Fm, (d l-1
) is used, which is
the equilibrium ratio of the activity concentration in milk related to the daily dietary
radionuclide intake. Feed transfer coefficient were determined in milk from semi-natural
extensive production regions with calcareous and silicate bedrock [11-13]), the two basically
400
different rock units, and in one intensively productive lowland region for comparison [12].
Concerning the time trends of 137
Cs contamination of cow milk from Alpine pastures,
considerably longer ecological (or effective) half-lives have been observed in comparison to
lowland production sites. Similar to the Arctic ecosystems, also here a two-component
exponential decay function can be applied for the description of the decrease in concentrations
over the years. For the period 1988 – 2006 Lettner et al. [14] derived ecological half-lives of
0.7/1.4 years for the fast initial period and 9.3/12.7 for the long-term decay component of 137
Cs concentration in cow milk. Keeping into account the difference between ecological and
effective half-lives (which includes physical decay of radionuclides), these values are very
similar compared to the results from Arctic environments (see Table 5). The feed transfer
coefficients for 137
Cs in lowland region is significantly lower than on alpine production sites,
however for 90
Sr no difference could be found. Also no significant differences for both
radionuclides could be determined between milk feed transfer factors on silicate and
calcareous bedrock.
5. CONCLUSIONS
Like in Arctic environments, radionuclide behaviour in Alpine ecosystems is strongly
dependent on site-specific conditions, indicating a considerable variability of radionuclide
transfer parameters and their high sensitivity to climate changes. The melting of glaciers
caused by temperature increase will remobilize a considerable amount of radionuclide
inventories stored in permanent ice (both from global fallout, but also Chernobyl fallout in
alpine regions). The same as for Arctic ecosystems, long-term predictions of radionuclides
redistributions in Alpine regions are associated with high uncertainty and further investigation
of processes for the migration of radionuclides in food-chains of such ecosystems is
necessary.
REFERENCES
[1] STEMMER, M., HROMATKA, A., LETTNER, H., STREBL F., Radiocaesium storage in soil microbial biomass of undisturbed alpine meadow soils and its relation to 137Cs soil–plant transfer, Journal of Environmental Radioactivity, 79(2) (2005) 107-118
[2] FRISSEL, M., NOORDIJK, H., VAN BERGEIJK, K.E., “The impact of extreme environmental condition, as occurring in natural ecosystems, on the soil-to-plant transfer of radionuclides”, Transfer of Radionuclides in Natural and Semi-natural Environments (DESMET, G., NASSIMBENI, P., BELLI, M. Eds.) Elsevier, Amsterdam (1990) 40-47.
[3] GERZABEK, M.H., DEMERCI, M., ROTH, K., STREBL, F., “Radionuclide transfer in alpine ecosystems”, Influence of Climatic Characteristics upon Behaviour of Radioactive Elements, (Ohmomo, Y., Sakurai, N., Eds.), Proceedings of an international meeting. Rokkasho, Aomori, Japan Oct. 14-16, (1997) 75-82.
[4] BOSSEW, P, KIRCHNER, G., Modelling the vertical distribution of radionuclides in soil. Part 1: the convection-dispersion equation revisited, Journal of Environmental Radioactivity 73(2) (2004).127-50.
[5] BUNZL, K., SCHIMMACK, W., ZELLES, L., ALBERS, B.P., Spatial variability of the vertical migration of fallout 137Cs in the soil of a pasture, and consequences for long-term predictions, Radiation and Environmental Biophysics 39(3) (2000) 197-205.
[6] GASTBERGER, M., STEINHÄUSLER, F., GERZABEK, M.H., LETTNER , H., HUBMER A.K., Soil-to-plant transfer of fallout caesium and strontium in Austrian lowland and Alpine pastures, Journal of Environmental Radioactivity, 49(2) (2000) 217-233.
[7] LETTNER, H., GRIESEBNER, A., PEER, T., HUBMER, A.K., PINTARIC, M., Altitude dependent 137Cs concentrations in different plant species in alpine agricultural areas, Journal of Environmental Radioactivity, 86(1) (2006) 12-30
401
[8] BUNZL, K.; ALBERS, B.P.; SCHIMMACK, W.; BELLI, M.; CIUFFO, L.; MENEGON, S., Examination of a relationship between 137Cs concentrations in soils and plants from alpine pastures, Journal of Environmental Radioactivity 48 (2000) 145-158
[9] ALBERS, B.P.; RACKWITZ, R.; SCHIMMACK, W.; BUNZL, K., Transect survey of radiocaesium in soils and plants of two alpine pastures, Science of the Total Environment 216
(1998) 159-172 [10] SCHIMMACK, W., KRACKE, W., SOMMER, M., Spatial variability of fallout-90Sr in soil and
vegetation of an alpine pasture, Journal of Environmental Radioactivity, 65(3) (2003) 281-296. [11] ALBERS, B.P., STEINDL, H., SCHIMMACK, W., BUNZL, K., Soil to plant and plant-to-
cow’s milk transfer of radiocaesium in alpine pastures: significance of seasonal variability, Chemosphere 41 (2000) 717 – 723.
[12] GASTBERGER, M., STEINHÄUSLER, F., GERZABEK, M.H., HUBMER, A., Fallout strontium and caesium transfer from vegetation to cow milk at two lowland and two Alpine pastures, Journal of Environmental Radioactivity 54(2) (2001) 267-273.
[13] LETTNER, H., HUBMER, A., BOSSEW, P., STREBL, F., Cs-137 and 90Sr transfer to milk in Austrian alpine agriculture, Journal of Environmental Radioactivity 98(1-2) (2007) Pages 69-84.
[14] LETTNER, H.; BOSSEW, P., STREBL, F., Cs-137 und 90Sr Verteilung auf Almen der Salzburger Hohen Tauern und Aktivitaetskonzentrationen in Lebensmitteln (2003). Final Report to Federal Ministry of Social Safety and Generations. 103 pp.

RADIONUCLIDE TRANSFERS IN FRESHWATER ECOSYSTEMS
Radionuclides dispersed in the environment can be deposited into water surface or on surface of the watershed, which can represent in this case a long-term source of radionuclides for the freshwater ecosystems. The first pathway represents direct source of radionuclides to the freshwater ecosystem and can be easily simulated by the specification of the relevant input model parameters. The second pathway includes a set of processes and radionuclides can be transferred to water body being dissolved in flowing water or with soil particles adhered radionuclides. In water radionuclides can be adsorbed by the solid particles, portioning between the solid and water. The solid particles can settle out to the bottom of the like or river and be removed from the water column. Radionuclides dissolved in water can also be adsorbed by the bottom sediments and be transferring after that to the deep sediment layers. At the same time, adsorbed radionuclides can be remobilised, becoming available again for uptake by freshwater biota.

405
TRANSFER BY WASH-OFF FROM WATERSHEDS
L. GARCIA-SANCHEZ
Institut de Radioprotection et de Sûreté Nucléaire (IRSN),
Centre de Cadarache, Saint Paul-lez-Durance, France
Abstract
Radionuclide transport with water from contaminated watersheds is an intermittent flux – also called watershed wash-off –
which causes radionuclide redistribution in terrestrial ecosystems, and more critically radionuclide delivery to downstream
water bodies. Mean wash-off fluxes and their evolution with time can be generally quantified via two types of parameters:
liquid and solid entrainment coefficients and transfer functions, which can be seen as transfer factors varying with time. The
paper provides an extensive review covering various radionuclides, source terms, processes, time and space scales reported in
the literature after 1960.
1. INTRODUCTION
Radionuclide wash-off from watersheds is a secondary pathway of contamination of
ecosystems. It is both a term of radionuclide redistribution in terrestrial ecosystems [1-2], and
a delivery term for aquatic ecosystems [3]. From a terrestrial point of view, wash-off is not an
effective process of decontamination. The removed amounts and removal rates are not
significant enough to be considered in food chain models [4]. But from an aquatic point of
view, this way of contamination is important and persistent because it collects fluxes from
wide potentially contaminated areas that remain affected by precipitations [5]. These transfers
have been observed since the beginning of atmospheric bomb tests [3], and became much
more evident after the Chernobyl accident [6].
2. MAIN PROCESSES
Radionuclide wash-off is the transport of contamination by flowing water over the soil
surface (run-off). Actually two pathways can be distinguished:
• liquid wash-off: when radionuclide is transported in soluble phase with water;
• solid wash-off: when radionuclide is transported in particulate form with suspended
matter.
Wash-off is particularly intense during and within few weeks after deposition. This stage is
referred as short-term wash-off. Wash-off is significantly lower for larger delays after
deposition, but is still active years and decades after deposition. This stage is referred as long-
term wash-off.
Short-term liquid wash-off originates in:
• direct deposition on surface water without passage in the soil store [7];
• non-equilibrium sorption on the soil surface during wet deposition (substantial rainfall
and high fallout input). The excess contamination is rapidly exported with runoff [8-
9].
Its duration over few weeks is due to transit times of water in watersheds and extended
deposit time to soil by vegetation wash-off [10].

406
Long-term liquid wash-off results from dilution of soil water with runoff water, and desorption from a thin soil layer [11]. Desorption seems to occur at equilibrium [12], for both 137Cs and 90Sr, except when runoff of 90Sr is intense like in rills and gullies [13]. Availability of the radionuclide to liquid wash-off generally decreases with time, because of migration for strontium [13], and essentially ageing for caesium [14].
Short-term solid wash-off [2, 15] is a direct transfer from rainfall to suspended matter by adsorption. It is active during the deposition period or while plant leaching is significant [10]. Soil disaggregating by contaminated rain explains the rapid mobilization of contaminated particles [16].
Long-term solid wash-off is caused by detachment and transport of soil particles by the combined action of rain and runoff [17]. During this stage, rainfall water is uncontaminated and conveys soil particles previously contaminated.
Major co-factors influencing wash-off processes are:
• the radionuclide: most of the operating processes are chemical dependent;
• the type of contamination: for a given radionuclide, the nature of the contamination can affect its availability to wash-off, especially for liquid wash-off. Important factors are: initial exchangeable fraction of the contamination, nature of the source (bomb, Chernobyl);
• the pathway: if the considered flux is the liquid, solid, or total wash-off;
• space and time scales: if the flux integrates the radionuclide entrainment at the plot/rainfall scale or at the watershed/season scale;
• the advection fluxes: wash-off stems from the movement of water at the soil surface. The climate (arid ,humid, with/without snow cover [18]) and soil properties (erodibility, vegetation cover [19]) are determinant. The abundance of surface water influences the rapid flush [7] and more generally the dilution between deposition and water concentration [20];
• the nature of the soils in the watersheds: An important literature has focused on the higher wash-off rates of Caesium in (organic) peaty soils [21].
3. CONVENTIONAL PARAMETERS
Usual parameters quantify wash-off fluxes (Bq/s) exported from watersheds. Two complementary approaches appear in the literature:
• Entrainment coefficients, at small time scales (e.g. rainfall, season);
• Transfer functions, at larger time scales (e.g. months, years). Wash-off is here described as continuous though it is intermittent by nature.
3.1. Entrainment coefficients
Liquid/solid normalized entrainment coefficients (noted *
lK , *
sK ) are transfer factors between
mean soil contamination and mean liquid/solid contamination of water [12, 22]. For a given radionuclide M, their expression is:
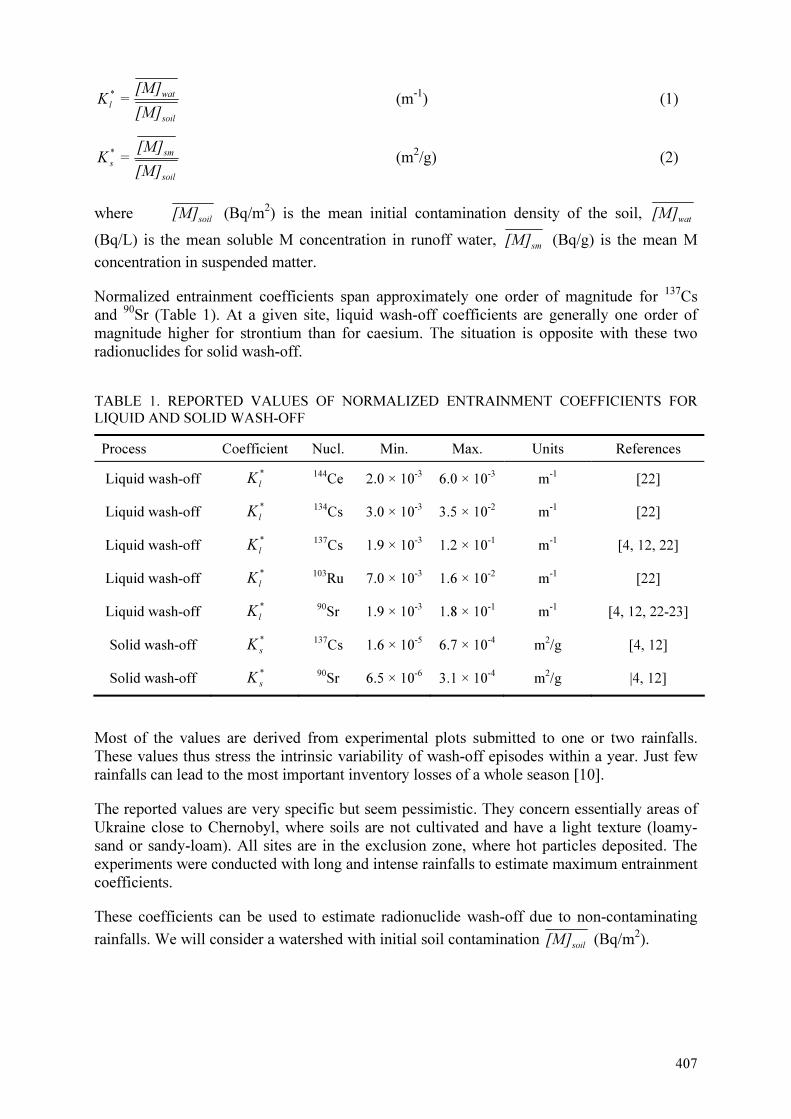
407
soil
wat
l
[M]
[M]=K
* (m-1) (1)
soil
sm
s
[M]
[M]=K
* (m2/g) (2)
where soil
[M] (Bq/m2) is the mean initial contamination density of the soil, wat
[M]
(Bq/L) is the mean soluble M concentration in runoff water, sm
[M] (Bq/g) is the mean M
concentration in suspended matter.
Normalized entrainment coefficients span approximately one order of magnitude for 137Cs and 90Sr (Table 1). At a given site, liquid wash-off coefficients are generally one order of magnitude higher for strontium than for caesium. The situation is opposite with these two radionuclides for solid wash-off.
TABLE 1. REPORTED VALUES OF NORMALIZED ENTRAINMENT COEFFICIENTS FOR LIQUID AND SOLID WASH-OFF
Process Coefficient Nucl. Min. Max. Units References
Liquid wash-off *
lK
144Ce 2.0 × 10⁻³ 6.0 × 10⁻³ m-1 [22]
Liquid wash-off *
lK
134Cs 3.0 × 10⁻³ 3.5 × 10⁻² m-1 [22]
Liquid wash-off *
lK
137Cs 1.9 × 10⁻³ 1.2 × 10⁻¹ m-1 [4, 12, 22]
Liquid wash-off *
lK
103Ru 7.0 × 10⁻³ 1.6 × 10⁻² m-1 [22]
Liquid wash-off *
lK
90Sr 1.9 × 10⁻³ 1.8 × 10⁻¹ m-1 [4, 12, 22-23]
Solid wash-off *
sK
137Cs 1.6 × 10⁻⁵ 6.7 × 10⁻⁴ m2/g [4, 12]
Solid wash-off *
sK
90Sr 6.5 × 10⁻⁶ 3.1 × 10⁻⁴ m2/g |4, 12]
Most of the values are derived from experimental plots submitted to one or two rainfalls. These values thus stress the intrinsic variability of wash-off episodes within a year. Just few rainfalls can lead to the most important inventory losses of a whole season [10].
The reported values are very specific but seem pessimistic. They concern essentially areas of Ukraine close to Chernobyl, where soils are not cultivated and have a light texture (loamy-sand or sandy-loam). All sites are in the exclusion zone, where hot particles deposited. The experiments were conducted with long and intense rainfalls to estimate maximum entrainment coefficients.
These coefficients can be used to estimate radionuclide wash-off due to non-contaminating
rainfalls. We will consider a watershed with initial soil contamination soil
[M] (Bq/m2).

408
Concentrations. Liquid and solid radionuclide concentrations at the outlet are:
*
lsoilwatK[M]=[M] × (Bq/m
3) (3)
*
ssoilsmK[M]=[M] × (Bq/g) (4)
Fluxes. For a water flow rate wat
Q (m3/s) and a suspended matter flow rate
smQ
(g/s) at the
outlet, liquid and solid wash-off fluxes are:
*
lsoilwatK[M]Q ×× (Bq/s) (5)
*
ssoilsmK[M]Q ×× (Bq/s) (6)
The effective value of coefficients *
lK
and *
sK
can be replaced by reported values of Table 1,
with the usual limits for such extrapolations.
3.2. Transfer functions
The wash-off transfer function f of a watershed is its characteristic wash-off flux as a function
of time after a unit pulse of contamination by atmospheric deposition. It is expressed as a
fraction of the initial deposit exported per unit of time (s-1
).
Wash-off transfer functions depend on the considered watershed, radionuclide and wash-off
process (liquid, solid or total).
The following transfer function synthesizes the data reported for global [24-26] and
Chernobyl fallout [27, 28]:
[ ] [ ]λ)t+(λλf+λ)t+(λλf=f(t)1 11000
expexp −⋅−⋅ (s-1
) (7)
Where 0f is the fraction of deposited contamination affected by short-term (rapid) wash-off;
1f is the fraction of deposited contamination affected by long-term (slow) wash-off; λ (s
-1) is
the radioactive decay rate; 0λ (s
-1) is the rapid wash-off rate constant (few weeks);
1λ (s
-1) is
the slow wash-off rate constant (few years). This analytical formulation distinguishes two
characteristic time scales for wash-off: within a year and years.
Short-term wash-off (few weeks) can represent more than a percent of the deposit for very
soluble radionuclides like 90
Sr, 103
Ru, 131
I and 132
Te (Table 2).
For the other reported radionuclides, extreme values of 0f generally corresponds to
estimations at small space scale. For watershed scenarios, 0f should be considered of the
order of a percent. The different forms of wash-off (total, liquid, solid) were distinguished
when enough data were available.

409
TABLE 2. FRACTION OF DEPOSITED CONTAMINATION AFFECTED BY SHORT-TERM WASH-OFF (
0f ), %
Process Radionuclide Min. Max. References #ref
Liquid wash-off 137Cs 0.007 1.7 [10, 24, 26, 27, 29-32] 8
Liquid wash-off 131I 4 10 [32] 1
Liquid wash-off 103Ru 4 10 [32] 1
Liquid wash-off 90Sr 0.63 10 [25, 26] 2
Liquid wash-off 132Te 5 10 [32] 1
Solid wash-off 7Be 0.6 2.3 [32] 1
Total wash-off 137Cs 0.2 7.4 [6, 28, 34, 35] 4
Total wash-off 131I 0.14 [6] 1
Total wash-off 103Ru 1.15 [6] 1
Total wash-off 90Sr 0.10 7.2 [3, 35, 51, 53] 4
The major part (around 95%) of rapid wash-off has occurred approximately T0=45 days after deposition (e.g. [19, 30, 31]). It can thus be recommended:
24)95.01ln(
0
0≈
−
−
T=λ (yr-1) (8)
Long-term wash-off (years). A pessimistic (in terms of the radionuclide transfer to water bodies) assessment consists in assuming that all the watershed contamination is accessible to wash-off:
f1= 1− f
0 (-) (9)
Slow wash-off rate constant 1λ generally represents less than a percent per year of the initial
deposit (Table 3). Variability of 137Cs and 90Sr coefficients is partly explained by the nature of the soils. Organic soils significantly increase radionuclide availability for wash-off.
Wash-off fluxes after an accidental deposit. This approach supposes that wash-off is the same for similar events happening at different times (time invariance principle), and is proportional to the deposited amount (proportionality principle). After an accidental deposit dA(t0) (Bq/m2) occurring at time t0, the wash-off flow rate f (Bq/s) at the outlet is then:
)tf(t)dA(tS=Φ(t)00
−⋅⋅ (Bq/s) (10)
Where t (yr) is the time; S (m2) is the surface of the watershed; f (/s) is the transfer function of the watershed, modelling its wash-off response.
Wash-off fluxes after a chronic deposit. This approach also assumes that wash-off adds up the responses to individual deposition events (superposition principle).
If a watershed is submitted to a varying atmospheric deposition rate D (Bq/m2/s), the wash-off flow rate Φ(t) (Bq/s) at the outlet is then:
∫ ⋅−⋅⋅ dτ)f(tD(τS=Φ(t) τ) (Bq/s) (11)

410
TABLE 3. SLOW RATE CONSTANT OF RADIONUCLIDE WASH-OFF 1λ , a-1
Process Radionuclide Min. Max. References #ref
Solid wash-off 241Am 1.0 × 10⁻⁴ 2.0 × 10⁻⁴ [36, 37] 2
Solid wash-off 7Be 2.0 × 10⁻² [37] 1
Liquid wash-off 137Cs 6.7 × 10⁻⁵ 2 × 10⁻² [10, 26, 29-30, 36, 38-39, 55] 7
Solid wash-off 137Cs 8.9 × 10⁻⁵ 1.2 × 10⁻¹ [1, 7, 10, 33, 36, 37, 40, 41] 8
Total wash-off 137Cs 3.8 × 10⁻⁵ 1 × 10⁻² [6, 18, 28, 34, 35, 36, 40, 43,
45, 48, 49, 54] 11
Total wash-off 131I 1.1 × 10⁻¹ [45] 2
Solid wash-off 210Pb 3.3 × 10⁻⁴ 7.1 × 10⁻⁴ [33, 37] 2
Total wash-off 210Pb 3.3 × 10⁻⁴ 1.3 × 10⁻³ [46,47] 2
Solid wash-off 210Pu 2 × 10⁻⁵ 6 × 10⁻³ [36, 37, 7, 40, 44] 5
Total wash-off 210Pu 1 × 10⁻⁴ 1.2 × 10⁻³ [24, 42, 43] 3
Total wash-off 103Ru 2 × 10⁻² [6] 1
Liquid wash-off 90Sr 6.7 × 10⁻⁴ 5 × 10⁻² [13, 24-26, 35, 50, 52] 7
Total wash-off 90Sr 1.1 × 10⁻³ 2 × 10⁻² [24, 49, 51] 3
In the expression of f (Eq. 7), the effective value of coefficients 0f and
1λ can be replaced by
reported values of Tables 2 and 3, with the usual limits of such extrapolations.
Concentrations. For a water flow rate wat
Q (m3/s) and a suspended matter flow rate sm
Q (g/s)
at the outlet, mean soluble and particulate radionuclide concentrations are:
watlwatQt=[M] /)(Φ (Bq/m3) (12)
smssmQt=[M] /)(Φ (Bq/g) (13)
where Φl and Φs correspond to liquid and solid wash-off fluxes. These estimated concentrations are representative of average variations over months and years. For short term assessments (below the month), use entrainment coefficients.
REFERENCES
[1] KHANBILVARDI, R., SHESTOPALOV, V., ONISHCHENKO, I., BUBLYAS, V., GUDZENKO, V., Role of erosion processes in transfer of radionuclides: results of field experiments, Journal of the American Water Resources Association 35(4) (1999) 887-898.
[2] WALLING, D.E. BRADLEY, S., Transport and redistribution of Chernobyl fallout radionuclides by fluvial processes: some preliminary evidence, Environmental Geochemistry and Health 10(2) (1988) 35-39.
[3] MENZEL, R., Transport of strontium-90 in runoff, Science 131 (1960) 499-500. [4] BORZILOV, V., KONOPLEV, A., REVINA, S., BOBOVNIKOVA, T. I., LYUTIK, P.,
SHVEIKIN, Y. V., SHCHERBAK, A.., Experimental investigation of washout of radionuclides deposited on soil as a result of the Chernobyl nuclear power plant accident, Soviet Meteorology and Hydrology 11 (1988) 43-53.
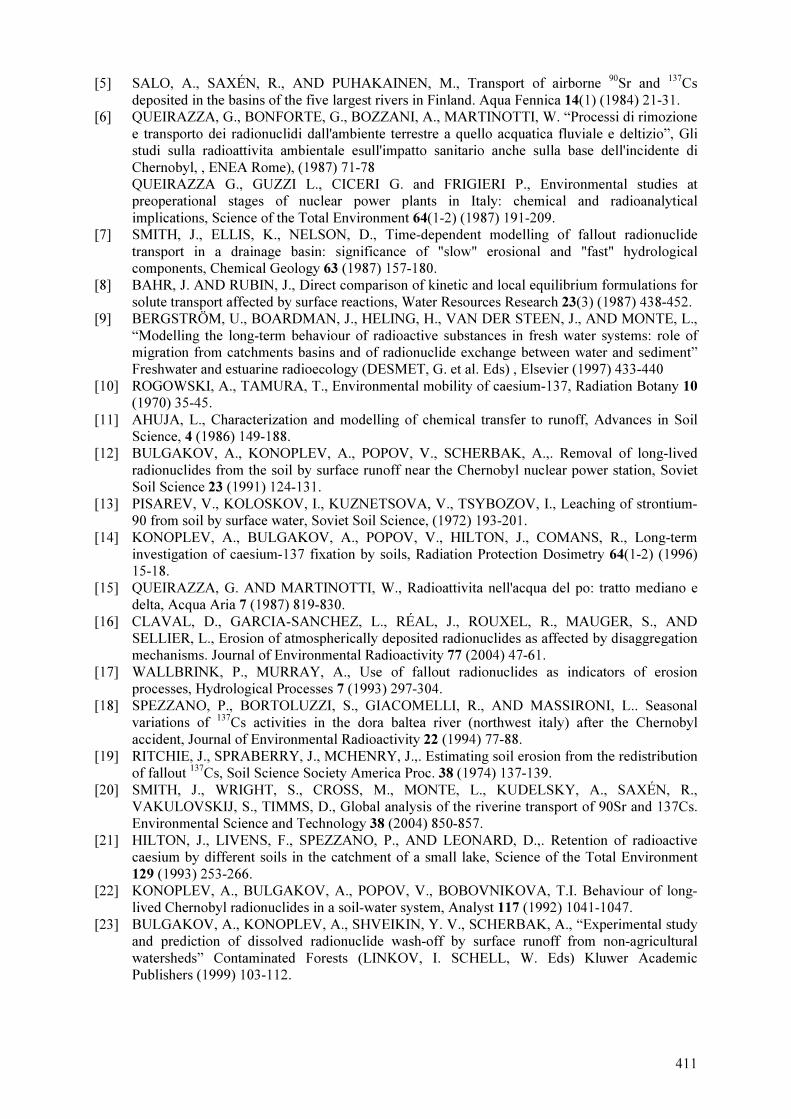
411
[5] SALO, A., SAXÉN, R., AND PUHAKAINEN, M., Transport of airborne 90Sr and 137Cs deposited in the basins of the five largest rivers in Finland. Aqua Fennica 14(1) (1984) 21-31.
[6] QUEIRAZZA, G., BONFORTE, G., BOZZANI, A., MARTINOTTI, W. “Processi di rimozione e transporto dei radionuclidi dall'ambiente terrestre a quello acquatica fluviale e deltizio”, Gli studi sulla radioattivita ambientale esull'impatto sanitario anche sulla base dell'incidente di Chernobyl, , ENEA Rome), (1987) 71-78 QUEIRAZZA G., GUZZI L., CICERI G. and FRIGIERI P., Environmental studies at preoperational stages of nuclear power plants in Italy: chemical and radioanalytical implications, Science of the Total Environment 64(1-2) (1987) 191-209.
[7] SMITH, J., ELLIS, K., NELSON, D., Time-dependent modelling of fallout radionuclide transport in a drainage basin: significance of "slow" erosional and "fast" hydrological components, Chemical Geology 63 (1987) 157-180.
[8] BAHR, J. AND RUBIN, J., Direct comparison of kinetic and local equilibrium formulations for solute transport affected by surface reactions, Water Resources Research 23(3) (1987) 438-452.
[9] BERGSTRÖM, U., BOARDMAN, J., HELING, H., VAN DER STEEN, J., AND MONTE, L., “Modelling the long-term behaviour of radioactive substances in fresh water systems: role of migration from catchments basins and of radionuclide exchange between water and sediment” Freshwater and estuarine radioecology (DESMET, G. et al. Eds) , Elsevier (1997) 433-440
[10] ROGOWSKI, A., TAMURA, T., Environmental mobility of caesium-137, Radiation Botany 10 (1970) 35-45.
[11] AHUJA, L., Characterization and modelling of chemical transfer to runoff, Advances in Soil Science, 4 (1986) 149-188.
[12] BULGAKOV, A., KONOPLEV, A., POPOV, V., SCHERBAK, A.,. Removal of long-lived radionuclides from the soil by surface runoff near the Chernobyl nuclear power station, Soviet Soil Science 23 (1991) 124-131.
[13] PISAREV, V., KOLOSKOV, I., KUZNETSOVA, V., TSYBOZOV, I., Leaching of strontium-90 from soil by surface water, Soviet Soil Science, (1972) 193-201.
[14] KONOPLEV, A., BULGAKOV, A., POPOV, V., HILTON, J., COMANS, R., Long-term investigation of caesium-137 fixation by soils, Radiation Protection Dosimetry 64(1-2) (1996) 15-18.
[15] QUEIRAZZA, G. AND MARTINOTTI, W., Radioattivita nell'acqua del po: tratto mediano e delta, Acqua Aria 7 (1987) 819-830.
[16] CLAVAL, D., GARCIA-SANCHEZ, L., RÉAL, J., ROUXEL, R., MAUGER, S., AND SELLIER, L., Erosion of atmospherically deposited radionuclides as affected by disaggregation mechanisms. Journal of Environmental Radioactivity 77 (2004) 47-61.
[17] WALLBRINK, P., MURRAY, A., Use of fallout radionuclides as indicators of erosion processes, Hydrological Processes 7 (1993) 297-304.
[18] SPEZZANO, P., BORTOLUZZI, S., GIACOMELLI, R., AND MASSIRONI, L.. Seasonal variations of 137Cs activities in the dora baltea river (northwest italy) after the Chernobyl accident, Journal of Environmental Radioactivity 22 (1994) 77-88.
[19] RITCHIE, J., SPRABERRY, J., MCHENRY, J.,. Estimating soil erosion from the redistribution of fallout 137Cs, Soil Science Society America Proc. 38 (1974) 137-139.
[20] SMITH, J., WRIGHT, S., CROSS, M., MONTE, L., KUDELSKY, A., SAXÉN, R., VAKULOVSKIJ, S., TIMMS, D., Global analysis of the riverine transport of 90Sr and 137Cs. Environmental Science and Technology 38 (2004) 850-857.
[21] HILTON, J., LIVENS, F., SPEZZANO, P., AND LEONARD, D.,. Retention of radioactive caesium by different soils in the catchment of a small lake, Science of the Total Environment 129 (1993) 253-266.
[22] KONOPLEV, A., BULGAKOV, A., POPOV, V., BOBOVNIKOVA, T.I. Behaviour of long-lived Chernobyl radionuclides in a soil-water system, Analyst 117 (1992) 1041-1047.
[23] BULGAKOV, A., KONOPLEV, A., SHVEIKIN, Y. V., SCHERBAK, A., “Experimental study and prediction of dissolved radionuclide wash-off by surface runoff from non-agricultural watersheds” Contaminated Forests (LINKOV, I. SCHELL, W. Eds) Kluwer Academic Publishers (1999) 103-112.

412
[24] HELTON, J., MULLER, A., AND BAYER, A., Contamination of surface-water bodies after reactor accidents by the erosion of atmospherically deposited radionuclides, Health Physics, 48(6) (1985) 757-771.
[25] KAMADA, H., YUKAWA, M., SAIKI, M., “Studies on removal of 90Sr, 106Ru, 137Cs, 144Ce in land and fresh water” Proc. IAEA Symposium on environmental surveillance around nuclear installations, vol. II, IAEA, Vienna (1974) 137-146.
[26] LINSLEY, G., HAYWOOD, S., DIONAN, J., “Use of fall-out data in the development of models for the transfer of nuclides in terrestrial and freshwater systems” IAEA Report IAEA-SM-257, Vienna (1982) 615-633.
[27] MONTE, L., Evaluation of radionuclide transfer functions from drainage basins of fresh water systems, Journal of Environmental Radioactivity 26 (1995) 71-82.
[28] SMITH, J., CLARKE, R., AND SAXÉN, R., Time-dependent behaviour of radiocaesium: A new method to compare mobility of weapon test and Chernobyl derived fallout, Journal of Environmental Radioactivity 49 (2000) 65-83.
[29] BILYI, I., COMANS, R., HILTON, J., VOITSEKHOVITCH, O., “Modelling of Chernobyl radioceasium behaviour in catchment-lake-sediment system Devoke water (Cumbria, UK)”, Freshwater and estuarine radioecology (DESMET, G. Ed), Elsevier (1997) 449-459.
[30] CARLSSON, S., A model for the movement and loss of caesium-137 in a small watershed, Health Physics 34(1) (1978) 33-37.
[31] SANTSCHI, P., BOLHALDER, S., ZINGG, S., LÜCK, A., FARRENHOTHEN, K.,. The self-cleaning capacity of surface waters after radioactive fallout. Evidence from European water after Chernobyl, 1986-1988, Environmental Science and Technology 24 (1990) 510-527.
[32] SANTSCHI, P., BOLLHALDER, S., FARRENKOTHEN, K., LUECK, A., ZINGG, S., STURM, M. Chernobyl radionuclides in the environment: tracers for tight coupling of atmospheric, terrestrial and aquatic geochemical processes, Environmental Science and Technology 22 (1988) 510-516.
[33] DOMINIK, J., BURRUS, D., VERNET, J.-P. Transport of environmental radionuclides in an alpine watershed, Earth and Planetary Science Letters 84: (1987) 165-180.
[34] ETTENHUBER, E., JURK, M., KÜMMEL, M., SIEBERT, H.-U.,. “Model for predicting water contamination in fallout situations”, Environment contamination following a major nuclear accident, IAEA, Vienna (1990) 260-264.
[35] YAMAGATA, N., MATSUDA, S., AND KODAIRA, K. Run-off of caesium-137 and strontium-90 from rivers, Nature 200 (1963) 668-669.
[36] BEASLEY, T. AND JENNINGS, C., The inventory of 239,240Pu, 241Am and 60Co in Columbia river sediments from Hanford to the Columbia river estuary, Environmental Science and Technology 18 (1984) 207-212.
[37] JOSHI, S. AND SHUKLA, B., The role of the water/soil distribution coefficient in the watershed transport of environmental radionuclides, Earth and Planetary Science Letters 105 (1991) 314-318.
[38] SPEZZANO, P., HILTON, J., LISHMAN, J., AND CARRICK, T.,. The variability of Chernobyl Cs retention in the water column of lakes in the english lake district, two years and four years after deposition, Journal of Environmental Radioactivity 19(3) (1993) 213-232.
[39] KUDELSKY, A., SMITH, J.T., OVSYANNIKOVA, S. HILTON, J., Mobility of Chernobyl-derived 137Cs in a peatnog system within the catchment of the Pripyat river, Belarus, Science of the Total Environment 188 (1996) 101-113.
[40] BONNETT, P.J.P., A review of the erosional behaviour of radionuclides in selected drainage basins, Journal of Environmental Radioactivity 11 (1990) 251-266.
[41] WALLING, D.E., BRADLEY, S.B. WILKINSON, C.J., “A ceasium-137 budget approach to the investigation of sediment delivery from a small agricultural drainage basin in Devon, UK” Drainage Basin Sediment Delivery (Hadley R.F. Ed), International Association of Hydrological Sciences, Wallingford, UK. (1986).
[42] SPRUGEL, D.G. AND BARTELT, G.E., Erosional removal of fallout plutonium from a large midwestern watershed, Journal of Environmental Quality 7(2) (1978) 175-177.
[43] LINSALATA, P., SIMPSON, H.J., OLSEN, C.R., COHEN, N. TRIER, R.M., Plutonium and radiocaesium in the water column of the Hudson river estuary, Environmental Geology and Water Sciences 7(4): (1985) 193-204.
413
[44] FOSTER, G.R. HAKONSON, T.E., Predicted erosion and sediment delivery of fallout plutonium, Journal of Environmental Quality 13(4): (1984) 595-602.
[45] QUEIRAZZA, G., GUZZI, L., AND CIGNA, A., “Radionuclides in the Po river ecosystem after the Chernobyl accident” IVe Symposium international de radioécologie de Cadarache. Impact des accidents d'origine nucléaire sur l'environnement, Cadarache CEA (1988). E15-E23
[46] MATSUNAGA, T., AMANO, H., UENO, T., YANASE, N., KOBAYASHI, Y. The role of suspended particles in the discharge of 210Pb and 7Be within the Kuji river watershed, Japan, Journal of Environmental Radioactivity 26 (1995) 3-17.
[47] JOSHI, S.R., MCREA, R.C., SHUKLA, B.S. ROY, J.-C., Partitioning transport of lead-210 in the Ottawa river watershed (1991) Water, Air and Soil Pollution 59 311-320.
[48] MATSUNAGA, T., “The fate of several radionuclides derived from atmospheric fallout in a river watershed” Trace elements, their distribution and effects in the environment (MARKERT, B. FRIESE, K., Eds), , Elsevier, Amsterdam (2000).
[49] KUDELSKY, A., PASHKEVICH, V., PETRYAYEV, Y., OVSYANNIKOVA, S. SOKOLIK, G., “Physical and chemical features of the Chernobyl nuclides migration processes in the rivers of Belarus.”, Freshwater and estuarine radioecology (Desmet G. Ed), Proc. of an international seminar, Lisbon 21-25 March 1994. Elsevier, Amsterdam (1997) 183-190.
[50] MIYAKE, Y. TSUBOTA, H., “Estimation of direct contribution of meteoric water to river by means of fallout radiocaesium and radiostrontium”, Radioisotopes in Hydrology, IAEA, Vienna (1963) 425-431.
[51] MENZEL, R., Land surface erosion and rainfall as sources of Strontium-90 in streams. Journal of Environmental Quality 3(3) (1974) 219-223.
[52] MONTE, L., A collective model for predicting the long term behaviour of radionuclides in rivers, Science of the Total Environment 201 (1997) 17-29.
[53] MORGAN, A. AND STANBURY, D., The contamination of rivers with fission products from fallout, Health Physics 5 (1961) 101-107.
[54] MATSUNAGA, T., “The fate of several radionuclides derived from atmospheric fallout in a river watershed” Trace elements, their distribution and effects in the environment (Markert, B. Friese, K., Eds), Elsevier, Amsterdam (2000).
[55] SPEZZANO, P., HILTON, J., LISHMAN, J., CARRICK, T., The variability of Chernobyl Cs retention in the water column of lakes in the English lake district, two years and four years after deposition. Journal of Environmental Radioactivity 19(3) (1993) 213-232.
414
APPENDIX
list of publication used for evaluation of parameters of wash-off from watersheds
ALBRECHT A., REICHERT P., BEER J., LÜCK A., Evaluation of the importance of reservoir sediments as sinks for reactor-derived radionuclides in river Ine systems, Journal of Environmental Radioactivity 28(3) (1995) 239-269
ALBRECHT A., Validating riverine transport and speciation models using nuclear reactor-derived radiocobalt, Journal of Environmental Radioactivity 66(3) (2003) 295-307
ANDREOLA M., CAMBIAGHI M., GURIZZAN G., STROBINO G., BOZZANI A., QUEIRAZZA G., Modelling sediment and radionuclide transport in the Pô river: the Cadraf code” Advances in environmental modelling (MARANI A. Ed) (1988) 313-342
BALE A.J., The characteristics, behaviour and heterogeneous reactivity of estuarine suspended particles, Ph. D. Thesis (1987).
BARROS H., LAISSAOUI A., ABRIL J., M. Trends of radionuclide sorption by estuarine sediments. Experimental studies using 133Ba as a tracer, Science of The Total Environment 319(1-3) (2004) 253-267.
BARROS H., ABRIL J., Experimental and modelling study on the uptake and desorption kinetics of 133Ba by suspended estuarine sediments from southern Spain, Water Research, Volume 38, Issue 3, (2004) 749-755.
BATTAGLIA A., BONFANTI G., CATTANEO C., DE PASQUALE N., “A method for field determinations of the chemical and physical characteristics of radionuclides after release into the river water” 6th Int. Congress of the International Radiation Protection Association 2 Verlag TUV Rehinland Gmbh, Köln (1984) 891-894.
BENES P., STREJC P., Interaction of radium with freshwater sediments and their mineral components. IV. Waste water and riverbed sediments, Journal of Radioanalytical and Nuclear Chemistry 99(2) (1986) 407-422.
BENES P., KUNCOVA M., SLOVAK J., RAMOS P.L., Analysis of the interaction of radionuclides with solid phase in surface waters using laboratory model experiments: methodical problems, Journal of Radioanalytical and Nuclear Chemistry 125(2) (1988) 295-315.
BIRD G.A., SCHWARTZ W.J., ROSENTRETER J., Evolution of 131I from freshwater and its partitioning in simple aquatic microcosms, Science of the Total Environment 164(2) (1995a) 151-159
BIRD G.A., MOTYCKA M., ROSENTRETER J., SCHWARTZ W.J., VILKS P., Behaviour of 125-I added to limnocorrals in two Canadian shield lakes of differing trophic states, Science of the Total Environment 166(1-3) (1995-b) 161-177
BIRD G.A., SCHWARTZ W.J., 1997. Partition coefficients (Kd values) for Tc in shield lake sediments under oxidizing and reducing conditions, Water Research 31(7), 1673-1678.
CARTIER Y. JOUEN R., FEUERSTEIN J., Rétention des principaux radionucléides dans les rejets normaux d'un réacteur à eau pressurisée par les sédiments charriés en suspension et les dépôts sédimentaires de la Garonne au voisinage du site de Golfech. Rapport de IPSN/DPEI/SERE, note SRP 90/09 (1990-a).
CARTIER Y. JOUEN R., FEUERSTEIN J., Rétention des principaux radionucléides dans les rejets normaux d'un réacteur à eau pressurisée par les sédiments charriés en suspension et les dépôts sédimentaires de la Meuse au voisinage du site de Chooz. Rapport de IPSN/DPEI/SERE, note SRP 90/20 (1990-b).
CARTIER Y. JOUEN R., FEUERSTEIN J., Etude de la rétention de l'iode présent en phase aqueuse par les matières en suspension (M.E.S.) des cours d'eau–cas du Rhône, de la Loire et de la Seine, Rapport de IPSN/DPEI/SERE, note SRP 90/31(1990-c).

415
CARVAHLO F, Distribution, cycling and mean residence time of 226Ra, 210Pb and 210Po in the
Tagus estuary, The Science of the Total Environement 196 (1999) 151-161
CICERI G., TRAVERSI A. L., MARTINOTTI W., QUEIRAZZA G., Radionuclide partitioning
between water and suspended matter: comparison of different methodologies, Studies in Environmental Science 34 (1988) 353-375.
CIFFROY P., SICLET F., HUMBERT B., “In situ determination of 110mAg, 58
Co, 60
Co and 54
Mn distribution between freshwater and suspended matter”, International Symposium on environmental impact of radioactive realeases, IAEA-SM-339/90 (1995) 299-309.
COCHRAN J. K., MORAN S. B., FISHER N. S., BEASLEY T. M., KELLEY J. M., 2000. Sources and transport of anthropogenic radionuclides in the Ob river system, Siberia, Earth and Planetary
Science Letters 179(1) 125-137.
COMANS R. N. J., MIDDELBURG J. J., ZONDERHUIS J., WOITTIEZ J. R. W., DE LANGE G. J., DAS H. A., VAN DER WEIJDEN C. H., Mobilization of radiocaesium in pore water of lake
sediments, Nature 339(5) (1989) 367-369.
COMANS R. N. J., HOCKLEY D., Kinetics of caesium sorption on illite, Geochimica et
Cosmochimica Acta 56(3) (1991) 1157-1164.
CONKIC L., BIKIT I., VANCSURA P., SLIVKA J., IVO M., MARINKOV L., SIMOR J., Concentration factors of 137Cs in river sediment, Water Research 22(2) (1988) 241-243.
COPPIN F., ROUSSEL-DEBET S., Comportement du 210
Po en milieu terrestre: revue bibliographique, Radioprotection 39(1) (2004) 39-58
CURTIS G. P., FOX P., KOHLER M.,, DAVIS J. A., Comparison of in situ uranium Kd values with a laboratory determined surface complexation model, Applied Geochemistry 19(10) (2004) 1643-1653.
DIBB J.E., RICE D.L., 1989. The geochemistry of beryllium-7 in Chesapeake Bay. Estuarine, Coastal
and Shelf Science 28 379-394.
DIEM D., STUMM W., 1984. Is dissolved Mn2+ being oxidized by O2 in absence of Mn bacteria or
surface catalysts? Geochimica et Cosmochimica Acta 48(7) 1571-1573.
DRNDARSKI N. D., LAVI N., Radioactivity in sediments from the Grliska impoundment, Water
Research 30(6) (1996) 1539-1542
ELPRINCE A. M., 1978. Effect of pH on the adsorption of trace radioactive caesium by sediments, Water Resources Research 14(4) 696-698.
FENG H., COCHRAN J.K., HIRSCHBERG D.J., 234
Th and 7Be as tracers for the transport and
dynamics of suspended particles in a partially mixed estuary, Geochimica and Cosmochimica Acta
63(17) (1999) 2487-2505.
GARNIER J.-M., MARTIN J.-M., MOUCHEL J.-M., SIOUD K., Partitioning of trace metals between the dissolved and particulate phases and particulate surface reactivity in the Lena river and the Laptev
sea (Russian Federation), Marine Chemistry 53(3-4) (1996) 269-283.
GAUR S., Determination of Cs-137 in environmental water by ion-exchange chromatography, Journal
of Chromatography A 733(1-2) (1996) 57-71.
HEMMING C. H., BUNDE R. L., LISZEWSKI M. J., ROSENTRETER J. J., WELHAN J., Effect of experimental technique on the determination of strontium distribution coefficients of a surficial
sediment from the Idaho national engineering laboratory, Idaho. Water Research 31(7) (1997) 1629-1636.
ILUS E., SAXEN R., Accumulation of Chernobyl-derived 137-Cs in bottom sediments of
some Finnish lakes, Journal of Environmental Radioactivity 82(2) (2005) 199-221.


FRESHWATER ECOSYSTEMS

419
PHYSICAL PROCESSES IN FRESHWATER ECOSYSTEMS
L. MONTE Ente per le Nuove Tecnologie, l’Energia e l’Ambiente (ENEA), Rome, Italy
R. PERIAÑEZ University of Seville, Spain
P. BOYER Institut de Radioprotection et de Sûreté Nucléaire (IRSN), Centre de Cadarache, Saint Paul-lez-Durance, France
J.T. SMITH University of Portsmouth, United Kingdom
J.E. BRITTAIN University of Oslo, Norway
Abstract
In the present paper the main methodological approaches to model the physical processes controlling the migration of
radionuclides through water ecosystems are presented and discussed. These processes include the dispersion and the transport
through the water and the migration from and to the bottom sediments caused by the settling and the re-suspension of
contaminated particles of suspended matter. The equations that control the above processes and that are used by most existing
state-of-the-art models are listed and briefly discussed and motivated. Values of the parameters in the equations have been
selected following a review of information available from the scientific literature.
1. PROCESSES INVOLVED
Modelling the behaviour of contaminants in aquatic ecosystems requires the quantitative assessment of phenomena of hydraulic, geochemical, sedimentological, ecological and anthropogenic nature.
Hydraulic processes are mainly responsible of the transport of toxic substances by water, whereas geochemical processes influence the interaction of dissolved radionuclides with suspended matter and bottom sediments. Sedimentation and resuspension are of importance for controlling the two-way migration of radionuclides from the water column to the bottom sediments and vice versa. Thus, the main physical processes controlling the migration of radionuclides in water bodies are [1]:
1) Diffusion and dispersion caused by gradients of concentration and the turbulent motion of water;
2) Transport caused by the water current;
3) Exchanges of contaminants between the dissolved and solid phases;
4) Deposition and re-mobilisation of the radionuclide following the interaction with suspended matter and bottom sediments;
Processes 1) and 2) are independent of the radionuclide characteristics, whereas processes 3) and 4), being related to physical and chemical properties of the pollutant, depend on the radionuclide.

420
Recently models for predicting the migration of radionuclides through the abiotic components of the freshwater ecosystem have been analysed and assessed [1-3]. This paper describes the physical processes that are accounted for by state-of-the-art models to predict the behaviour of radioactive substances in water bodies and provides a review of values of the parameters in the equations describing such processes.
2. DIFFUSION AND DISPERSION PROCESSES
Diffusion is the process that implies a movement of molecules from regions of space of high concentration to regions of low concentration. The radionuclide flux, F (Bq m-2 s-1), due to diffusion is related to the concentration gradient (Fick’s first law):
F = −E ⋅ grad(C) (1)
where grad is the gradient of C ( Cz
kCy
jCx
iCgrad∂
∂
∂
∂
∂
∂++=)( ), C is the radionuclide
concentration in water, and i, j and k are the unit vectors along the coordinate axes × , y and z. E is a 3x3 component symmetric tensor (the diffusion tensor).
The values of the diffusion tensor components for molecular diffusion depend on the temperature and the mass of particles. Consequently, they depend on the specific features of radionuclide. The order of magnitude of E in water ranges from 10-10 to 10-6 m2 s-1.
Diffusion originates from a thermal motion of molecules (molecular diffusion). However, the diffusion of a pollutant due to disordered, turbulent motion of water is usually also modelled by equation (1) by analogy with Fick’s first law.
In rivers, the water current is not uniform across the water column, having a maximum value at the surface and decreasing with depth due to friction against the bottom. This velocity profile is the cause of shear dispersion. If a radionuclide is released at the surface, it is partially transported downwards in the water column due to diffusion. However, radionuclides at the surface are advected faster than radionuclides at deeper locations since the velocity at the surface is greater. Thus, the volume of contamination suffers a deformation as indicated in Figure 1, along the direction of the current in the upper part of the water column.
The overall result is an enhanced dispersion in the current direction. Shear dispersion is included in 3-dimensional diffusion models, since they solve the vertical current profile, but not in the case of 2-dimensional, depth-averaged models. Horizontal current shear also produces shear dispersion. In the case of a river, currents are stronger at the centre than along shores due to friction. The shear effect will enhance mixing along the channel. In 2-dimensional diffusion models this horizontal shear is included since the hydrodynamic model automatically produces the current distribution outlined above. However, if a 1-dimensional model is applied, the effective diffusion coefficient must be increased to account for this horizontal shear. The effective dispersion coefficient depends on the spatial grid size used in the numerical solution of the diffusion equation: coarse grids require larger diffusion coefficients because larger eddies cannot be solved and their effects have to be described as turbulent mixing.
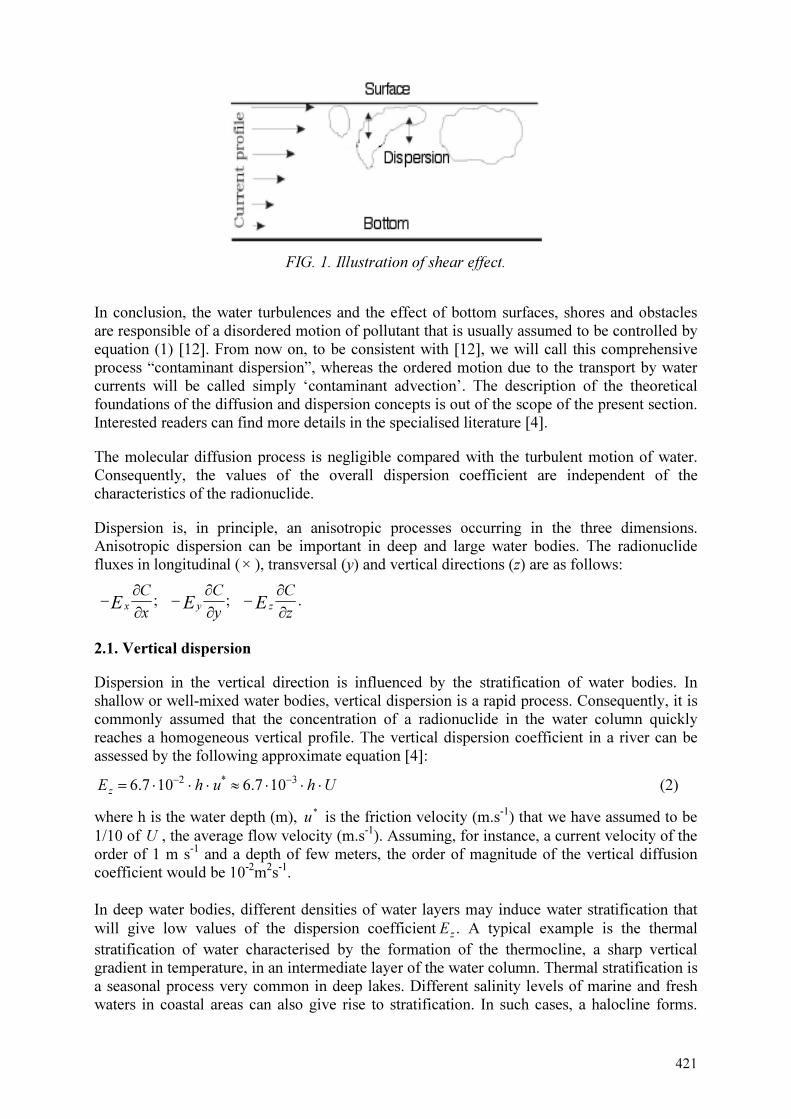
421
FIG. 1. Illustration of shear effect.
In conclusion, the water turbulences and the effect of bottom surfaces, shores and obstacles are responsible of a disordered motion of pollutant that is usually assumed to be controlled by equation (1) [12]. From now on, to be consistent with [12], we will call this comprehensive process “contaminant dispersion”, whereas the ordered motion due to the transport by water currents will be called simply ‘contaminant advection’. The description of the theoretical foundations of the diffusion and dispersion concepts is out of the scope of the present section. Interested readers can find more details in the specialised literature [4].
The molecular diffusion process is negligible compared with the turbulent motion of water. Consequently, the values of the overall dispersion coefficient are independent of the characteristics of the radionuclide.
Dispersion is, in principle, an anisotropic processes occurring in the three dimensions. Anisotropic dispersion can be important in deep and large water bodies. The radionuclide fluxes in longitudinal (× ), transversal (y) and vertical directions (z) are as follows:
−xE∂C
∂x; −
yE∂C
∂y; −
zE∂C
∂z.
2.1. Vertical dispersion
Dispersion in the vertical direction is influenced by the stratification of water bodies. In shallow or well-mixed water bodies, vertical dispersion is a rapid process. Consequently, it is commonly assumed that the concentration of a radionuclide in the water column quickly reaches a homogeneous vertical profile. The vertical dispersion coefficient in a river can be assessed by the following approximate equation [4]:
Ez= 6.7 ⋅10
−2⋅ h ⋅ u
*≈ 6.7 ⋅10
−3⋅ h ⋅U (2)
where h is the water depth (m), *
u is the friction velocity (m.s-1) that we have assumed to be 1/10 of U , the average flow velocity (m.s-1). Assuming, for instance, a current velocity of the order of 1 m s-1 and a depth of few meters, the order of magnitude of the vertical diffusion coefficient would be 10-2m2s-1.
In deep water bodies, different densities of water layers may induce water stratification that will give low values of the dispersion coefficient E
z. A typical example is the thermal
stratification of water characterised by the formation of the thermocline, a sharp vertical gradient in temperature, in an intermediate layer of the water column. Thermal stratification is a seasonal process very common in deep lakes. Different salinity levels of marine and fresh waters in coastal areas can also give rise to stratification. In such cases, a halocline forms.

422
Similarly, a chemocline is defined as a water layer showing a significant gradient of a dissolved chemical substance and a lutocline is a layer showing a gradient in suspended matter concentrations.
Several empirical estimates of the vertical dispersion coefficient in lakes are available from the literature (Table 1). It should be noted that the term diffusion is frequently used to denote this process as, in the absence of shear stresses in lakes, turbulences are the main responsible of disordered water mixing.
The values in Table 1 were generally obtained by calibration of the diffusion equation for predicting the distribution of substances dissolved in the water column. A selection of values was previously reported in [8] from an analysis of literature data of parameters used in ecological models. The values for the epilimnion (the upper well-mixed water layer in stratified lakes) were of the order of 10-2–10-4 m2 s-1. Such high values are induced by mechanical processes of water turbulence, such as wind action, and by the daily cycles of water warming and cooling that are common to the different kinds of water bodies.
The vertical dispersion coefficient through the thermocline (or chemocline/halocline), during the water stratification, is orders of magnitude lower (6. × 10-9–10-6 m2 s-1). The minimum values of E
z in [9] were measured at specific hours of the day. In general, the daily maximum
values were at least one order of magnitude higher. Deep lakes show higher values of the vertical dispersion coefficient in the epilimnion than shallow lakes. Consequently, from the values here reported, it is possible to conclude that the contaminant is homogeneously distributed in the epilimnion of a lake after a few days. Intermediate values of E
z were
obtained for the deep layers below the thermocline (hypolimnion).
Stratification in rivers is less frequent than in lakes due to the mechanical mixing processes induced by the water current, the obstacles and the varying morphometric characteristics that can cause water turbulence along the river course. Nevertheless, the water column of deep, gently meandering rivers can be affected by thermal stratification processes. Ez may also be calculated using turbulence models [11].
2.2. Transversal and longitudinal dispersion
Horizontal transport in lake surface water is caused by currents and also induced by the effect of wind. Changes in wind intensity and direction can induce disorganised water movements and mixing that can be modelled, on the long term, by the diffusion equation . The horizontal dispersion coefficient in lakes can be several orders of magnitude higher than E
z through the
thermocline of stratified waters. Values ranging from 10-3 to 10-2 m2 s-1 were measured by Quay, et al. [5].

423
TABLE 1. SELECTED VALUES OF THE VERTICAL DISPERSION COEFFICIENT IN LAKES
Values (m2 s-1) Conditions Methodology Reference
10-9-10-8 Lakes, thermocline Injection of tritiated water in two small temperate
dimictic lakes.
[5]
1.5 × 10⁻⁷ Diffusion across
chemocline in stagnant
lake
Calibration of a model [6]
1. × 10-6 Diffusion across
thermocline during
stratification. Lakes in
central Italy.
Calibration of a model to predict the diffusion of
dissolved 134Cs of Chernobyl origin in water
[7]
10-2 Lakes, epilimnion Collection of literature data [8]
6. × 10-5 -1. × 10-2 Epilimnion, lakes Erie and
Ontario (Canada)
H2O2 used as a natural, photochemically produced
tracer. Values were measured at specific hours of
the day (minimum value at 15 h, maximum at 12
h).
[9]
5. × 10-6 -5. × 10-4 Epilimnion, Jacks Lake
(Canada)
H2O2 used as a natural, photochemically produced
tracer. Values were measured at specific hours of
the day (minimum value at 17 h, maximum at 14
h).
[9]
6. × 10-4 Lakes in central Italy.
From epilimnion to deep
water during water mixing
Calibration of a model to predict the diffusion of
dissolved 134Cs of Chernobyl origin in water
[7]
10-7–10-5 Diffusion in deep water
layer. Lake Baikal
Calibration of a model to predict diffusion of
substances
[10]
10-7-10-6 Lakes, hypolimnion Injection of tritiated water in two small temperate
dimictic lakes
[5]
1. × 10-4 Diffusion in deep layers
below thermocline.
Collection of data from a literature search [8]
Suggested ranges and values
Range (m2 s-1) Value (m2 s-1) Water layer
< 10-6 10-7 Through thermocline (during stratification)
> 10-4 10-3 Epilimnion
10-7 – 10-4 10-4 (accounting for the
different stratification
conditions during the year)
Hypolimnion
Evaluations of longitudinal and transversal dispersion coefficients in rivers are available from
the literature. IAEA suggests values ranging from 7.6 10-1
to 1.5 103 m
2 s
-1 and from 4.8 10
-3
to 1.1 m2 s
-1 for, respectively, the longitudinal ( E
x) and the transverse ( E
y) dispersion
coefficients in several North America rivers [12]. It is generally recognised that values of
these parameters are higher in large rivers. Moreover, the values of the dispersion coefficients
in a river are strongly influenced by the water velocity. Turbulence effects imply that, in a
given river, the dispersion coefficient increases with the water flux. As an example,
evaluations derived from dye tracer experiments suggested the following quadratic
relationship between the longitudinal dispersion coefficient (m2s
-1) and the water flux Q
(m3s
-1) E
x= 0.0148Q
2+ 0.33Q in the river Thames [13]. An approximate estimate of Ex can
be obtained by the following formula [4]:
Ex≈
0.11⋅U ⋅2
L
h (3)
where L is the width of the river. There is no theoretical relationship for transverse diffusivity
in rivers because this parameter depends on the characteristics of the river. Nevertheless, for
rivers with low meandering, it was suggested that Ey can be approximated by a semi-
empirical formula such as taken from [12, 14]:
424
Ey≈ 0,6 ⋅ h ⋅ u* ≈ 6 ⋅10
−2⋅ h ⋅U (4)
giving values of the order of 10-2 – 10-1 m2 s-1.
It should be noted that, on the basis of the values of diffusion coefficients, in the order of a few hours or days are required for achieving relatively complete transverse mixing. In the case of steady state (the contaminant input rate is a constant independent of time) point-source
conditions, complete transverse mixing in a river is achieved when x
L>>
Ex
Ey
, where × is
the distance from the contaminant source. The use of formulae (16) and (17) gives reason of the usual assumption that a complete mixing in lateral direction is approximately achieved
when x > 3
2
L
h [14].
3. TRANSPORT BY THE CURRENT
Whereas dispersion is due to the turbulent components of the water flow, advection (the transport by the water current) is related to the average, ordered water movement.
The radionuclide flux (F) per unit surface of the water body section (Bq m-2 s-1) due to water advection is related to the concentration C of radionuclide (Bq m-3) and to the water velocity v (m s-1) by the following equation:
CvF ⋅= (5)
Formula (19) was obtained by dividing the total amount of substance flowing, per unit time, through the surface S, by the surface area.
It is quite obvious that parameter v in the pollutant advection equation is of hydrological nature and is independent of the pollutant. Ordinarily, v in rivers ranges from few decimetres per second to > 1 m s-1, depending on the river characteristics and on the hydraulic regime. Dispersion and advection are processes common to any kind of substance in dissolved form or attached to suspended matter as the contaminant movement is only caused by the water movements. The focus now shifts to assessing those processes that depend on radionuclide specific characteristics.
4. INTERACTION BETWEEN DISSOLVED AND SOLIDS PHASES OF RADIONUCLIDES
Although the interaction between dissolved and solids phases of contaminant is the subject of a specific section, here a brief outline is given of some concepts that can be useful for understanding the contents of the present section. This process relates to both the exchange between the radionuclides dissolved in the water column and those absorbed on the suspended matter and the exchanges between the radionuclides dissolved in the sediment interstitial water and those absorbed on the sedimented material.
The process of interaction of dissolved radionuclides with solids particles in suspension or deposited, is usually modelled according to the ‘
dK concept’, where
dK is the partition
coefficient ‘particulate form/dissolved form’ based on the hypothesis of a reversible and rapid

425
equilibration between the dissolved (w
C , Bq m-3) and the adsorbed phases (s
C , Bq kg-1) of
radionuclide
w
s
d
C
CK = (6)
However, this is not generally and rigorously true for every contaminant substance. The equilibrium between the concentrations of the dissolved and the attached phases may be not instantaneously achieved and the adsorption and desorption processes are not always rapidly reversible [15-17].
Thus, the most simple model to simulate the time behaviour of the radionuclide interaction with solid particles is based on a first order kinetics:
)(swd
sCCKb
dt
dC−⋅⋅= (7)
where b is the rate (s-1) of radionuclide desorption between the attached and the dissolved phases. If b is large, the equilibrium condition is rapidly attained. Moreover, if b is significantly larger than the time constants of other pollutant migration processes occurring in the aquatic environment, the time behaviour of the radionuclide interaction with solid particles is of negligible significance in relation to the expected time resolution of migration models. It is worthwhile to note that the processes of interaction of radionuclides with particulate matter can be very complicated. Neither equation (6) nor equation (7) simulate in their entirety such complex processes [18] that is analysed, in detail, in paper Ciffroy et al. ‘Distribution of radionuclides between solid and liquid phases in freshwaters’ of this TecDoc.
The interaction of radionuclides with bottom sediments and suspended particles is also controlled by complex environmental processes such as the sedimentation and the resuspension. The aim of the next section ‘Migration to and from sediments’ is to describe the approaches commonly used to simulate these processes in models for predicting the behaviour of radionuclides in fresh water systems.
Migration to and from sediments
Conceptually, three main active compartments can be assumed to be involved in the processes of radionuclide interactions with sediments and suspended matter (Figure 2). Such a schematic approach is used by the most state-of-the-art models to evaluate the radionuclide migration to and from sediments (suspended matter) by including, in a pragmatic way, three active compartments and seven main ‘aggregated’ radionuclide transformation/transfer processes from water to sediments or suspended matter and vice versa.
The active compartments are (Figure 2.):
• Dissolved radionuclide in water (C ); • Particulate radionuclide -rapid exchange component ( fD );
• Particulate radionuclide–slow exchange component (s
D );
A fourth ‘passive compartment’ (deep sediment) is used to represent the radionuclide subject to non-reversible removal processes from the active sediments. C, Df and Ds are the total amount of radionuclides in the three active compartments. The fluxes (Bq s-1) from a compartment can be calculated as the product of the total amount of radionuclide in the compartment (Bq) multiplied by the ‘rates’ (s-1) of migration (Kwf, Kfw, Ksf, Kfs, Kws, Ksw, Ks).
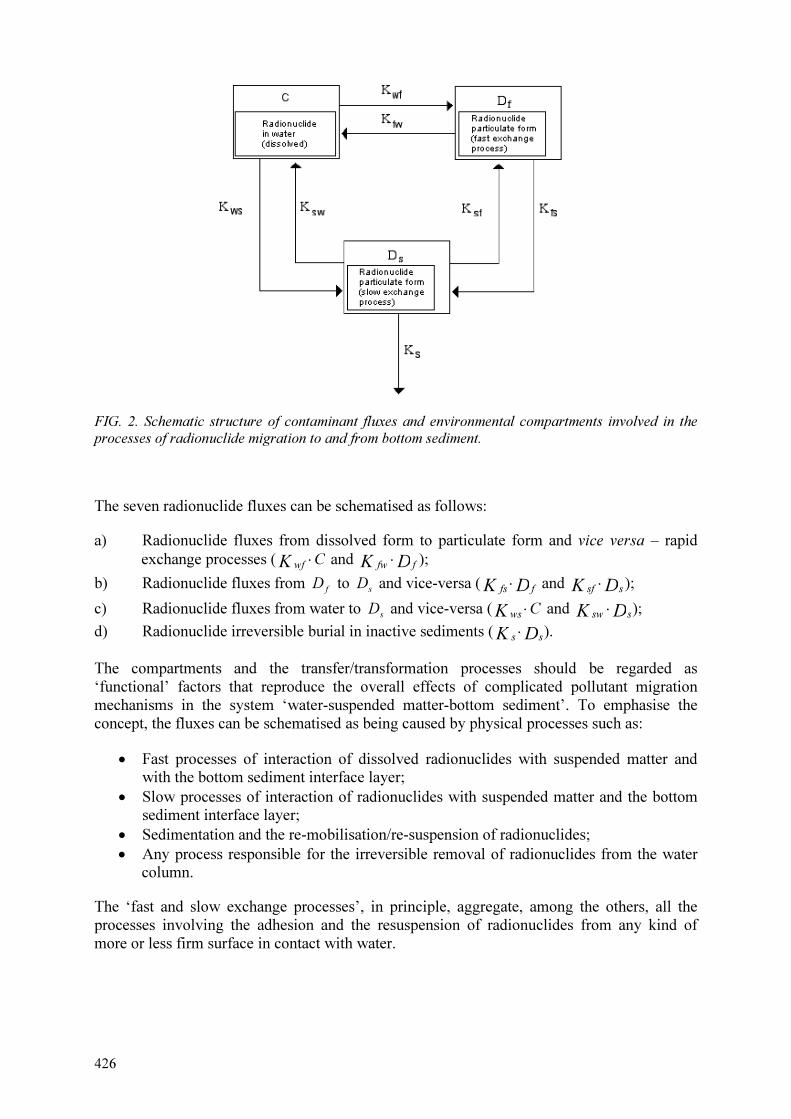
426
FIG. 2. Schematic structure of contaminant fluxes and environmental compartments involved in the
processes of radionuclide migration to and from bottom sediment.
The seven radionuclide fluxes can be schematised as follows:
a) Radionuclide fluxes from dissolved form to particulate form and vice versa – rapid
exchange processes ( wfK ⋅C and fwK ⋅ fD );
b) Radionuclide fluxes from fD to s
D and vice-versa ( fsK ⋅ fD and sfK ⋅ sD );
c) Radionuclide fluxes from water to s
D and vice-versa (wsK ⋅C and
swK ⋅
sD );
d) Radionuclide irreversible burial in inactive sediments (sK ⋅
sD ).
The compartments and the transfer/transformation processes should be regarded as
‘functional’ factors that reproduce the overall effects of complicated pollutant migration
mechanisms in the system ‘water-suspended matter-bottom sediment’. To emphasise the
concept, the fluxes can be schematised as being caused by physical processes such as:
• Fast processes of interaction of dissolved radionuclides with suspended matter and
with the bottom sediment interface layer;
• Slow processes of interaction of radionuclides with suspended matter and the bottom
sediment interface layer;
• Sedimentation and the re-mobilisation/re-suspension of radionuclides;
• Any process responsible for the irreversible removal of radionuclides from the water
column.
The ‘fast and slow exchange processes’, in principle, aggregate, among the others, all the
processes involving the adhesion and the resuspension of radionuclides from any kind of
more or less firm surface in contact with water.

427
If we hypothesise that the fast processes of interaction occurs between the dissolved and the particulate phases in water, from (21) we obtain the relationships relating b and
dK to fwK
and wfK :
bK fw =
Kwf = b ⋅Kd ⋅ Sm
where m
S (kg m-3) is the suspended matter concentration in water.
Table 2 shows examples of values of the migration rates available from the literature. The order of magnitude of wfK and fwK for suspended particulate matter in fresh water systems
suggest that, few hours or few days are sufficient for the concentrations of radionuclides in water and in suspended particulate (fast exchange process) attain the equilibrium. The corresponding values for bottom sediments are higher. Nevertheless, the equilibrium is attained in few days or, exceptionally, in few weeks.
It is worthwhile to note that the measures of wfK an fwK for bottom sediments are affected
by intrinsic uncertainties due to the difficulty of a univocal identification of the ‘fast’ and the ‘slow’ components for complex time dependent processes like those occurring in sediments. Moreover, the values in Table 2 refer to radionuclide fluxes due to the sorption and desorption processes, whereas migration processes due to particle sedimentation and re-suspension are significant in the fresh water environment.
As the equilibrium between the radionuclide dissolved in water and the radionuclide in rapid
exchange component (Df) is quickly achieved, we can write fD
C= A where A is a constant.
The flux (Ffs) per square metre (Bq m-2 s-1) of radionuclide migrating from compartment Df to
compartment Ds is fsF =
fsK ⋅ fD
S=
fsK ⋅ A ⋅C
S=
fsK ⋅ A ⋅V ⋅ wC
S= fsK ⋅ A ⋅ h ⋅ wC where V
and S are the volume and the surface of the water body, respectively. The product
fssv =K ⋅ A ⋅ h has the dimension of a velocity (the radionuclide sedimentation velocity
defined in relation to the dissolved radionuclide concentration). Finally we can write:
Ffs = vs ⋅Cw (8)
The above result was obtained from the sole hypothesis of quick equilibrium between the radionuclide dissolved in water and the radionuclide in the rapid exchange compartment. It is instructive to note that a similar formula can be obtained considering that the flux of radionuclide migrating to sediment is due to sedimentation of particulate matter:
Ffs = Sr ⋅Cs (9)
where r
S is the average sedimentation rate (kg m-2 s-1) that accounts for the dynamic balance of the particle settling to bottom sediment and of particle resuspension from sediment to water and Cs is the concentration of the radionuclide in suspended matter (Bq kg-1).
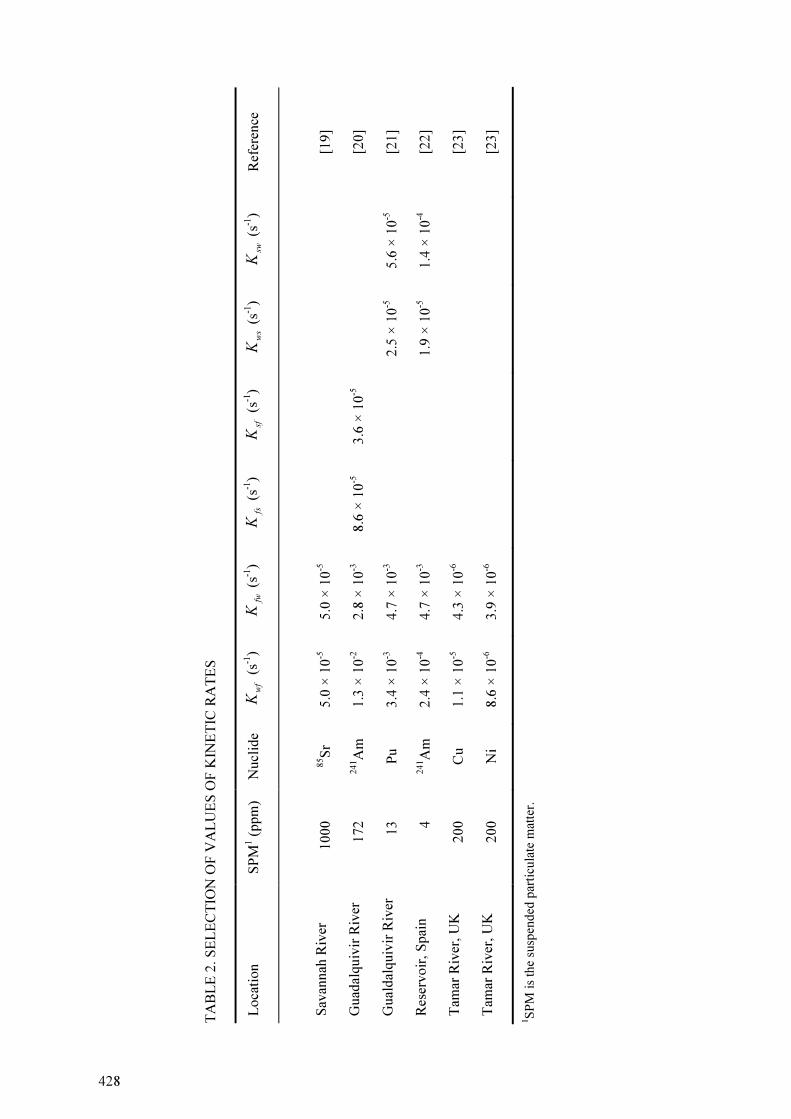
TA
BL
E 2
. S
EL
EC
TIO
N O
F V
AL
UE
S O
F K
INE
TIC
RA
TE
S
Loca
tion
SP
M1 (
pp
m)
Nucl
ide
wf
K (
s-1)
fwK
(s-1
) fs
K (
s-1)
sfK
(s-1
) ws
K (
s-1)
sw
K (
s-1)
Ref
eren
ce
Sav
annah
Riv
er
10
00
85S
r 5.0
× 1
0-5
5.0
× 1
0-5
[1
9]
Guad
alquiv
ir R
iver
1
72
241A
m
1.3
× 1
0-2
2.8
× 1
0-3
8.6
× 1
0-5
3.6
× 1
0-5
[2
0]
Gual
dal
quiv
ir R
iver
1
3
Pu
3.4
× 1
0-3
4.7
× 1
0-3
2.5
× 1
0-5
5.6
× 1
0-5
[2
1]
Res
ervoir
, S
pai
n
4
241A
m
2.4
× 1
0-4
4.7
× 1
0-3
1.9
× 1
0-5
1.4
× 1
0-4
[2
2]
Tam
ar R
iver
, U
K
20
0
Cu
1.1
× 1
0-5
4.3
× 1
0-6
[2
3]
Tam
ar R
iver
, U
K
20
0
Ni
8.6
× 1
0-6
3.9
× 1
0-6
[2
3]
1S
PM
is
the
susp
ended
par
ticu
late
mat
ter.
428

429
If the d
K concept can be applied and one-step kinetics is assumed, from equations (20) and
(23) we obtain equation (22) where KS rvsd
⋅= .The flux of dissolved radionuclide in water
that is adsorbed to bed sediment per second and per square metre is frequently assumed to be
approximately proportional to the concentration of dissolved radionuclide in water. Therefore,
the total radionuclide flux from the water column to sediment is:
wswsCvvF ⋅+= )( (10)
where v is the ‘migration velocity’ of the dissolved phase that accounts for the direct
interaction of the dissolved radionuclide with the bottom sediments.
The following formulas can be used to evaluate the main radionuclide fluxes:
• Flux from water to bottom sediment: ws
F =
ws⋅
vw
C
• Flux from bottom sediment to water: Fsw
=sw
*
K ⋅s
*
D ;
• Flux from bottom sediment to passive sediment: Fds=K
s⋅
s
*
D .
vws= v +
sv (m s-1
) is the radionuclide migration velocity from water to bottom
sediment, sw*
K = Ksw +Ksf (s-1
) and Ks (s-1
) are, respectively, the rate of radionuclide
migration from sediment to water and to passive sediment and s
*
D is the radionuclide deposit
per square metre in the active layer of the bottom sediment (Bq m-2
) where the slow exchange
processes of radionuclide are supposed to occur
Many models suggest suitable formulae that allow one to calculate v as functions of physical
and chemical characteristics of the sediment, for instance:
v = r ⋅ (1− e) ⋅ aws⋅ d ⋅K
d (11)
where r is the sediment density, e is the sediment porosity, d is the ‘effective thickness’ of the
contaminated upper layer of bottom sediment, ws
a is the rate of radionuclide exchange
‘water-bottom sediment’ and Kd is the partition coefficient [24]. Similarly, in several models
the rates are related to specific physical and chemical characteristics of sediments or to the
prevailing environmental features of the water system [25]. For radiocaesium, detailed
modelling of diffusion in freshwater sediments has been carried out by Smith and co-workers
[26-27]. It should be noted that for many of the parameters in the quoted formulae, site-
specific evaluations are necessary for the proper application of the relevant models.
Following the analysis of data from severe accidents in recent decades, evaluations of
aggregated parameters wsv ,
swK and K
s are available for
90Sr and
137Cs, two long-lived
radionuclides of relevance for the aquatic environment.
Table 3 gives indicative ranges of values of migration parameters for strontium and caesium.
These values were obtained by assessing the data reported by Smith, et al. [28, 29]; Monte et
al. [1, 30], IAEA [31] and Shukla [32]. Evaluations of radionuclide deposition velocity for
plutonium are available for the Great Lakes in North America. The relevant range was from
1.0 10-6
to 3.5 10-6
m s-1
[32]. Similar data for other radionuclides are not available. However,
it should be noted that radiocaesium and radiostrontium, due to their different chemical
characteristics, can be considered as reference radionuclides covering a wide range of
mobility in the aquatic environment.

430
TABLE 3. INDICATIVE RANGES OF MODEL PARAMETER VALUES FOR 137Cs AND 90Sr IN FRESHWATER ENVIRONMENT
90
Sr 137
Cs
Parameter Min. Max. GM GSD Min. Max. GM GSD
vws (m s-1
) 6.4 × 10⁻⁸
1.4 × 10⁻⁷
9.6 × 10⁻⁸
1.4 6.8 × 10⁻⁷
2.9 × 10⁻⁶
9.8 × 10⁻⁷
2
Ksw (s-1
) 5.7 × 10⁻¹⁰
3.0 × 10⁻⁸
5.0 × 10⁻⁹
2.6 1.1 × 10⁻⁸
1.4 × 10⁻⁷
3.4 × 10⁻⁸
2.9
Ks (s-1
) ≈0 8.8 × 10⁻¹⁰
<1.0 × 10⁻⁹
1.5 5.8 × 10⁻⁹
1.6 × 10⁻⁸
8.0 × 10⁻⁹
1.6
5. CONCLUSIONS
Most of the available state-of-the-art models for predicting the behaviour of radioactive
substances in the abiotic compartments of freshwater systems show a common overall
structure (Figure 2) and are based on the assessment of radionuclide fluxes in the balance
equation. Although simplifications and approximations are possible and are used to different
degrees by modellers, there are no significant conceptual differences among the theoretical
formulations of the models at this basic stage. As shown above, models make use of different
hypotheses to approach the complex problem of modelling the physical and chemical
behaviour of radioactive substances in water bodies. The equations that are used by models
represent more or less coarse approximations of complex processes that, in principle, depend
on a variety of environmental, hydraulic, hydrochemical, etc. characteristics of the water
bodies. The models essentially differ in the values of the transfer parameters or in the sub-
models used to assess these. Moreover, different formulations for evaluating the fluxes of
radionuclides are possible depending on the assumed hypotheses. This gives rise to a number
of different existing models. There is no convincing evidence of successful ‘crucial’ tests to
select univocally a single model or a set of transfer parameters. Therefore, the use of different
modelling approaches is deemed advantageous for the interpretation of the model results in
practical applications.
REFERENCES
[1] MONTE, L. BRITTAIN, J. E., HÅKANSON, L., HELING, R., SMITH, J. T., ZHELEZNYAK, M., Review and assessment of models used to predict the fate of radionuclides in lakes, Journal of Environmental Radioactivity 69 2003. 177-205.
[2] MONTE, L. BRITTAIN, J. E., HÅKANSON, L., SMITH, J. T., VAN DER PERK M., Review and assessment of models used to predict the fate of radionuclides from catchments, Journal of Environmental Radioactivity 75 (2004) 83-103.
[3] MONTE, L., BOYER, P., BRITTAIN, J.E., HÅKANSON, L., LEPICARD, S., SMITH, J. T., Review and assessment of models for predicting the migration of radionuclides through rivers, Journal of Environmental Radioactivity 79 (2005) 273-296.
[4] FISHER, B.F., LIST, E.J., KOH R.C.Y., IMBERGER, J., BROOKS N.H., Mixing in Inland and Costal Waters, Academic Press, Inc, Orlando, Florida (1979).
[5] QUAY, P.D., BROECKER, W.S., HESSLEIN, R.H., FEE, E.J., SCHINDLER, D.W., “Whole lake tritium spikes to measure horizontal and vertical mixing rates”, Isotopes in Lake Studies, Panel Proceedings Series, IAEA, Vienna, STI/PUB/511. (1979) 175-193
[6] LANDING, W.M., Nutrient cycling and the biogeochemistry of manganese, iron, and zinc in Jellifish Lake, Palau, Limnology and Oceanography 36 (1991) 515-525.
[7] MONTE, L., A predictive model for the behaviour of dissolved radioactive substances in stratified lakes, Journal of Environmental Radioactivity 13 (1991) 297-308
[8] Handbook of Environmental Data and Ecological Parameters, (JØRGENSEN, S. E.Ed.), International Society for Ecological Modelling, ISBN 87 87257 (1997) 165

431
[9] SCULLY, N.M., VINCENT, W.F., LEAN, D.R.S., MACINTYRE, S., Hydrogen peroxide as a natural tracer of mixing in surface layers, Aquatic Sciences 60 (1998) 169-186.
[10] KIPFER, R., HOFER, M., PEETERS, F., IMBODEN, D.M., DOMYSHEVA, M. Vertical turbulent diffusion and upwelling in Lake Baikal estimated by inverse modelling of transient tracers, Journal of Geophysical Research-Oceans 1005 (2000) 3451-3464
[11] PERIÁÑEZ, R., Modelling the dispersion of radionuclides by a river plume: application to the Rhone River, Continental Shelf Research 25 (2005) 1583-1603.
[12] INTERNATIONAL ATOMIC ENERGY AGENCY Generic Models for use in Assessing the Impact of Discharge of Radioactive Substances to the Environment. Safety Report Series No 19, IAEA, Vienna (2001) 216.
[13] SMITH, J.T., BOWES, M.J., DENISON, F.H., Modelling the dispersion of radionuclides following short duration releases to rivers: Part 1. Water and sediment, Science of the Total Environment 368 (2006) 485-501.
[14] SAYRE, N. W.,. Natural mixing processes in rivers. Environmental Impact on Rivers (River Mechanics II), H.W. Shen, Fort Collins, CO. (1973)
[15] DICK S., SCHONFELD W., Water transport and mixing in the North Frisian Waden Sea. Results of numerical investigations, German Journal of Hydrography 48 (1996) 27-48.
[16] COMANS, R.N.J., HOCKLEY, D.E., Kinetics of caesium sorption on illite. Geochimica et Cosmochimica Acta 56 (1992) 1157-1164.
[17] SMITH, J.T., COMANS, R.N.J, BERESFORD, N.A., WRIGHT, S.M., HOWARD, B.J. CAMPLIN, W.C., Chernobyl’s legacy in food and water, Nature 405 (2000) 141.
[18] Delle Site, A., 2000. Factors affecting sorption of organic compound in natural sorbent/water systems and sorption coefficients for selected pollutants. A review. J. Phys. Chem. Ref. Data, 29, No. 6, 1-253
[19] STEPHENS J.A., WHICKER F.W. AMD IBRAHIM S.A., Sorption of Cs and Sr to profundal sediments of a Savannah River site reservoir, Journal of Environmental Radioactivity 38 (1998) 293-315.
[20] BARROS, H., ABRIL, J.M., Constraints in the construction and/on selection of kinetic models for the uptake of radionuclides and heavy metals by suspended particulate matter, Ecological Modelling 185 (2005) 371-386.
[21] EL-MRABET, R., ABRIL J.M., MANJÓN G., GARCÍA-TENORIO R., Experimental and modelling study of plutonium uptake by suspended matter in aquatic environments from southern Spain, Water Research 35 (2001) 4184-4190.
[22] EL-MRABET, R., ABRIL J.M., MANJÓN G. GARCÍA-TENORIO R., Experimental and modelling study of 241Am uptake by suspended matter in freshwater environments from southern Spain, Journal of Radioanalytical Nuclear Chemistry 261, (2004) 137-144.
[23] HERZL, V.M.C., MILLWARD, G.E., WOLLAST, R., ACHTERBERG, E.P., Species of dissolved Cu and Ni and their adsorption kinetics in turbid river water, Estuarine, Coastal and Shelf Science 56 (2003) 43-52
[24] ZHELEZNYAK, M. J., DEMCHENKO, R. I., KHURSIN, S. L., KUZMENKO, Y. I., TKALICH, P. V. VITIUK, N. Y., Mathematical modelling of radionuclide dispersion in the Pripyat-Dnieper aquatic system after the Chernobyl accident, Science of the Total Environment 112 (1992) 89-114.
[25] HÅKANSON, L., Suspended particulate matter in lakes, rivers and marine systems, The Blackburn Press, New Jersey, (2006) 319.
[26] SMITH, J.T., COMANS, R.N.J., Modelling the diffusive transport and remobilisation of Cs-137 in sediments: the effects of sorption kinetics and reversibility, Geochimica et Cosmochimica Acta 60(6) (1996) 995-1004.
[27] SMITH, J.T., COMANS, R.N.J, IRELAND, D.G., NOLAN, L., HILTON J., Experimental and in situ study of radiocaesium transfer across the sediment/water interface and mobility in lake sediments, Applied Geochemistry 15(6) (2000) 831-846.
[28] SMITH, J.T., KONOPLEV, A. V., BULGAKOV, A.A., COMANS, R.N.J., CROSS, M.A., KAMINSKI, S., KHRISTUK, B., KLEMT, E., DE KONING, A., KUDELSKY, A.V., LAPTEV, G., MADRUGA, M.J., VOITSEKHOVITCH, O.V., ZIBOLD, G., AQUASCOPE Technical Deliverable. Simplified models for predicting 89Sr, 90Sr, 134Cs, 137Cs, 131I in water and

432
fish of rivers, lakes and reservoirs, CEH Centre for Ecology and Hydrology, Natural Environment Research Council, Lancaster (2002)
[29] SMITH, J.T., BULGAKOV, A.A., COMANS, R.N.J., KONOPLEV, A.V., KUDELSKY, A.V., MADRUGA, M.J., RYABOV, I.N., VOITSEKHOVITCH, O.V., ZIBOLD G., 2005. The “AQUASCOPE” simplified model for predicting 89,90Sr, 131I and 134,137Cs in surface waters after a large-scale radioactive fallout, Health Physics 89 628-644.
[30] MONTE, L., KRYSHEV, I., SAZYKINA, T., Quantitative assessment of the long term behaviour of 90Sr in Lake Uruskul, Southern Urals, Russia, Journal of Environmental Radioactivity 62 (2002) 61-74.
[31] INTERNATIONAL ATOMIC ENERGY AGENCY, Modelling of the transfer of radiocaesium from deposition to lake ecosystems, Report of the VAMP Aquatic Working Group, IAEA-TECDOC-1143. Vienna, (2000).
[32] SHUKLA, B. S., Watershed, River and Lake modelling through Environmental Radioactivity, Environmental Research & Publications Inc, Ontario, Canada, (1993) 227.

433
APPENDIX
List of publication used for evaluation of parameters of physical transfer of radionuclides in
freshwater ecosystems
BARROS, H., ABRIL, J.M., Constraints in the construction and/on selection of kinetic models for the uptake of radionuclides and heavy metals by suspended particulate matter, Ecological Modelling 185 (2005) 371-386.
COMANS, R.N.J., HOCKLEY, D.E., Kinetics of caesium sorption on illite. Geochimica et Cosmochimica Acta 56 (1992) 1157-1164.
Delle Site, A., 2000. Factors affecting sorption of organic compound in natural sorbent/water systems and sorption coefficients for selected pollutants. A review. J. Phys. Chem. Ref. Data, 29, No. 6, 1-253
DICK S., SCHONFELD W., Water transport and mixing in the North Frisian Waden Sea. Results of numerical investigations, German Journal of Hydrography 48 (1996) 27-48.
EL-MRABET, R., ABRIL J.M., MANJÓN G. GARCÍA-TENORIO R., Experimental and modelling study of 241Am uptake by suspended matter in freshwater environments from southern Spain, Journal of Radioanalytical Nuclear Chemistry 261, (2004) 137-144.
EL-MRABET, R., ABRIL J.M., MANJÓN G., GARCÍA-TENORIO R., Experimental and modelling study of plutonium uptake by suspended matter in aquatic environments from southern Spain, Water Research 35 (2001) 4184-4190.
FISHER, B.F., LIST, E.J., KOH R.C.Y., IMBERGER, J., BROOKS N.H., Mixing in Inland and Costal Waters, Academic Press, Inc, Orlando, Florida (1979).
HÅKANSON, L., Suspended particulate matter in lakes, rivers and marine systems, The Blackburn Press, New Jersey, (2006) 319.
Handbook of Environmental Data and Ecological Parameters, (JØRGENSEN, S. E.Ed.), International Society for Ecological Modelling, ISBN 87 87257 (1997) 165
HERZL, V.M.C., MILLWARD, G.E., WOLLAST, R., ACHTERBERG, E.P., Species of dissolved Cu and Ni and their adsorption kinetics in turbid river water, Estuarine, Coastal and Shelf Science 56 (2003) 43-52
INTERNATIONAL ATOMIC ENERGY AGENCY Generic Models for use in Assessing the Impact of Discharge of Radioactive Substances to the Environment. Safety Report Series No 19, IAEA, Vienna (2001) 216.
INTERNATIONAL ATOMIC ENERGY AGENCY, Modelling of the transfer of radiocaesium from deposition to lake ecosystems, Report of the VAMP Aquatic Working Group, IAEA-TECDOC-1143. Vienna, (2000).
KIPFER, R., HOFER, M., PEETERS, F., IMBODEN, D.M., DOMYSHEVA, M. Vertical turbulent diffusion and upwelling in Lake Baikal estimated by inverse modelling of transient tracers, Journal of Geophysical Research-Oceans 1005 (2000) 3451-3464
LANDING, W.M., Nutrient cycling and the biogeochemistry of manganese, iron, and zinc in Jellifish Lake, Palau, Limnology and Oceanography 36 (1991) 515-525.
MONTE, L. BRITTAIN, J. E., HÅKANSON, L., HELING, R., SMITH, J. T., ZHELEZNYAK, M., Review and assessment of models used to predict the fate of radionuclides in lakes, Journal of Environmental Radioactivity 69 2003. 177-205.
MONTE, L. BRITTAIN, J. E., HÅKANSON, L., SMITH, J. T., VAN DER PERK M., Review and assessment of models used to predict the fate of radionuclides from catchments, Journal of Environmental Radioactivity 75 (2004) 83-103.

434
MONTE, L., A predictive model for the behaviour of dissolved radioactive substances in stratified lakes, Journal of Environmental Radioactivity 13 (1991) 297-308
MONTE, L., BOYER, P., BRITTAIN, J.E., HÅKANSON, L., LEPICARD, S., SMITH, J. T., Review and assessment of models for predicting the migration of radionuclides through rivers, Journal of Environmental Radioactivity 79 (2005) 273-296.
MONTE, L., KRYSHEV, I., SAZYKINA, T., Quantitative assessment of the long term behaviour of 90Sr in Lake Uruskul, Southern Urals, Russia, Journal of Environmental Radioactivity 62 (2002) 61-74.
PERIÁÑEZ, R., Modelling the dispersion of radionuclides by a river plume: application to the Rhone River, Continental Shelf Research 25 (2005) 1583-1603.
QUAY, P.D., BROECKER, W.S., HESSLEIN, R.H., FEE, E.J., SCHINDLER, D.W., “Whole lake tritium spikes to measure horizontal and vertical mixing rates”, Isotopes in Lake Studies, Panel Proceedings Series, IAEA, Vienna, STI/PUB/511. (1979) 175-193
SAYRE, N. W.,. Natural mixing processes in rivers. Environmental Impact on Rivers (River Mechanics II), H.W. Shen, Fort Collins, CO. (1973)
SCULLY, N.M., VINCENT, W.F., LEAN, D.R.S., MACINTYRE, S., Hydrogen peroxide as a natural tracer of mixing in surface layers, Aquatic Sciences 60 (1998) 169-186.
SHUKLA, B. S., Watershed, River and Lake modelling through Environmental Radioactivity, Environmental Research & Publications Inc, Ontario, Canada, (1993) 227.
SMITH, J.T., ,COMANS, R.N.J., Modelling the diffusive transport and remobilisation of Cs-137 in sediments: the effects of sorption kinetics and reversibility, Geochimica et Cosmochimica Acta 60(6) (1996) 995-1004.
SMITH, J.T., BOWES, M.J., DENISON, F.H., Modelling the dispersion of radionuclides following short duration releases to rivers: Part 1. Water and sediment, Science of the Total Environment 368 (2006) 485-501.
SMITH, J.T., BULGAKOV, A.A., COMANS, R.N.J., KONOPLEV, A.V., KUDELSKY, A.V., MADRUGA, M.J., RYABOV, I.N., VOITSEKHOVITCH, O.V., ZIBOLD G., 2005. The “AQUASCOPE” simplified model for predicting 89,90Sr, 131I and 134,137Cs in surface waters after a large-scale radioactive fallout, Health Physics 89 628-644.
SMITH, J.T., COMANS, R.N.J, BERESFORD, N.A., WRIGHT, S.M., HOWARD, B.J. CAMPLIN, W.C., Chernobyl’s legacy in food and water, Nature 405 (2000) 141.
SMITH, J.T., COMANS, R.N.J, IRELAND, D.G., NOLAN, L., HILTON J., Experimental and in situ study of radiocaesium transfer across the sediment/water interface and mobility in lake sediments, Applied Geochemistry 15(6) (2000) 831-846.
SMITH, J.T., KONOPLEV, A. V., BULGAKOV, A.A., COMANS, R.N.J., CROSS, M.A., KAMINSKI, S., KHRISTUK, B., KLEMT, E., DE KONING, A., KUDELSKY, A.V., LAPTEV, G., MADRUGA, M.J., VOITSEKHOVITCH, O.V., ZIBOLD, G., AQUASCOPE Technical Deliverable. Simplified models for predicting 89Sr, 90Sr, 134Cs, 137Cs, 131I in water and fish of rivers, lakes and reservoirs, CEH Centre for Ecology and Hydrology, Natural Environment Research Council, Lancaster (2002)
STEPHENS J.A., WHICKER F.W. AMD IBRAHIM S.A., Sorption of Cs and Sr to profundal sediments of a Savannah River site reservoir, Journal of Environmental Radioactivity 38 (1998) 293-315.
ZHELEZNYAK, M. J., DEMCHENKO, R. I., KHURSIN, S. L., KUZMENKO, Y. I., TKALICH, P. V. VITIUK, N. Y., Mathematical modelling of radionuclide dispersion in the Pripyat-Dnieper aquatic system after the Chernobyl accident, Science of the Total Environment 112 (1992) 89-114.

435
ADHESION OF SUSPENDED MATTER TO THE EXTERNAL PLANT SURFACE
U. SANSONE
International Atomic Energy Agency, Vienna, Austria
M. BELLI
Istituto Superiore di Ricerca per la Protezione Ambientale (ISPRA),
Servizio di Metrologia Ambienatle, Rome, Italy
Abstract
The retention of suspended particles transported by river flow on freshwater plant surfaces is a potentially important process
in the contamination of aquatic biota and can significantly increase the apparent concentration of radionuclides above their
endogenous value, leading to an overestimation of the uptake rate and concentration ratios and may significantly influence
analytical results of aquatic biota In the case of contaminants that have a high affinity for soil particles, like caesium that
interacts strongly with the micaceous clay minerals in natural particulate matter, the concentration of these contaminants in
suspended particles is generally higher than the endogenous concentration of the same contaminant in biota, thus even small
quantities of particles adhering to the plant can significantly increase the apparent concentration of elements above their
endogenous value, leading to wrong conclusions. The mass of suspended particles retained on the surfaces of freshwater
plants and the plant biomass could be determined by comparing the scandium content of suspended material with that in the
fresh plant. Scandium, a predominantly soil-associated trace element, is a useful “tracer” for the inorganic component of
suspended particles, because this element is geologically ubiquitous in soils and sediment, and it is recognized that it cannot
cross natural membranes of plants and other organisms.
1. INTRODUCTION
Many contaminants have a high affinity for soil particles and exhibit systematic correlation
with the clay mineral fraction. Soil particles are thus both the physical support and the carrier
of numerous contaminants in natural waterways. They can act as a sink: the settling of
suspended material is clearly one of the most important processes, which effectively removes
contaminants adsorbed to the particles from the water column. Suspended matter may also
become a source of short- or long-term contamination: erosion and resuspension due to flood
events, transportation by the flow and biological processes have a central role in the fate and
mobility of contaminants associated with soil particles in natural waters.
One of the factors that could explain part of the variability exhibited by aquatic biota tissues is
the adhesion of organic or inorganic contaminated particles to external plant surface [1-3].
The concentration of many contaminants in suspended particles is generally higher than the
endogenous concentration in biota thus even small quantities of particles adhering to the plant
can significantly increase the apparent concentration of trace elements above their
endogenous value, leading to erroneous conclusions concerning plant uptake. Thus in
comparing data from different areas or for assessing temporal and spatial variations of the
contamination of freshwater plants, the effects of the adhesion of suspended particles to the
plant surface should be considered [4].
When contaminants are released into waterways they become more or less associated with the
clay mineral fraction of suspended particles, depending upon their individual chemical
properties. Under conditions of strong association, the transport and fate of the pollutant is
highly controlled by the fate and mobility of particles in natural waters. In these conditions,
the association of contaminants with suspended material can play an important role in
controlling their transfer through the ecosystem. Available data on caesium transfer to aquatic
organisms suggest that aquatic plants accumulate 137
Cs by both absorption and adsorption [5-
7], but these parameters were not quantitatively assessed. In addition, several studies [1-3]

436
showed that external adhesion of suspended particles on submerged biological materials may
significantly influence analytical results of aquatic biota. Scandium, a predominantly soil-
associated trace element, has been used as a ‘tracer’ for the inorganic component of
suspended particles [8-10], because this element is geologically ubiquitous in soils, and it is
assumed that it cannot cross natural membranes of plants and other organisms [1-3, 9, 11].
For these reasons, the ratio between the amount of Sc in aquatic plants and the amount of Sc
in suspended particles provides a good estimate of the relative mass of inorganic particles
adhered to aquatic plants.
Materials coating submerged material can accumulate very high levels of metals [12]. Such
materials, defined as periphyton or aufwuchs, have been widely used to monitor metal
bioavailability in contaminated environments [1-3, 13-19]. These materials are a complex
mixture of biotic matter that is consumed by many species of scrappers and grazers [12].
Periphytic algal communities have been extensively studied because of interest in their role in
the ecosystem and, from an applied viewpoint, because of their tendency to concentrate
materials from the surrounding water. Despite their trophically significant role, the association
of metals with those materials coating submerged surface and the abiotic components of
sexton has been generally ignored in the past. Table 1 gives the mean values for Sc measured
in the periphyton samples (n=20) scrapped off from the artificial substrates collected at
intervals of 16, 21, 25 and 30 days (Sc = 4.00±0.99 mg kg-1
) [3].
TABLE 1 VARIATION WITH TIME IN Sc CONCENTRATIONS IN THE PERIPHYTON MAT
Days of exposure Sc (mg kg-1)
AM SD
16 5.18 3.6 × 10⁻¹
21 4.72 1.9 × 10⁻¹
25 3.35 5.4 × 10⁻¹
30 2.75 4.8 × 10⁻¹
Comparison of the scandium content of suspended material with that in algal communities
collected at intervals of 16, 21, 25 and 30 days after placement of the artificial substrates,
allows the quantification of the contribution of suspended material to the total caesium
contamination of the algal samples:
[ ]
[ ]periphytontoadheringparticlessuspendedinorganicofamountrelative
Sc
Sc
par
per
=
where [ ]par
Sc is the Sc concentration in periphyton (mg kg-1
) and [ ]per
Sc is the Sc
concentration in suspended particles (mg kg-1
)
The relative mass of suspended particles adhering to the total mass of periphyton scraped off
from the artificial sheets at intervals of 16, 21, 25 and 30 days after placement in the river
water are shown on Figure 1.

437
FIG. 1. Mass of suspended particles adhering to mass unit of periphyton.
The results indicated that the suspended particles mass adhering to the periphyton contributes
between 55 and 100% of the total apparent periphyton mass. The uncertainty associated in the
assessment of the extremely low quantities of periphyton biomass and suspended particles
mass adhering to the biota at the beginning of the ecological succession explains the mean
values higher than 100% found until the 21st days of the exposure of the artificial substrates in
the river water.
Figure 2 illustrates the bio volumes of the main species composing the periphyton mat,
expressed as the total volume of all individuals (specific cell volume determined from mean
dimensions of the cells, multiplied by the specific cell density) during the growing period. As
expected the biovolume per surface unit increases with time. The growth curve reaches a
maximum at day 25 and then decreases due to the limited growing area on the artificial
substrate.
y = 14.947e0.234x
R2 = 0.8989
0
1000
2000
3000
4000
5000
6000
7000
8000
0 5 10 15 20 25 30 35
Days of exposure
Bio
vo
lum
e (
mm
3 c
m-2
103)
FIG. 2. Variation with time in biomass of main species composing the periphyton mat [2].
438
Quantitatively, it is well known that uptake of materials may be linear over a certain range of
biomass but as the biomass increases, proportional accumulation diminishes. This ‘weight
dilution’ effect, apparently applies to adhering particles as well, and is apparent in Figures 1
and 2, where the mass of suspended particles tend to be lowest in the zone of maximum
biomass and highest in the area of low biomass. The data show a higher suspended particles
adhesion capacity of the cells at the beginning of the ecological succession and we
hypothesise that this effect could be dependent on the cells’ surface exposed to the particles.
At the beginning of the ecological succession the total surface of all individual small cells is
high and we expect a diminution of the total surface along the ecological succession.
2. CONCLUSIONS
In the case of contaminants that have a high affinity for soil particles, like caesium that
interacts strongly with the micaceous clay minerals in natural particulate matter [20-25], the
concentration of these contaminants in suspended particles is generally higher than the
endogenous concentration of the same contaminant in biota, thus even small quantities of
particles adhering to the plant can significantly increase the apparent concentration of
elements above their endogenous value, leading to wrong conclusions.
REFERENCES
[1] SANSONE, U, BELLI, M., RICCARDI, M., ALONZI, A., JERAN, Z., JACIMOVIC, R., SMODIS, B., MONTANARI, M., CAVOLO, F. Adhesion of water-borne particulate on freshwater biota, Science of the Total Environment 219 (1998) 21-28.
[2] SANSONE, U., BELLI, M., JERAN, Z., KANIVETS, V.V., RADOJCO, J., RICCARDI, M., VOITSEKHOVITCH, O.V. Suspended particle adhesion on aquatic plant surfaces: implications for 137Cs and 137Cs uptake rates and water-to-plant concentration ratios, Journal of Environmental Sciences 59 (2002) 257-271.
[3] SANSONE, U, BELLI, M., FERNANDEZ, J.A., COMANS, R.N.J., JERAN, Z., CAVOLO, F., BARBIZZI, S., DE ZORZI, P., JACIMOVIC, R., Testing scandium method to quantify suspended particles adhesion to the external surface of periphyton communities, Water, Air, and Soil Pollution 141 (2002a) 313-324.
[4] BARGAGLI, R., The elemental composition of vegetation and the possible incidence of soil contamination of samples, Science of the Total Environment 176 (1995) 121-128.
[5] SMEDILE, E. AND QUEIRAZZA, G., “Uptake of cobalt-60 and caesium-137 in different components of a river ecosystem connected with discharges of a nuclear power station”. Radioecology and energy resources (C.E. CUSHING Ed.), Ecological Society of America, 1. Dowden, Hutchinson and Ross Inc., Pensilvania (1975) 314-320.
[6] NAKAMURA, R. NAKAHARA, M. Combining of radionuclides with constituent materials of marine algae, Nippo Suissa Gakkaishi, 45 (1979) 757-762.
[7] COUGHTREY, P.J. AND THORNE, M.C. Radionuclide distribution and transport in terrestrial and aquatic ecosystems. A critical review of data. Vol. 1, A.A. Balkema, Rotterdam, (1983) 496.
[8] HINTON, T.G., Contamination of plants by resuspension: a review, with critique of measurement methods, Science of the Total Environment 121 (1992) 177-193.
[9] LI, J., GERZABEK, M. AND MÜCK, K., An experimental study on mass loading of soil particles on plant surfaces, Sonderdruck “Die Bodenkultur” 45(1) (1994) 15-24.
[10] THOMAS, A.J AND MARTIN, J.M. Chemical composition of river suspended sediment: Yangtse, Mackenzie, Indus, Orinoco, Parana and French rivers (Seine, Loire, Garonne, Dordogne, Rhone). Mitt. Geolo.-Paläont. Inst. Univ. Hamburg. SCOPE/UNEP Sonderband, Heft 52 (1982) 555-564.
[11] O’TOOLE, J.J., WESSELS, T.E. AND MC LEOD., K.W., Trace element levels and their enrichment processes in terrestrial vegetation, Journal of Plant Nutrition 3(1-4) (1981) 397-407.
439
[12] NEWMAN, M.C. AND MCINTOSH, A.W. Appropriateness of Aufwuchs as a monitor of bioaccumulation, Environmental Pollution 60 (1989) 83-100.
[13] NEAL, E.C., PATTEN, B.C. AND DEPOE, C.E., Periphyton growth on artificial substrates in a radioactively contaminated lake, Ecology 48(6) (1967).
[14] CUSHING, C.E. AND RANCITELLI, L.A., Trace element analyses of Columbia River water and phytoplankton, Northwest Science 46(2) (1972) 115-121.
[15] JOHNSON G.D., MCINTOSH, A.W. AND ATCHISO, G.J., The use of periphyton as a monitor of trace metals in two contaminated Indiana lakes, Bulletin of Environmental Contamination and Toxicology 19 (1978) 733-40.
[16] WEITZEL, R.L., Periphyton measurements and applications. American Society for Testing and Materials, Special technical publication 690 (1979) 3-33.
[17] FRIANT, S.L. AND KOERNER, H. Use of an in situ artificial substrate for biological accumulation and monitoring of aqueous trace metals. A preliminary field investigation, Water Research 15 (1981) 161-167.
[18] DARLEY, W.M. Algal Biology: a physiologycal approach. Basic Microbiology. Volume 9. (WILKINSON, J.F. Ed), Blackwell Scientific Publications, Oxford, ISBN 0-632-00608-0 (1982) 168.
[19] RAMELOW G.J., MAPLES, R.S., THOMPSON, R.L., MUELLER, C.S., WEBRE, C. AND BECK, J.N. Periphyton as monitor for heavy metal pollution in the Calcasieu River estuary, Environmental pollution 43 (1987) 247-261.
[20] COMANS, R.N.J., HOCKLEY, D.E., Kinetics of caesium sorption on illite, Geochimica et Cosmochimica Acta 56: (1992) 1157-1164.
[21] CREMERS, A., ELSEN, A., DE PRETER, P., MAES, A., Quantitative analysis of radiocaesium retention in soils, Nature 335 (1988) 247-249.
[22] EVANS, D.W., ALBERTS, J.J. AND CLARK, R.A. Reversible ion-exchange fixation of caesium-137 leading to mobilization from reservoir sediments, Geochimica et Cosmochimica Acta 47 (1983) 1041-1049.
[23] FRANCIS, C.W. AND BRINKLEY, F.S., Preferential adsorption of 137Cs to micaceous minerals in contaminated freshwater sediment, Nature 260 (1976) 511-513.
[24] SANSONE, U., BELLI, M., VOITSEKOVITCH, O.V. AND KANIVETS, V.V. 137Cs and 90Sr in water and suspended particulate matter of the Dnieper River-Reservoirs System (Ukraine), Science of the Total Environment 186 (1996) 257-271.
[25] SAWHNEY, B. Selective sorption and fixation of cations by clay minerals: A review, Clays Clay Mineral 20 (1972) 93-100.


441
DISTRIBUTION OF RADIONUCLIDES BETWEEN SOLID
AND LIQUID PHASES IN FRESHWATERS
P. CIFFROY
Electricité de France (EDF), Division Recherche et Développement, Chatou, France
G. DURRIEU, J.-M. GARNIER
CEREGE, Aix en Provence, France
Abstract
The paper provides operational Best Estimate values, as well as Probability Density Functions (PDFs), for distribution
coefficients (Kds) in freshwater, representing the partition of radionuclides between the particulate and the dissolved phases
respectively. A literature review allowed to highlight the most important environmental factors influencing the distribution of
radionuclides at the interface particles/water is presented. The construction of PDFs for 8 elements (Ag, Am, Co, Cs, I, Mn,
Pu and Sr) was established according the following procedure: (i) construction of a comprehensive database where Kds values
obtained under various environments and parametric conditions were collected; (ii) scoring procedure to account for the
‘quality’ of each data point (according to several criteria such as the presentation of data (e.g. raw data vs mean with or
without replicates), contact time, pH, solid-to-liquid ratio, expert judgement) in the construction of the PDF; (iii) weighted
bootstrapping procedure to build the PDFs, in order to give more importance to the most relevant data points. For 7 other
radionuclides (Ba, Be, Ce, Ra, Ru, Sb and Th), a simplified procedure was adopted because of the scarcity of data: only non-
conditional PDFs were built, without incorporating a scoring procedure
1. Kd CONCEPT FOR FRESHWATER ECOSYSTEMS
The residence time of radionuclides in freshwater streams is strongly affected by their
interactions with suspended particulate matter (SPM) and settlement in sedimentation zones
of a water system. Besides, the uptake of radionuclides by aquatic organisms depends on the
concentration and on the speciation of radionuclides remaining in the dissolved phase.
Partitioning of radionuclides between water and suspended matter is often described in terms
of distribution coefficients (Kds), expressed as the concentration ratio between the particulate
phase and the dissolved phase under equilibrium conditions (in Bq.kg-1
of SPM per Bq L-1
).
2. FACTORS AFFECTING Kd
2.1. Kinetics aspects
Numerous studies have shown that the sorption of radioactive or metallic trace elements on
natural particles resulted from several kinetic processes, involving rapid, but also slow
processes (e.g. oxidation processes, inner sphere complexation and migration of cation in the
clay structure) [1-15]. Some examples of studies that demonstrated the existence of several
kinetic processes for some radionuclides are given in Figures 1 and 2.
Referenced studies showed that kinetics in the interactions of radionuclides at the interface
water-SPM obviously depend on the element of concern, but also on other environmental co-
factors, such as:
• The season, and the associated biological activity in the river. For some radionuclides
(e.g. radioisotopes of Co or Mn), oxidation processes, that are partly microbially
mediated, govern their slow uptake onto SPM. Seasonal differences may then reflect
strong seasonal variation in the abundance of oxidizing bacteria [11-12, 16].

442
FIG. 1. Sorption kinetics onto freshwater particles from the Loire river over 100 h–experimental data obtained under winter and summer conditions [124].
FIG. 2. Sorption (ads) and desorption (des) kinetics of trace elements on SPM in winter and in
summer conditions over 30 days [127].

443
• SPM concentration. Benes et al. [5-7] studied the uptake kinetics of Cs over a wide
range of SPM concentration (20-2000 mg.l-1
) and observed that time to reach
equilibrium is more longer for low SPM concentration, reflecting that the ratio
between binding sites and available radionuclide in the solution partly governs the
kinetics of transfer.
• The ionic strength. Even if this document focuses on freshwaters, experiments
performed in estuarine systems characterized by an ionic strength gradient can indicate
the influence of this parameter on uptake and release kinetics. For some radionuclides
(e.g. radioisotopes of Cs, Co, Mn), it was shown that the velocity of rapid processes is
more or less constant over a wide range of salinity, while velocity of slow processes is
highly affected by salinity [12]. Rapid processes likely correspond to binding/release
or ionic exchange with easily accessible sites that are not significantly modified by
chemical composition in water, while slow processes likely correspond to the change
of speciation of bound elements (oxidation, migration to less accessible sites and inner
sphere complex formation) that may be salinity-limited.
• age of the contamination (called ageing effect). The desorption kinetics may be highly
governed by the inner speciation of bound radionuclides (i.e. distribution among easily
and less accessible binding sites respectively). For example, long time kinetic
adsorption–desorption experiments (over 30 days) [7, 15] indicate that elements
freshly associated with particles present less stable complexes and are released more
rapidly than ‘old-contaminated’ particles.Thus, kinetics in the interaction of
radionuclides at the interface water-SPM may highly depend on experimental designs
used for their determination and are highly site-specific.
Site-specific data can be generated through in vitro experiments conducted with freshly
collected natural water and spiked radioactive solutions, according to protocols that are
described in detail by several authors [4-6, 10-13, 15]. When such site-specific data are
available, uptake and release kinetics can be simulated by compartmental models (one-, two,
three- or more box models with successive or parallel reactions) summarized in Figure 3
(from Barros [17]). In general, all these compartmental models provide multi-exponential-
type solutions. However, Barros et al. [17} showed the mathematical equivalence between
these models and concluded that it is a practical fact that no difference between models occurs
under certain environmental conditions.
FIG. 3. Schematic representation of the kinetic box models. Arrows show the sorption and desorption processes, compartment aw is the dissolved-phase concentration, as1 is the concentration associated
to the fastest reaction, as2 is a moderate reaction (related to another mechanism or due to the delay caused by accessibility) and as3 is the slowly sorbed fraction (adopted from [17]).

444
2.2. pH
pH was demonstrated to be a predominant factor for several radionuclides, such as Co [18-
22], because it modifies the speciation of solid surface sites and the speciation of competitive
ions in water. Radionuclides adsorption to SPM can generally be represented by a sigmoid
curve, with sudden increase in adsorption occurring over a narrow range of 1 to 2 pH units
(see examples provided in Figure 4 [22]). The observed radionuclides uptake behaviour,
qualitatively similar to results for simpler surfaces (e.g. metal oxides [23]), can be interpreted
in terms of interaction of dissolved metals with deprotonated sites on the surfaces of the SPM.
The importance of pH in the choice of relevant Kd is particularly crucial for elements that
show steep slopes in the range of natural pH found in freshwaters (typically 6-7), such as Co
or Mn.
FIG. 4. Adsorption edges for 109
Cd, 60
Co, 51
Cr, 59
Fe, 54
Mn, AND 65
Zn onto suspended particulate matter in seawater (salinity 31.6) and freshwater [22]
2.3. Suspended particulate matter concentration and colloids effects
The so-called ‘particle concentration effect’ (i.e. the effect of the particle concentration on the
distribution coefficient) was showed by several studies [4, 7, 18-20, 22, 24-26]. The ‘particle
concentration effect’ is an unexpected decline in partition coefficients (Kd) as suspended
particulate matter (SPM) increases. This observation has been attributed to a variety of causes
that were listed by Benoit and Rozan [27]: sorption kinetics, irreversible adsorption or
incomplete desorption, qualitative variations in surface chemistry, filtration artefacts, particle-
particle interactions, the presence of a non-aqueous dissolved phase, and the contribution of
trace elements bound to colloids included in the filtrate fraction. However, this effect remains
controversial. Indeed, according to McKinley and Jenne [28], examination of published data

445
accounts of the solid concentration effect revealed either inappropriate experimental designs
or errors of data interpretation. In particular, the colloidal phase (intermediate phase between
the ‘true’ dissolved phase and the particulate phase), that is included (in error) within the so-
called ‘dissolved’ phase, may play a major role: according to Benoit and Rozan [27], when
corrections are applied for both colloids and large particles, d
K values become truly constant.
Nevertheless, on a practical point of view, such corrections (that need data on both ‘truly
dissolved’ and colloidal forms) can be applied only if site-specific data are collected. The
contribution of colloids to the distribution within the so-called dissolved phase was studied by
several authors through ultrafiltration techniques [29-33] – see some examples in Figs. 5 and
6).
FIG.5. Distribution of 60
Co, 106
Ru and 137
Cs, among particulate (>450 nm), true dissolved (<2 nm)
and colloidal (2–450 nm) phases [30].
FIG. 6. Fractional distributions of radionuclides and stable elements in 4-step ultrafiltration in the
Chernobyl zone [32].

446
It was observed that the contribution of colloidal forms to the ‘dissolved’ phase may be quite
significant for some radionuclides (e.g. 106
Ru, 239,240
Pu, 241
Am) and that their transformation
(e.g. aggregation, coagulation) may be a source of variability in the determination of d
K
values.
2.4. Ionic strength
The concentration of complexing ligands and/or competitors in the dissolved phase (e.g.
analogue ions or dissolved organic matter) largely influences the Kd values. Indeed, the
competitive complexation between particulate surface sites and inorganic dissolved ligands
depends on the concentration of dissolved ligands and on the complexation constant of these
ligands with each element. Experiments, conducted in estuarine waters where significant
salinity gradients were observed, demonstrated the effect of ionic strength on Kd values for
most of the studied radionuclides [11, 12, 24, 35]. Even if the variability of ionic strength is
moderate in freshwaters compared to estuaries, the effect of competitive ions can be
significant for some elements. For example, competition processes between ions were
extensively studied and demonstrated for Cs and Sr that compete with monovalent (K+ or
NH4+) and divalent (Ca
2+ or Mg
2+) ions respectively [36-41]. Some models were proposed for
Cs and Sr to account for the concentration or competitive ions in the calculation of Kd values.
Thus, Hilton et al [40] proposed the relationship that represents the decrease of Kd values with
increasing competing ions concentrations:
• the sites able to uptake Cs are supposed to be located at the broken edges of illite
mineral fragments called ‘frayed edge sites’ (FES), and thus:
•
( )]Cs).[K/Cs(K]K[
FES).K/Cs(KK
c
cCs
d++
+
= , where Kc(Cs/K) is the selectivity coefficient for
homovalent competition (e.g. about 1000 for illite according to de Preter [42]).
• for bivalent Sr, a similar relationship was proposed: ( )]Sr).[Ca/Sr(K]Ca[
CEC).Ca/Sr(KK
2c
2
cSr
d++
+
= ,
where CEC is the cation exchange capacity (in meq.kg-1
) and Kc(Sr/Ca) is the
selectivity coefficient for homovalent competition (e.g. 1 according to Bruggenwert et
al [43]).
2.5. Nature of particles and extend of reversibility
Suspended matter gathers contrasted type of particles such as clay, carbonates, oxides and
hydroxides, organic matter including living cells, such as phytoplankton. The partitioning of a
given radionuclide is highly dependant on the composition of the particulate pool. The degree
of reversibility also highly depends on the distribution of the radionuclide of concern among
these different types of particulate ligands. One way to investigate the degree of reversibility
is to conduct sequential extractions, with successive extractants that theoretically allow the
selective release of radionuclides (e.g. [44]: extraction of five fractions corresponding to five
types of sites with various exchange characteristics (exchangeable, acid soluble, reducible,
oxidizable, residual); [45-47]). The example presented in Figure 7 shows that the association
of radionuclides to particles highly depends on the element of concern, but also on the
particulate pool.
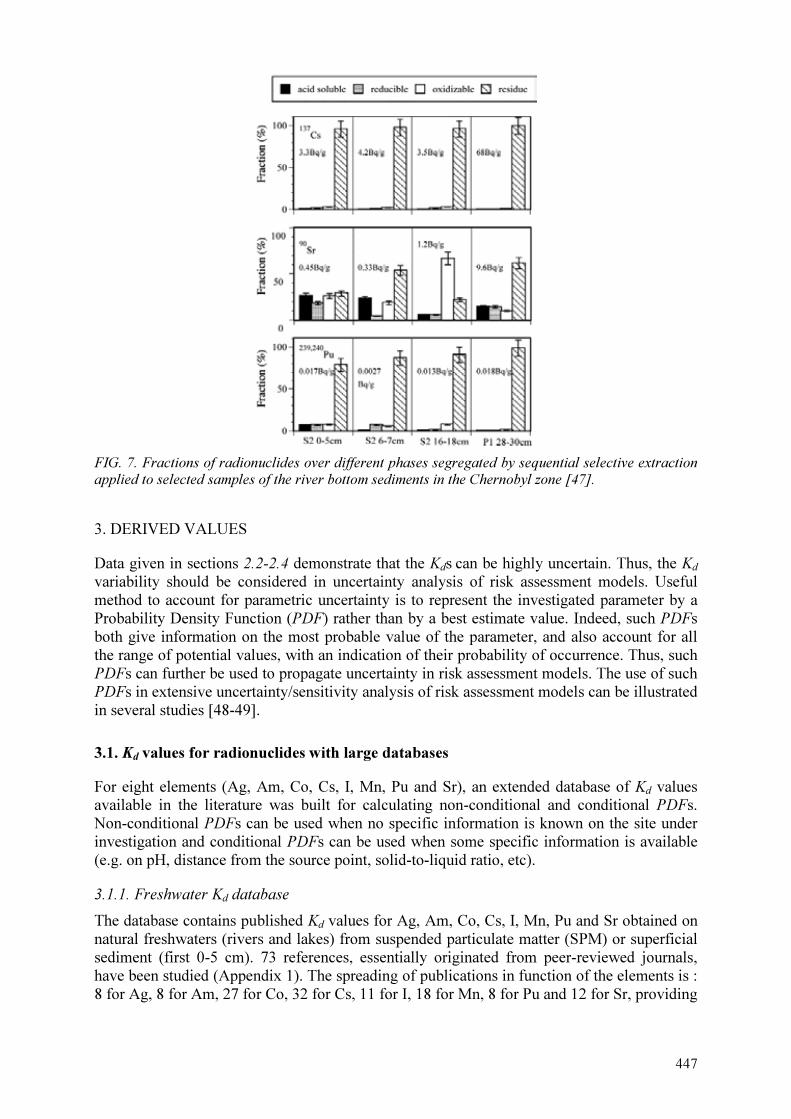
447
FIG. 7. Fractions of radionuclides over different phases segregated by sequential selective extraction applied to selected samples of the river bottom sediments in the Chernobyl zone [47].
3. DERIVED VALUES
Data given in sections 2.2-2.4 demonstrate that the Kds can be highly uncertain. Thus, the Kd
variability should be considered in uncertainty analysis of risk assessment models. Useful
method to account for parametric uncertainty is to represent the investigated parameter by a
Probability Density Function (PDF) rather than by a best estimate value. Indeed, such PDFs
both give information on the most probable value of the parameter, and also account for all
the range of potential values, with an indication of their probability of occurrence. Thus, such
PDFs can further be used to propagate uncertainty in risk assessment models. The use of such
PDFs in extensive uncertainty/sensitivity analysis of risk assessment models can be illustrated
in several studies [48-49].
3.1. Kd values for radionuclides with large databases
For eight elements (Ag, Am, Co, Cs, I, Mn, Pu and Sr), an extended database of Kd values
available in the literature was built for calculating non-conditional and conditional PDFs.
Non-conditional PDFs can be used when no specific information is known on the site under
investigation and conditional PDFs can be used when some specific information is available
(e.g. on pH, distance from the source point, solid-to-liquid ratio, etc).
3.1.1. Freshwater Kd database
The database contains published Kd values for Ag, Am, Co, Cs, I, Mn, Pu and Sr obtained on
natural freshwaters (rivers and lakes) from suspended particulate matter (SPM) or superficial
sediment (first 0-5 cm). 73 references, essentially originated from peer-reviewed journals,
have been studied (Appendix 1). The spreading of publications in function of the elements is :
8 for Ag, 8 for Am, 27 for Co, 32 for Cs, 11 for I, 18 for Mn, 8 for Pu and 12 for Sr, providing
448
Kd values in freshwater. d
K values came from different river and lake water systems (5 for
Ag, 15 for Am, 19 for Co, 57 for Cs, 13 for I, 13 for Mn, 16 for Pu and 16 for Sr). In addition,
information on potential co-factors and on criteria allowing estimating the quality of each
referenced data was collected, especially about: pH, suspended matter concentration, contact
time between water and particles, method for the determination of Kd values (in situ
measurements or laboratory experiments under adsorption or desorption conditions with
spiked solutions), redox conditions (especially for I).
In many studies, raw data were not published, but only mean values, eventually associated
with information on standard deviation and the number of measurements (e.g. replicates). In
the present study (aiming at providing information on d
K uncertainty), it was chosen to use
the information regarding the dispersion of raw data (indicated through the standard
dispersion), instead of using only the mean value. Thus, ‘calculated raw data’ were generated
through a Monte Carlo procedure (Latin Hypercube procedure) in a way to respect the mean
value, the standard deviation and the number of originally raw data.
3.1.2. Data quality evaluation
In the frame of the statistical analysis presented in this paper, it appeared necessary to affect a
score describing the quality of the Kd values found in the literature. Indeed, the quality of each
Kd values depend for example on the method chosen for its determination, the number of
replicates, the quality and quantity of information given on the physico-chemical
characteristics of water, etc. Some objective criteria were defined in order to determine for
each data a score describing its quality according to the objective of this study (Table 1):
1. Criterion 1: presentation of data. Presentation and accessibility of data in published
papers may be quite different according to the publication (all raw data available, or
mean value with or without standard deviation and number of replicates, raw data or
mean values presented on a Figure, etc). The score linked to the ‘presentation of data’
depended on the information provided (e.g. raw data are preferred to a mean value) and
whether data are easily legible or not (data from a table are preferred to data in a figure).
2. Criterion 2: contact time. As mentioned earlier, the Kd theoretically describe interactions
of radionuclides at the water/particles interface at equilibrium. Among the published
papers, some of them included kinetic aspects. To account for kinetics, Kd values
obtained under rather long-term experiments were better scored (also because most
concrete applications concern long-term interactions, except for zones situated just
downstream of release points). Such information allowed us to define five ‘contact time’
classes (see Table 1). For long contact time (over 120 hours), equilibrium is expected to
be achieved but the in vitro experimental medium may be submitted to physico-chemical
modifications (e.g. phytoplankton death, organic matter degradation) leading to less
relevant Kd values, as shown by Millward and Liu [14] for example. This is the reason
why a lower score was affected. Moreover, Kd values directly measured in the field are
supposed to be equilibrated.
3. Criterion 3: pH range. pH may play a significant influence on complexation processes
and then on the Kd. Thus, it was necessary to discriminate Kd values obtained under
natural conditions with or without any indication on the pH value, and d
K values
obtained under extreme pH values. Consequently, different scores were affected to these
different categories, considering that pH of the natural freshwaters is generally between
5 and 9 [50].
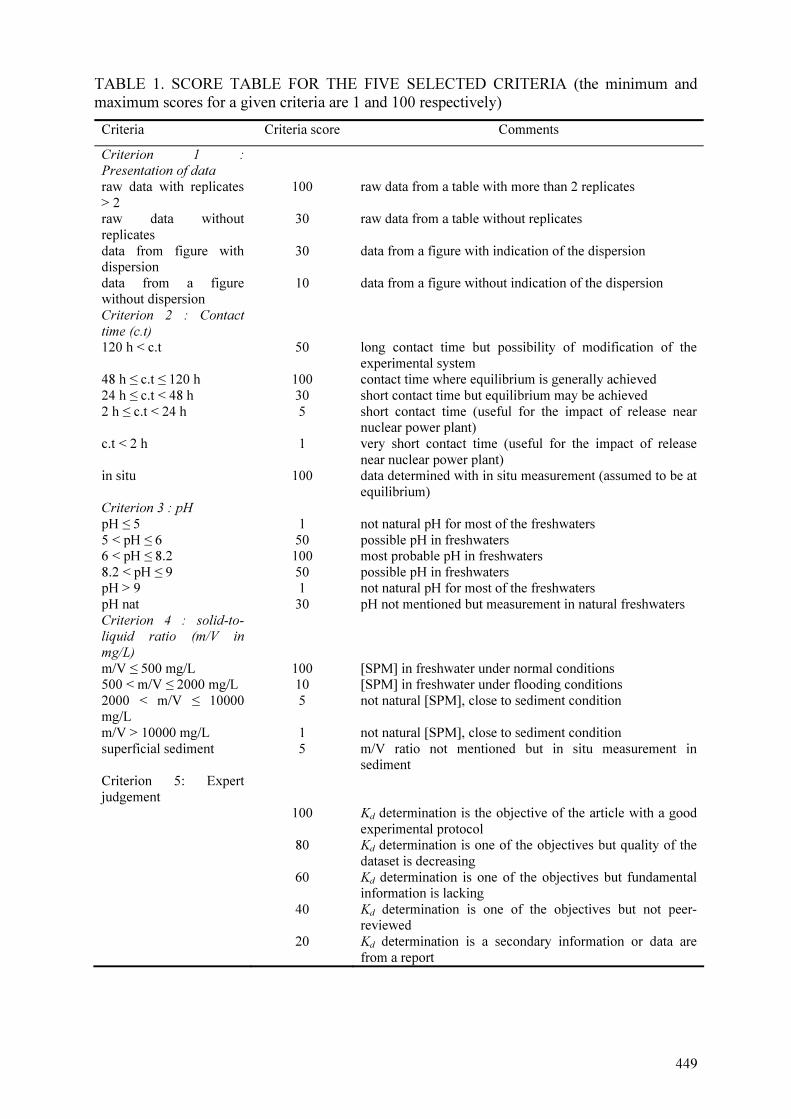
449
TABLE 1. SCORE TABLE FOR THE FIVE SELECTED CRITERIA (the minimum and
maximum scores for a given criteria are 1 and 100 respectively)
Criteria Criteria score Comments
Criterion 1 : Presentation of data
raw data with replicates
> 2
100 raw data from a table with more than 2 replicates
raw data without
replicates
30 raw data from a table without replicates
data from figure with dispersion
30 data from a figure with indication of the dispersion
data from a figure without dispersion
10 data from a figure without indication of the dispersion
Criterion 2 : Contact
time (c.t) 120 h < c.t 50 long contact time but possibility of modification of the
experimental system 48 h ≤ c.t ≤ 120 h 100 contact time where equilibrium is generally achieved
24 h ≤ c.t < 48 h 30 short contact time but equilibrium may be achieved
2 h ≤ c.t < 24 h 5 short contact time (useful for the impact of release near nuclear power plant)
c.t < 2 h 1 very short contact time (useful for the impact of release
near nuclear power plant) in situ 100 data determined with in situ measurement (assumed to be at
equilibrium) Criterion 3 : pH
pH ≤ 5 1 not natural pH for most of the freshwaters
5 < pH ≤ 6 50 possible pH in freshwaters 6 < pH ≤ 8.2 100 most probable pH in freshwaters
8.2 < pH ≤ 9 50 possible pH in freshwaters pH > 9 1 not natural pH for most of the freshwaters
pH nat 30 pH not mentioned but measurement in natural freshwaters
Criterion 4 : solid-to-liquid ratio (m/V in
mg/L)
m/V ≤ 500 mg/L 100 [SPM] in freshwater under normal conditions 500 < m/V ≤ 2000 mg/L 10 [SPM] in freshwater under flooding conditions
2000 < m/V ≤ 10000 mg/L
5 not natural [SPM], close to sediment condition
m/V > 10000 mg/L 1 not natural [SPM], close to sediment condition
superficial sediment 5 m/V ratio not mentioned but in situ measurement in sediment
Criterion 5: Expert
judgement 100 Kd determination is the objective of the article with a good
experimental protocol 80 Kd determination is one of the objectives but quality of the
dataset is decreasing
60 Kd determination is one of the objectives but fundamental information is lacking
40 Kd determination is one of the objectives but not peer-reviewed
20 Kd determination is a secondary information or data are
from a report
450
4. Criterion 4: solid-to-liquid ratio. A scoring criteria was defined for this parameter
because some experiments were performed in conditions (batch experiments with very
high solid-to-liquid ratio) that are poorly relevant for most of natural situations. From
the works of Håkanson et al [51], who modelled and fitted SPM in temperate rivers from
extended databases, it can be shown that SPM is, most of the time, lower than 100 mg/L,
sometimes (during flood events) in the range 100-1000 mg/L and rarely higher than
1000 mg/L. Thus, experiments performed with high SPM (e.g. more than 10000 mg/L)
are poorly relevant for the majority of usual situations and a lower score was affected to
them.
5. Criterion 5: expert judgement. A complementary score was added to take into account
the ‘expert judgement’ criteria when building the database. The expert judgement was
defined according to several points: (i) the impact factor of the journal; (ii) the quality of
data found in the publication. For given experimental conditions, replicated leading to
scattered data were less scored than data with a good standard deviation; (iii) the
objective of the article (e.g. articles specifically focused on the determination of Kd
values, with well-defined experimental protocols). The global score of each data point is
the mean of the individual scores obtained for the criteria 1 to 5.
3.1.3. Statistical analysis
The previous stages allowed us to build a database containing Kd values, each of them being
associated with a score. The generation of PDFs was then provided through a direct weighted
bootstrap procedure. The weighted bootstrap method is used to construct samples in which the
proportions of data among referenced studies correspond to those desired. We therefore carry
out a non-equiprobable sampling with replacement from raw data available in the database:
the probability of drawing each data point corresponds to the score previously defined for
each of them. Thus, ‘relevant’ data points are more represented in the bootstrap sample than
poorly relevant data points.
Each bootstrap sample is then fitted to log-normal PDF or log-triangular PDF. The goodness
of fit was tested by a Kolmogorov-Smirnov test with a Dallal-Wilkinson approach and by the
multiple R-square coefficient (R2) between theoretical and empirical distribution. The
calibration allows to determine the characteristics of the distribution, such as the mode (50th
percentile), and the 5th
and 95th
percentiles.
For the non-conditional PDFs, all the data entered in the database are taken into account. On
the contrary, for the conditional PDFs, the same procedure was used, but the database was
previously filtered in order to keep only data respecting a given constraint (e.g. data points
obtained under a given range of pH, or a given range of contact time, etc).
Figure 8 gives an example of the PDF that can be obtained according to this procedure (case
of Cobalt under adsorption conditions and with a contact time between 48 and 120 hours)
while the others PDFs derived based in collected information is given in Appendix 2 (Figs.
A2.1-A.2.6.).
In such a Figure, the following information are reported: (i) the origin of each data point and
its score; (ii) the characteristics of the theoretical distribution (mean and standard deviation
for log-normal PDFs; minimum, mode and maximum for log-triangular PDFs); (iii) the
goodness of fit (Kolmogorov-Smirnov test an R2 coefficient between theoretical and empirical
distribution); (iv) the confidence interval of the theoretical PDFs (extreme PDFs among the
1000 bootstrap generated samples).

451
Co - Log Normal
Adsorption data w ith 48 h < contact time <= 120 h
0%
10%
20%
30%
40%
50%
60%
70%
80%
90%
100%
1.00E+03 1.00E+04 1.00E+05 1.00E+06 1.00E+07
Kd values (in L/kg)
Cu
mu
lativ
e w
eig
hte
d
pro
ba
bility
Best-Estimate Cent ile 5% Cent ile 95%
Hat je03_score : 77,5 Hatje03_score : 55 Garnier97_score : 77,5
Cif f roy03_score : 87,5 Ciff roy03_score : 100 Cif froy01_score : 77,5
Benes92-I_score : 65 Benes92-II_score : 82,5 Benes89_score : 1
R² = 0,9814
KSpvalue = 0,500
Log(mode) = 5.39
Log(standard deviation) = 0.58
FIG. 8. Example of PDFs obtained by the weighted bootstrap procedure.
3.1.4. Results: operational PDFs
Two types of operational PDFs were determined (non-conditional and conditional PDFs). The
non-conditional PDFs were built from three different sources of data: (i) in situ data. Kd
values calculated from field measurements. (ii) adsorption data. Kd values calculated from
laboratory experiment of adsorption of spiked radionuclide from dissolved phase to
suspended matter. (iii) desorption data. Kd values calculated from laboratory experiment of
desorption of spiked radionuclide from suspended matter to dissolved phase. The conditional
PDFs are subclasses of the laboratory experiments (adsorption and desorption data) giving
more accurate information about the influence of parameters (contact time, pH, solid-to-liquid
ratio or oxic/anoxic conditions). Such conditional PDFs could not be determined from in situ
data since few details about the parameters previously cited were given in most of the
references.
The aim of this study was to provide to end-users (risk assessors) who need Kd values in
freshwater for their own assessments (e.g. transport models, risk assessment of the aquatic
food-chain, for which the distribution dissolved/particulate is needed) operational PDFs
allowing further uncertainty/sensitivity analysis. Non-conditional PDFs can be used when no
specific information is known on the site under investigation. Such non-conditional PDFs
gather a wide range of parametric conditions studied in laboratory. However, the scoring
procedure and further bootstrapping method allowed providing more importance to conditions
that can typically be met in natural environments. When more detailed information is known
about the context of investigation, conditional PDFs can be used, and thus uncertainty can be
reduced.
The various global and conditional PDFs that were thus generated were synthesised in Tables
2-10 where the following information were collected: (i) the number of data (N), the number
of references (#ref) and the number of freshwater systems of concern (NE) used for the
construction of the PDF; (ii) the mode, as well as the 5th
and 95th
percentiles of the
distribution. When N < 10, #ref < 2 or NE < 2, the mention ‘irrelevant data’ was written. The
latter disposition was taken to present only relevant Kd values coming from different water
systems that can be considered not is to be linked to special local conditions.
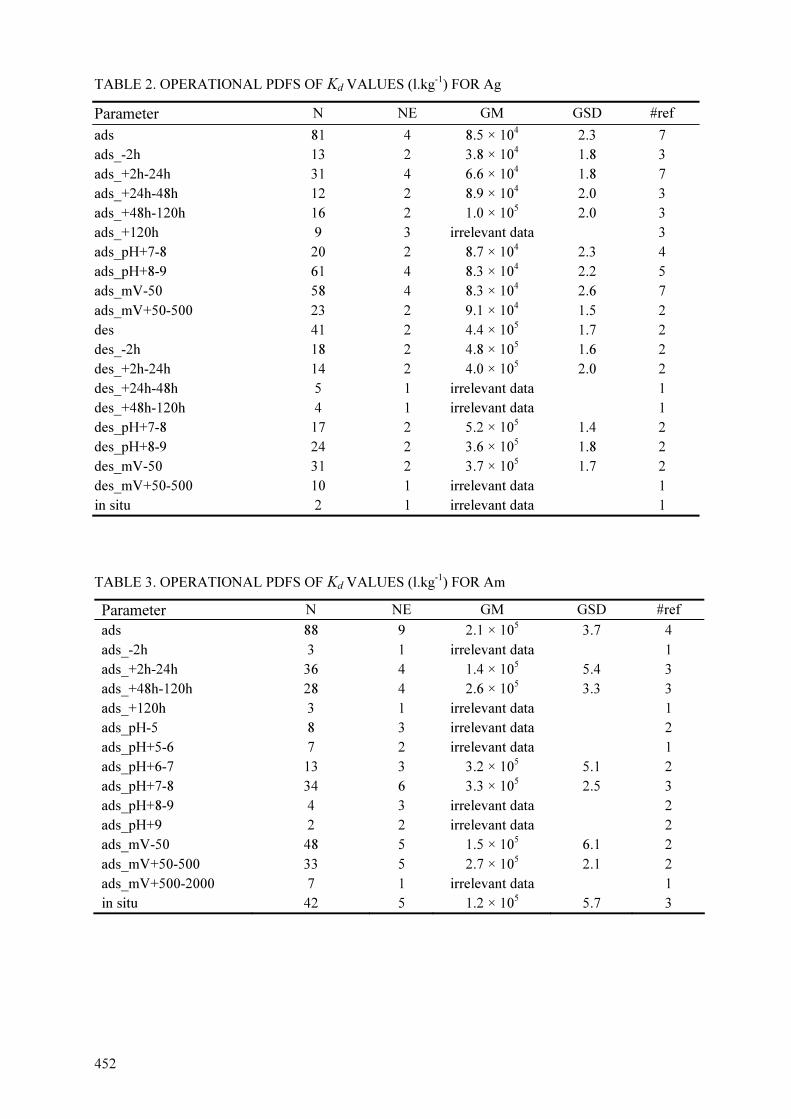
452
TABLE 2. OPERATIONAL PDFS OF Kd VALUES (l.kg-1) FOR Ag
Parameter N NE GM GSD #ref
ads 81 4 8.5 × 10⁴ 2.3 7 ads_-2h 13 2 3.8 × 10⁴ 1.8 3 ads_+2h-24h 31 4 6.6 × 10⁴ 1.8 7 ads_+24h-48h 12 2 8.9 × 10⁴ 2.0 3 ads_+48h-120h 16 2 1.0 × 10⁵ 2.0 3 ads_+120h 9 3 irrelevant data 3 ads_pH+7-8 20 2 8.7 × 10⁴ 2.3 4 ads_pH+8-9 61 4 8.3 × 10⁴ 2.2 5 ads_mV-50 58 4 8.3 × 10⁴ 2.6 7 ads_mV+50-500 23 2 9.1 × 10⁴ 1.5 2 des 41 2 4.4 × 10⁵ 1.7 2 des_-2h 18 2 4.8 × 10⁵ 1.6 2 des_+2h-24h 14 2 4.0 × 10⁵ 2.0 2 des_+24h-48h 5 1 irrelevant data 1 des_+48h-120h 4 1 irrelevant data 1 des_pH+7-8 17 2 5.2 × 10⁵ 1.4 2 des_pH+8-9 24 2 3.6 × 10⁵ 1.8 2 des_mV-50 31 2 3.7 × 10⁵ 1.7 2 des_mV+50-500 10 1 irrelevant data 1 in situ 2 1 irrelevant data 1
TABLE 3. OPERATIONAL PDFS OF Kd VALUES (l.kg-1) FOR Am
Parameter N NE GM GSD #ref
ads 88 9 2.1 × 10⁵ 3.7 4 ads_-2h 3 1 irrelevant data 1 ads_+2h-24h 36 4 1.4 × 10⁵ 5.4 3 ads_+48h-120h 28 4 2.6 × 10⁵ 3.3 3 ads_+120h 3 1 irrelevant data 1 ads_pH-5 8 3 irrelevant data 2 ads_pH+5-6 7 2 irrelevant data 1 ads_pH+6-7 13 3 3.2 × 10⁵ 5.1 2 ads_pH+7-8 34 6 3.3 × 10⁵ 2.5 3 ads_pH+8-9 4 3 irrelevant data 2 ads_pH+9 2 2 irrelevant data 2 ads_mV-50 48 5 1.5 × 10⁵ 6.1 2 ads_mV+50-500 33 5 2.7 × 10⁵ 2.1 2 ads_mV+500-2000 7 1 irrelevant data 1 in situ 42 5 1.2 × 10⁵ 5.7 3
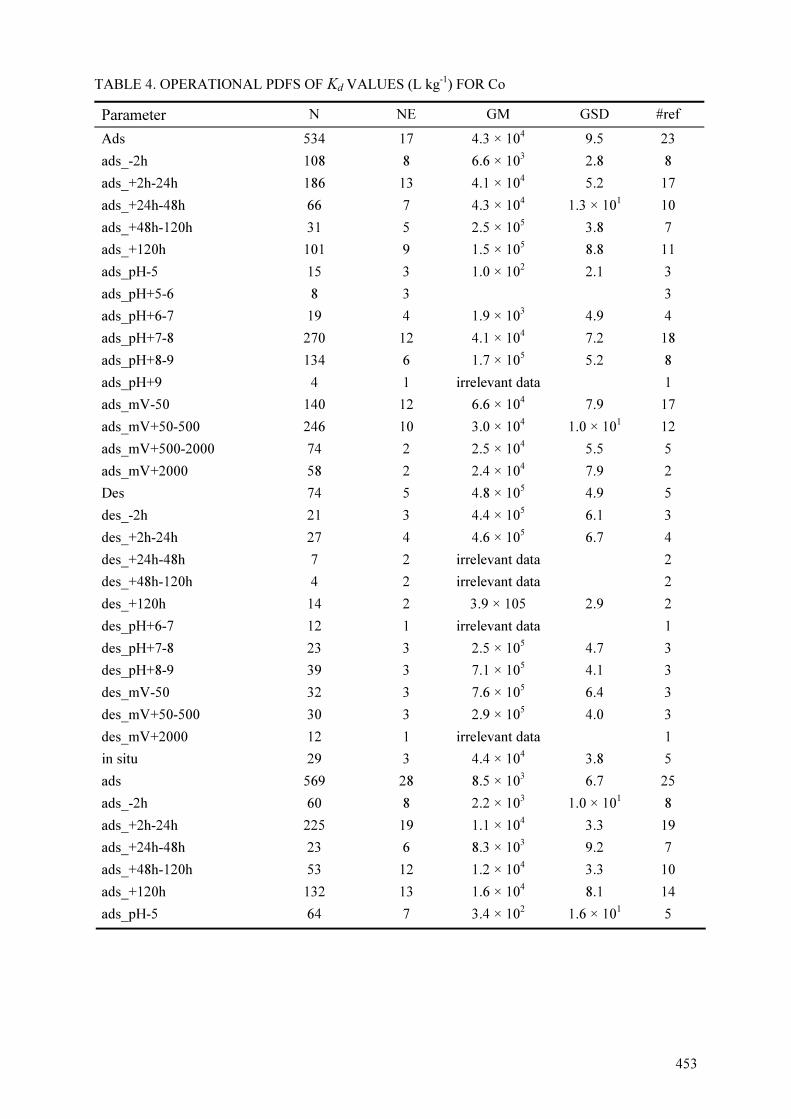
453
TABLE 4. OPERATIONAL PDFS OF Kd VALUES (L kg-1) FOR Co
Parameter N NE GM GSD #ref
Ads 534 17 4.3 × 10⁴ 9.5 23
ads_-2h 108 8 6.6 × 10³ 2.8 8
ads_+2h-24h 186 13 4.1 × 10⁴ 5.2 17
ads_+24h-48h 66 7 4.3 × 10⁴ 1.3 × 101 10
ads_+48h-120h 31 5 2.5 × 10⁵ 3.8 7
ads_+120h 101 9 1.5 × 10⁵ 8.8 11
ads_pH-5 15 3 1.0 × 10² 2.1 3
ads_pH+5-6 8 3 3
ads_pH+6-7 19 4 1.9 × 10³ 4.9 4
ads_pH+7-8 270 12 4.1 × 10⁴ 7.2 18
ads_pH+8-9 134 6 1.7 × 10⁵ 5.2 8
ads_pH+9 4 1 irrelevant data 1
ads_mV-50 140 12 6.6 × 10⁴ 7.9 17
ads_mV+50-500 246 10 3.0 × 10⁴ 1.0 × 101 12
ads_mV+500-2000 74 2 2.5 × 10⁴ 5.5 5
ads_mV+2000 58 2 2.4 × 10⁴ 7.9 2
Des 74 5 4.8 × 10⁵ 4.9 5
des_-2h 21 3 4.4 × 10⁵ 6.1 3
des_+2h-24h 27 4 4.6 × 10⁵ 6.7 4
des_+24h-48h 7 2 irrelevant data 2
des_+48h-120h 4 2 irrelevant data 2
des_+120h 14 2 3.9 × 10⁵ 2.9 2
des_pH+6-7 12 1 irrelevant data 1
des_pH+7-8 23 3 2.5 × 10⁵ 4.7 3
des_pH+8-9 39 3 7.1 × 10⁵ 4.1 3
des_mV-50 32 3 7.6 × 10⁵ 6.4 3
des_mV+50-500 30 3 2.9 × 10⁵ 4.0 3
des_mV+2000 12 1 irrelevant data 1
in situ 29 3 4.4 × 10⁴ 3.8 5
ads 569 28 8.5 × 10³ 6.7 25
ads_-2h 60 8 2.2 × 10³ 1.0 × 101 8
ads_+2h-24h 225 19 1.1 × 10⁴ 3.3 19
ads_+24h-48h 23 6 8.3 × 10³ 9.2 7
ads_+48h-120h 53 12 1.2 × 10⁴ 3.3 10
ads_+120h 132 13 1.6 × 10⁴ 8.1 14
ads_pH-5 64 7 3.4 × 10² 1.6 × 101 5
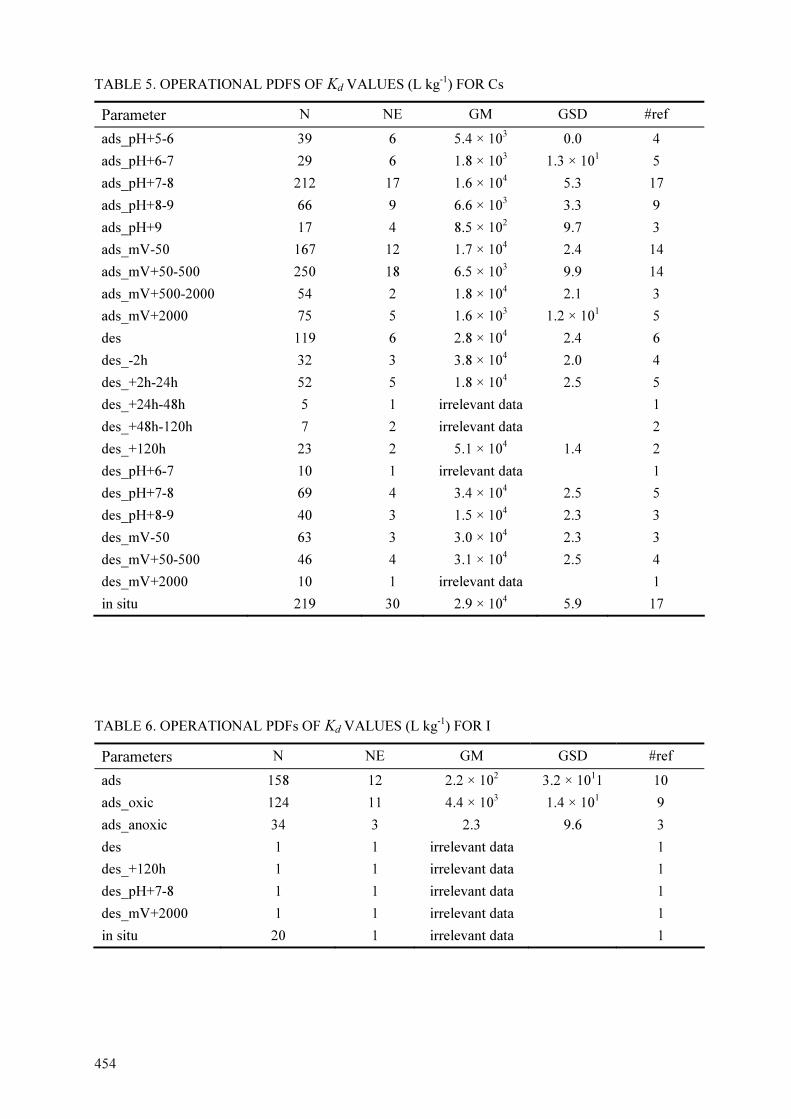
454
TABLE 5. OPERATIONAL PDFS OF Kd VALUES (L kg-1) FOR Cs
Parameter N NE GM GSD #ref
ads_pH+5-6 39 6 5.4 × 10³ 0.0 4
ads_pH+6-7 29 6 1.8 × 10³ 1.3 × 101 5
ads_pH+7-8 212 17 1.6 × 10⁴ 5.3 17
ads_pH+8-9 66 9 6.6 × 10³ 3.3 9
ads_pH+9 17 4 8.5 × 10² 9.7 3
ads_mV-50 167 12 1.7 × 10⁴ 2.4 14
ads_mV+50-500 250 18 6.5 × 10³ 9.9 14
ads_mV+500-2000 54 2 1.8 × 10⁴ 2.1 3
ads_mV+2000 75 5 1.6 × 10³ 1.2 × 101 5
des 119 6 2.8 × 10⁴ 2.4 6
des_-2h 32 3 3.8 × 10⁴ 2.0 4
des_+2h-24h 52 5 1.8 × 10⁴ 2.5 5
des_+24h-48h 5 1 irrelevant data 1
des_+48h-120h 7 2 irrelevant data 2
des_+120h 23 2 5.1 × 10⁴ 1.4 2
des_pH+6-7 10 1 irrelevant data 1
des_pH+7-8 69 4 3.4 × 10⁴ 2.5 5
des_pH+8-9 40 3 1.5 × 10⁴ 2.3 3
des_mV-50 63 3 3.0 × 10⁴ 2.3 3
des_mV+50-500 46 4 3.1 × 10⁴ 2.5 4
des_mV+2000 10 1 irrelevant data 1
in situ 219 30 2.9 × 10⁴ 5.9 17
TABLE 6. OPERATIONAL PDFs OF Kd VALUES (L kg-1) FOR I
Parameters N NE GM GSD #ref
ads 158 12 2.2 × 10² 3.2 × 10¹¹ 10
ads_oxic 124 11 4.4 × 10³ 1.4 × 101 9
ads_anoxic 34 3 2.3 9.6 3
des 1 1 irrelevant data 1
des_+120h 1 1 irrelevant data 1
des_pH+7-8 1 1 irrelevant data 1
des_mV+2000 1 1 irrelevant data 1
in situ 20 1 irrelevant data 1

455
TABLE 7. OPERATIONAL PDFS OF Kd VALUES (L kg-1) FOR Mn
Parameters N NE GM GSD #ref ads 190 12 1.3 × 10⁵ 1.2 × 101 16 ads_-2h 33 5 1.4 × 10⁴ 6.0 6 ads_+2h-24h 66 11 1.5 × 10⁵ 6.8 14 ads_+24h-48h 43 3 1.3 × 10⁵ 2.0 × 101 5 ads_+48h-120h 24 5 4.5 × 10⁵ 8.6 6 ads_+120h 20 7 5.4 × 10⁵ 5.4 6 ads_pH-5 9 1 1 ads_pH+5-6 13 2 6.3 × 10² 3.6 2 ads_pH+6-7 3 1 1 ads_pH+7-8 105 9 6.9 × 10⁴ 7.4 12 ads_pH+8-9 49 5 1.1 × 10⁶ 4.1 7 ads_pH+9 ads_mV-50 89 8 2.2 × 10⁵ 1.2 × 101 11 ads_mV+50-500 79 6 6.0 × 10⁴ 1.1 × 101 7
ads_mV+500-2000 8 1 1
TABLE 8. OPERATIONAL PDFS OF Kd VALUES (L kg-1) FOR Mn
Parameters N NE GM GSD #ref ads_mV+2000 10 1 1 des 46 3 6.9 × 10⁵ 6.6 3 des_-2h 17 2 5.4 × 10⁵ 6.7 2 des_+2h-24h 20 3 6.6 × 10⁵ 1.1 × 101 3 des_+24h-48h 5 1 1 des_+48h-120h 4 1 1 des_pH+7-8 22 3 2.0 × 10⁵ 5.0 3 des_pH+8-9 24 2 2.6 × 10⁶ 2.2 2 des_mV-50 32 3 1.3 × 10⁶ 5.6 3 des_mV+50-500 14 2 1.9 × 10⁵ 6.4 2 des_mV+500-2000 no data
des_mV+2000 no data in situ 17 2 7.8 × 10⁴ 1.8 4
TABLE 9. OPERATIONAL PDFS OF Kd VALUES (L kg-1) FOR Pu
Parameters N NE GM GSD #ref ads 37 7 7.9 × 10⁴ 2.2 3 ads_+2h-24h 1 1 irrelevant data 1 ads_+120h 15 2 irrelevant data 1 ads_mV-50 4 1 irrelevant data 1 ads_mV+50-500 27 6 8.7 × 10⁴ 2.3 2 ads_mV+500-2000 1 1 irrelevant data 1 des 41 6 3.0 × 10⁵ 4.2 4 des_-2h 1 1 irrelevant data 1 des_+2h-24h 5 2 irrelevant data 2 des_+24h-48h 3 2 irrelevant data 2 des_+48h-120h 1 1 irrelevant data 1 des_+120h 6 2 irrelevant data 2 des_mV+50-500 10 1 irrelevant data 1
des_mV+500-2000 30 4 3.4 × 10⁵ 2.5 2 in situ 79 9 2.4 × 10⁵ 6.6 6

456
TABLE 10. OPERATIONAL PDFS OF Kd VALUES (L kg-1) FOR Sr
Parameters N NE GM GSD #ref
ads 156 10 1.8 × 10² 4.6 8
ads_+2h-24h 51 5 2.8 × 10² 5.0 5
ads_+24h-48h 1 1 irrelevant data 1 ads_+48h-120h 48 3 8.5 × 101 4.0 3 ads_+120h 13 2 5.4 × 10² 1.9 2 ads_pH+5-6 7 1 irrelevant data 1 ads_pH+6-7 3 1 irrelevant data 1 ads_pH+7-8 81 6 9.3 × 101 3.0 4 ads_pH+8-9 28 2 4.6 × 101 1.5 2 ads_pH+9 2 1 irrelevant data 1 ads_mV-50 2 1 irrelevant data 1 ads_mV+50-500 48 7 1.4 × 10² 4.1 4 ads_mV+500-2000 7 1 irrelevant data 1 ads_mV+2000 84 3 4.5 × 101 4.1 3 des 34 5 6.2 × 10² 2.1 3 des_+2h-24h 1 1 irrelevant data 1 des_+24h-48h no data des_+48h-120h no data des_+120h 6 1 irrelevant data 1 des_pH+6-7 6 1 irrelevant data 1 des_pH+7-8 18 3 4.4 × 10² 1.4 2 des_pH+8-9 10 1 irrelevant data 1 des_mV+50-500 27 3 irrelevant data 1 des_mV+2000 7 2 irrelevant data 2 in situ 13 5 1.2 × 10³ 2.7 3
3.2 Kd values for radionuclides with moderate databases
For Be, Ba, Ce, Ra, Ru, Sb, and Th, the same methodology as previously detailed was used,
i.e.: (i) construction of a database including information on experimental factors; (ii)
application of quality criteria; (iii) determination of non-conditional PDFs by a bootstrap
statistical procedure. Thus, the only difference with section 3.1. is that no conditional PDFs
were defined for reducing the uncertainty over a given range of values for any parameter.
The literature sources are given in Appendix 1, and the various global PDFs that were thus
generated were summarised in Table 11.
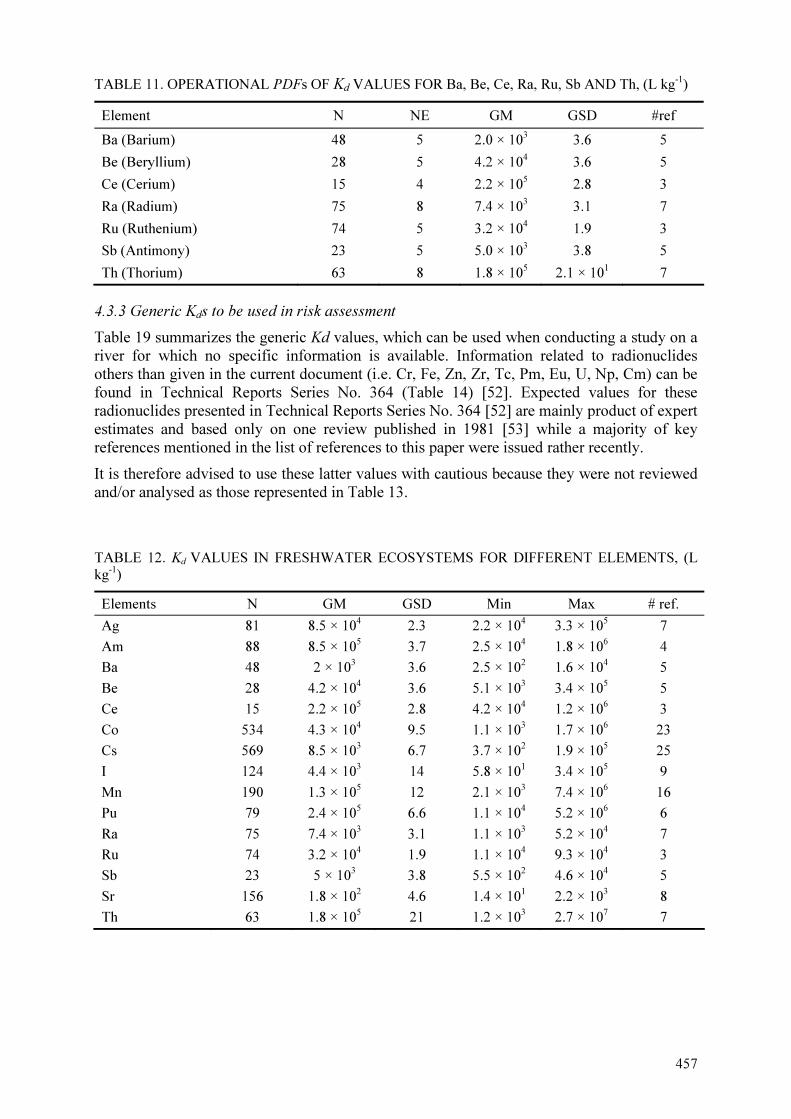
457
TABLE 11. OPERATIONAL PDFs OF Kd VALUES FOR Ba, Be, Ce, Ra, Ru, Sb AND Th, (L kg-1)
Element N NE GM GSD #ref
Ba (Barium) 48 5 2.0 × 10³ 3.6 5
Be (Beryllium) 28 5 4.2 × 10⁴ 3.6 5
Ce (Cerium) 15 4 2.2 × 10⁵ 2.8 3
Ra (Radium) 75 8 7.4 × 10³ 3.1 7
Ru (Ruthenium) 74 5 3.2 × 10⁴ 1.9 3
Sb (Antimony) 23 5 5.0 × 10³ 3.8 5
Th (Thorium) 63 8 1.8 × 10⁵ 2.1 × 101 7
4.3.3 Generic Kds to be used in risk assessment
Table 19 summarizes the generic Kd values, which can be used when conducting a study on a
river for which no specific information is available. Information related to radionuclides
others than given in the current document (i.e. Cr, Fe, Zn, Zr, Tc, Pm, Eu, U, Np, Cm) can be
found in Technical Reports Series No. 364 (Table 14) [52]. Expected values for these
radionuclides presented in Technical Reports Series No. 364 [52] are mainly product of expert
estimates and based only on one review published in 1981 [53] while a majority of key
references mentioned in the list of references to this paper were issued rather recently.
It is therefore advised to use these latter values with cautious because they were not reviewed
and/or analysed as those represented in Table 13.
TABLE 12. Kd VALUES IN FRESHWATER ECOSYSTEMS FOR DIFFERENT ELEMENTS, (L kg-1)
Elements N GM GSD Min Max # ref.
Ag 81 8.5 × 10⁴ 2.3 2.2 × 10⁴ 3.3 × 10⁵ 7
Am 88 8.5 × 10⁵ 3.7 2.5 × 10⁴ 1.8 × 10⁶ 4
Ba 48 2 × 10³ 3.6 2.5 × 10² 1.6 × 10⁴ 5
Be 28 4.2 × 10⁴ 3.6 5.1 × 10³ 3.4 × 10⁵ 5
Ce 15 2.2 × 10⁵ 2.8 4.2 × 10⁴ 1.2 × 10⁶ 3
Co 534 4.3 × 10⁴ 9.5 1.1 × 10³ 1.7 × 10⁶ 23
Cs 569 8.5 × 10³ 6.7 3.7 × 10² 1.9 × 10⁵ 25
I 124 4.4 × 10³ 14 5.8 × 101 3.4 × 10⁵ 9
Mn 190 1.3 × 10⁵ 12 2.1 × 10³ 7.4 × 10⁶ 16
Pu 79 2.4 × 10⁵ 6.6 1.1 × 10⁴ 5.2 × 10⁶ 6
Ra 75 7.4 × 10³ 3.1 1.1 × 10³ 5.2 × 10⁴ 7
Ru 74 3.2 × 10⁴ 1.9 1.1 × 10⁴ 9.3 × 10⁴ 3
Sb 23 5 × 10³ 3.8 5.5 × 10² 4.6 × 10⁴ 5
Sr 156 1.8 × 10² 4.6 1.4 × 101 2.2 × 10³ 8
Th 63 1.8 × 10⁵ 21 1.2 × 10³ 2.7 × 10⁷ 7
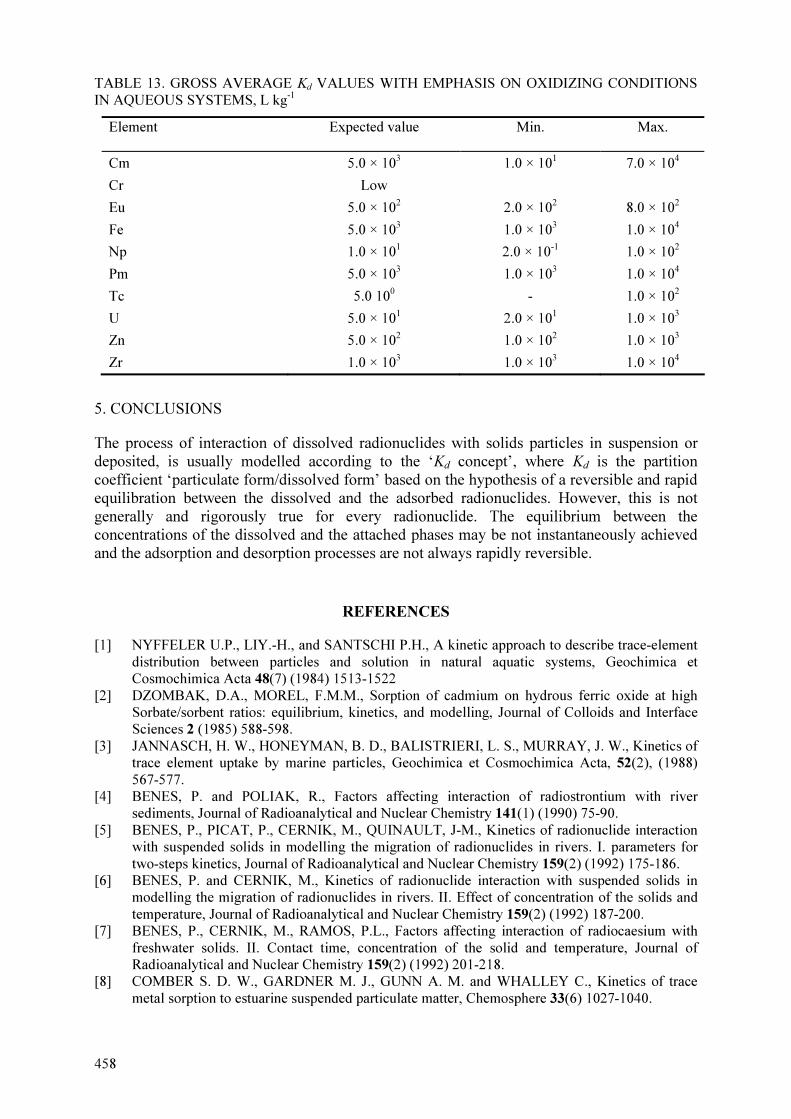
458
TABLE 13. GROSS AVERAGE Kd VALUES WITH EMPHASIS ON OXIDIZING CONDITIONS IN AQUEOUS SYSTEMS, L kg-1
Element Expected value Min. Max.
Cm 5.0 × 10³ 1.0 × 101 7.0 × 10⁴
Cr Low
Eu 5.0 × 10² 2.0 × 10² 8.0 × 10²
Fe 5.0 × 10³ 1.0 × 10³ 1.0 × 10⁴
Np 1.0 × 101 2.0 × 10⁻¹ 1.0 × 10²
Pm 5.0 × 10³ 1.0 × 10³ 1.0 × 10⁴
Tc 5.0 100 - 1.0 × 10²
U 5.0 × 101 2.0 × 101 1.0 × 10³
Zn 5.0 × 10² 1.0 × 10² 1.0 × 10³
Zr 1.0 × 10³ 1.0 × 10³ 1.0 × 10⁴
5. CONCLUSIONS
The process of interaction of dissolved radionuclides with solids particles in suspension or
deposited, is usually modelled according to the ‘Kd concept’, where Kd is the partition
coefficient ‘particulate form/dissolved form’ based on the hypothesis of a reversible and rapid
equilibration between the dissolved and the adsorbed radionuclides. However, this is not
generally and rigorously true for every radionuclide. The equilibrium between the
concentrations of the dissolved and the attached phases may be not instantaneously achieved
and the adsorption and desorption processes are not always rapidly reversible.
REFERENCES
[1] NYFFELER U.P., LIY.-H., and SANTSCHI P.H., A kinetic approach to describe trace-element distribution between particles and solution in natural aquatic systems, Geochimica et Cosmochimica Acta 48(7) (1984) 1513-1522
[2] DZOMBAK, D.A., MOREL, F.M.M., Sorption of cadmium on hydrous ferric oxide at high Sorbate/sorbent ratios: equilibrium, kinetics, and modelling, Journal of Colloids and Interface Sciences 2 (1985) 588-598.
[3] JANNASCH, H. W., HONEYMAN, B. D., BALISTRIERI, L. S., MURRAY, J. W., Kinetics of trace element uptake by marine particles, Geochimica et Cosmochimica Acta, 52(2), (1988) 567-577.
[4] BENES, P. and POLIAK, R., Factors affecting interaction of radiostrontium with river sediments, Journal of Radioanalytical and Nuclear Chemistry 141(1) (1990) 75-90.
[5] BENES, P., PICAT, P., CERNIK, M., QUINAULT, J-M., Kinetics of radionuclide interaction with suspended solids in modelling the migration of radionuclides in rivers. I. parameters for two-steps kinetics, Journal of Radioanalytical and Nuclear Chemistry 159(2) (1992) 175-186.
[6] BENES, P. and CERNIK, M., Kinetics of radionuclide interaction with suspended solids in modelling the migration of radionuclides in rivers. II. Effect of concentration of the solids and temperature, Journal of Radioanalytical and Nuclear Chemistry 159(2) (1992) 187-200.
[7] BENES, P., CERNIK, M., RAMOS, P.L., Factors affecting interaction of radiocaesium with freshwater solids. II. Contact time, concentration of the solid and temperature, Journal of Radioanalytical and Nuclear Chemistry 159(2) (1992) 201-218.
[8] COMBER S. D. W., GARDNER M. J., GUNN A. M. and WHALLEY C., Kinetics of trace metal sorption to estuarine suspended particulate matter, Chemosphere 33(6) 1027-1040.
459
[9] TRIVEDI P. AXE L., Modelling Cd and Zn sorption to hydrous metal oxides, Environmental Sciences and Technology 34 (2000) 2215-2223.
[10] EL MRABET, R., ABRIL, J. M., MANJÓN, G. GARCÍA TENORIO, R., Experimental and modelling study of Plutonium uptake by suspended matter in aquatic environments from southern Spain, Water Research 35(17) (2001) 4184-4190.
[11] CIFFROY, P., GARNIER, J.-M. and PHAM, M. K., Kinetics of Co, Mn, Fe, Ag and Cd adsorption in freshwater: experimental and modelling approach, Journal of Environmental Radioactivity 55(1) (2001) 71-91.
[12] CIFFROY, P., GARNIER, J.-M., BENYAHYA, L., Kinetic partitioning of Co, Mn, Cs, Fe, Ag, Zn and Cd in freshwaters (Loire) mixed with brackish waters (Loire estuary) : experimental and modelling approaches, Marine Pollution Bulletin 46(5), (2003) 626-641
[13] CIFFROY, P., REYSS, J.-L., SICLET, F., Determination of the residence time of suspended particles in the turbidity maximum of the Loire estuary by 7Be analysis, Estuarine, Coastal and Shelf Science 57(4) (2003) 553-568.
[14] MILLWARD, G.E., LIU, Y.P., Modelling metal desorption kinetics in estuaries, Science of the Total Environment 314-316 (2003) 613-623.
[15] GARNIER, J.-M., CIFFROY, P., BENYAHYA, L., Implications of short and long term (30 days) sorption on the desorption kinetic of trace metals (Cd, Zn, Co, Mn, Fe, Ag, Cs) associated with river suspended matter, Science of the Total Environment 366(1) (2006) 350-360.
[16] MOFFETT, J. W., A radiotracer study of cerium and manganese uptake onto suspended particles in Chesapeake Bay, Geochimica et Cosmochimica Acta 58(2) (1994) 695-703.
[17] BARROS H., ABRIL J.M., Constraints in the construction and/or selection of kinetic box models for the uptake of radionuclides and heavy metals by suspended particulate matter, Ecological Modelling 185(2-4) (2005) 371-385.
[18] SCHELL W. R., SANCHEZ A. L., SIBLEY T. H. and CLAYTON J. R.,. Distribution coefficients for radionuclides in aquatic environments. III. Adsorption and desorption studies of 106Ru, 137Cs, 241Am, 85Sr and 237Pu in marine and freshwater systems, Report of the Office of Nuclear Regulatory Research NUREG/CR-0803 (1980).
[19] BENES, P., JURAK, M. KUNCOVA, M., Factors affecting interaction of radiocobalt with river sediments. I. pH and composition of water, and contact time, Journal of Radioanalytical and Nuclear Chemistry 132(2) (1989) 209-223.
[20] BENES, P., JURAK, M., CERNIK, M., Factors affecting interaction of radiocobalt with river sediments. II. Composition and concentration of sediment, temperature, Journal of Radioanalytical and Nuclear Chemistry 132(2) (1989) 225-239.
[21] LIMA, M. F. and MAZZILLI, B. P., Determination of the distribution coefficients for 134Cs, 60Co and 234Th in the Pinheiros river sediment-water Journal of Radioanalytical and Nuclear Chemistry 177(1) (1994) 139-147.
[22] HATJE, V., PAYNE, T. E., HILL, D. M., MCORIST, G., BIRCH, G. F. SZYMCZAK, R., Kinetics of trace element uptake and release by particles in estuarine waters: effects of pH, salinity, and particle loading, Environment International, 29(5), (2003) 619-629.
[23] DZOMBAK, D.A., MOREL, F.M.M., Surface complexation modelling—hydrous ferric oxide, Wiley, New York (1990).
[24] TURNER, A., MILLWARD, G. E., BALE, A. J., MORRIS, A. W., Application of the Kd concept to the study of trace metal removal and desorption during estuarine mixing, Estuarine, Coastal and Shelf Science 36(1) (1993) 1-13.
[25] BIRD, G. A., SCHWARTZ, W. J., Distribution coefficients, Kds, for Iodide Canadian shield lake sediments under oxic and anoxic conditions, Journal of Environmental Radioactivity 35(3) (1996) 261-269.
[26] STEPHENS, J. A., WHICKER, F. W., IBRAHIM, S. A., Sorption of Cs and Sr to profundal sediments of a Savannah river site reservoir, Journal of Environmental Radioactivity 38(3) (1998) 293-315.
[27] BENOIT, G., ROZAN, T., The influence of size distribution on the particle concentration effect and trace metal partitioning in rivers, Geochimica et Cosmochimica Acta 63(1) (1999) 113-127
[28] McKINLEY, J. P., JENNE, E. A., Experimental investigation and review of the “solids concentration” effects in adsorption Studies, Environmental Science and Technology 25(12) (1991) 2082-2087.

460
[29] GARNIER, J.-M., PHAM, M. K., CIFFROY, P. and MARTIN, J.-M., Kinetics of trace metal complexation with suspended matter and with filterable ligands in fresh water. Environmental Science and Technology 31(6) (1997) 1597-1606.
[30] EYROLLE, F., CHARMASSON, S., Distribution of organic carbon, selected stable elements and artificial radionuclides among dissolved, colloidal and particulate phases in the Rhône River (France): Preliminary results, Journal of Environmental Radioactivity 55(2) (2001) 145-155.
[31] EYROLLE, F., CHARMASSON,S., Importance of colloids in the transport within the dissolved phase (<450 nm) of artificial radionuclides from the Rhône river towards the Gulf of Lions (Mediterranean Sea), Journal of Environmental Radioactivity 72 (3) (2004) 273-286.
[32] MATSUNAGA, T., NAGAO, S., UENO, T., TAKEDA, S., AMANO, H., TKACHENKO, Y., Association of dissolved radionuclides released by the Chernobyl accident with colloidal materials in surface water, Applied Geochemistry 19(10) (2004) 1581-1599.
[33] SALBU B., LIND O. C., SKIPPERUD L., Radionuclide speciation and its relevance in environmental impact assessments, Journal of Environmental Radioactivity 74(1-3) (2004) 233-242.
[34] TURNER, A., MILLWARD, G. E., Partitioning of trace metals in a macrotidal estuary. Implications for contaminant transport models, Estuarine, Coastal and Shelf Science 39(1) (1994) 45-58.
[35] TURNER, A., Trace-metal partitioning in estuaries: importance of salinity and particle concentration, Marine Chemistry 54(1-2) (1996) 27-39.
[36] MATSUNAGA, T., AMANO, H., YANASE, N., Discharge of dissolved and particulate 137Cs in the Kuji river, Japan, Applied Geochemistry 6(2) (1991) 159-167.
[37] MATSUNAGA, T., UENO, T., AMANO, H., TKATCHENKO, Y., KOVALYOV, A., WATANABE, M., ONUMA, Y., Characteristics of Chernobyl-derived radionuclides in particulate form in surface waters in the exclusion zone around the Chernobyl nuclear power plant, Journal of Contaminant Hydrology 35(1-3) (1998) 101-113.
[38] SMITH, J. T., COMANS, R. N. J., Modelling the diffusive transport and remobilisation of 137Cs in sediments: the effects of sorption kinetics and reversibility, Geochimica and Cosmochimica Acta 60(6) (1996) 995-1004.
[39] SMITH, J. T., LEONARD, D. R. P., HILTON, J. APPLEBY, P. G., Towards a generalised model for the primary and secondary contamination of lakes by Chernobyl-derived radiocaesium, Health Physics 72(6) (1997) 880-892.
[40] HILTON, J., NOLAN, L., JARVIS, K. E., Concentrations of stable isotopes of caesium and strontium in freshwaters in northern England and their effect on estimates of sorption coefficients (Kd), Geochimica et Cosmochimica Acta 61 (6) (1997) 1115-1124.
[41] COMANS, R. N. J., HILTON, J., VOITSEKHOVITCH, O., LAPTEV, G., POPOV, V., MADRUGA, M. J., BULGAKOV, A., SMITH, J. T., MOVCHAN, N., KONOPLEV, A., A comparative study of radiocaesium mobility measurements in soils and sediments from the catchment of a small upland oligotrophic lake (Devoke Water, U.K.), Water Research 32(9) (1998) 2846-2855.
[42] DE PRETER, P., Radiocaesium retention in the aquatic, terrestrial and urban environment: A quantitative and unifying analysis, Ph.D. thesis, Katholieke Universiteit, (1990)
[43] BRUGGENWERT, M.G.M., KAMPHORST, A., “Survey of experimental information on cation exchange in soil systems” Soil Chemistry, B. Physico-chemical Models Developments in Soil Science (Bolt, G.H. Ed)(1979)
[44] TESSIER, P.G., CAMPBELL, C., BISSON, M., Sequential extraction procedure for the speciation of particulate trace metals, Analytical Chemistry 51 (1979) 844–851.
[45] SCHULTZ, M. K., BURNETT, W. C., KENNETH, G. W., Evaluation of a sequential extraction method for determining actinide fractionation in soils and sediments, Journal of Environmental Radioactivity(40) (2) (1998) 155-174.
[46] BUNKER, D. J., SMITH, J. T., LIVENS, F. R., HILTON, J., Determination of radionuclide exchangeability in freshwater systems, Science of the Total Environment 263(1-3) (2000) 171-183.
[47] SANADA, Y., MATSUNAGA, T., YANASE, N., NAGAO, S., AMANO, H., TAKADA, H., TKACHENKO, Y., Accumulation and potential dissolution of Chernobyl-derived radionuclides in river bottom sediment, Applied Radiation and Isotopes56(5) (2002) 751-760.
461
[48] ZEEVAERT, T., VOLCKAERT, G., VANDECASTEELE, C., A sensitivity study of the SCK-CEN BIOSPHERE model for performance assessment of near-surface repositories, Health Physics 69(2) (1995) 243-256.
[49] CIFFROY, P., SICLET, F., DAMOIS, C., LUCK, M., DUBOUDIN, C., A dynamic model for assessing radiological consequences of routine releases in the Loire river : parameterisation and uncertainty/sensitivity analysis, Journal of Environmental Radioactivity 83(1) (2005) 9-48.
[50] BENES, P., RAMOS, P. L., POLIAK, R., Factors affecting interaction of radiocaesium with freshwater solids. I. pH and composition of water, and contact time, Journal of Radioanalytical and Nuclear Chemistry 133(2) (1989) 359-376.
[51] HÅKANSON, L., MIKRENSKA, M., PETROV, K., FOSTER, I., Suspended particulate matter (SPM) in rivers: empirical data and models, Ecological Modelling 183(2-3) (2005) 251-267.
[52] INTERNATIONAL ATOMIC ENERGY AGENCY, Handbook of Parameter Values for the Prediction of Radionuclide Transfer in Temperate Environments, Technical Reports Series No. 364, IAEA, Vienna (1994).
[53] ONISHI, Y., SERNE, R.J., ARNOLD, E.M., COWEN, C.E. THOMPSON, F.L., Critical Review: Radionuclide Transport, Sediment Transport, and Water Quality Mathematical Modelling and Radionuclide Adsorption/Desorption Mechanisms, Rep. NUREG/CR-1322, PNL-2901, Pacific Nortwest Lab., Richmond, WA (1981).

462
APPENDIX I
List of publication used for evaluation of freshwater Kd values
BARROS H., ABRIL J.M., Constraints in the construction and/or selection of kinetic box models for the uptake of radionuclides and heavy metals by suspended particulate matter, Ecological Modelling 185(2-4) (2005) 371-385. BENES, P. and CERNIK, M., Kinetics of radionuclide interaction with suspended solids in modelling the migration of radionuclides in rivers. II. Effect of concentration of the solids and temperature, Journal of Radioanalytical and Nuclear Chemistry 159(2) (1992) 187-200. BENES, P. and POLIAK, R., Factors affecting interaction of radiostrontium with river sediments, Journal of Radioanalytical and Nuclear Chemistry 141(1) (1990) 75-90. BENES, P., CERNIK, M., RAMOS, P.L., Factors affecting interaction of radiocaesium with freshwater solids. II. Contact time, concentration of the solid and temperature, Journal of Radioanalytical and Nuclear Chemistry 159(2) (1992) 201-218. BENES, P., JURAK, M. KUNCOVA, M., Factors affecting interaction of radiocobalt with river sediments. I. pH and composition of water, and contact time, Journal of Radioanalytical and Nuclear Chemistry 132(2) (1989) 209-223. BENES, P., JURAK, M., CERNIK, M., Factors affecting interaction of radiocobalt with river sediments. II. Composition and concentration of sediment, temperature, Journal of Radioanalytical and Nuclear Chemistry 132(2) (1989) 225-239. BENES, P., PICAT, P., CERNIK, M., QUINAULT, J-M., Kinetics of radionuclide interaction with suspended solids in modelling the migration of radionuclides in rivers. I. parameters for two-steps kinetics, Journal of Radioanalytical and Nuclear Chemistry 159(2) (1992) 175-186. BENES, P., RAMOS, P. L., POLIAK, R., Factors affecting interaction of radiocaesium with freshwater solids. I. pH and composition of water, and contact time, Journal of Radioanalytical and Nuclear Chemistry 133(2) (1989) 359-376. BENOIT, G., ROZAN, T., The influence of size distribution on the particle concentration effect and trace metal partitioning in rivers, Geochimica et Cosmochimica Acta 63(1) (1999) 113-127 BIRD, G. A., SCHWARTZ, W. J., Distribution coefficients, Kds, for Iodide Canadian shield lake sediments under oxic and anoxic conditions, Journal of Environmental Radioactivity 35(3) (1996) 261-269. BRUGGENWERT, M.G.M., KAMPHORST, A., “Survey of experimental information on cation exchange in soil systems” Soil Chemistry, B. Physico-chemical Models Developments in Soil Science (Bolt, G.H. Ed)(1979) BUNKER, D. J., SMITH, J. T., LIVENS, F. R., HILTON, J., Determination of radionuclide exchangeability in freshwater systems, Science of the Total Environment 263(1-3) (2000) 171-183. CIFFROY, P., GARNIER, J.-M. and PHAM, M. K., Kinetics of Co, Mn, Fe, Ag and Cd adsorption in freshwater: experimental and modelling approach, Journal of Environmental Radioactivity 55(1) (2001) 71-91. CIFFROY, P., GARNIER, J.-M., BENYAHYA, L., Kinetic partitioning of Co, Mn, Cs, Fe, Ag, Zn and Cd in freshwaters (Loire) mixed with brackish waters (Loire estuary) : experimental and modelling approaches, Marine Pollution Bulletin 46(5), (2003) 626-641 CIFFROY, P., REYSS, J.-L., SICLET, F., Determination of the residence time of suspended particles in the turbidity maximum of the Loire estuary by 7Be analysis, Estuarine, Coastal and Shelf Science 57(4) (2003) 553-568. CIFFROY, P., SICLET, F., DAMOIS, C., LUCK, M., DUBOUDIN, C., A dynamic model for assessing radiological consequences of routine releases in the Loire river : parameterisation and uncertainty/sensitivity analysis, Journal of Environmental Radioactivity 83(1) (2005) 9-48. COMANS, R. N. J., HILTON, J., VOITSEKHOVITCH, O., LAPTEV, G., POPOV, V., MADRUGA, M. J., BULGAKOV, A., SMITH, J. T., MOVCHAN, N., KONOPLEV, A., A comparative study of radiocaesium mobility measurements in soils and sediments from the catchment of a small upland oligotrophic lake (Devoke Water, U.K.), Water Research 32(9) (1998) 2846-2855.

463
COMBER S. D. W., GARDNER M. J., GUNN A. M. and WHALLEY C., Kinetics of trace metal sorption to estuarine suspended particulate matter, Chemosphere 33(6) 1027-1040. DE PRETER, P., Radiocaesium retention in the aquatic, terrestrial and urban environment: A quantitative and unifying analysis, Ph.D. thesis, Katholieke Universiteit, (1990) DZOMBAK, D.A., MOREL, F.M.M., Sorption of cadmium on hydrous ferric oxide at high Sorbate/sorbent ratios: equilibrium, kinetics, and modelling, Journal of Colloids and Interface Sciences 2 (1985) 588-598. DZOMBAK, D.A., MOREL, F.M.M., Surface complexation modelling—hydrous ferric oxide, Wiley, New York (1990). EL MRABET, R., ABRIL, J. M., MANJÓN, G. GARCÍA TENORIO, R., Experimental and modelling study of Plutonium uptake by suspended matter in aquatic environments from southern Spain, Water Research 35(17) (2001) 4184-4190. EYROLLE, F., CHARMASSON, S., Distribution of organic carbon, selected stable elements and artificial radionuclides among dissolved, colloidal and particulate phases in the Rhône River (France): Preliminary results, Journal of Environmental Radioactivity 55(2) (2001) 145-155. EYROLLE, F., CHARMASSON,S., Importance of colloids in the transport within the dissolved phase (<450 nm) of artificial radionuclides from the Rhône river towards the Gulf of Lions (Mediterranean Sea), Journal of Environmental Radioactivity 72 (3) (2004) 273-286. GARNIER, J.-M., CIFFROY, P., BENYAHYA, L., Implications of short and long term (30 days) sorption on the desorption kinetic of trace metals (Cd, Zn, Co, Mn, Fe, Ag, Cs) associated with river suspended matter, Science of the Total Environment 366(1) (2006) 350-360. GARNIER, J.-M., PHAM, M. K., CIFFROY, P. and MARTIN, J.-M., Kinetics of trace metal complexation with suspended matter and with filterable ligands in fresh water. Environmental Science and Technology 31(6) (1997) 1597-1606. HÅKANSON, L., MIKRENSKA, M., PETROV, K., FOSTER, I., Suspended particulate matter (SPM) in rivers: empirical data and models, Ecological Modelling 183(2-3) (2005) 251-267. HATJE, V., PAYNE, T. E., HILL, D. M., MCORIST, G., BIRCH, G. F. SZYMCZAK, R., Kinetics of trace element uptake and release by particles in estuarine waters: effects of pH, salinity, and particle loading, Environment International, 29(5), (2003) 619-629. HILTON, J., NOLAN, L., JARVIS, K. E., Concentrations of stable isotopes of caesium and strontium in freshwaters in northern England and their effect on estimates of sorption coefficients (Kd), Geochimica et Cosmochimica Acta 61 (6) (1997) 1115-1124. INTERNATIONAL ATOMIC ENERGY AGENCY, Handbook of Parameter Values for the Prediction of Radionuclide Transfer in Temperate Environments, Technical Reports Series No. 364, IAEA, Vienna (1994). JANNASCH, H. W., HONEYMAN, B. D., BALISTRIERI, L. S., MURRAY, J. W., Kinetics of trace element uptake by marine particles, Geochimica et Cosmochimica Acta, 52(2), (1988) 567-577. LIMA, M. F. and MAZZILLI, B. P., Determination of the distribution coefficients for 134Cs, 60Co and 234Th in the Pinheiros river sediment-water Journal of Radioanalytical and Nuclear Chemistry 177(1) (1994) 139-147. MATSUNAGA, T., AMANO, H., YANASE, N., Discharge of dissolved and particulate 137Cs in the Kuji river, Japan, Applied Geochemistry 6(2) (1991) 159-167. MATSUNAGA, T., NAGAO, S., UENO, T., TAKEDA, S., AMANO, H., TKACHENKO, Y., Association of dissolved radionuclides released by the Chernobyl accident with colloidal materials in surface water, Applied Geochemistry 19(10) (2004) 1581-1599. MATSUNAGA, T., UENO, T., AMANO, H., TKATCHENKO, Y., KOVALYOV, A., WATANABE, M., ONUMA, Y., Characteristics of Chernobyl-derived radionuclides in particulate form in surface waters in the exclusion zone around the Chernobyl nuclear power plant, Journal of Contaminant Hydrology 35(1-3) (1998) 101-113. McKINLEY, J. P., JENNE, E. A., Experimental investigation and review of the “solids concentration” effects in adsorption Studies, Environmental Science and Technology 25(12) (1991) 2082-2087. MILLWARD, G.E., LIU, Y.P., Modelling metal desorption kinetics in estuaries, Science of the Total Environment 314-316 (2003) 613-623.

464
MOFFETT, J. W., A radiotracer study of cerium and manganese uptake onto suspended particles in Chesapeake Bay, Geochimica et Cosmochimica Acta 58(2) (1994) 695-703. NYFFELER U.P., LIY.-H., and SANTSCHI P.H.,A kinetic approach to describe trace-element distribution between particles and solution in natural aquatic systems, Geochimica et Cosmochimica Acta 48(7) (1984) 1513-1522 SALBU B., LIND O. C., SKIPPERUD L., Radionuclide speciation and its relevance in environmental impact assessments, Journal of Environmental Radioactivity 74(1-3) (2004) 233-242. SANADA, Y., MATSUNAGA, T., YANASE, N., NAGAO, S., AMANO, H., TAKADA, H., TKACHENKO, Y., Accumulation and potential dissolution of Chernobyl-derived radionuclides in river bottom sediment, Applied Radiation and Isotopes56(5) (2002) 751-760. SCHELL W. R., SANCHEZ A. L., SIBLEY T. H. and CLAYTON J. R.,. Distribution coefficients for radionuclides in aquatic environments. III. Adsorption and desorption studies of 106Ru, 137Cs, 241Am, 85Sr and 237Pu in marine and freshwater systems, Report of the Office of Nuclear Regulatory Research NUREG/CR-0803 (1980). SCHULTZ, M. K., BURNETT, W. C., KENNETH, G. W., Evaluation of a sequential extraction method for determining actinide fractionation in soils and sediments, Journal of Environmental Radioactivity(40) (2) (1998) 155-174. SMITH, J. T., COMANS, R. N. J., Modelling the diffusive transport and remobilisation of 137Cs in sediments: the effects of sorption kinetics and reversibility, Geochimica and Cosmochimica Acta 60(6) (1996) 995-1004. SMITH, J. T., LEONARD, D. R. P., HILTON, J. APPLEBY, P. G., Towards a generalised model for the primary and secondary contamination of lakes by Chernobyl-derived radiocaesium, Health Physics 72(6) (1997) 880-892. STEPHENS, J. A., WHICKER, F. W., IBRAHIM, S. A., Sorption of Cs and Sr to profundal sediments of a Savannah river site reservoir, Journal of Environmental Radioactivity 38(3) (1998) 293-315. TESSIER, P.G., CAMPBELL, C., BISSON, M., Sequential extraction procedure for the speciation of particulate trace metals, Analytical Chemistry 51 (1979) 844–851. TRIVEDI P. AXE L., Modelling Cd and Zn sorption to hydrous metal oxides, Environmental Sciences and Technology 34 (2000) 2215-2223. TURNER, A., MILLWARD, G. E., BALE, A. J., MORRIS, A. W., Application of the Kd concept to the study of trace metal removal and desorption during estuarine mixing, Estuarine, Coastal and Shelf Science 36(1) (1993) 1-13. TURNER, A., MILLWARD, G. E., Partitioning of trace metals in a macrotidal estuary. Implications for contaminant transport models, Estuarine, Coastal and Shelf Science 39(1) (1994) 45-58. TURNER, A., Trace-metal partitioning in estuaries: importance of salinity and particle concentration, Marine Chemistry 54(1-2) (1996) 27-39. ZEEVAERT, T., VOLCKAERT, G., VANDECASTEELE, C., A sensitivity study of the SCK-CEN BIOSPHERE model for performance assessment of near-surface repositories, Health Physics 69(2) (1995) 243-256.
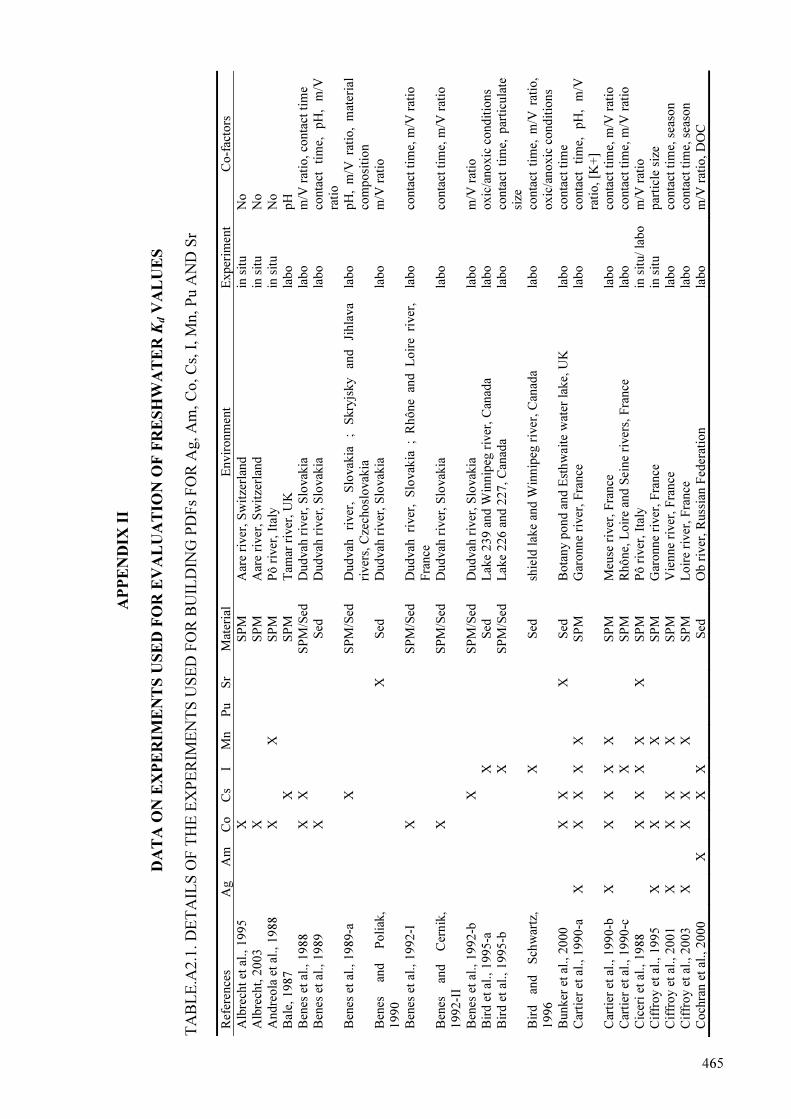
AP
PE
ND
IX
II
DA
TA
ON
EX
PE
RIM
EN
TS
US
ED
FO
R E
VA
LU
AT
IO
N O
F F
RE
SH
WA
TE
R K
d V
AL
UE
S
TA
BL
E.A
2.1
. D
ET
AIL
S O
F T
HE
EX
PE
RIM
EN
TS
US
ED
FO
R B
UIL
DIN
G P
DF
s F
OR
Ag, A
m,
Co, C
s, I
, M
n, P
u A
ND
Sr
Ref
eren
ces
Ag
Am
C
o
Cs
I M
n
Pu
Sr
Mat
eria
l E
nvir
onm
ent
Exper
imen
t C
o-f
acto
rs
Alb
rech
t et
al.
, 1995
X
S
PM
A
are
river
, S
wit
zerl
and
in s
itu
No
Alb
rech
t, 2
003
X
S
PM
A
are
river
, S
wit
zerl
and
in s
itu
No
Andre
ola
et
al., 1
988
X
X
SP
M
Pô r
iver
, It
aly
in s
itu
No
Bal
e, 1
987
X
S
PM
T
amar
riv
er,
UK
la
bo
pH
Ben
es e
t al
., 1
988
X
X
SP
M/S
ed
Dudvah
riv
er,
Slo
vak
ia
labo
m/V
rat
io,
conta
ct t
ime
Ben
es e
t al
., 1
989
X
S
ed
Dudvah
riv
er,
Slo
vak
ia
labo
conta
ct
tim
e,
pH
, m
/V
rati
o
Ben
es e
t al
., 1
989-a
X
SP
M/S
ed
Dudvah
ri
ver
, S
lovak
ia
; S
kry
jsky
and
Jihla
va
river
s, C
zech
osl
ovak
ia
labo
pH
, m
/V r
atio
, m
ater
ial
com
posi
tion
Ben
es
and
Poli
ak,
19
90
X
S
ed
Dudvah
riv
er, S
lovak
ia
labo
m/V
rat
io
Ben
es e
t al
., 1
992-I
X
SP
M/S
ed
Dudvah
ri
ver
, S
lovak
ia ;
Rhône
and
L
oir
e ri
ver
,
Fra
nce
labo
conta
ct t
ime,
m/V
rat
io
Ben
es
and
Cer
nik
,
19
92
-II
X
S
PM
/Sed
D
udvah
riv
er, S
lovak
ia
labo
conta
ct t
ime,
m/V
rat
io
Ben
es e
t al
., 1
992-b
X
SP
M/S
ed
Dudvah
riv
er,
Slo
vak
ia
labo
m/V
rat
io
Bir
d e
t al
., 1
995-a
X
Sed
L
ake
239 a
nd W
innip
eg r
iver
, C
anad
a la
bo
oxic
/ano
xic
condit
ions
Bir
d e
t al
., 1
995-b
X
SP
M/S
ed
Lak
e 226 a
nd 2
27,
Can
ada
labo
conta
ct t
ime,
par
ticu
late
size
Bir
d
and
Sch
war
tz,
19
96
X
S
ed
shie
ld l
ake
and W
innip
eg r
iver
, C
anad
a la
bo
conta
ct t
ime,
m/V
rat
io,
oxic
/ano
xic
condit
ions
Bunker
et
al., 2
000
X
X
X
S
ed
Bota
ny p
ond a
nd E
sth
wai
te w
ater
lak
e, U
K
labo
conta
ct t
ime
Car
tier
et
al., 1
990-a
X
X
X
X
X
SP
M
Gar
onne
river
, F
rance
la
bo
conta
ct
tim
e,
pH
, m
/V
rati
o, [K
+]
Car
tier
et
al., 1
990-b
X
X
X
X
X
SP
M
Meu
se r
iver
, F
rance
la
bo
conta
ct t
ime,
m/V
rat
io
Car
tier
et
al., 1
990-c
X
SP
M
Rhô
ne,
Loir
e an
d S
eine
river
s, F
rance
la
bo
conta
ct t
ime,
m/V
rat
io
Cic
eri
et a
l., 1988
X
X
X
X
X
S
PM
P
ô r
iver
, It
aly
in s
itu/
labo
m/V
rat
io
Cif
fro
y e
t al
., 1
995
X
X
X
S
PM
G
aronne
river
, F
rance
in
sit
u
par
ticl
e si
ze
Cif
fro
y e
t al
., 2
001
X
X
X
X
SP
M
Vie
nne
river
, F
rance
la
bo
conta
ct t
ime,
sea
son
Cif
fro
y e
t al
., 2
003
X
X
X
X
SP
M
Loir
e ri
ver
, F
rance
la
bo
conta
ct t
ime,
sea
son
Coch
ran e
t al
., 2
000
X
X
X
S
ed
Ob r
iver
, R
uss
ian F
eder
atio
n
labo
m/V
rat
io,
DO
C
465
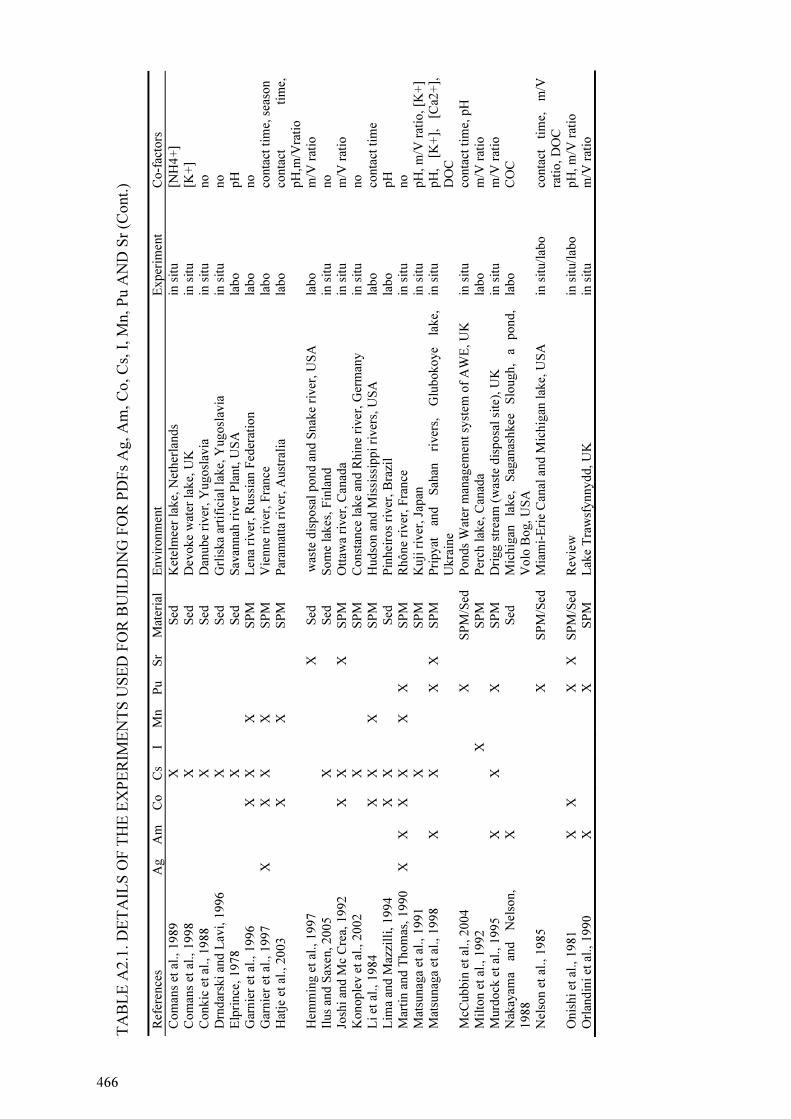
TA
BL
E A
2.1
. D
ET
AIL
S O
F T
HE
EX
PE
RIM
EN
TS
US
ED
FO
R B
UIL
DIN
G F
OR
PD
Fs
Ag, A
m,
Co, C
s, I
, M
n, P
u A
ND
Sr
(Cont.
)
Ref
eren
ces
Ag
Am
C
o
Cs
I M
n
Pu
Sr
Mat
eria
l E
nvir
onm
ent
Exper
imen
t C
o-f
acto
rs
Co
man
s et
al.
, 1989
X
S
ed
Ket
elm
eer
lake,
Net
her
lands
in s
itu
[NH
4+
]
Co
man
s et
al.
, 1998
X
S
ed
Dev
oke
wat
er l
ake,
UK
in
sit
u
[K+
]
Conkic
et
al., 1
988
X
S
ed
Dan
ube
river
, Y
ugosl
avia
in
sit
u
no
Drn
dar
ski
and L
avi,
1996
X
S
ed
Grl
iska
arti
fici
al l
ake,
Yugosl
avia
in
sit
u
no
Elp
rince
, 1978
X
S
ed
Sav
annah
riv
er P
lant,
US
A
labo
pH
Gar
nie
r et
al.
, 1996
X
X
X
S
PM
L
ena
river
, R
uss
ian F
eder
atio
n
labo
no
Gar
nie
r et
al.
, 1997
X
X
X
X
SP
M
Vie
nne
river
, F
rance
la
bo
conta
ct t
ime,
sea
son
Hat
je e
t al
., 2
003
X
X
SP
M
Par
amat
ta r
iver
, A
ust
rali
a la
bo
conta
ct
tim
e,
pH
,m/V
rati
o
Hem
min
g e
t al
., 1
997
X
S
ed
was
te d
isposa
l pond a
nd S
nak
e ri
ver
, U
SA
la
bo
m/V
rat
io
Ilus
and S
axen
, 2005
X
S
ed
So
me
lakes
, F
inla
nd
in s
itu
no
Josh
i an
d M
c C
rea,
1992
X
X
X
S
PM
O
ttaw
a ri
ver
, C
anad
a in
sit
u
m/V
rat
io
Konople
v e
t al
., 2
002
X
S
PM
C
onst
ance
lak
e an
d R
hin
e ri
ver
, G
erm
any
in s
itu
no
Li
et a
l.,
1984
X
X
X
S
PM
H
udso
n a
nd M
issi
ssip
pi
river
s, U
SA
la
bo
conta
ct t
ime
Lim
a an
d M
azzi
lli,
1994
X
X
Sed
P
inhei
ros
river
, B
razi
l la
bo
pH
Mar
tin a
nd T
ho
mas
, 1990
X
X
X
X
X
X
SP
M
Rhô
ne
river
, F
rance
in
sit
u
no
Mat
sunag
a et
al.
, 1991
X
S
PM
K
uji
riv
er, Ja
pan
in
sit
u
pH
, m
/V r
atio
, [K
+]
Mat
sunag
a et
al.
, 1998
X
X
X
X
SP
M
Pri
pyat
an
d
Sah
an
river
s,
Glu
boko
ye
lake,
Ukra
ine
in s
itu
pH
, [K
+],
[C
a2+
],
DO
C
McC
ubbin
et
al., 2
004
X
S
PM
/Sed
P
onds
Wat
er m
anag
emen
t sy
stem
of
AW
E,
UK
in
sit
u
conta
ct t
ime,
pH
Mil
ton e
t al
., 1
992
X
S
PM
P
erch
lak
e, C
anad
a la
bo
m/V
rat
io
Murd
ock
et
al., 1
995
X
X
X
S
PM
D
rigg s
trea
m (
was
te d
isposa
l si
te),
UK
in
sit
u
m/V
rat
io
Nak
ayam
a an
d
Nel
son,
19
88
X
S
ed
Mic
hig
an
lake,
S
agan
ashkee
S
lough,
a pond,
Volo
Bog,
US
A
labo
CO
C
Nel
son e
t al
., 1
985
X
S
PM
/Sed
M
iam
i-E
rie
Can
al a
nd M
ichig
an l
ake,
US
A
in s
itu/l
abo
conta
ct
tim
e,
m/V
rati
o, D
OC
Onis
hi
et a
l., 1981
X
X
X
X
SP
M/S
ed
Rev
iew
in
sit
u/l
abo
pH
, m
/V r
atio
Orl
andin
i et
al.
, 1990
X
X
SP
M
Lak
e T
raw
sfynnydd, U
K
in s
itu
m/V
rat
io
466

TA
BL
E A
2.1
. D
ET
AIL
S O
F T
HE
EX
PE
RIM
EN
TS
US
ED
FO
R B
UIL
DIN
G P
DF
s F
OR
Ag, A
m,
Co, C
s, I
, M
n, P
u a
nd S
r (C
ont.
)
Ref
eren
ces
Ag
Am
C
o
Cs
I M
n
Pu
Sr
Mat
eria
l E
nvir
onm
ent
Exper
imen
t C
o-f
acto
rs
Pham
an
d
Gar
nie
r,
19
98
X
X
X
X
SP
M
Vie
nne
river
, F
rance
la
bo
Coll
oid
al c
once
ntr
atio
n
Quei
razz
a et
al
.,
19
87
X
X
X
X
SP
M
Pô r
iver
, It
aly
in s
itu/l
abo
no
Robbin
s et
al.
, 1992
X
S
ed
Const
ance
lak
e, G
erm
any
labo
conta
ct t
ime,
m/V
rat
io
Robbin
s an
d
Jasi
nsk
i, 1
995
X
S
ed
lake
Snia
rdw
y,
Pola
nd
labo
conta
ct t
ime,
m/V
rat
io
San
tsch
i et
al.
, 1990
X
S
PM
Z
uri
ch l
ake,
Sw
itze
rlan
d
in s
itu
no
Sch
ell
et a
l., 1980
X
X
X
X
X
S
ed
Mic
hig
an
lake,
H
udso
n
and
Cli
nch
ri
ver
,
Cat
tara
gus
cree
k, U
SA
labo
pH
, m
/V r
atio
Sm
ith e
t al
., 1
997
X
S
PM
S
om
e C
um
bri
an l
akes
, U
K
in s
itu
m/V
rat
io
Sm
ith a
nd C
om
ans,
19
96
X
S
ed
Ket
elm
eer
and H
oll
and D
iep l
akes
, N
ether
lands
in s
itu
[K+
], [
NH
4+
]
Sta
ndri
ng
et
al.,
20
02
-a
X
S
ed
Fle
kke
river
, S
ogn a
nd F
jord
ane
county
, N
orw
ay
labo
conta
ct
tim
e,
sedim
ent
com
posi
tion
Sta
ndri
ng
et
al.,
20
02
-b
X
X
X
S
ed
Res
ervoir
10 o
f M
ayak
PA
, R
uss
ian F
eder
atio
n
in s
itu
no
Ste
phen
s et
al
.,
19
98
X
X
Sed
S
avan
nah
riv
er s
ite,
US
A
labo
m/V
rat
io
Str
and e
t al
., 1
999
X
X
Sed
R
eser
voir
10
and
11
of
May
ak
PA
, R
uss
ian
Fed
erat
ion
in s
itu
no
Svad
lenko
va
et
al.,
19
90
X
S
ed
Vlt
ava
river
, C
zech
osl
ovak
ia
labo
conta
ct t
ime
Thir
ion e
t al
., 1
983
X
X
X
S
PM
L
oir
e ri
ver
, F
rance
la
bo
conta
ct t
ime,
m/V
rat
io
Turn
er e
t al
., 1
993
X
X
SP
M
Ouse
riv
er, U
K
labo
m/V
rat
io
Turn
er
and
Mil
lwar
d,
19
94
X
X
SP
M
Dee
riv
er, U
K
labo
conta
ct t
ime,
pH
Turn
er,
1996
X
S
PM
C
lyde,
C
onw
y,
Res
tronguet
an
d
Tw
eed
river
s,
UK
lab
o
no
Um
et
al., 2
004
X
S
ed
Han
ford
sit
e, U
SA
la
bo
pH
467
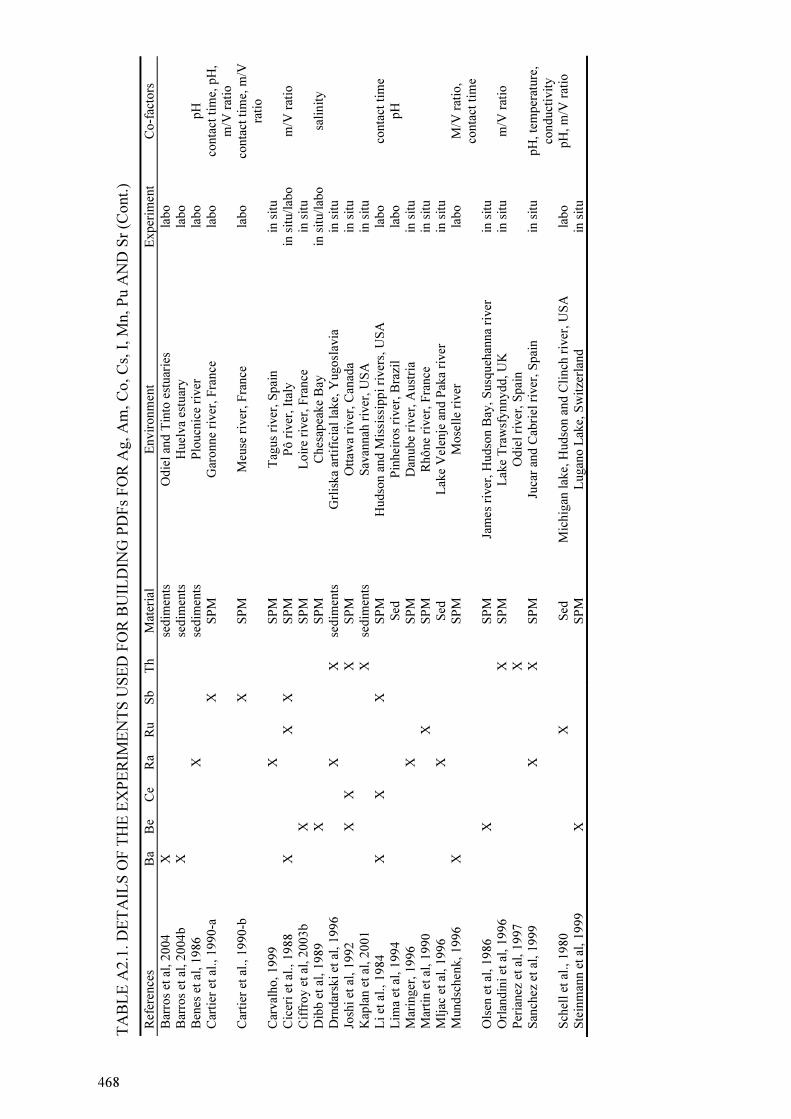
TA
BL
E A
2.1
. D
ET
AIL
S O
F T
HE
EX
PE
RIM
EN
TS
US
ED
FO
R B
UIL
DIN
G P
DF
s F
OR
Ag, A
m,
Co, C
s, I
, M
n, P
u A
ND
Sr
(Cont.
)
Ref
eren
ces
Ba
Be
Ce
Ra
Ru
Sb
Th
Mat
eria
l E
nvir
onm
ent
Exper
imen
t C
o-f
acto
rs
Bar
ros
et a
l, 2
004
X
sedim
ents
O
die
l an
d T
into
est
uar
ies
labo
Bar
ros
et a
l, 2
004b
X
sedim
ents
H
uel
va
estu
ary
labo
Ben
es e
t al
, 1986
X
sedim
ents
P
loucn
ice
river
la
bo
pH
Car
tier
et
al., 1
990-a
X
S
PM
G
aronne
river
, F
rance
la
bo
conta
ct t
ime,
pH
,
m/V
rat
io
Car
tier
et
al., 1
990-b
X
S
PM
M
euse
riv
er,
Fra
nce
la
bo
conta
ct t
ime,
m/V
rati
o
Car
val
ho, 1999
X
SP
M
Tag
us
river
, S
pai
n
in s
itu
Cic
eri
et a
l., 1988
X
X
X
SP
M
Pô r
iver
, It
aly
in s
itu/l
abo
m/V
rat
io
Cif
fro
y e
t al
, 2003b
X
SP
M
Loir
e ri
ver
, F
rance
in
sit
u
Dib
b e
t al
, 1989
X
SP
M
Ches
apea
ke
Bay
in
sit
u/l
abo
sali
nit
y
Drn
dar
ski
et a
l, 1
996
X
X
se
dim
ents
G
rlis
ka
arti
fici
al l
ake,
Yugosl
avia
in
sit
u
Josh
i et
al,
1992
X
X
X
SP
M
Ott
awa
river
, C
anad
a in
sit
u
Kap
lan e
t al
, 2001
X
sedim
ents
S
avan
nah
riv
er, U
SA
in
sit
u
Li
et a
l.,
1984
X
X
X
SP
M
Hudso
n a
nd M
issi
ssip
pi
river
s, U
SA
la
bo
conta
ct t
ime
Lim
a et
al,
1994
S
ed
Pin
hei
ros
river
, B
razi
l la
bo
pH
Mar
inger
, 1996
X
SP
M
Dan
ube
river
, A
ust
ria
in s
itu
Mar
tin e
t al
, 1990
X
SP
M
Rhô
ne
river
, F
rance
in
sit
u
Mlj
ac e
t al
, 1996
X
Sed
L
ake
Vel
enje
and P
aka
river
in
sit
u
Mund
schen
k,
1996
X
SP
M
Mose
lle
river
la
bo
M/V
rat
io,
conta
ct t
ime
Ols
en e
t al
, 1986
X
SP
M
Jam
es r
iver
, H
udso
n B
ay, S
usq
ueh
anna
river
in
sit
u
Orl
andin
i et
al,
1996
X
SP
M
Lak
e T
raw
sfynnydd, U
K
in s
itu
m/V
rat
io
Per
ianez
et
al,
1997
X
O
die
l ri
ver
, S
pai
n
San
chez
et
al,
1999
X
X
S
PM
Ju
car
and C
abri
el r
iver
, S
pai
n
in s
itu
pH
, te
mper
ature
,
conduct
ivit
y
Sch
ell
et a
l.,
1980
X
Sed
M
ichig
an l
ake,
Hudso
n a
nd C
linch
riv
er,
US
A
labo
pH
, m
/V r
atio
Ste
inm
ann e
t al
, 1999
X
SP
M
Lugan
o L
ake,
Sw
itze
rlan
d
in s
itu
468

469
APPENDIX III
GRAPHICAL PRESENTATION OF PROBABILITY DENSITY FUNCTIONS
DERIVED FOR SOME RADIONUCLIDES
SSWD - Log Normal
0%
10%
20%
30%
40%
50%
60%
70%
80%
90%
100%
10 100 1000 10000 100000
Concentration
Cu
mu
lative
we
igh
ted
pro
ba
bili
ty
Best-Estimate Centile 5% Centile 95%
Mundschenk96_1e_2a_3f_4b_5a Mundschenk96_1e_2a_3f_4a_5a Li84_1e_2e_3c_4a_5b
Li84_1e_2c_3c_4a_5b Li84_1e_2a_3c_4a_5b Ciceri88_1d_2f_3f_4a_5c
Barros04b_1b_2b_3f_4a_5c Barros04b_1b_2a_3f_4d_5c Barros04b_1b_2a_3f_4c_5c
Barros04_1b_2b_3c_4d_5b Barros04_1b_2a_3c_4d_5b Barros04_1b_2a_3c_4c_5b
R² = 0.9575
KSpvalue = 0.500
wm.lg = 3.31
wsd.lg = 0.55
FIG.1. PDF for Ba.
SSWD - Log NormalSp = unweighted; TW:
Ciffroy03_1b_2f_3f_4b_5c;Ciffroy03_1b_2f_3f_4c_5c;Dibb89_1b_2b_3f_4a_5d;Dibb89_1b_2f_3f_4a_5c;Joshi92_1b_2f_3f_4a_5c;Olsen86_1b_2f_3f_4a_5c;St
einmann99_1b_2f_3f_4a_5b = 46;45;60;64;64;64;68
0%
10%
20%
30%
40%
50%
60%
70%
80%
90%
100%
1000 10000 100000 1000000
Concentration
Cu
mu
lative
we
igh
ted
pro
ba
bili
ty
Best-Estimate Centile 5% Centile 95% Steinmann99_1b_2f_3f_4a_5b
Olsen86_1b_2f_3f_4a_5c Joshi92_1b_2f_3f_4a_5c Dibb89_1b_2f_3f_4a_5c Dibb89_1b_2b_3f_4a_5d
Ciffroy03_1b_2f_3f_4c_5c Ciffroy03_1b_2f_3f_4b_5c
R² = 0.9450
KSpvalue = 0.500
wm.lg = 4.62
wsd.lg = 0.55
FIG. 2. PDF FOR Be.
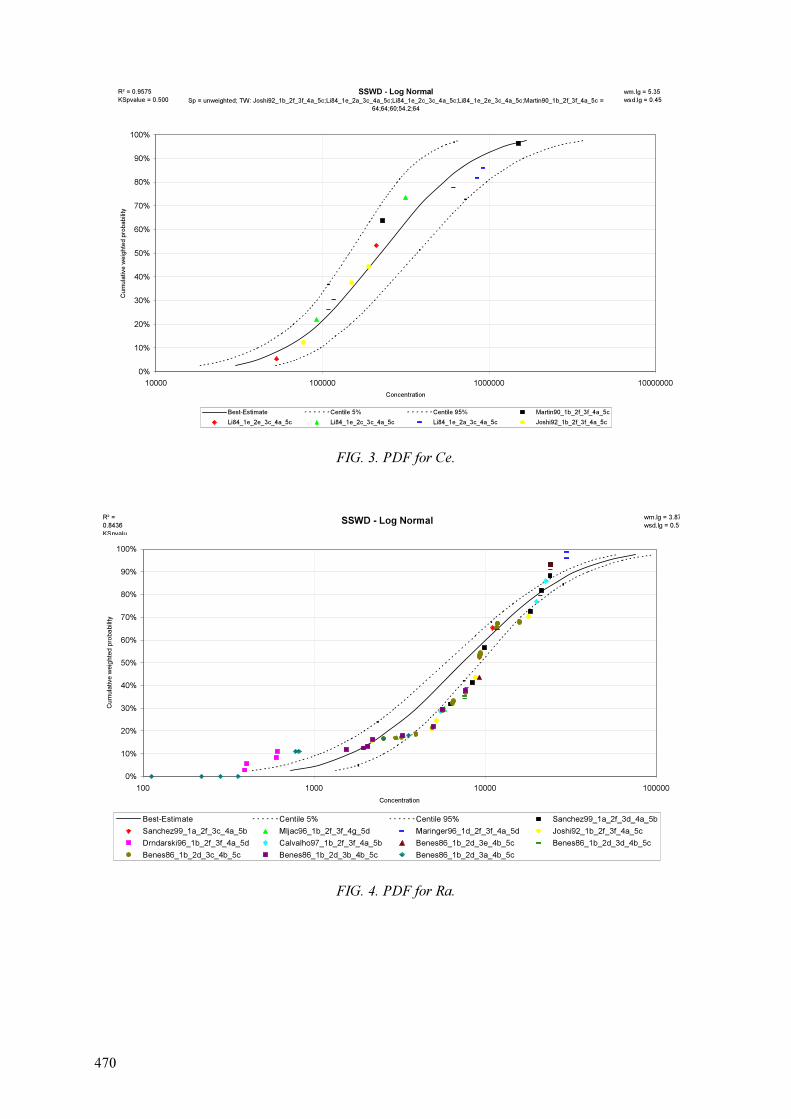
470
SSWD - Log NormalSp = unweighted; TW: Joshi92_1b_2f_3f_4a_5c;Li84_1e_2a_3c_4a_5c;Li84_1e_2c_3c_4a_5c;Li84_1e_2e_3c_4a_5c;Martin90_1b_2f_3f_4a_5c =
64;64;60;54.2;64
0%
10%
20%
30%
40%
50%
60%
70%
80%
90%
100%
10000 100000 1000000 10000000
Concentration
Cu
mu
lative
we
igh
ted
pro
ba
bili
ty
Best-Estimate Centile 5% Centile 95% Martin90_1b_2f_3f_4a_5c
Li84_1e_2e_3c_4a_5c Li84_1e_2c_3c_4a_5c Li84_1e_2a_3c_4a_5c Joshi92_1b_2f_3f_4a_5c
R² = 0.9575
KSpvalue = 0.500
wm.lg = 5.35
wsd.lg = 0.45
FIG. 3. PDF for Ce.
SSWD - Log Normal
0%
10%
20%
30%
40%
50%
60%
70%
80%
90%
100%
100 1000 10000 100000
Concentration
Cu
mu
lative
we
igh
ted
pro
ba
bili
ty
Best-Estimate Centile 5% Centile 95% Sanchez99_1a_2f_3d_4a_5b
Sanchez99_1a_2f_3c_4a_5b Mljac96_1b_2f_3f_4g_5d Maringer96_1d_2f_3f_4a_5d Joshi92_1b_2f_3f_4a_5c
Drndarski96_1b_2f_3f_4a_5d Calvalho97_1b_2f_3f_4a_5b Benes86_1b_2d_3e_4b_5c Benes86_1b_2d_3d_4b_5c
Benes86_1b_2d_3c_4b_5c Benes86_1b_2d_3b_4b_5c Benes86_1b_2d_3a_4b_5c
R² =
0.8436
KSpvalu
wm.lg = 3.87
wsd.lg = 0.51
FIG. 4. PDF for Ra.

471
SSWD - Log NormalSp = unweighted; TW: Ciceri88_1d_2f_3f_4a_5c;Martin90_1b_2f_3f_4a_5c;Schell80_1a_2g_3c_4a_5d = 64;64;68.2
0%
10%
20%
30%
40%
50%
60%
70%
80%
90%
100%
1000 10000 100000
Concentration
Cu
mu
lative
we
igh
ted
pro
ba
bili
ty
Best-Estimate Centile 5% Centile 95% Schell80_1a_2g_3c_4a_5d Martin90_1b_2f_3f_4a_5c Ciceri88_1d_2f_3f_4a_5c
R² = 0.8495
KSpvalue = 0.000
wm.lg = 4.51
wsd.lg = 0.28
FIG. 5. PDF for Ru.
SSWD - Log Normal
0%
10%
20%
30%
40%
50%
60%
70%
80%
90%
100%
100 1000 10000 100000
Concentration
Cu
mu
lative
we
igh
ted
pro
ba
bili
ty
Best-Estimate Centile 5% Centile 95% Martin90_1b_2f_3f_4a_5c
Li84_1e_2e_3c_4a_5h Li84_1e_2c_3c_4a_5h Li84_1e_2a_3c_4a_5h Ciceri88_1d_2f_3f_4a_5c
Cartier90-b_1b_2d_3d_4a_5e Cartier90-b_1b_2d_3c_4a_5e Cartier90-b_1b_2a_3d_4a_5e Cartier90-b_1b_2a_3c_4a_5e
Cartier90-a_1b_2d_3c_4a_5e Cartier90-a_1b_2a_3c_4a_5e
R² = 0.8773
KSpvalue =
0.500
wm.lg = 3.70
wsd.lg = 0.58
FIG. 6. PDF for Sb.


473
TRANSFERS TO FRESHWATER BIOTA
T. YANKOVICH
EcoMetrix Incorporated, Mississauga, Ontario, Canada
Abstract
It remains important to monitor the fate of radionuclides, particularly in environmental compartments that comprise human
pathways. Therefore, an extensive literature survey has been conducted to compile available data on the transfer of
radionuclides and their analogues to edible freshwater biota. Focus was placed on compilation of steady state transfer
parameters for two freshwater pathways, including water-to-biota and sediment-to-biota. In general, although in many cases,
extensive data were available for fishes and invertebrates, relatively fewer data were available for freshwater primary
producers, amphibians and reptiles. To fill in these gaps, data were also compiled on the internal partitioning of elements in
the body with respect to tissue masses, which could be used to estimate radionuclide concentrations between compartments in
the body.
1. MAIN CONCEPTS
Humans can consume a wide variety of freshwater biota, which broadly includes fish,
freshwater primary producers, invertebrates, amphibians, reptiles, mammalian species and
waterfowl. Within each type of freshwater foodstuff, humans may also consume a number of
different tissue types (Tables 1 and 2) [1-13], which can contribute to the accumulation of
radionuclides into human tissues, depending upon the propensity of a given tissue to
accumulate radionuclides and the efficiency with which radionuclides in different types of
food are incorporated into the human body [14-19].
Humans may also indirectly receive accumulated radionuclides through food-chain transfer
processes whereby radionuclides are transferred from lower trophic levels that are not
typically consumed by humans to higher, edible trophic levels (e.g. Figure 1). All such
transfer processes can be mathematically described through the application of steady state or
dynamic radionuclide transfer models for freshwater ecosystems [20-28].
Although it is generally recognized that accumulation of contaminants (in this case,
radionuclides) by edible aquatic organisms is a dynamic process, many contaminant
bioaccumulation models assume that the aquatic organisms are in equilibrium with reference
media, such as water or sediments, in their surrounding environment. As a result, radionuclide
accumulation into aquatic biota is often represented by simplified ratios that relate
radionuclide concentrations in biotic tissues to concentrations in the reference media [25 and
29].
TABLE 1. SUMMARY OF EDIBLE TISSUES FOR EACH TYPE OF FRESHWATER PLANT SPECIES [13]
Type of Freshwater Biota Whole Leaves Stems Roots Fruit
Cyanobacteria √
a Filamentous Algae √
Floating-leaved Macrophytes √ √
Emergent Macrophytes √ √ √ √
a e.g. epiphyton.

474
TABLE 2. SUMMARY OF EDIBLE TISSUES FOR EACH TYPE OF FRESHWATER ANIMAL SPECIES [1-13]
Type of Freshwater Animal Whole Soft Tissues Muscle Liver Eggs Comments
Freshwater Invertebrate: Freshwater Mussels √ Benthic Crustaceans √ √ Snails √ √ Macroinvertebrates √ Freshwater Fish: Forage Fish √ √ Benthic Fish √ √ √ Piscivorous Fish/Eels √ √ Reptiles:
Snakes √ √ ld1 Alligators √ √ ld
Turtles √ √ ld Amphibians:
Tadpoles √ ld Frogs √ √ ld
Freshwater Birds: Waterfowl √ √ √
Aquatic Mammals: Muskrats √ Not covered.
Otters √ Not covered. Beavers √ Not covered.
1ld means that data are relatively limited.
FIG. 1. Conceptual Model Depicting Trophic Interactions in Aquatic Ecosystems.

475
The steady state models can be sub-divided into two categories based on the chemical
behaviour of a given radionuclide and its associated transfer processes to edible biotic tissues.
These include: i) models that are based on simple radionuclide partitioning between
organisms and reference phases (such as surface water or sediments), and ii) specific activity
models, which assess partitioning of radionuclides relative to stable analogues in the body.
2. MODELS BASED ON BIOACCUMULATION FACTORS
2.1 Definitions
Depending upon the radionuclide uptake pathway being considered, a number of
representations of partitioning can be defined. For example, the biota sediment accumulation
factor (BSAF) is the concentration of a radionuclide in an organism (Cb) relative to the value
measured in the sediment (Csed) on a per unit fresh sediment basis, as described by:
Csed
CbBSAF = (1)
The BSAF is appropriately derived from studies in which only the sediment is contaminated.
The bioaccumulation factor (BAF) is the contaminant concentration in biota (Cb) from all
exposure pathways (including water, sediment and ingestion/dietary pathways) relative to that
of water (Cw), where:
Cw
CbBAF = (2)
The contribution of sediment-associated radionuclides can be of particular importance with
respect to radionuclide uptake by benthic species.
2.2 Derived bioaccumulation factor values
Most contaminant transfer factors found in the literature do not distinguish between uptake
pathways and therefore represent BAFs (also called concentration ratios, CRs). Water-to-biota
BAFs from the literature have been compiled for radionuclides and their stable analogues in
Tables 3-6, whereas sediment-to-biota accumulation factors (BSAFs) are provided in Tables
from 7 to 8 (based on the data from [30-31]). The BAF data have been further sub-divided by
type of edible tissue, as provided in Tables 9–21.All accumulation factors are given on a per
unit fresh weight basis. In general, it is important to note that BAFs and BSAFs for stable
elements are conservative when used to represent radionuclides with relatively short
radiological half-lives and relatively long biological half-lives, since physical decay of short-
lived radionuclides can significantly reduce their concentration in biota tissues [32]. To
account for this, the BAF or BSAF can be multiplied by a factor, K, that accounts for the
radionuclide-specific half-lives, as described by:
br
bK
λλ
λ
+
= (3)
where λb is the biological decay constant = 0.693 tb-1
(day-1
); λr = radioactive decay
constant = 0.693 tr-1
(day-1
); tb = biological half-life (day); tr = radiological half-life (day). For
screening purposes, a tb of 30 days (or a λb of 0.023 day-1
) can be assumed [32].

476
TABLE 3. SUMMARY OF BIOACCUMULATION FACTORS (BAF) FOR ALL TYPES OF EDIBLE FRESHWATER PRIMARY PRODUCERS, L/kg FW
Element N GM/AM1 GSD/SD Min Max # ref
Am 16 3.7 × 10³ 8.3 × 100 7.5 × 100 3.8 × 10⁴ 6
C 10 1.6 × 10⁴ 1.5 × 101 4.4 × 101 8.9 × 10⁴ 1
Cd 5 1.9 × 10⁴ 6.8 × 100 1.10 × 10⁴ 2.3 × 10⁴ 2
Cm 1 8.0 × 10³ nd2 nd nd 1
Co 18 7.1 × 10² 5.1 × 100 5.0 × 101 2.0 × 10⁴ 11
Cs 26 8.7 × 101 1.6 × 101 1.8 × 100 3.3 × 10³ 2
Cu 5 3.0 × 10³ 3.19 × 10² 2.40 × 10³ 3.6 × 10³ 3
Fe 5 9.1 × 10³ 1.8 × 100 5.20 × 10³ 1.5 × 10⁴ 1
I 3 1.3 × 10² 3.7 × 100 7.8 × 101 2.7 × 10² 1
Mn 6 1.2 × 10⁴ 7.22 × 10² 3.10 × 10⁻¹ 1.5 × 10⁵ 4
Ni 5 7.7 × 10² 1.29 × 10² 2.50 × 10² 1.1 × 10³ 3
Np 2 7.2 × 10³ 1.1 × 10³ 6.50 × 10³ 8.0 × 10³ 3
Pb 5 1.9 × 10³ 7.6 × 101 1.30 × 10³ 2.2 × 10³ 1
Pu 40 2.6 × 10⁴ 1.4 × 101 1.20 × 10² 4.9 × 10⁷ 4
Ra 8 2.8 × 10³ 4.1 × 100 6.40 × 10² 1.1 × 10⁴ 2
Ru 8 2.9 × 10² 2.0 × 100 7.4 × 101 6.7 × 10² 1
Se 31 1.4 × 10³ 5.4 × 100 9.4 × 100 8.2 × 10³ 1
Sr 17 4.1 × 10² 3.3 × 100 3.9 × 101 1.9 × 10³ 16
Tc 8 5.5 × 100 4.9 × 100 2.80 × 10⁻¹ 8.8 × 101 1
U 4 2.10 × 10² 1.9 × 100 8.1 × 101 5.2 × 10² 1
Zn 5 2.10 × 10⁴ 1.3 × 101 1.40 × 10⁴ 2.7 × 10⁴ 1 1 The arithmetical mean AM and the standard deviation (SD) are given if the number of observations (N) is 2; 2 nd means – no data.
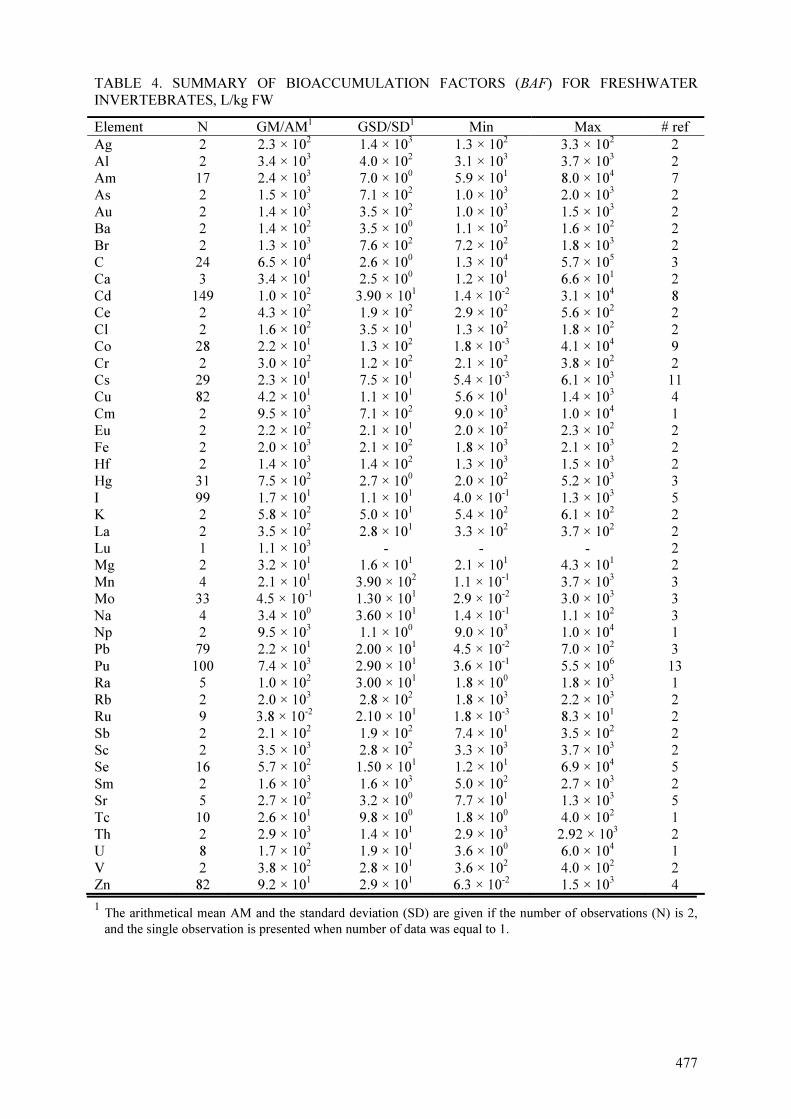
477
TABLE 4. SUMMARY OF BIOACCUMULATION FACTORS (BAF) FOR FRESHWATER INVERTEBRATES, L/kg FW
Element N GM/AM1 GSD/SD1 Min Max # ref Ag 2 2.3 × 10² 1.4 × 10³ 1.3 × 10² 3.3 × 10² 2 Al 2 3.4 × 10³ 4.0 × 10² 3.1 × 10³ 3.7 × 10³ 2 Am 17 2.4 × 10³ 7.0 × 100 5.9 × 101 8.0 × 10⁴ 7 As 2 1.5 × 10³ 7.1 × 10² 1.0 × 10³ 2.0 × 10³ 2 Au 2 1.4 × 10³ 3.5 × 10² 1.0 × 10³ 1.5 × 10³ 2 Ba 2 1.4 × 10² 3.5 × 100 1.1 × 10² 1.6 × 10² 2 Br 2 1.3 × 10³ 7.6 × 10² 7.2 × 10² 1.8 × 10³ 2 C 24 6.5 × 10⁴ 2.6 × 100 1.3 × 10⁴ 5.7 × 10⁵ 3 Ca 3 3.4 × 101 2.5 × 100 1.2 × 101 6.6 × 101 2 Cd 149 1.0 × 10² 3.90 × 101 1.4 × 10⁻² 3.1 × 10⁴ 8 Ce 2 4.3 × 10² 1.9 × 10² 2.9 × 10² 5.6 × 10² 2 Cl 2 1.6 × 10² 3.5 × 101 1.3 × 10² 1.8 × 10² 2 Co 28 2.2 × 101 1.3 × 10² 1.8 × 10⁻³ 4.1 × 10⁴ 9 Cr 2 3.0 × 10² 1.2 × 10² 2.1 × 10² 3.8 × 10² 2 Cs 29 2.3 × 101 7.5 × 101 5.4 × 10⁻³ 6.1 × 10³ 11 Cu 82 4.2 × 101 1.1 × 101 5.6 × 101 1.4 × 10³ 4 Cm 2 9.5 × 10³ 7.1 × 10² 9.0 × 10³ 1.0 × 10⁴ 1 Eu 2 2.2 × 10² 2.1 × 101 2.0 × 10² 2.3 × 10² 2 Fe 2 2.0 × 10³ 2.1 × 10² 1.8 × 10³ 2.1 × 10³ 2 Hf 2 1.4 × 10³ 1.4 × 10² 1.3 × 10³ 1.5 × 10³ 2 Hg 31 7.5 × 10² 2.7 × 100 2.0 × 10² 5.2 × 10³ 3 I 99 1.7 × 101 1.1 × 101 4.0 × 10⁻¹ 1.3 × 10³ 5 K 2 5.8 × 10² 5.0 × 101 5.4 × 10² 6.1 × 10² 2 La 2 3.5 × 10² 2.8 × 101 3.3 × 10² 3.7 × 10² 2 Lu 1 1.1 × 10³ - - - 2 Mg 2 3.2 × 101 1.6 × 101 2.1 × 101 4.3 × 101 2 Mn 4 2.1 × 101 3.90 × 10² 1.1 × 10⁻¹ 3.7 × 10³ 3 Mo 33 4.5 × 10⁻¹ 1.30 × 101 2.9 × 10⁻² 3.0 × 10³ 3 Na 4 3.4 × 100 3.60 × 101 1.4 × 10⁻¹ 1.1 × 10² 3 Np 2 9.5 × 10³ 1.1 × 100 9.0 × 10³ 1.0 × 10⁴ 1 Pb 79 2.2 × 101 2.00 × 101 4.5 × 10⁻² 7.0 × 10² 3 Pu 100 7.4 × 10³ 2.90 × 101 3.6 × 10⁻¹ 5.5 × 10⁶ 13 Ra 5 1.0 × 10² 3.00 × 101 1.8 × 100 1.8 × 10³ 1 Rb 2 2.0 × 10³ 2.8 × 10² 1.8 × 10³ 2.2 × 10³ 2 Ru 9 3.8 × 10⁻² 2.10 × 101 1.8 × 10⁻³ 8.3 × 101 2 Sb 2 2.1 × 10² 1.9 × 10² 7.4 × 101 3.5 × 10² 2 Sc 2 3.5 × 10³ 2.8 × 10² 3.3 × 10³ 3.7 × 10³ 2 Se 16 5.7 × 10² 1.50 × 101 1.2 × 101 6.9 × 10⁴ 5 Sm 2 1.6 × 10³ 1.6 × 10³ 5.0 × 10² 2.7 × 10³ 2 Sr 5 2.7 × 10² 3.2 × 100 7.7 × 101 1.3 × 10³ 5 Tc 10 2.6 × 101 9.8 × 100 1.8 × 100 4.0 × 10² 1 Th 2 2.9 × 10³ 1.4 × 101 2.9 × 10³ 2.92 × 10³ 2 U 8 1.7 × 10² 1.9 × 101 3.6 × 100 6.0 × 10⁴ 1 V 2 3.8 × 10² 2.8 × 101 3.6 × 10² 4.0 × 10² 2 Zn 82 9.2 × 101 2.9 × 101 6.3 × 10⁻² 1.5 × 10³ 4 1 The arithmetical mean AM and the standard deviation (SD) are given if the number of observations (N) is 2,
and the single observation is presented when number of data was equal to 1.

TA
BL
E 5
. S
UM
MA
RY
OF
BIO
AC
CU
MU
LA
TIO
N F
AC
TO
RS
(BAF
) F
OR
FR
ES
HW
AT
ER
FIS
H T
ISS
UE
S, L
/kg F
W
Who
le
M
usc
le
Ele
ment
N
GM
/AM
G
SD
/SD
M
in
Max
N
GM
/AM
G
SD
/SD
M
in
Max
# r
ef
Ag
23
1
.1 ×
102
1.3
× 1
00
5.7
× 1
01
1.8
× 1
02
2
7
1.1
× 1
02
1.5
× 1
00
4.0
× 1
01
2.1
× 1
02
4
Al
93
6
.6 ×
101
7.1
× 1
00
4.5
× 1
00
5.2
× 1
03
3
1
5.1
× 1
01
3.8
× 1
00
5.9
× 1
00
3.0
× 1
02
3
Am
nd
nd
nd
nd
nd
2
2.4
× 1
02
2.3
× 1
02
7.2
× 1
01
4.0
× 1
02
11
As
33
3
.8 ×
102
2.3
× 1
00
8.1
× 1
01
1.0
× 1
03
1
5
3.3
× 1
02
2.1
× 1
00
5.0
× 1
01
8.5
× 1
02
4
Au
13
2
.9 ×
102
2.3
× 1
00
5.0
× 1
01
1.0
× 1
03
1
7
2.4
× 1
02
2.1
× 1
00
5.0
× 1
01
9.0
× 1
02
4
Ba
92
4
.7 ×
101
1.7
× 1
00
5.0
× 1
00
2.2
× 1
02
1
11
1.2
× 1
00
3.3
× 1
00
5.3
× 1
0-2
3.2
× 1
01
4
Br
37
1
.6 ×
102
2.3
× 1
00
1.5
× 1
01
7.9
× 1
02
1
5
9.1
× 1
01
2.3
× 1
00
1.8
× 1
01
3.7
× 1
02
4
C
nd
nd
nd
nd
nd
6
4.0
× 1
05
2.9
× 1
00
1.9
× 1
05
3.2
× 1
06
3
Ca
11
8
1.0
× 1
03
3.4
× 1
00
8.4
× 1
01
5.6
× 1
03
1
04
1.2
× 1
01
2.5
× 1
00
2.0
× 1
00
9.7
× 1
01
5
Ce
90
1
.2 ×
101
2.7
× 1
00
3.0
× 1
00
1.1
× 1
02
7
1
2.5
× 1
01
8.5
× 1
00
9.0
e-0
1
1.2
× 1
03
5
Cl
37
8
.5 ×
101
1.6
× 1
00
2.5
× 1
01
2.3
× 1
02
1
6
4.7
× 1
01
2.2
× 1
00
8.9
× 1
00
1.2
× 1
02
4
Co
1
18
4
.0 ×
102
1.6
× 1
00
2.3
× 1
01
2.4
× 1
03
6
5
7.6
× 1
01
2.4
× 1
00
9.0
× 1
00
5.6
× 1
02
14
Cr
51
2
.1 ×
102
2 ×
100
3.5
× 1
01
7.6
× 1
02
5
7
4.0
× 1
01
2 ×
100
1.3
× 1
01
1.2
× 1
02
5
Cs
14
5
3.0
× 1
03
2.6
× 1
00
7.5
× 1
01
2.4
× 1
04
1
06
2.5
× 1
03
2.4
× 1
00
1.4
× 1
02
1.5
× 1
04
52
Cu
10
2
2.7
× 1
02
1.5
× 1
00
8.6
× 1
01
1.2
× 1
03
8
6
2.3
× 1
02
1.7
× 1
00
8.9
× 1
01
7.2
× 1
02
5
Dy
1
3.0
× 1
02
- -
-
2
6.5
× 1
02
6.4
× 1
02
2.0
× 1
02
1.1
× 1
03
3
Eu
53
1
.5 ×
102
3.2
× 1
00
7.6
× 1
00
2.2
× 1
03
2
4
1.3
× 1
02
4.9
× 1
00
1.1
× 1
01
7.2
× 1
02
4
Fe
11
4
1.4
× 1
02
5.7
× 1
00
1.6
× 1
01
5.3
× 1
03
8
6
1.7
× 1
02
6.9
× 1
00
6.6
× 1
00
2.0
× 1
03
6
Hf
20
2
.1 ×
103
3.2
× 1
00
3.0
× 1
02
2.8
× 1
04
1
0
1.1
× 1
03
1.8
× 1
00
3.3
× 1
02
2.0
× 1
03
3
Hg
20
4
.5 ×
103
2.2
× 1
00
1.1
× 1
03
2.2
× 1
04
1
4
6.1
× 1
03
1.8
× 1
00
1.9
× 1
03
1.7
× 1
04
3
I 8
4
6.5
× 1
02
2.1
× 1
00
1.0
× 1
02
4.5
× 1
04
5
0
3.0
x 1
01
2.5
× 1
00
1.1
e-0
1
4.0
× 1
02
8
K
12
0
4.0
× 1
03
2.0
× 1
00
5.7
× 1
02
1.5
× 1
04
8
7
3.2
× 1
03
1.6
× 1
00
1.2
× 1
03
9.0
× 1
03
5
La
10
2
1.6
× 1
01
3.2
× 1
00
3.6
× 1
00
3.4
× 1
02
7
4
3.7
× 1
01
4.9
× 1
00
1.1
× 1
00
6.6
× 1
02
4
Mg
11
1
1.1
× 1
02
3.0
× 1
00
1.4
× 1
01
4.3
× 1
02
8
6
3.7
× 1
01
2.2
× 1
00
7.9
× 1
00
1.8
× 1
02
4
Mn
11
0
4.5
× 1
02
4.0
× 1
00
4.8
× 1
01
7.0
× 1
03
8
7
2.4
× 1
02
6
.7 ×
100
1.3
× 1
01
1.4
× 1
05
6
Mo
8
1
2.7
× 1
01
1.9
× 1
00
2.1
× 1
00
1.9
× 1
02
6
4
1.9
× 1
00
2.1
× 1
00
4.0
× 1
0-3
2.0
× 1
01
5
Na
42
1
.4 ×
102
2.1
× 1
00
3.4
× 1
01
6.0
× 1
02
8
7
7.6
× 1
01
3.0
× 1
00
1.7
× 1
01
6.1
× 1
02
5
Ni
24
7
.1 ×
101
2.1
× 1
00
1.9
× 1
01
6.6
× 1
02
5
2
.1 ×
101
1.9
× 1
00
1.1
× 1
01
4.4
× 1
01
1
P
nd
nd
nd
nd
nd
39
1
.4 ×
105
1.1
× 1
00
1.2
× 1
05
1.7
× 1
05
1
Pb
8
2
3.7
× 1
02
3.0
× 1
00
5.8
× 1
01
5.7
× 1
03
3
9
2.5
× 1
01
2.9
× 1
00
1.0
× 1
0-1
2.7
× 1
02
1
Po
nd
nd
nd
nd
nd
5
3.6
× 1
01
4.3
× 1
00
6.0
× 1
00
1.7
× 1
02
2
478
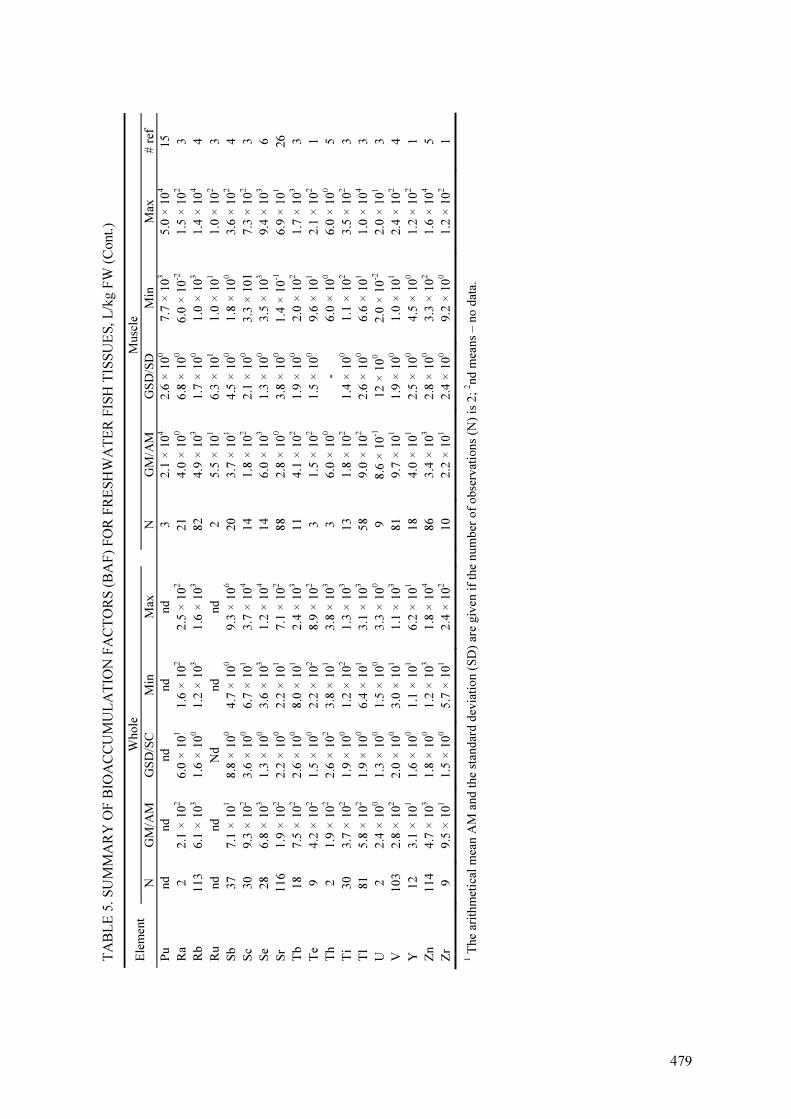
TA
BL
E 5
. S
UM
MA
RY
OF
BIO
AC
CU
MU
LA
TIO
N F
AC
TO
RS
(B
AF
) F
OR
FR
ES
HW
AT
ER
FIS
H T
ISS
UE
S, L
/kg F
W (
Cont.
)
Who
le
M
usc
le
Ele
ment
N
GM
/AM
G
SD
/SC
M
in
Max
N
GM
/AM
G
SD
/SD
M
in
Max
# r
ef
Pu
nd
nd
nd
nd
nd
3
2.1
× 1
04
2.6
× 1
00
7.7
× 1
03
5.0
× 1
04
15
Ra
2
2.1
× 1
02
6.0
× 1
01
1.6
× 1
02
2.5
× 1
02
2
1
4.0
× 1
00
6.8
× 1
00
6.0
× 1
0-2
1.5
× 1
02
3
Rb
1
13
6
.1 ×
103
1.6
× 1
00
1.2
× 1
03
1.6
× 1
03
8
2
4.9
× 1
03
1.7
× 1
00
1.0
× 1
03
1.4
× 1
04
4
Ru
nd
nd
N
d
nd
nd
2
5.5
× 1
01
6.3
× 1
01
1.0
× 1
01
1.0
× 1
02
3
Sb
3
7
7.1
× 1
01
8.8
× 1
00
4.7
× 1
00
9.3
× 1
06
2
0
3.7
× 1
01
4.5
× 1
00
1.8
× 1
00
3.6
× 1
02
4
Sc
30
9
.3 ×
102
3.6
× 1
00
6.7
× 1
01
3.7
× 1
04
1
4
1.8
× 1
02
2.1
× 1
00
3.3
× 1
01
7.3
× 1
02
3
Se
28
6
.8 ×
103
1.3
× 1
00
3.6
× 1
03
1.2
× 1
04
1
4
6.0
× 1
03
1.3
× 1
00
3.5
× 1
03
9.4
× 1
03
6
Sr
11
6
1.9
× 1
02
2.2
× 1
00
2.2
× 1
01
7.1
× 1
02
8
8
2.8
× 1
00
3.8
× 1
00
1.4
× 1
0-1
6.9
× 1
01
26
Tb
1
8
7.5
× 1
02
2.6
× 1
00
8.0
× 1
01
2.4
× 1
03
1
1
4.1
× 1
02
1.9
× 1
00
2.0
× 1
02
1.7
× 1
03
3
Te
9
4.2
× 1
02
1.5
× 1
00
2.2
× 1
02
8.9
× 1
02
3
1
.5 ×
102
1.5
× 1
00
9.6
× 1
01
2.1
× 1
02
1
Th
2
1.9
× 1
02
2.6
× 1
02
3.8
× 1
01
3.8
× 1
03
3
6
.0 ×
100
- 6
.0 ×
100
6.0
× 1
00
5
Ti
30
3
.7 ×
102
1.9
× 1
00
1.2
× 1
02
1.3
× 1
03
1
3
1.8
× 1
02
1.4
× 1
00
1.1
× 1
02
3.5
× 1
02
3
Tl
81
5
.8 ×
102
1.9
× 1
00
6.4
× 1
01
3.1
× 1
03
5
8
9.0
× 1
02
2.6
× 1
00
6.6
× 1
01
1.0
× 1
04
3
U
2
2.4
× 1
00
1.3
× 1
00
1.5
× 1
00
3.3
× 1
00
9
8
.6 ×
10-1
12
× 1
00
2.0
× 1
0-2
2.0
× 1
01
3
V
10
3
2.8
× 1
02
2.0
× 1
00
3.0
× 1
01
1.1
× 1
03
8
1
9.7
× 1
01
1.9
× 1
00
1.0
× 1
01
2.4
× 1
02
4
Y
12
3
.1 ×
101
1.6
× 1
00
1.1
× 1
01
6.2
× 1
01
1
8
4.0
× 1
01
2.5
× 1
00
4.5
× 1
00
1.2
× 1
02
1
Zn
11
4
4.7
× 1
03
1.8
× 1
00
1.2
× 1
03
1.8
× 1
04
8
6
3.4
× 1
03
2.8
× 1
00
3.3
× 1
02
1.6
× 1
04
5
Zr
9
9.5
× 1
01
1.5
× 1
00
5.7
× 1
01
2.4
× 1
02
1
0
2.2
× 1
01
2.4
× 1
00
9.2
× 1
00
1.2
× 1
02
1
1 T
he
arit
hm
etic
al m
ean A
M a
nd
the
standar
d d
evia
tio
n (
SD
) ar
e giv
en i
f th
e n
um
ber
of
obse
rvat
ion
s (N
) is
2; 2nd
mea
ns
– n
o d
ata.
479

480
TABLE 6. SUMMARY OF BIOACCUMULATION FACTORS (BAF) FOR EDIBLE HERPETOFAUNA [30], L/kg FW
Element Biota Type (tissue) N GM/AM GSD/SD Min Max
Al Tadpole (whole) 3 1.0 × 10⁴ 1.3 × 100 7.5 × 10³ 1.3 × 10⁴
Al Frog (muscle) 2 1.3 × 10² 7.0 × 100 1.2 × 10² 1.3 × 10²
Al Frog (carcass) 2 1.3 × 10² 2.8 × 101 1.1 × 10² 1.5 × 10²
As Tadpole (whole) 3 1.4 × 10² 1.3 × 100 1.1 × 10² 1.8 × 10²
As Frog (muscle) 2 5.2 × 101 4.0 × 101 2.4 × 101 8.0 × 101
As Frog (carcass) 2 1.2 × 10² 6.0 × 101 7.4 × 101 1.6 × 10²
Ca Tadpole (whole) 3 4.5 × 101 1.6 × 100 2.6 × 101 6.3 × 101
Ca Frog (muscle) 2 3.5 × 100 7.0 × 10⁻² 3.4 × 100 3.5 × 100
Ca Frog (carcass) 2 2.9 × 10² 7.0 × 10⁻² 2.8 × 10² 2.9 × 10²
Ca Reptile (carcass) 9 1.6 × 10² 1.1 × 101 5.2 × 101 3.4 × 10²
Cd Tadpole (whole) 3 2.1 × 10² 1.4 × 100 1.4 × 10² 2.8 × 10²
Cd Frog (muscle) 2 1.2 × 10² 7.0 × 100 1.1 × 10² 1.2 × 10²
Cd Frog (carcass) 2 2.4 × 10² 2.1 × 101 2.2 × 10² 2.5 × 10²
Co Tadpole (whole) 3 8.3 × 10³ 1.1 × 100 7.3 × 10³ 9.5 × 10³
Co Frog (muscle) 2 5.5 × 10² 5.0 × 10² 1.9 × 10² 9.0 × 10²
Co Frog (carcass) 2 2.4 × 10³ 8.5 × 10² 1.8 × 10³ 3.0 × 10³
Co Reptile (carcass) 9 2.6 × 10³ 1.8 × 100 1.6 × 10³ 4.2 × 10³
Cr Tadpole (whole) 3 2.9 × 10² 1.5 × 100 2.1 × 10² 4.4 × 10²
Cr Frog (muscle) 2 8.2 × 101 7.0 × 10⁻¹ 8.2 × 101 8.3 × 101
Cr Frog (carcass) 2 2.6 × 10³ 3.3 × 10³ 1.9 × 10² 4.9 × 10³
Cs Tadpole (whole) 3 3.0 × 10³ 1.3 × 100 2.5 × 10³ 4.0 × 10³
Cs Frog (muscle) 2 2.6 × 10² 1.2 × 100 1.7 × 10² 3.4 × 10²
Cs Frog (carcass) 2 2.1 × 10² 6.4 × 101 1.6 × 10² 2.5 × 10²
Cs Reptile (carcass) 9 2.8 × 10² 1.3 × 100 1.3 × 10² 5.0 × 10²
Cu Tadpole (whole) 3 2.2 × 10² 1.3 × 100 1.7 × 10² 2.6 × 10²
Cu Frog (muscle) 2 1.1 × 10² 0 1.1 × 10² 1.1 × 10²
Cu Frog (carcass) 2 4.4 × 10² 2.3 × 100 2.8 × 10² 6.0 × 10²
1 The arithmetical mean AM and the standard deviation (SD) are given if the number of observations (N) is 2 nd means – no data.

481
TABLE 6. SUMMARY OF BIOACCUMULATION FACTORS (BAF) FOR EDIBLE HERPETOFAUNA [30], L/kg FW (Cont.)
Element Biota Type (tissue) N GM/AM GSD/SD Min Max
Fe Tadpole (whole) 3 2.4 × 10³ 1.2 × 100 1.9 × 10³ 2.8 × 10³
Fe Frog (muscle) 2 3.5 × 101 2.2 × 101 1.9 × 101 5.0 × 101
Fe Frog (carcass) 2 1.0 × 10³ 1.0 × 10³ 3.0 × 10² 1.7 × 10³
K Tadpole (whole) 3 4.7 × 10² 1.5 × 100 3.1 × 10² 7.0 × 10²
K Frog (muscle) 2 1.5 × 10³ 7.1 × 101 1.4 × 10³ 1.5 × 10³
K Frog (carcass) 2 1.6 × 10³ 7.1 × 101 1.5 × 10³ 1.6 × 10³
K Reptile (carcass) 9 1.4 × 10³ 7.0 × 100 8.8 × 10² 2.0 × 10³
Mg Tadpole (whole) 3 2.7 × 101 1.2 × 100 2.3 × 101 3.4 × 101
Mg Frog (muscle) 2 1.5 × 101 8.9 × 100 9.4 × 100 2.1 × 101
Mg Frog (carcass) 2 2.4 × 101 7.0 × 10⁻¹ 2.3 × 101 2.4 × 101
Mg Reptile (carcass) 9 3.4 × 101 5.8 × 100 1.5 × 101 7.2 × 101
Mn Tadpole (whole) 3 5.6 × 10² 2.8 × 100 1.7 × 10² 1.1 × 10³
Mn Frog (muscle) 2 2.0 × 100 1.5 × 100 9.3 × 10⁻¹ 3.1 × 100
Mn Frog (carcass) 2 3.0 × 10² 5.0 × 101 2.6 × 10² 3.3 × 10²
Na Tadpole (whole) 3 1.1 × 10² 2.5 × 100 4.0 × 101 2.5 × 10²
Na Frog (muscle) 2 1.4 × 10² 6.0 × 101 9.8 × 101 1.8 × 10²
Na Frog (carcass) 2 7.7 × 101 2.0 × 100 7.5 × 101 7.8 × 101
Na Reptile (carcass) 9 7.3 × 101 1.1 × 100 5.6 × 101 1.3 × 10²
Ni Tadpole (whole) 3 3.8 × 10² 1.9 × 100 1.9 × 10² 7.2 × 10²
Ni Frog (muscle) 2 2.4 × 101 0.4 × 100 2.1 × 101 2.7 × 101
Ni Frog (carcass) 2 2.0 × 10⁴ 2.8 × 10⁴ 6.6 × 10² 1.0 × 10⁴
Pb Tadpole (whole) 3 6.4 × 101 1.2 × 100 5.3 × 101 7.6 × 101
Pb Frog (muscle) 2 5.5 × 100 4.8 × 100 2.1 × 100 8.9 × 100
Pb Frog (carcass) 2 1.7 × 101 6.0 × 100 1.2 × 101 2.1 × 101
Zn Tadpole (whole) 3 5.7 × 10² 2.7 × 100 2.7 × 10² 1.8 × 10³
Zn Frog (muscle) 2 9.0 × 10² 9.0 × 10² 2.0 × 10² 1.5 × 10³
Zn Frog (carcass) 2 1.0 × 10⁴ 1.1 × 10³ 9.5 × 10³ 1.1 × 10⁴
1 The arithmetical mean AM and the standard deviation (SD) are given if the number of observations (N) is
2nd means – no data.
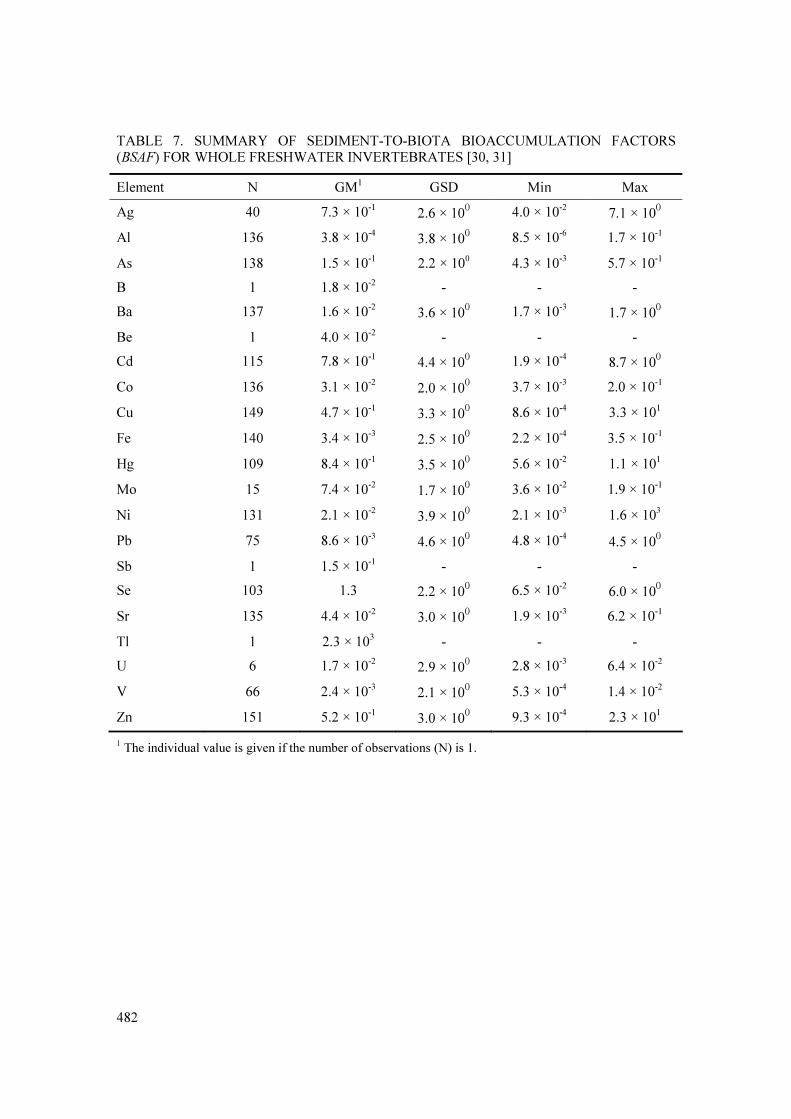
482
TABLE 7. SUMMARY OF SEDIMENT-TO-BIOTA BIOACCUMULATION FACTORS (BSAF) FOR WHOLE FRESHWATER INVERTEBRATES [30, 31]
Element N GM1 GSD Min Max
Ag 40 7.3 × 10⁻¹ 2.6 × 100 4.0 × 10
-2 7.1 × 100
Al 136 3.8 × 10⁻⁴ 3.8 × 100 8.5 × 10⁻⁶ 1.7 × 10⁻¹
As 138 1.5 × 10⁻¹ 2.2 × 100 4.3 × 10⁻³ 5.7 × 10⁻¹
B 1 1.8 × 10⁻² - - -
Ba 137 1.6 × 10⁻² 3.6 × 100 1.7 × 10
-3 1.7 × 100
Be 1 4.0 × 10⁻² - - -
Cd 115 7.8 × 10⁻¹ 4.4 × 100 1.9 × 10
-4 8.7 × 100
Co 136 3.1 × 10⁻² 2.0 × 10
0 3.7 × 10
-3 2.0 × 10⁻¹
Cu 149 4.7 × 10⁻¹ 3.3 × 100 8.6 × 10⁻⁴ 3.3 × 101
Fe 140 3.4 × 10⁻³ 2.5 × 100 2.2 × 10
-4 3.5 × 10⁻¹
Hg 109 8.4 × 10⁻¹ 3.5 × 100 5.6 × 10⁻² 1.1 × 101
Mo 15 7.4 × 10⁻² 1.7 × 10
0 3.6 × 10
-2 1.9 × 10⁻¹
Ni 131 2.1 × 10⁻² 3.9 × 100 2.1 × 10
-3 1.6 × 10³
Pb 75 8.6 × 10⁻³ 4.6 × 100 4.8 × 10⁻⁴ 4.5 × 10
0
Sb 1 1.5 × 10⁻¹ - - -
Se 103 1.3 2.2 × 100 6.5 × 10
-2 6.0 × 100
Sr 135 4.4 × 10⁻² 3.0 × 10
0 1.9 × 10⁻³ 6.2 × 10⁻¹
Tl 1 2.3 × 10³ - - -
U 6 1.7 × 10⁻² 2.9 × 100 2.8 × 10
-3 6.4 × 10⁻²
V 66 2.4 × 10⁻³ 2.1 × 100 5.3 × 10⁻⁴ 1.4 × 10⁻²
Zn 151 5.2 × 10⁻¹ 3.0 × 10
0 9.3 × 10
-4 2.3 × 101
1 The individual value is given if the number of observations (N) is 1.
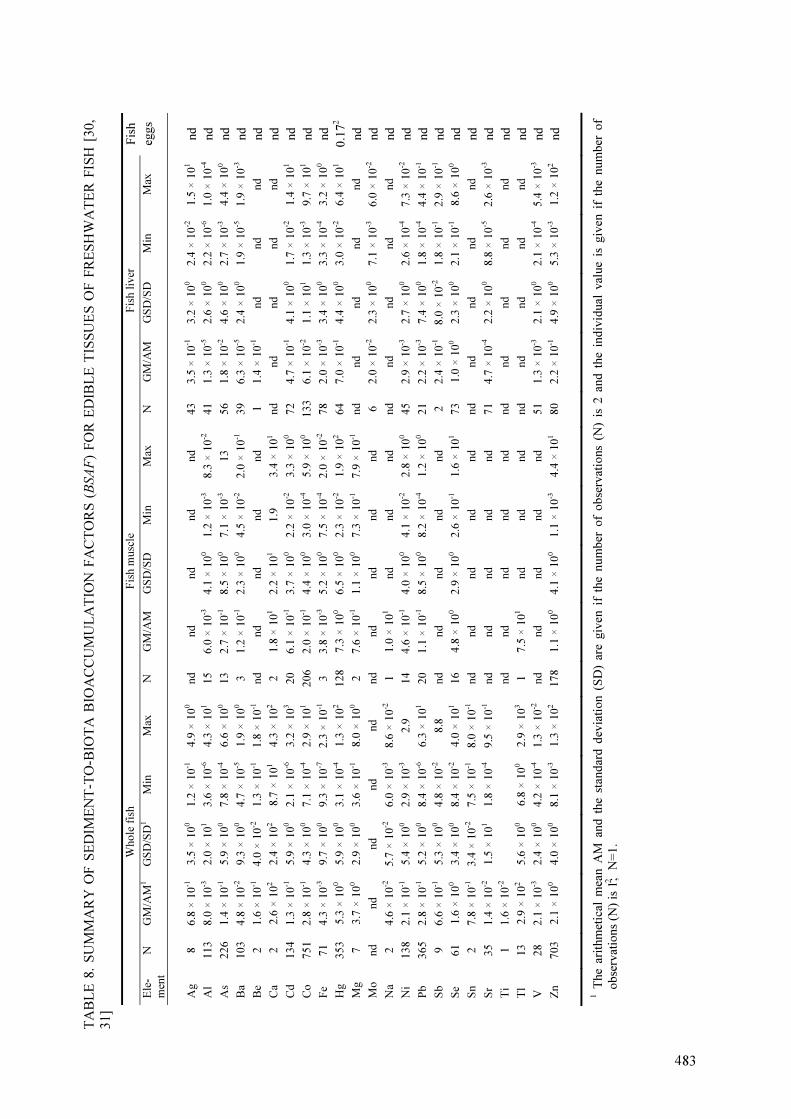
TA
BL
E 8
. S
UM
MA
RY
OF
SE
DIM
EN
T-T
O-B
IOT
A B
IOA
CC
UM
UL
AT
ION
FA
CT
OR
S (BSAF
) F
OR
ED
IBL
E T
ISS
UE
S O
F F
RE
SH
WA
TE
R F
ISH
[30,
31]
W
hole
fis
h
Fis
h m
usc
le
Fis
h l
iver
F
ish
Ele
-
men
t
N
GM
/AM
1
GS
D/S
D1
Min
M
ax
N
GM
/AM
G
SD
/SD
M
in
Max
N
G
M/A
M
GS
D/S
D
Min
M
ax
egg
s
Ag
8
6.8
× 1
0-1
3.5
× 1
00
1.2
× 1
0-1
4.9
× 1
00
nd
n
d
nd
n
d
nd
4
3
3.5
× 1
0-1
3.2
× 1
00
2.4
× 1
0-2
1.5
× 1
01
nd
Al
11
3
8.0
× 1
0-3
2.0
× 1
01
3.6
× 1
0-6
4.3
× 1
01
15
6
.0 ×
10-3
4
.1 ×
100
1.2
× 1
0-3
8
.3 ×
10-2
4
1
1.3
× 1
0-5
2.6
× 1
00
2.2
× 1
0-6
1.0
× 1
0-4
nd
As
22
6
1.4
× 1
0-1
5.9
× 1
00
7.8
× 1
0-4
6.6
× 1
00
13
2
.7 ×
10-1
8
.5 ×
100
7.1
× 1
0-3
1
3
56
1
.8 ×
10-2
4.6
× 1
00
2.7
× 1
0-3
4.4
× 1
00
nd
Ba
10
3
4.8
× 1
0-2
9.3
× 1
00
4.7
× 1
0-5
1.9
× 1
00
3
1.2
× 1
0-1
2
.3 ×
100
4.5
× 1
0-2
2
.0 ×
10-1
3
9
6.3
× 1
0-5
2.4
× 1
00
1.9
× 1
0-5
1.9
× 1
0-3
nd
Be
2
1.6
× 1
0-1
4.0
× 1
0-2
1.3
× 1
0-1
1.8
× 1
0-1
n
d
nd
nd
n
d
nd
1
1
.4 ×
10-1
nd
n
d
nd
nd
Ca
2
2.6
× 1
02
2.4
× 1
02
8.7
× 1
01
4.3
× 1
02
2
1.8
× 1
01
2.2
× 1
01
1.9
3
.4 ×
101
nd
n
d
nd
n
d
nd
nd
Cd
1
34
1
.3 ×
10-1
5.9
× 1
00
2.1
× 1
0-6
3.2
× 1
03
20
6
.1 ×
10-1
3
.7 ×
100
2.2
× 1
0-2
3
.3 ×
100
72
4
.7 ×
10-1
4.1
× 1
00
1.7
× 1
0-2
1.4
× 1
01
nd
Co
75
1
2.8
× 1
0-1
4.3
× 1
00
7.1
× 1
0-4
2.9
× 1
01
20
6
2.0
× 1
0-1
4
.4 ×
100
3.0
× 1
0-4
5
.9 ×
100
13
3
6.1
× 1
0-2
1.1
× 1
01
1.3
× 1
0-3
9.7
× 1
01
nd
Fe
71
4
.3 ×
10-3
9.7
× 1
00
9.3
× 1
0-7
2.3
× 1
0-1
3
3
.8 ×
10-3
5
.2 ×
100
7.5
× 1
0-4
2
.0 ×
10-2
7
8
2.0
× 1
0-3
3.4
× 1
00
3.3
× 1
0-4
3.2
× 1
00
nd
Hg
35
3
5.3
× 1
00
5.9
× 1
00
3.1
× 1
0-4
1.3
× 1
02
12
8
7.3
× 1
00
6.5
× 1
00
2.3
× 1
0-2
1
.9 ×
102
64
7
.0 ×
10-1
4.4
× 1
00
3.0
× 1
0-2
6.4
× 1
01
0.1
72
Mg
7
3.7
× 1
00
2.9
× 1
00
3.6
× 1
0-1
8.0
× 1
00
2
7.6
× 1
0-1
1
.1 ×
100
7.3
× 1
0-1
7
.9 ×
10-1
n
d
nd
n
d
nd
n
d
nd
Mo
nd
n
d
nd
n
d
nd
n
d
nd
nd
n
d
nd
6
2
.0 ×
10-2
2.3
× 1
00
7.1
× 1
0-3
6.0
× 1
0-2
nd
Na
2
4.6
× 1
0-2
5.7
× 1
0-2
6.0
× 1
0-3
8.6
× 1
0-2
1
1
.0 ×
101
nd
n
d
nd
n
d
nd
n
d
nd
n
d
nd
Ni
13
8
2.1
× 1
0-1
5.4
× 1
00
2.9
× 1
0-3
2.9
1
4
4.6
× 1
0-1
4
.0 ×
100
4.1
× 1
0-2
2
.8 ×
100
45
2
.9 ×
10-3
2.7
× 1
00
2.6
× 1
0-4
7.3
× 1
0-2
nd
Pb
3
65
2
.8 ×
10-1
5.2
× 1
00
8.4
× 1
0-6
6.3
× 1
01
20
1
.1 ×
10-1
8
.5 ×
100
8.2
× 1
0-4
1
.2 ×
100
21
2
.2 ×
10-3
7.4
× 1
00
1.8
× 1
0-4
4.4
× 1
0-1
nd
Sb
9
6
.6 ×
10-1
5.3
× 1
00
4.8
× 1
0-2
8.8
n
d
nd
nd
n
d
nd
2
2
.4 ×
10-1
8.0
× 1
0-2
1.8
× 1
0-1
2.9
× 1
0-1
nd
Se
61
1
.6 ×
100
3.4
× 1
00
8.4
× 1
0-2
4.0
× 1
01
16
4
.8 ×
100
2.9
× 1
00
2.6
× 1
0-1
1
.6 ×
101
73
1
.0 ×
100
2.3
× 1
00
2.1
× 1
0-1
8.6
× 1
00
nd
Sn
2
7
.8 ×
10-1
3.4
× 1
0-2
7.5
× 1
0-1
8.0
× 1
0-1
n
d
nd
nd
n
d
nd
n
d
nd
n
d
nd
n
d
nd
Sr
35
1
.4 ×
10-2
1.5
× 1
01
1.8
× 1
0-4
9.5
× 1
0-1
n
d
nd
nd
n
d
nd
7
1
4.7
× 1
0-4
2.2
× 1
00
8.8
× 1
0-5
2.6
× 1
0-3
nd
Ti
1
1.6
× 1
0-2
n
d
nd
nd
n
d
nd
n
d
nd
n
d
nd
n
d
nd
Tl
13
2
.9 ×
102
5.6
× 1
00
6.8
× 1
00
2.9
× 1
03
1
7.5
× 1
01
nd
n
d
nd
n
d
nd
n
d
nd
n
d
nd
V
28
2
.1 ×
10-3
2.4
× 1
00
4.2
× 1
0-4
1.3
× 1
0-2
n
d
nd
nd
n
d
nd
5
1
1.3
× 1
0-3
2.1
× 1
00
2.1
× 1
0-4
5.4
× 1
0-3
nd
Zn
7
03
2
.1 ×
100
4.0
× 1
00
8.1
× 1
0-3
1.3
× 1
02
17
8
1.1
× 1
00
4.1
× 1
00
1.1
× 1
0-3
4
.4 ×
101
80
2
.2 ×
10-1
4.9
× 1
00
5.3
× 1
0-3
1.2
× 1
02
nd
1 T
he
ari
thm
etic
al m
ean A
M a
nd
the
stand
ard
dev
iati
on (
SD
) ar
e giv
en i
f th
e n
um
ber
of
ob
serv
atio
ns
(N)
is 2
and
the
ind
ivid
ual
val
ue
is g
iven i
f th
e nu
mb
er o
f
ob
serv
atio
ns
(N)
is 1
; 2N
=1
.
483

484
TABLE 9. SUMMARY OF BIOACCUMULATION FACTORS (BAF) FOR VARIOUS TYPES OF
EDIBLE FRESHWATER ALGAE AND PLANTS1
Element Group of Plants N GM/AM2 GSD/SD2 Min Max # ref
Am Algae 7 9.4 × 10³ 3.0 × 100 1.5 × 10³ 3.8 × 10⁴ 5
Macrophytes (generic)1 1 6.5 × 10³ 1
Floating-leafed Macrophytes 1 1.5 × 10⁴ 1
Emergent Macrophytes 7 1.1 × 10³ 8.9 × 100 7.5 × 101 2.0 × 10⁴ 5
C Algae 3 4.5 × 10⁴ 1.4 × 100 3.1 × 10⁴ 5.6 × 10⁴ 1
Floating-leafed Macrophytes 1 5.4 × 10³ 1
Emergent Macrophytes 6 1.1 × 10⁴ 1.7 × 101 4.4 × 101 8.9 × 10⁴ 2
Cd Algae 4 1.8 × 10⁴ 1.4 × 100 1.1 × 10⁴ 2.3 × 10⁴ 2
Floating-leafed Macrophytes 1 2.3 × 10⁴ nd nd nd 1
Cm Algae 1 8.0 × 10³ nd nd nd 1
Co Algae 8 1.5 × 10³ 2.6 × 100 6.5 × 10
2 9.0 × 10³ 6
Macrophytes (generic) 3 1.1 × 10³ 1.2 × 101 2.6 × 10² 2.0 × 10⁴ 3
Floating-leafed Macrophytes 4 3.5 × 10² 2.1 × 100 2.3 × 10² 1.0 × 10³ 2
Emergent Macrophytes 3 1.6 × 10² 3.8 × 100 5.0 × 101 6.8 × 10² 3
Cs Algae 5 9.6 × 10² 2.4 × 100 4.3 × 10² 3.3 × 10³ 5
Macrophytes (generic) 3 3.9 × 10² 4.0 × 100 1.7 × 10² 2.0 × 10³ 3
Floating-leafed Macrophytes 2 3.6 × 10² 3.0 × 10² 1.5 × 10² 5.7 × 10² 2
Emergent Macrophytes 16 2.7 × 101 8.8 × 100 1.8 × 100 1.4 × 10³ 4
Cu Algae 4 3.0 × 10³ 1.2 × 100 2.4 × 10³ 3.1 × 10³ 4
Floating-leafed Macrophytes 1 2.7 × 10³ 1
Fe Algae 4 8.4 × 10³ 1.6 × 100 5.2 × 10³ 9.2 × 10³ 4
Floating-leafed Macrophytes 1 1.2 × 10⁴ 1
I a Macrophytes (generic) 3 1.3 × 10² 2.0 × 100 7.8 × 101 2.7 × 10² 2
Mn Algae 4 9.2 × 10⁴ 1.5 × 100 6.1 × 10⁴ 9.8 × 10⁴ 4
Macrophytes (generic) 1 3.1 × 10⁻¹ 1
Floating-leafed Macrophytes 1 1.1 × 10⁵ 1
1Although four groups of aquatic plants are considered: algae, macrophytes (generic), floating-leafed macrophytes, emergent
macrophytes, only those species are mentioned for individual radionuclides, which information was available for. Generic’
macrophyte data are typically based on a compilation of very few data on accumulation factors for which little information is
available. These values should not be used preferably for critical parameters. 2The arithmetical mean AM and the standard deviation (SD) are given if the number of observations (N) is 2 and the individual value is given if the number of observations (N) is 1
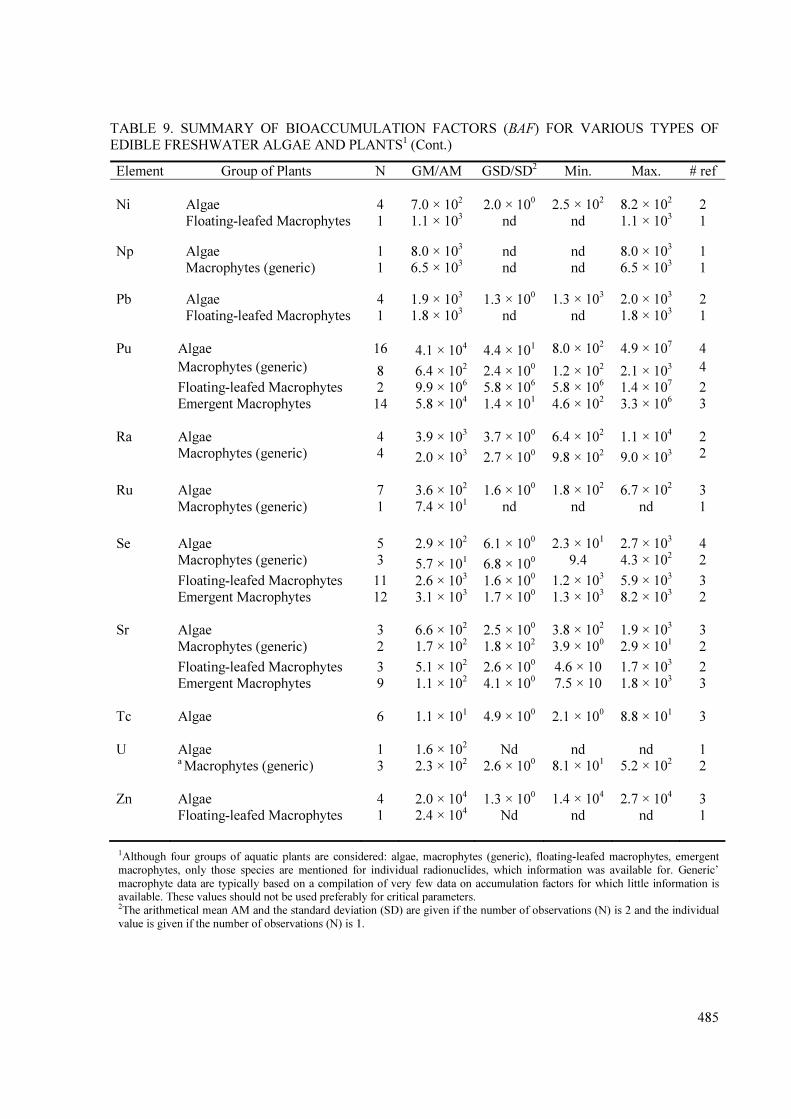
485
TABLE 9. SUMMARY OF BIOACCUMULATION FACTORS (BAF) FOR VARIOUS TYPES OF
EDIBLE FRESHWATER ALGAE AND PLANTS1 (Cont.)
Element Group of Plants N GM/AM GSD/SD2 Min. Max. # ref
Ni Algae 4 7.0 × 10² 2.0 × 100 2.5 × 10² 8.2 × 10² 2
Floating-leafed Macrophytes 1 1.1 × 10³ nd nd 1.1 × 10³ 1
Np Algae 1 8.0 × 10³ nd nd 8.0 × 10³ 1
Macrophytes (generic) 1 6.5 × 10³ nd nd 6.5 × 10³ 1
Pb Algae 4 1.9 × 10³ 1.3 × 100 1.3 × 10³ 2.0 × 10³ 2
Floating-leafed Macrophytes 1 1.8 × 10³ nd nd 1.8 × 10³ 1
Pu Algae 16 4.1 × 10⁴ 4.4 × 101 8.0 × 10² 4.9 × 10⁷ 4
Macrophytes (generic) 8 6.4 × 10² 2.4 × 100 1.2 × 10² 2.1 × 10³ 4
Floating-leafed Macrophytes 2 9.9 × 10⁶ 5.8 × 10⁶ 5.8 × 10⁶ 1.4 × 10⁷ 2
Emergent Macrophytes 14 5.8 × 10⁴ 1.4 × 101 4.6 × 10² 3.3 × 10⁶ 3
Ra Algae 4 3.9 × 10³ 3.7 × 100 6.4 × 10² 1.1 × 10⁴ 2
Macrophytes (generic) 4 2.0 × 10³ 2.7 × 100 9.8 × 10² 9.0 × 10³ 2
Ru Algae 7 3.6 × 10² 1.6 × 100 1.8 × 10² 6.7 × 10² 3
Macrophytes (generic) 1 7.4 × 101 nd nd nd 1
Se Algae 5 2.9 × 10² 6.1 × 100 2.3 × 101 2.7 × 10³ 4
Macrophytes (generic) 3 5.7 × 101 6.8 × 100 9.4 4.3 × 10² 2
Floating-leafed Macrophytes 11 2.6 × 10³ 1.6 × 100 1.2 × 10
3 5.9 × 10³ 3
Emergent Macrophytes 12 3.1 × 10³ 1.7 × 100 1.3 × 10³ 8.2 × 10³ 2
Sr Algae 3 6.6 × 10² 2.5 × 100 3.8 × 10² 1.9 × 10³ 3
Macrophytes (generic) 2 1.7 × 10² 1.8 × 10² 3.9 × 100 2.9 × 101 2
Floating-leafed Macrophytes 3 5.1 × 10² 2.6 × 100 4.6 × 10 1.7 × 10³ 2
Emergent Macrophytes 9 1.1 × 10² 4.1 × 100 7.5 × 10 1.8 × 10³ 3
Tc Algae 6 1.1 × 101 4.9 × 100 2.1 × 100 8.8 × 101 3
U Algae 1 1.6 × 10² Nd nd nd 1
a Macrophytes (generic) 3 2.3 × 10² 2.6 × 100 8.1 × 101 5.2 × 10² 2
Zn Algae 4 2.0 × 10⁴ 1.3 × 100 1.4 × 10⁴ 2.7 × 10⁴ 3
Floating-leafed Macrophytes 1 2.4 × 10⁴ Nd nd nd 1
1Although four groups of aquatic plants are considered: algae, macrophytes (generic), floating-leafed macrophytes, emergent
macrophytes, only those species are mentioned for individual radionuclides, which information was available for. Generic’
macrophyte data are typically based on a compilation of very few data on accumulation factors for which little information is available. These values should not be used preferably for critical parameters. 2The arithmetical mean AM and the standard deviation (SD) are given if the number of observations (N) is 2 and the individual
value is given if the number of observations (N) is 1.
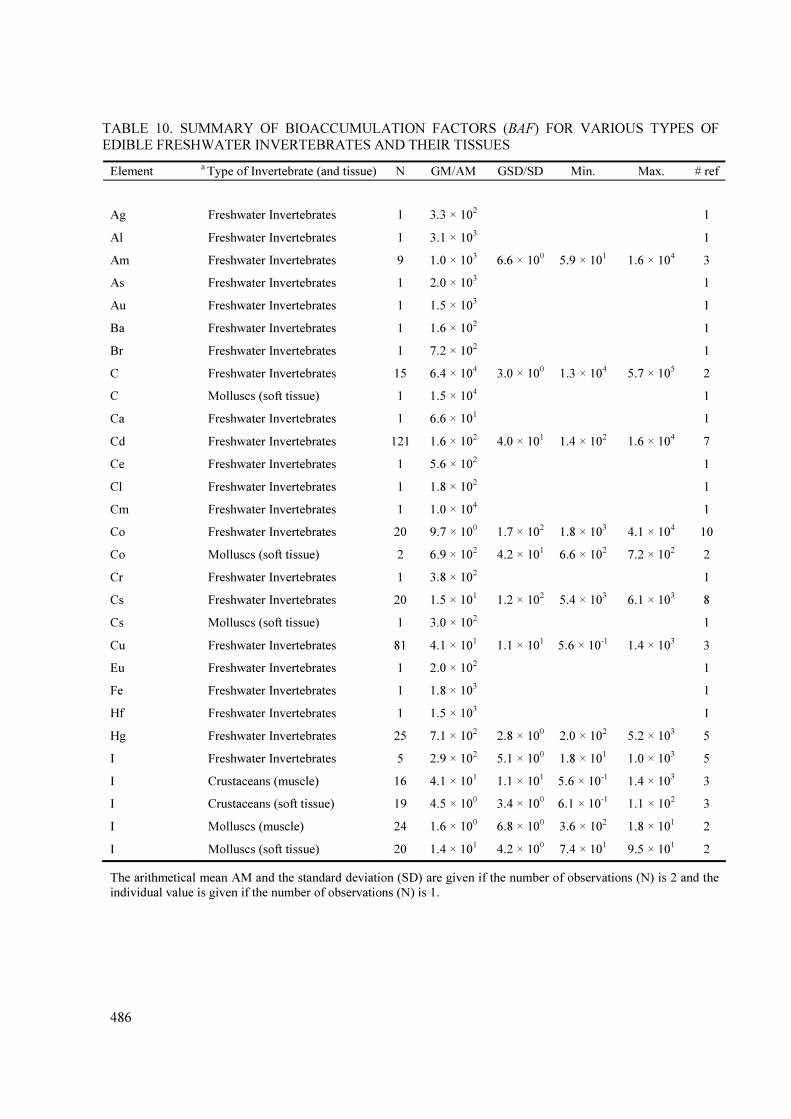
486
TABLE 10. SUMMARY OF BIOACCUMULATION FACTORS (BAF) FOR VARIOUS TYPES OF
EDIBLE FRESHWATER INVERTEBRATES AND THEIR TISSUES
Element a Type of Invertebrate (and tissue) N GM/AM GSD/SD Min. Max. # ref
Ag Freshwater Invertebrates 1 3.3 × 10² 1
Al Freshwater Invertebrates 1 3.1 × 10³ 1
Am Freshwater Invertebrates 9 1.0 × 10³ 6.6 × 10
0 5.9 × 10
1 1.6 × 10
4 3
As Freshwater Invertebrates 1 2.0 × 10³ 1
Au Freshwater Invertebrates 1 1.5 × 10³ 1
Ba Freshwater Invertebrates 1 1.6 × 10² 1
Br Freshwater Invertebrates 1 7.2 × 10² 1
C Freshwater Invertebrates 15 6.4 × 10⁴ 3.0 × 10
0 1.3 × 10
4 5.7 × 10
5 2
C Molluscs (soft tissue) 1 1.5 × 10⁴ 1
Ca Freshwater Invertebrates 1 6.6 × 101 1
Cd Freshwater Invertebrates 121 1.6 × 10² 4.0 × 10
1 1.4 × 10
2 1.6 × 10
4 7
Ce Freshwater Invertebrates 1 5.6 × 10² 1
Cl Freshwater Invertebrates 1 1.8 × 10² 1
Cm Freshwater Invertebrates 1 1.0 × 10⁴ 1
Co Freshwater Invertebrates 20 9.7 × 100 1.7 × 10
2 1.8 × 10
3 4.1 × 10
4 10
Co Molluscs (soft tissue) 2 6.9 × 10² 4.2 × 10
1 6.6 × 10
2 7.2 × 10
2 2
Cr Freshwater Invertebrates 1 3.8 × 10² 1
Cs Freshwater Invertebrates 20 1.5 × 101 1.2 × 10
2 5.4 × 10
3 6.1 × 10
3 8
Cs Molluscs (soft tissue) 1 3.0 × 10² 1
Cu Freshwater Invertebrates 81 4.1 × 101 1.1 × 10
1 5.6 × 10
-1 1.4 × 10
3 3
Eu Freshwater Invertebrates 1 2.0 × 10² 1
Fe Freshwater Invertebrates 1 1.8 × 10³ 1
Hf Freshwater Invertebrates 1 1.5 × 10³ 1
Hg Freshwater Invertebrates 25 7.1 × 10² 2.8 × 10
0 2.0 × 10
2 5.2 × 10
3 5
I Freshwater Invertebrates 5 2.9 × 10² 5.1 × 10
0 1.8 × 10
1 1.0 × 10
3 5
I Crustaceans (muscle) 16 4.1 × 101 1.1 × 10
1 5.6 × 10
-1 1.4 × 10
3 3
I Crustaceans (soft tissue) 19 4.5 × 100 3.4 × 10
0 6.1 × 10
-1 1.1 × 10
2 3
I Molluscs (muscle) 24 1.6 × 100 6.8 × 100 3.6 × 10² 1.8 × 101 2
I Molluscs (soft tissue) 20 1.4 × 101 4.2 × 10
0 7.4 × 10
1 9.5 × 10
1 2
The arithmetical mean AM and the standard deviation (SD) are given if the number of observations (N) is 2 and the
individual value is given if the number of observations (N) is 1.

487
TABLE 10. SUMMARY OF BIOACCUMULATION FACTORS (BAF) FOR VARIOUS TYPES OF
EDIBLE FRESHWATER INVERTEBRATES AND THEIR TISSUES (Cont.)
Element Type of Invertebrate
1
(and tissue) N GM GSD Min. Max. # ref
K Freshwater Invertebrates 1 5.4 × 10² 1
La Freshwater Invertebrates 1 3.7 × 10² 1
Lu Freshwater Invertebrates 1 1.1 × 10³ 1
Mg Freshwater Invertebrates 1 4.4 × 101 1
Mn Freshwater Invertebrates 1 3.7 × 10³ 1
Mo Freshwater Invertebrates 1 2.0 × 10³ 1
Mo Crustaceans (muscle) 8 1.3 × 101 6.5 × 10
0 2.9 × 10
2 1.0 × 10
1 2
Mo Crustaceans (soft tissue) 8 4.2 × 101 3.5 × 10
0 5.0 × 10
2 2.5 × 10
0 2
Mo Molluscs (muscle) 8 1.8 × 101 2.3 × 10
0 3.6 × 10
-2 4.9 × 10
-1 2
Mo Molluscs (soft tissue) 7 5.0 × 101 3.3 × 10
0 4.5 × 10
-2 1.60 2
Na Freshwater Invertebrates 1 1.1 × 10² 1
Np Freshwater Invertebrates 1 1.0 × 10⁴ 1
Pb Freshwater Invertebrates 74 1.9 × 101 2.1 × 10
1 4.5 × 10
-2 7.0 × 10
2 4
Pu Freshwater Invertebrates 53 5.3 × 10³ 3.8 × 10
1 3.6 × 10
1 5.5 × 10
6 11
Ra Freshwater Invertebrates 5 1.0 × 10² 3.0 × 10
1 1.8 1.8 × 10
3 2
Rb Freshwater Invertebrates 1 2.2 × 10³ 1
Ru Freshwater Invertebrates 8 3.9 × 10² 2.6 × 10
1 1.8 × 10
-3 8.3 × 10
1 3
Sb Freshwater Invertebrates 1 7.4 × 101 1
Sc Freshwater Invertebrates 1 3.7 × 10³ 1
Se Freshwater Invertebrates 4 7.8 × 10² 1.0 × 10
1 6.3 × 10
1 5.8 × 10
3 2
Sm Freshwater Invertebrates 1 2.7 × 10³ 1
Sr Freshwater Invertebrates 4 3.3 × 10² 3.4 × 10
0 7.7 × 10
1 1.3 × 10
3 3
Tc Freshwater Invertebrates 3 3.0 × 101 8.6 × 10
0 5.4 × 10
0 3.3 × 10
2 2
Tc Molluscs (soft tissue) 2 1.9 × 100 1.4 × 10
-1 1.8 × 10
0 2.0 × 10
0 2
Th Freshwater Invertebrates 1 2.9 × 10³ 1
U Freshwater Invertebrates 8 1.7 × 10² 1.9 × 10
1 3.6 6.0 × 10
4 2
V Freshwater Invertebrates 1 3.3 × 10² 1
Zn Freshwater Invertebrates 81 8.9 × 101 2.9 × 10
1 6.3 × 10
-2 1.5 × 10
3 5
1A review of available data for whole freshwater invertebrates, crustacean muscle, crustacean soft tissue (including
organs), mollusc muscle and mollusc soft tissue was conducted, but only records for which information was
available is provided in the above table.
2The arithmetical mean AM and the standard deviation (SD) are given if the number of observations (N) is 2 and the
individual value is given if the number of observations (N) is 1.

TA
BL
E 1
1. S
UM
MA
RY
OF
BIO
AC
CU
MU
LA
TIO
N F
AC
TO
RS
(BAF
) F
OR
VA
RIO
US
TY
PE
S O
F E
DIB
LE
FR
ES
HW
AT
ER
FIS
H1
F
ish M
usc
le (
L/k
g F
W)
W
ho
le F
ish (
L/k
g F
W)
#
ref
Ele
ment
Fis
h T
yp
e N
G
M/A
M2
GS
D/S
D2
Min
. M
ax.
N
G
M/A
M
GS
D/S
D
Min
. M
ax.
(mu
scle
,
wh
ole
)
Ag
Ben
thic
Fis
h
16
9
.4 ×
10
1
1.4
× 1
00
5.3
× 1
01
1.7
× 1
020
1
1.8
× 1
02
2
, 1
F
ora
ge
Fis
h
11
1
.2 ×
10
2
1.6
× 1
00
4.0
× 1
01
2.1
× 1
02
37
1
.1 ×
10
2
1.3
× 1
00
5.7
× 1
01
1.7
× 1
02
2,
2
P
isciv
oro
us
Fis
h
4
1.2
× 1
02
1.2
× 1
00
9.3
× 1
01
1.5
× 1
02
nd
nd
nd
nd
nd
2
, -
Al
Ben
thic
Fis
h
20
3
.4 ×
10
1
4.8
× 1
00
5.9
× 1
00
1.9
× 1
02
4
1
.4 ×
10
2
1.2
× 1
01
1.7
× 1
01
5.2
× 1
03
3,
2
F
ora
ge
Fis
h
16
1
.5 ×
10
2
1.6
× 1
00
6.7
× 1
01
3.0
× 1
02
38
5
.1 ×
10
2
2.3
1
.5 ×
10
22
.6 ×
10
3
2,
3
P
isciv
oro
us
Fis
h
13
2
.8 ×
10
1
3.2
× 1
00
6.4
× 1
00
1.4
× 1
02
53
1
.6 ×
10
1
2.7
4.5
1
.9 ×
10
2
3,
3
Am
F
ora
ge
Fis
h
2
2.3
× 1
02
2.3
× 1
02
7.2
× 1
01
4.0
× 1
02
nd
nd
nd
nd
nd
2
, -
As
Ben
thic
Fis
h
4
4.5
× 1
02
1.4
× 1
00
3.1
× 1
02
6.2
× 1
02
1
9
.2 ×
10
2
nd
nd
nd
2
, 1
F
ora
ge
Fis
h
11
2
.8 ×
10
2
2.6
× 1
00
5.0
× 1
01
8.5
× 1
02
38
3
.7 ×
10
2
2.3
× 1
00
8.1
× 1
01
1.0
× 1
03
2,
3
P
isciv
oro
us
Fis
h
3
3.4
× 1
02
1.9
× 1
00
1.8
× 1
02
6.4
× 1
02
nd
nd
nd
nd
nd
1
, -
Au
Ben
thic
Fis
h
4
2.3
× 1
02
2.0
× 1
00
1.0
× 1
02
5.0
× 1
02
1
3
.5 ×
10
2
nd
nd
nd
2
, 1
F
ora
ge
Fis
h
11
3
.3 ×
10
2
1.9
× 1
00
1.0
× 1
02
9.0
× 1
02
30
2
.9 ×
10
2
2.4
× 1
00
5.0
× 1
01
1.0
× 1
03
2,
3
P
isciv
oro
us
Fis
h
4
1.2
× 1
02
2.0
× 1
00
5.0
× 1
01
2.5
× 1
02
nd
nd
nd
nd
nd
2
, -
Ba
Ben
thic
Fis
h
27
1
.5
2.8
× 1
00
2.5
× 1
0-1
3
.2 ×
10
1
4
1
.4 ×
10
1
2.5
× 1
00
5.0
× 1
00
4.1
× 1
01
3,
3
F
ora
ge
Fis
h
9
4.8
3
.8 ×
10
0
1.1
× 1
00
2.7
× 1
01
14
5
.7 ×
10
1
2.3
× 1
00
1.4
× 1
01
2.2
× 1
02
3,
3
P
isciv
oro
us
Fis
h
79
9
.7 ×
10
-1
3.0
× 1
00
5.3
× 1
0-2
1
.4 ×
10
1
78
4
.9 ×
10
1
1.5
× 1
00
1.3
× 1
01
1.5
× 1
02
4,
4
1A
lth
ou
gh
fou
r gro
up
s of
fish
are
con
sid
ered
: F
ish (
Gener
ic),
Ben
thic
Fis
h,
Fo
rage F
ish a
nd
Pis
civo
rous
Fis
h,
on
ly t
hose
sp
ecie
s ar
e m
enti
on
ed f
or
ind
ivid
ual
rad
ion
ucl
ides
, w
hic
h
info
rmat
ion
was
avai
lab
le f
or
2T
he
arit
hm
etic
al m
ean A
M a
nd
the
stan
dar
d d
evia
tio
n (
SD
) ar
e giv
en i
f th
e n
um
ber
of
ob
serv
ati
ons
(N)
is 2
and
the
ind
ivid
ual
val
ue
is g
iven i
f th
e n
um
ber
of
ob
serv
atio
ns
(N)
is 1
.
488

TA
BL
E 1
1.1
1. S
UM
MA
RY
OF
BIO
AC
CU
MU
LA
TIO
N F
AC
TO
RS
(BAF
) F
OR
VA
RIO
US
TY
PE
S O
F E
DIB
LE
FR
ES
HW
AT
ER
FIS
H (
Cont.
)
F
ish M
usc
le (
L/k
g F
W)
W
ho
le F
ish (
L/k
g F
W)
#
ref
E
lem
ent
Tis
sue
Typ
e N
G
M/A
M
GS
D/S
DM
in.
Max
.
N
GM
/AM
G
SD
/SD
M
in.
Max
.
(mu
scle
,
wh
ole
)
Br
Ben
thic
Fis
h
1
1.4
× 1
02
1
9.8
× 1
01
1
, 1
F
ora
ge
Fis
h
11
8
.1 ×
10
1
2.8
× 1
00
1.8
× 1
01
3.7
× 1
02
38
1
.6 ×
10
2
2.3
× 1
00
1.5
× 1
01
7.9
× 1
02
2,
3
P
isci
vo
rous
Fis
h
4
1.1
× 1
02
1.4
× 1
00
7.4
× 1
01
1.5
× 1
02
nd
nd
nd
nd
nd
2
, -
Ca
Ben
thic
Fis
h
26
7
.0 ×
10
0
1.5
× 1
00
2.6
× 1
00
1.6
× 1
01
4
1
.6 ×
10
2
1.8
× 1
00
9.3
× 1
01
3
.3 ×
10
2
3,
3
F
ora
ge
Fis
h
16
1
.3 ×
10
1
1.9
× 1
00
4.1
× 1
00
3.1
x 1
01
37
2
.1 ×
10
2
1.4
× 1
00
8.4
× 1
01
4
.5 ×
10
2
3,
2
P
isci
vo
rous
Fis
h
62
1
.4 ×
10
1
2.9
× 1
00
2.0
× 1
00
9.7
× 1
01
78
2
.4 ×
10
3
1.5
× 1
00
1.5
× 1
02
5
.6 ×
10
3
6,
5
Ce
Ben
thic
Fis
h
14
8
.6 ×
10
1
1.2
× 1
01
1.7
× 1
00
1.2
× 1
03
4
4
.8 ×
10
1
2.2
× 1
00
1.6
× 1
01
9.3
× 1
01
3,
3
F
ora
ge
Fis
h
1
3.0
× 1
01
nd
nd
nd
9
3.2
× 1
01
2.6
× 1
00
8.6
× 1
00
1.1
× 1
02
1,
3
P
isci
vo
rous
Fis
h
56
1
.8 ×
10
1
7.2
× 1
00
9.0
× 1
0-1
6.7
× 1
02
77
1
.0 ×
10
1
2.4
× 1
00
3.0
× 1
00
1.1
× 1
02
3,
5
Cl
Ben
thic
Fis
h
1
4.4
× 1
01
1
1.2
× 1
02
1
, 1
F
ora
ge
Fis
h
11
4
.4 ×
10
1
2.6
× 1
00
8.9
1
.2 ×
10
2
38
8
.5 ×
10
1
1.6
× 1
00
2.5
× 1
01
2.3
× 1
02
2,
2
P
isci
vo
rous
Fis
h
4
5.9
× 1
01
1.1
5.4
× 1
01
6.4
× 1
01
nd
nd
nd
nd
nd
2
, -
Co
B
enth
ic F
ish
16
8
.1 ×
10
1
2.6
× 1
00
1.9
× 1
01
2.7
× 1
02
6
1
.6 ×
10
2
2.4
× 1
00
6.3
× 1
01
7.2
× 1
02
14
, 6
F
ora
ge
Fis
h
11
3
.0 ×
10
2
1.5
× 1
00
1.9
× 1
02
5.6
× 1
02
32
5
.3 ×
10
2
1.9
× 1
00
2.4
× 1
02
2.4
× 1
03
11
, 22
P
isci
vo
rous
Fis
h
40
5
.5 ×
10
1
2.0
× 1
00
1.7
× 1
01
2.7
× 1
02
80
3
.9 ×
10
2
1.5
× 1
00
2.3
× 1
01
7.5
× 1
02
23
, 20
Cr
Ben
thic
Fis
h
9
2.9
× 1
01
1.4
× 1
00
2.0
× 1
01
4.7
× 1
01
3
5
.4 ×
10
1
1.1
× 1
00
5.2
× 1
01
5.8
× 1
01
3,
3
F
ora
ge
Fis
h
1
3.9
× 1
01
5
5.9
× 1
01
1.5
× 1
00
3.5
× 1
01
8.8
× 1
01
1,
3
P
isci
vo
rous
Fis
h
47
4
.2 ×
10
1
2.1
× 1
00
1.3
× 1
01
1.2
× 1
02
43
2
.6 ×
10
2
1.6
× 1
00
5.9
× 1
01
7.6
× 1
02
5,
5
Cs
Ben
thic
Fis
h
17
1
.4 ×
10
3
2.2
× 1
00
1.6
× 1
02
3.1
× 1
03
11
2
.0 ×
10
3
1.9
× 1
00
4.8
× 1
02
4.4
× 1
03
17
, 11
F
ora
ge
Fis
h
12
1
.4 ×
10
3
2.2
× 1
00
1.4
× 1
02
2.2
× 1
03
43
9
.8 ×
10
2
2.6
× 1
00
7.5
× 1
01
5.2
× 1
03
12
, 36
P
isci
vo
rous
Fis
h
78
3
.1 ×
10
3
2.5
× 1
00
2.6
× 1
02
1.5
× 1
04
91
5
.3 ×
10
3
2.2
× 1
00
2.4
× 1
02
2.4
× 1
04
34
, 49
489
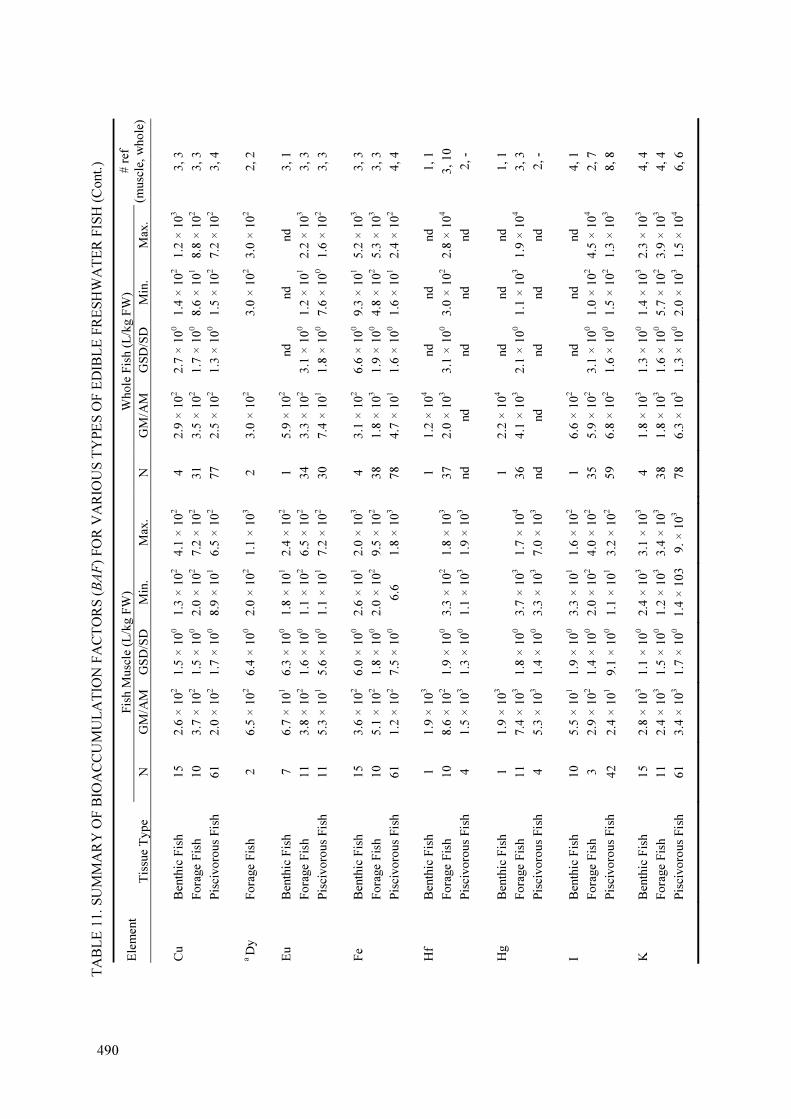
TA
BL
E 1
1. S
UM
MA
RY
OF
BIO
AC
CU
MU
LA
TIO
N F
AC
TO
RS
(BAF
) F
OR
VA
RIO
US
TY
PE
S O
F E
DIB
LE
FR
ES
HW
AT
ER
FIS
H (
Cont.
)
F
ish M
usc
le (
L/k
g F
W)
W
hole
Fis
h (
L/k
g F
W)
E
lem
ent
Tis
sue
Typ
e N
G
M/A
M
GS
D/S
DM
in.
Max
.
N
GM
/AM
G
SD
/SD
M
in.
Max
.
# r
ef
(musc
le,
who
le)
Cu
Ben
thic
Fis
h
15
2.6
× 1
02
1.5
× 1
00
1.3
× 1
02
4.1
× 1
02
4
2
.9 ×
10
2
2.7
× 1
00
1.4
× 1
02
1.2
× 1
03
3,
3
F
ora
ge
Fis
h
10
3.7
× 1
02
1.5
× 1
00
2.0
× 1
02
7.2
× 1
02
3
1
3.5
× 1
02
1.7
× 1
00
8.6
× 1
01
8.8
× 1
02
3,
3
P
isci
vo
rous
Fis
h
61
2.0
× 1
02
1.7
× 1
00
8.9
× 1
01
6.5
× 1
02
7
7
2.5
× 1
02
1.3
× 1
00
1.5
× 1
02
7.2
× 1
02
3,
4
a D
y
Fo
rage
Fis
h
2
6.5
× 1
02
6.4
× 1
00
2.0
× 1
02
1.1
× 1
03
2
3
.0 ×
10
2
3
.0 ×
10
23.0
× 1
02
2,
2
Eu
Ben
thic
Fis
h
7
6.7
× 1
01
6.3
× 1
00
1.8
× 1
01
2.4
× 1
02
1
5
.9 ×
10
2
nd
nd
nd
3,
1
F
ora
ge
Fis
h
11
3.8
× 1
02
1.6
× 1
00
1.1
× 1
02
6.5
× 1
02
3
4
3.3
× 1
02
3.1
× 1
00
1.2
× 1
01
2.2
× 1
03
3,
3
P
isci
vo
rous
Fis
h
11
5.3
× 1
01
5.6
× 1
00
1.1
× 1
01
7.2
× 1
02
3
0
7.4
× 1
01
1.8
× 1
00
7.6
× 1
00
1.6
× 1
02
3,
3
Fe
Ben
thic
Fis
h
15
3.6
× 1
02
6.0
× 1
00
2.6
× 1
01
2.0
× 1
03
4
3
.1 ×
10
2
6.6
× 1
00
9.3
× 1
01
5.2
× 1
03
3,
3
F
ora
ge
Fis
h
10
5.1
× 1
02
1.8
× 1
00
2.0
× 1
02
9.5
× 1
02
3
8
1.8
× 1
03
1.9
× 1
00
4.8
× 1
02
5.3
× 1
03
3,
3
P
isci
vo
rous
Fis
h
61
1.2
× 1
02
7.5
× 1
00
6.6
1
.8 ×
10
3
78
4
.7 ×
10
1
1.6
× 1
00
1.6
× 1
01
2.4
× 1
02
4,
4
Hf
Ben
thic
Fis
h
1
1.9
× 1
03
1
1.2
× 1
04
nd
nd
nd
1,
1
F
ora
ge
Fis
h
10
8.6
× 1
02
1.9
× 1
00
3.3
× 1
02
1.8
× 1
03
3
7
2.0
× 1
03
3.1
× 1
00
3.0
× 1
02
2.8
× 1
04
3,
10
P
isci
vo
rous
Fis
h
4
1.5
× 1
03
1.3
× 1
00
1.1
× 1
03
1.9
× 1
03
nd
nd
nd
nd
nd
2,
-
Hg
Ben
thic
Fis
h
1
1.9
× 1
03
1
2.2
× 1
04
nd
nd
nd
1,
1
F
ora
ge
Fis
h
11
7.4
× 1
03
1.8
× 1
00
3.7
× 1
03
1.7
× 1
04
3
6
4.1
× 1
03
2.1
× 1
00
1.1
× 1
03
1.9
× 1
04
3,
3
P
isci
vo
rous
Fis
h
4
5.3
× 1
03
1.4
× 1
00
3.3
× 1
03
7.0
× 1
03
nd
nd
nd
nd
nd
2,
-
I B
enth
ic F
ish
10
5.5
× 1
01
1.9
× 1
00
3.3
× 1
01
1.6
× 1
02
1
6
.6 ×
10
2
nd
nd
nd
4,
1
F
ora
ge
Fis
h
3
2.9
× 1
02
1.4
× 1
00
2.0
× 1
02
4.0
× 1
02
3
5
5.9
× 1
02
3.1
× 1
00
1.0
× 1
02
4.5
× 1
04
2,
7
P
isci
vo
rous
Fis
h
42
2.4
× 1
01
9.1
× 1
00
1.1
× 1
01
3.2
× 1
02
5
9
6.8
× 1
02
1.6
× 1
00
1.5
× 1
02
1.3
× 1
03
8,
8
K
Ben
thic
Fis
h
15
2.8
× 1
03
1.1
× 1
00
2.4
× 1
03
3.1
× 1
03
4
1
.8 ×
10
3
1.3
× 1
00
1.4
× 1
03
2.3
× 1
03
4,
4
F
ora
ge
Fis
h
11
2.4
× 1
03
1.5
× 1
00
1.2
× 1
03
3.4
× 1
03
3
8
1.8
× 1
03
1.6
× 1
00
5.7
× 1
02
3.9
× 1
03
4,
4
P
isci
vo
rous
Fis
h
61
3.4
× 1
03
1.7
× 1
00
1.4
× 1
03
9.
× 1
03
7
8
6.3
× 1
03
1.3
× 1
00
2.0
× 1
03
1.5
× 1
04
6,
6
490
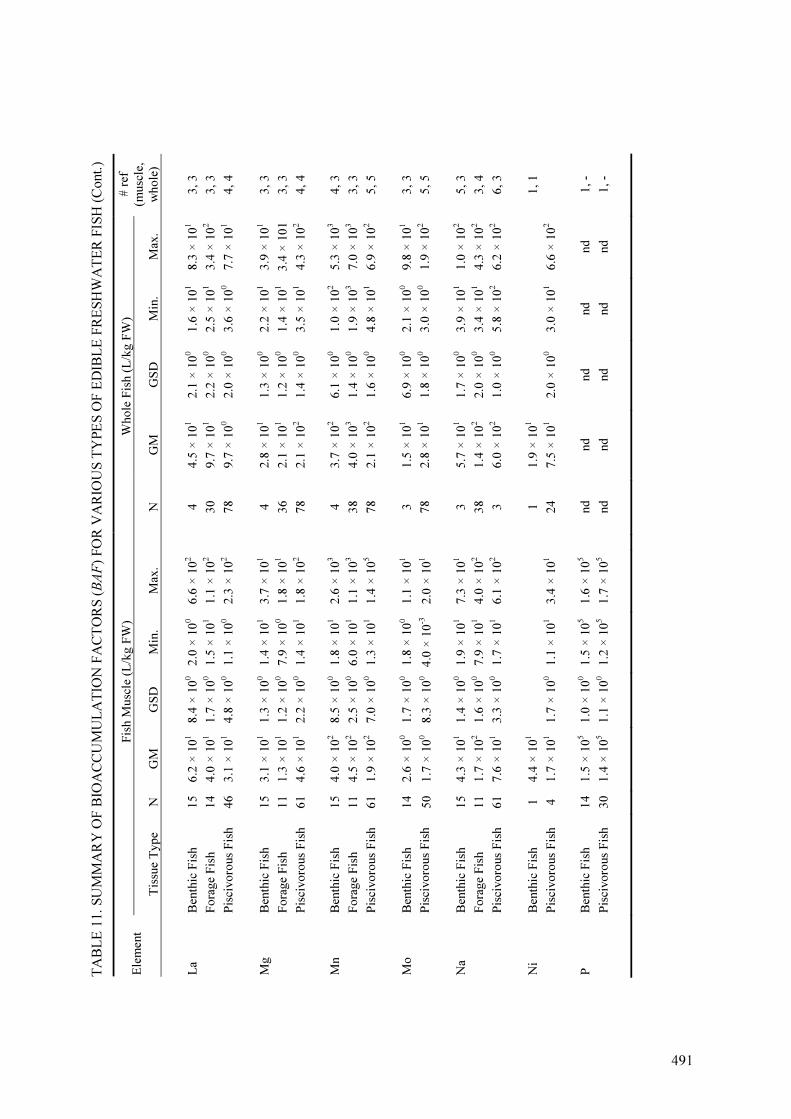
TA
BL
E 1
1. S
UM
MA
RY
OF
BIO
AC
CU
MU
LA
TIO
N F
AC
TO
RS
(BAF
) F
OR
VA
RIO
US
TY
PE
S O
F E
DIB
LE
FR
ES
HW
AT
ER
FIS
H (
Cont.
)
F
ish M
usc
le (
L/k
g F
W)
W
ho
le F
ish (
L/k
g F
W)
E
lem
ent
Tis
sue
Typ
e N
G
M
GS
D
Min
. M
ax.
N
G
M
GS
D
Min
. M
ax.
# r
ef
(mu
scle
,
wh
ole
)
La
Ben
thic
Fis
h
15
6
.2 ×
10
1
8.4
× 1
00
2.0
× 1
00
6.6
× 1
02
4
4.5
× 1
01
2.1
× 1
00
1.6
× 1
01
8.3
× 1
01
3,
3
F
ora
ge
Fis
h
14
4
.0 ×
10
1
1.7
× 1
00
1.5
× 1
01
1.1
× 1
02
3
0
9.7
× 1
01
2.2
× 1
00
2.5
× 1
01
3.4
× 1
02
3,
3
P
isci
vo
rous
Fis
h
46
3
.1 ×
10
1
4.8
× 1
00
1.1
× 1
00
2.3
× 1
02
7
8
9.7
× 1
00
2.0
× 1
00
3.6
× 1
00
7.7
× 1
01
4,
4
Mg
Ben
thic
Fis
h
15
3
.1 ×
10
1
1.3
× 1
00
1.4
× 1
01
3.7
× 1
01
4
2.8
× 1
01
1.3
× 1
00
2.2
× 1
01
3.9
× 1
01
3,
3
F
ora
ge
Fis
h
11
1
.3 ×
10
1
1.2
× 1
00
7.9
× 1
00
1.8
× 1
01
3
6
2.1
× 1
01
1.2
× 1
00
1.4
× 1
01
3.4
× 1
01
3,
3
P
isci
vo
rous
Fis
h
61
4
.6 ×
10
1
2.2
× 1
00
1.4
× 1
01
1.8
× 1
02
7
8
2.1
× 1
02
1.4
× 1
00
3.5
× 1
01
4.3
× 1
02
4,
4
Mn
Ben
thic
Fis
h
15
4
.0 ×
10
2
8.5
× 1
00
1.8
× 1
01
2.6
× 1
03
4
3.7
× 1
02
6.1
× 1
00
1.0
× 1
02
5.3
× 1
03
4,
3
F
ora
ge
Fis
h
11
4
.5 ×
10
2
2.5
× 1
00
6.0
× 1
01
1.1
× 1
03
3
8
4.0
× 1
03
1.4
× 1
00
1.9
× 1
03
7.0
× 1
03
3,
3
P
isci
vo
rous
Fis
h
61
1
.9 ×
10
2
7.0
× 1
00
1.3
× 1
01
1.4
× 1
05
7
8
2.1
× 1
02
1.6
× 1
00
4.8
× 1
01
6.9
× 1
02
5,
5
Mo
Ben
thic
Fis
h
14
2
.6 ×
10
0
1.7
× 1
00
1.8
× 1
00
1.1
× 1
01
3
1.5
× 1
01
6.9
× 1
00
2.1
× 1
00
9.8
× 1
01
3,
3
P
isci
vo
rous
Fis
h
50
1
.7 ×
10
0
8.3
× 1
00
4.0
× 1
0-3
2.0
× 1
01
7
8
2.8
× 1
01
1.8
× 1
00
3.0
× 1
00
1.9
× 1
02
5,
5
Na
Ben
thic
Fis
h
15
4
.3 ×
10
1
1.4
× 1
00
1.9
× 1
01
7.3
× 1
01
3
5.7
× 1
01
1.7
× 1
00
3.9
× 1
01
1.0
× 1
02
5,
3
F
ora
ge
Fis
h
11
1
.7 ×
10
2
1.6
× 1
00
7.9
× 1
01
4.0
× 1
02
3
8
1.4
× 1
02
2.0
× 1
00
3.4
× 1
01
4.3
× 1
02
3,
4
P
isci
vo
rous
Fis
h
61
7
.6 ×
10
1
3.3
× 1
00
1.7
× 1
01
6.1
× 1
02
3
6.0
× 1
02
1.0
× 1
00
5.8
× 1
02
6.2
× 1
02
6,
3
Ni
Ben
thic
Fis
h
1
4.4
× 1
01
1
1.9
× 1
01
1
, 1
P
isci
vo
rous
Fis
h
4
1.7
× 1
01
1.7
× 1
00
1.1
× 1
01
3.4
× 1
01
2
4
7.5
× 1
01
2.0
× 1
00
3.0
× 1
01
6.6
× 1
02
P
Ben
thic
Fis
h
14
1
.5 ×
10
5
1.0
× 1
00
1.5
× 1
05
1.6
× 1
05
nd
nd
nd
nd
nd
1,
-
P
isci
vo
rous
Fis
h
30
1
.4 ×
10
5
1.1
× 1
00
1.2
× 1
05
1.7
× 1
05
nd
nd
nd
nd
nd
1,
-
491

TA
BL
E 1
1. S
UM
MA
RY
OF
BIO
AC
CU
MU
LA
TIO
N F
AC
TO
RS
(BAF
) F
OR
VA
RIO
US
TY
PE
S O
F E
DIB
LE
FR
ES
HW
AT
ER
FIS
H (
Cont.
)
F
ish M
usc
le (
L/k
g F
W)
W
ho
le F
ish (
L/k
g F
W)
#
ref
E
lem
ent
Tis
sue
Type
N
GM
/AM
G
SD
/SD
M
in.
Max.
N
G
M/A
M
GS
D/S
D
Min
. M
ax.
(mu
scle
,
wh
ole
)
Pb
B
enth
ic F
ish
5
2.7
× 1
01
2.9
× 1
00
7.0
× 1
00
1.2
× 1
02
3
1.5
× 1
02
1.3
× 1
00
1.2
× 1
02
2.0
× 1
02
1,
1
P
isci
vo
rous
Fis
h
26
4
.9 ×
10
1
2.8
× 1
00
8.3
× 1
00
2.7
× 1
02
7
7
3.9
× 1
02
3.0
× 1
00
5.8
× 1
01
5.7
× 1
03
3,
3
F
ish (
Gen
eric
)1
9
2.8
× 1
00
5.9
× 1
00
1.0
× 1
0-1
3
.0 ×
10
1
2
1.2
× 1
02
1.8
× 1
00
7.5
× 1
01
1.8
× 1
02
1,
1
Po
F
ish (
Gen
eric
) 6
3
.6 ×
10
1
4.3
× 1
00
6.0
× 1
00
1.7
× 1
02
nd
nd
nd
nd
nd
2
, -
Pu
Fo
rage
Fis
h
3
2.1
× 1
04
2.6
× 1
00
7.7
× 1
03
5.0
× 1
04
nd
nd
nd
nd
nd
2
, -
Ra
Fis
h (
Gen
eric
) 2
1
4.0
× 1
00
7.4
× 1
00
6.0
× 1
0-2
1
.5 ×
10
2
nd
nd
nd
nd
nd
3
, -
Rb
B
enth
ic F
ish
15
2
.9 ×
10
3
1.4
× 1
00
1.0
× 1
03
5.0
× 1
03
4
3.3
× 1
03
1.3
2
.5 ×
10
3
4.0
× 1
03
3,
3
F
ora
ge
Fis
h
11
3
.3 ×
10
3
1.3
× 1
00
2.3
× 1
03
5.3
× 1
03
3
8
3.9
× 1
03
1.5
1
.2 ×
10
3
1.0
× 1
04
3,
3
P
isci
vo
rous
Fis
h
60
5
.8 ×
10
3
1.6
× 1
00
2.1
× 1
03
1.4
× 1
04
7
8
7.6
× 1
03
1.4
3
.8 ×
10
3
1.6
× 1
04
4,
4
Ru
Fis
h (
Gen
eric
) 2
3
.2 ×
10
1
5.1
× 1
00
1.0
× 1
01
1.0
× 1
02
nd
nd
nd
nd
nd
2
, -
Sb
B
enth
ic F
ish
6
8.2
0
8.2
× 1
00
1.9
× 1
00
9.1
× 1
01
4
1.2
× 1
01
2.5
× 1
00
4.8
× 1
00
4.4
× 1
01
3,
3
F
ora
ge
Fis
h
10
8
.9 ×
10
1
2.0
× 1
00
3.7
× 1
01
3.6
× 1
02
3
8
1.3
× 1
02
1.2
× 1
01
2.6
× 1
01
9.3
× 1
06
4,
4
P
isci
vo
rous
Fis
h
8
2.5
× 1
01
4.4
× 1
00
3.6
× 1
00
1.1
× 1
02
1
0
3.7
× 1
01
2.3
× 1
00
4.7
× 1
00
9.4
× 1
01
3,
3
Sc
Ben
thic
Fis
h
1
1.7
× 1
02
1
8.3
× 1
03
1
, 1
F
ora
ge
Fis
h
10
2
.0 ×
10
2
2.5
× 1
00
3.3
× 1
01
7.3
× 1
02
3
7
8.7
× 1
02
3.4
× 1
00
6.7
× 1
01
3.7
× 1
04
2,
2
P
isci
vo
rous
Fis
h
4
1.4
× 1
02
1.3
× 1
00
1.0
× 1
02
2.0
× 1
02
nd
nd
nd
nd
nd
2
, -
Se
Ben
thic
Fis
h
1
9.4
× 1
03
1
6.1
× 1
03
nd
nd
nd
1
, 1
F
ora
ge
Fis
h
10
5
.7 ×
10
3
1.4
× 1
00
3.5
× 1
03
8.2
× 1
03
3
8
6.9
× 1
03
1.4
× 1
00
3.6
× 1
03
1.2
× 1
04
2,
6
P
isci
vo
rous
Fis
h
4
6.1
× 1
03
1.1
× 1
00
5.5
× 1
03
6.9
× 1
03
nd
nd
nd
nd
nd
2
, -
1 G
ener
ic’
fish
dat
a ar
e ty
pic
ally
bas
ed o
n v
ery f
ew d
ata
on a
ccu
mula
tio
n f
acto
rs f
or
whic
h l
ittl
e su
pple
menta
ry i
nfo
rmat
ion
is
avai
lable
. T
hes
e val
ues
sh
ould
not
be
adop
ted a
s p
refe
rred
ref
eren
ce v
alu
es u
nle
ss n
o o
ther
, m
ore
sp
ecif
ic d
ata
are
avai
lab
le.
492

TA
BL
E 1
1.
SU
MM
AR
Y O
F B
IOA
CC
UM
UL
AT
ION
FA
CT
OR
S (
BA
F)
FO
R V
AR
IOU
S T
YP
ES
OF
ED
IBL
E F
RE
SH
WA
TE
R F
ISH
AN
D T
HE
IR
TIS
SU
ES
(C
ont.
)
F
ish M
usc
le (
L/k
g F
W)
W
ho
le F
ish (
L/k
g F
W)
E
lem
ent
Tis
sue
Typ
e N
G
M/A
M1
GS
D/S
DM
in.
Max.
N
G
M/A
M
GS
D/S
D
Min
. M
ax.
# r
ef
(musc
le,
wh
ole
)
Sr
Ben
thic
Fis
h
15
2.2
× 1
00
1.8
× 1
00
1.1
0
1.1
× 1
01
4
4
.0 ×
10
1
2.0
× 1
00
2.2
× 1
01
1.0
× 1
02
5,
3
F
ora
ge
Fis
h
11
2.2
× 1
01
1.9
× 1
00
8.3
0
6.9
× 1
01
38
7
.4 ×
10
1
1.7
× 1
00
2.5
× 1
01
2.4
× 1
02
7,
11
P
isci
vo
rous
Fis
h
62
2.1
× 1
00
3.4
× 1
00
1.4
× 1
0-1
2.3
× 1
01
78
3
.0 ×
10
2
1.4
× 1
00
3.3
× 1
01
7.1
× 1
02
27
, 33
Tb
B
enth
ic F
ish
1
3.0
× 1
02
1
2.4
× 1
03
nd
nd
nd
1
, 1
F
ora
ge
Fis
h
9
4.0
× 1
02
2.4
× 1
00
2.0
× 1
02
1.7
× 1
03
35
7
.0 ×
10
2
2.6
× 1
00
8.0
× 1
01
2.2
× 1
03
2,
3
P
isci
vo
rous
Fis
h
4
4.5
× 1
02
1.4
× 1
00
3.4
× 1
02
7.0
× 1
02
nd
nd
nd
nd
nd
2,
-
Te
Pis
civo
rous
Fis
h
3
1.5
× 1
02
1.5
× 1
00
9.6
× 1
01
2.1
× 1
02
10
4
.2 ×
10
2
1.5
× 1
00
2.2
× 1
02
8.9
× 1
02
1,
1
Th
Fis
h (
Gen
eric
) 1
6
.00
1
3
.8 ×
10
1
nd
nd
nd
1
, 1
B
enth
ic F
ish
nd
nd
nd
nd
nd
1
3.8
× 1
03
nd
nd
nd
-,
1
Ti
Ben
thic
Fis
h
1
1.5
× 1
02
1
1.3
× 1
03
nd
nd
nd
1
, 1
F
ora
ge
Fis
h
9
1.8
× 1
02
1.6
× 1
00
1.1
× 1
02
3.5
× 1
02
34
3
.6 ×
10
2
1.8
× 1
00
1.2
× 1
02
1.3
× 1
03
2,
3
P
isci
vo
rous
Fis
h
4
1.8
× 1
02
1.2
× 1
00
1.4
× 1
02
2.1
× 1
02
nd
nd
nd
nd
nd
2,
-
Tl
Ben
thic
Fis
h
14
2.4
× 1
03
3.8
× 1
00
1.3
× 1
02
1.0
× 1
04
3
7
.6 ×
10
1
1.3
× 1
00
6.4
× 1
01
1.0
× 1
02
1,
1
P
isci
vo
rous
Fis
h
48
7.4
× 1
02
2.1
× 1
00
6.6
× 1
01
2.8
× 1
03
78
6
.3 ×
10
2
1.6
× 1
00
6.5
× 1
01
3.1
× 1
03
1,
1
U
Fis
h (
Gen
eric
) 1
2
8.6
× 1
0-1
1
.2 ×
10
12
.0 ×
10
-22
.0 ×
10
1
2
2
.2 ×
10
0
1.7
× 1
00
1.5
× 1
00
3.3
× 1
00
3,
2
V
Ben
thic
Fis
h
15
8.0
× 1
01
1.4
× 1
00
2.5
× 1
01
1.1
× 1
02
4
2
.8 ×
10
2
2.4
× 1
00
1.5
× 1
02
1.1
× 1
03
3,
3
F
ora
ge
Fis
h
11
3.3
× 1
01
2.5
× 1
00
1.0
× 1
01
1.6
× 1
02
33
1
.4 ×
10
2
2.6
× 1
00
3.0
× 1
01
1.0
× 1
03
3,
3
P
isci
vo
rous
Fis
h
61
1.2
× 1
02
1.6
× 1
00
1.5
× 1
01
2.4
× 1
02
78
3
.3 ×
10
2
1.5
× 1
00
8.3
× 1
01
9.9
× 1
02
4,
4
1T
he
arit
hm
etic
al m
ean A
M a
nd
the
stan
dar
d d
evia
tio
n (
SD
) ar
e giv
en i
f th
e nu
mber
of
ob
serv
atio
ns
(N)
is 2
and t
he
indiv
idual
val
ue
is g
iven i
f th
e n
um
ber
of
ob
serv
atio
ns
(N)
is 1
.
493

TA
BL
E 1
1. S
UM
MA
RY
OF
BIO
AC
CU
MU
LA
TIO
N F
AC
TO
RS
(BAF
) F
OR
VA
RIO
US
TY
PE
S O
F E
DIB
LE
FR
ES
HW
AT
ER
FIS
H (
Cont.
)
F
ish M
usc
le (
L/k
g F
W)
W
ho
le F
ish (
L/k
g F
W)
E
lem
ent
Tis
sue
Typ
e N
G
M
GS
D
Min
. M
ax.
N
G
M
GS
D
Min
. M
ax.
# r
ef
(musc
le,
who
le)
Y
Ben
thic
Fis
h
11
8.2
× 1
01
1.4
× 1
00
5.8
× 1
01
1.2
× 1
02
3
4
.7 ×
10
1
1.3
× 1
00
4.0
× 1
01
6.2
× 1
01
1,
1
P
isci
vo
rous
Fis
h
12
2.8
× 1
01
2.5
× 1
00
4.5
× 1
00
9.8
× 1
01
1
0
2.6
× 1
01
1.6
× 1
00
1.1
× 1
01
4.6
× 1
01
1,
1
Zn
Ben
thic
Fis
h
15
6.3
× 1
03
2.3
× 1
00
3.8
× 1
02
1.6
× 1
04
4
6
.3 ×
10
3
2.2
× 1
00
1.9
× 1
03
9.8
× 1
03
5,
4
F
ora
ge
Fis
h
11
1.0
× 1
03
1.5
× 1
00
6.4
× 1
02
1.9
× 1
03
3
8
2.3
× 1
03
1.4
× 1
00
1.2
× 1
03
4.3
× 1
03
3,
3
P
isci
vo
rous
Fis
h
61
3.6
× 1
03
2.6
× 1
00
3.3
× 1
02
1.1
× 1
04
7
8
6.3
× 1
03
1.3
× 1
00
2.7
× 1
03
1.8
× 1
04
5,
5
Zr
Ben
thic
Fis
h
5
1.4
× 1
01
1.5
× 1
00
9.2
× 1
00
2.1
× 1
01
nd
nd
nd
nd
nd
1,
-
P
isci
vo
rous
Fis
h
7
2.8
× 1
01
2.7
× 1
00
1.2
× 1
01
1.2
× 1
02
1
0
9.5
× 1
01
1.5
× 1
00
5.7
× 1
01
2.4
× 1
02
1,
1
a D
y–
dysp
rosi
um
494
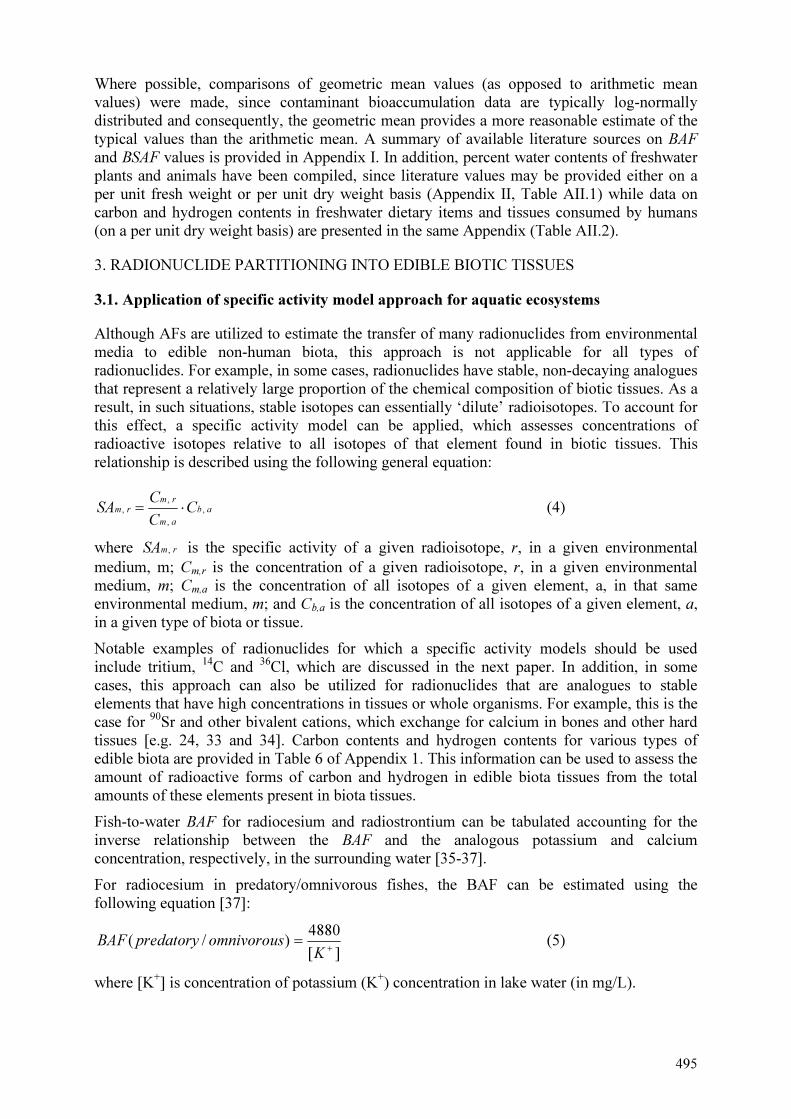
495
Where possible, comparisons of geometric mean values (as opposed to arithmetic mean
values) were made, since contaminant bioaccumulation data are typically log-normally
distributed and consequently, the geometric mean provides a more reasonable estimate of the
typical values than the arithmetic mean. A summary of available literature sources on BAF
and BSAF values is provided in Appendix I. In addition, percent water contents of freshwater
plants and animals have been compiled, since literature values may be provided either on a
per unit fresh weight or per unit dry weight basis (Appendix II, Table AII.1) while data on
carbon and hydrogen contents in freshwater dietary items and tissues consumed by humans
(on a per unit dry weight basis) are presented in the same Appendix (Table AII.2).
3. RADIONUCLIDE PARTITIONING INTO EDIBLE BIOTIC TISSUES
3.1. Application of specific activity model approach for aquatic ecosystems
Although AFs are utilized to estimate the transfer of many radionuclides from environmental
media to edible non-human biota, this approach is not applicable for all types of
radionuclides. For example, in some cases, radionuclides have stable, non-decaying analogues
that represent a relatively large proportion of the chemical composition of biotic tissues. As a
result, in such situations, stable isotopes can essentially ‘dilute’ radioisotopes. To account for
this effect, a specific activity model can be applied, which assesses concentrations of
radioactive isotopes relative to all isotopes of that element found in biotic tissues. This
relationship is described using the following general equation:
ab
am
rm
rm CC
CSA ,
,
,
, ⋅= (4)
where rmSA , is the specific activity of a given radioisotope, r, in a given environmental
medium, m; Cm,r is the concentration of a given radioisotope, r, in a given environmental
medium, m; Cm,a is the concentration of all isotopes of a given element, a, in that same
environmental medium, m; and Cb,a is the concentration of all isotopes of a given element, a,
in a given type of biota or tissue.
Notable examples of radionuclides for which a specific activity models should be used
include tritium, 14
C and 36
Cl, which are discussed in the next paper. In addition, in some
cases, this approach can also be utilized for radionuclides that are analogues to stable
elements that have high concentrations in tissues or whole organisms. For example, this is the
case for 90
Sr and other bivalent cations, which exchange for calcium in bones and other hard
tissues [e.g. 24, 33 and 34]. Carbon contents and hydrogen contents for various types of
edible biota are provided in Table 6 of Appendix 1. This information can be used to assess the
amount of radioactive forms of carbon and hydrogen in edible biota tissues from the total
amounts of these elements present in biota tissues.
Fish-to-water BAF for radiocesium and radiostrontium can be tabulated accounting for the
inverse relationship between the BAF and the analogous potassium and calcium
concentration, respectively, in the surrounding water [35-37].
For radiocesium in predatory/omnivorous fishes, the BAF can be estimated using the
following equation [37]:
][
4880)/(
+=
KomnivorouspredatoryBAF (5)
where [K+] is concentration of potassium (K
+) concentration in lake water (in mg/L).

496
For non-predatory fishes, the following relationship can be applied:
][
2390)(
+=−
KpredatorynonBAF (6)
Similarly, strontium concentrations can be tabulated based on calcium concentrations in water
([Ca] in mg L-1
), since both elements behave in a similar manner, primarily partitioning in the
bony parts of aquatic biota (e.g. skeleton, head, fins, bone, fish scales), as follows [25, 35]:
BAF(muscle) = exp(5.2 – 1.2 ln[Ca]) (7)
BAF(bone) = exp(9.7 – 1.2 ln[Ca]) (8)
Assuming that 20% of the wet weight of a fish is composed of bony parts, the whole fish BAF
can be estimated using the following equation [37]:
BAF(whole fish) = exp(8.13 – 1.2 ln[Ca]) (9)
An important consideration in the application of specific activity models is the choice of
environmental medium, m, in Equation 1. Indeed, in some instances, organisms may obtain
their supplies of an element from multiple sources, e.g. both water and sediments. In such
cases, the specific activity in the organism will be some weighted average of the specific
activities in the source media and this weighted average may vary in time and space
depending on the relative availability of the different sources.
3.2. Derived parameters for radionuclide partitioning into edible biotic tissues
As discussed above, humans can consume a number of different types of biotic tissues, which
may have varying propensities to accumulate radionuclides of interest. As a result, depending
upon the species, radionuclide and tissue under consideration, it may be necessary to estimate
the the percent radionuclide loading in specific edible tissues and/or in cases where whole
organisms are consumed, to estimate the radionuclide load in the whole body of an organism
based on data that have been collected for individual tissues [38-39]. Therefore, where
possible, literature data relating tissue biomass to organism fresh weight were compiled for
edible biota (Tables 12 and 13), along with data reflecting radionuclide partitioning patterns
in edible biotic tissues (Tables 14-22). In the case of teleost fish and amphibians, predictive
relationships were developed to estimate changes in tissue or organ mass with body size
(Table 12).
Biomass estimates for biota and their internal components, and concentration measurements
for each tissue, were then utilized to estimate the expected percent loadings of a given
radionuclide in biotic tissues [40], as follows:
%100
%100
Tissuein LoadingPercent
Tissue Reference
⋅
⋅
⋅⋅
=⋅
⋅
⋅
=
wholewhole
tissuetissue
wholewhole
tissuetissue
mC
mCCR
mC
mC
where C tissue is the element concentration in a given tissue (in mg/kg fresh weight or
Bq/kg fresh weight); m tissue is the mass of that tissue (in kg fresh weight); Cwhole is the element
concentration in the whole organism (in mg/kg fresh weight or Bq/kg fresh weight); mwhole is
fresh weight (in kg); CRtissue is the concentration ratio of the tissue of interest relative to the
reference tissue for a given type of biota (based on literature data); and CReference Tissue is the
concentration of the element of interest measured in the reference tissue (i.e. muscle).
It is important to note that percent loads can be tabulated using actual data on concentrations
or by using concentration ratios for the tissue of interest in a given type of biota. A

497
concentration ratio is defined as the ratio of the concentration of a given element in the tissue
of interest relative to its concentration in the Reference Tissue (in this case, muscle) for a
given type of biota (e.g. freshwater fish) [38]. For example, measurements of elements have
been made for fish muscle tissue, but not for brain tissue. However, element concentrations in
brain can be estimated by taking the product of the concentration in muscle (i.e. the Reference
Tissue) and the brain-to-muscle concentration ratio for freshwater fish. With such
information, it becomes possible to estimate the concentration of a given radionuclide in
whole fish based on measurements taken for fish muscle tissue, for example, which could be
relevant for fish species that humans eat whole. Available of the information for various types
of freshwater biota are summarized in Appendix III [38].
Due to differences in the methodologies and objectives of various studies, several selection
criteria were developed to choose which data would be included in the review. Therefore, of
the more than 10,000 titles identified as being of potential relevance, about 1,000 reports and
articles were selected for review on the basis of the following criteria:
• Tissue concentrations had been measured once steady-state conditions were achieved;
• Long-term exposure to the element of interest had occurred;
• Well-defined, realistic environmental conditions were predominant during the study;
and
• Information was available on elemental concentrations in reference organs or tissues
for each type of organism under consideration within a given reference paper.
Data that did not meet these criteria were excluded from the analysis. For example, some
studies focused on the rate of change of element concentrations in non-human biota following
changes in exposure through their environments [41]. However, when stable element
concentrations in the environment are changing, corresponding tissue concentrations in non-
human biota do not necessarily change at the same rate [41]. Therefore, comparison of tissue
concentrations in a changing system could potentially result in misinterpretation of the
relative concentrations of elements in various tissues. To overcome this, data were only
included from reports in which element concentrations in non-human biota were constant with
respect to their surrounding environment (i.e. at steady-state). This ensured that the relative
concentrations in tissues and biota were stable and could be compared between ecosystems
without misinterpretation.
In some cases, data were taken from laboratory studies or controlled field experiments. In
these cases, it was necessary to ensure that the environmental and physicochemical conditions
under which these studies were carried out were well-defined and realistic. For example,
appropriate controls were required, as well as realistic pH, temperature, and concentrations of
the elements or compounds of interest.
The final selection criterion accounted for the fact that it was often difficult to compare stable
element concentrations in tissues from different studies. These difficulties can be attributed to
homeostatic mechanisms in some types of organisms, which could cause elimination systems
to be enhanced when a given element is in excess; regulation of some elements by the body,
whereby the element may enter the organism’s anabolic/catabolic cycles and concentrate in
predictable ‘biological compartments’ (e.g. iron in hemoglobin, myoglobin and liver);
differences in uptake thresholds between environmental conditions with varying contaminant
loads; and other factors that can affect elemental partitioning between biota and their
environments [16-18]. As a result, the relationships between environmental concentrations

498
and tissue concentrations were often non-linear in nature. To address this inherent complexity,
reference tissues were chosen for each type of biota and relative tissue concentrations were
standardized between studies by dividing the concentration in a given tissue by that in the
reference tissue. Reference tissues were chosen on the basis of data availability in the
literature and relative importance of the tissue to human exposure and/or biotic health
(Table 14) [40].
TABLE 12. PREDICTIVE RELATIONSHIPS BETWEEN WHOLE BODY WEIGHT (in kg), X, AND TISSUE WEIGHT (in g), Y, FOR TELEOST FISH AND AMPHIBIANS
Tissue Equation R2
Teleost Fishes:
Bone
Y = 40.68�X1.03
0.992
Brain Y = 0.960�X0.504 0.7474
Eyes Y = 5.36�X0.76 0.7267
Gonads (female) Y = 3.67�X0.729 0.3398
Gonads (male) Y = 2.03�X1.13 0.4205
Heart Y = 1.92�X1.00 0.9146
Kidney Y = 5.16�X1.03 0.8908
Liver Y = 13.42�X1.08 0.8985
Spleen Y = 1.12�X0.98 0.8562
Stomach & Intestine Y = 39.61X + 36.76 0.8944
Thyroid Y = 0.0131X + 8 × 10⁻⁵ 0.6275
Amphibians:
Eyes
Y = 4.124�X0.693
0.9868
Heart Y = 0.464�ln(X) + 1.96 0.9857
Lung Y = 3.68�X0.471 0.9775
Spleen Y = 0.0877�ln(X) + 0.443 0.8142
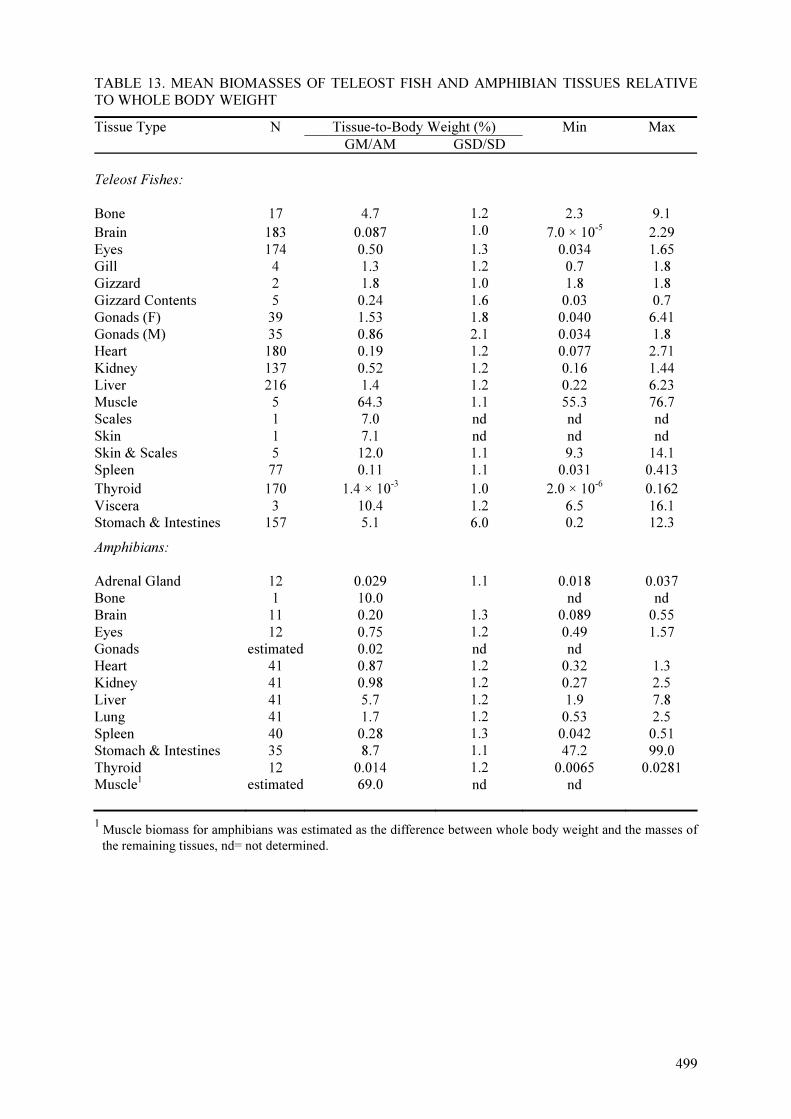
499
TABLE 13. MEAN BIOMASSES OF TELEOST FISH AND AMPHIBIAN TISSUES RELATIVE TO WHOLE BODY WEIGHT
Tissue Type N Tissue-to-Body Weight (%) Min Max GM/AM GSD/SD
Teleost Fishes:
Bone 17 4.7 1.2 2.3 9.1 Brain 183 0.087 1.0 7.0 × 10⁻⁵ 2.29 Eyes 174 0.50 1.3 0.034 1.65 Gill 4 1.3 1.2 0.7 1.8 Gizzard 2 1.8 1.0 1.8 1.8 Gizzard Contents 5 0.24 1.6 0.03 0.7 Gonads (F) 39 1.53 1.8 0.040 6.41 Gonads (M) 35 0.86 2.1 0.034 1.8 Heart 180 0.19 1.2 0.077 2.71 Kidney 137 0.52 1.2 0.16 1.44 Liver 216 1.4 1.2 0.22 6.23 Muscle 5 64.3 1.1 55.3 76.7 Scales 1 7.0 nd nd nd Skin 1 7.1 nd nd nd Skin & Scales 5 12.0 1.1 9.3 14.1 Spleen 77 0.11 1.1 0.031 0.413 Thyroid 170 1.4 × 10⁻³ 1.0 2.0 × 10⁻⁶ 0.162 Viscera 3 10.4 1.2 6.5 16.1 Stomach & Intestines 157 5.1 6.0 0.2 12.3
Amphibians: Adrenal Gland 12 0.029 1.1 0.018 0.037 Bone 1 10.0 nd nd Brain 11 0.20 1.3 0.089 0.55 Eyes 12 0.75 1.2 0.49 1.57 Gonads estimated 0.02 nd nd Heart 41 0.87 1.2 0.32 1.3 Kidney 41 0.98 1.2 0.27 2.5 Liver 41 5.7 1.2 1.9 7.8 Lung 41 1.7 1.2 0.53 2.5 Spleen 40 0.28 1.3 0.042 0.51 Stomach & Intestines 35 8.7 1.1 47.2 99.0 Thyroid 12 0.014 1.2 0.0065 0.0281 Muscle1 estimated 69.0 nd nd
1 Muscle biomass for amphibians was estimated as the difference between whole body weight and the masses of
the remaining tissues, nd= not determined.

500
TABLE 13. MEAN BIOMASSES OF TELEOST FISH AND AMPHIBIAN TISSUES RELATIVE TO WHOLE BODY WEIGHT (Cont.)
Tissue Type N Tissue-to-Body Weight (%) Min Max GM/AM GSD/SD
Teleost Fishes:
Bone 17 4.71 1.1 2.34 9.1 Brain 183 0.087 1.0 7.0 × 10⁻⁵ 2.29 Eyes 174 0.504 1.3 0.034 1.65 Gill 4 1.3 1.2 0.7 1.8 Gizzard 2 1.80 1.0 1.8 1.8 Gizzard Contents 5 0.242 1.6 0.03 0.7 Gonads (F) 39 1.53 1.7 0.040 6.41 Gonads (M) 35 0.860 2.1 0.034 1.8 Heart 180 0.192 1.2 0.077 2.71 Kidney 137 0.518 1.2 0.155 1.44 Liver 216 1.43 1.2 0.222 6.23 Muscle 5 64.3 1.1 55.3 76.7 Scales 1 7.0 nd nd nd Skin 1 7.1 nd nd nd Skin & Scales 5 12.0 1.1 9.3 14.1 Spleen 77 0.112 1.1 0.031 0.413 Thyroid 170 1.42 × 10⁻³ 1.0 2.03 × 10⁻⁶ 0.162 Viscera 3 10.4 1.2 6.5 16.1 Stomach & Intestines 157 5.06 6.2 0.200 12.3
Amphibians: Adrenal Gland 12 0.0287 1.1 0.0177 0.0372 Bone 1 10 nd nd Brain 11 0.200 1.3 0.089 0.553 Eyes 12 0.751 1.2 0.494 1.57 Gonads estimated 0.02 nd nd Heart 41 0.871 1.2 0.317 1.26 Kidney 41 0.978 1.2 0.273 2.53 Liver 41 5.70 1.2 1.89 7.77 Lung 41 1.70 1.2 0.531 2.48 Spleen 40 0.275 1.3 0.042 0.512 Stomach & Intestines 35 8.67 1.1 47.200 99.0 Thyroid 12 0.014 1.2 0.00646 0.0281 Muscle1 estimated 69 nd nd nd
1 Muscle biomass for amphibians was estimated as the difference between whole body weight and the masses of
the remaining tissues, nd= not determined.
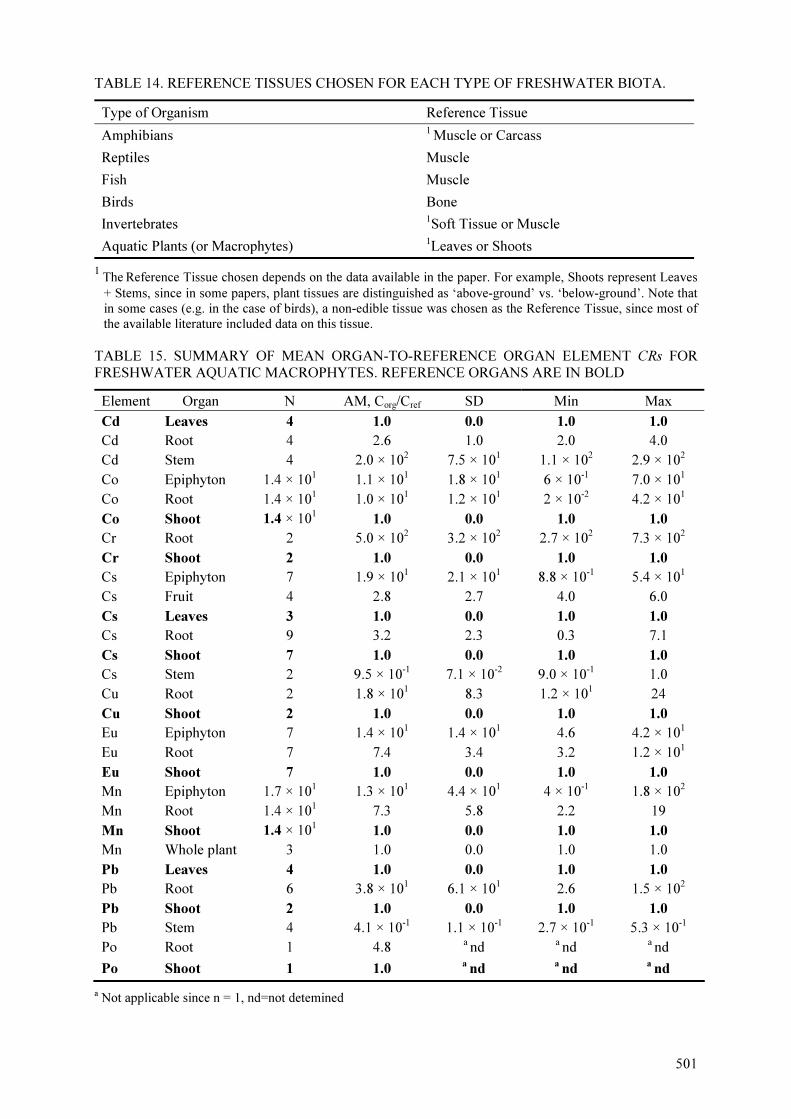
501
TABLE 14. REFERENCE TISSUES CHOSEN FOR EACH TYPE OF FRESHWATER BIOTA.
Type of Organism Reference Tissue
Amphibians 1 Muscle or Carcass
Reptiles Muscle
Fish Muscle
Birds Bone
Invertebrates 1Soft Tissue or Muscle
Aquatic Plants (or Macrophytes) 1Leaves or Shoots
1 The Reference Tissue chosen depends on the data available in the paper. For example, Shoots represent Leaves
+ Stems, since in some papers, plant tissues are distinguished as ‘above-ground’ vs. ‘below-ground’. Note that
in some cases (e.g. in the case of birds), a non-edible tissue was chosen as the Reference Tissue, since most of
the available literature included data on this tissue.
TABLE 15. SUMMARY OF MEAN ORGAN-TO-REFERENCE ORGAN ELEMENT CRs FOR FRESHWATER AQUATIC MACROPHYTES. REFERENCE ORGANS ARE IN BOLD
Element Organ N AM, Corg/Cref SD Min Max Cd Leaves 4 1.0 0.0 1.0 1.0
Cd Root 4 2.6 1.0 2.0 4.0 Cd Stem 4 2.0 × 10² 7.5 × 101 1.1 × 10² 2.9 × 10² Co Epiphyton 1.4 × 101 1.1 × 101 1.8 × 101 6 × 10⁻¹ 7.0 × 101 Co Root 1.4 × 101 1.0 × 101 1.2 × 101 2 × 10⁻² 4.2 × 101 Co Shoot 1.4 × 101
1.0 0.0 1.0 1.0
Cr Root 2 5.0 × 10² 3.2 × 10² 2.7 × 10² 7.3 × 10² Cr Shoot 2 1.0 0.0 1.0 1.0
Cs Epiphyton 7 1.9 × 101 2.1 × 101 8.8 × 10⁻¹ 5.4 × 101 Cs Fruit 4 2.8 2.7 4.0 6.0 Cs Leaves 3 1.0 0.0 1.0 1.0
Cs Root 9 3.2 2.3 0.3 7.1 Cs Shoot 7 1.0 0.0 1.0 1.0
Cs Stem 2 9.5 × 10⁻¹ 7.1 × 10⁻² 9.0 × 10⁻¹ 1.0 Cu Root 2 1.8 × 101 8.3 1.2 × 101 24 Cu Shoot 2 1.0 0.0 1.0 1.0
Eu Epiphyton 7 1.4 × 101 1.4 × 101 4.6 4.2 × 101 Eu Root 7 7.4 3.4 3.2 1.2 × 101 Eu Shoot 7 1.0 0.0 1.0 1.0
Mn Epiphyton 1.7 × 101 1.3 × 101 4.4 × 101 4 × 10⁻¹ 1.8 × 10² Mn Root 1.4 × 101 7.3 5.8 2.2 19 Mn Shoot 1.4 × 101
1.0 0.0 1.0 1.0
Mn Whole plant 3 1.0 0.0 1.0 1.0 Pb Leaves 4 1.0 0.0 1.0 1.0
Pb Root 6 3.8 × 101 6.1 × 101 2.6 1.5 × 10² Pb Shoot 2 1.0 0.0 1.0 1.0
Pb Stem 4 4.1 × 10⁻¹ 1.1 × 10⁻¹ 2.7 × 10⁻¹ 5.3 × 10⁻¹ Po Root 1 4.8 a nd a nd a nd
Po Shoot 1 1.0 a
nd a
nd a
nd
a Not applicable since n = 1, nd=not detemined
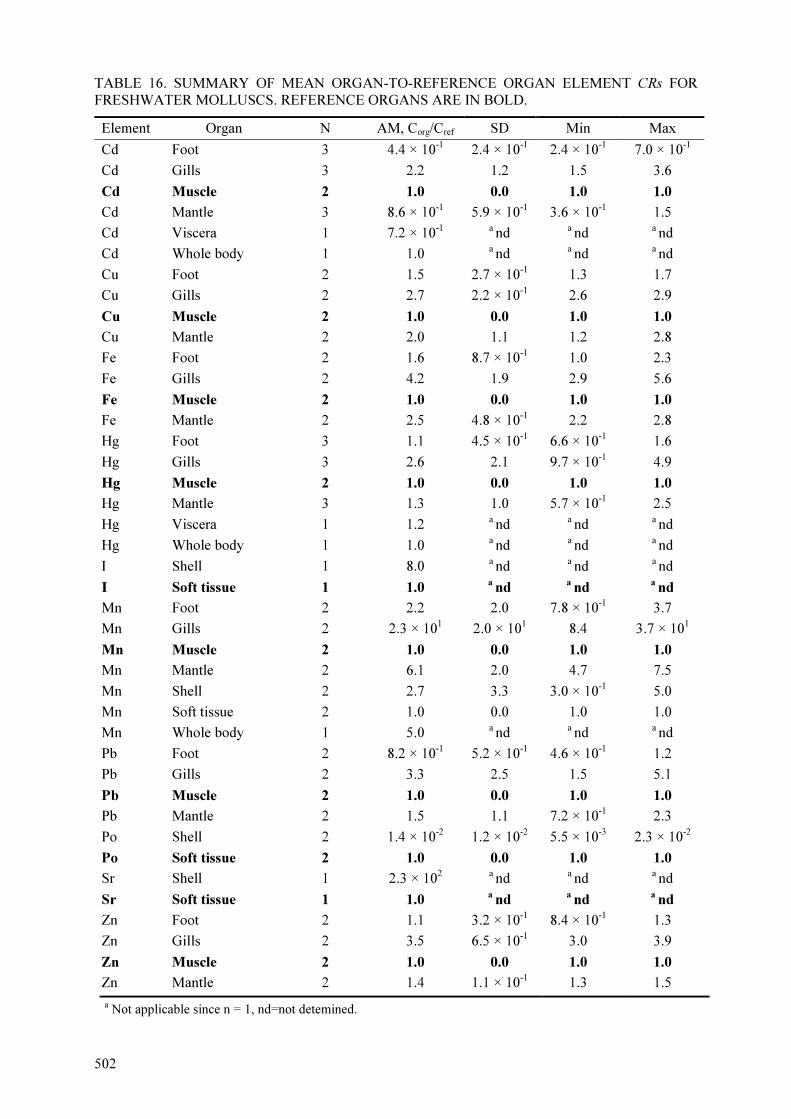
502
TABLE 16. SUMMARY OF MEAN ORGAN-TO-REFERENCE ORGAN ELEMENT CRs FOR FRESHWATER MOLLUSCS. REFERENCE ORGANS ARE IN BOLD.
Element Organ N AM, Corg/Cref SD Min Max
Cd Foot 3 4.4 × 10⁻¹ 2.4 × 10⁻¹ 2.4 × 10⁻¹ 7.0 × 10⁻¹
Cd Gills 3 2.2 1.2 1.5 3.6
Cd Muscle 2 1.0 0.0 1.0 1.0
Cd Mantle 3 8.6 × 10⁻¹ 5.9 × 10⁻¹ 3.6 × 10⁻¹ 1.5
Cd Viscera 1 7.2 × 10⁻¹ a nd a nd a nd
Cd Whole body 1 1.0 a nd a nd a nd
Cu Foot 2 1.5 2.7 × 10⁻¹ 1.3 1.7
Cu Gills 2 2.7 2.2 × 10⁻¹ 2.6 2.9
Cu Muscle 2 1.0 0.0 1.0 1.0
Cu Mantle 2 2.0 1.1 1.2 2.8
Fe Foot 2 1.6 8.7 × 10⁻¹ 1.0 2.3
Fe Gills 2 4.2 1.9 2.9 5.6
Fe Muscle 2 1.0 0.0 1.0 1.0
Fe Mantle 2 2.5 4.8 × 10⁻¹ 2.2 2.8
Hg Foot 3 1.1 4.5 × 10⁻¹ 6.6 × 10⁻¹ 1.6
Hg Gills 3 2.6 2.1 9.7 × 10⁻¹ 4.9
Hg Muscle 2 1.0 0.0 1.0 1.0
Hg Mantle 3 1.3 1.0 5.7 × 10⁻¹ 2.5
Hg Viscera 1 1.2 a nd a nd a nd
Hg Whole body 1 1.0 a nd a nd a nd
I Shell 1 8.0 a nd a nd a nd
I Soft tissue 1 1.0 a
nd a
nd a
nd
Mn Foot 2 2.2 2.0 7.8 × 10⁻¹ 3.7
Mn Gills 2 2.3 × 101 2.0 × 101 8.4 3.7 × 101
Mn Muscle 2 1.0 0.0 1.0 1.0
Mn Mantle 2 6.1 2.0 4.7 7.5
Mn Shell 2 2.7 3.3 3.0 × 10⁻¹ 5.0
Mn Soft tissue 2 1.0 0.0 1.0 1.0
Mn Whole body 1 5.0 a nd a nd a nd
Pb Foot 2 8.2 × 10⁻¹ 5.2 × 10⁻¹ 4.6 × 10⁻¹ 1.2
Pb Gills 2 3.3 2.5 1.5 5.1
Pb Muscle 2 1.0 0.0 1.0 1.0
Pb Mantle 2 1.5 1.1 7.2 × 10⁻¹ 2.3
Po Shell 2 1.4 × 10⁻² 1.2 × 10⁻² 5.5 × 10⁻³ 2.3 × 10⁻²
Po Soft tissue 2 1.0 0.0 1.0 1.0
Sr Shell 1 2.3 × 10² a nd a nd a nd
Sr Soft tissue 1 1.0 a
nd a
nd a
nd
Zn Foot 2 1.1 3.2 × 10⁻¹ 8.4 × 10⁻¹ 1.3
Zn Gills 2 3.5 6.5 × 10⁻¹ 3.0 3.9
Zn Muscle 2 1.0 0.0 1.0 1.0
Zn Mantle 2 1.4 1.1 × 10⁻¹ 1.3 1.5 a Not applicable since n = 1, nd=not detemined.

503
TABLE 17. SUMMARY OF MEAN ORGAN-TO-REFERENCE ORGAN STABLE ELEMENT CRs FOR FRESHWATER DECAPODS. REFERENCE ORGANS ARE IN BOLD
Element Organ N AM, Corg/Cref SD Min Max
Cd Exoskeleton 2 1.4 4.2 × 10⁻¹ 1.1 1.7
Cd Hepatopancreas 2 7.1 3.7 × 10⁻¹ 6.9 7.4
Cd Muscle 2 1.0 0.0 1.0 1.0
Cd Viscera 2 1.2 1.1 × 10⁻¹ 1.1 1.3
Cu Exoskeleton 2 6.5 × 10⁻¹ 2.7 × 10⁻¹ 4.6 × 10⁻¹ 8.4 × 10⁻¹
Cu Hepatopancreas 2 9.5 1.1 8.7 1.0 × 101
Cu Muscle 2 1.0 0.0 1.0 1.0
Cu Viscera 2 7.2 × 10⁻¹ 4.4 × 10⁻¹ 4.1 × 10⁻¹ 1.0
Mg Exoskeleton 2 1.7 1.3 × 10⁻¹ 1.6 1.8
Mg Hepatopancreas 2 5.7 × 10⁻¹ 4.3 × 10⁻² 5.3 × 10⁻¹ 6.0 × 10⁻¹
Mg Muscle 2 1.0 0.0 1.0 1.0
Mg Viscera 2 2.5 6.3 × 10⁻¹ 2.0 2.9
Mn Exoskeleton 2 6.7 2.6 × 10⁻¹ 6.5 6.9
Mn Hepatopancreas 2 7.5 3.0 × 10⁻² 7.5 7.5
Mn Muscle 2 1.0 0.0 1.0 1.0
Mn Viscera 2 5.8 1.0 5.1 6.5
Ni Exoskeleton 1 9.7 a nd a nd a nd
Ni Hepatopancreas 1 1.5 a nd a nd a nd
Ni Muscle 1 1.0 a
nd a
nd a
nd
Ni Viscera 1 5.3 × 10⁻¹ a nd a nd a nd
Po Exoskeleton 2 8.5 × 10⁻¹ 0.0 8.1 × 10⁻¹ 8.8 × 10⁻¹
Po Muscle 2 1.0 0.0 1.0 1.0
Zn Exoskeleton 2 2.5 × 10⁻¹ 1.1 × 10⁻¹ 1.8 × 10⁻¹ 3.3 × 10⁻¹
Zn Hepatopancreas 2 1.6 1.1 × 10⁻¹ 1.6 1.7
Zn Muscle 2 1.0 0.0 1.0 1.0
Zn Viscera 2 8.9 × 10⁻¹ 1.5 × 10⁻¹ 7.8 × 10⁻¹ 1.0
a Not applicable since n = 1.
a Not applicable since n = 1, nd=not detemined.
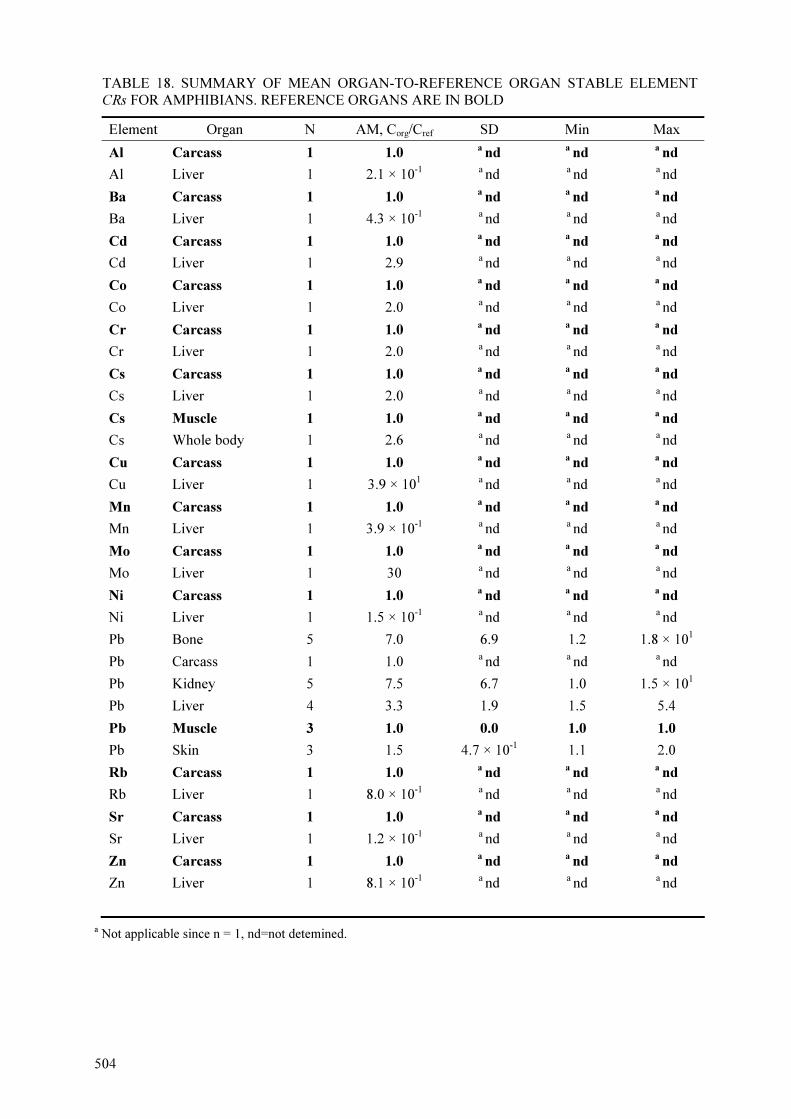
504
TABLE 18. SUMMARY OF MEAN ORGAN-TO-REFERENCE ORGAN STABLE ELEMENT CRs FOR AMPHIBIANS. REFERENCE ORGANS ARE IN BOLD
Element Organ N AM, Corg/Cref SD Min Max
Al Carcass 1 1.0 a
nd a
nd a
nd
Al Liver 1 2.1 × 10⁻¹ a nd a nd a nd
Ba Carcass 1 1.0 a
nd a
nd a
nd
Ba Liver 1 4.3 × 10⁻¹ a nd a nd a nd
Cd Carcass 1 1.0 a
nd a
nd a
nd
Cd Liver 1 2.9 a nd a nd a nd
Co Carcass 1 1.0 a
nd a
nd a
nd
Co Liver 1 2.0 a nd a nd a nd
Cr Carcass 1 1.0 a
nd a
nd a
nd
Cr Liver 1 2.0 a nd a nd a nd
Cs Carcass 1 1.0 a
nd a
nd a
nd
Cs Liver 1 2.0 a nd a nd a nd
Cs Muscle 1 1.0 a
nd a
nd a
nd
Cs Whole body 1 2.6 a nd a nd a nd
Cu Carcass 1 1.0 a
nd a
nd a
nd
Cu Liver 1 3.9 × 101 a nd a nd a nd
Mn Carcass 1 1.0 a
nd a
nd a
nd
Mn Liver 1 3.9 × 10⁻¹ a nd a nd a nd
Mo Carcass 1 1.0 a
nd a
nd a
nd
Mo Liver 1 30 a nd a nd a nd
Ni Carcass 1 1.0 a
nd a
nd a
nd
Ni Liver 1 1.5 × 10⁻¹ a nd a nd a nd
Pb Bone 5 7.0 6.9 1.2 1.8 × 101
Pb Carcass 1 1.0 a nd a nd a nd
Pb Kidney 5 7.5 6.7 1.0 1.5 × 101
Pb Liver 4 3.3 1.9 1.5 5.4
Pb Muscle 3 1.0 0.0 1.0 1.0
Pb Skin 3 1.5 4.7 × 10⁻¹ 1.1 2.0
Rb Carcass 1 1.0 a
nd a
nd a
nd
Rb Liver 1 8.0 × 10⁻¹ a nd a nd a nd
Sr Carcass 1 1.0 a
nd a
nd a
nd
Sr Liver 1 1.2 × 10⁻¹ a nd a nd a nd
Zn Carcass 1 1.0 a
nd a
nd a
nd
Zn Liver 1 8.1 × 10⁻¹ a nd a nd a nd
a Not applicable since n = 1, nd=not detemined.
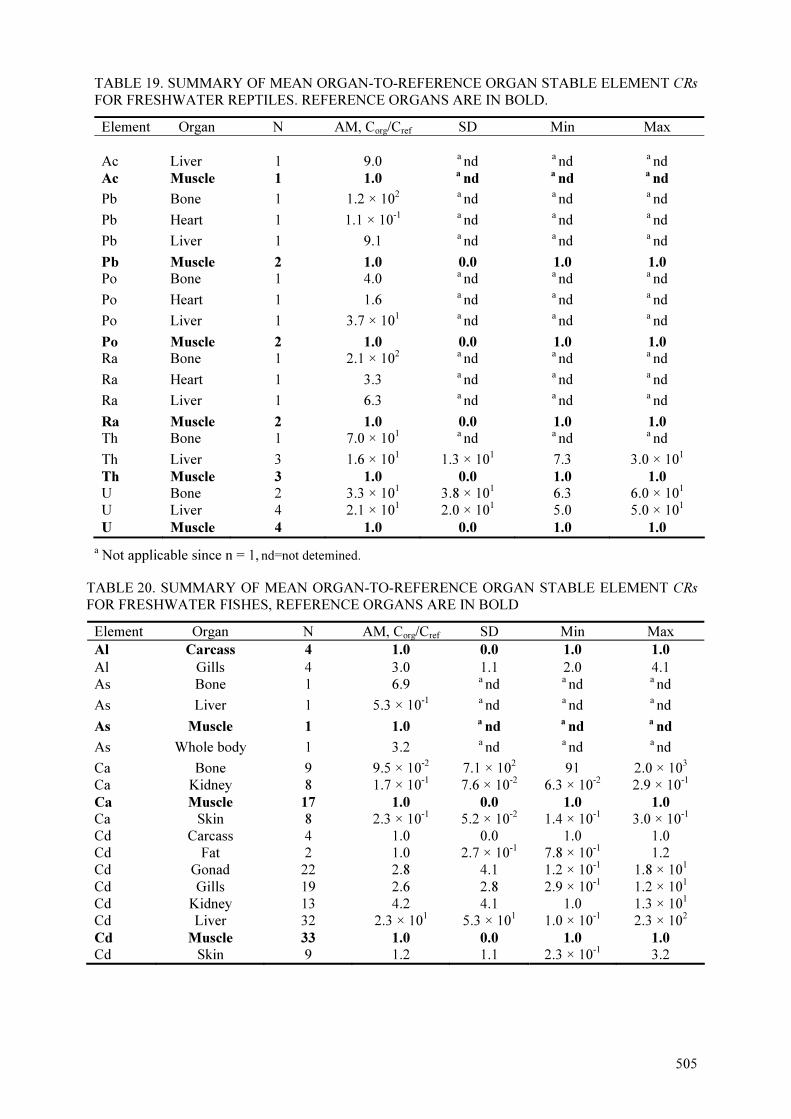
505
TABLE 19. SUMMARY OF MEAN ORGAN-TO-REFERENCE ORGAN STABLE ELEMENT CRs FOR FRESHWATER REPTILES. REFERENCE ORGANS ARE IN BOLD.
Element Organ N AM, Corg/Cref SD Min Max Ac
Liver
1
9.0
a nd
a nd
a nd
Ac Muscle 1 1.0 a
nd a
nd a
nd
Pb Bone 1 1.2 × 10² a nd a nd a nd
Pb Heart 1 1.1 × 10⁻¹ a nd a nd a nd
Pb Liver 1 9.1 a nd a nd a nd
Pb Muscle 2 1.0 0.0 1.0 1.0
Po Bone 1 4.0 a nd a nd a nd
Po Heart 1 1.6 a nd a nd a nd
Po Liver 1 3.7 × 101 a nd a nd a nd
Po Muscle 2 1.0 0.0 1.0 1.0
Ra Bone 1 2.1 × 10² a nd a nd a nd
Ra Heart 1 3.3 a nd a nd a nd
Ra Liver 1 6.3 a nd a nd a nd
Ra Muscle 2 1.0 0.0 1.0 1.0
Th Bone 1 7.0 × 101 a nd a nd a nd
Th Liver 3 1.6 × 101 1.3 × 101 7.3 3.0 × 101 Th Muscle 3 1.0 0.0 1.0 1.0
U Bone 2 3.3 × 101 3.8 × 101 6.3 6.0 × 101 U Liver 4 2.1 × 101 2.0 × 101 5.0 5.0 × 101 U Muscle 4 1.0 0.0 1.0 1.0
a Not applicable since n = 1, nd=not detemined.
TABLE 20. SUMMARY OF MEAN ORGAN-TO-REFERENCE ORGAN STABLE ELEMENT CRs FOR FRESHWATER FISHES, REFERENCE ORGANS ARE IN BOLD
Element Organ N AM, Corg/Cref SD Min Max Al Carcass 4 1.0 0.0 1.0 1.0
Al Gills 4 3.0 1.1 2.0 4.1 As Bone 1 6.9 a nd a nd a nd
As Liver 1 5.3 × 10⁻¹ a nd a nd a nd
As Muscle 1 1.0 a
nd a
nd a
nd
As Whole body 1 3.2 a nd a nd a nd
Ca Bone 9 9.5 × 10⁻² 7.1 × 10² 91 2.0 × 10³ Ca Kidney 8 1.7 × 10⁻¹ 7.6 × 10⁻² 6.3 × 10⁻² 2.9 × 10⁻¹ Ca Muscle 17 1.0 0.0 1.0 1.0
Ca Skin 8 2.3 × 10⁻¹ 5.2 × 10⁻² 1.4 × 10⁻¹ 3.0 × 10⁻¹ Cd Carcass 4 1.0 0.0 1.0 1.0 Cd Fat 2 1.0 2.7 × 10⁻¹ 7.8 × 10⁻¹ 1.2 Cd Gonad 22 2.8 4.1 1.2 × 10⁻¹ 1.8 × 101 Cd Gills 19 2.6 2.8 2.9 × 10⁻¹ 1.2 × 101 Cd Kidney 13 4.2 4.1 1.0 1.3 × 101 Cd Liver 32 2.3 × 101 5.3 × 101 1.0 × 10⁻¹ 2.3 × 10² Cd Muscle 33 1.0 0.0 1.0 1.0
Cd Skin 9 1.2 1.1 2.3 × 10⁻¹ 3.2
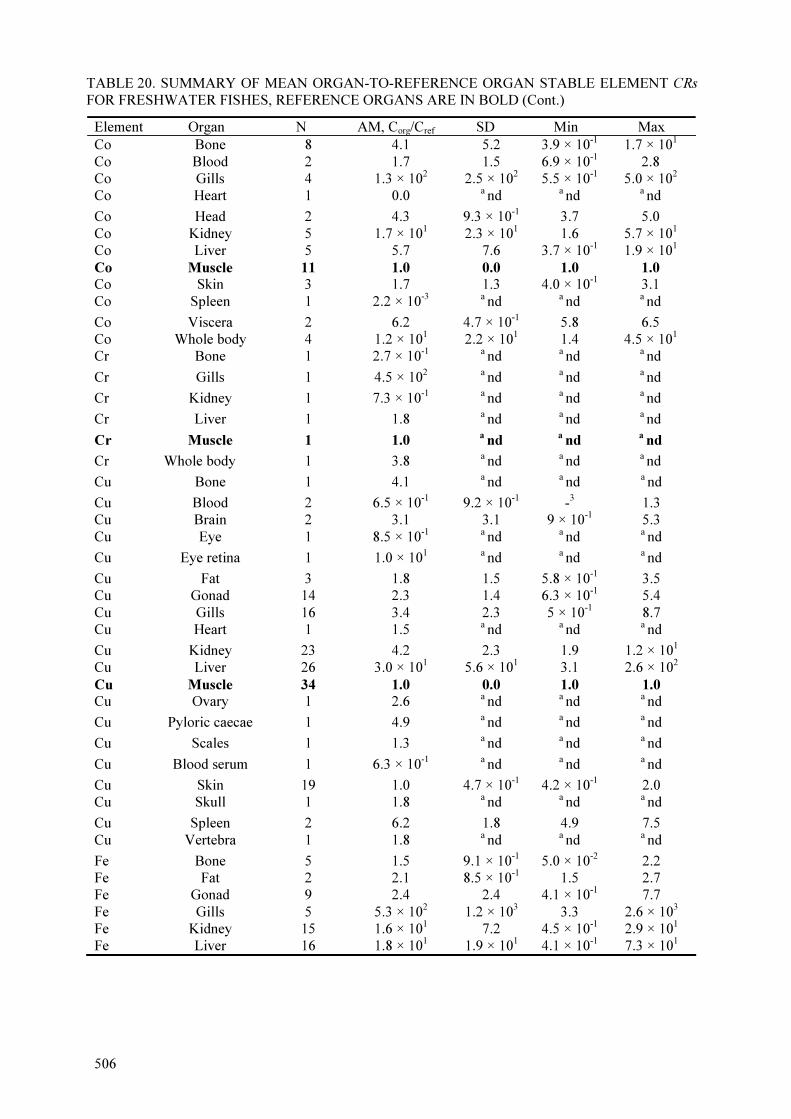
506
TABLE 20. SUMMARY OF MEAN ORGAN-TO-REFERENCE ORGAN STABLE ELEMENT CRs FOR FRESHWATER FISHES, REFERENCE ORGANS ARE IN BOLD (Cont.)
Element Organ N AM, Corg/Cref SD Min Max Co Bone 8 4.1 5.2 3.9 × 10⁻¹ 1.7 × 101 Co Blood 2 1.7 1.5 6.9 × 10⁻¹ 2.8 Co Gills 4 1.3 × 10² 2.5 × 10² 5.5 × 10⁻¹ 5.0 × 10² Co Heart 1 0.0 a nd a nd a nd
Co Head 2 4.3 9.3 × 10⁻¹ 3.7 5.0 Co Kidney 5 1.7 × 101 2.3 × 101 1.6 5.7 × 101 Co Liver 5 5.7 7.6 3.7 × 10⁻¹ 1.9 × 101 Co Muscle 11 1.0 0.0 1.0 1.0
Co Skin 3 1.7 1.3 4.0 × 10⁻¹ 3.1 Co Spleen 1 2.2 × 10⁻³ a nd a nd a nd
Co Viscera 2 6.2 4.7 × 10⁻¹ 5.8 6.5 Co Whole body 4 1.2 × 101 2.2 × 101 1.4 4.5 × 101 Cr Bone 1 2.7 × 10⁻¹ a nd a nd a nd
Cr Gills 1 4.5 × 10² a nd a nd a nd
Cr Kidney 1 7.3 × 10⁻¹ a nd a nd a nd
Cr Liver 1 1.8 a nd a nd a nd
Cr Muscle 1 1.0 a
nd a
nd a
nd
Cr Whole body 1 3.8 a nd a nd a nd
Cu Bone 1 4.1 a nd a nd a nd
Cu Blood 2 6.5 × 10⁻¹ 9.2 × 10⁻¹ -3 1.3 Cu Brain 2 3.1 3.1 9 × 10⁻¹ 5.3 Cu Eye 1 8.5 × 10⁻¹ a nd a nd a nd
Cu Eye retina 1 1.0 × 101 a nd a nd a nd
Cu Fat 3 1.8 1.5 5.8 × 10⁻¹ 3.5 Cu Gonad 14 2.3 1.4 6.3 × 10⁻¹ 5.4 Cu Gills 16 3.4 2.3 5 × 10⁻¹ 8.7 Cu Heart 1 1.5 a nd a nd a nd
Cu Kidney 23 4.2 2.3 1.9 1.2 × 101 Cu Liver 26 3.0 × 101 5.6 × 101 3.1 2.6 × 10² Cu Muscle 34 1.0 0.0 1.0 1.0
Cu Ovary 1 2.6 a nd a nd a nd
Cu Pyloric caecae 1 4.9 a nd a nd a nd
Cu Scales 1 1.3 a nd a nd a nd
Cu Blood serum 1 6.3 × 10⁻¹ a nd a nd a nd
Cu Skin 19 1.0 4.7 × 10⁻¹ 4.2 × 10⁻¹ 2.0 Cu Skull 1 1.8 a nd a nd a nd
Cu Spleen 2 6.2 1.8 4.9 7.5 Cu Vertebra 1 1.8 a nd a nd a nd
Fe Bone 5 1.5 9.1 × 10⁻¹ 5.0 × 10⁻² 2.2 Fe Fat 2 2.1 8.5 × 10⁻¹ 1.5 2.7 Fe Gonad 9 2.4 2.4 4.1 × 10⁻¹ 7.7 Fe Gills 5 5.3 × 10² 1.2 × 10³ 3.3 2.6 × 10³ Fe Kidney 15 1.6 × 101 7.2 4.5 × 10⁻¹ 2.9 × 101 Fe Liver 16 1.8 × 101 1.9 × 101 4.1 × 10⁻¹ 7.3 × 101
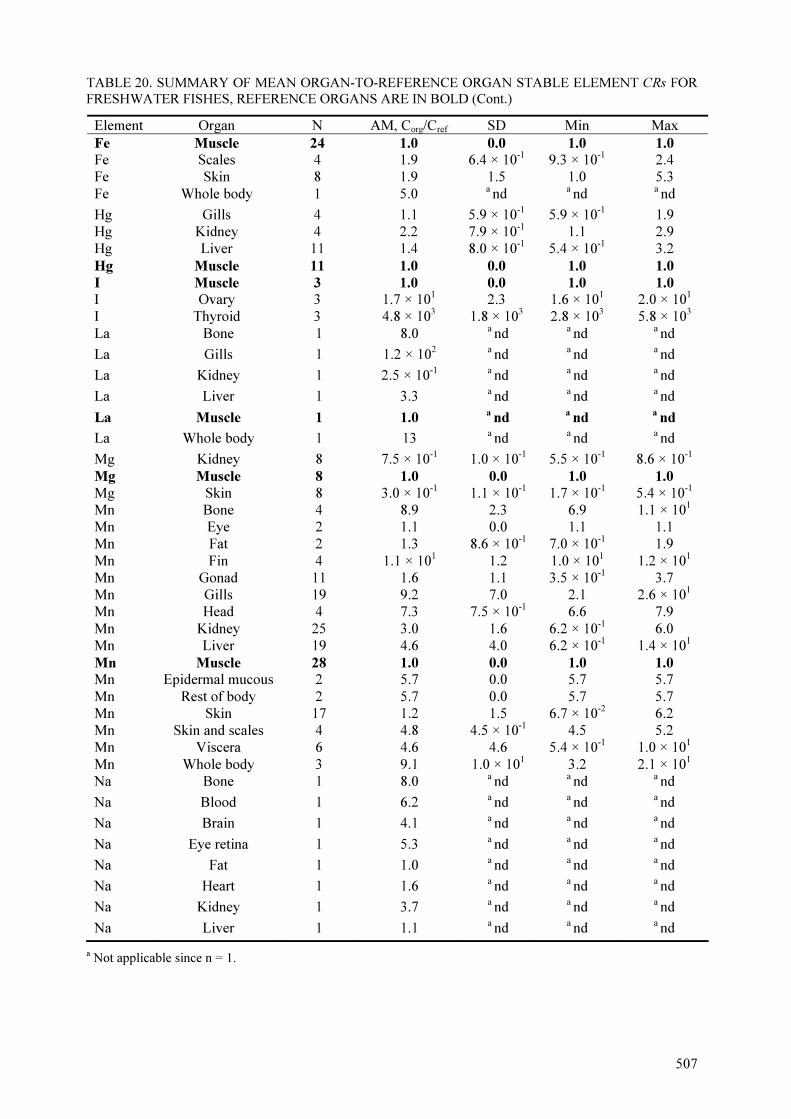
507
TABLE 20. SUMMARY OF MEAN ORGAN-TO-REFERENCE ORGAN STABLE ELEMENT CRs FOR
FRESHWATER FISHES, REFERENCE ORGANS ARE IN BOLD (Cont.)
Element Organ N AM, Corg/Cref SD Min Max Fe Muscle 24 1.0 0.0 1.0 1.0
Fe Scales 4 1.9 6.4 × 10⁻¹ 9.3 × 10⁻¹ 2.4 Fe Skin 8 1.9 1.5 1.0 5.3 Fe Whole body 1 5.0 a nd a nd a nd
Hg Gills 4 1.1 5.9 × 10⁻¹ 5.9 × 10⁻¹ 1.9 Hg Kidney 4 2.2 7.9 × 10⁻¹ 1.1 2.9 Hg Liver 11 1.4 8.0 × 10⁻¹ 5.4 × 10⁻¹ 3.2 Hg Muscle 11 1.0 0.0 1.0 1.0
I Muscle 3 1.0 0.0 1.0 1.0
I Ovary 3 1.7 × 101 2.3 1.6 × 101 2.0 × 101 I Thyroid 3 4.8 × 10³ 1.8 × 10³ 2.8 × 10³ 5.8 × 10³ La Bone 1 8.0 a nd a nd a nd
La Gills 1 1.2 × 10² a nd a nd a nd
La Kidney 1 2.5 × 10⁻¹ a nd a nd a nd
La Liver 1 3.3 a nd a nd a nd
La Muscle 1 1.0 a
nd a
nd a
nd
La Whole body 1 13 a nd a nd a nd
Mg Kidney 8 7.5 × 10⁻¹ 1.0 × 10⁻¹ 5.5 × 10⁻¹ 8.6 × 10⁻¹ Mg Muscle 8 1.0 0.0 1.0 1.0
Mg Skin 8 3.0 × 10⁻¹ 1.1 × 10⁻¹ 1.7 × 10⁻¹ 5.4 × 10⁻¹ Mn Bone 4 8.9 2.3 6.9 1.1 × 101 Mn Eye 2 1.1 0.0 1.1 1.1 Mn Fat 2 1.3 8.6 × 10⁻¹ 7.0 × 10⁻¹ 1.9 Mn Fin 4 1.1 × 101 1.2 1.0 × 101 1.2 × 101 Mn Gonad 11 1.6 1.1 3.5 × 10⁻¹ 3.7 Mn Gills 19 9.2 7.0 2.1 2.6 × 101 Mn Head 4 7.3 7.5 × 10⁻¹ 6.6 7.9 Mn Kidney 25 3.0 1.6 6.2 × 10⁻¹ 6.0 Mn Liver 19 4.6 4.0 6.2 × 10⁻¹ 1.4 × 101 Mn Muscle 28 1.0 0.0 1.0 1.0
Mn Epidermal mucous 2 5.7 0.0 5.7 5.7 Mn Rest of body 2 5.7 0.0 5.7 5.7 Mn Skin 17 1.2 1.5 6.7 × 10⁻² 6.2 Mn Skin and scales 4 4.8 4.5 × 10⁻¹ 4.5 5.2 Mn Viscera 6 4.6 4.6 5.4 × 10⁻¹ 1.0 × 101 Mn Whole body 3 9.1 1.0 × 101 3.2 2.1 × 101 Na Bone 1 8.0 a nd a nd a nd
Na Blood 1 6.2 a nd a nd a nd
Na Brain 1 4.1 a nd a nd a nd
Na Eye retina 1 5.3 a nd a nd a nd
Na Fat 1 1.0 a nd a nd a nd
Na Heart 1 1.6 a nd a nd a nd
Na Kidney 1 3.7 a nd a nd a nd
Na Liver 1 1.1 a nd a nd a nd
a Not applicable since n = 1.

508
TABLE 20. SUMMARY OF MEAN ORGAN-TO-REFERENCE ORGAN STABLE ELEMENT CRs
FOR FRESHWATER FISHES, REFERENCE ORGANS ARE IN BOLD (Cont.)
Element Organ N AM, Corg/Cref SD Min Max
Na Muscle 1 1.0 a
nd a
nd a
nd
Na Ovary 1 2.2 a na
a nd
a nd
Na Scales 1 4.5 a nd
a nd
a nd
Na Skin 1 1.3 a nd
a nd
a nd
Na Spleen 1 4.8 a nd
a nd
a nd
Ni Fat 2 6.2 × 10⁻¹
1.4 × 10⁻²
6.1 × 10⁻¹
6.3 × 10⁻¹
Ni Gonad 2 6.0 × 10⁻¹ 1.1 × 10
-26.0 × 10
-1 6.1 × 10
-1
Ni Gills 4 1.0 7.4 × 10-14.3 × 10
-1 2.1
Ni Kidney 2 1.3 4.4 × 10-19.4 × 10
-1 1.6
Ni Liver 11 2.1 1.1 3.7 × 10⁻¹ 3.5
Ni Muscle 11 1.0 0.0 1.0 1.0
P Bone 1 1.6 × 101
a nd
a nd
a nd
P Blood 1 2.0 a nd
a nd
a nd
P Brain 1 1.9 a nd
a nd
a nd
P Eye lens 1 6.3 × 10⁻¹
a nd
a nd
a nd
P Eye retina 1 2.1 a nd
a nd
a nd
P Fat 1 6.3 × 10⁻¹
a nd
a nd
a nd
P Heart 1 2.5 a nd
a nd
a nd
P Kidney 1 4.4 a nd
a nd
a nd
P Liver 1 5.5 a nd
a nd
a nd
P Muscle 1 1.0 a
nd a
nd a
nd
P Ovary 1 2.4 a nd
a nd
a nd
P Scales 1 9.9 a nd
a nd
a nd
P Skin 1 1.0 a nd
a nd
a nd
P Spleen 1 5.6 a nd
a nd
a nd
Pb Bone 11 1.5 × 101 9.5 1.0 3.1 × 10
1
Pb Brain 9 2.9 4.1 1.2 × 10⁻¹ 1.3 × 10
1
Pb Carcass 4 1.0 0.0 1.0 1.0
Pb Eye 5 1.1 8.6 × 10-11.7 × 10
-1 2.4
Pb Fat 2 8.6 × 10⁻¹ 1.1 × 10
-28.5 × 10
-1 8.7 × 10
-1
Pb Gonad 19 1.9 1.9 4.8 × 10⁻¹ 7.7
Pb Gills 52 2.4 2.0 6.3 × 10⁻¹ 1.1 × 10
1
Pb Kidney 22 2.8 × 101 5.1 × 10
1 4.4 × 10
-1 2.0 × 10
2
Pb Liver 67 3.9 1.1 × 101 0.0 8.1 × 10
1
Pb Muscle 74 1.0 0.0 1.0 1.0
Pb Ovary 9 6.3 9.6 4.2 × 10⁻¹ 2.7 × 10
1
Pb Skin 16 3.1 3.2 2.8 × 10⁻¹ 1.1 × 10
1
Pb Skin and muscle 3 2.3 1.5 1.3 4.0
Pb Spleen 9 2.5 × 101 2.8 × 10
1 1.4 7.9 × 10
1
Pb Testis 9 2.9 4.6 0.0 1.5 × 101
Pb Whole body 14 9.0 1.5 × 101 1.0 6.0 × 10
1
a Not applicable since n = 1.

509
TABLE 20. SUMMARY OF MEAN ORGAN-TO-REFERENCE ORGAN STABLE ELEMENT CRs FOR FRESHWATER FISHES, REFERENCE ORGANS ARE IN BOLD (Cont.)
Element Organ N AM, Corg/Cref SD Min Max Po Bone 6 2.3 2.6 1.7 × 10⁻¹ 6.5 Po Muscle 6 1.0 0.0 1.0 1.0
Ra Bone 17 1.5 × 101 1.2 × 101 1.0 3.3 × 101 Ra Liver 5 1.4 × 101 2.3 × 101 2.5 5.6 × 101 Ra Muscle 19 1.0 0.0 1.0 1.0
Ra Skin 7 2.3 2.8 8.7 × 10⁻¹ 8.7 Ra Skin and muscle 3 1.1 1.2 × 10⁻¹ 1.0 1.2 Ra Whole body 10 4.8 × 101 1.4 × 10² 8 × 10⁻¹ 4.4 × 10² Rb Bone 1 2.4 a nd a nd a nd
Rb Soft tissue 1 1.0 a
nd a
nd a
nd
Ru Bone 1 1.1 a nd a nd a nd
Ru General 1 58 a nd a nd a nd
Ru Gills 1 2.2 × 10² a nd a nd a nd
Ru Muscle 3 1.0 0.0 0.0 1.0
Ru Viscera 1 4.4 × 10² a nd a nd a nd
Ru Whole body 3 8.3 × 101 2.9 × 101 5.0 × 101 1.0 × 10² Sc Bone 2 1.1 × 101 1.5 × 101 0.0 2.1 × 101 Sc Blood 1 7.7 a nd a nd a nd
Sc Brain 1 0.0 a nd a nd a nd
Sc Eye lens 1 0.0 a nd a nd a nd
Sc Eye retina 1 0.0 a nd a nd a nd
Sc Fat 1 0.43 a nd a nd a nd
Sc Gills 1 460 a nd a nd a nd
Sc Heart 1 0.0 a nd a nd a nd
Sc Kidney 2 9.2 × 10⁻¹ 1.3 0.0 1.8 Sc Liver 2 3.2 4.6 0.0 6.4 Sc Muscle 2 1.0 0.0 1.0 1.0
Sc Ovary 1 0.0 a nd a nd a nd
Sc Scales 1 0.0 a nd a nd a nd
Sc Skin 1 1.0 a nd a nd a nd
Sc Spleen 1 6.7 a nd a nd a nd
Sc Whole body 1 3.0 × 101 a nd a nd a nd
Sr air bladder 1 5.6 a nd a nd a nd
Sr bone 7 2.9 × 10² 3.9 × 10² 7.2 × 101 1.1 × 10³ Sr blood 1 3.9 a nd a nd a nd
Sr fin 1 1.2 × 10² a nd a nd a nd
Sr gonad 1 1.1 a nd a nd a nd
Sr gall bladder 1 2.1 a nd a nd a nd
Sr gills 1 1.5 × 10² a nd a nd a nd
Sr heart 1 3.6 a nd a nd a nd
Sr kidney 1 3.3 a nd a nd a nd
Sr liver 1 2.9 a nd a nd a nd
a Not applicable since n = 1, nd=not detemined.
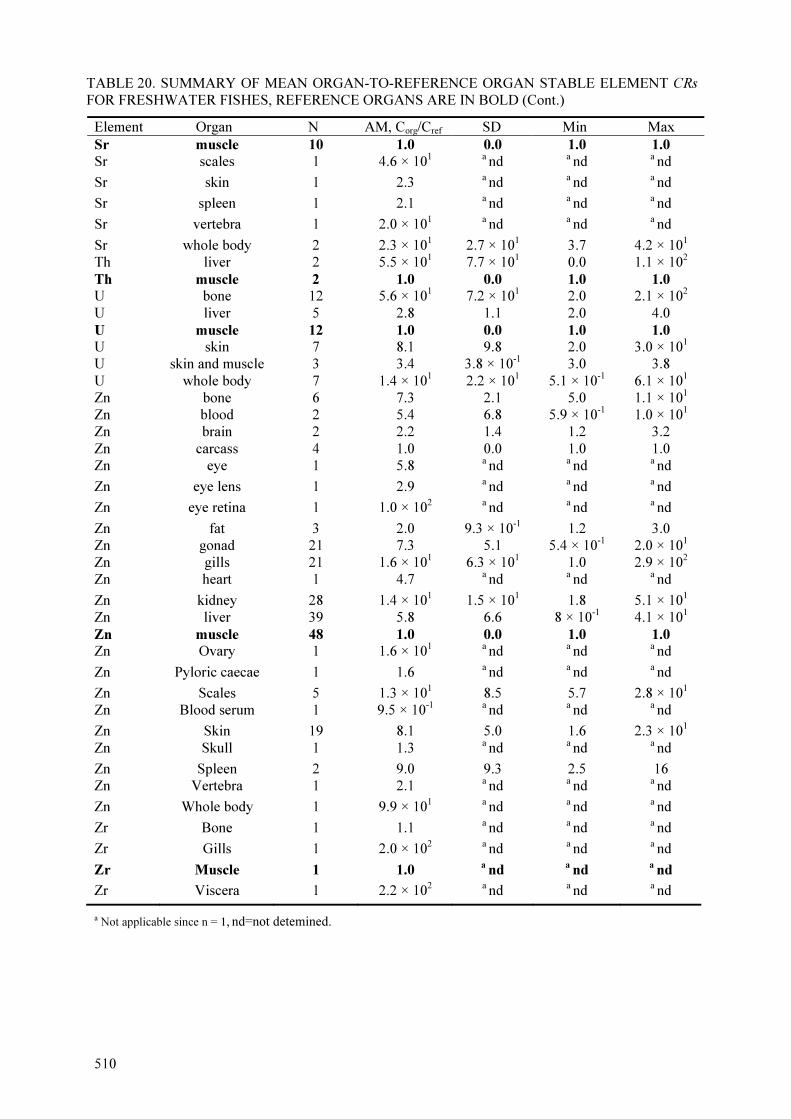
510
TABLE 20. SUMMARY OF MEAN ORGAN-TO-REFERENCE ORGAN STABLE ELEMENT CRs FOR FRESHWATER FISHES, REFERENCE ORGANS ARE IN BOLD (Cont.)
Element Organ N AM, Corg/Cref SD Min Max Sr muscle 10 1.0 0.0 1.0 1.0
Sr scales 1 4.6 × 101 a nd a nd a nd
Sr skin 1 2.3 a nd a nd a nd
Sr spleen 1 2.1 a nd a nd a nd
Sr vertebra 1 2.0 × 101 a nd a nd a nd
Sr whole body 2 2.3 × 101 2.7 × 101 3.7 4.2 × 101 Th liver 2 5.5 × 101 7.7 × 101 0.0 1.1 × 10² Th muscle 2 1.0 0.0 1.0 1.0
U bone 12 5.6 × 101 7.2 × 101 2.0 2.1 × 10² U liver 5 2.8 1.1 2.0 4.0 U muscle 12 1.0 0.0 1.0 1.0
U skin 7 8.1 9.8 2.0 3.0 × 101 U skin and muscle 3 3.4 3.8 × 10⁻¹ 3.0 3.8 U whole body 7 1.4 × 101 2.2 × 101 5.1 × 10⁻¹ 6.1 × 101 Zn bone 6 7.3 2.1 5.0 1.1 × 101 Zn blood 2 5.4 6.8 5.9 × 10⁻¹ 1.0 × 101 Zn brain 2 2.2 1.4 1.2 3.2 Zn carcass 4 1.0 0.0 1.0 1.0 Zn eye 1 5.8 a nd a nd a nd
Zn eye lens 1 2.9 a nd a nd a nd
Zn eye retina 1 1.0 × 10² a nd a nd a nd
Zn fat 3 2.0 9.3 × 10⁻¹ 1.2 3.0 Zn gonad 21 7.3 5.1 5.4 × 10⁻¹ 2.0 × 101 Zn gills 21 1.6 × 101 6.3 × 101 1.0 2.9 × 10² Zn heart 1 4.7 a nd a nd a nd
Zn kidney 28 1.4 × 101 1.5 × 101 1.8 5.1 × 101 Zn liver 39 5.8 6.6 8 × 10⁻¹ 4.1 × 101 Zn muscle 48 1.0 0.0 1.0 1.0
Zn Ovary 1 1.6 × 101 a nd a nd a nd
Zn Pyloric caecae 1 1.6 a nd a nd a nd
Zn Scales 5 1.3 × 101 8.5 5.7 2.8 × 101 Zn Blood serum 1 9.5 × 10⁻¹ a nd a nd a nd
Zn Skin 19 8.1 5.0 1.6 2.3 × 101 Zn Skull 1 1.3 a nd a nd a nd
Zn Spleen 2 9.0 9.3 2.5 16 Zn Vertebra 1 2.1 a nd a nd a nd
Zn Whole body 1 9.9 × 101 a nd a nd a nd
Zr Bone 1 1.1 a nd a nd a nd
Zr Gills 1 2.0 × 10² a nd a nd a nd
Zr Muscle 1 1.0 a
nd a
nd a
nd
Zr Viscera 1 2.2 × 10² a nd a nd a nd
a Not applicable since n = 1, nd=not detemined.

511
TABLE 21. SUMMARY OF MEAN ORGAN-TO-REFERENCE ORGAN STABLE ELEMENT CRs FOR EELS, REFERENCE ORGANS ARE IN BOLD
Element Organ N AM, Corg/Cref SD Min Max Ca Bone 1 26 a nd a nd a nd Ca Muscle 1 1.0
a
nd a
nd a
nd
Cd Brain 3 1.5 1.0 8.3 × 10⁻¹ 2.7 Cd Gill 4 4.7 3.8 1.2 10 Cd Heart 3 8.1 × 10⁻¹ 2.4 × 10⁻¹ 6.5 × 10⁻¹ 1.1 Cd Kidney 3 5.0 2.1 2.8 6.9 Cd Liver 4 8.1 1.1 × 101 1.1 2.5 × 101 Cd Muscle 4 1.0 0.0 1.0 1.0
Cd Skin 1 2.0 a nd a nd a nd
Cd Whole body 1 2.7 a nd a nd a nd
Cu Brain 1 2.0 × 10⁻¹ a nd a nd a nd
Cu Gill 1 4.0 a nd a nd a nd
Cu Heart 1 8.0 a nd a nd a nd
Cu Kidney 1 4.0 a nd a nd a nd
Cu Liver 1 1.6 × 101 a nd a nd a nd
Cu Muscle 1 1.0 a
nd a
nd a
nd
Hg Gill 1 5.0 a nd a nd a nd
Hg Liver 1 3.6 a nd a nd a nd
Hg Muscle 1 1.0 a
nd a
nd a
nd
Hg Skin 1 1.4 a nd a nd a nd
Hg Whole body 1 1.1 a nd a nd a nd
Sr Bone 1 4.7 × 101 a nd a nd a nd
Sr Muscle 1 1.0 a
nd a
nd a
nd
Zn Brain 1 1.7 × 101 a nd a nd a nd
Zn Gill 1 1.3 a nd a nd a nd
Zn Heart 1 1.8 a nd a nd a nd
Zn Kidney 1 1.8 a nd a nd a nd
Zn Liver 1 1.9 a nd a nd a nd
Zn Muscle 1 1.0 a
nd a
nd a
nd
aNot applicable since n = 1, nd=not detemined.
.TABLE 32. SUMMARY OF MEAN ORGAN-TO-REFERENCE ORGAN STABLE ELEMENT CRs, FOR MIGRATORY BIRDS. REFERENCE ORGANS ARE IN BOLD.
Element Organ N AM, Corg/Cref SD Min Max
Cs Bone 10 1.0 0.0 1.0 1.0
Cs Liver 3 3.1 4.1 × 10⁻¹ 2.8 3.6
Cs Muscle 9 2.7 1.5 1.0 5.1
Pb Bone 11 1.0 0.0 1.0 1.0
Pb Liver 11 2.4 × 10⁻¹ 1.7 × 10⁻¹ 8.3 × 10⁻² 6.7 × 10⁻¹

512
4. CONCLUSIONS
The paper that has been compiled on radionuclide transfer to freshwater edible biota is much
more comprehensive than the information that had been provided in the 1994 version of
Technical Reports Series No. 364. In addition to radionuclide water-to-muscle transfer to
freshwater fishes, which was covered in the 1994 Technical Reports Series No. 364 report, the
updated information also includes transfer from water to whole fishes, distinguishing
benthivorous (sediment-dwelling) fish species, forage fishes and piscivorous fishes. In
addition, new tables of water-to-edible aquatic primary producers (including algae, floating-
leafed and emergent plant tissues); water-to-edible freshwater invertebrate tissues (including
generic invertebrate, crustacean and mollusc tissues); and water-to-freshwater herpetofauna
(including tadpoles, frogs and reptiles) have been added to provide a more comprehensive
representation of transfer to edible freshwater plant and animal tissues. New tables of
sediment-to-biota transfer factors have been compiled for fishes and invertebrates. Finally,
data on the relative masses of tissues in a range of freshwater biota were compiled, along with
a comparison in radionuclide and stable analogue concentrations in each tissue type were
provided to facilitate estimation of radionuclide levels in edible tissues where data gaps
existed.
Although, a number of additions have been included in the revised Technical Reports Series
No. 364 chapter on transfer to edible freshwater biota, it is clear that the amount of data
available is not uniform between radionuclides or types of edible plants and animals. For
example, although a relatively large pool of data exists for such radionuclides as Cs, Sr or Co;
much fewer data exist for many other radionuclides or their analogues. In addition, relatively
few data are available for edible species of herpetofauna and invertebrates for many
radionuclides.
The information that has been compiled in this paper is focused on steady state radionuclide
transfer, although it would be useful to compile relevant data on dynamic parameters, as well
as ecological half-lives of radionuclides in edible biota, in the future. Further work is also
required to gain a better understanding of the factors that influence radionuclide transfer to
edible biota, particularly for less well-studied species (such as invertebrates, herpetofauna,
aquatic mammals and waterfowl), for less well-studied radionuclides, as well as for types of
biota that show wide ranges of radionuclide transfer factors.
REFERENCES
[1] BUNNEY, S., The Illustrated Book of Herbs: Their Medicinal and Culinary Uses, Octopus
Books, London (1986). [2] CROPKING AQUACULTURE AND AQUAPONICS, Tilapia: Aquatic chicken, American
Small Farm (1997), http://www.cropking.com/tilapia.shtml
[3] FOOD AND AGRICULTURE ORGANIZATION OF THE UNITED NATIONS, Aquaculture: Not just an export industry (2003), http://www.fao.org/
english/newsroom/focus/2003/aquaculture.htm [4] FOOD AND AGRICULTURE ORGANIZATION OF THE UNITED NATIONS, The State of
World Fisheries and Aquaculture 2002 (2002), http://www.fao.org/
documents/show_cdr.asp?url_file=/docrep/005/y7300e/y7300e00.htm [5] FOOD AND AGRICULTURE ORGANIZATION OF THE UNITED NATIONS, The State of
World Fisheries and Aquaculture (1996-2006), http://www.fao.org/sof/sofia/index_en.htm
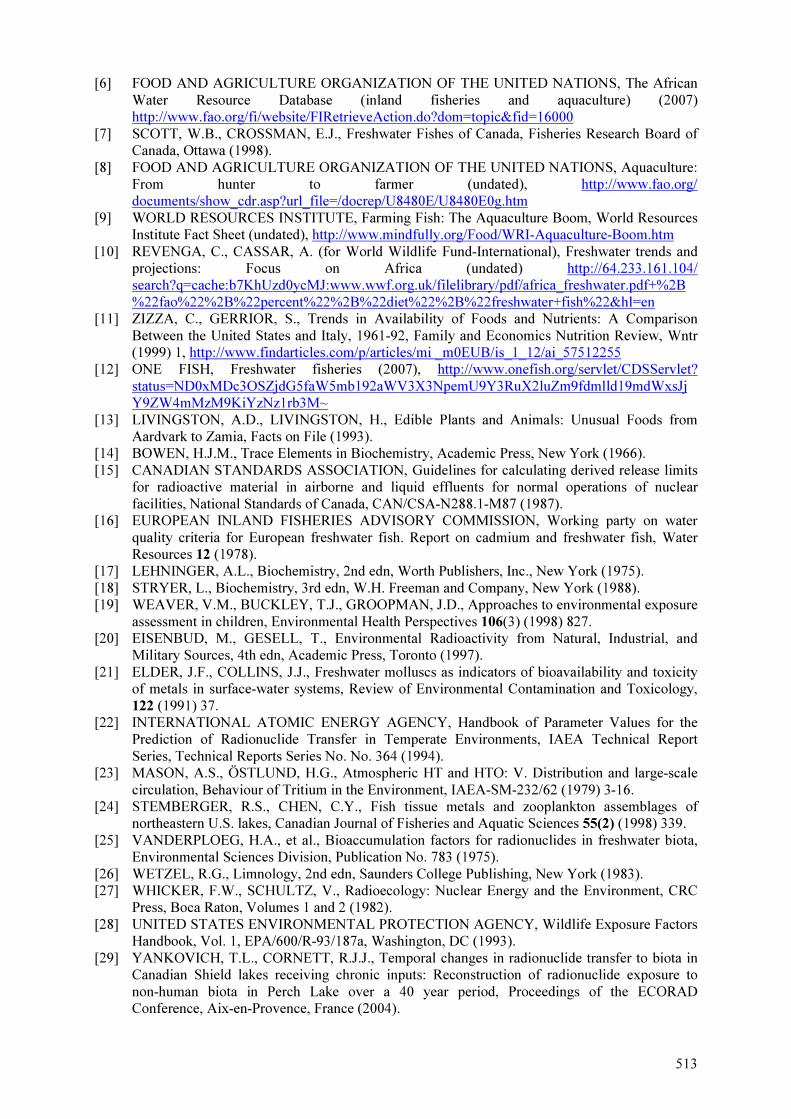
513
[6] FOOD AND AGRICULTURE ORGANIZATION OF THE UNITED NATIONS, The African Water Resource Database (inland fisheries and aquaculture) (2007) http://www.fao.org/fi/website/FIRetrieveAction.do?dom=topic&fid=16000
[7] SCOTT, W.B., CROSSMAN, E.J., Freshwater Fishes of Canada, Fisheries Research Board of Canada, Ottawa (1998).
[8] FOOD AND AGRICULTURE ORGANIZATION OF THE UNITED NATIONS, Aquaculture: From hunter to farmer (undated), http://www.fao.org/ documents/show_cdr.asp?url_file=/docrep/U8480E/U8480E0g.htm
[9] WORLD RESOURCES INSTITUTE, Farming Fish: The Aquaculture Boom, World Resources Institute Fact Sheet (undated), http://www.mindfully.org/Food/WRI-Aquaculture-Boom.htm
[10] REVENGA, C., CASSAR, A. (for World Wildlife Fund-International), Freshwater trends and projections: Focus on Africa (undated) http://64.233.161.104/ search?q=cache:b7KhUzd0ycMJ:www.wwf.org.uk/filelibrary/pdf/africa_freshwater.pdf+%2B%22fao%22%2B%22percent%22%2B%22diet%22%2B%22freshwater+fish%22&hl=en
[11] ZIZZA, C., GERRIOR, S., Trends in Availability of Foods and Nutrients: A Comparison Between the United States and Italy, 1961-92, Family and Economics Nutrition Review, Wntr (1999) 1, http://www.findarticles.com/p/articles/mi _m0EUB/is_1_12/ai_57512255
[12] ONE FISH, Freshwater fisheries (2007), http://www.onefish.org/servlet/CDSServlet? status=ND0xMDc3OSZjdG5faW5mb192aWV3X3NpemU9Y3RuX2luZm9fdmlld19mdWxsJjY9ZW4mMzM9KiYzNz1rb3M~
[13] LIVINGSTON, A.D., LIVINGSTON, H., Edible Plants and Animals: Unusual Foods from Aardvark to Zamia, Facts on File (1993).
[14] BOWEN, H.J.M., Trace Elements in Biochemistry, Academic Press, New York (1966). [15] CANADIAN STANDARDS ASSOCIATION, Guidelines for calculating derived release limits
for radioactive material in airborne and liquid effluents for normal operations of nuclear facilities, National Standards of Canada, CAN/CSA-N288.1-M87 (1987).
[16] EUROPEAN INLAND FISHERIES ADVISORY COMMISSION, Working party on water quality criteria for European freshwater fish. Report on cadmium and freshwater fish, Water Resources 12 (1978).
[17] LEHNINGER, A.L., Biochemistry, 2nd edn, Worth Publishers, Inc., New York (1975). [18] STRYER, L., Biochemistry, 3rd edn, W.H. Freeman and Company, New York (1988). [19] WEAVER, V.M., BUCKLEY, T.J., GROOPMAN, J.D., Approaches to environmental exposure
assessment in children, Environmental Health Perspectives 106(3) (1998) 827. [20] EISENBUD, M., GESELL, T., Environmental Radioactivity from Natural, Industrial, and
Military Sources, 4th edn, Academic Press, Toronto (1997). [21] ELDER, J.F., COLLINS, J.J., Freshwater molluscs as indicators of bioavailability and toxicity
of metals in surface-water systems, Review of Environmental Contamination and Toxicology, 122 (1991) 37.
[22] INTERNATIONAL ATOMIC ENERGY AGENCY, Handbook of Parameter Values for the Prediction of Radionuclide Transfer in Temperate Environments, IAEA Technical Report Series, Technical Reports Series No. No. 364 (1994).
[23] MASON, A.S., ÖSTLUND, H.G., Atmospheric HT and HTO: V. Distribution and large-scale circulation, Behaviour of Tritium in the Environment, IAEA-SM-232/62 (1979) 3-16.
[24] STEMBERGER, R.S., CHEN, C.Y., Fish tissue metals and zooplankton assemblages of northeastern U.S. lakes, Canadian Journal of Fisheries and Aquatic Sciences 55(2) (1998) 339.
[25] VANDERPLOEG, H.A., et al., Bioaccumulation factors for radionuclides in freshwater biota, Environmental Sciences Division, Publication No. 783 (1975).
[26] WETZEL, R.G., Limnology, 2nd edn, Saunders College Publishing, New York (1983). [27] WHICKER, F.W., SCHULTZ, V., Radioecology: Nuclear Energy and the Environment, CRC
Press, Boca Raton, Volumes 1 and 2 (1982). [28] UNITED STATES ENVIRONMENTAL PROTECTION AGENCY, Wildlife Exposure Factors
Handbook, Vol. 1, EPA/600/R-93/187a, Washington, DC (1993). [29] YANKOVICH, T.L., CORNETT, R.J.J., Temporal changes in radionuclide transfer to biota in
Canadian Shield lakes receiving chronic inputs: Reconstruction of radionuclide exposure to non-human biota in Perch Lake over a 40 year period, Proceedings of the ECORAD Conference, Aix-en-Provence, France (2004).

514
[30] YANKOVICH, T.L., et al., Preliminary screening of aquatic macrophytes as biomonitors in environmental risk assessment of nuclear facilities: An ecosystem approach. Proceedings of the 2nd International Symposium on Ionizing Radiation: Environmental protection approaches for nuclear facilities (2001).
[31] UNITED STATES ENVIRONMENTAL PROTECTION AGENCY, National sediment quality survey, EPA-823-C-01-001 (2001).
[32] NATIONAL COUNCIL ON RADIOLOGICAL PROTECTION, Screening models for releases of radionuclides to atmosphere, surface water, and ground: Recommendations of the National Council on Radiological Protection and Measurements, (1996).
[33] OPHEL, I.L., The fate of radiostrontium in a freshwater community, Radioecology, Reinhold Publishing Corporation, New York, (1976) 213-216.
[34] OPHEL, I.M., JUDD, J.M., Sr–Ca relationships in aquatic food chains, Proceedings of the Second National Symposium on Radioecology, US AEC Tech. Inf. Cent., Oak Ridge National Lab., Oak Ridge, TN. CONF-670503 (1967) 221–225.
[35] BLAYLOCK, B.G., Radionuclide data base available for bioaccumulation factors for freshwater biota, Nuclear Safety 23 (1982) 427.
[36] ROWAN, D.J., RASMUSSEN, J.B., Bioaccumulation of radiocaesium by fish: The influence of physicochemical factors and trophic structure, Canadian Journal of Fisheries and Aquatic Sciences 51 (1994) 2388–2410.
[37] SMITH, J.T., et al., Radiocaesium concentration factors of Chernobyl-contaminated fish: a study of the influence of potassium, and "blind" testing of a previously developed model, Journal of Environmental Radioactivity 48 (2000) 359.
[38] YANKOVICH, T.L., BEATON, D., Concentration ratios of stable elements measured in organs of terrestrial, freshwater and marine non-human biota for input into internal dose assessment for PSL-2: A literature review, COG-99-106-I (2000).
[39] YANKOVICH, T.L., Conceptual development of Reference Plant, Fish and Amphibian with recommendations on the establishment of approaches to improve estimates of internal dose to non-human biota, COG-00-129 (2001).
[40] YANKOVICH, T.L., Towards an improved ability to estimate internal dose to non-human biota: Development of conceptual models for reference non-human biota, Third International Symposium on the Protection of the Environment from Ionizing Radiation, Darwin, (2002).
[41] CANLI, M., KARGIN, F., A comparative study on heavy metals (Cd, Cr, Pb and Ni) accumulation in the tissue of the carp Cyprinus carpio and the nile fish Tilapia nilotica, Tr. J. of Zool. 19 (1995) 165
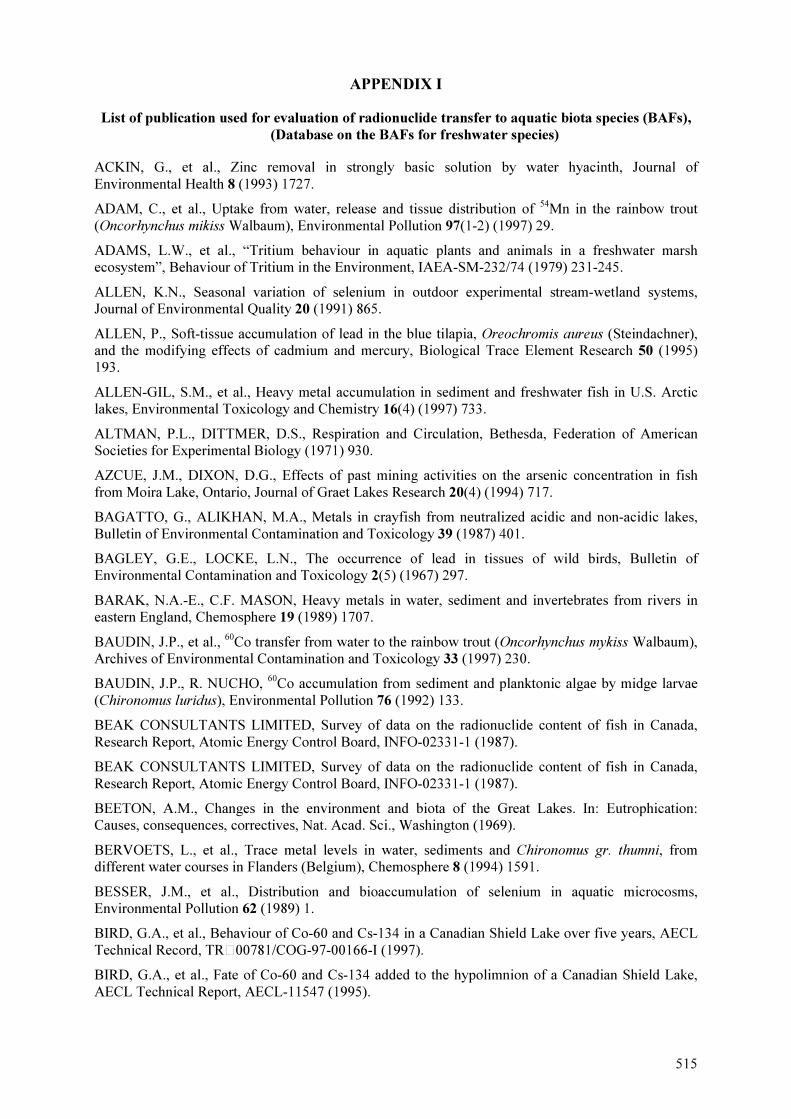
515
APPENDIX I
List of publication used for evaluation of radionuclide transfer to aquatic biota species (BAFs),
(Database on the BAFs for freshwater species)
ACKIN, G., et al., Zinc removal in strongly basic solution by water hyacinth, Journal of Environmental Health 8 (1993) 1727.
ADAM, C., et al., Uptake from water, release and tissue distribution of 54Mn in the rainbow trout (Oncorhynchus mikiss Walbaum), Environmental Pollution 97(1-2) (1997) 29.
ADAMS, L.W., et al., “Tritium behaviour in aquatic plants and animals in a freshwater marsh ecosystem”, Behaviour of Tritium in the Environment, IAEA-SM-232/74 (1979) 231-245.
ALLEN, K.N., Seasonal variation of selenium in outdoor experimental stream-wetland systems, Journal of Environmental Quality 20 (1991) 865.
ALLEN, P., Soft-tissue accumulation of lead in the blue tilapia, Oreochromis aureus (Steindachner), and the modifying effects of cadmium and mercury, Biological Trace Element Research 50 (1995) 193.
ALLEN-GIL, S.M., et al., Heavy metal accumulation in sediment and freshwater fish in U.S. Arctic lakes, Environmental Toxicology and Chemistry 16(4) (1997) 733.
ALTMAN, P.L., DITTMER, D.S., Respiration and Circulation, Bethesda, Federation of American Societies for Experimental Biology (1971) 930.
AZCUE, J.M., DIXON, D.G., Effects of past mining activities on the arsenic concentration in fish from Moira Lake, Ontario, Journal of Graet Lakes Research 20(4) (1994) 717.
BAGATTO, G., ALIKHAN, M.A., Metals in crayfish from neutralized acidic and non-acidic lakes, Bulletin of Environmental Contamination and Toxicology 39 (1987) 401.
BAGLEY, G.E., LOCKE, L.N., The occurrence of lead in tissues of wild birds, Bulletin of Environmental Contamination and Toxicology 2(5) (1967) 297.
BARAK, N.A.-E., C.F. MASON, Heavy metals in water, sediment and invertebrates from rivers in eastern England, Chemosphere 19 (1989) 1707.
BAUDIN, J.P., et al., 60Co transfer from water to the rainbow trout (Oncorhynchus mykiss Walbaum), Archives of Environmental Contamination and Toxicology 33 (1997) 230.
BAUDIN, J.P., R. NUCHO, 60Co accumulation from sediment and planktonic algae by midge larvae (Chironomus luridus), Environmental Pollution 76 (1992) 133.
BEAK CONSULTANTS LIMITED, Survey of data on the radionuclide content of fish in Canada, Research Report, Atomic Energy Control Board, INFO-02331-1 (1987).
BEAK CONSULTANTS LIMITED, Survey of data on the radionuclide content of fish in Canada, Research Report, Atomic Energy Control Board, INFO-02331-1 (1987).
BEETON, A.M., Changes in the environment and biota of the Great Lakes. In: Eutrophication: Causes, consequences, correctives, Nat. Acad. Sci., Washington (1969).
BERVOETS, L., et al., Trace metal levels in water, sediments and Chironomus gr. thumni, from different water courses in Flanders (Belgium), Chemosphere 8 (1994) 1591.
BESSER, J.M., et al., Distribution and bioaccumulation of selenium in aquatic microcosms, Environmental Pollution 62 (1989) 1.
BIRD, G.A., et al., Behaviour of Co-60 and Cs-134 in a Canadian Shield Lake over five years, AECL Technical Record, TR�00781/COG-97-00166-I (1997).
BIRD, G.A., et al., Fate of Co-60 and Cs-134 added to the hypolimnion of a Canadian Shield Lake, AECL Technical Report, AECL-11547 (1995).

516
BIRD, G.A., et al., Fate of Co-60 and Cs-134 added to the hypolimnion of a Canadian Shield Lake: Accumulation in biota, Canadian Journal of Fisheries and Aquatic Sciences 55 (1998) 987.
BIRD, G.A., Schwartz, W., Nuclides concentration factors for freshwater biota, TR�703, COG-95-397 (1996).
BLAGOEVA, R., Résultats du programme de serveillance radiologique de l’environnement du Site de Gentilly: Rapports Annuel 1995, Hydro-Québec, G2-RT-96-06 (1996).
BLAGOEVA, R., Résultats du programme de serveillance radiologique de l’environnement du Site de Gentilly: Rapports Annuel 1996, Hydro-Québec, G2-RT-97-20 (1997).
BLAYLOCK, B.G., et al., “Behaviour of technetium in freshwater environments”, Scientific Seminar on the Behaviour of Technetium in the Environment, Cadarache, France. CONF-8410157-1 (1984).
BLAYLOCK, B.G., Frank, M.L., 1982. “Bioaccumulation and distribution of 95mTc in an experimental freshwater pond” Environmental Migration of Long-lived Radionuclides, Proc. Symp. Knoxville, IAEA, (1982).
BLAYLOCK, B.G., Radionuclide data base available for bioaccumulation factors for freshwater biota, Nuclear Safety 23 (1982) 427.
BORGMANN, U., et al., Relationship between chronic toxicity and bioaccumulation of cadmium in Hyallela azteca, Canadian Journal of Fisheries and Aquatic Sciences 48 (1991) 1055.
BOWEN, H.J.M., Trace Elements in Biochemistry, Academic Press, New York (1966).
BOWEN, V.T., Plutonium and americium concentration along freshwater food chains of the Great Lakes, U.S.A. General Summary of Progress 1973 – 1974, USAEC Report COO-3568-4, Woods Hole Oceanographic Institution (1974).
BRODY, S., Bioenergetics and Growth, Baltimore, Maryland, Reinhold (1945) 1023.
BUNNEY, S., The Illustrated Book of Herbs: Their Medicinal and Culinary Uses, Octopus Books Ltd., London (1986) 320.
CAMPBELL, P.G.C., et al., Biologically Available Metals in Sediments, NRCC No. 27694 (1988) 298.
CANADIAN STANDARDS ASSOCIATION, Guidelines for calculating derived release limits for radioactive material in airborne and liquid effluents for normal operations of nuclear facilities, National Standards of Canada, CAN/CSA-N288.1-M87 (1987).
CANLI, M., KARGIN, F., A comparative study on heavy metals (Cd, Cr, Pb and Ni) accumulation in the tissue of the carp Cyprinus carpio and the nile fish Tilapia nilotica, Trurkish Journal of Zoology 19 (1995) 165.
CARLSSON, S. LIDÉN, K., 137Cs and potassium in fish and littoral plants from humus-rich oligotrophic lake 1961-1976, Oikos, 30 (1978) 128.
CASTRO, H.T., Uptake and distribution of technetium-99 by channel catfish Ictalurus punctatus (Rafinesque), Dissertation, Purdue University, West Lafayette, Indiana (1975) 105.
CHANT, L., et al., Site-specific aquatic transfer factors for CANDU sites in Canada, RC-2457 (2000).
CHAPMAN, W., et al., Concentration factors of chemical elements in edible aquatic organisms, UCRL-50564. Lawrence Radiation Laboratory, University of California, Livermore, California (1968).
CLULOW, V., Radionuclides in fish, water, and sediments of the Serpent River basin: 210Pb, 210Po, 230Th and 232Th, thorium and uranium. AECB Project No. 5.127.2 (1995).
COPELAND, R.A., AYERS, J.C., Trace element distributions in water, sediment, phytoplankton, zooplankton and benthos of Lake Michigan: A baseline study with calculations of concentration factors and buildup of radioisotopes in the food web, ERG Special Report No. 1 (1972).

517
COPELAND, R.A., et al., Trace element distributions in Lake Michigan fish: a baseline study with calculations of concentration factors and equilibrium radioisotope distributions, Environmental Research Group, Inc., Ann Arbor, MI (1973).
COUGHTREY, P.J., THORNE, M.C., Radionuclide Distribution and Transport in Terrestrial and Aquatic Ecosystems: A Critical Review of Data, Volume Two. A. A. Balkema, Rotterdam (1983).
COUGHTREY, P.J., THORNE, M.C., Radionuclide Distribution and Transport in Terrestrial and Aquatic Ecosystems: A Critical Review of Data, Volume 1, A.A. Balkema, Rotterdam (1983) 496.
COWX, I.G., Concentrations of heavy metals in the tissues of trout Salmo trutta and char Salvelinus
alpinus from two lakes in North Wales, Environmental Pollution (Series A) 29 (1982) 101.
CRILE, G., QUIRING, D.P., A record of the body weight and certain organ and gland weights of 3,690 animals, Ohio Journal of Science 40 (1940) 219.
CROPKING AQUACULTURE AND AQUAPONICS, Tilapia: Aquatic chicken, American Small Farm (1997), http://www.cropking.com/tilapia.shtml
CROSSLEY, D.A., Jr., “Movement and accumulation of radiostrontium and radiocesium in insects”, Radioecology, Reinhold, New York (1963).
CROWDER, A., et al., Metal contamination in sediments and biota of the Bay of Quinte, Lake Ontario, Canada, Hydrobiologia, 188/189 (1989) 337.
CUSHING, C.E., WATSON, D.G., “Cycling of zinc-65 in a simple food-web”, Radionuclides in Ecosystems. Proceedings of the Third National Symposium on Radioecology, Oak Ridge, Tennesse, 1 (1971) 318-322.
DABROWSKI, K., et al., Rapeseed meal in the diet for common carp reared in heated waters. III. Metal concentration in tissues, Zeitschrift fuer Tierphysiologie, Tierernaehrung und Futtermittelkunde
46 (1981) 273.
DAHLMAN, R.C., et al., “Biological pathways and chemical behavior of plutonium and other actinides in the environment”, Actinides in the Environment, American Chemical Society, Symposium Series 35, American Chemical Society, Washington, DC (1976).
DAVIS, J.J., Dispersion of radioactive materials by streams, Journal of American Water Works Associacion 50 (1958) 1501.
DAVIS, J.J., et al., 1958. “Radioactive materials in aquatic and terrestrial organisms exposed to reactor effluent water”, Proceedings of the Second United Nations International Conference on the Peaceful Uses of Atomic Energy, Geneva, 18 (1958) 423-428.
DeBORTOLI, M., et al., Concentration factors for strontium and cesium in fish of the lakes in the region of Varese (Northern Italy) Minerva, Fisiconuclear, 11 (1967) 324.
DeBORTOLI, M., et al., Environmental Radioactivity Report, Ispra 1966, European Report, EUR-3554e (N67-38278), NTIS (1967).
DEPARTMENT OF NATURAL RESOURCES, Heavy metals in surface waters, sediments and fish in Michigan, Michigan Water Resources Commission, Bureau of Water Management, DNR, State of Michigan, (1972).
DION, E., Résultats du programme de serveillance radiologique de l’environnement du Site de Gentilly: Rapports Annuel 1997, Hydro-Québec, G2-RT-98-05 (1998).
DION, E., Résultats du programme de serveillance radiologique de l’environnement du Site de Gentilly: Rapports Annuel 1998, Hydro-Québec, G2-RT-99-06 (1999).
DION, E., Résultats du programme de serveillance radiologique de l’environnement du Site de Gentilly: Rapports Annuel 1999, Hydro-Québec, G2-RT-various-05 (2000).
DION, E., Résultats du programme de surveillance radiologique de L’environnment du site de Gentilly: Rapport annuel 2000, Hydro-Québec (2001).

518
DION, E., Résultats du programme de surveillance radiologique de L’environnment du site de Gentilly: Rapport annuel 2001, Hydro-Québec (2002).
Du PREEZ, H.H., STEYN, G.J., A preliminary investigation of the concentration of selected metals in the tissues and organs of the tigerfish (Hydrocynus vittatus) from the Olifants River, Kruger National Park, South Africa, Water SA, 18(2) (1992) 131.
DUGDALE, R.C., Studies on the iron, manganese, sulfate and silica balances and distributions for Lake Mendota, Wisconsin, Wisconsin Academic Sciences 51 (1962) 141.
EDGINGTON, D.N., et al., “Plutonium and americium in Lake Michigan sediments”, Transuranic Nuclides in the Environment, Symposium Proceedings, San Francisco, , STI/PUB/410, International Atomic Energy Agency, Vienna (1976) 493-516.
EDGINGTON, D.N., et al., “The behaviour of plutonium in aquatic ecosystems: A summary of studies on the Great Lakes”, Environmental Toxicity Aquatic Radionuclides: Models and Mechanisms. Ann Arbor Science Publishers, Ann Arbor, MI (1976) 45-79.
EIFAC, Working party on water quality criteria for European freshwater fish. Report on cadmium and freshwater fish, Wat. Res. 12 (1978) 281.
EISENBUD, M., GESELL, T., Environmental Radioactivity from Natural, Industrial, and Military Sources, 4th edn, Academic Press, Toronto (1997) 656.
ELDER, J.F., COLLINS, J.J., Freshwater molluscs as indicators of bioavailability and toxicity of metals in surface-water systems, Reviews of Environmental Contamination and Toxicology 122 (1991) 37.
ELDER, J.F., COLLINS, J.J., Freshwater molluscs as indicators of bioavailability and toxicity of metals in surface-water systems, Reviews of Environmental Contamination and Toxicology 122 (1991) 37.
ELWOOD, J.W., et al., Contribution of gut contents to the concentration and body burden of elements in Tipula spp. From a spring-fed stream, Journal of the Fisheries Research Board of Canada 33 (1976) 1930.
EMERY, R.M., et al., “Ecological behavior of plutonium and americium in a freshwater pond”, Radioecology and Energy Resources, Ecological Society of America, Special Publication No. 1, Dowden, Hutchinson & Ross, Inc., Stroudsburg (1975).
EMERY, R.M., et al., Ecological behavior of plutonium and americium in a freshwater ecosystem. Phase I. Limnological characterization and isotopic distribution. USAEC Report BNWL-1867. Battelle, Pacific Northwest Laboratories, NTIS (1974).
EMERY, R.M., et al., Ecological behavior of plutonium and americium in a freshwater pond. USAEC Report BNWL-SA-5346. Battelle, Pacific Northwest Laboratories, NTIS (1975).
EMERY, R.M., et al., “The ecological behavior of plutonium and americium in a freshwater pond”, Proc. 4th Nat. Symp. on Radioecology (1976) 74-85.
EMERY, R.M., Farland, T.R., Ecological behavior of plutonium and americium in a freshwater ecosystem. Phase II. Implications of differences in transuranic isotopic ratios, USAEC Report BNWL-1879. Battelle, Pacific Northwest Laboratories, NTIS (1974).
EMERY, R.M., Klopfer, D.C., “The distribution of transuranic elements in a freshwater pond ecosystem”, Environmental Toxicity Aquatic Radionuclides: Models and Mechanisms. Ann Arbor Science Publishers, Ann Arbor (1976) 269-285.
ERICKSON, D.W., LINDZEY, J.S., Lead and cadmium in muskrat and cattail tissues, Journal of Wildlife Management 47(2) (1983) 550.
EYMAN, L.D., et al., “Plutonium-237 and 246: Their production and use as gamma tracers in research on plutonium kinetics in an aquatic consumer”, Environmental Toxicity of Radionuclides: Models and Mechanisms, Ann Arbor Science Publishers, Inc., Ann Arbor (1976) 193-206.

519
EYMAN, L.D., Trabalka, J.R., Plutonium-237: Comparative uptake in chelated and non-chelated forms by channel catfish (Ictalurus punctatus), Health Physics 32 (1977) 475.
EYMAN, L.D., Trabalka, T.R., “Patterns of transuranic uptake by aquatic organisms: Consequences and implications”, Transuranic Elements in the Environment, U.S. Department of Energy (1980) 612-624.
Fontaine, Y., Radioactive contamination of aquatic media and organisms, AEC-TR-5358 (1960).
FOOD AND AGRICULTURE ORGANIZATION OF THE UNITED NATIONS, Aquaculture: From hunter to farmer (undated), http://www.fao.org/documents/show_cdr.asp?url_file=/docrep/U8480E/ U8480E0g.htm
FOOD AND AGRICULTURE ORGANIZATION OF THE UNITED NATIONS, Aquaculture: Not just an export industry (2003), http://www.fao.org/english/newsroom/focus/2003/aquaculture.htm
FOOD AND AGRICULTURE ORGANIZATION OF THE UNITED NATIONS, The African Water Resource Database (inland fisheries and aquaculture) (2007) http://www.fao.org/fi/website/FIRetrieveAction.do?dom=topic&fid=16000
FOOD AND AGRICULTURE ORGANIZATION OF THE UNITED NATIONS, The State of World Fisheries and Aquaculture (1996-2006), http://www.fao.org/sof/sofia/index_en.htm
FOOD AND AGRICULTURE ORGANIZATION OF THE UNITED NATIONS, The State of World Fisheries and Aquaculture 2002 (2002), http://www.fao.org/documents/show_cdr.asp?url_file=/docrep/005/y7300e/y7300e00.htm
GARCIA-FERNANDEZ, et al., Environmental exposure and distribution of lead in four species of raptors in Southeastern Spain, Arch. Environ. Contam. Toxicol., 33 (1997) 76.
GILES, M.A., Rare earth elements as internal batch marks for rainbow trout: Retention, distribution, and effects on growth of injected dysprosium, europium, and samarium, Transactions of American Fisheries Society 122(2) (1993) 289.
GILL, T.S., et al., Trace metal (Cu and Zn) adaption of organ systems of the american eel, Anguilla
rostrata, to external concentrations of cadmium, Comparative Biochemistry and Physiology C, Pharmacology and Toxicology 102C(3) (1992) 361.
GRAHAM, R.V., et al., Comparison of selenomethionine and selenite cycling in freshwater experimental ponds, Water Air Soil Pollutution 62 (1992) 25.
GRIMÅs, U., Aquatic food chain, Publ. Ser. Progress. Radiation Protection 22 (1989) 277.
GROULX, G.R. LASENBY, D.C., Temporal and spatial variation in the amount of cadmium in phantom midge larvae (Chaoborus spp.), Archives of Environmental Contamination and Toxicology 23 (1992) 370.
HAINES, T.A., BRUMBAUGH, W.G., Metal concentration in the gills, gastrointestinal tract, and carcass of white suckers (Catostomus commersoni) in relation to lake acidity, Water, Air, Soil Pollution 73 (1994) 265.
HÅKANSON, L., “Radioactive caesium in fish in Swedish lakes after Chernobyl – Geographical distributions, trends, models and remedial actions”, The Chernobyl Fallout in Sweden, (1991) 239-281.
HÅKANSON, T.E., JOHNSON, L.J., Distribution of Environmental Plutonium in the Trinity Site Ecosystem After 27 Years, USAEC Report LA-UR-73-1291, Los Alamos Scientific Laboratory, NTIS (1973).
HALL, W.S., PULLIAM, G.W., An assessment of metals in an estuarine wetlands ecosystem, Archives of Environmental Contamination and Toxicology 29 (1995) 164.
HERMANUTZ, R.O., et al., Effects of elevated selenium concentrations on bluegills (Lepomis
macrochirus) in outdoor experimental streams, Environmental Toxicology and Chemistry 11 (1992) 217.

520
HEWETT, C.J., JEFFERIES, D.F., The accumulation of radioactive caesium from food by the plaice (Pleuronectes platessa) and the brown trout (Salmo trutta), J. Fish. Biol., 13 (1978) 143.
HINCHBERGER, M., Annual summary and assessment of environmental radiological data for 2001, N-REP-03419-10001 (2002).
HOOPER, F.F., et al., Use of radioisotopes in hydrobiology and fish culture, Transactions of American Fisheries Society 90 (1961) 49.
HUGHES, G.M., “Dimensions and the respiration of lower invertebrates”, Scale Effects in Animal Locomotion, Academic Press, New York (1977) 57-81.
INTERNATIONAL ATOMIC ENERGY AGENCY, Handbook of parameter values for the prediction of radionuclide transfer in temperate environments, IAEA Technical Report Series, Technical Reports Series No. No. 364 (1994).
IRELAND, M.P., Lead retention in toads Xenopus laevis fed increasing levels of lead-contaminated earthworms, Environmental Pollution 12 (1977) 85.
JACKSON, L.J., et al., Empirical relationship between element composition of aquatic macrophytes and their underlying elements, Biogeochemistry 12 (1991) 71.
JACKSON, L.J., Rooted aquatic macrophytes and the cycling of littoral zone metals, M.Sc. Dissertation, McGill University, Montreal, Quebec (1992).
JAMIL, K., HUSSAIN, S., Biotransfer of metals to the insect Neochetina eichhornae via aquatic plants, Archives of Environmental Contamination and Toxicology 22 (1992) 459.
JINKS, S.M., EISENBUD, M., Concentration factors in the aquatic environment, Radiation Data and Reports (1972) 243-247.
JOP, K.M., Concentrations of metals in various larval stages of four Ephemeroptera species, Bulletin of Environmental Contamination and Toxicology 46 (1992) 901.
JORGENSEN, S.E., et al., Handbook of Environmental Data and Ecological Parameters, Pergamon Press, New York (1979).
JUDD, J.M., OPHEL, I.L., The effect of water temperature and body weight on strontium and calcium metabolism of fish, AECL Report (1976).
KARZINKIN, G.S., The use of radioactive isotopes in the fishing industry (translated), JPRS, 21 (1963) 109.
KEVERN, N.R., Feeding rate of carp estimated by a radioisotopic method, Transactions of American Fisheries Society 95 (1966) 363.
KEVERN, N.R., SPIGARELLI, S.A., “Effects of selected limnological factors on the accumulation of cesium-137 fallout by largemouth bass (Micropterus salmoides)”, Proc. of the 3rd National Symposium on Radioecology, May 10-12, 1971, Oak Ridge, TN, I (1971) 354-360.
KHALAF, A.N., et al., The patterns of accumulation of some heavy metals in Barbus grypus (Heckel) from a polluted river, JBSR, 16(2) (1985) 51.
KOLEHMAINEN, S., NELSON, D.J., “The balances of 137Cs, stable cesium and the feeding rates of bluegill (Lepomis macrochirus Raf.) in White Oak Lake”, USAEC Report, ORNL-4445, Oak Ridge National Laboratory, NTIS, (1969).
KOLEHMAINEN, S.E., et al., “137Cs in fish, plankton and plants in Finnish lakes 1964-5”, Radioecological Concentration Processes, Pergamon Press, New York (1967) 913-919.
KOTZER, T., et al., Natural concentrations of tritium (OBT, FWT) in fish and associated media, COG report (2001).
KOTZER, T., KRAMER-TREMBLAY, S., Behaviour of radiocarbon in the freshwater environment around CANDU Nuclear Power Generating Stations, COG Report, COG-01-080 (2002).

521
KOTZER, T., YANKOVICH, T.L., Concentrations of tritium (OBT, FWT) in fish and associated media, TK-01-01 (2001).
KRUMHOLZ, L.A., Observations on the fish population of a lake contaminated by radioactive wastes, Bull. Amer. Museum. Nat. Hist., 110(4) (1956) 283.
KUMAR, A., MATHUR, R.P., Bioaccumulation kinetics and organ distribution of lead in a fresh water teleost, Colisa fasciatus, Environmental Technology 12 (1991) 731.
LaMARRE, J.R., Annual Summary and Assessment of Environmental Radiological Data for 1995, Ontario Hydro Nuclear, N-REP-03419-0123 R0 (1996).
LaMARRE, J.R., Annual Summary and Assessment of Environmental Radiological Data for 1996, Ontario Hydro Nuclear, N-REP-03419-0186 R0 (1997).
LaMARRE, J.R., Annual Summary and Assessment of Environmental Radiological Data for 1997, Ontario Hydro Nuclear, N-REP-03419-0264 R00 (1998).
LaMARRE, J.R., Annual Summary and Assessment of Environmental Radiological Data for 1998, Ontario Power Generation, N-REP-03419-0597 R00 (1999).
LaMARRE, J.R., Annual Summary and Assessment of Environmental Radiological Data for 1999, Ontario Power Generation, N-REP-03419-10000 (2000).
LaMARRE, J.R., Annual summary and assessment of environmental radiological data for 2000, Ontario Power Generation (2001).
LaMARRE, J.R., Annual summary and assessment of environmental radiological data for 2001, Ontario Power Generation (2002).
LAMBRECHTS, A., FOULQUIER, L., “Experimental study of the transfers of a radionuclide mixture between water, sediment and fish”, Proc. of an International Seminar: Application of distribution coefficients to radiological assessment models, Elsevier Applied Science Publishers (1985) 336-350.
LAVEROCK, M., et al., Toxicity of iodine, iodide and iodate to Daphnia magna and rainbow trout (Oncorhynchus mykiss), Archives of Environmental Contamination and Toxicology 29 (1995) 344.
LEHNINGER, A.L., Biochemistry, 2nd edn, Worth Publishers, Inc., New York (1975) 1104.
LINDNER, G., et al., “Biological transfer and sedimentation of Chernobyl radionuclides in Lake Constance”, Ecological Structure and Function in Large Lakes, Science – Tech. Publ., Madison (1989) 265-287.
LIPKE, E.J., Jr., Effects of environmental parameters on the uptake of radioisotopes in freshwater fish, Ph.D. Dissertation, University of Michigan, Ann Arbor (1971).
LIVINGSTON, A.D., LIVINGSTON, H., Edible Plants and Animals: Unusual Foods from Aardvark to Zamia, Facts on File (1993) 292.
LÓPEZ, J., CARBALLEIRA, A., Interspecific difference in metal bioaccumulation and plant-water concentration ratios in five aquatic bryophytes, Hydrobiologia 263 (1993) 95.
LOUMBOURDIS, N.S., WRAY, D., Heavy-metal concentration in the frog Rana ridibunda from a small river of Macedonia, Northern Greece, Environment International 24(4) (1998) 427.
LUCAS, H.F., et al., Concentrations of trace elements in Great Lakes fishes, Journal of the Fisheries Research Board of Canada 27 (1970) 677.
LUTEN, J., et al., Accumulation, elimination and speciation of Cd and Zn in mussels: Mytilus edulis in the natural environment, Bulletin of Environmental Contamination and Toxicology 37 (1986) 579.
MARSHALL, J.S., et al., “Plutonium in the Laurentian Great Lakes: Food chain relationships”, Proceedings of the XIX Congress of Association of Limnology, Winnipeg (1974).
MARSHALL, J.S., et al., Plutonium in the Laurentian Great Lakes: Food-chain relationship. Internat. Verein. Limnology 19 (1975) 323.

522
MARTIN, P., et al., Natural-series radionuclides in traditional North Australian aboriginal foods, Journal of Environmental Radioactivity 40(1) (1998) 37.
MARTIN, R.E., et al., Growth and movement of smallmouth buffalo, Ictiobus bubalus (Rafinesque), in Watts Bar Reservoir, Tennessee, ORNL-3530. (1964) 100 .
MASON, A.S., ÖSTLUND, H.G., “Atmospheric HT and HTO: V. Distribution and large-scale circulation”, Behaviour of Tritium in the Environment, IAEA-SM-232/62 (1979) 3-16.
McCULLEY, J.C., Environmental Radiation Monitoring Data for Point Lepreau Generating Station, New Brunswick Power January 1, 1998 to December 31, 1998, HP-07000-99-1 (1999).
McCULLEY, J.C., Environmental Radiation Monitoring Data for Point Lepreau Generating Station, New Brunswick Power January 1, 1999 to December 31, 1999, HP-07000-2000-1 (2000).
McCULLEY, J.C., Environmental Radiation Monitoring Data for Point Lepreau Generating Station, New Brunswick Power January 1, 2000 to December 31, 2000, HP-07000-2001-1 (2001).
McCULLEY, J.C., Environmental Radiation Monitoring Data for Point Lepreau Generating Station, New Brunswick Power January 1, 2001 to December 31, 2001, HP-07000-2002-1 (2002).
McMAHON, J.W., et al., Determination of ultra trace amounts of cobalt in fish by graphite furnace Zeeman effect atomic absorption spectrometry, Internnational Journal of Environmental and Analitycal Chemistry 24 (1986) 297.
MORGAN, A., STANBURY, D.G., The contamination of rivers with fission products from fallout, Health Physics 5 (1961) 101.
MORTON, R.J., Status report No. 5 on Clinch River Study, USAEC Document, ORNL-3721 (1965) 149.
MUIR, B.S., HUGHES, G.M., 1969. Gill dimensions for three species of tunny, Journal of Experimental Biology 51 (1969) 271.
NATIONAL ACADEMY OF SCIENCES – National Research Council, The effects of atomic radiation on oceanography and fisheries, Pub. 551, Washington, D.C. (1957).
NAVARRO, E., et al., Radioactivity measurements on migrating birds (Turdus philomelos) captured in the Comunidad Valenciana (Spain), Science of the Total Environment 209 (1998) 143.
NELSON, D.J., “Cesium, cesium-137 and potassium concentrations in white crappie and other Clinch River fish”, Proceedings of the Second National Symposium on Radioecology, USAEC Report, CONF-670503, Ann Arbor, Michigan, (1967) 240-248.
NELSON, D.J., “Ecological behaviour of radionuclides in the Clinch and Tennessee Rivers”, Reservoir Fishery Research Symp., Athens, Georgia (1969).
NELSON, D.J., BLAYLOCK, B.G., “The preliminary investigation of salivary gland chromosomes of Chironomus tentans Fabr. from the Clinch River”, Radioecology, (1963) 367-372.
NEWMAN, M.C., BRISBIN, I.L., Jr., Variation of 137Cs levels between sexes, body sizes and collection localities of mosquitofish, Gambusia holbrooki (Girard 1859), inhabiting a reactor cooling reservoir, Journal of Environmental Radioactivity 12 (1990) 131.
NOËL-LAMBOT, F., BOUQUEGNEAU, J.M., Comparative study of toxicity, uptake and distribution of cadmium and mercury in the sea water adapted eel Anguilla anguilla, Bulletin of Environmental Contamination and Toxicology 18 (1977) 418.
NOSHKIN, V.E., Ecological aspects of plutonium dissemination in aquatic environments, Health Physics 22 (1972) 537.
ODUM, H.T., Biogeochemical deposition of strontium, Institute of Marine Sciences 4(2) (1957) 38.
ONE FISH, FRESHWATER FISHERIES (2007), http://www.onefish.org/servlet/CDSServlet? status=ND0xMDc3OSZjdG5faW5mb192aWV3X3NpemU9Y3RuX2luZm9fdmlld19mdWxsJjY9ZW4mMzM9KiYzNz1rb3M~

523
OPHEL, I.L., “The fate of radiostrontium in a freshwater community”, Radioecology, Reinhold Publishing Corporation, New York, (1976) 213-216.
OPHEL, I.L., et al.,“Strontium concentration factors and bottom sediments of a freshwater lake”, Radioecology Applied to the Protection of Man and his Environment. Commission of the European Community, Luxembourg (1972) 509-530.
OPHEL, I.L., Judd, J.M., Accumulation of radiostontium by the gills of freshwater fish, Nature 194 (1962) 1187.
OPHEL, I.M., Judd, J.M., “Sr–Ca relationships in aquatic food chains”, Proceedings of the Second National Symposium on Radioecology, US AEC Tech. Inf. Cent., Oak Ridge National Lab., Oak Ridge, TN. CONF-670503 (1967) 221–225.
PARKER, F.L., “Clinch River studies”, Transport of Radionuclides in Fresh Water Systems, USAEC Doc., TID-7664 (1963) 161-191.
PARKER, H.M. et al., “North American experience in the release of low-level waste to rivers and lakes”, Proc. 3rd Int. Conf. On Peaceful Uses of Atomic Energy, 14 (1964) 62-71.
PHILLIPS, D.J.H., The use of biological indicator organisms to monitor trace metal pollution in marine and estuarine environments–A review, Environmental Pollutution 13 (1977) 281.
PILLAI, K.C., MATHEW, E., “Plutonium in the aquatic environment: Its behaviour, distribution and significance”, Transuranium Nuclides in the Environment, Symposium Proceedings, STI/PUB/410, International Atomic Energy Agency, Vienna (1976) 22-45.
PRESTON, A., et al. The concentration of cesium-137 and strontium-90 in the flesh of brown trout taken from rivers and lakes in the British Isles between 1961-1966: The variables determining the concentrations and their use in radiological assessments, Water Resourches 1(6) (1967) 475.
QUIRING, D.P., Functional anatomy of vertebrates, McGraw Hill: New York (1950).
REED, J.R., Uptake and excretion of 60Co by black bullheads Ictalurus melas (Rafinesque), Health Physics 21 (1971) 835.
REHWOLDT, R., et al., Distribution of selected metals in tissue samples of carp, Cyprinus carpio, Bulletin of Environmental Contamination and Toxicology 15(3) (1976) 374.
REVENGA, C., CASSAR, A. (for World Wildlife Fund-International), Freshwater trends and projections: Focus on Africa (undated) http://64.233.161.104/search?q=cache:b7KhUzd0ycMJ:www.wwf.org.uk /filelibrary/pdf/africa_freshwater.pdf+%2B%22fao%22%2B%22percent%22%2B%22diet%22%2B%22freshwater+fish%22&hl=en
REYNOLDS, W.W., KARLOTSKI, W.J., The allometric relationship of skeleton weight and body weight in teleost fishes: A preliminary comparison with birds and mammals, Copeia, 1977 (1977) 160.
RIBEYRE, I. R., et al., Tissue distribution of inorganic mercury, methylmercury and cadmium in the asiatic clam (Corbicula fluminea) in relation to the contamination levels of the water column and sediment, Chemosphere 35(12) (1997) 2817.
ROULEAU, C., et al., Uptake, distribution and elimination of 54Mn(II) in the brown trout (Salmo trutta), Environmental Toxicology and Chemistry 14(3) (1995) 483.
ROWAN, D.J., RASMUSSEN, J.B., Bioaccumulation of radiocaesium by fish: The influence of physicochemical factors and trophic structure, Canadian Journal of Fisheries and Aquatic Sciences 51 (1994) 2388–2410.
SADLER, W.O., Biology of the midge Chironomus tentans Fabricius, and methods for its propagation, Cornell Univ. Agr. Exp. Sta. Memoir No. 173 (1935).
SALÁNKI, J., et al., Heavy metals in animals of Lake Balaton, Water Resourches 16 (1982) 1147.
SAMPLE, B., et al., Methods and tools for estimation of the exposure of terrestrial wildlife to contaminants, Oak Ridge National Laboratory. ORNL/TM-13391 (1997) 148.

524
SANTUSCHI, P.H., et al., Chernobyl radionuclides in the environment: Tracers for the tight coupling of atmospheric, terrestrial, and aquatic geochemical processes, Environmental Science and Technology 22 (1988) 510.
SCOTT, W.B., Crossman, E.J., Freshwater Fishes of Canada, Fisheries Research Board of Canada, Ottawa (1998).
SEYMOUR, A.H., Contributions of radionuclides to our understanding of aquatic ecosystems, Verh. Internat. Verein. Limnology 15 (1964) 227.
SHAHUL-HAMEED, P., et al., A study on distribution of natural radionuclide polonium-210 in a pond ecosystem, Journal of Biosciences 22(5) (1997) 627.
SHORT, Z.F., et al., The uptake of 131I by the biota of Fern Lake, Washington, in a laboratory and a field experiment, Ecology, 50 (1969) 979.
SHORT, Z.F., et al.,“Uptake of molybdenum, marked with 99Mo, by the biota of Fern Lake, Washington, in a laboratory and a field experiment”, Radionuclides in Ecosystems. Proc. of the 3rd Nat. Symp. on Radioecology, Oak Ridge, Tennessee, 1 (1971) 474-485.
SMITH, J.T., et al., “Radioactivity in aquatic systems”, Chernobyl: Catastrophe and Consequences, Praxis Publishing Ltd., Chichester, UK (2005) 139-190.
SPIGARELLI, S.A., Effects of biogeochemical factors on the accumulation of 137Cs fallout by largemouth bass (Micropterus salmoides), Ph.D. thesis, Michigan State University, East Lansing, Mich (1970).
STANSLEY, W., ROSCOE, D.E., The uptake and effects of lead in small mammals and frogs at a trap and skeet range, Archives of Environmental Contamination and Toxicology 30 (1996) 220.
STEMBERGER, R.S., CHEN, C.Y., Fish tissue metals and zooplankton assemblages of northeastern U.S. lakes, Canadian Journal of Fisheries and Aquatic Sciences 55(2) (1998) 339.
STEPHENSON, M., et al., Carbon-14 in the water, sediments and biota of Lakes 226 North, 226 South and 224, Experimental Lakes Area, 1989 to 1994, Atomic Energy of Canada Report, TR-634/COG-94-97 (1994).
STEPHENSON, M., TURNER, M.A., A field study of cadmium dynamics in periphyton and in Hyallela azteca (Crustacea: Amphipoda), Water Air Soil Pollution 68 (1993) 341.
STRONG, M., LUOMA, S.N., Variations in the correlation of body size with concentrations of Cu and Ag in the bivalve Macoma balthica, Canadian Journal of Fisheries and Aquatic Sciences 38 (1981) 1059-1064.
STRUXNESS, E.G., et al., Comprehensive report of the Clinch River study, USAEC Doc., ORNL-4035 (1967) 199.
STRYER, L., Biochemistry, 3rd edn, W.H. Freeman and Company, New York (1988) 1089 .
SUKHOPAROVA, V.P., et al., Organochlorine compounds and heavy metals in fish of the Upper Oka basin, Russian Journal of Ecology 25(1) (1994) 30 (In Russian).
SWANSON, S.M., Levels of 226Ra, 210Pb and TotalU in fish near a Saskatchewan uranium mine and mill, Health Physics 45(1) (1983) 67.
TEAL, J.M., Community metabolism in a temperate cold spring, Ecol. Monogr., 27 (1957) 283.
TEMPLETON, W.L., BROWN, V.M., The relationship between the concentrations of calcium, strontium and strontium-90 in wild brown trout, Salmo trutta L. and the concentrations of the stable elements in some waters of the United Kingdom, and the implications in radiological health studies, International Journal of Air and Water Pollution 8 (1964) 49.
TENNESSEE VALLEY AUTHORITY, Division of Forestry Development, Annual Report (1964).
TENNEY, S.M., TENNEY, J.B., Quantitative morphology of cold-blooded lungs: Amphibia and Reptilia, Respiration Physiology 9 (1970) 197.

525
TRABALKA, J.R., EYMAN, L.D., Distribution of plutonium-237 in a littoral freshwater microcosm, Health Physics 31 (1976) 390.
TRABALKA, J.R., FRANK, M.L., Trophic transfer by chironomids and distribution of plutonium-239 in simple aquatic microcosms, Health Physics 35 (1978) 492.
TRAPEZNIKOV, A.V., et al., Radioactive contamination of the Techa River, the Aerialist. Health Physics, 65 (1993) 481.
UNITED STATES ENVIRONMENTAL PROTECTION AGENCY, National sediment quality survey, EPA-823-C-01-001 (2001).
UNITED STATES ENVIRONMENTAL PROTECTION AGENCY, Wildlife Exposure Factors Handbook, Vol. I, EPA/600/R-93/187a, Washington, DC (1993).
VANDERPLOEG, H.A., et al., Bioaccumulation factors for radionuclides in freshwater biota, Environmental Sciences Division, Publication No. 783 (1975).
VANGENECHTEN, J.H.D., et al., Curium-224 and americium-241 uptake in freshwater fish, Toxicological and Environmental Chemistry 19 (1989) 147.
VIGH, P., et al., Comparison of heavy metal concentration of grass carp (Ctenopharyngodon idella Cuv et Val) in a shallow eutrophic lake and a fish pond, Chemosphere 32(4) (1996) 691.
VOSHELL, J.R. Jr., et al., Transfer of 137Cs and 60Co in a waste retention pond with emphasis on aquatic insects, Health Physics 49 (1985) 777.
VRAY, F., et al., Effects of some factors on uptake and release of 106Ru by a freshwater moss, Plathypnidium riparioides, Archives of Environmental Contamination and Toxicology 23 (1992) 190.
WAHLGREN, M.A., et al., “Study of the behavior of transuranic and possible chemical homologues in Lake Michigan water and biota”, Transuranium Nuclides in the Environment, Symposium Proceedings, San Francisco, STI/PUB/410, International Atomic Energy Agency, Vienna (1976) 9-24.
WAHLGREN, M.A., Marshall, J.S., “Distribution studies of plutonium in the Great Lakes”, Proceedings of the 2nd International Conference on Nuclear Methods in Environmental Research, University of Missouri, Columbia, CONF-740701, NTIS (1974).
WAHLGREN, M.A., MARSHALL, J.S., “The behaviour of plutonium and other long-lived radionuclides in Lake Michigan”, Impacts of Releases into the Aquatic Environment, Symposium Proceedings, Finland, STI/PUB/406. International Atomic Energy Agency, Vienna (1974) 227-243.
WAYMAN, C.W., et al., “Further investigations of plutonium in aquatic biota of the Great Miami River Watershed, including the canal and ponds in Miamisburg, Ohio”, Radiological and Environmental Research Division Annual Report, USAEC Report ANL-75-60 (Pt. 3), Argonne National Laboratory, NTIS (1976).
WEAVER, et al., Approaches to environmental exposure assessment in children, Environmental Health Perspectives 106(Suppl. 3) (1998) 827.
WEBER, D.N., et al., Metal redistribution in largemouth bass (Micropterus salmoides) in response to restrainment stress and dietary cadmium: Role of metallothionein and other metal-binding proteins, Comparative Biochemistry and Physiology 101C(2) (1992) 255.
WETZEL, R.G., Limnology, 2nd edn, Saunders College Publishing, New York (1983).
WHICKER, F.W., SCHULTZ, V., Radioecology: Nuclear Energy and the Environment, CRC Press, Boca Raton, 1,2 (1982).
WILHM, J.L., Transfer of radioisotopes between detritus and benthic macroinvertebrates in laboratory microecosystems, Health Physics 18 (1970) 277.
WILLIAMS, L.G. SWANSON, H.D., Concentration of cesium-137 by algae, Science 127 (1958) 187.
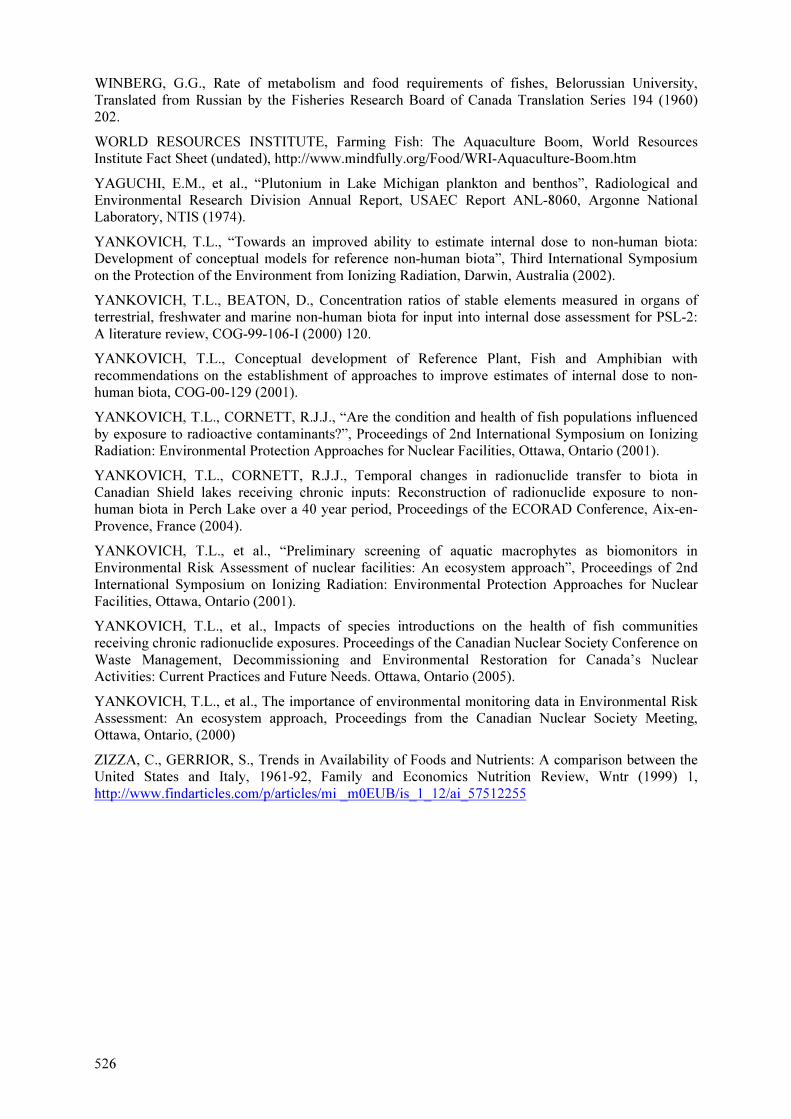
526
WINBERG, G.G., Rate of metabolism and food requirements of fishes, Belorussian University, Translated from Russian by the Fisheries Research Board of Canada Translation Series 194 (1960) 202.
WORLD RESOURCES INSTITUTE, Farming Fish: The Aquaculture Boom, World Resources Institute Fact Sheet (undated), http://www.mindfully.org/Food/WRI-Aquaculture-Boom.htm
YAGUCHI, E.M., et al., “Plutonium in Lake Michigan plankton and benthos”, Radiological and Environmental Research Division Annual Report, USAEC Report ANL-8060, Argonne National Laboratory, NTIS (1974).
YANKOVICH, T.L., “Towards an improved ability to estimate internal dose to non-human biota: Development of conceptual models for reference non-human biota”, Third International Symposium on the Protection of the Environment from Ionizing Radiation, Darwin, Australia (2002).
YANKOVICH, T.L., BEATON, D., Concentration ratios of stable elements measured in organs of terrestrial, freshwater and marine non-human biota for input into internal dose assessment for PSL-2: A literature review, COG-99-106-I (2000) 120.
YANKOVICH, T.L., Conceptual development of Reference Plant, Fish and Amphibian with recommendations on the establishment of approaches to improve estimates of internal dose to non-human biota, COG-00-129 (2001).
YANKOVICH, T.L., CORNETT, R.J.J., “Are the condition and health of fish populations influenced by exposure to radioactive contaminants?”, Proceedings of 2nd International Symposium on Ionizing Radiation: Environmental Protection Approaches for Nuclear Facilities, Ottawa, Ontario (2001).
YANKOVICH, T.L., CORNETT, R.J.J., Temporal changes in radionuclide transfer to biota in Canadian Shield lakes receiving chronic inputs: Reconstruction of radionuclide exposure to non-human biota in Perch Lake over a 40 year period, Proceedings of the ECORAD Conference, Aix-en-Provence, France (2004).
YANKOVICH, T.L., et al., “Preliminary screening of aquatic macrophytes as biomonitors in Environmental Risk Assessment of nuclear facilities: An ecosystem approach”, Proceedings of 2nd International Symposium on Ionizing Radiation: Environmental Protection Approaches for Nuclear Facilities, Ottawa, Ontario (2001).
YANKOVICH, T.L., et al., Impacts of species introductions on the health of fish communities receiving chronic radionuclide exposures. Proceedings of the Canadian Nuclear Society Conference on Waste Management, Decommissioning and Environmental Restoration for Canada’s Nuclear Activities: Current Practices and Future Needs. Ottawa, Ontario (2005).
YANKOVICH, T.L., et al., The importance of environmental monitoring data in Environmental Risk Assessment: An ecosystem approach, Proceedings from the Canadian Nuclear Society Meeting, Ottawa, Ontario, (2000)
ZIZZA, C., GERRIOR, S., Trends in Availability of Foods and Nutrients: A comparison between the United States and Italy, 1961-92, Family and Economics Nutrition Review, Wntr (1999) 1, http://www.findarticles.com/p/articles/mi _m0EUB/is_1_12/ai_57512255
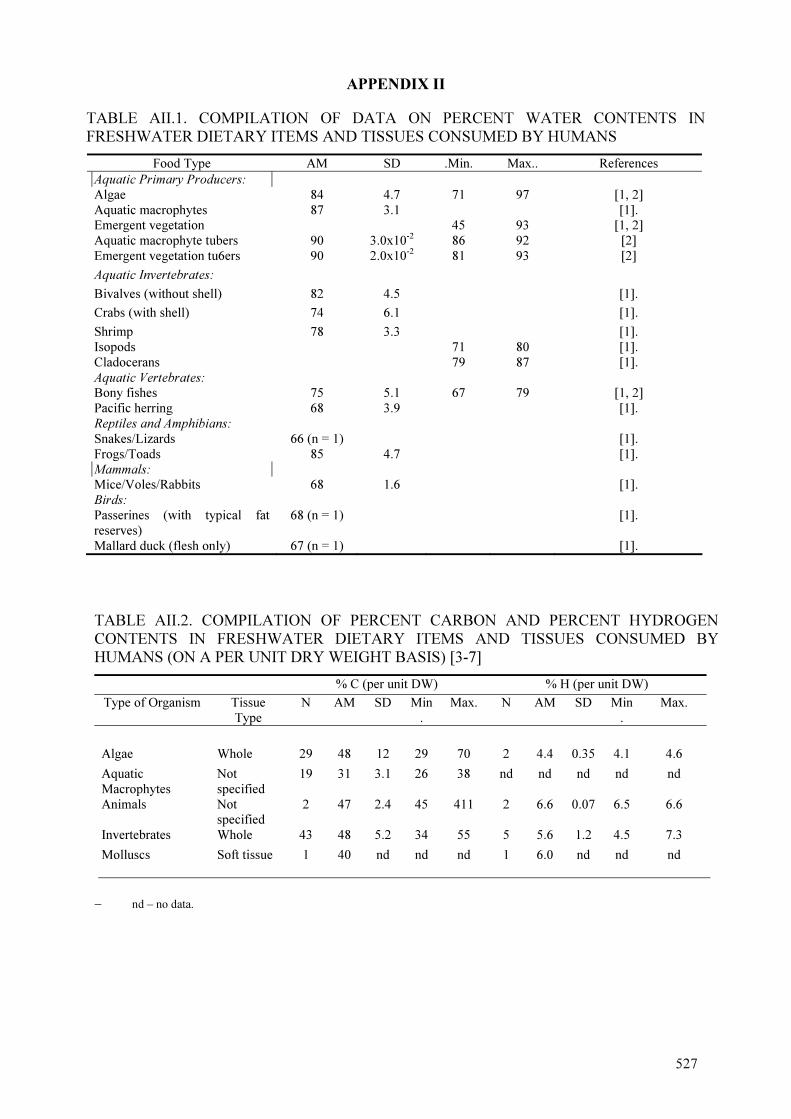
527
APPENDIX II
TABLE AII.1. COMPILATION OF DATA ON PERCENT WATER CONTENTS IN
FRESHWATER DIETARY ITEMS AND TISSUES CONSUMED BY HUMANS
Food Type AM SD .Min. Max.. References
Aquatic Primary Producers:
Algae 84 4.7 71 97 [1, 2]
Aquatic macrophytes 87 3.1 [1].
Emergent vegetation 45 93 [1, 2]
Aquatic macrophyte tubers 90 3.0x10⁻² 86 92 [2]
Emergent vegetation tu6ers 90 2.0x10⁻² 81 93 [2]
Aquatic Invertebrates:
Bivalves (without shell) 82 4.5 [1].
Crabs (with shell) 74 6.1 [1].
Shrimp 78 3.3 [1].
Isopods 71 80 [1].
Cladocerans 79 87 [1].
Aquatic Vertebrates:
Bony fishes 75 5.1 67 79 [1, 2]
Pacific herring 68 3.9 [1].
Reptiles and Amphibians:
Snakes/Lizards 66 (n = 1) [1].
Frogs/Toads 85 4.7 [1].
Mammals:
Mice/Voles/Rabbits 68 1.6 [1].
Birds:
Passerines (with typical fat
reserves)
68 (n = 1) [1].
Mallard duck (flesh only) 67 (n = 1) [1].
TABLE AII.2. COMPILATION OF PERCENT CARBON AND PERCENT HYDROGEN
CONTENTS IN FRESHWATER DIETARY ITEMS AND TISSUES CONSUMED BY
HUMANS (ON A PER UNIT DRY WEIGHT BASIS) [3-7]
% C (per unit DW) % H (per unit DW)
Type of Organism Tissue
Type
N AM SD Min
.
Max. N AM SD Min
.
Max.
Algae Whole 29 48 12 29 70 2 4.4 0.35 4.1 4.6
Aquatic
Macrophytes
Not
specified
19 31 3.1 26 38 nd nd nd nd nd
Animals Not
specified
2 47 2.4 45 411 2 6.6 0.07 6.5 6.6
Invertebrates Whole 43 48 5.2 34 55 5 5.6 1.2 4.5 7.3
Molluscs Soft tissue 1 40 nd nd nd 1 6.0 nd nd nd
− nd – no data.

528
REFERENCES
[1] SAMPLE, B., et al., Methods and tools for estimation of the exposure of terrestrial wildlife to
contaminants, Oak Ridge National Laboratory. ORNL/TM-13391 (1997). [2] YANKOVICH, T.L., unpublished data.
[3] ADAMS, L.W., et al., “Tritium behaviour in aquatic plants and animals in a freshwater marsh ecosystem”, Behaviour of Tritium in the Environment, IAEA-SM-232/74 (1979) 231-245.
[4] KOTZER, T., KRAMER-TREMBLAY, S., Behaviour of radiocarbon in the freshwater environment around CANDU Nuclear Power Generating Stations, COG Report, COG-01-080 (2002).
[5] KOTZER, T., YANKOVICH, T.L., Concentrations of tritium (OBT, FWT) in fish and associated media, TK-01-01 (2001).
[6] KOTZER, T., et al., Natural concentrations of tritium (OBT, FWT) in fish and associated media, COG report (2001).
[7] JORGENSEN, S.E., et al., Handbook of Environmental Data and Ecological Parameters,
Pergamon Press, New York (1979).

AP
PE
ND
IX
III:
SU
MM
AR
Y O
F A
VA
IL
AB
LE
BA
F A
ND
BS
AF
DA
TA
SO
UR
CE
S F
OR
ED
IB
LE
FR
ES
HW
AT
ER
BIO
TA
TA
BL
E A
III.
1.
INV
EN
TO
RY
OF
LIT
ER
AT
UR
E D
AT
A C
OM
PIL
ED
TO
RE
PR
ES
EN
T B
IOA
CC
UM
UL
AT
ION
FA
CT
OR
S (
BA
FS
) F
OR
VA
RIO
US
TY
PE
S O
F E
DIB
LE
BIO
TA
AN
D T
HE
IR T
ISS
UE
S
Pri
mary
Pro
duce
rs
Inve
rteb
rate
s F
ishes
H
erpet
ofa
una
Element
Algae
Macrophytes (Generic)
Macrophytes (Floating-leafed)
Macrophytes (Emergent)
Freshwater Invertebrates
Crustaceans (muscle)
Crustaceans (soft tissue)
Molluscs (muscle)
Molluscs (soft tissue)
Fishes (Generic)
Fishes (Generic, muscle)
Fishes (Generic, whole)
Benthic Fishes (eggs)
Benthic Fishes (liver)
Benthic Fishes (muscle)
Benthic Fishes (whole)
Forage Fishes (eggs)
Forage Fishes (liver)
Forage Fishes (muscle)
Forage Fishes (whole)
Piscivorous Fishes (eggs)
Piscivorous Fishes (liver)
Piscivorous Fishes (muscle)
Piscivorous Fishes (whole)
Tadpoles
Frog (muscle)
Frog (whole)
Reptiles
Tota
l
Ag
1
1
6
1
11
3
7
4
7
0
Al
1
2
0
4
16
3
8
13
5
3
14
5
Am
3
1
3
2
1
10
241A
m
4
1
4
7
1
1
7
As
1
4
1
1
1
38
3
58
Au
1
4
1
1
1
30
4
51
B
0
Ba
1
2
7
4
9
14
7
9
78
2
12
Be
0
Br
1
1
1
1
1
38
4
56
14C
3
1
6
15
1
2
6
Ca
1
2
6
4
16
3
7
62
7
8
3
2
2
9
24
0
Cd
4
1
1
21
12
6
Ce
1
1
4
4
1
9
56
7
7
16
2
Cl
1
1
1
1
1
38
4
56
Cm
1
1
2
529

Pri
mary
Pro
duce
rs
Inve
rteb
rate
s F
ishes
H
erpet
ofa
una
Element
Algae
Macrophytes (Generic)
Macrophytes (Floating-leafed)
Macrophytes (Emergent)
Freshwater Invertebrates
Crustaceans (muscle)
Crustaceans (soft tissue)
Molluscs (muscle)
Molluscs (soft tissue)
Fishes (Generic)
Fishes (Generic, muscle)
Fishes (Generic, whole)
Benthic Fishes (eggs)
Benthic Fishes (liver)
Benthic Fishes (muscle)
Benthic Fishes (whole)
Forage Fishes (eggs)
Forage Fishes (liver)
Forage Fishes (muscle)
Forage Fishes (whole)
Piscivorous Fishes (eggs)
Piscivorous Fishes (liver)
Piscivorous Fishes (muscle)
Piscivorous Fishes (whole)
Tadpoles
Frog (muscle)
Frog (whole)
Reptiles
Tota
l
Co
6
2
1
4
1
5
4
11
3
8
39
7
8
3
2
2
9
21
4
60C
o
2
1
3
3
16
2
1
2
1
2
3
3
Cr
1
9
3
1
5
4
7
43
1
09
Cs
1
2
5
1
7
4
12
4
3
63
7
9
3
2
2
9
24
2
Cs
Ra-
dio
iso-
top
es
1
1
1
1
1
1
6
137C
s 3
1
15
1
4
8
1
5
16
1
3
85
Cu
4
1
81
15
4
1
0
31
6
1
77
2
84
Dy
2
2
4
Eu
1
7
1
1
1
34
1
1
30
9
5
Fe
4
1
1
1
5
4
10
3
8
61
7
8
21
2
Hf
1
1
1
1
0
37
4
54
Hg
25
1
1
11
3
6
4
7
8
I
2
3
1
0
1
3
35
3
2
59
1
45
131I
1
2
1
6
19
1
6
20
10
84
K
1
1
5
4
11
3
8
61
7
8
3
2
2
9
22
4
La
1
1
5
4
14
3
0
46
7
8
18
8
Lu
1
1
Mg
15
4
1
1
36
6
1
78
3
2
2
9
2
21
Mn
4
1
1
1
15
4
1
1
38
6
1
78
2
14
530

Pri
mary
Pro
duce
rs
Inve
rteb
rate
s F
ishes
H
erpet
ofa
una
Element
Algae
Macrophytes (Generic)
Macrophytes (Floating-leafed)
Macrophytes (Emergent)
Freshwater Invertebrates
Crustaceans (muscle)
Crustaceans (soft tissue)
Molluscs (muscle)
Molluscs (soft tissue)
Fishes (Generic)
Fishes (Generic, muscle)
Fishes (Generic, whole)
Benthic Fishes (eggs)
Benthic Fishes (liver)
Benthic Fishes (muscle)
Benthic Fishes (whole)
Forage Fishes (eggs)
Forage Fishes (liver)
Forage Fishes (muscle)
Forage Fishes (whole)
Piscivorous Fishes (eggs)
Piscivorous Fishes (liver)
Piscivorous Fishes (muscle)
Piscivorous Fishes (whole)
Tadpoles
Frog (muscle)
Frog (whole)
Reptiles
Tota
l
Mo
1
14
3
4
2
78
1
38
99M
o
8
8
8
7
8
3
9
Na
1
1
5
3
11
3
8
61
3
3
2
2
9
1
48
Ni
4
1
1
1
4
24
3
5
Np
1
1
1
3
P
14
30
44
Pb
4
1
7
4
5
3
2
6
77
1
90
210P
b
9
2
11
210P
o
6
2
8
Pu
16
8
2
1
4
50
3
9
3
239P
u
3
3
Ra
4
4
5
2
15
226R
a
2
2
2
24
Rb
1
15
4
1
1
38
6
0
78
2
07
Ru
0
106R
u
7
1
8
1
6
Sb
1
6
4
10
3
8
8
10
7
7
Sc
1
1
1
1
0
37
4
54
Se
5
3
11
1
2
4
1
1
1
0
38
4
89
Sm
1
1
Sn
0
531

Pri
mary
Pro
duce
rs
Inve
rteb
rate
s F
ishes
H
erpet
ofa
una
Element
Algae
Macrophytes (Generic)
Macrophytes (Floating-leafed)
Macrophytes (Emergent)
Freshwater Invertebrates
Crustaceans (muscle)
Crustaceans (soft tissue)
Molluscs (muscle)
Molluscs (soft tissue)
Fishes (Generic)
Fishes (Generic, muscle)
Fishes (Generic, whole)
Benthic Fishes (eggs)
Benthic Fishes (liver)
Benthic Fishes (muscle)
Benthic Fishes (whole)
Forage Fishes (eggs)
Forage Fishes (liver)
Forage Fishes (muscle)
Forage Fishes (whole)
Piscivorous Fishes (eggs)
Piscivorous Fishes (liver)
Piscivorous Fishes (muscle)
Piscivorous Fishes (whole)
Tadpoles
Frog (muscle)
Frog (whole)
Reptiles
Tota
l
Sr
3
2
4
1
5
4
11
3
8
62
7
8
21
7
90
Sr
3
9
12
Tb
1
1
9
3
5
4
5
0
Tc
3
3
2
8
95m T
c 3
2
5
Te
3
3
1
0
16
Th
1
1
1
1
4
Ti
1
1
9
34
4
49
Tl
14
3
4
8
78
1
43
U
1
3
8
1
2
2
26
V
1
1
5
4
11
3
3
61
7
8
20
3
Y
11
3
1
2
10
3
6
Yb
0
Zn
4
1
81
15
4
1
1
38
6
1
78
2
93
Zr
5
7
1
0
22
To
tal:
9
8
33
3
1
69
5
63
2
4
27
2
4
33
0
5
2
9
0
0
41
3
11
1
0
0
33
3
11
02
0
0
13
16
16
69
18
12
1
2
54
6
00
3
5 32
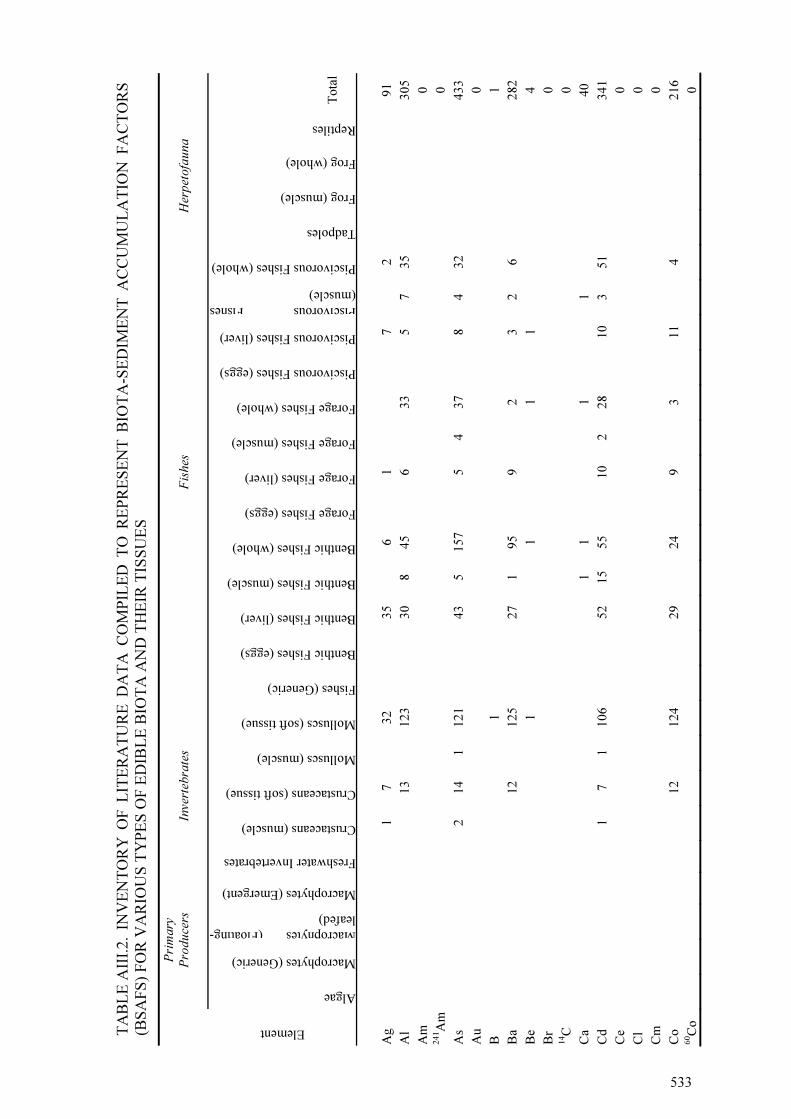
TA
BL
E A
III.
2.
INV
EN
TO
RY
OF
LIT
ER
AT
UR
E D
AT
A C
OM
PIL
ED
TO
RE
PR
ES
EN
T B
IOT
A-S
ED
IME
NT
AC
CU
MU
LA
TIO
N F
AC
TO
RS
(BS
AF
S)
FO
R V
AR
IOU
S T
YP
ES
OF
ED
IBL
E B
IOT
A A
ND
TH
EIR
TIS
SU
ES
Pri
mary
Pro
duce
rs
Inve
rteb
rate
s F
ishes
H
erpet
ofa
una
Element
Algae
Macrophytes (Generic)
Macrophytes (Floating-
leafed)
Macrophytes (Emergent)
Freshwater Invertebrates
Crustaceans (muscle)
Crustaceans (soft tissue)
Molluscs (muscle)
Molluscs (soft tissue)
Fishes (Generic)
Benthic Fishes (eggs)
Benthic Fishes (liver)
Benthic Fishes (muscle)
Benthic Fishes (whole)
Forage Fishes (eggs)
Forage Fishes (liver)
Forage Fishes (muscle)
Forage Fishes (whole)
Piscivorous Fishes (eggs)
Piscivorous Fishes (liver)
Piscivorous Fishes
(muscle)
Piscivorous Fishes (whole)
Tadpoles
Frog (muscle)
Frog (whole)
Reptiles
Tota
l
Ag
1
7
32
3
5
6
1
7
2
91
Al
13
12
3
30
8
4
5
6
33
5
7
35
3
05
Am
0
241A
m
0
As
2
1
4
1
12
1
43
5
1
57
5
4
37
8
4
32
4
33
Au
0
B
1
1
Ba
12
12
5
27
1
9
5
9
2
3
2
6
2
82
Be
1
1
1
1
4
Br
0
14C
0
Ca
1
1
1
1
40
Cd
1
7
1
10
6
52
1
5
55
10
2
2
8
1
0
3
51
3
41
Ce
0
Cl
0
Cm
0
Co
1
2
1
24
2
9
2
4
9
3
1
1
4
2
16
60C
o
0
5 33
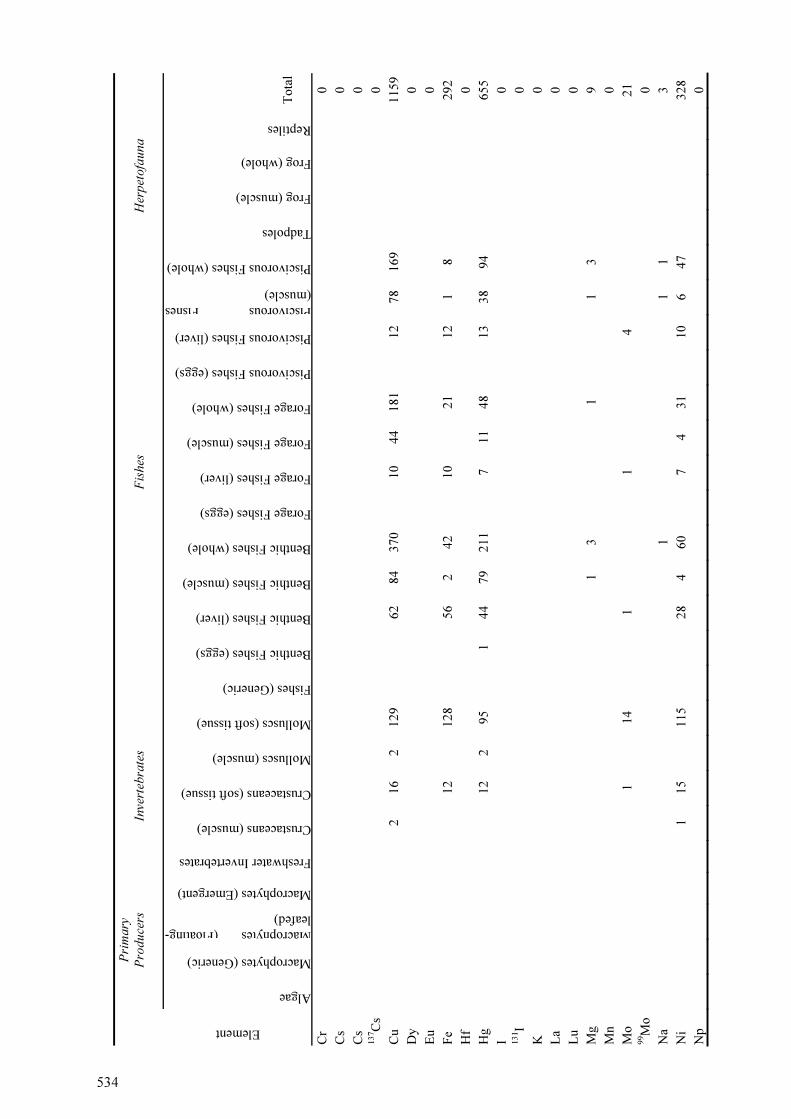
Pri
mary
Pro
duce
rs
Inve
rteb
rate
s F
ishes
H
erpet
ofa
una
Element
Algae
Macrophytes (Generic)
Macrophytes (Floating-
leafed)
Macrophytes (Emergent)
Freshwater Invertebrates
Crustaceans (muscle)
Crustaceans (soft tissue)
Molluscs (muscle)
Molluscs (soft tissue)
Fishes (Generic)
Benthic Fishes (eggs)
Benthic Fishes (liver)
Benthic Fishes (muscle)
Benthic Fishes (whole)
Forage Fishes (eggs)
Forage Fishes (liver)
Forage Fishes (muscle)
Forage Fishes (whole)
Piscivorous Fishes (eggs)
Piscivorous Fishes (liver)
Piscivorous Fishes
(muscle)
Piscivorous Fishes (whole)
Tadpoles
Frog (muscle)
Frog (whole)
Reptiles
Tota
l
Cr
0
Cs
0
Cs
0
137C
s
0
Cu
2
1
6
2
12
9
62
8
4
37
0
1
0
44
1
81
12
7
8
16
9
11
59
Dy
0
Eu
0
Fe
12
12
8
56
2
4
2
1
0
2
1
1
2
1
8
29
2
Hf
0
Hg
12
2
9
5
1
4
4
79
2
11
7
11
4
8
1
3
38
9
4
65
5
I
0
131I
0
K
0
La
0
Lu
0
Mg
1
3
1
1
3
9
Mn
0
Mo
1
14
1
1
4
2
1
99M
o
0
Na
1
1
1
3
Ni
1
1
5
1
15
2
8
4
60
7
4
31
10
6
4
7
32
8
Np
0
534

Pri
mary
Pro
duce
rs
Inve
rteb
rate
s F
ishes
H
erpet
ofa
una
Element
Algae
Macrophytes (Generic)
Macrophytes (Floating-
leafed)
Macrophytes (Emergent)
Freshwater Invertebrates
Crustaceans (muscle)
Crustaceans (soft tissue)
Molluscs (muscle)
Molluscs (soft tissue)
Fishes (Generic)
Benthic Fishes (eggs)
Benthic Fishes (liver)
Benthic Fishes (muscle)
Benthic Fishes (whole)
Forage Fishes (eggs)
Forage Fishes (liver)
Forage Fishes (muscle)
Forage Fishes (whole)
Piscivorous Fishes (eggs)
Piscivorous Fishes (liver)
Piscivorous Fishes
(muscle)
Piscivorous Fishes (whole)
Tadpoles
Frog (muscle)
Frog (whole)
Reptiles
Tota
l
P
0
Pb
2
8
2
63
1
5
8
16
2
2
4
1
09
4
8
94
4
81
Pb
-
21
0
0
Po
-
21
0
0
Pu
0
Pu-
23
9
0
Ra
0
Ra-
22
6
0
Rb
0
Ru
0
Ru
-
10
6
0
Sb
1
7
2
2
1
2
Sc
0
Se
4
9
9
53
8
3
3
9
1
8
11
7
2
0
25
3
Sm
0
Sn
1
1
2
Sr
12
12
3
52
29
8
1
11
5
24
1
Sr-
90
0
53 5
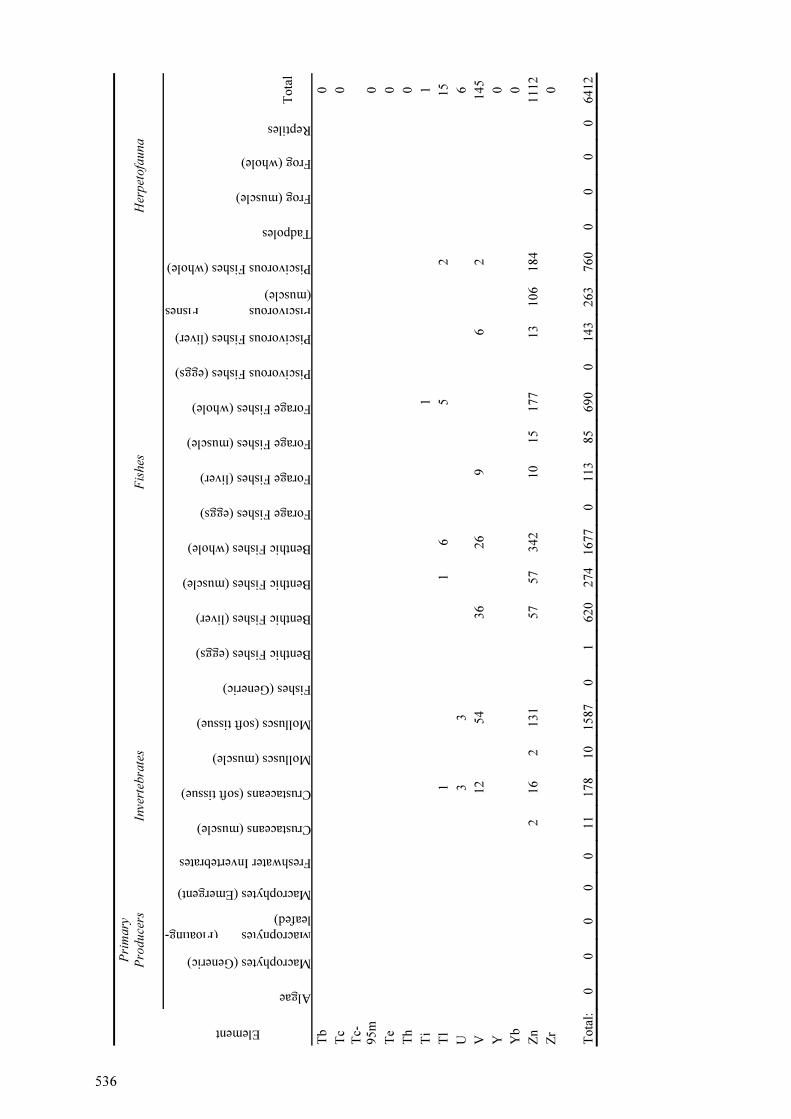
Pri
mary
Pro
duce
rs
Inve
rteb
rate
s F
ishes
H
erpet
ofa
una
Element
Algae
Macrophytes (Generic)
Macrophytes (Floating-
leafed)
Macrophytes (Emergent)
Freshwater Invertebrates
Crustaceans (muscle)
Crustaceans (soft tissue)
Molluscs (muscle)
Molluscs (soft tissue)
Fishes (Generic)
Benthic Fishes (eggs)
Benthic Fishes (liver)
Benthic Fishes (muscle)
Benthic Fishes (whole)
Forage Fishes (eggs)
Forage Fishes (liver)
Forage Fishes (muscle)
Forage Fishes (whole)
Piscivorous Fishes (eggs)
Piscivorous Fishes (liver)
Piscivorous Fishes
(muscle)
Piscivorous Fishes (whole)
Tadpoles
Frog (muscle)
Frog (whole)
Reptiles
Tota
l
Tb
0
Tc
0
Tc-
95
m
0
Te
0
Th
0
Ti
1
1
Tl
1
1
6
5
2
1
5
U
3
3
6
V
12
54
3
6
2
6
9
6
2
1
45
Y
0
Yb
0
Zn
2
1
6
2
13
1
57
5
7
34
2
1
0
15
1
77
13
1
06
1
84
1
11
2
Zr
0
To
tal:
0
0
0
0
0
1
1
17
8
10
1
58
70
1
6
20
2
74
1
67
70
1
13
8
5
69
0
0
14
3
26
3
76
0
0
0
0
0
64
12
536

537
SUMMARY OF AVAILABLE ORGAN-TO-REFERENCE ORGAN
CONCENTRATION RATIO DATA FOR EDIBLE FRESHWATER BIOTA TISSUES.
TABLE AIII.3. GAP ANALYSIS DEPICTING THE NUMBER OF CONCENTRATION RATIO
VALUES AVAILABLE FOR STABLE ELEMENTS IN VARIOUS ORGANS OF AQUATIC MACROPHYTES
Element Whole Shoots Leaves Stems Roots Fruits Epiphytes
Al
Ba
Ca
Cd 4 4 4
Ce
Co 14 14 14
Cr 2 2
Cs 7 3 2 9 4 7
Cu 2 2
Eu 7 7 7
Fe
K
La
Mb
Mg
Mn 3 14 14 17
Na
Ni
P
Pb 2 4 4 6
Po 1 1
Pu
Rb
Ru
Sb
Sr
Te
Th
Tl
U
V
Y
Zn
Zr

538
TABLE AIII.4. GAP ANALYSIS DEPICTING THE NUMBER OF CONCENTRATION RATIO VALUES AVAILABLE FOR STABLE ELEMENTS IN VARIOUS ORGANS OF FRESHWATER
MOLLUSCS
Element Whole Shell Soft Tissue Viscera Muscle Foot Gills Mantle
Al
Ba
Ca
Cd 1 1 2 3 3 3
Ce
Co
Cr
Cs
Cu 2 2 2 2
Eu
Fe 2 2 2 2
Hg 1 1 2 3 3 3
I 1 1
K
La
Mb
Mg
Mn 1 2 2 2 2 2 2
Mo
Na
Ni
P
Pb 2 2 2 2
Po 2 2
Pu
Rb
Ru
Sb
Sr 1 1
Te
Th
Tl
U
V
Y
Zn 2 2 2 2
Zr
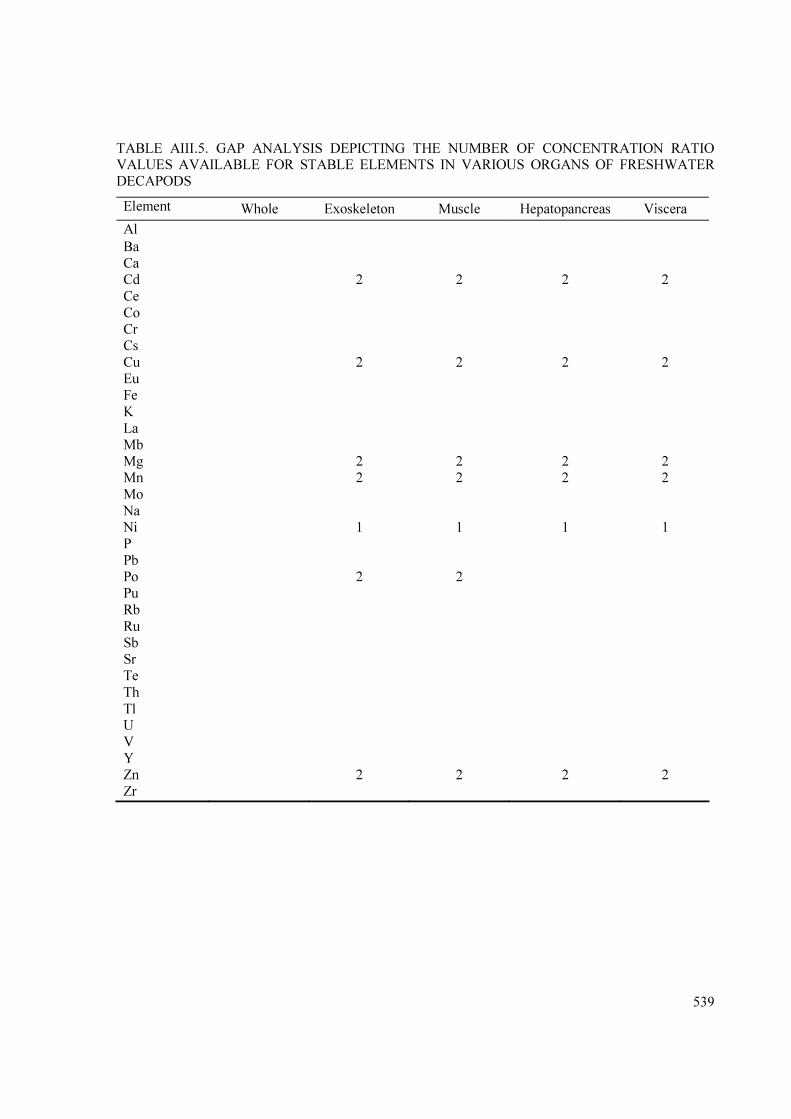
539
TABLE AIII.5. GAP ANALYSIS DEPICTING THE NUMBER OF CONCENTRATION RATIO VALUES AVAILABLE FOR STABLE ELEMENTS IN VARIOUS ORGANS OF FRESHWATER
DECAPODS
Element Whole Exoskeleton Muscle Hepatopancreas Viscera
Al
Ba
Ca
Cd 2 2 2 2
Ce
Co
Cr
Cs
Cu 2 2 2 2
Eu
Fe
K
La
Mb
Mg 2 2 2 2
Mn 2 2 2 2
Mo
Na
Ni 1 1 1 1
P
Pb
Po 2 2
Pu
Rb
Ru
Sb
Sr
Te
Th
Tl
U
V
Y
Zn 2 2 2 2
Zr
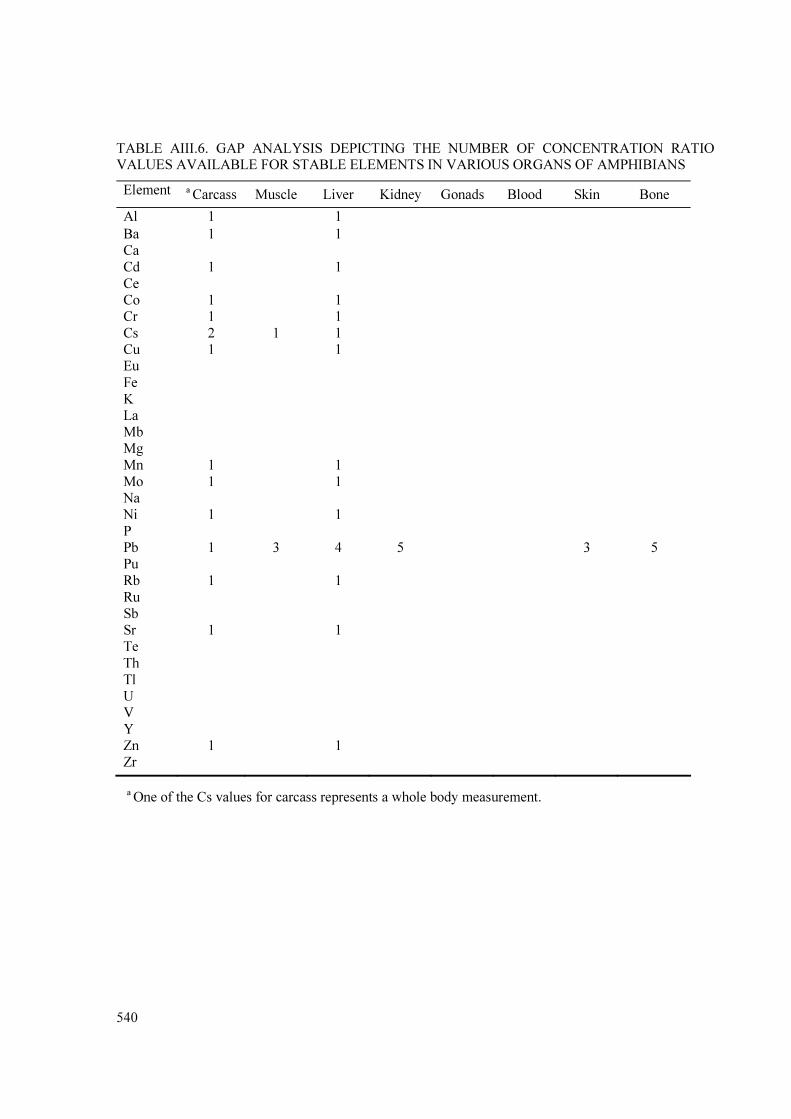
540
TABLE AIII.6. GAP ANALYSIS DEPICTING THE NUMBER OF CONCENTRATION RATIO VALUES AVAILABLE FOR STABLE ELEMENTS IN VARIOUS ORGANS OF AMPHIBIANS
Element a Carcass Muscle Liver Kidney Gonads Blood Skin Bone
Al 1 1
Ba 1 1
Ca
Cd 1 1
Ce
Co 1 1
Cr 1 1
Cs 2 1 1
Cu 1 1
Eu
Fe
K
La
Mb
Mg
Mn 1 1
Mo 1 1
Na
Ni 1 1
P
Pb 1 3 4 5 3 5
Pu
Rb 1 1
Ru
Sb
Sr 1 1
Te
Th
Tl
U
V
Y
Zn 1 1
Zr
a One of the Cs values for carcass represents a whole body measurement.

541
TABLE AIII.7. GAP ANALYSIS DEPICTING THE NUMBER CONCENTRATION RATIO VALUES AVAILABLE FOR STABLE ELEMENTS IN VARIOUS ORGANS OF FRESHWATER
REPTILES
Element Muscle Liver Kidney Gonads Heart Blood Skin Bone
Ac 1 1
Al
Ba
Ca
Cd
Ce
Co
Cr
Cs
Cu
Eu
Fe
K
La
Mb
Mg
Mn
Mo
Na
Ni
P
Pb 2 1 1 1
Po 2 1 1 1
Pu
Po
Ra 2 1 1 1
Ru
Sb
Sr
Te
Th 3 3 1
Tl
U 4 4 2
V
Y
Zn
Zr

TA
BL
E A
III.
8. G
AP
AN
AL
YS
IS D
EP
ICT
ING
TH
E N
UM
BE
R O
F C
ON
CE
NT
RA
TIO
N R
AT
IO V
AL
UE
S A
VA
ILA
BL
E F
OR
ST
AB
LE
EL
EM
EN
TS
IN
V
AR
IOU
S O
RG
AN
S O
F F
RE
SH
WA
TE
R F
ISH
ES
Ele
men
t
Whole
Muscle
Carcass
a
Bone
Gills
Skin
Scales
Blood
Blood Serum
Air Bladder
Liver
Kidney
Gonad
Fat
Eye
Pancreas
Brain
Spleen
Heart
Thyroid
Gall Bladder
Epidermal Mucous
Head
Fin
Viscera
Ag
Al
4
4
As
1
1
1
1
Ba
Ca
17
9
8
8
8
Cd
33
4
19
9
32
13
22
2
Ce
Co
4
11
8
4
3
2
5
5
1
1
2
2
Cr
1
1
1
1
1
1
Cs
Cu
34
3
16
19
1
2
1
26
23
15
3
3
8
2
2
1
Eu
Fe
1
24
5
5
8
4
16
15
9
2
8
Hg
11
4
11
4
3
I
3
5
3
K
La
1
1
1
1
1
1
Mb
Mg
8
8
8
8
Mn
3
28
2
4
19
17
4
19
25
11
2
2
8
2
4
4
6
Mo
Na
1
1
1
1
1
1
1
1
1
2
1
1
1
Ni
11
4
11
2
2
2
P
1
1
1
1
1
1
1
1
1
2
1
1
1
Pb
14
77
4
11
52
16
67
22
37
2
5
9
9
542

Ele
men
t
Whole
Muscle
Carcass
a
Bone
Gills
Skin
Scales
Blood
Blood Serum
Air Bladder
Liver
Kidney
Gonad
Fat
Eye
Pancreas
Brain
Spleen
Heart
Thyroid
Gall Bladder
Epidermal Mucous
Head
Fin
Viscera
Po
6
6
Ra
10
22
17
7
5
Rb
1
1
Ru
3
3
1
1
1
1
Sc
1
2
2
1
1
1
1
2
2
1
1
2
1
1
1
Sr
2
10
8
1
1
1
1
1
1
1
1
1
1
1
1
Te
Th
2
2
Tl
U
7
15
12
7
5
V
Y
Zn
1
48
4
8
21
19
5
2
1
39
28
22
3
3
8
2
2
1
1
Zr
1
1
1
1
a
One
bone
val
ue
each
for
Cu a
nd Z
n r
epre
sents
skull
and o
ne
of
each
rep
rese
nts
ver
tebra
mea
sure
men
ts.
One
Sr
val
ue
in b
one
repre
sents
a v
erte
bra
mea
sure
men
t.
5 43

TA
BL
E A
III.
9.
GA
P A
NA
LY
SIS
D
EP
ICT
ING
T
HE
N
UM
BE
R O
F C
ON
CE
NT
RA
TIO
N R
AT
IO V
AL
UE
S A
VA
ILA
BL
E F
OR
S
TA
BL
E E
LE
ME
NT
S IN
VA
RIO
US
OR
GA
NS
OF
EE
LS
Ele
men
t W
ho
le
Mu
scle
B
on
e S
kin
B
lood
L
iver
K
idn
ey
Go
nad
G
ill
Bra
in
Hea
rt
Ag
Al
Ba
Ca
1
1
Cd
1
4
1
4
3
4
3
3
Ce
Co
Cr
Cs
Cu
1
1
1
1
1
1
Eu
Fe
Hg
1
1
1
1
1
K
La
Mb
Mg
Mn
Mo
Na
Ni
P
Pb
Pu
Rb
Ru
Sb
Sr
1
1
Te
Th
Tl
U
V
Y
Zn
1
1
1
1
1
1
Zr
54 4

545
TABLE AIII.10. GAP ANALYSIS DEPICTING THE NUMBER OF CONCENTRATION
RATIO VALUES AVAILABLE FOR STABLE ELEMENTS IN VARIOUS ORGANS OF
MIGRATORY BIRDS
Element Whole Muscle Bone Feathers Blood Liver Kidney Gonad
Ag
Al
Ba
Ca
Cd
Ce
Co
Cr
Cs 9 10 3
Cu
Eu
Fe
Hg
K
La
Mb
Mg
Mn
Mo
Na
Ni
P
Pb 11 11
Pu
Rb
Ru
Sb
Sr
Te
Th
Tl
U
V
Y
Zn
Zr


MISCELLANEOUS TOPICS


549
SPECIFIC ACTIVITY MODELS AND PARAMETER VALUES
FOR TRITIUM, 14
C AND 36
Cl
P.A. DAVIS
Atomic Energy of Canada Limited, Canada
E. LECLERC
National Radioactive Waste Management Agency, France
D.C. GALERIU, A. MELINTESCU
Horia Hulubei National Institute for Physics and Nuclear Engineering, Romania
V. KASHPAROV
Ukrainian Institute of Agricultural Radiology, Ukraine
S -R. PETERSON
Lawrence Livermore National Laboratory, USA
P.M. RAVI
Bhabha Atomic Research Centre, India
F. SICLET
Electricité de France, France
C. TAMPONNET
Institute of Radioprotection and Nuclear Safety, Centre de Cadarache,
Saint Paul-lez-Durances, France
Abstract
Tritium, 14C and 36Cl are long-lived isotopes of biologically-regulated, essential elements that are highly mobile in the
environment. Under equilibrium conditions, specific activity (SA) models can be used to describe the environmental transfer
of these isotopes based on the behaviour of the stable elements hydrogen, carbon and chlorine, respectively. SA models for
the transfer of tritiated water and 14C through the environment following release to air and water, and for transfer from soils
contaminated via irrigation or releases from subsurface waste management areas, are described in this paper. Models are also
presented for the environmental transfer of tritiated hydrogen gas following release to air, and for the transfer of 36Cl to
animal products. All of the tritium models account for the formation of organically bound tritium in plants and animals.
Values of the parameters required by the models are listed in all cases. Areas in which further knowledge is needed to
improve the confidence in the predictions of the models are identified.
1. INTRODUCTION
The models described in the previous papers are largely based on trace element partitioning
and accumulation concepts, which are expressed quantitatively in terms of transfer factors that
describe the transport of radionuclides between different environmental compartments. Under
equilibrium conditions, the specific activity model provides an alternative approach for long-
lived isotopes of biologically-regulated, essential elements that are highly mobile in the
environment.
The behaviour of such an isotope mimics that of the stable form of the element in physical
and biological processes. The flux of the isotope from one compartment to another is
determined by the flux of the essential element (except in the case of diffusion, where the
stable and active forms follow their respective vapour pressure gradients). Moreover,
feedback mechanisms such as homeostasis act to control the flux of the essential element and
.

550
hence, indirectly, the flux of the isotope. Models for these isotopes can be formulated in terms
of specific activity concepts, where specific activity (SA) is defined as the radionuclide
activity per mass of the stable element. SA models are used here for tritium, 14
C and 36
Cl (for
plant to animal transfer only in the case of 36
Cl), based on the environmental behaviour of the
stable elements hydrogen, carbon and chlorine, respectively. In principle, the SA model can
be applied to 129
I as well, but this has not been common practice.
In the simplest application of the SA model, the radioisotope mixes physically and chemically
with its corresponding stable element within some compartment of the environment, resulting
in a certain specific activity. Any organism drawing the stable element from this compartment
draws the radioisotope in proportion, and attains the same SA as the source compartment. The
concentration of the isotope in the organism can be readily calculated from the concentration
of the stable element, which is usually well known. In practice, the application of SA models
requires a good understanding and precise definition of the environmental compartments
within which the radionuclide of interest can be mixed, and of the fluxes that occur between
those compartments. Mathematically, the specific activity (J
SA ) in a compartment J that
draws an element S from N other compartments is given by:
SAJ =
∑
∑
=
=
⋅
⋅⋅
=
N
i
ii
N
i
iFii
J
J
Sq
ADq
S
A
1
1 (1)
Here Ai is the concentration of the active form of the element in compartment i (Bq kg-1
), Si is
the concentration of the stable form (g kg-1
), and qi is the flux of the element from
compartment i to compartment J (g d-1
). F
D is an isotopic discrimination factor that is
introduced to allow for the possibility that the stable and active forms may have significantly
different masses and therefore different transfer rates between compartments. The
concentration of the radioisotope in compartment j is found by multiplying J
SA by the
concentration of the stable element in the compartment. Isotopic exchange with relatively
uncontaminated pools of the stable element results in progressive dilution of the isotope with
distance from the source.
Most parameter values in specific activity models show relatively little variability and their
distributions are best described as normal. However, for consistency with the rest of this
document, the means and variations of the parameters discussed below are presented in terms
of their geometric means (GM) and geometric standard deviations (GSD). This is not
necessarily meant to imply that these parameters are lognormally distributed, or that the usual
statistical properties of lognormal distributions apply to them. In reality though, the geometric
and arithmetic means are almost identical for most of the parameters, and the spread in values
implied by the geometric and standard deviations are similar.
The models and parameter values considered here are applicable only to steady-state
conditions. Dynamic releases can be incorporated into the SA approach by considering the
ratios of active-to-stable fluxes between compartments rather than the ratios of active-to-
stable concentrations in the compartments. However, such an approach is complex and the
uncertainties in the predictions of dynamic models are large. For tritium in particular, the
model parameters depend upon meteorological and plant variables that are highly scenario-
specific. It is not clear how to supply generic parameter values for dynamic models of tritium, 14
C or 36
Cl, and the discussion below is restricted to steady-state situations. This includes

551
conditions near a continuous source, where concentrations at a given location fluctuate
regularly with changes in meteorological conditions, particularly wind direction. SA models
give reliable results in such situations provided the predictions of interest are long-term
averages.
2. TRITIUM
Following traditional usage, the SA model for tritium is formulated in terms of the tritium
concentration in water rather than the ratio of tritium activity to the mass of hydrogen in a
given compartment. There is a one-to-one correspondence between these two quantities and it
is the concentration in water (the HTO concentration) that is normally measured. Tritium can
also be incorporated into the organic matter of plants and animals as non-exchangeable
organically bound tritium (OBT). This is the form of tritium that remains in dry biomatter that
has been repeatedly washed with tritium-free water. Its concentration is calculated as the
activity in the water equivalent of the dry matter (the water produced by complete combustion
of the dry material). Models and parameter values are also given for releases of tritiated
hydrogen gas (HT).
2.1 Release of HTO to air
2.1.1 Transfer from air to soil
Tritium is transferred from air to soil through wet and dry deposition from the airborne plume.
Concentrations in soil water are lower than those in air moisture, partly because precipitation
is less contaminated than air moisture and partly because soil water concentrations are diluted
by uncontaminated precipitation that falls when the plume is not present. Here, the soil water
concentration (Csw, Bq L-1
) is assumed to be proportional to the concentration in air moisture
(Cam, Bq L-1
), with a proportionality constant CRs:
amsswCCRC ⋅= (2)
sCR is difficult to estimate since HTO concentrations in both soil water and air moisture must
be measured often enough to provide reliable averages over the growing season. The values
depend upon a number of local factors, notably the frequency with which rain falls when the
airborne plume is present at the site of interest. The few available data are listed in Table 1.
On balance, a default value of 0.3 is reasonable, consistent with the recommendation of IAEA
[1]. A value of 0.5 is likely to be conservative, although values as high as 1.0 are possible.
The data in Table 1 suggest that southern or wetter regions may have higher values of s
CR .
Values based on local measurements should be used wherever possible.
Equation (2) should not be applied close to an elevated source where air concentrations are
low or zero because the plume has not diffused down to the ground. Under such conditions,
Equation (2) would predict low or zero concentrations in soil water, whereas in reality the
concentration could be high due to wet deposition when precipitation falls through the
elevated plume. This is not a serious restriction in practice because the model is usually
applied to members of the public who are located far enough from the source that the plume
has descended to the ground.

552
TABLE 1. RATIO OF SOIL FREE WATER TO AIR MOISTURE CONCENTRATION (s
CR )
Reference Country of
Measurement
Min. Max Conditions of Measurement
[2] Russian
Federation
1.3 × 10⁻¹ 3.4 × 10⁻¹ 3 values for sandy soils, each based on annual average
air concentration and a single measurement of soil
concentration in September. Annual precipitation: 560
mm
[3] France 8 × 10⁻² 2 × 10⁻¹ 2 values, each based on air and soil concentrations
averaged over a 20-month period. Air concentrations
were measured continuously and soil concentrations
monthly. Total precipitation over the study period:
1072 mm
[4] Canada 1.5 × 10⁻¹ 3.1 × 10⁻¹ 7 values for sandy soils, each based on air and soil
concentrations averaged over the growing season. Air
concentrations were measured continuously and soil
concentrations daily or weekly. Annual precipitation:
880 mm
P.M. Ravi,
BARC1
India 4 × 10⁻¹ Mean of 9 measurements in sandy loam soils covering
rainy and winter seasons
Y. Inoue, NIRS1 Japan 7.6 × 10⁻¹ Based on weekly air and soil concentrations measured
between mid-April and June. Air concentrations were
weekly averages and soil concentrations were
measured once per week.
All data GM = 2.3 × 10⁻¹ GSD = 1.7
1Personal communication.
The HTO concentration in air moisture is calculated from the HTO concentration in air (Cair
Bq m-3
) and the absolute humidity (Ha, kg m-3
):
a
air
am
H
CC = (3)
The value of Cair is assumed known through measurement or modelling. The absolute
humidity is commonly measured by national weather services, and site-specific values are
usually readily available and preferred. In the absence of local data, default values are given
in Table 2 for different climates [5]. If the relative humidity (RH) is known, Ha can be found
from:
a
s
a
T
RHeH
⋅⋅⋅
=
−31017.2
(4)
where se is the saturation vapour pressure (Pa) and
aT is air temperature (K). The saturated
vapour pressure is a function of temperature only and is available in a number of lookup
tables [6].
TABLE 2 SELECTED DEFAULT VALUES OF THE RELATIVE AND ABSOLUTE HUMIDITY FOR DIFFERENT CLIMATES AVERAGED OVER THE GROWING SEASON [5]
Climate Latitude Absolute humidity (Ha)
(kg m-3
)
Relative Humidity (RH)
Mediterranean (Cordoba) 34 0.0115 0.6
Continental (Munich) 48 0.0087 0.71
Maritime (London) 50 0.0078 0.795
Arctic (Northern Finland) 70 0.0067 0.73

553
2.1.2 Transfer to plants
HTO: Plants take up tritium from both air and soil. The HTO concentration in the free water
of the leaf (commonly referred to as the tissue free-water tritium (TFWT) concentration) is
calculated using a steady-state model [7] that explicitly considers the contributions from these
two sources. The model is based on theoretical considerations and controlled experiments [8-
10], and is written as:
γ/])1([swamTFWT
CRHCRHC ⋅−+⋅= , (5)
where TFWT
C is the HTO concentration in the leaf free water (Bq L-1
) andγ (= 0.909) is the
ratio of the HTO vapour pressure to that of H2O.
When the relative humidity is 1, the transpiration stream shuts down and Equation (5) predicts
that no soil tritium is carried to the leaves. In this case, the tritium in the leaves is due entirely
to transfer from the air via diffusion through the stomates, and the leaf concentration comes
into equilibrium with the concentration in air moisture. As the humidity drops, transpiration
brings low concentration water up to the leaves, diluting the input from the air. In the limit
RH = 0 (a physically impossible situation) there is no HTO in the air and no transfer from air
to leaf, and the plant concentration equals the concentration in the transpiration stream.
The relative contributions of air moisture and soil water to the tritium concentration in the
plant depend on the part of the plant under consideration. The partitioning in Equation (5) in
terms of the relative humidity applies specifically to plant leaves that, under normal
circumstances, draw the majority of their tritium from the air. The equation does not apply to
fruit, tubers or root crops, which draw a larger fraction of their tritium from the soil [11]. The
concentration in tubers and root crops is close to that in soil water. The concentration in fruit
water is intermediate between the concentration in leaves and soil water. However, the
available data do not permit the fractional contributions of air and soil water to the tritium
concentration in fruit, tubers or root crops to be quantified with any confidence. Thus
Equation (5) is used for all plant parts, with the recognition that it will be conservative for all
parts other than leaves, since concentrations in soil water are lower than those in air moisture
for an atmospheric release.
Equation (5) is a simplification of a more general formula [7, 12] that considers the effect of
leaf/air temperature differences, which are ignored in the simplified version. Equation (5) can
also be derived as the steady-state solution of a more complex dynamic equation [13] that
considers tritium fluxes between air, soil and plants using a resistance model. Equation (5)
can be obtained from this model if it is assumed that the temperature of the air, soil surface
and leaf are the same; that the mass of plant water is constant; and that the HTO concentration
at the soil surface is equal to the concentration in root water. Equation (5) is in common use in
the tritium modelling community [1] and requires a minimal amount of input data. Various
validation exercises have demonstrated that, when it is used to predict average concentrations
close to harvest, it provides realistic or slightly conservative estimates of the amount of HTO
in the plant.
The averaging time of the parameters appearing in Equation (5) depends on the application.
To predict the tritium concentration in leaf water at harvest, the input values should reflect
conditions that prevail close to the harvest time, since turnover of tritium in plant leaves
occurs on time scales of minutes to hours. In contrast, if Equation (5) is used as the first step
in calculating OBT concentrations, the input values should be averaged over the growing

554
season of the organs to be harvested. This is because the OBT concentration at harvest is
roughly proportional to the mean TFWT concentration in leaves over the growing phase,
assuming that growth is nearly linear and that most of the OBT, once formed, remains in the
plant until harvest.
The HTO concentration in the fresh weight (FW) plant (Bq kg-1
FW) is given by
TFWTp
HTO
pfw CWCC ⋅= (6)
where p
WC is the fractional water content of the plant. Water contents for a number of broad
plant categories are listed in Table 3. These are the same categories defined in this TECDOC
earlier, except that some groups have been combined (leafy with non-leafy vegetables, cereals
with rice, and grass with fodder and pasture), and the categories for herbs and “other’ plants
are not considered. The dry matter contents reported in Appendix 1 for individual species
have been synthesized, converted to water contents and combined with data from other
sources to produce the values in Table 3. These values apply to the edible part of the plant as
harvested. Some grasses are dried before use as animal feed, in which case their water
contents are better represented by the value for cereals (12%). A value for silage is also
provided since this is a common form of animal feed.
TABLE 3. DEFAULT WATER CONTENTS (WCp, %) FOR PLANT CATEGORIES [14 -24]
Plant category N GM GSD Min. Max
Leafy and non-leafy vegetables 88 92 1.03 84 97
Leguminous vegetables–seed
–vegetative mass
11
16
12
81
1.19
1.10
9.3
69
17
91.4
Root crops 39 87 1.05 76.9 95
Tubers 10 75 1.08 62.2 82.2
Fruit 102 85 1.06 73.4 96
Grass, Fodder, Pasture 33 76 1.07 67.1 90
Cereals (including rice) 22 12 1.17 10 16
Maize–sweet corn
–feed corn
4
11
71
16
1.05
1.46
68.1
10
76.4
25.2
Silage 13 66 1.15 55 82
OBT: Tritium is incorporated into the organic matter of plants during photosynthesis in the
presence of light and through metabolic processes in the dark. Tritiated organic material
occurs in two main forms: exchangeable and non-exchangeable. The former is in equilibrium
with plant tritiated water and behaves as TFWT in all respects. The latter is more stable and
has a longer residence time in plants and animals, making it a greater radiological risk.
Organically bound tritium (OBT) is usually considered to refer to the non-exchangeable form,
and that will be the case here. Since most dry matter is formed in the presence of water, the
plant OBT concentration is similar to the TFWT concentration. However, due to the larger
mass of tritium compared to hydrogen, isotopic fractionation results in an OBT specific
activity that is lower than that for HTO [25]. Accordingly, the OBT concentration in water
produced from the complete oxidation of organically bound hydrogen in plant tissues (Bq L-1
)
is equal to the TFWT concentration in the leaf water modified by a partition factor p
R :
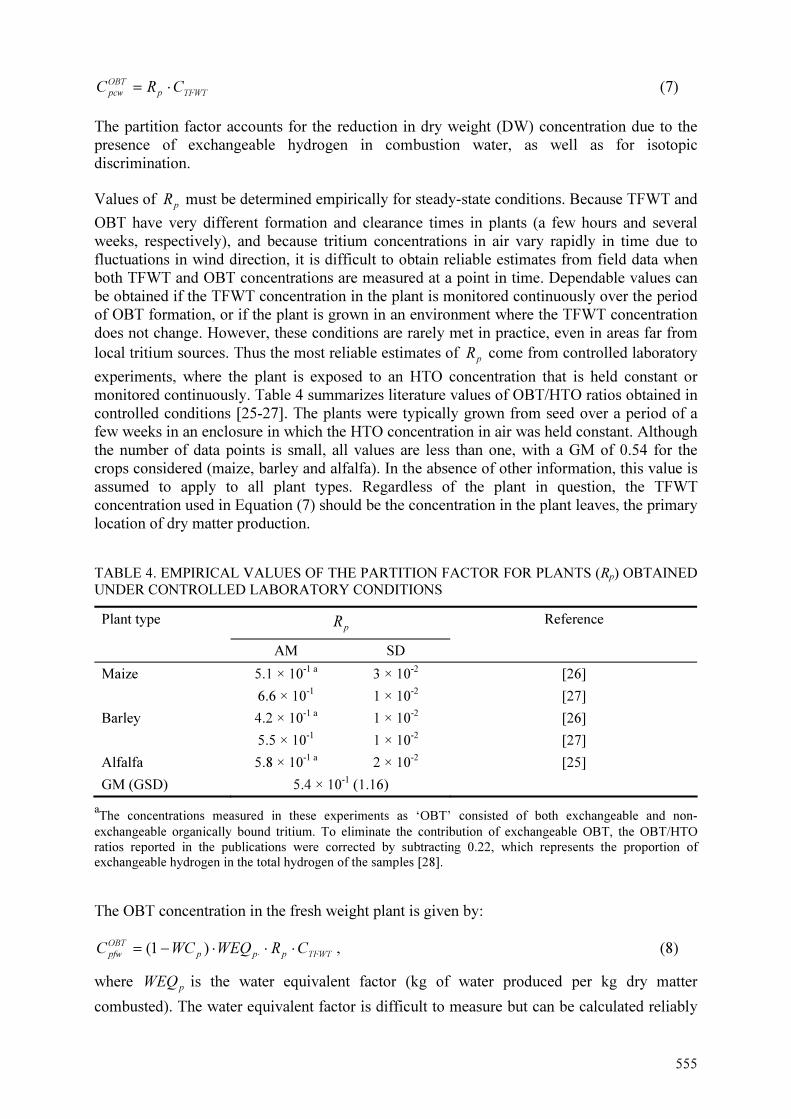
555
TFWTp
OBT
pcw CRC ⋅= (7)
The partition factor accounts for the reduction in dry weight (DW) concentration due to the
presence of exchangeable hydrogen in combustion water, as well as for isotopic
discrimination.
Values of p
R must be determined empirically for steady-state conditions. Because TFWT and
OBT have very different formation and clearance times in plants (a few hours and several
weeks, respectively), and because tritium concentrations in air vary rapidly in time due to
fluctuations in wind direction, it is difficult to obtain reliable estimates from field data when
both TFWT and OBT concentrations are measured at a point in time. Dependable values can
be obtained if the TFWT concentration in the plant is monitored continuously over the period
of OBT formation, or if the plant is grown in an environment where the TFWT concentration
does not change. However, these conditions are rarely met in practice, even in areas far from
local tritium sources. Thus the most reliable estimates of p
R come from controlled laboratory
experiments, where the plant is exposed to an HTO concentration that is held constant or
monitored continuously. Table 4 summarizes literature values of OBT/HTO ratios obtained in
controlled conditions [25-27]. The plants were typically grown from seed over a period of a
few weeks in an enclosure in which the HTO concentration in air was held constant. Although
the number of data points is small, all values are less than one, with a GM of 0.54 for the
crops considered (maize, barley and alfalfa). In the absence of other information, this value is
assumed to apply to all plant types. Regardless of the plant in question, the TFWT
concentration used in Equation (7) should be the concentration in the plant leaves, the primary
location of dry matter production.
TABLE 4. EMPIRICAL VALUES OF THE PARTITION FACTOR FOR PLANTS (Rp) OBTAINED UNDER CONTROLLED LABORATORY CONDITIONS
Plant type p
R Reference
AM SD
Maize 5.1 × 10⁻¹ a
3 × 10⁻²
[26]
6.6 × 10⁻¹
1 × 10⁻²
[27]
Barley 4.2 × 10⁻¹ a
1 × 10⁻²
[26]
5.5 × 10⁻¹
1 × 10⁻²
[27]
Alfalfa 5.8 × 10⁻¹ a
2 × 10⁻²
[25]
GM (GSD) 5.4 × 10⁻¹
(1.16)
aThe concentrations measured in these experiments as ‘OBT’ consisted of both exchangeable and non-
exchangeable organically bound tritium. To eliminate the contribution of exchangeable OBT, the OBT/HTO
ratios reported in the publications were corrected by subtracting 0.22, which represents the proportion of
exchangeable hydrogen in the total hydrogen of the samples [28].
The OBT concentration in the fresh weight plant is given by:
TFWTppp
OBT
pfw CRWEQWCC ⋅⋅⋅−=⋅
)1( , (8)
where pWEQ is the water equivalent factor (kg of water produced per kg dry matter
combusted). The water equivalent factor is difficult to measure but can be calculated reliably

556
from the hydrogen content of protein, fat and carbohydrate (7%, 12% and 6.2%, respectively)
and the fractions of protein, fat and carbohydrate in the dry matter of the plant in question.
The calculated values, which are shown in Table 5, vary little among the various plant
categories.
TABLE 5 DEFAULT WATER EQUIVALENT FACTORS (WEQp, g water g-1
DW) FOR THE
VARIOUS PLANT CATEGORIES (calculated from data in [17, 20, 24])
Plant category N GM GSD Min. Max
Leafy vegetables 10 5.1 × 10⁻¹
1.05 4.7 × 10⁻¹
5.5 × 10⁻¹
Non-leafy vegetables 12 5.3 × 10⁻¹
1.03 5.0 × 10⁻¹
5.5 × 10⁻¹
Root crops 11 5.2 × 10⁻¹
1.06 4.5 × 10⁻¹
5.5 × 10⁻¹
All others
91 5.6 × 10⁻¹
1.04 5.0 × 10⁻¹
6.0 × 10⁻¹
2.1.3. Transfer to terrestrial animal products
Animals can ingest tritium as HTO in feed and drinking water and as OBT in the organic
fraction of feed. Inhalation and skin absorption are also possible routes of HTO intake.
Exchangeable organic tritium and HTO rapidly equilibrate with body water. Most of the HTO
taken in by an animal remains as HTO in the body, with a small fraction converted to OBT. In
contrast, about half the OBT taken in is converted to HTO, with the other half remaining in
organic form. Animal concentrations are generally lower than concentrations in air or plants
because their tritium inventory is diluted by drinking water, which has a concentration much
lower than that of air moisture for most atmospheric releases.
Here, concentrations in animal products are based on a metabolic model [29, 30] that relates
the concentrations in animal products to the concentration in feed and drinking water. The
model explicitly takes into account transfers from HTO in the diet to HTO and OBT in the
product, and from OBT in the diet to HTO and OBT in the product. It is expressed in terms of
transfer coefficients; the equilibrium activity concentrations of HTO and OBT in fresh weight
animal products are given by
OBT
OH
HTO
HH
HTO
afw IFIFC ⋅+⋅= (9)
OBT
OO
HTO
HO
OBT
afw IFIFC ⋅+⋅= (10)
Here HHF is the transfer coefficient from HTO in diet to HTO in animal product (d kg
-1 FW);
HOF is the transfer coefficient from HTO in diet to OBT in animal product (d kg
-1 FW);
OHF
is the transfer coefficient from OBT in diet to HTO in animal product (d kg-1
FW); OO
F is the
transfer coefficient from OBT in diet to OBT in animal product (d kg-1
FW); HTOI is the
daily intake of HTO (Bq d-1
); and OBTI
is the daily intake of OBT (Bq d
-1).
Expressions for the transfer coefficients were derived from a SA approach based on the
metabolism of hydrogen in the body:
w
tw
HH
IF
ν
= (11)
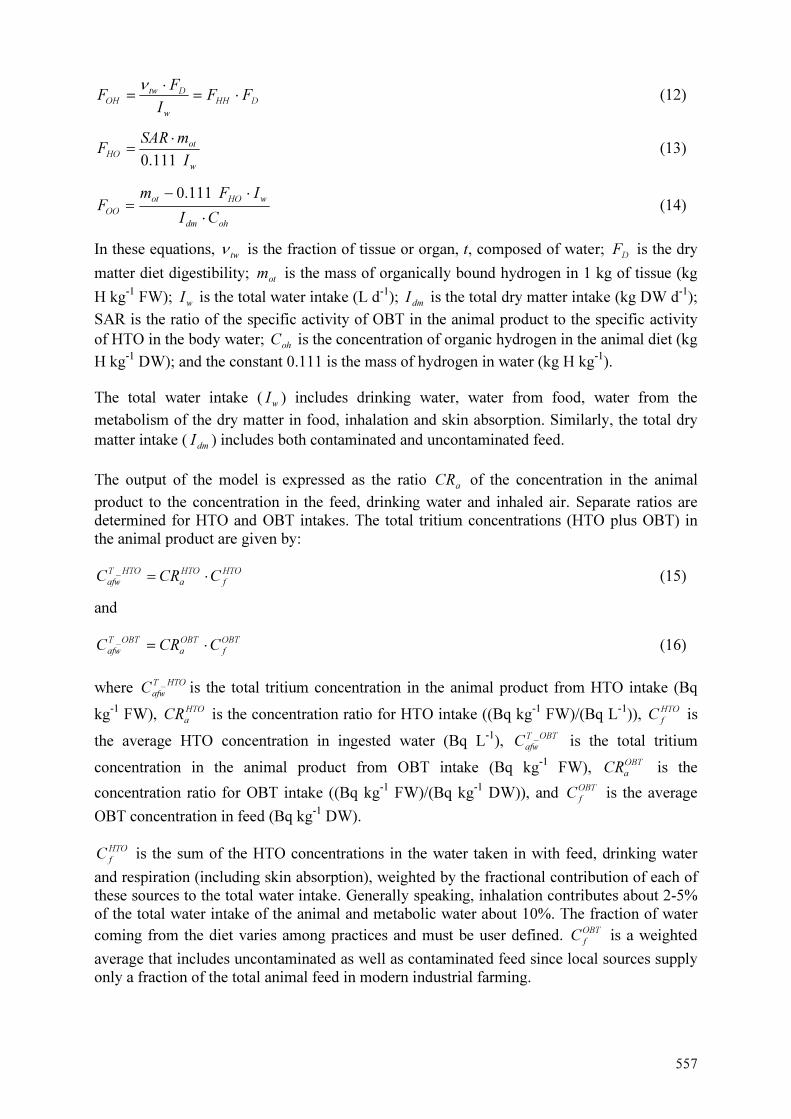
557
DHH
w
Dtw
OHFF
I
FF ⋅=
⋅
=
ν
(12)
w
ot
HO
I
mSARF
111.0
⋅
= (13)
ohdm
wHOot
OO
CI
IFmF
⋅
⋅−
=
111.0 (14)
In these equations, tw
ν is the fraction of tissue or organ, t, composed of water; D
F is the dry
matter diet digestibility; ot
m is the mass of organically bound hydrogen in 1 kg of tissue (kg
H kg-1
FW); wI is the total water intake (L d
-1);
dmI is the total dry matter intake (kg DW d
-1);
SAR is the ratio of the specific activity of OBT in the animal product to the specific activity
of HTO in the body water; oh
C is the concentration of organic hydrogen in the animal diet (kg
H kg-1
DW); and the constant 0.111 is the mass of hydrogen in water (kg H kg-1
).
The total water intake (wI ) includes drinking water, water from food, water from the
metabolism of the dry matter in food, inhalation and skin absorption. Similarly, the total dry
matter intake (dmI ) includes both contaminated and uncontaminated feed.
The output of the model is expressed as the ratio a
CR of the concentration in the animal
product to the concentration in the feed, drinking water and inhaled air. Separate ratios are
determined for HTO and OBT intakes. The total tritium concentrations (HTO plus OBT) in
the animal product are given by:
HTO
f
HTO
a
HTOT
afw CCRC ⋅=
_ (15)
and
OBT
f
OBT
a
OBTT
afw CCRC ⋅=
_ (16)
where HTOT
afwC_ is the total tritium concentration in the animal product from HTO intake (Bq
kg-1
FW), HTO
aCR is the concentration ratio for HTO intake ((Bq kg
-1 FW)/(Bq L
-1)), HTO
fC is
the average HTO concentration in ingested water (Bq L-1
), OBTT
afwC_ is the total tritium
concentration in the animal product from OBT intake (Bq kg-1
FW), OBT
aCR is the
concentration ratio for OBT intake ((Bq kg-1
FW)/(Bq kg-1
DW)), and OBT
fC is the average
OBT concentration in feed (Bq kg-1
DW).
HTO
fC is the sum of the HTO concentrations in the water taken in with feed, drinking water
and respiration (including skin absorption), weighted by the fractional contribution of each of
these sources to the total water intake. Generally speaking, inhalation contributes about 2-5%
of the total water intake of the animal and metabolic water about 10%. The fraction of water
coming from the diet varies among practices and must be user defined. OBT
fC is a weighted
average that includes uncontaminated as well as contaminated feed since local sources supply
only a fraction of the total animal feed in modern industrial farming.
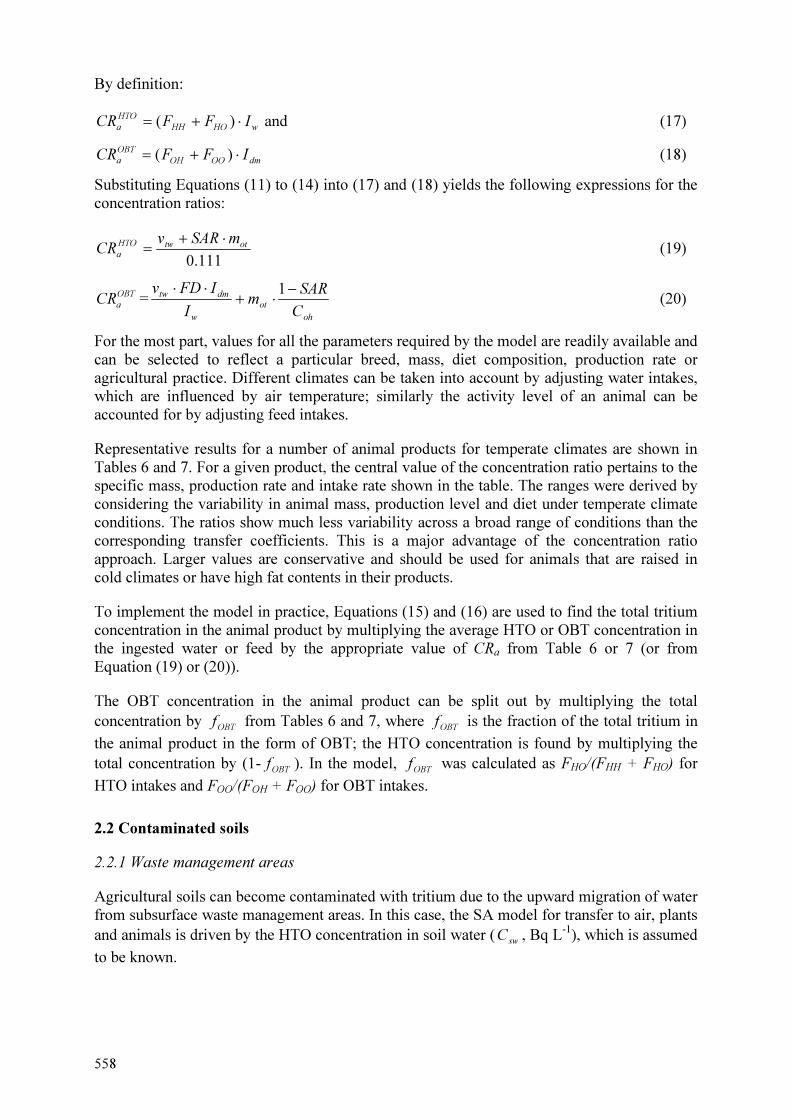
558
By definition:
wHOHH
HTO
aIFFCR ⋅+= )( and (17)
dmOOOH
OBT
aIFFCR ⋅+= )( (18)
Substituting Equations (11) to (14) into (17) and (18) yields the following expressions for the
concentration ratios:
111.0
ottwHTO
a
mSARvCR
⋅+= (19)
OBT
aCR =
oh
ot
w
dmtw
C
SARm
I
IFDv −⋅+
⋅⋅ 1 (20)
For the most part, values for all the parameters required by the model are readily available and
can be selected to reflect a particular breed, mass, diet composition, production rate or
agricultural practice. Different climates can be taken into account by adjusting water intakes,
which are influenced by air temperature; similarly the activity level of an animal can be
accounted for by adjusting feed intakes.
Representative results for a number of animal products for temperate climates are shown in
Tables 6 and 7. For a given product, the central value of the concentration ratio pertains to the
specific mass, production rate and intake rate shown in the table. The ranges were derived by
considering the variability in animal mass, production level and diet under temperate climate
conditions. The ratios show much less variability across a broad range of conditions than the
corresponding transfer coefficients. This is a major advantage of the concentration ratio
approach. Larger values are conservative and should be used for animals that are raised in
cold climates or have high fat contents in their products.
To implement the model in practice, Equations (15) and (16) are used to find the total tritium
concentration in the animal product by multiplying the average HTO or OBT concentration in
the ingested water or feed by the appropriate value of CRa from Table 6 or 7 (or from
Equation (19) or (20)).
The OBT concentration in the animal product can be split out by multiplying the total
concentration by OBTf from Tables 6 and 7, where
OBTf is the fraction of the total tritium in
the animal product in the form of OBT; the HTO concentration is found by multiplying the
total concentration by (1-OBTf ). In the model,
OBTf was calculated as FHO/(FHH + FHO) for
HTO intakes and FOO/(FOH + FOO) for OBT intakes.
2.2 Contaminated soils
2.2.1 Waste management areas
Agricultural soils can become contaminated with tritium due to the upward migration of water
from subsurface waste management areas. In this case, the SA model for transfer to air, plants
and animals is driven by the HTO concentration in soil water (sw
C , Bq L-1
), which is assumed
to be known.

559
TABLE 6. CONCENTRATION RATIOS FOR HTO INTAKE ( HTO
aCR )
HTO
aCR
, (Bq kg-1 FW product per Bq L-1
intake)
Product Animal
mass
(kg)
Intake rate
(kg DW d-1)
Production
rate (kg d-1
or L d-1)
Fraction OBT
(OBTf )
Value Min. Max.
Cow milk 550 14 15 4 × 10⁻² 8.7 × 10⁻¹ 8.1 × 10⁻¹ 9.2 × 10⁻¹
Sheep milk 50 1.8 1.3 6 × 10⁻² 7.8 × 10⁻¹ 7.6 × 10⁻¹ 8.9 × 10⁻¹
Goat milk 50 2.5 2.5 4 × 10⁻² 8.3 × 10⁻¹ 8.1 × 10⁻¹ 9.3 × 10⁻¹
Beef meat 500 9.3 7 × 10⁻¹ 9 × 10⁻² 6.6 × 10⁻¹ 6.4 × 10⁻¹ 8.2 × 10⁻¹
Veal meat 160 4.9 8 × 10⁻¹ 8 × 10⁻² 6.9 × 10⁻¹ 6.4 × 10⁻¹ 8.2 × 10⁻¹
Sheep meat 50 1.2 8 × 10⁻² 1.2 × 10⁻¹ 7.4 × 10⁻¹ 6.7 × 10⁻¹ 7.8 × 10⁻¹
Lamb meat 20 1.0 2 × 10⁻¹ 1.2 × 10⁻¹ 7.8 × 10⁻¹ 6.0 × 10⁻¹ 8.1 × 10⁻¹
Goat meat 50 1.2 8 × 10⁻² 1.0 × 10⁻¹ 6.7 × 10⁻¹ 6.4 × 10⁻¹ 8.1 × 10⁻¹
Pork meat 100 2.7 8 × 10⁻¹ 1.5 × 10⁻¹ 6.7 × 10⁻¹ 6.1 × 10⁻¹ 7.7 × 10⁻¹
Hen meat 2.5 1.2 × 10⁻¹ 7 × 10⁻³ 1.0 × 10⁻¹ 7.6 × 10⁻¹ 7.0 × 10⁻¹ 8.0 × 10⁻¹
Broiler meat 1.7 1.1 × 10⁻¹ 3 × 10⁻² 1.0 × 10⁻¹ 7.6 × 10⁻¹ 7.0 × 10⁻¹ 9.0 × 10⁻¹
Egg 2.5 1.5 × 10⁻¹ 4.5 × 10⁻² 8 × 10⁻² 6.6 × 10⁻¹ 6.4 × 10⁻¹ 8.1 × 10⁻¹
TABLE 7. CONCENTRATION RATIOS FOR OBT INTAKE ( OBT
aCR )
OBT
aCR
, (Bq kg-1 FW product
per Bq kg-1 DW intake)
Product Anim
al
mass
(kg)
Intake rate
(kg DW d-1)
Production
rate (kg d-1 or
L d-1)
Fraction OBT
Value Min Max
Cow milk 550 14 15 4.7 × 10⁻¹ 2.4 × 10⁻¹ 1.7 × 10⁻¹ 3.0 × 10⁻¹
Sheep milk 50 1.8 1.3 5.7 × 10⁻¹ 3.2 × 10⁻¹ 2.3 × 10⁻¹ 3.9 × 10⁻¹
Goat milk 50 2.5 2.5 4.0 × 10⁻¹ 3.2 × 10⁻¹ 2.5 × 10⁻¹ 3.8 × 10⁻¹
Beef meat 500 9.3 7 × 10⁻¹ 8.0 × 10⁻¹ 4.0 × 10⁻¹ 3.5 × 10⁻¹ 5.3 × 10⁻¹
Veal meat 160 4.9 8 × 10⁻¹ 7.2 × 10⁻¹ 3.5 × 10⁻¹ 3.1 × 10⁻¹ 4.5 × 10⁻¹
Sheep meat 50 1.2 8 × 10⁻² 7.5 × 10⁻¹ 4.0 × 10⁻¹ 3.5 × 10⁻¹ 5.6 × 10⁻¹
Lamb meat 20 1.0 2 × 10⁻¹ 7.8 × 10⁻¹ 5.5 × 10⁻¹ 4.1 × 10⁻¹ 6.7 × 10⁻¹
Goat meat 50 1.2 8 × 10⁻² 6.0 × 10⁻¹ 4.3 × 10⁻¹ 3.6 × 10⁻¹ 4.5 × 10⁻¹
Pork meat 100 2.7 8 × 10⁻¹ 7.4 × 10⁻¹ 6.4 × 10⁻¹ 4.5 × 10⁻¹ 7.5 × 10⁻¹
Hen meat 2.5 1.2 × 10⁻¹ 7 × 10⁻³ 5.5 × 10⁻¹ 5.0 × 10⁻¹ 4.2 × 10⁻¹ 6.0 × 10⁻¹
Broiler meat 1.7 1.1 × 10⁻¹ 3 × 10⁻² 5.5 × 10⁻¹ 5.0 × 10⁻¹ 4.2 × 10⁻¹ 7.0 × 10⁻¹
Egg 2.5 1.5 × 10⁻¹ 4.5 × 10⁻² 7.8 × 10⁻¹ 6.4 × 10⁻¹ 5.3 × 10⁻¹ 6.8 × 10⁻¹
The lower levels of the atmosphere will become contaminated due to evapotranspiration of
tritium from soil and plants. Yim and Caron [31] have shown that the tritium profile above a
contaminated, vegetated surface remains roughly constant with height in the canopy. This
suggests that the specific activity of air in the plant canopy is the same as in the soil water:
swamCC = (21)

560
The HTO concentration in plant water is then calculated using Equation (5), with
amaairCHC ⋅= The OBT concentration in plants and the HTO and OBT concentrations in
terrestrial animals following soil contamination are then calculated using the models and
parameter values for release to air (see Sections 2.1.2 and 2.1.3).
2.2.2 Irrigation
Soils can also become contaminated through irrigation. From specific activity concepts,
tritium reaching the soil with irrigation water is mixed into the total amount of water reaching
the soil. Thus the concentration in soil pore water is given by
irr
irrirr
sw
QP
CQC
+
⋅= (22)
where irr
Q is the irrigation rate (L m-2
d-1
averaged over the growing season), irr
C is the
tritium concentration in irrigation water (Bq L-1
) (assumed known), and P is the precipitation
rate (L m-2
d-1
averaged over the growing season).
From this point forward, the model follows that for contamination by upward migration from
waste management areas. Air moisture concentrations are calculated using Equation (21) and
TFWT concentrations using Equation (5). The OBT concentration in plants and the HTO and
OBT concentrations in terrestrial animal products are calculated using the models and
parameter values for release to air (see Sections 1.1.2 and 1.1.3). When calculating animal
concentrations, only those crops that are irrigated should be considered contaminated.
Moreover, the drinking water of the animals should be considered contaminated if it comes
from the same source as the irrigation water.
Precipitation rate is commonly measured and a site-specific value is usually available. The
irrigation rate depends strongly on the crop in question and the local climate and practice.
Nominal values are shown in Table 8. Forage crops are not usually irrigated.
2.3. Release of HTO to water bodies
Fish are the only aquatic organisms considered here since they are the only aquatic organisms
that play a major role in the human diet.
HTO: The assumption of full SA equilibrium is a good approximation for HTO
concentrations in most aquatic compartments [38, 39]. Concentrations in the top few
centimetres of sediment water are likely to be the same as those in the water column itself.
Submerged plants, and the submerged parts of emergent plants, have the same concentration
as the local water, whether they are rooted in the sediments or not. The HTO concentrations in
fish and benthic organisms are the same as the concentration in the water that they access.
Only the emergent parts of plants such as cattails diverge from the SA assumption, but these
do not play a major role in the diets of aquatic animals. Thus, the water to which freshwater
fish are exposed, including lake water and water derived from foods at different trophic
levels, has more or less the same HTO concentration.
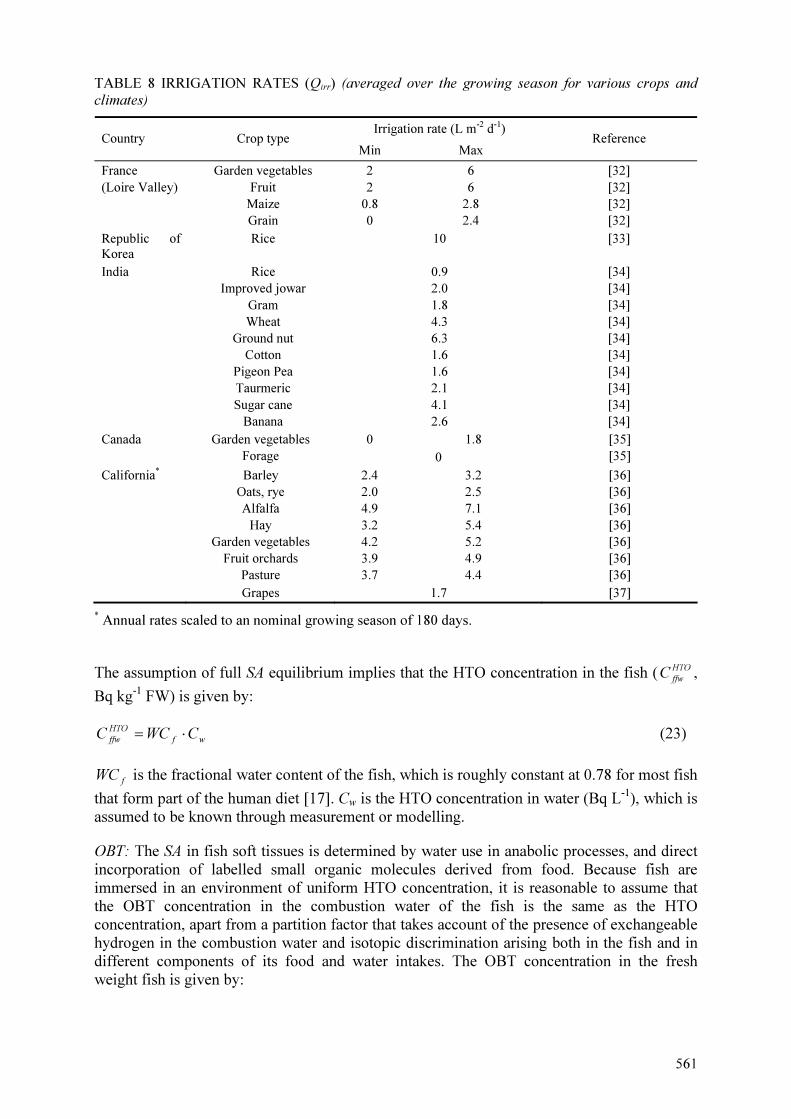
561
TABLE 8 IRRIGATION RATES (Qirr) (averaged over the growing season for various crops and
climates)
Irrigation rate (L m-2 d-1) Country Crop type
Min Max Reference
France
(Loire Valley)
Garden vegetables
Fruit
Maize
Grain
2
2
0.8
0
6
6
2.8
2.4
[32]
[32]
[32]
[32]
Republic of
Korea
Rice 10 [33]
India Rice
Improved jowar
Gram
Wheat
Ground nut
Cotton
Pigeon Pea
Taurmeric
Sugar cane
Banana
0.9
2.0
1.8
4.3
6.3
1.6
1.6
2.1
4.1
2.6
[34]
[34]
[34]
[34]
[34]
[34]
[34]
[34]
[34]
[34]
0 1.8 Canada Garden vegetables
Forage 0
[35]
[35]
California* Barley
Oats, rye
Alfalfa
Hay
Garden vegetables
Fruit orchards
Pasture
2.4
2.0
4.9
3.2
4.2
3.9
3.7
3.2
2.5
7.1
5.4
5.2
4.9
4.4
[36]
[36]
[36]
[36]
[36]
[36]
[36]
Grapes 1.7 [37]
*
Annual rates scaled to an nominal growing season of 180 days.
The assumption of full SA equilibrium implies that the HTO concentration in the fish ( HTO
ffwC ,
Bq kg-1
FW) is given by:
wf
HTO
ffw CWCC ⋅= (23)
fWC is the fractional water content of the fish, which is roughly constant at 0.78 for most fish
that form part of the human diet [17]. Cw is the HTO concentration in water (Bq L-1
), which is
assumed to be known through measurement or modelling.
OBT: The SA in fish soft tissues is determined by water use in anabolic processes, and direct
incorporation of labelled small organic molecules derived from food. Because fish are
immersed in an environment of uniform HTO concentration, it is reasonable to assume that
the OBT concentration in the combustion water of the fish is the same as the HTO
concentration, apart from a partition factor that takes account of the presence of exchangeable
hydrogen in the combustion water and isotopic discrimination arising both in the fish and in
different components of its food and water intakes. The OBT concentration in the fresh
weight fish is given by:

562
wfff
OBT
ffw CRWEQWCC ⋅⋅⋅−= )1( , (24)
where fWEQ is the water equivalent factor of the fish and fR is the partition factor.
As was the case for the partition factor for plants, values of fR must be determined
empirically for steady state conditions. Because HTO and OBT have very different biological
half-lives in fish, and because fish can encounter different tritium concentrations as they move
through their water body, it is difficult to obtain reliable estimates from fish collected in the
wild. Dependable values can be obtained if the fish lives its entire life in an environment
where the HTO concentration does not change, or if the fish is exposed over a long period of
time to contaminated food and water in a controlled setting. Table 9 summarizes literature
values of OBT/HTO ratios obtained under such conditions. The GM of the observations is
0.66, which is the recommended default value for fR .
The water equivalent factor is difficult to measure but can be calculated reliably from the
hydrogen content of protein, fat and carbohydrate (7%, 12% and 6.2%, respectively) and the
fractions of protein, fat and carbohydrate in the fish in question. The calculated values for four
fish species are shown in Table 10. The GM of 0.65 is recommended for generic assessments.
TABLE 9 VALUES OF THE PARTITION FACTOR FOR FISH ( fR ) OBTAINED UNDER
EQUILIBRIUM CONDITIONS
Fish type Rf Reference
Bullhead (catfish) 7.7 × 10⁻¹ [38]
Pike 8.4 × 10⁻¹ [38]
Bass 1.3 a [39]
Bluegill 9.7 × 10⁻¹ a
4.9 × 10⁻¹ a
[40] [41]
Largemouth bass 4.1 × 10⁻¹ a [41]
Mosquito fish 3.4 × 10⁻¹ a
6.7 × 10⁻¹ a
[41] [42]
Carp 6.0 × 10⁻¹ a [43]
GM (GSD) 6,6 × 10⁻¹ (1.5)
aThe concentrations measured in these experiments as ‘OBT’ consisted of both exchangeable and non-
exchangeable organically bound tritium. To eliminate the contribution of exchangeable OBT, the OBT/HTO
ratios reported in the publications were corrected by subtracting 0.2, which represents the proportion of
exchangeable hydrogen in the total hydrogen of the samples [44].
TABLE 10 DEFAULT WATER EQUIVALENT FACTORS (WEQf,) FOR VARIOUS FISH SPECIES (calculated from data in [17])
Fish Water equivalent factor (g water g-1 DW)
Carp 7.1 × 10⁻¹
Perch 6.1 × 10⁻¹
Pike 6.5 × 10⁻¹
Trout 6.4 × 10⁻¹
GM (GSD) 6.5 × 10⁻¹ (1.06)
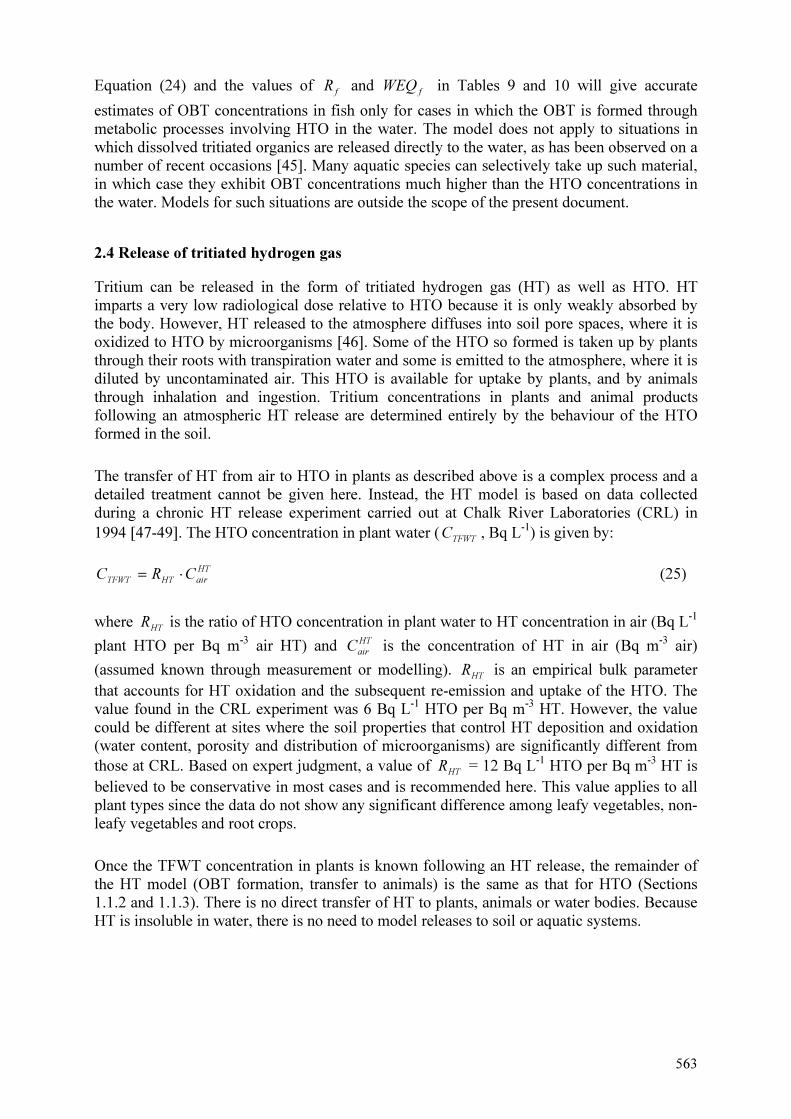
563
Equation (24) and the values of fR and fWEQ in Tables 9 and 10 will give accurate
estimates of OBT concentrations in fish only for cases in which the OBT is formed through
metabolic processes involving HTO in the water. The model does not apply to situations in
which dissolved tritiated organics are released directly to the water, as has been observed on a
number of recent occasions [45]. Many aquatic species can selectively take up such material,
in which case they exhibit OBT concentrations much higher than the HTO concentrations in
the water. Models for such situations are outside the scope of the present document.
2.4 Release of tritiated hydrogen gas
Tritium can be released in the form of tritiated hydrogen gas (HT) as well as HTO. HT
imparts a very low radiological dose relative to HTO because it is only weakly absorbed by
the body. However, HT released to the atmosphere diffuses into soil pore spaces, where it is
oxidized to HTO by microorganisms [46]. Some of the HTO so formed is taken up by plants
through their roots with transpiration water and some is emitted to the atmosphere, where it is
diluted by uncontaminated air. This HTO is available for uptake by plants, and by animals
through inhalation and ingestion. Tritium concentrations in plants and animal products
following an atmospheric HT release are determined entirely by the behaviour of the HTO
formed in the soil.
The transfer of HT from air to HTO in plants as described above is a complex process and a
detailed treatment cannot be given here. Instead, the HT model is based on data collected
during a chronic HT release experiment carried out at Chalk River Laboratories (CRL) in
1994 [47-49]. The HTO concentration in plant water (TFWT
C , Bq L-1
) is given by:
HT
airHTTFWTCRC ⋅= (25)
where HT
R is the ratio of HTO concentration in plant water to HT concentration in air (Bq L-1
plant HTO per Bq m-3
air HT) and HT
airC is the concentration of HT in air (Bq m-3
air)
(assumed known through measurement or modelling). HT
R is an empirical bulk parameter
that accounts for HT oxidation and the subsequent re-emission and uptake of the HTO. The
value found in the CRL experiment was 6 Bq L-1
HTO per Bq m-3
HT. However, the value
could be different at sites where the soil properties that control HT deposition and oxidation
(water content, porosity and distribution of microorganisms) are significantly different from
those at CRL. Based on expert judgment, a value of HT
R = 12 Bq L-1
HTO per Bq m-3
HT is
believed to be conservative in most cases and is recommended here. This value applies to all
plant types since the data do not show any significant difference among leafy vegetables, non-
leafy vegetables and root crops.
Once the TFWT concentration in plants is known following an HT release, the remainder of
the HT model (OBT formation, transfer to animals) is the same as that for HTO (Sections
1.1.2 and 1.1.3). There is no direct transfer of HT to plants, animals or water bodies. Because
HT is insoluble in water, there is no need to model releases to soil or aquatic systems.
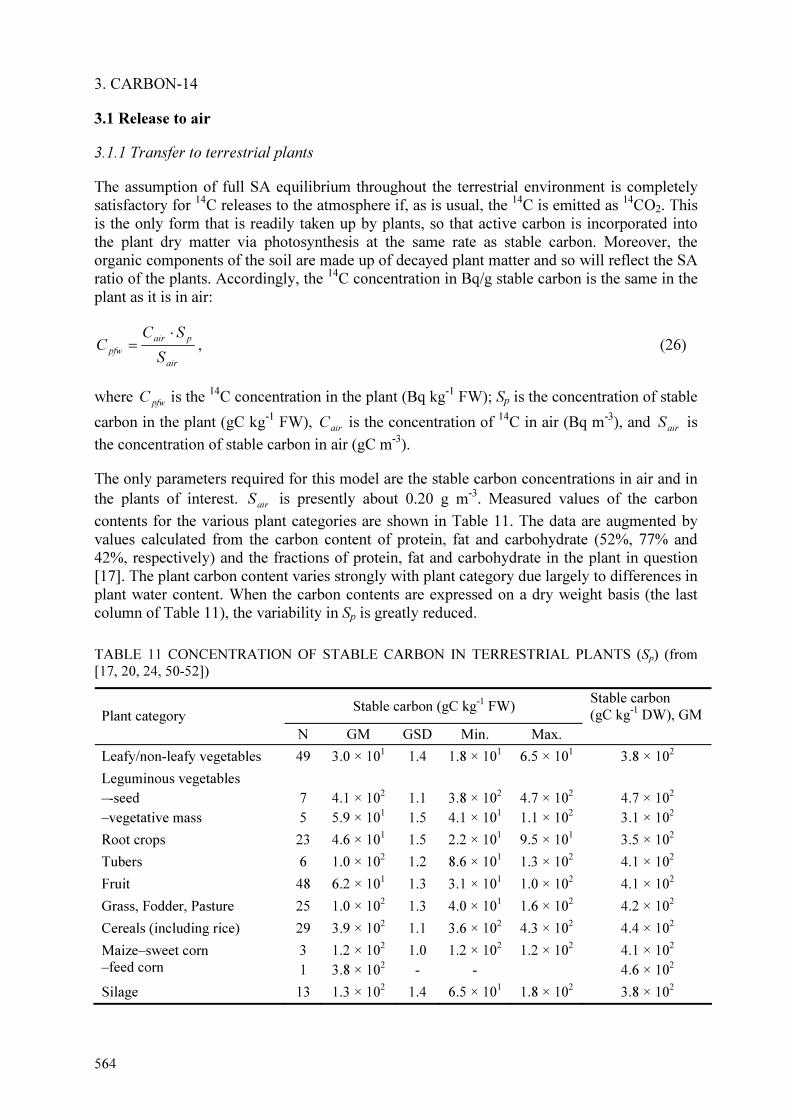
564
3. CARBON-14
3.1 Release to air
3.1.1 Transfer to terrestrial plants
The assumption of full SA equilibrium throughout the terrestrial environment is completely
satisfactory for 14
C releases to the atmosphere if, as is usual, the 14
C is emitted as 14
CO2. This
is the only form that is readily taken up by plants, so that active carbon is incorporated into
the plant dry matter via photosynthesis at the same rate as stable carbon. Moreover, the
organic components of the soil are made up of decayed plant matter and so will reflect the SA
ratio of the plants. Accordingly, the 14
C concentration in Bq/g stable carbon is the same in the
plant as it is in air:
air
pair
pfwS
SCC
⋅
= , (26)
where pfwC is the 14
C concentration in the plant (Bq kg-1
FW); Sp is the concentration of stable
carbon in the plant (gC kg-1
FW), airC is the concentration of 14
C in air (Bq m-3
), and air
S is
the concentration of stable carbon in air (gC m-3
).
The only parameters required for this model are the stable carbon concentrations in air and in
the plants of interest. air
S is presently about 0.20 g m-3
. Measured values of the carbon
contents for the various plant categories are shown in Table 11. The data are augmented by
values calculated from the carbon content of protein, fat and carbohydrate (52%, 77% and
42%, respectively) and the fractions of protein, fat and carbohydrate in the plant in question
[17]. The plant carbon content varies strongly with plant category due largely to differences in
plant water content. When the carbon contents are expressed on a dry weight basis (the last
column of Table 11), the variability in Sp is greatly reduced.
TABLE 11 CONCENTRATION OF STABLE CARBON IN TERRESTRIAL PLANTS (Sp) (from [17, 20, 24, 50-52])
Stable carbon (gC kg-1 FW) Stable carbon (gC kg-1 DW), GM Plant category
N GM GSD Min. Max.
Leafy/non-leafy vegetables 49 3.0 × 101 1.4 1.8 × 101 6.5 × 101 3.8 × 10²
Leguminous vegetables –-seed –vegetative mass
7 5
4.1 × 10² 5.9 × 101
1.1 1.5
3.8 × 10² 4.1 × 101
4.7 × 10² 1.1 × 10²
4.7 × 10² 3.1 × 10²
Root crops 23 4.6 × 101 1.5 2.2 × 101 9.5 × 101 3.5 × 10²
Tubers 6 1.0 × 10² 1.2 8.6 × 101 1.3 × 10² 4.1 × 10²
Fruit 48 6.2 × 101 1.3 3.1 × 101 1.0 × 10² 4.1 × 10²
Grass, Fodder, Pasture 25 1.0 × 10² 1.3 4.0 × 101 1.6 × 10² 4.2 × 10²
Cereals (including rice) 29 3.9 × 10² 1.1 3.6 × 10² 4.3 × 10² 4.4 × 10²
Maize–sweet corn –feed corn
3 1
1.2 × 10² 3.8 × 10²
1.0 -
1.2 × 10² -
1.2 × 10² 4.1 × 10² 4.6 × 10²
Silage 13 1.3 × 10² 1.4 6.5 × 101 1.8 × 10² 3.8 × 10²

565
2.1.2 Transfer to terrestrial animal products
Animals take up carbon almost entirely through ingestion and the SA ratio in plants is
maintained in the animal. Therefore the 14
C concentration in animal products is given by:
p
apfwc
apfS
SCfC
⋅⋅
= (27)
where apfC is the 14
C concentration in the animal product (Bq kg-1
FW), f is the fraction of
animal feed that is contaminated, and a
S is the concentration of stable carbon in the animal
product (gC kg-1
FW). The factor f is introduced to allow for the fact that animals may be fed
supplementary concentrates or feed from remote sources that is uncontaminated. If an animal
is fed stored hay or silage, the concentration of relevance is that in the stored feed. The value
of f should be set from a consideration of local farming practices; if a site-specific value is not
available, f should be conservatively set to 1.
Carbon contents of various animal products are shown in Table 12. A few of these were
directly measured [50, 52] but most were calculated from the carbon content of protein, fat
and carbohydrate and the fractions of protein, fat and carbohydrate in the product in question
[17].
TABLE 12 CONCENTRATION OF STABLE CARBON CONTENT IN TERRESTRIAL ANIMAL
PRODUCTS (Sa, gC kg-1
FW)
Animal product N GM GSD Min. Max.
Cow milk 8 6.5 × 101 1.03 6.2 × 10
1 6.9 × 10
1
Sheep milk 1 1.1 × 10² - -
Goat milk 1 7.1 × 101 - -
Beef meat 14 2.0 × 10² 1.19 1.6 × 10
2 2.9 × 10
2
Veal meat 3 1.6 × 10² 1.21 1.3 × 10
2 1.9 × 10
2
Sheep meat -
2.9 × 10² - -
Lamb meat 2 2.8 × 10² 1.26 2.3 × 10
2 3.2 × 10
2
Goat meat 1 1.7 × 10² - -
Pork meat 12 3.0 × 10² 1.39 1.7 × 10
2 5.5 × 10
2
Hen meat 1 2.4 × 10² - -
Broiler meat 5 1.5 × 10² 1.23 1.1 × 10
2 2.0 × 10
2
Egg 2 1.6 × 10² 1.01 1. 6 × 10
2 1.6 × 10
2
3.2 Contaminated soils
3.2.1 Irrigation
Soils can become contaminated with 14
C, as they can with tritium, by irrigation with
contaminated water. C-14 in irrigation water enters the soil compartment and part is reemitted
to the air by volatilization, where it is taken up by plants. Sheppard et al. [12.53] have
developed a dynamic model for this pathway. Assuming that the irrigation rate is controlled

566
so that there are no losses by leaching, a conservative, steady-state solution to the equations
is:
c
irrirrCairp
F
CQCDSASA
⋅
⋅== (28)
where p
SA is the specific activity in the plant (Bq/gC); air
SA is the specific activity in the
canopy air (Bq/gC); C
CD is the canopy dilution factor for 14
C (unitless); irr
Q is the average
irrigation rate over the growing season (L m-2
d-1
); irr
C is the 14
C concentration in irrigation
water (Bq L-1
); and C
F is the average production rate of carbon by decomposition of crop
residues (gC m-2
d-1
).
The term C
irrirr
F
CQ in Equation (28) is the specific activity of
14C in the soil, calculated as the
14C flux to the soil with irrigation water divided by the stable carbon flux generated by the
decomposition of soil organic matter, which consists mainly of crop residues. The SA in the
air in the plant canopy is assumed equal to the SA in the soil, reduced by the canopy dilution
factor to account for dilution with uncontaminated air from the free atmosphere. The SA in
the plant is then set equal to the SA in the canopy air. The concentration in the fresh weight
plant is given by Equation (26) (with air
air
airSA
S
C= ), and the
14C concentration in animal
products by Equation (27).
Values for FC, the production of carbon by decomposition of crop residues, can be calculated
as the total biomass minus the harvested biomass using site-specific data. However, total
biomass is not a readily available parameter; it includes root biomass, which is not easy to
measure under realistic conditions. Petersen et al. [54] have suggested a central value of 0.66
gC m-2
d-1
, with a range from 0.37 to 0.94.
The canopy dilution factor, C
CD , indicates the degree to which canopy air is diluted by
uncontaminated air from the free atmosphere. Its value depends on the area of contaminated
soil and the crop height and density. Plants represent a sink for atmospheric 14
C, suggesting
that the 14
C profile decreases with height in the canopy when the 14
C source is in the soil.
Sheppard et al. [55] have suggested a value for C
CD of 0.15 for crops with an open canopy
(forage) and 0.3 for crops with a closed canopy (garden crops), although values up to 1 are
possible.
Equation (28) is conservative, particularly for soils that have a high pH or other properties
that result in low volatilization rates. Under such conditions, most of the carbon is fixed in
soil and is unavailable to plants. Moreover, Equation (28) assumes equilibrium conditions
where none may exist, as the 14
C soil concentration due to irrigation will build up gradually
over time.
3.2.2 Waste management areas
Soils can also become contaminated with 14
C by the upward migration of water from
subsurface waste management areas. The chemistry of such a situation is complex and the
form in which the 14
C might occur is not clear. Microbial degradation of the wastes leads to

567
the production of 14
CO2 and radiomethane, which may be oxidized to 14
CO2 in the unsaturated
zone and released to the soil gas. In addition, 14
C may escape from a repository in solution in
groundwater and may also be converted to 14
CO2. All of these scenarios depend strongly on
site-specific conditions, and their quantitative analysis is beyond the scope of this document.
Instead, the present model is driven by the concentration of 14
CO2 in soil gas, which is
assumed to be known regardless of how it originates. Part of the 14
C volatilizes from the soil
to the atmosphere, where it is diluted with uncontaminated air and incorporated into plants by
photosynthesis. The 14
C concentration in air is calculated using a model identical to that for
tritium (Section 1.2.1), assuming that the specific activity of air in the plant canopy is the
same as in the soil gas, modified to account for dilution with uncontaminated air:
sgCair SACDSA ⋅= (29)
where SAair is the 14
C specific activity in air (Bq/gC); CDC is the canopy dilution factor for 14
C (unitless); and SAsg is the 14
C specific activity in soil gas (Bq/gC) (assumed known).
The SA of the plant is the same as the SA of the air (Section 2.2.1). The concentration in the
fresh weight plant ( pfwC , Bq kg-1
FW) is given by
pairpfw SSAC ⋅= , (30)
where Sp is the concentration of stable carbon in the plant (gC kg-1
FW). The 14
C
concentration in animal products is then given by Equation (27).
An alternative approach is available if the 14
C is associated with soil solids. In this case, the
flux of 14
C from the soil to the atmosphere is given by Yu et al. [56]:
sbcsdECF ⋅⋅⋅= ρ (31)
where F is the flux of 14
C from soil to air (Bq m-2
d-1
); Cs is the 14
C concentration in soil (Bq
kg-1
DW) (assumed known); c
E is the 14
C evasion loss rate (d-1
); b
ρ is the soil dry bulk
density (kg DW m-3
); and s
d is the soil depth (m).
The specific activity of the carbon evading the soil (SAe, Bq/gC) is given by
C
e
F
FSA = (32)
where FC is the average production of stable carbon by decomposition of crop residues
(Section 2.2.1). Although this is a production rate, it should equal the evasion rate under
steady-state conditions. The specific activity in air is then calculated from Equation (29) with
SAsg replaced with SAe. Concentrations in plants and animal products are found using
Equations (30) and (27) respectively.
The parameters c
E and b
ρ depend on soil type. Nominal values are shown in Table 13 [57].

568
TABLE 13 DEFAULT VALUES FOR SOIL BULK DENSITY (ρb) AND 14C EVASION RATE (Ec) [57]
Soil type Evasion rate c
E (d-1) Bulk density
bρ (kg DW m-3)
Sand 0.060 1500
Loam 0.033 1300
Clay 0.033 1400
Organic 0.060 400
3.3 Transfer to fish
Modelling 14
C in aquatic systems is complicated by the existence of several carbon pools:
dissolved inorganic carbon (DIC), dissolved organic carbon (DOC), particulate inorganic
carbon (PIC) and particulate organic carbon (POC). DIC and DOC are found primarily in the
water column and PIC and POC in the sediments. Different aquatic organisms are exposed to
different carbon pools and care must be taken to base the SA model on the pools that are seen
by the organism of interest. DIC is the dominant carbon pool accessed by most aquatic
organisms. DIC is the form of carbon taken up by most aquatic plants and animals that are
important for human consumption. Moreover, DIC is the form of carbon normally released to
aquatic systems, the most common form in the water column and the most easily measurable
form of carbon. Thus it is reasonable to use DIC as the basis for the SA model for fish. This
approach may underestimate concentrations in rooted macrophytes, filter feeders and benthic
fish, which see particulate organic carbon in bottom sediments, but these organisms, play a
small role in the human diet.
The assumption of full SA equilibrium based on DIC for aquatic 14
C releases implies that the 14
C concentration in Bq/g stable carbon is the same in fish as it is in dissolved inorganic
carbon in the water column. The 14
C concentration in fresh weight fish ( ffwC , Bq kg-1
FW) is
given by
fDICffw SCC ⋅= (33)
where CDIC is the 14
C concentration in DIC in the water column (Bq/gC) and Sf (gC kg-1
FW)
is the concentration of stable carbon in the fish.
As was the case for terrestrial animals, the carbon contents of fish are most reliably
determined from the carbon content of protein, fat and carbohydrate and the fractions of
protein, fat and carbohydrate in the fish [17]. The calculated values are shown in Table 14. A
conservative default value of 150 gC kg-1
FW can be used for fish types not listed in Table 14.
TABLE 14 CONCENTRATION OF STABLE CARBON IN FISH (Sf) (calculated from data in [17])
Fish type Stable carbon content (gC kg-1 FW) Carp 1.6 × 10² Perch 1.0 × 10² Pike 1.0 × 10² Rainbow Trout 1.2 × 10² GM (GSD) 1.2 × 10² (1.2)
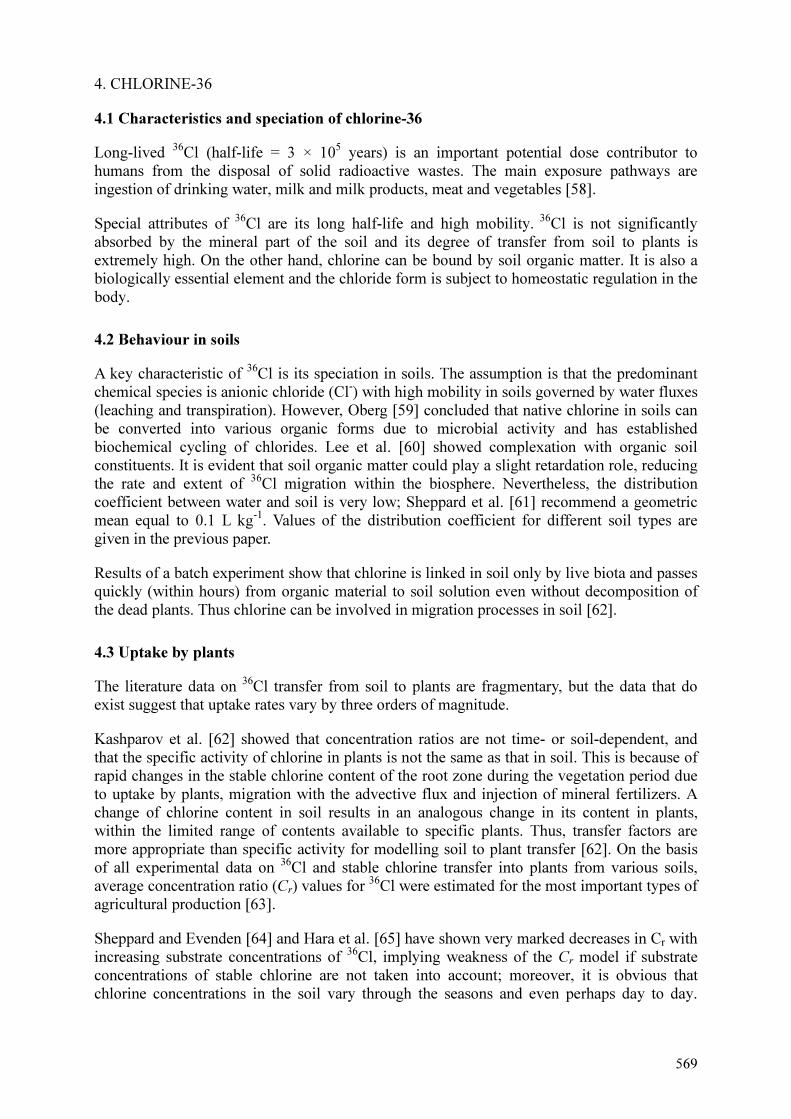
569
4. CHLORINE-36
4.1 Characteristics and speciation of chlorine-36
Long-lived 36
Cl (half-life = 3 × 10⁵ years) is an important potential dose contributor to
humans from the disposal of solid radioactive wastes. The main exposure pathways are
ingestion of drinking water, milk and milk products, meat and vegetables [58].
Special attributes of 36
Cl are its long half-life and high mobility. 36
Cl is not significantly
absorbed by the mineral part of the soil and its degree of transfer from soil to plants is
extremely high. On the other hand, chlorine can be bound by soil organic matter. It is also a
biologically essential element and the chloride form is subject to homeostatic regulation in the
body.
4.2 Behaviour in soils
A key characteristic of 36
Cl is its speciation in soils. The assumption is that the predominant
chemical species is anionic chloride (Cl-) with high mobility in soils governed by water fluxes
(leaching and transpiration). However, Oberg [59] concluded that native chlorine in soils can
be converted into various organic forms due to microbial activity and has established
biochemical cycling of chlorides. Lee et al. [60] showed complexation with organic soil
constituents. It is evident that soil organic matter could play a slight retardation role, reducing
the rate and extent of 36
Cl migration within the biosphere. Nevertheless, the distribution
coefficient between water and soil is very low; Sheppard et al. [61] recommend a geometric
mean equal to 0.1 L kg-1
. Values of the distribution coefficient for different soil types are
given in the previous paper.
Results of a batch experiment show that chlorine is linked in soil only by live biota and passes
quickly (within hours) from organic material to soil solution even without decomposition of
the dead plants. Thus chlorine can be involved in migration processes in soil [62].
4.3 Uptake by plants
The literature data on 36
Cl transfer from soil to plants are fragmentary, but the data that do
exist suggest that uptake rates vary by three orders of magnitude.
Kashparov et al. [62] showed that concentration ratios are not time- or soil-dependent, and
that the specific activity of chlorine in plants is not the same as that in soil. This is because of
rapid changes in the stable chlorine content of the root zone during the vegetation period due
to uptake by plants, migration with the advective flux and injection of mineral fertilizers. A
change of chlorine content in soil results in an analogous change in its content in plants,
within the limited range of contents available to specific plants. Thus, transfer factors are
more appropriate than specific activity for modelling soil to plant transfer [62]. On the basis
of all experimental data on 36
Cl and stable chlorine transfer into plants from various soils,
average concentration ratio (Cr) values for 36
Cl were estimated for the most important types of
agricultural production [63].
Sheppard and Evenden [64] and Hara et al. [65] have shown very marked decreases in Cr with
increasing substrate concentrations of 36
Cl, implying weakness of the Cr model if substrate
concentrations of stable chlorine are not taken into account; moreover, it is obvious that
chlorine concentrations in the soil vary through the seasons and even perhaps day to day.

570
Where the stable chlorine concentration in soil varies in the same way as the 36
Cl
concentration, the SA concept can be used. The uptake of 36
Cl (and of stable chlorine)
depends on the plant group. For example, halophyte species can take up a large quantity of
chlorine.
4.4 Transfer to animals
Chlorine is essential to animals; it controls osmotic pressure and internal solution
electroneutrality. Recent work on transfer to cow meat and milk has shown that the isotopic
ratio in animal products is the same as in their foodstuffs [63]. Due to homeostatic control, the
stable chlorine concentrations in animal tissues were not related to the amount ingested daily
in herbage at intake rates in the normal physiological range of up to 188 g d-1
for cows and up
to 40 g d-1
for pigs. The metabolism of stable chlorine and 36
Cl in an animal’s body is
identical. Therefore, the average equilibrium ratios of 36
Cl to stable chlorine in the daily ration
and in the animal body will be the same. Thus it is concluded that the average equilibrium
chlorine isotopic ratio in the dietary daily intake should be used to predict the contamination
of meat and milk with 36
Cl.
4.5 Modelling
For these several reasons, it is more appropriate to use a specific activity model to describe
the transfer of 36
Cl to animal products than the classical transfer factor approach, as long as
the different inputs are well defined. Following Equation (1), the specific activity in the
animal product is given by:
foodstufffoodstuffwaterwater
foodstufffoodstuffwaterwater
animal
animal
SqSq
CqCq
S
C
⋅+⋅
⋅+⋅
= (34)
where q is the intake rate (L d-1
or kg FW d-1
), C is the 36
Cl concentration (Bq L-1
or Bq kg-1
FW), and S is the stable chlorine concentration (g L-1
or g kg-1
FW). The intake of stable
chlorine should include the contribution from salt (NaCl) licks for cattle.
4.6 Stable chlorine contents in environmental media
The stable chlorine values required for Equation (34) are shown in Table 15. These values
represent the means of literature data for soil [66], plants and animal products [67] and air
[68-69]. They should be used with caution and only when site-specific data are not available.
In fact, there exist only a few data in the literature for stable chlorine contents in
environmental media, and those show some large variations.
5. CONCLUSIONS
The specific activity concepts upon which the tritium, 14
C and 36
Cl models are based are
theoretically sound for long-term safety assessments with constant release rates. However, the
models do not apply to short-term term (accidental) releases where concentrations are time-
dependent. For example, the 36
Cl content of soils varies by more than an order of magnitude
between winter and the growing season, and plant uptake depends on the growth stage. This
contributes some uncertainty to the predictions of 36
Cl concentrations in animal products
calculated using the specific activity approach.

571
TABLE 15 STABLE INORGANIC CHLORINE CONTENTS IN ENVIRONMENTAL MEDIA ([66-
70] as summarized in [71]
Environmental media Content Unit Environmental media Content Unit
Air1 Root vegetable 5.0 × 10⁻¹ g/kg
Gaseous 6.0 × 10⁻² mg/m3 Beet 1.3 g/kg
Aerosol 3.0 × 10⁻² mg/m3 Sugar beet 3.5 × 10⁻¹ g/kg
Water1 1.0 × 10⁻² g/L Potatoes 1.0 g/kg
Groundwater2 1.6 × 10⁻² g/L Red beet 6.0 × 10⁻¹ g/kg
River3 7.0 × 10⁻³ g/L Carrot 5.0 × 10⁻¹ g/kg
Rain4 1.1 × 10⁻² g/L Celery 5.0 × 10⁻¹ g/kg
Soil 2.0 × 10⁻¹ g/kg (DW) Turnip 5.5 × 10⁻¹ g/kg
Terrestrial plants Onion 2.5 × 10⁻¹ g/kg
Cereals (grains) 5.0 × 10⁻¹ g/kg (FW) Radish 3.0 × 10⁻¹ g/kg
Oat 5.0 × 10⁻¹ g/kg Horse radish 1.7 × 10⁻¹ g/kg
Wheat 5.0 × 10⁻¹ g/kg Rutabaga 3.0 × 10⁻¹ g/kg
Maize 4.5 × 10⁻¹ g/kg Salsify 3.1 × 10⁻¹ g/kg
Millet (bird seeds) 1.9 × 10⁻¹ g/kg Leafy vegetable 5.0 × 10⁻¹ g/kg
Barley 1.0 g/kg Artichoke 2.2 × 10⁻¹ g/kg
Rice 2.3 × 10⁻¹ g/kg Celery 1.4 g/kg
Saracen 3.0 × 10⁻¹ g/kg Cabbage 1.1 g/kg
Cereals (flour) Brussels sprout 1.0 × 10⁻¹ g/kg
Oat 4.9 × 10⁻¹ g/kg Cauliflower 2.9 × 10⁻¹ g/kg
Wheat 5.0 × 10⁻¹ g/kg Red cabbage 4.5 × 10⁻¹ g/kg
Fruits and nuts 5.0 × 10⁻¹ g/kg Chives 4.3 × 10⁻¹ g/kg
Apricot 2 × 10⁻² g/kg Watercress 1.0 g/kg
Almond 2.0 × 10⁻¹ g/kg Endive 7.1 × 10⁻¹ g/kg
Pineapple 3.0 × 10⁻¹ g/kg Spinach 7.5 × 10⁻¹ g/kg
Peanut 1.7 × 10⁻¹ g/kg Curled salad 2.5 × 10⁻¹ g/kg
Eggplant 5.0 × 10⁻¹ g/kg Lettuce 5.0 × 10⁻¹ g/kg
Banana 1.0 g/kg Corn salad 1.0 × 10⁻¹ g/kg
Nectarine 5.0 × 10⁻² g/kg Sorrel 6.0 × 10⁻¹ g/kg
Cherry 3.0 × 10⁻² g/kg Parsley 1.3 g/kg
Chestnut 1.0 × 10⁻¹ g/kg Dandelion 1.0 g/kg
Lemon 3.0 × 10⁻² g/kg Leek 4.0 × 10⁻¹ g/kg
Pumpkin 1.8 × 10⁻¹ g/kg Animal Products
Quince 2.0 × 10⁻² g/kg Milk 1.0 g/L
Cucumber 2.7 × 10⁻¹ g/kg Woman 4.0 × 10⁻¹ g/L
Pickle 2.7 × 10⁻¹ g/kg Cow 1.0 g/L
Courgette 1.8 × 10⁻¹ g/kg Ewe 1.0 g/L
Date 2.5 g/kg Buffalo 6.2 × 10⁻¹ g/L
Fig 1.6 × 10⁻¹ g/kg Camel 1.1 g/L
Strawberry 1.2 × 10⁻¹ g/kg Goat 5.0 × 10⁻¹ g/L
Raspberry 2.2 × 10⁻¹ g/kg Mare 3.0 × 10⁻¹ g/L
Guava 4.5 × 10⁻¹ g/kg Egg 1.2 g/kg
Currant 1.0 × 10⁻¹ g/kg Meat 7.5 × 10⁻¹ g/kg
Bean 2.3 × 10⁻¹ g/kg Beef 7.0 × 10⁻¹ g/kg
Mandarin 2.0 × 10⁻² g/kg Horse 9 × 10⁻² g/kg
Melon 4.3 × 10⁻¹ g/kg Sheep 1.0 g/kg
Blackberry 2.0 × 10⁻¹ g/kg Lamb 8.5 × 10⁻¹ g/kg
Medlar 3.0 × 10⁻² g/kg Veal 7.5 × 10⁻¹ g/kg
Coconut 1.2 g/kg Pork 6.0 × 10⁻¹ g/kg
Olive 4.0 × 10⁻² g/kg Turkey 1.2 g/kg
Grapefruit 2.0 × 10⁻² g/kg Chicken 6.0 × 10⁻¹ g/kg
Watermelon 8.0 × 10⁻² g/kg Pig liver 9.0 × 10⁻¹ g/kg
Peach 3.0 × 10⁻² g/kg Aquatic Plants 5.0 × 10⁻¹ g/kg
Pear 2.0 × 10⁻² g/kg Aquatic Animals
Pea 3.6 × 10⁻¹ g/kg Freshwater fishes 1.0 g/kg
Bell pepper 1.9 × 10⁻¹ g/kg Bream 1.2 g/kg
Apple 3.0 × 10⁻² g/kg Pike 1.0 g/kg
Plum 5.0 × 10⁻² g/kg Perch 8.5 × 10⁻¹ g/kg
Grape 3.0 × 10⁻² g/kg Tench 9.5 × 10⁻¹ g/kg
Rhubarb 5.3 × 10⁻¹ g/kg Trout 1.0 g/kg
Tomato 4.0 × 10⁻¹ g/kg Fresh water invertebrates 1.0 g/kg 1Dependent on distance from the sea. 2 variation 1 × 10⁻³-7 × 10⁻². 3 variation: 1 × 10⁻³-3.5 × 10⁻². 4 variation: 1 × 10⁻³-2.0 × 10⁻².

572
In applying the models, all inputs of the stable and active forms of the isotope to each
environmental compartment must be taken into account. For example, the stable chlorine
taken up by animals from salt licks should be accounted for in calculating 36
Cl concentrations.
The models for tritium and 14
C transfer following contamination of soil (Sections 2.2 and 3.2)
are generally quite simple and should be reconsidered as more information becomes available.
Many of the parameters required by the models are bulk parameters that describe the net effect
of several processes, and that are empirically derived. If the models are to provide reliable
predictions, the experimental data must cover the full range of environmental conditions of
interest. This is not always the case, and the main gaps in the data are listed below:
For tritium:
• More data are required on the relative contributions of air moisture and soil water
to the tritium content in plants, to allow Equation (5) to be applied more
realistically to fruit and root crops.
• More data are required on the ratio CRs of soil water concentration to air moisture
concentration (Equation (2)). Values are needed for different soil types and for
sites that exhibit different frequencies with which rain falls when the airborne
plume is present. New values of CRs must be based on HTO measurements made
frequently enough to provide reliable averages of air and soil concentrations over
the growing season. Alternatively, the model of transfer from air to soil could be
amended to treat wet and dry deposition explicitly (e.g. [72]).
• More data collected under steady-state conditions are required to better define the
isotopic discrimination factors in the formation of OBT in a variety of plants and
fish (Equations (7) and (24)).
• More information is needed on the ratio RHT of the HTO concentration in plant
water to the HT concentration in air (Equation (25)). Given the difficulty in
measuring RHT experimentally, new values are more likely to arise through model
simulations than through measurements.
For 14
C:
• More information is needed on the canopy dilution factor CDC (Equations (28) and
(29)) as a function of the size of the contaminated soil source and the height and
density of the plant canopy. Given the difficulty in measuring CDC experimentally,
new values are most likely to come from models that account for the emission of 14
C
from soil and plants and dispersion from ground-level area sources.
• More data are required for FC, the average production rate of carbon by decomposition
of crop residues (Equations (28) and (32)), for different crop types.
• More data are needed for EC, the 14
C evasion rate (Equation. (31)), for different soil
and meteorological conditions.
For 36
Cl:
More data on stable chlorine concentrations in the drinking water and foodstuffs of domestic
animals, and in the animal products themselves, would be useful.

573
REFERENCES
[1] INTERNATIONAL ATOMIC ENERGY AGENCY, Modeling the environmental transport of tritium in the vicinity of long-term atmospheric and sub-surface sources, IAEA-BIOMASS-3, IAEA, Vienna (2003).
[2] GOLUBEV, A.V., “A test of atmospheric release models using Russian data”, Modeling the environmental transport of tritium in the vicinity of long-term atmospheric and sub-surface sources, Part C, IAEA-BIOMASS-3, IAEA, Vienna (2003) 53-74.
[3] TÄSCHNER, M., GUINOIS, G., “Field data for wet and dry deposition of tritium”, Modeling the environmental transport of tritium in the vicinity of long-term atmospheric and sub-surface sources, Part G, IAEA-BIOMASS-3, IAEA, Vienna (2003) 133-151.
[4] DAVIS, P.A., KOTZER, T.G., WORKMAN, W.J.G., Environmental tritium concentrations due to continuous atmospheric sources, Fusion Science and Technology 41 (2002) 453-457.
[5] UNIVERSITY OF EAST ANGLIA, Climate Research Unit, Regional Climatology for Europe, http://www.cru.uea.ac.uk/~mikeh/datasets/regional/ europe.htm (2007).
[6] LIST, R.J. (Ed.) Smithsonian Meteorological Tables, 6th edition. Washington, D.C. (1984). [7] MURPHY, C.E. Jr., The relationship between tritiated water activities in air, vegetation and soil
under steady-state conditions, Health Physics 47 (1984) 635-639. [8] BELOT, Y., GAUTHIER, D., CAMUS, H., CAPUT, C., Prediction of the flux of tritiated water
from air to plant leaves, Health Physics 37 (1979) 575-583. [9] COUCHAT, PH., PUARD, M., LASCÈVE, G., Tritiated water vapour exchange in sunflowers,
Health Physics 45 (1983) 757-764. [10] GARLAND, J.A., COX, L.C., Uptake of tritiated water vapour by bean leaves, Water, Air and
Soil Pollution 17 (1982) 202-212. [11] SPENCER, F.S. Tritiated water uptake kinetics in tissue-free water and organically bound
fractions of tomato plants, Report No. 84-69-K, Ontario Hydro Research Division (1984). [12] MURPHY, C.E. Jr., Modeling tritium transport in the environment, Radiation Protection
Dosimetry 16 (1986) 51-58. [13] MELINTESCU, A., GALERIU, D., A versatile model for tritium transfer from atmosphere to
plant and soil, Radioprotection Sup. 1, Vol. 40, S437-S442 (2005). [14] BROWN, R.M., OGRAM, G.L., SPENCER, F.S., Field studies of HT oxidation and dispersion
in the environment, II The 1987 June experiment at Chalk River, Canadian Fusion Fuels Technology Project Report CFFTP-G-88007 (1989).
[15] BROWN, R.M., The measurement of tritium in Canadian food items, Prepared for the AECB under Contract 87055-9-4070.01-SS (1994).
[16] FRISSEL, M.J., HEISTERKAMP, S., Geometric mean transfer factor values calculated with multilinear regression analyses. Sixth Report of the IUR Working Group on soil-to-plant transfer factors. RIVM, Bilthoven (1989).
[17] GEIGY, Geigy scientific tables, Vol. 1, 8th edition, Units of measurement, body fluids, composition of the body, nutrition. Ciba-Geigy Ltd., Basel, Switzerland (1981).
[18] KÖNIG, L.A., FARK, S., HEMPELMANN, S., LANGGUTH, K.G., PAPADOPOULOS, D., STRACK, S., Untersuchungen zum Transport von Tritium in der Umwelt, Kernforschungszentrum Karlsruhe Report KfK 4131 (1987).
[19] NG, Y.C., COLSHER, C.S., THOMPSON, S.E., Soil-to-plant concentration factors for radiological assessments, Report NUREG/CR-2975 UCID-19463, Lawrence Livermore National Laboratory (1982).
[20] NATIONAL RESEARCH COUNCIL, Nutrient requirements of dairy cattle, Committee on Animal Nutrition, Board on Agriculture and Natural Resources, 7th revised edition, National Academy Press, Washington, D.C. (2001).
[21] PAUNESCU, N., COTARLEA, M., GALERIU, D., MARGINEANU, R., MOCANU, N., Evaluation of environmental tritium level in preoperational period of Cernavoda CANDU nuclear power plant, Journal of Radioanalytical and Nuclear Chemistry 239 (1999) 465-470.
[22] SCHEIER, N.W., KIM, S.B., Evaluation of a model of OBT formation at night in edible parts of non-leafy vegetables. AECL Report 153-121241-440-011 (2006).

574
[23] USDA National Nutrient Database for Standard Reference, http://www.nal.usda.gov/fnic/foodcomp/search/ .
[24] Animal Nutrition and Feeding, (STOICA. I. Ed) Coral-Sanivet, Bucharest (1997) (In Romanian).
[25] McFARLANE, J.C., Tritium fractionation in plants, Environmental and Experimental Botany 16 (1976) 9-14.
[26] GARLAND, J.A., AMEEN, M., Incorporation of tritium in grain plants, Health Physics 36 (1979) 35-38.
[27] KIM, M-A, BAUMGÄRTNER, F., Equilibrium and non-equilibrium partition of tritium between organics and tissue water of different biological systems, Applied Radiation and Isotopes 45 (1994) 353-360.
[28] GUENOT, J., BELOT, Y., Assimilation of 3H in photosynthesizing leaves exposed to HTO. Health Physics 47 (1984) 849-855.
[29] GALERIU, D., CROUT, N.M.J., MELINTESCU, A., BERESFORD, N.A., PETERSON, S-R., VAN HESS, M., Metabolic derivation of tritium transfer factors in animal products, Radiation Environmental Biophysics 40 (2001) 325-334.
[30] GALERIU, D. et al., Modelling 3H and 14C transfer to farm animals and their products under steady state conditions, Journal of Environmental Radioactivity, doi:10.1016/j.jenvrad.2006.11.010 (in press) (2007).
[31] YIM, M-S., CARON, F., Life cycle and management of carbon-14 from nuclear power generation, Progress in Nuclear Energy 48 (2006) 2–36.
[32] CIFFROY, P., SICLET, F., DAMOIS, C., LUCK, M., DUBOUDIN, C., A dynamic model for assessing radiological consequences of routine releases in the Loire River: parameterisation and uncertainty/sensitivity analysis, Journal of Environmental Radioactivity 83 (2005) 9-48..
[33] LEE, E.W., Rice Culture, Hyangmoon Press, Seoul 1996 (in Korean) [34] PAWAR, D.H., PALASKAR, M.S., Irrigation scheduling based on soil-crop-climate integrated
approach: A case study of Upper Pengana Project in Maharashtra, 4th International R&D Conference on Water and Energy for the 21st Century, Aurangabad, Maharashtra, India (2003).
[35] CANADIAN STANDARDS ASSOCIATION, Guidelines for calculating derived release limits for radioactive material in airborne and liquid effluents for normal operation of nuclear facilities, CSA Standard N288.1 (draft 2007).
[36] UNITED STATES DEPARTMENT OF AGRICULTURE, 1984 farm and ranch irrigation survey, AG84-SR-1 Special Report Series, USDA Bureau of Census, U.S. Department of Commerce (1986).
[37] BREWER, B., Irrigation expenses threaten vineyards, Contra Costa Times, January 21. (2001). [38] KIM, S.B., WORKMAN, W.J.G., DAVIS, P.A., YANKOVICH, T., Tritium concentrations in
the Perch Lake ecosystem, AECL document CTD-03700-ENA-003, Chalk River Laboratories, Chalk River, Ontario (2004).
[39] EATON, D., MURPHY C.E. Jr., Tritium uptake by fish in a small stream, Westinghouse Savannah River Company Report WRSC-TR-92-193-Rev 1, Aiken SC. (1992).
[40] ELWOOD, J.W., Tritium behaviour in fish from a chronically contaminated lake, Proc. of the 3rd National Symposium on Radioecology, Oak Ridge, May 10-12 (1971) 435-439.
[41] BLAYLOCK, B.G., FRANK, M.L., “Distribution of tritium in a chronically contaminated lake”, Behaviour of Tritium in the Environment, Proc. of a Symposium, San Francisco, 16-20 October 1978. IAEA-SM-232/74, IAEA, Vienna (1979) 711.
[42] PATZER, R.G., MOGHISSI A.A., McNELIS, D.N., “Accumulation of tritium in various species of fish reared in tritiated water” Proc. of a Symposium on Environmental Behaviour of Radionuclides Released in the Nuclear Industry, Aix-en-Provence. IAEA, Vienna (1973) 403.
[43] STRAND, J.A., TEMPLETON W.L., OLSON, P.A., “Fixation and long-term accumulation of tritium from tritiated water in an experimental aquatic environment”, Radiation effects and tritium technology for fusion reactors, Proc. of an international conference held at Gatlinburg, TN, October 1-3, 1975. (WATSON, J.S., WIFFEN, F.W. Eds.) (1976) III-77-95.
[44] RODGERS, D.W., Tritium dynamics in juvenile rainbow trout, Salmo gairdneri. Health Physics 63 (1992) 331-337.
575
[45] WILLIAMS, J.L., RUSS, R.M., MCCUBBIN, D., KNOWLES, J.F., An overview of tritium behaviour in the Severn Estuary (UK), Journal of Radiological Protection 21 (2001) 337-344.
[46] DUNSTALL, T.G., OGRAM, G.L., SPENCER, F.S., Elemental tritium deposition and conversion in the terrestrial environment, Fusion Technology 8 (1985) 2551-2556.
[47] DAVIS, P.A., WORKMAN, W.J.G., AMIRO, B.D., SPENCER, F.S., NOGUCHI, N., AMANO, H., ICHIMASA, Y. ICHIMASA, M., Overview of the 1994 chronic HT release experiment at Chalk River, Fusion Technology 28 (1995) 840 -845.
[48] DAVIS, P.A., GALERIU, D.C., SPENCER, F.S., AMIRO, B.D., Evolution of HTO concentrations in soil, vegetation and air during an experimental chronic HT release, Fusion Technology 28 (1995) 833-839.
[49] DAVIS, P.A., BICKEL, G.A., Transfer parameters for environmental pathways models for chronic emissions of tritiated hydrogen gas, Atomic Energy of Canada Limited, RC-2501 (2000).
[50] GARNIER-LAPLACE, J., ROUSSEL-DEBET, S., CALMON P., Modélisation des transferts du carbone 14, émis par les réacteurs à eau pressurisée en fonctionnement normal dans l’environnement proche du site, Rapport IPSN/DPRE/SERE 98/007 (1998).
[51] UCHIDA, S., TAGAMI, K., HIRAI, I., Soil-to-plant transfer factors for stable elements and naturally-occurring radionuclides. I. Upland field crops collected in Japan, Journal of Nuclear Science and Technology 44 (2007) 628-640.
[52] HOLTUM, J.A.M. LATZKO, E., Carbon and Carbon Metabolism in the Environment, Institüt für Strahlen-Hygiene, Bundesgesundheitsamt. Neuherberg, Germany, ISH-Heft-92 (1986).
[53] SHEPPARD, S.C., CIFFROY, P., SICLET, F., DAMOIS, C., SHEPPARD, M.I., STEPHENSON, M., Conceptual approaches for the development of dynamic specific activity models of 14C transfer from surface water to humans, Journal of Environmental Radioactivity 87 (2006) 32-51.
[54] PETERSEN, B.M., BERNTSEN, J., HANSEN S., JENSEN, L.S., CN/SIM–A model for the turnover of soil organic matter. I. Long-term carbon and radiocarbon development, Soil Biology and Biochemistry 37 (2005) 359-374.
[55] SHEPPARD, S.C., SHEPPARD, M.I., SICLET, F., Parameterization of a dynamic specific activity model of 14C transfer from surface water to humans, Journal of Environmental Radioactivity 87 (2006) 15-31.
[56] YU, C., ZIELEN, A.J., CHENG, J.J., LEPOIRE, D.J., GNANAPRAGASAM, E., KAMBOJ, S., ARNISH, J., WALLO A. III, WILLIAMS, W.A., PETERSON, H., User’s Manual for RESRAD Version 6. Argonne National Laboratory, Argonne, IL. (2001).
[57] AMIRO, B.D., DAVIS, P.A., A pathway model to assess transport of radionuclides from terrestrial and aquatic surfaces to the atmosphere, Waste Management 11 (1991) 41-57.
[58] AGENCE NATIONALE POUR LA GESTION DES DECHETS RADIOACTIFS, Référentiel du comportement des radionucléides et des toxiques chimiques d'un stockage dans le Callovo-Oxfordien jusqu'à l'homme, Site de Meuse Haute-Marne, ANDRA, Dossier HAVL-Argile 2005, Châtenay-Malabry (92), France, C.RP.ASTR.04.0032.A (2005).
[59] OBERG, G., Chloride and organic chlorine in soil, Acta Hydrochimica and Hydrobiology 26 (1998) 137-144.
[60] LEE, R.T., SHAW G., et al. Specific association of 36Cl with low molecular weight humic substances in soils, Chemosphere 43(8) (2001) 1063-1070.
[61] SHEPPARD, S., SHEPPARD, M., et al., Revision and meta-analysis of selected biosphere parameter values for chlorine, iodine, neptunium, radium, radon and uranium, Journal of Environmental Radioactivity 89(2) (2006) 115-137.
[62] KASHPAROV, V., COLLE, C., ZVARICH, S., YOSCHENKO, V., LEVCHUK, S., LUNDIN, S., Studies of soil-to-plant transfer of halogens. 2. Root uptake of radiochlorine by plants, Journal of Environmental Radioactivity 79(3) (2005). 233-253.
[63] KASHPAROV, V., C. COLLE, et al., Transfer of chlorine from the environment to agricultural foodstuffs, Journal of Environmental Radioactivity 94 (2007) 1-15.
[64] SHEPPARD, S.C., EVENDEN, W.G., Response of some vegetable crops to soil-applied halides, Canadian Journal Of Soil Science 72 (1992) 555-567.
576
[65] HARA, T., SONODA Y., et al., Growth response of cabbage plants to sodium halides under water culture conditions, Soil Science and Plant Nutrition 23 (1977) 77-84.
[66] COUGHTREY, P. J., JACKSON, D., et al., Radionuclide distribution and Transport in Terrestrial and Aquatic Ecosystems, (A.A. BALKEMA Ed.) Rotterdam (1983).
[67] RANDOUIN, L., P. LE GALLIC, et al., Tables de composition des aliments. Malakoff (France) (1988).
[68] GRAEDEL, T.E. KEENE, W.C., The tropospheric budget of reactive chlorine, Global Biogeochemistry Cycles 9 (1995) 47-78.
[69] GRAEDEL, T. E. AND W. C. KEENE The budget and cycle of Earth' natural chlorine, Pure and Applied Chemistry 68(9) (1996) 1689-1696.
[70] OBERG, G., The biogeochemistry of Chlorine in soil, The handbook of Environmental Chemistry. 3 (2003) 43-62.
[71] TAMPONNET, C., Modélisation des transferts environnementaux du chlore 36, Rapport IRSN/DEI/SECRE n°2006-19 (2006).
[72] GALERIU, D. BELOT Y., A standard guide for dose assessment of routine releases of tritium from any tritium facility, Report WP3, IDRANAP 31-02/2002 (2002).
577
FOOD PROCESSING
V. KASHPAROV
Ukrainian Institute of Agricultural Radiology, Ukraine
S. CONNEY
Food Standards Agency, London, Unaited Kingdom
S. UCHIDA
National Institute of Radiological Sciences, Chiba-shi, Japan
S. FESENKO
International Atomic Energy Agency,
V. KRASNOV
Ukrainian Institute for Forestry and Agro-Forest Amelioration, Ukraine
Abstract
The paper discusses the processes involved in food preparation for consumption and technological processing that could be
used to reduce contamination of foodstuffs. The food processing transfer parameters–food processing retention factor,
processing efficiency and the food processing factor–are defined and their relationships discussed. Data are presented for
vegetables, fruit, cereals, dairy products, meat (mammals, birds and fish–edible fraction), fungi, seafoods and drinks.
Processing procedures considered includes: simple washing and boiling for fruit, vegetables and mushrooms, boiling and
milling for cereals, cooking and curing for meats, butter and cheese productions for dairy products and washing and cooking
for seafoods. Storage times for foodstuffs have also been considered. A wide range of chemical elements are considered, with
the majority of data presented caesium, strontium and iodine, stable element databases have been reviewed and relevant data
used to extend the data set. A discussion of application of the data is presented with consideration of areas where cautions is
needed.
1. DEFINITIONS AND CONCEPTS
The concentration of radionuclides in food can be affected by industrial and domestic
processes such as extraction during boiling, removal of certain parts of the raw food (eg. bran,
peel, shell, bone) and drying or dilution [1]. Neglecting of radionuclide losses during food
processing can lead to overestimation of the calculated dose. It should be noted that
processing of raw materials of vegetable and animal origin is often the most effective
countermeasure for reducing the radioactive contamination of the foodstuff to permissible
levels or below. It can be applied both domestically and in industrial processing of food.
Experience gained after the Chernobyl accident has shown that many commonly used
methods of domestic and industrial processing of food products results in significant
decreases of contamination of those foodstuffs and hence of internal radiation doses to people
[2, 3]. Food processing allows significant reduction in the radionuclide contamination of
foodstuffs. It can be achieved by many of the normal practices used in the preparation,
cooking and processing of food. The effects of processing on contaminated food depend on
the radionuclide, the type of foodstuff and the method of processing. The effectiveness of
radionuclide removal from raw material during processing can vary widely, but can be up to
99% (for instance in the production of ethyl alcohol and vegetable oil) [2].
In addition, it is relevant to note that standard food preparation techniques will be used
irrespective of whether it is known that food is contaminated with radionuclides. Therefore,
when evaluating the radiological impacts of routine releases, e.g. in the context of
Vienna
578
optimisation studies, consideration may need to be given to the degree to which those impacts
are affected by food processing methods. Finally, it has to be recognised that the waste
streams generated in food processing may be contaminated by radionuclides and the
radiological impacts of disposal or recycling of this material, e.g. in animal feed, may need to
be addressed.
Data on the behaviour of many radionuclides during food processing are scarce. The
exceptions are radioisotopes of caesium, strontium and iodine. Some measurements were
made in the 1960s at a time when there was concern over the consequences of radionuclide
transfer from nuclear weapons testing into the human food chain. Following the accident at
the Chernobyl NPP, new measurements have become available. Noordijk and Quinault [4]
reviewed the existing literature with in the framework of the CEC and VAMP programmes.
These results were mainly reported in Technical Reports Series No. 364 [1]. This updated
account includes the more recent results and information from various reviews [5-9], as well
as the experimental data from the database of the UK Food Standards Agency (for 137
Cs, 90
Sr
and stable Na, K, Ca, Mg, P, Fe, Cu, Zn, Cl, Mn, Se, I, Cd and Pb) [10] and from the database
created within the framework of the Franco-German Initiative FGI (includes 783 cases of
technological processing of 137
Cs and 90
Sr contaminated raw materials after the Chernobyl
accident: animal products – 384 and plant products–399 cases) [2, 3]. The main results
obtained, focusing on the most effective methods, are shown in Tables 1-9.
In reporting the quantitative results of food processing, the following food processing transfer
parameters are applied:
1. Food processing retention factor (r
F ) is the fraction of activity of radionuclides that is
retained in the food after processing. r
F is defined as the total amount of a radionuclide in
processed food divided by the total amount of the radionuclide in the original raw food (Bq
processed per Bq raw, i.e. r
F cannot exceed 1):
rf
pf
rA
AF = (1)
Where Apf is the total activity of processed food, Bq and Arf is the total activity of raw
material.
2. Processing efficiency (eP ) which is the ratio of the fresh weight of processed food (Mpf)
divided to weight of original raw material (Mrf) i.e.:
rf
pf
eM
MP = (2)
3. Processing factors ( fP )1 for a foodstuff which is the ratio of the radionuclide activity
concentrations (analogous to CR–concentration ratio) in the food after (SApf) and before
processing (SArf) (Bq/kg processed per Bq/kg raw for fresh weight):
1 In some publications, in particular the ICRU report 65 this value is called the Food processing retention factor.
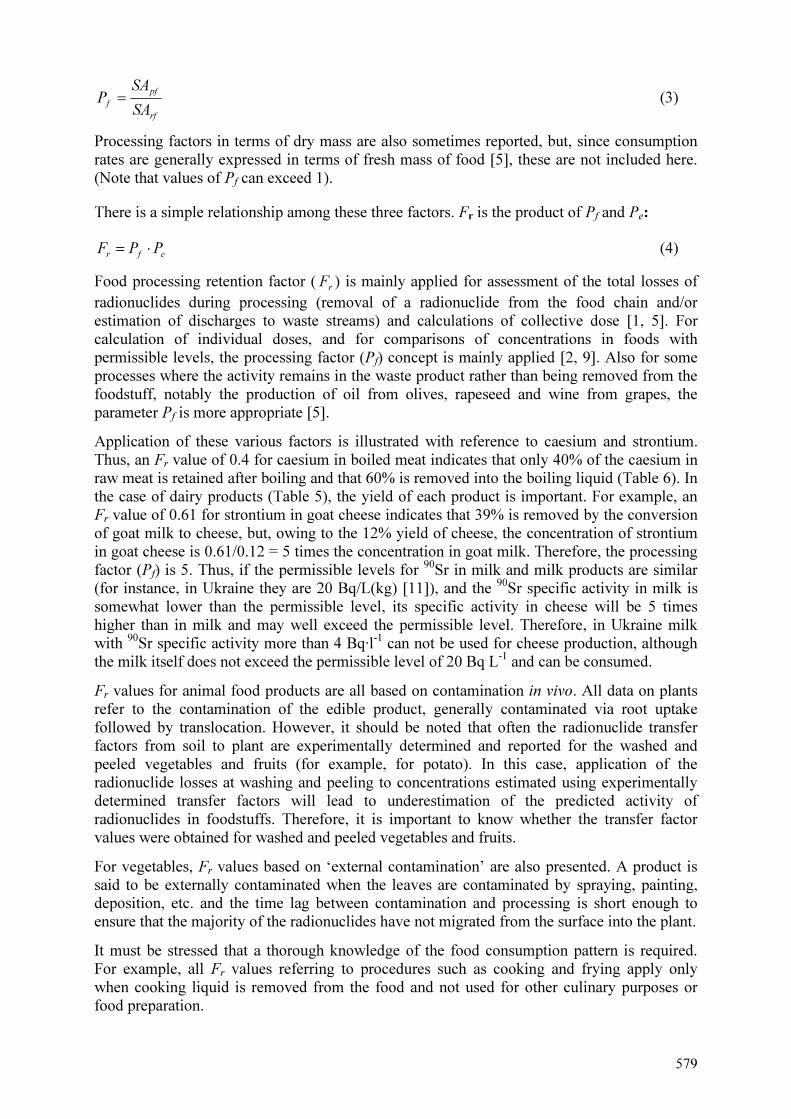
579
rf
pf
fSA
SAP = (3)
Processing factors in terms of dry mass are also sometimes reported, but, since consumption
rates are generally expressed in terms of fresh mass of food [5], these are not included here.
(Note that values of Pf can exceed 1).
There is a simple relationship among these three factors. Fr is the product of Pf and Pe:
efr PPF ⋅= (4)
Food processing retention factor (r
F ) is mainly applied for assessment of the total losses of
radionuclides during processing (removal of a radionuclide from the food chain and/or
estimation of discharges to waste streams) and calculations of collective dose [1, 5]. For
calculation of individual doses, and for comparisons of concentrations in foods with
permissible levels, the processing factor (Pf) concept is mainly applied [2, 9]. Also for some
processes where the activity remains in the waste product rather than being removed from the
foodstuff, notably the production of oil from olives, rapeseed and wine from grapes, the
parameter Pf is more appropriate [5].
Application of these various factors is illustrated with reference to caesium and strontium.
Thus, an Fr value of 0.4 for caesium in boiled meat indicates that only 40% of the caesium in
raw meat is retained after boiling and that 60% is removed into the boiling liquid (Table 6). In
the case of dairy products (Table 5), the yield of each product is important. For example, an
Fr value of 0.61 for strontium in goat cheese indicates that 39% is removed by the conversion
of goat milk to cheese, but, owing to the 12% yield of cheese, the concentration of strontium
in goat cheese is 0.61/0.12 = 5 times the concentration in goat milk. Therefore, the processing
factor (Pf) is 5. Thus, if the permissible levels for 90
Sr in milk and milk products are similar
(for instance, in Ukraine they are 20 Bq/L(kg) [11]), and the 90
Sr specific activity in milk is
somewhat lower than the permissible level, its specific activity in cheese will be 5 times
higher than in milk and may well exceed the permissible level. Therefore, in Ukraine milk
with 90
Sr specific activity more than 4 Bq·l-1
can not be used for cheese production, although
the milk itself does not exceed the permissible level of 20 Bq L-1
and can be consumed.
Fr values for animal food products are all based on contamination in vivo. All data on plants
refer to the contamination of the edible product, generally contaminated via root uptake
followed by translocation. However, it should be noted that often the radionuclide transfer
factors from soil to plant are experimentally determined and reported for the washed and
peeled vegetables and fruits (for example, for potato). In this case, application of the
radionuclide losses at washing and peeling to concentrations estimated using experimentally
determined transfer factors will lead to underestimation of the predicted activity of
radionuclides in foodstuffs. Therefore, it is important to know whether the transfer factor
values were obtained for washed and peeled vegetables and fruits.
For vegetables, Fr values based on ‘external contamination’ are also presented. A product is
said to be externally contaminated when the leaves are contaminated by spraying, painting,
deposition, etc. and the time lag between contamination and processing is short enough to
ensure that the majority of the radionuclides have not migrated from the surface into the plant.
It must be stressed that a thorough knowledge of the food consumption pattern is required.
For example, all Fr values referring to procedures such as cooking and frying apply only
when cooking liquid is removed from the food and not used for other culinary purposes or
food preparation.

580
Milk products may require careful consideration, due to the variety of processes employed
and products generated. It should be determined which coagulation process is used for cheese
making – the acid or rennet process. Further, it should not be assumed beforehand that all
whey will be discarded as waste or animal feed. The food industry has found ways to use
whey as an additive to human food. If all the whey and the buttermilk is used for human
consumption, it is more accurate to use for collective dose assessment an Fr value of 1.0 for
all milk. However, such approach may not be appropriate for individual dose assessments,
depending on the mix of milk products consumed by the individuals of interest, and it may be
more appropriate to use the food processing factors for the different products and assess the
doses to the population groups separately, using their specific consumption rates of the
different products.
As for forest products such as mushrooms and berries, culinary treatment is one of the most
effective and technically feasible options for reduction of radiocaesium uptake into the human
body. Raw mushrooms are usually peeled, washed and boiled in water, which leads to more
than one order of magnitude reduction of radiocaesium activity in the cooked mushrooms
[12].
Long storage and processing times will reduce the activity contents of short-lived
radionuclides in foodstuffs, with implications for assessments of doses from releases of
radionuclides to the environment [5, 9]. The delay between harvest and consumption is
important for short-lived radionuclides such as 131
I. For instance, processing of milk with a
high concentration of 131
I during the acute phase of Chernobyl accident into long-stored
foodstuffs (such as butter, cheese and dried milk) ensured significant decreases of 131
I
concentrations in these foodstuffs due to the radioactive decay before their delayed
consumption. For that reason, storage and processing times for the main foodstuffs are also
reported here [5, 8, 9, 125].
2. PROCESSING OF PLANT PRODUCTS
Available data on food processing of plant products are given in Tables 1-6. Processing of
fruits and vegetables includes surface cleansing or washing and other more vigorous or deeply
penetrating measures. The efficiency of radionuclide removal through processing of plant
products varies widely and can remove up to 99% of the initial activity in raw material
(Table 1). However, the efficiency of surface cleansing or washing of fruit and vegetables is
rather low and gives a reduction in the 137
Cs content of up to 10-30% of the initial activity.
Some more vigorous processing can be more effective. Thus, the 137
Cs content is reduced by
30-80% after boiling, salting, pickling, and juice and wine production. Most of the initial
radionuclide content remains in water wastes and filter-pressed precipitate. The technological
processing of grain to flour, sugar-beet to sugar and potatoes to starch provides products with
low 137
Cs and 90
Sr concentrations (Table 1).
Although most data are related to 90
Sr and 137
Cs, information on the behaviour of tritium and 14
C during food processing is available and summarized in Tables 5-6. The values for 14
C and
tritium assume that the water used in cooking is uncontaminated, which may not always be
the case. Moreover, it is the custom in some cultures to consume the cooking water, in which
case any tritium lost to the water would still be ingested. For these reasons, it is recommended
that, in the absence of specific information, the food-processing factor for these radionuclides
should be 1 (i.e. concentrations in food products should not be reduced when the food is
processed).

581
TABLE 1. FOOD PROCESSING RETENTION FACTOR r
F AND THE PROCESSING
EFFICIENCY eP FOR VEGETABLES AND FRUIT (DATA ARE BASED ON TOTAL
CONTAMINATION OF THE PLANT) [1-3, 5, 8-10, 12-49]
Food processing retention factor r
F
eP
Method of processing
Element Min. Max Min. Max.
Cs 6 × 10⁻¹
1.0 1.0 Washing of vegetables, berry
and fruits I 8 × 10⁻¹
1.0
Ru 7 × 10⁻¹ 9 × 10
-1 1.0
Sr 4 × 10⁻¹ 1.0 1.0
Am, Pu 1 × 10⁻¹ 1.0 7 × 10
-1 9 × 10
-1
Cs 5 × 10⁻¹ 9 × 10
-1 7 × 10
-1 9 × 10
-1
Po 3 × 10⁻¹ 5 × 10
-1 7 × 10
-1 9 × 10
-1
Peeling of vegetables
Sr 5 × 10⁻¹ 9 × 10
-1 7 × 10
-1 9 × 10
-1
Am, Ca, Cu, Fe, K,
Mg, Na, P, Po, Pu, Ru, S, Zn
3 × 10⁻¹ 1 8 × 10
-1 1
Cl, 3H 3 × 10
-1 6 × 10
-1 8 × 10
-1 1
Cs 4 × 10⁻¹ 9 × 10
-1 8 × 10
-1 1
Boiling in water of vegetables,
berries and fruits
Sr 6 × 10⁻¹ 1.0 8 × 10
-1 1
Canning, blanching and Cs 1 × 10⁻¹ 1 5 × 10
-1 9 × 10
-1
pickling of vegetables Sr 3 × 10⁻¹ 1.0 5 × 10
-1 9 × 10
-1
Producing of sugar from
beetroot Cs 1 × 10⁻³
1 × 10⁻²
1.2 × 10⁻¹
Producing of starch from potato Cs 2 × 10⁻² 3 × 10
-2 1.8 × 10
-1
Olive press – oil; Cs 1.3 × 10⁻¹ 2 × 10
-1
- cake 4.3 × 10⁻¹
5 × 10
-1
Processing rapeseed to oil Cs fP =4 × 10
-3
Sr fP =2 × 10
-3
TABLE 2. FOOD PROCESSING RETENTION FACTOR r
F AND THE PROCESSING
EFFICIENCY eP FOR VEGETABLES AND FRUIT (DATA ARE BASED ON EXTERNAL
CONTAMINATION ONLY) [1,22,23,50]
Food processing retention factor r
F
eP
Method of processing
Element Min. Max. Min. Max.
Cs 1 × 10⁻¹
9 × 10⁻¹
1.0
I 1 × 10⁻¹
9 × 10⁻¹
1.0
Ru 2 × 10⁻¹
8 × 10⁻¹
1.0
Washing of vegetables,
berries and fruits
Sr 1 × 10⁻¹ 5 × 10
-1 1.0
Ba 6 × 10⁻¹ 9 × 10
-1 8 × 10
-1 1
Cs 1 × 10⁻¹ 5 × 10
-1 8 × 10
-1 1
I 1 × 10⁻¹
5 × 10⁻¹
8 × 10⁻¹
1
Ru, Te 3 × 10⁻¹ 7 × 10
-1 8 × 10
-1 1
Sr 1 × 10⁻¹ 2 × 10
-1 8 × 10
-1 1
Boiling of vegetables and
berries
Zr: 1.0 8 × 10⁻¹ 1

582
TABLE 3. FOOD PROCESSING RETENTION FACTOR r
F AND THE PROCESSING
EFFICIENCY eP FOR CEREALS [1-3, 9, 10, 14, 15, 17, 18, 22, 23, 28, 47, 51-62]
Food processing retention factor, r
F eP
Raw material Method of processing Element Min. Max. Min. Max.
Am, Pu 1 × 10⁻¹ 2 × 10⁻¹ 6 × 10⁻¹ 8 × 10⁻¹
Cd, Pb 5 × 10⁻¹ 6 × 10⁻¹ 6 × 10⁻¹ 8 × 10⁻¹
Cs 2 × 10⁻¹ 6 × 10⁻¹ 6 × 10⁻¹ 8 × 10⁻¹
Milling to white flour
Sr 1 × 10⁻¹ 6 × 10⁻¹ 6 × 10⁻¹ 8 × 10⁻¹
Milling to dark flour Cs 5 × 10⁻² 2 × 10⁻¹ 5 × 10⁻² 1 × 10⁻¹
Sr 1 × 10⁻¹ 2 × 10⁻¹ 5 × 10⁻² 1 × 10⁻¹
Milling to semolina Cs 1.5 × 10⁻¹ 5 × 10⁻¹ 1 × 10⁻¹ 3 × 10⁻¹
Milling to bran Cs 4 × 10⁻¹ 7 × 10⁻¹ 1 × 10⁻¹ 4 × 10⁻¹
Sr 6 × 10⁻¹ 9 × 10⁻¹ 1 × 10⁻¹ 4 × 10⁻¹
Cooking wheat sprouts Cs 8 × 10⁻¹ 9 × 10⁻¹ 1.8 2.4
Wheat, rye,
barley,
oats grain
Shredding or puffing
wheat
Cs 1 × 10⁻¹ 1.5 × 10⁻¹ 9 × 10⁻¹ 9.5× 10⁻¹
Ca, P, Fe, K,
Mg
1 × 10⁻¹ 6 × 10⁻¹
Cs 2 × 10⁻¹ 4 × 10⁻¹
Na, Cu, Zn 7 × 10⁻¹ 9 × 10⁻¹
Rice grain Polishing
Sr 1 × 10⁻¹ 4 × 10⁻¹
Brown,
savoury, easy
cook white rice
Boiling Ca, Cl, Cu, Fe,
K, Mg, Na, P,
Se, Zn
rF =0.3-0.4
Cs 1 × 10⁻¹ 4 × 10⁻¹ Macaroni,
spaghetti, pasta
Boiling
Ca, Cl, Cu, Fe,
K, Mg, Na, P,
Zn
fP =0.1-0.4
TABLE 4. FOOD PROCESSING RETENTION FACTOR (Pe) AND THE PROCESSING
EFFICIENCY eP FOR DRINKS [1, 5, 8, 10, 17, 22, 29, 63-68]
Food processing retention factor, Fr
eP Raw material Method of
processing Element Min. Max Min. Max.
Co 4 × 10⁻¹ 1
Cs 7 × 10⁻¹ 1
I: 8 × 10⁻¹ 1
Ru 3 × 10⁻¹ 1
Surface waste
water
Conventional
treatment
to tap water
Sr 1.0 1
Cs 4 × 10⁻¹ 6 × 10⁻¹ Tea Brewing 2-8
minutes Cs 9 × 10⁻¹ for external
contamination
Herb tea Brewing Cs 4 × 10⁻¹ 6 × 10⁻¹
Am, Pu 5 × 10⁻¹ 3 × 10⁻¹ 9 × 10⁻¹
Cs 2 × 10⁻¹ 9 × 10⁻¹ 3 × 10⁻¹ 9 × 10⁻¹
3H 6 × 10⁻¹ 3 × 10⁻¹ 9 × 10⁻¹
Berries and
fruits
Juice
S 2 × 10⁻¹ 3 × 10⁻¹ 9 × 10⁻¹
Cu, K, P, Zn 3 × 10⁻¹ 8 × 10⁻¹ 6 × 10⁻¹ 8 × 10⁻¹
Cs 3 × 10⁻¹ 7 × 10⁻¹ 6 × 10⁻¹ 8 × 10⁻¹
Grapes Wine
Sr 2 × 10⁻¹ 6 × 10⁻¹ 6 × 10⁻¹ 8 × 10⁻¹

583
TABLE 5. FOOD PROCESSING FACTORS FOR TRITIUM [20-21]
Food processing retention factor r
F Raw material Method of processing
HTO OBT
Processing
efficiency eP
Blackberries Washed and stewed 5.5 × 10⁻¹ 5.6 × 10⁻¹ 5.9 × 10⁻¹
Broad beans Boiled 2.8 × 10⁻¹ a 6.9 × 10⁻¹ b 9.1 × 10⁻¹
Cabbage Washed and steamed 2.8 × 10⁻¹ a - 9.8 × 10⁻¹
Carrots Washed and boiled 2.8 × 10⁻¹ a 4.3 × 10⁻¹ b 8.5 × 10⁻¹
New potatoes
Scrubbed and boiled
Peeled and roasted
5.5 × 10⁻¹ b
2.2 × 10⁻¹ b
-
-
9.2 × 10⁻¹
6.2 × 10⁻¹
Old potatoes
Peeled and boiled
Peeled and roasted
5.5 × 10⁻¹
2.1 × 10⁻¹
7.4 × 10⁻¹
-
9.2 × 10⁻¹
6.5 × 10⁻¹
Hulled rice Boiled 8.4 × 10⁻¹ - -
Soybean Boiled 7.7 × 10⁻¹ - -
Rice flour Boiled 6.9 × 10⁻¹ - -
Soybean flour Boiled 7.4 × 10⁻¹ - -
aSome data are below the detection limit, bnot significant at the 5% level.
TABLE 6 FOOD PROCESSING FACTORS FOR 14C [20, 21]
Raw material Method of processing r
F eP
New potatoes Scrubbed and boiled 6.9 × 10⁻¹ 9.2 × 10⁻¹
Hulled wheat Boiled 8.2 × 10⁻¹ -
Hulled rice Boiled 9.8 × 10⁻¹ -
Soybean Boiled 8.6 × 10⁻¹ -
Wheat flour Boiled 9.2 × 10⁻¹ -
3. PROCESSING OF ANIMAL PRODUCTS
3.1. Milk processing
Milk is one of the important foods that can contribute to internal irradiation doses and
available data for this product are shown in Table 7.
Radiocaesium is concentrated in the water phase of milk, whereas radiostrontium is bound by
casein and milk protein. Neither radionuclide is preferentially associated with the fat content
of milk and hence neither tends to accumulate in high-fat products.
The 137
Cs contents of cream, sour cream, butter, natural cheese, and casein after processing
are 1-30% of the initial radionuclide content in raw milk (Table 7). The 90
Sr contents in
cream, sour cream and butter products with high contents of fats are reduced to 1-30% of
those in raw milk. Contaminated milk should not be used for producing of dried milk because
the drying process does not remove radionuclides.

584
TABLE 7. FOOD PROCESSING RETENTION FACTOR (Fr) AND THE PROCESSING EFFICIENCY (Pe) FOR DAIRY PRODUCTS (bold denotes recommended values) [1-3, 9, 10, 14, 18, 21, 22, 51, 69-103]
Product Food processing retention factor Fr P
e
Element Mean Min Max Mean Min Max
Cream Ca, Cl, K, Mg, Na 3 × 10⁻² 8 × 10⁻²
3 × 10⁻² 2.4 × 10⁻¹
Cd 6 × 10⁻² 1 × 10⁻¹ 8 × 10
-2 3 × 10⁻² 2.4 × 10⁻¹
Cs 5 × 10⁻² 3 × 10⁻²
1.6 × 10⁻¹ 8 × 10⁻²
3 × 10⁻² 2.4 × 10⁻¹
Fe 7 × 10⁻² 8 × 10⁻²
3 × 10⁻² 2.4 × 10⁻¹
I 6 × 10⁻² 6 × 10⁻³
1.9 × 10⁻¹ 8 × 10⁻²
3 × 10⁻² 2.4 × 10⁻¹
P 2 × 10⁻² 8 × 10⁻²
3 × 10⁻² 2.4 × 10⁻¹
Pb, Zn 5 × 10⁻² 8 × 10⁻²
3 × 10⁻² 2.4 × 10⁻¹
Sr 4 × 10⁻² 2 × 10⁻²
2.5 × 10⁻¹ 8 × 10⁻²
3 × 10⁻² 2.4 × 10⁻¹
Sour cream Cs 1 × 10⁻¹ 1 × 10⁻¹
2 × 10⁻¹ 1 × 10⁻¹
1 × 10⁻¹ 2 × 10⁻¹
Sr 1 × 10⁻¹ 1 × 10⁻¹
1.3 × 10⁻¹ 1 × 10⁻¹
1 × 10⁻¹ 2 × 10⁻¹
Skim milk Cs 9.5 × 10⁻¹ 8.5 × 10⁻¹
9.9 × 10⁻¹ 9.2 × 10⁻¹
7.6 × 10⁻¹ 9.7 × 10⁻¹
I 8.1 × 10⁻¹ 9.4 × 10⁻¹ 9.2 × 10
-1 7.6 × 10⁻¹ 9.7 × 10⁻¹
Sr 9.3 × 10⁻¹ 7.5 × 10⁻¹
9.6 × 10⁻¹ 9.2 × 10⁻¹
7.6 × 10⁻¹ 9.7 × 10⁻¹
Butter Ca, Cl, K, Mg, Na 8 × 10⁻³ 4 × 10⁻²
3 × 10⁻² 5 × 10⁻²
Cd 1 × 10⁻¹ 4 × 10⁻²
3 × 10⁻² 5 × 10⁻²
Cs 1 × 10⁻²
3 × 10⁻³ 2 × 10⁻² 4 × 10⁻²
3 × 10⁻² 5 × 10⁻²
I 2 × 10⁻²
1 × 10⁻² 3.5 × 10⁻² 4 × 10⁻²
3 × 10⁻² 5 × 10⁻²
P 4 × 10⁻³ 4 × 10⁻²
3 × 10⁻² 5 × 10⁻²
Pb 2 × 10⁻² 4 × 10⁻²
3 × 10⁻² 5 × 10⁻²
Sr 6 × 10⁻³
2.5 × 10⁻³ 1.2 × 10⁻² 4 × 10⁻²
3 × 10⁻² 5 × 10⁻²
Zn 1 × 10⁻² 4 × 10⁻²
3 × 10⁻² 5 × 10⁻²
Buttermilk Cs 5 × 10⁻² 2 × 10⁻² 1.3 × 10⁻¹ 4 × 10
-2 3 × 10⁻² 0.14
I 5 × 10⁻² 1.3 × 10⁻¹ 4 × 10⁻²
3 × 10⁻² 0.14
Sr 6 × 10⁻² 3 × 10⁻² 7 × 10⁻² 4 × 10
-2 3 × 10⁻² 0.14
Butterfat I 2 × 10⁻² 4 × 10⁻²
4 × 10⁻² 4 × 10⁻²
Sr 1 × 10⁻³ 2 × 10⁻³
Milk powder Ca Cl K Mg Na Zn 1 1.2 × 10⁻¹
1.1 × 10⁻¹ 1.2
(dried) Cs 1.0 1.0 1.2 × 10⁻¹
1.1 × 10⁻¹ 1.2
I 1.0 1.0 1.2 × 10⁻¹
1.1 × 10⁻¹ 1.2
Sr 1.0 1.0 1.2 × 10⁻¹
1.1 × 10⁻¹ 1.2
Condensed milk Ca Cl Cu Fe K Mg
Na, Zn
1 4 × 10⁻¹
3.7 × 10⁻¹
Cs 1.0 1.0 4 × 10⁻¹
3.7 × 10⁻¹
I 1.0 1.0 4 × 10⁻¹
3.7 × 10⁻¹
Sr 1.0 1.0 4 × 10⁻¹
3.7 × 10⁻¹
Cheese1
goat Cs 7 × 10⁻² 1.5 × 10⁻¹ 1.2 × 10⁻¹
8 × 10⁻² 1.7 × 10⁻¹
I 8 × 10⁻² 1.4 × 10⁻¹ 1.2 × 10⁻¹
8 × 10⁻² 1.7 × 10⁻¹
Sr 6.1 × 10⁻¹ 1.2 × 10⁻¹
8 × 10⁻² 1.7 × 10⁻¹
5 × 10⁻¹ 7 × 10⁻¹ 1.2 × 10⁻¹
8 × 10⁻² 1.8 × 10⁻¹
Cd Fe Mg P Pb 2 × 10⁻¹ 4 × 10⁻¹ 1.2 × 10⁻¹
8 × 10⁻² 1.8 × 10⁻¹
Cl K 1 × 10⁻¹ 1.2 × 10⁻¹
8 × 10⁻² 1.8 × 10⁻¹
Cs 7 × 10⁻²
5 × 10⁻² 2.3 × 10⁻¹ 1.2 × 10⁻¹
8 × 10⁻² 1.8 × 10⁻¹
Cu 4 × 10⁻¹ 6 × 10⁻¹ 1.2 × 10⁻¹
8 × 10⁻² 1.8 × 10⁻¹
I 2.0 × 10⁻¹
1.1 × 10⁻¹ 5.3 × 10⁻¹ 1.2 × 10⁻¹
8 × 10⁻² 1.8 × 10⁻¹
Se, Zn 7 × 10⁻¹ 1 1.2 × 10⁻¹
8 × 10⁻² 1.8 × 10⁻¹
Sr 7 × 10⁻¹
2.5 × 10⁻² 8.0 × 10⁻¹ 1.2 × 10⁻¹
8 × 10⁻² 1.8 × 10⁻¹
6 × 10⁻²
1 × 10⁻² 1.2 × 10⁻¹ 1.0 × 10⁻¹
8 × 10⁻² 1.2 × 10⁻¹
I 2.2 × 10⁻¹ 2.7 × 10⁻¹ 1.0 × 10⁻¹
8 × 10⁻² 1.2 × 10⁻¹
Sr 8 × 10⁻²
4 × 10⁻² 8 × 10⁻² 1.0 × 10⁻¹
8 × 10⁻² 1.2 × 10⁻¹
Cottage cheese Cs 1 × 10⁻² 5 × 10⁻²
Cottage cheese Cs
rennet Sr 7 × 10⁻² 1.7 × 10⁻¹
Cow rennet Ca
Cow acid Cs
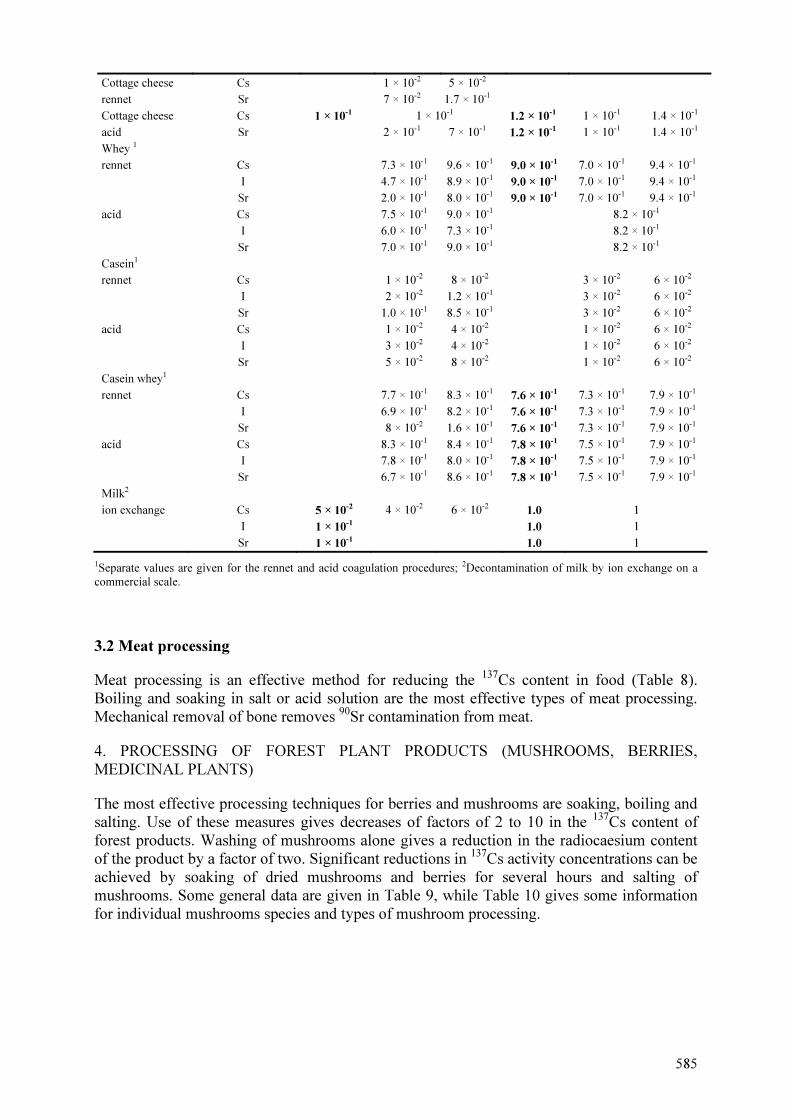
585
Cottage cheese Cs 1 × 10⁻² 5 × 10⁻²
rennet Sr 7 × 10⁻² 1.7 × 10⁻¹
Cottage cheese Cs 1 × 10⁻¹
1 × 10⁻¹ 1.2 × 10⁻¹
1 × 10⁻¹ 1.4 × 10⁻¹
acid Sr 2 × 10⁻¹ 7 × 10⁻¹ 1.2 × 10⁻¹
1 × 10⁻¹ 1.4 × 10⁻¹
Whey 1
rennet Cs 7.3 × 10⁻¹ 9.6 × 10⁻¹ 9.0 × 10⁻¹
7.0 × 10⁻¹ 9.4 × 10⁻¹
I 4.7 × 10⁻¹ 8.9 × 10⁻¹ 9.0 × 10⁻¹
7.0 × 10⁻¹ 9.4 × 10⁻¹
Sr 2.0 × 10⁻¹ 8.0 × 10⁻¹ 9.0 × 10⁻¹
7.0 × 10⁻¹ 9.4 × 10⁻¹
acid Cs 7.5 × 10⁻¹ 9.0 × 10⁻¹ 8.2 × 10⁻¹
I 6.0 × 10⁻¹ 7.3 × 10⁻¹ 8.2 × 10⁻¹
Sr 7.0 × 10⁻¹ 9.0 × 10⁻¹ 8.2 × 10⁻¹
Casein1
rennet Cs 1 × 10⁻² 8 × 10⁻² 3 × 10⁻² 6 × 10⁻²
I 2 × 10⁻² 1.2 × 10⁻¹ 3 × 10⁻² 6 × 10⁻²
Sr 1.0 × 10⁻¹ 8.5 × 10⁻¹ 3 × 10⁻² 6 × 10⁻²
acid Cs 1 × 10⁻² 4 × 10⁻² 1 × 10⁻² 6 × 10⁻²
I 3 × 10⁻² 4 × 10⁻² 1 × 10⁻² 6 × 10⁻²
Sr 5 × 10⁻² 8 × 10⁻² 1 × 10⁻² 6 × 10⁻²
Casein whey1
rennet Cs 7.7 × 10⁻¹ 8.3 × 10⁻¹ 7.6 × 10⁻¹
7.3 × 10⁻¹ 7.9 × 10⁻¹
I 6.9 × 10⁻¹ 8.2 × 10⁻¹ 7.6 × 10⁻¹
7.3 × 10⁻¹ 7.9 × 10⁻¹
Sr 8 × 10⁻² 1.6 × 10⁻¹ 7.6 × 10⁻¹
7.3 × 10⁻¹ 7.9 × 10⁻¹
acid Cs 8.3 × 10⁻¹ 8.4 × 10⁻¹ 7.8 × 10⁻¹
7.5 × 10⁻¹ 7.9 × 10⁻¹
I 7.8 × 10⁻¹ 8.0 × 10⁻¹ 7.8 × 10⁻¹
7.5 × 10⁻¹ 7.9 × 10⁻¹
Sr 6.7 × 10⁻¹ 8.6 × 10⁻¹ 7.8 × 10⁻¹
7.5 × 10⁻¹ 7.9 × 10⁻¹
Milk2
ion exchange Cs 5 × 10⁻²
4 × 10⁻² 6 × 10⁻² 1.0 1
I 1 × 10⁻¹
1.0 1
Sr 1 × 10⁻¹
1.0 1
1Separate values are given for the rennet and acid coagulation procedures; 2Decontamination of milk by ion exchange on a
commercial scale.
3.2 Meat processing
Meat processing is an effective method for reducing the 137
Cs content in food (Table 8).
Boiling and soaking in salt or acid solution are the most effective types of meat processing.
Mechanical removal of bone removes 90
Sr contamination from meat.
4. PROCESSING OF FOREST PLANT PRODUCTS (MUSHROOMS, BERRIES,
MEDICINAL PLANTS)
The most effective processing techniques for berries and mushrooms are soaking, boiling and
salting. Use of these measures gives decreases of factors of 2 to 10 in the 137
Cs content of
forest products. Washing of mushrooms alone gives a reduction in the radiocaesium content
of the product by a factor of two. Significant reductions in 137
Cs activity concentrations can be
achieved by soaking of dried mushrooms and berries for several hours and salting of
mushrooms. Some general data are given in Table 9, while Table 10 gives some information
for individual mushrooms species and types of mushroom processing.

586
TABLE 8 FOOD PROCESSING RETENTION FACTOR Fr AND THE PROCESSING EFFICIENCY Pe FOR MEAT (bold data denote recommended values) [1-3, 9, 10, 22, 69, 104-123]
Food processing retention factor Fr Pe
Raw material Method of
processing Elem. Mean Min. Max Min. Max.
Boiling meat Cs 4 × 10⁻¹ 2 × 10⁻¹ 7 × 10⁻¹ 5 × 10⁻¹ 7 × 10⁻¹
I 6 × 10⁻¹ 5 × 10⁻¹ 7 × 10⁻¹
Ru 3 × 10⁻¹ 5 × 10⁻¹ 7 × 10⁻¹
Sr 5 × 10⁻¹ 4 × 10⁻¹ 9 × 10⁻¹ 5 × 10⁻¹ 7 × 10⁻¹
Tissues of
animals
(cow, pig,
sheep, deer,
rabbit)
Boiling bone Cs 3 × 10⁻¹
2 × 10⁻¹ 3 × 10⁻¹ 1.0
I 9.8 × 10⁻¹ 1.0
Ru 7 × 10⁻¹ 1.0
Sr 9.9 × 10⁻¹ 1.0
Frying,
roasting or
grilling meat
Ca Cl Cu Fe K
Mg Na P Se Zn
5 × 10⁻¹ 1
Cs 7 × 10⁻¹
5 × 10⁻¹ 8 × 10⁻¹ 4 × 10⁻¹ 7 × 10⁻¹
I 2 × 10⁻¹ 6 × 10⁻¹ 4 × 10⁻¹ 7 × 10⁻¹
Sr 8 × 10⁻¹ 4 × 10⁻¹ 7 × 10⁻¹
Microwave
baking
Ca Cl Fe K Mg
Na P Se Zn
5 × 10⁻¹ 1 4 × 10⁻¹ 7 × 10⁻¹
Cs 5 × 10⁻¹
4 × 10⁻¹ 5 × 10⁻¹ 4 × 10⁻¹ 7 × 10⁻¹
Pickling wet
(salting),
Cs 5 × 10⁻¹
1 × 10⁻¹ 7 × 10⁻¹ 9 × 10⁻¹ 1
marinating
Sausage
production
Cs 4 × 10⁻¹ 1.0
Birds Boiling meat Sr 5 × 10⁻¹
Baking meat Cs 7 × 10⁻¹ 8 × 10⁻¹
Roasting Ca Cl Cu Fe I K
Mg Mn Na P Se
Zn
5 × 10⁻¹ 1 4 × 10⁻¹ 7 × 10⁻¹
Fish Boiling flesh Cs 2 × 10⁻¹ 9 × 10⁻¹ 5 × 10⁻¹ 9 × 10⁻¹
Sr 9 × 10⁻¹ 5 × 10⁻¹ 9 × 10⁻¹
Frying flesh Cs 8 × 10⁻¹ 9 × 10⁻¹ 7 × 10⁻¹ 8 × 10⁻¹
Grilling Ca Cl Cu Fe I K
Mg Mn Na P Se
Zn
fP =1.1-1.2

587
TABLE 9 FOOD PROCESSING RETENTION FACTOR (r
F ) AND THE PROCESSING
EFFICIENCY (eP ) FOR
137Cs and
90Sr FOR FOREST PLANT PRODUCTS (MUSHROOMS AND
BERRIES) (Data are based on total contamination of the plant) [1-3, 12, 13]
rF
eP
Raw material Method of processing
Min. Max Min. Max.
Washing 8 × 10⁻¹ 1 1
Boiling 5 × 10⁻¹ 6 × 10⁻¹ 1
Drying of berries 1 1 × 10⁻¹
Berries
(bilberry,
blackberry)
Soaking in water of dried berries 8 × 10⁻¹ 1 × 10⁻¹
Washing 4 × 10⁻¹ 1
Drying of mushrooms 1 1 × 10⁻¹ 1.2 ×10⁻¹
(Sr: 1) 1 × 10⁻¹ 1.2 ×10⁻¹
Washing of dried mushrooms 5 × 10⁻¹ 1 × 10⁻¹
Soaking of dried mushrooms in water 1 × 10⁻¹ 2 × 10⁻¹ 1 × 10⁻¹
Salting 7 × 10⁻² 1 × 10⁻¹ 6 × 10⁻¹ 9 × 10⁻¹
Boiling (30-60 min) 1 × 10⁻¹ 3 × 10⁻¹ 6 × 10⁻¹ 8 × 10⁻¹
Sr: 2 × 10⁻¹ 9 × 10⁻¹ 6 × 10⁻¹ 8 × 10⁻¹
Boiling of dried mushrooms 1 × 10⁻¹ 1.5 × 10⁻¹
Mushrooms
Pickling 6 × 10⁻² 1 × 10⁻¹ 6 × 10⁻¹
(Sr: 5 × 10⁻¹) 6 × 10⁻¹
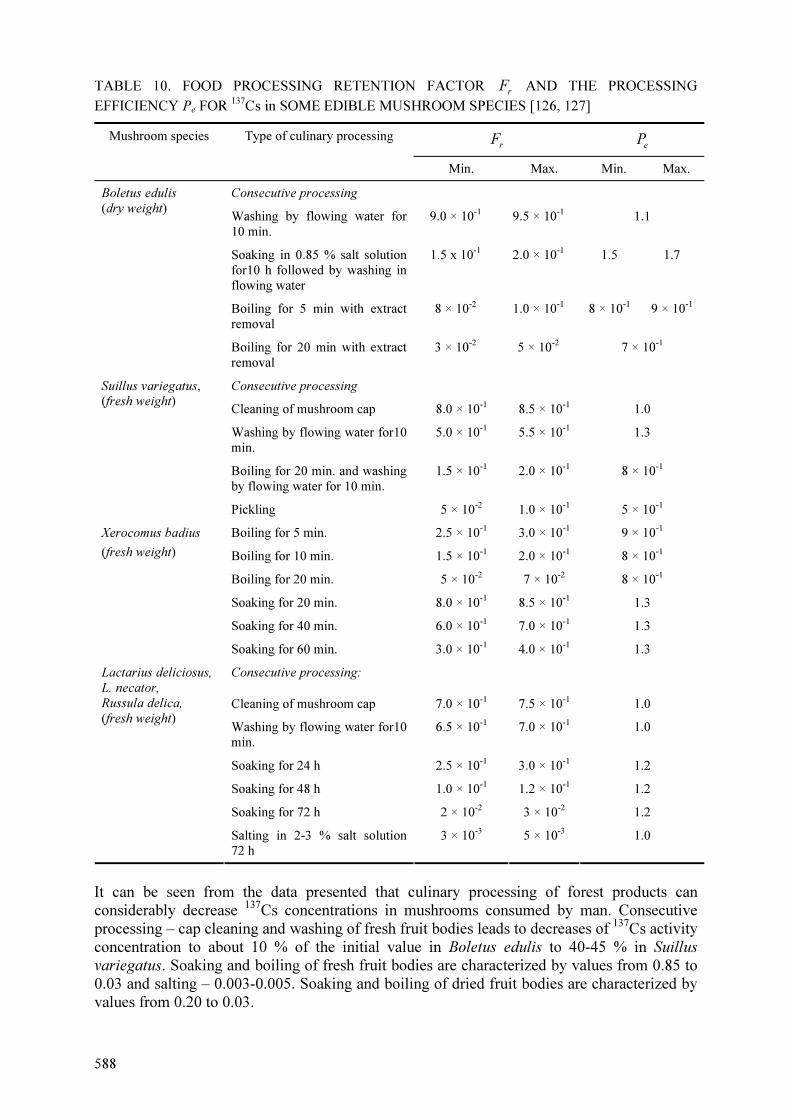
588
TABLE 10. FOOD PROCESSING RETENTION FACTOR r
F AND THE PROCESSING
EFFICIENCY Pe FOR 137
Cs in SOME EDIBLE MUSHROOM SPECIES [126, 127]
Mushroom species Type of culinary processing r
F eP
Min. Max. Min. Max.
Consecutive processing
Washing by flowing water for
10 min.
9.0 × 10⁻¹ 9.5 × 10⁻¹ 1.1
Soaking in 0.85 % salt solution
for10 h followed by washing in
flowing water
1.5 x 10⁻¹ 2.0 × 10⁻¹ 1.5 1.7
Boiling for 5 min with extract
removal
8 × 10⁻² 1.0 × 10⁻¹ 8 × 10⁻¹ 9 × 10⁻¹
Boletus edulis
(dry weight)
Boiling for 20 min with extract
removal
3 × 10⁻² 5 × 10⁻² 7 × 10⁻¹
Consecutive processing
Cleaning of mushroom cap 8.0 × 10⁻¹ 8.5 × 10⁻¹ 1.0
Washing by flowing water for10
min.
5.0 × 10⁻¹ 5.5 × 10⁻¹ 1.3
Boiling for 20 min. and washing
by flowing water for 10 min.
1.5 × 10⁻¹ 2.0 × 10⁻¹ 8 × 10⁻¹
Suillus variegatus,
(fresh weight)
Pickling 5 × 10⁻² 1.0 × 10⁻¹ 5 × 10⁻¹
Boiling for 5 min. 2.5 × 10⁻¹ 3.0 × 10⁻¹ 9 × 10⁻¹
Boiling for 10 min. 1.5 × 10⁻¹ 2.0 × 10⁻¹ 8 × 10⁻¹
Boiling for 20 min. 5 × 10⁻² 7 × 10⁻² 8 × 10⁻¹
Soaking for 20 min. 8.0 × 10⁻¹ 8.5 × 10⁻¹ 1.3
Soaking for 40 min. 6.0 × 10⁻¹ 7.0 × 10⁻¹ 1.3
Xerocomus badius
(fresh weight)
Soaking for 60 min. 3.0 × 10⁻¹ 4.0 × 10⁻¹ 1.3
Consecutive processing:
Cleaning of mushroom cap 7.0 × 10⁻¹ 7.5 × 10⁻¹ 1.0
Washing by flowing water for10
min.
6.5 × 10⁻¹ 7.0 × 10⁻¹ 1.0
Soaking for 24 h 2.5 × 10⁻¹ 3.0 × 10⁻¹ 1.2
Soaking for 48 h 1.0 × 10⁻¹ 1.2 × 10⁻¹ 1.2
Soaking for 72 h 2 × 10⁻² 3 × 10⁻² 1.2
Lactarius deliciosus,
L. necator,
Russula delica,
(fresh weight)
Salting in 2-3 % salt solution
72 h
3 × 10⁻³ 5 × 10⁻³ 1.0
It can be seen from the data presented that culinary processing of forest products can
considerably decrease 137
Cs concentrations in mushrooms consumed by man. Consecutive
processing – cap cleaning and washing of fresh fruit bodies leads to decreases of 137
Cs activity
concentration to about 10 % of the initial value in Boletus edulis to 40-45 % in Suillus
variegatus. Soaking and boiling of fresh fruit bodies are characterized by values from 0.85 to
0.03 and salting – 0.003-0.005. Soaking and boiling of dried fruit bodies are characterized by
values from 0.20 to 0.03.

589
After the Chernobyl accident some information was also obtained on processing retention
factors for wild (mainly forest) medicinal plants (Table 11). Normally, wild medicinal plants
are used after drying to an air-dry state. Liquid medicinal forms are then prepared from dried
plant material.
There are five main groups of plant medicinal raw material according to parts of plants used:
fruits (mainly of arboreal species) – Alnus glutinosa, Rosa canina, Crataegus sp., Vaccinium
myrtillus, etc.); flowers (both grass and arboreal species) – Tilia cordata, Crataegus sp.,
Helichrysum arenarium, etc.; buds (mainly of arboreal species) – Pinus sylvestris, Betula
pendula; leaves, shoots (more than 50 grass and dwarf-shrub species) – Leonurus
quinquelobatus, Hypericum perforatum, Vaccinium vitis-idaea, etc.; rhizomes and roots
(mainly of grass species) – Potentilla erecta, Acorus calamus, Valeriana officinalis, Ononis
arvensis etc.; bark (mainly of arboreal species) – Quercus robur, Frangula alnus, Viburnum
opulus etc.
TABLE 11. Cs-137 AND 90
Sr FOOD PROCESSING RETENTION FACTORS r
F FOR
PREPARATION OF LIQUID WATER MEDICINAL FORMS (INFUSIONS AND BROTHS)
FROM AIR DRY MEDICINAL PLANT RAW MATERIAL [128-134]
Food processing retention factor r
F
137Cs 90Sr
Group of
medicinal
plant raw
material
N
AM SD Min Max AM SD Min Max
Fruits 25 4.9×10⁻¹ 2.7×10⁻¹ 1.1×10⁻¹ 8.7×10⁻¹ 4.3×10⁻¹ 9 × 10⁻² 2.9 × 10⁻¹ 5.9 ×10⁻¹
Flowers 20 6.0×10⁻¹ 2.9×10⁻¹ 1.5×10⁻¹ 9.3×10⁻¹ 4.7×10⁻¹ 2.1 × 10⁻¹ 1.6 × 10⁻¹ 7.3 ×10⁻¹
Buds 20 5.5×10⁻¹ 8 × 10⁻² 4.4×10⁻¹ 5.8×10⁻¹ 5.0×10⁻¹ 1.0 × 10⁻¹ 4.0 × 10⁻¹ 5.5 ×10⁻¹
Grass,
leaves,
shoots
115 5.7×10⁻¹ 1.5×10⁻¹ 2.0×10⁻¹ 9.2×10⁻¹ 4.6×10⁻¹ 1.2 × 10⁻¹ 2.2 × 10⁻¹ 7.5 ×10⁻¹
Rhizomes
and roots
20 4.8×10⁻¹ 2.0×10⁻¹ 1.9×10⁻¹ 8.9×10⁻¹ 2.3×10⁻¹ 6 × 10⁻² 1.4 × 10⁻¹ 3.1 ×10⁻¹
Bark 15 2.9×10⁻¹ 6 × 10⁻² 1.8×10⁻¹ 3.8×10⁻¹ 1.6×10⁻¹ 5 × 10⁻² 1.2 × 10⁻¹ 2.8 ×10⁻¹
In wide use now are ethanol and water-ethanol liquid medicinal forms made from medicinal
plants. For some medicinal plants, these forms are the main, and sometimes the only possible,
way to produce medicines. There is a close relationship between 137
Cs concentrations in raw
plants and in water-ethanol medicinal forms that depends on the alcohol concentration in the
solvent [135, 136]. It has been found that for concentrations of ethanol in solvent of 96.5 %
the mean value is around 0.12 (range 0.05-0.19), for 70 % it is 0.58 (range 0.51-0.69), and for
40 % it is 0.70 (range 0.64-0.86) [135, 136].
Targeted chemical processing of medicinal plants with extraction of clean effective medicinal
substances (flavonoids, cortical glycozids etc.) leads to medicines of very low contamination
and values are in the range 1-3·10-5
[135].
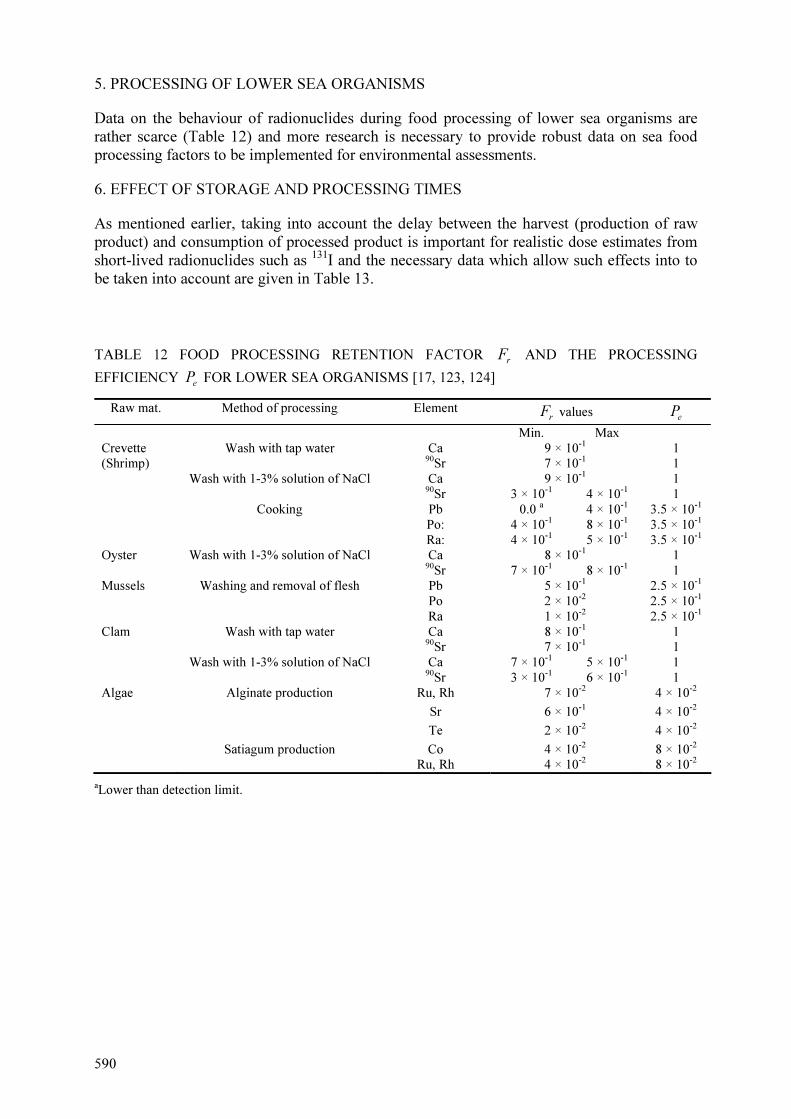
590
5. PROCESSING OF LOWER SEA ORGANISMS
Data on the behaviour of radionuclides during food processing of lower sea organisms are
rather scarce (Table 12) and more research is necessary to provide robust data on sea food
processing factors to be implemented for environmental assessments.
6. EFFECT OF STORAGE AND PROCESSING TIMES
As mentioned earlier, taking into account the delay between the harvest (production of raw
product) and consumption of processed product is important for realistic dose estimates from
short-lived radionuclides such as 131
I and the necessary data which allow such effects into to
be taken into account are given in Table 13.
TABLE 12 FOOD PROCESSING RETENTION FACTOR r
F AND THE PROCESSING
EFFICIENCY eP FOR LOWER SEA ORGANISMS [17, 123, 124]
Raw mat. Method of processing Element r
F values eP
Min. Max
Wash with tap water Ca 9 × 10⁻¹ 1 90Sr 7 × 10⁻¹ 1
Wash with 1-3% solution of NaCl Ca 9 × 10⁻¹ 1
90Sr 3 × 10⁻¹ 4 × 10⁻¹ 1
Crevette
(Shrimp)
Cooking Pb 0.0 a 4 × 10⁻¹ 3.5 × 10⁻¹
Po: 4 × 10⁻¹ 8 × 10⁻¹ 3.5 × 10⁻¹
Ra: 4 × 10⁻¹ 5 × 10⁻¹ 3.5 × 10⁻¹
Oyster Wash with 1-3% solution of NaCl Ca 8 × 10⁻¹ 1
90Sr 7 × 10⁻¹ 8 × 10⁻¹ 1
Mussels Washing and removal of flesh Pb 5 × 10⁻¹ 2.5 × 10⁻¹
Po 2 × 10⁻² 2.5 × 10⁻¹
Ra 1 × 10⁻² 2.5 × 10⁻¹
Wash with tap water Ca 8 × 10⁻¹ 1
90Sr 7 × 10⁻¹ 1
Clam
Wash with 1-3% solution of NaCl Ca 7 × 10⁻¹ 5 × 10⁻¹ 1
90Sr 3 × 10⁻¹ 6 × 10⁻¹ 1
Alginate production Ru, Rh 7 × 10⁻² 4 × 10⁻²
Sr 6 × 10⁻¹ 4 × 10⁻²
Te 2 × 10⁻² 4 × 10⁻²
Algae
Satiagum production Co 4 × 10⁻² 8 × 10⁻²
Ru, Rh 4 × 10⁻² 8 × 10⁻²
aLower than detection limit.

591
TABLE 13 DELAY TIMES (STORAGE AND PROCESSING TIMES) BETWEEN HARVESTING AND
CONSUMPTION OF FOOD PRODUCTS [5, 8, 9, 125]
Raw material Typical value Minimum Maximum
Cereals and cereal products 6 months 45 days 1 year
Potatoes and beet 3 months 7 days 6 months
Leafy vegetables 4 days 1 day 7 days
Root vegetables 10 days 7 days 14 days
Fruit vegetables 7 days 2 days 14 days
Fresh apples and pears 3.5 months 0 day 8 months
Fresh drupe fruits, soft fruit, rhubarb 4 days 0 day 8 days
Canned fruit 1 year 14 days 2 years
Frozen fruit 6 months 7 days 1 year
Jams and jellies 1 year 1 day 2 years
Milk 2 days 1 day 6 days
Butter 1 month 3 days 3 months
Cream 5 days 2 days 10 days
Condensed milk 6 months 7 days 1 year
Pasteurized skim milk 2 days 1 day 6 days
Cheese (rennet coagulation) 1.5 months 30 days 3 months
Cheese (acid coagulation) 1 month 7 days 2 months
Fresh* beef 20 days 14 days 28 days
Fresh* pork, veal 4 days 2 days 7 days
Fresh* chicken 4 days 2 days 7 days
Fresh* lamb 10days 7 days 14 days
Fresh* game 10 days 2 days 20 days
Eggs 14 days 2 days 28 days
* Refers to fresh meat, frozen meats would have longer delay times of up to 6 months.
REFERENCES
[1] INTERNATIONAL ATOMIC ENERGY AGENCY, Handbook of parameter values for the prediction of the radionuclide transfer in temperate environments. IAEA, Technical Report Series N° 364, (1994) 74.
[2] BOGDEVITCH, I., SANZHAROVA, N., PRISTER, B., TARASIUK, S., “Countermeasures on natural and agricultural areas after Chernobyl accident”, Role of GIS in Lifting the Cloud off Chernobyl, (J. KOLEJKA Ed.), Kluwer Academic Publishers (2002) 147-158.
[3] DEVILLE-CAVELIN, G., ALEXAKHIN, R.M., BOGDEVITCH, I.M., PRISTER, B.S., BIESOLD, H., PEREPELYATNIKOVA, L.V., SANZHAROVA, N.I., TARASIUK, S.V., “Countermeasures in agriculture: assessment of efficiency“, Proc. of the International Conference “Fifteen Years after the Chernobyl Accident. Lessons Learned”, Kiev (2001) 118-128.
[4] NOORDIJK, H., QUINAULT, J.M., The influence of food processing and culinary preparation on the radionuclide content of foodstuffs: A review of available data, Modelling of Resuspension, Seasonality and Losses during Food Processing, First report of the VAMP Terrestrial Working Group, IAEA-TECDOC-647, Vienna (1992) 35-59.
[5] GREEN, N., The effect of storage and processing on radionuclide content of fruit, Journal of Environmental Radioactivity 52 (2001) 281-290.

592
[6] GREEN, N., WILKINS, B.T., Effects of processing on radionuclide content of foods: derivation of parameter values for use in radiological assessments. NRPB-M587, National Radiological Protection Board, Chilton (1995).
[7] LONG, S., POLLARD, D., CUNNINGHAM, J.L., ASTASHEVA, N.P., DONSKAYA, G.A., LABETSKY, E.V., The effects of food processing and direct decontamination techniques on the radionuclide content of foodstuffs: A literature review. Part 2: Meat, fruit, cereals and drinks, Journal of Radioecology 3(2) (1995) 15-38.
[8] INTERNATIONAL ATOMIC ENERGY AGENCY, Modelling the transfer of radionuclides to fruit, IAEA-BIOMASS-5, IAEA, Vienna, (2003) 151.
[9] RODOS: Decision support system for off-site nuclear emergency management in Europe (EHRHARDT, J., WEIS, A., Eds.) Report EUR 19144, ISBN No.92-828-9773-7 (2000) 259.
[10] FOOD STANDARDS AGENCY, McCance Widdowson's The Composition of Foods, Sixth summary edition. Cambridge: Royal Society of Chemistry, ISBN 0-85404-428-0, (2002), 537,
[11] STATE HYGIENIC STANDARDS, Permissible levels of 137Cs and 90Sr content in foodstuffs and drinking water (PL-97), Kyiv, Chornobyinterinform. (1997) 10.
[12] IVANOVA, T.N., PEREPELYATNIKOVA, L.V., GRYTZUK, N.R., Assessment of radionuclides distribution at the processing of the vegetable stuff: Problems of agricultural radiology, Collection of the scientific articles (Prister, B. Ed.) 4, UIAR. Kiev (1996) 188-198 (in Ukrainian).
[13] Radionuclides in Food–MAFF Food Surveillance Paper 43, HMSO, London (1994) 221. [14] The effects of processing on cadmium and lead levels in food, FSA Final Report C01006 (2000)
62. [15] WATTERSON, J., NICHOLSON, K., The effects of food preparation on the radionuclide
content of food, MAFF Report AEAT/43710001/REME-194, (1996) 13. [16] WATTERSON, J., NICHOLSON, K., Change in radionuclide content in crops as a result of
food preparation, AEA/CS-10400 (1995) 24. [17] Removal of Radionuclide during Food Processing and Culinary Preparation, Environmental
parameters, series 4, Radioactive Waste Management Center, Japan (1994) (in Japanese). [18] KASHPAROV V., COLLE C., LEVCHUK S., YOSCHENKO V., SVYDYNUK N. Transfer of
radiochlorine from the environment to agricultural foodstuffs, Journal of Environmental Radioactivity 94(1) (2007) 1-15.
[19] ADRIANO, D.C., DOSWELL, A.C., CIRAVOLO, T.G., PINDER, J.E., III., MCLEOD, K.W., Radionuclide content of selected root vegetables as influenced by culinary preparation, Journal of Environmental Radioactivity 49, (2000) 307-317.
[20] WATTERSON J., NICHOLSON K. W. Change in radionuclide content of crops as a result of food preparation Journal of Radiological Protection 16(3) (1996) 191–200.
[21] ARNAUD, M.J., The removal and/or reduction of radionuclides in the food chain, Radionuclides in the Food Chain, ILSI Monographs, Berlin (1988) 195-213.
[22] RANTAVAARA, A.H., Transfer of radionuclides during processing and preparation of foods; Finnish studies since 1986, Radioactivity Transfer during Food Processing and Culinary Preparation (Proc. Seminar Cadarache), CEC, Luxembourg (1989) 69-94.
[23] DELMAS, J., GRAUBY, A., Influence des technologies de transformation agroalimentaire sur la radioactivite des aliments, Foodstuffs Intervention Level Following a Nuclear Accident (Proc. Sem. Luxembourg), Rep. Eur. 11232, CEC, Luxembourg (1987) 183-197 (in French).
[24] ENDRES, O., FISCHER, E., Untersuchungen zur Dekontamination von Gemuse, Deutsche Lebensmittel-Rundschau 65 (1969) 1-5.
[25] FOOD AND DRUG ADMINISTRATION, Strontium-90 in food at intermediate stages of preparation for canning and freezing, Radiological Health Data 5 (1964) 222-226.
[26] GRUETER, H., Radioactive fission product Cs-137 in mushrooms in West Germany during 1963-1970, Health Physics 20 (1971) 655-656.
[27] HISAMATSU, S., TAKIZAWA, Y., ABE, Т., Reduction of 131I content in leafy vegetables and seaweed by cooking, Journal of Radiation Research. 28 (1987) 135-140.
[28] LAUG, E.P., Temporal and geographical distributions of strontium-90 and cesium-137 in food, Radiological Health Data (1963) 448-455.
[29] MURAMATSU, Y., UCHIDA, S., SUMIYA, M., YOSHIDA, S., OHMOMO, Y., Decontamination of radioiodine from waste and vegetables, Radioactivity Transfer during Food

593
Processing and Culinary Preparation, Proc. Seminar Cadarache, CEC, Luxembourg (1989) 341-349.
[30] PAULUS, K., Beurteilung pflanzlicher Lebensmittel nach Behandlungen zur Beseitigung der radioaktiven Kontamination, Z. Lebensmittel-Untersuchung 142 (1969) 17-24.
[31] PAULUS, K., Dekontamiantion von mit 137Cs and 85Sr kontaminiertem Blattgemuse (Salat, Kohl, Spinat), Z. Lebensmittel-Untersuchung 138 (1969) 329-334.
[32] PAULUS, K., Dekontamination von mit 137Cs and 85Sr kontaminiertem Blattgemuse (Salat, Kohl, Spinat), Z. Lebensmittel-Untersuchung 139 (1969) 7-12.
[33] PAULUS, K., Dekontamination von pflanzlichen Lebensmitteln, insbesondere von Obst und Gemuse, sowie damit zusammenhangende Probleme. Kontamin. Decontamination Lebensmittel, Proc. Conf. Karlsruhe (1974) 197-228.
[34] PAULUS, K., Die Dekontamination von mit radioaktiven Stoffen oberflachig ver-seuchtem Gemuse und Obst, Industrielle Obst- und Gemueseverwertung 53 (1968) 85-88.
[35] PAULUS, K., Zur Dekontamination von Rote Beete, Kohlrabi und Rosenkohl, Industrielle Obst- und Gemueseverwertung 53 (1968) 635-638.
[36] RANTAVAARA, A., Radioactivity of Vegetables and Mushrooms in Finland after the Chernobyl Accident in 1986, Suppl. 4 to Annual Rep. STUK-A55, Finnish Centre for Radiation and Nuclear Safety, Helsinki (1987).
[37] RALLS, J.W., MAAGDENBERG, H.J., GUCKEEN, T.R., MERCER, W.A., Removal of radioactive strontium and caesium from vegetables and fruits during preparation for preservation, Journal of Food Science 36 (1971) 653-656.
[38] RALLS, J.W., et al., Distribution of strontium and calcium in major vegetable and fruit crops and criteria for use of fallout-contaminated foods, Radiological Health Data Rep. 8 (1967) 355-358.
[39] RALLS, J.W., MAAGDENBERG, H.J., GUCKEEN, T.R., MERCER, W.A., Removal of radioactive strontium and caesium from certain vegetables and fruits during normal preparation for preservation, Isotopes and Radiation Technology 6 (1969) 146-149.
[40] ROHLEDER, K., Uber die radioaktive Dekontamination von Speisepilzen durch Blan-chieren, Industrielle Obst- und Gemueseverwertung 52 (1967) 64-66.
[41] ROHLEDER, K., Untersuchungen uber die Aufnahme radioaktiver Stoffe durch Grunkohl aus dem Boden and aus der Atmosphare und Versuche zur Dekontamination, Zeitschrift fuer Lebensmittel-Untersuchung und -Forschung 149 (1972) 223-227.
[42] THOMPSON, J.C., HOWE, M., Retention and removal of I31I from contaminated vegetables, Health Physics 24 (1973) 345-351.
[43] THOMPSON, J.C., Sr removal in vegetables prepared for home consumption, Health Physics 11 (1965) 136-137.
[44] WEAVER, СМ., HARRIS, N.D., Removal of radioactive strontium and cesium from vegetables during laboratory scale processing, Journal of Food Science 44 (1979) 1491-1493.
[45] WILKINS, B.T., BRADLEY, E.J., DODD, N.J., The effects of culinary preparation on radionuclide levels in vegetable foodstuffs, Radiation Protection Dosimetry. 20 (1987) 187-190.
[46] “De radioactieve besmetting in Nederland t.g.v. het kernongeval in Tsjernobyl” Part 1, Chapter 12, Werkdocumenten CCRX-rapport (1986).
[47] BRADLEY, E.J., POPPLEWELL, D.S., WILKINS, B.T., The influence of simple culinary preparation on the radionuclide content of vegetables, Radioactivity Transfer during Food Processing and Culinary Preparation (Proc. Seminar Cadarache), CEC, Luxembourg (1989) 311-324.
[48] PAULUS, K., Zur Dekontamination totalkontaminierter Kartoffeln. Zeitschrift fuer Lebensmittel-Untersuchung und -Forschung 139 (1969) 282-287.
[49] PERKINS, H.J., STRACHAN, J., Decontamination of potato tubers containing caesium-137, Science 144 (1964) 59-60.
[50] HISAMATSU, S., TAKIZAWA, Y., ABE, T., Radionuclide contents of leafy vegetables; their reduction by cooking. Journal of Radiation Research 29 (1988), 110-118.
[51] FRIEDLI, C, GEERING, J.J., LERCH, P., Strontium-90 measurements in Switzerland, Impact des Accidents d'Origine Nucleaire sur l'Environnement (Proc. Sem. Cadarache), Centre d'etudes nucleaires de Cadarache (1988) F114-F121.

594
[52] APOSTOLATOS, G., HADJIANTONIOU, A., Caesium contamination transfer in wheat products, Radioactivity Transfer during Food Processing and Culinary Preparation (Proc. Seminar Cadarache), CEC, Luxembourg (1989) 377-400.
[53] ARAPIS, G., MARTI, J.M., KOUSKOUTOPOULOS, A., KARANDINOS, M., IRANZO, E., Low radioactivity contribution of cereals to diet due to their specific composition and processing, Radioactivity Transfer during Food Processing and Culinary Preparation (Proc. Seminar Cadarache), CEC, Luxembourg (1989).
[54] BUNZL, K., KRACKE, W., Soil to plant transfer of 239+240Pu, 238Pu, 241Am, 137Cs and 90Sr from global fallout in flour and bran from wheat, rye, barley and oats, as obtained by field measurements, Science of the Total Environment 63 (1987) 111-124.
[55] BUNZL, K., KRACKE, W., Transfer of 137Cs and 90Sr to flour, bran and straw from wheat, rye, barley and oats during the years 1982, 1986 (reactor accident at Chernobyl) and 1987 in field measurements, Zeitschrift fuer Lebensmittel-Untersuchung und -Forschung (in press).
[56] LIU, D.J., ROBBINS, G.S., POMERANZ, Y., Composition and utilization of milled barley products, Cereal Chemistry 51 (1974) 309-316.
[57] LOFTI, M., NOTARO, M., AZIMI-GARAKANI, D., PIERMATTEI, S., TOM-MASINO, L., Loss of radioactivity in cooked spaghetti, Science of the Total Environment 79 (1989) 291-293.
[58] MULLER, H., Radiaktivitats-Kontamination von Brotgetreide nach Tschernobyl, Die Muhle+Mischfuttertechnik 123 (1986) 392-393.
[59] OHMOMO, Y., et al., Transfer of radioiodine into rice grains, Impact des Accidents d'Origine Nucleaire sur l'Environnement (Proc. Symp. Cadarache), Part 1, Centre d'etudes nucleaires de Cadarache (1988) D68-D74.
[60] PFEIFER, V.F., PEPLINSKI, A.J., HUBBARD, J.E., Strontium-90 in plant parts and milling fractions from a 1963 Illinois wheat, Radiological Health Data 5 (1964) 283-284.
[61] RIVERA, J., Sr-90 in U.S. wheat and flour produced in 1962 and predictions of levels in the 1963 crop, Fallout Program Quarterly Summary Report HASL-140, Office of Technical Services, Department of Commerce, Washington, DC (1964) 276-282.
[62] VOIGT, G., MULLER, H., PROHL, G., PARETZKE, H.G., Caesium activity distribution in cereals after milling processes, Radioactivity Transfer during Food Processing and Culinary Preparation (Proc. Seminar Cadarache), CEC, Luxembourg (1989) 351-360.
[63] BOVARD, P., BENARD, P., DELMAS, J., GRAUBY, A., Transfert des produits de fission dans le vigne et le vin, C.R. Seances Acad. Agric. Fr. (1968) 989-995.
[64] CASTRO, J., SANCHO, A., VEIGA, E., DIAS YUBERO, J., MURIAS, B.S.F., Transfert de Cs-134 et Cs-137 dans les infusions d'herboristerie, Radioactivity Transfer during Food Processing and Culinary Preparation (Proc. Seminar Cadarache), CEC, Luxembourg (1989) 205-218.
[65] GEDIKOGLU, A., SIPAHI, B.L., OSKAY, Т., KURUGLU, M., Chernobyl radio-activity in Turkey, Radioactivity Transfer during Food Processing and Culinary Preparation (Proc. Seminar Cadarache), CEC, Luxembourg (1989) 193-204.
[66] MASSCHELEIN, W.J., Elimination d'isotopes radioactifs par les filieres convention-nelles de traitement des eaux potables, Radioactivity Transfer during Food Processing and Culinary Preparation (Proc. Seminar Cadarache), CEC, Luxembourg (1989) 167-192.
[67] MIRIBEL, J., DELMAS, J., Utilisation de traceurs activables pour l' etude de devenir de la contamination radioactive au cours de la vinification, Radioactivity Transfer during Food Processing and Culinary Preparation (Proc. Seminar Cadarache), CEC, Luxembourg (1989) 219-227.
[68] GIESE, W., SCHIMANSKY, K., KLUGE, K., ROINER, F., Radiocesium transfer to whey and whey products: whey decontamination on an industrial scale, Radiactivity Transfer during Food Processing and Culinary Preparation (Proc. Seminar Cadarache), CEC, Luxembourg (1989) 295-308.
[69] ANNENKOV, В., Radiobiology and radioecology of farm animals, Radiobiol. Radioekol. Sel'skokhoz. Zhivotn. (1973) (in Russian).
[70] ASSIMAKOPOULOS, PA., IOANNIDES, K.G., PAKOU, A.A., PARADOPOULOU, C.V., Transport of the radioisotopes iodine-131, cesium-134 and cesium-137 from the fallout following the accident at the Chernobyl nuclear reactor into cheese and other cheesemaking products, Journal Dairy Sciences 70 (1987) 1338-1343.

595
[71] ANTILA, V, KANKARE, V, PAHKALA, E., PAAKKOLA, O., RANTAVAARA, A., Radionuklidien siirtyminen meijeriprosesseissa eri maitovalmisteisiin ja maidon fraktioihin, Meijeriteollisuus 3 (1987) 36-37.
[72] BALES, R.E., HICKEY, J.L.S., Commercial processing of milk for concurrent removal of cationic and anionic radionuclides, Radioisot. Radiat. Dairy Sci. Technol. Proc. Semin. (1966) 121-145.
[73] BUMA, T.J., MEERESTRA, J., Transfer of radiostrontium from milk to cheese and whey, Nature 202 (1964) 310-311.
[74] CALAPAJ, G.G., ONGARO, D., Sul comportamento del 90Sr e del l37Cs nei processi di burrificazione e caseificazione del latte, Minerva Nucleare 9 (1965) 93-98.
[75] CIGNA, A., MARIANI, A., SPADONI, M.A., TOMASSI, G., Research on radiocontamination transport in food chains: 90Sr in Parmigiano Reggiano cheese during 1957 to 1963, Nuclear Science 23 (1969) 297.
[76] DUBROVINA, S.V., BELOVA, O.M., Transfer of strontium-90 from milk into several milk products by different technological processes, Hygene and Sanitary 28 (1963) 105-108 (in Russian).
[77] EASTERLY, D.G., BROOKS, J.B., HASUIKE, J.K., WEAVER, C.L., Development of Ion Exchange Processes for the Removal of Radionuclides from Milk, US Environmental Protection Agency Techn. Rep. RO/EERL 71-1, Washington, DC (1971).
[78] FOOKS, J.H., TERRILL, J.G., HEINEMANN, B.H., BALDI, E.J., WALTER, H.E., Evaluation of full scale strontium removal system for fluid milk, Health Physics 13 (1967) 279-286.
[79] KANDARAKIS, J.K., ANIFANTAKIS, E.M., Distribution of 131I, 134Cs and 137Cs in ewe’s milk during processing into different products, Deltio-Ethnikes Epitropes Galaktos 3 (1986) 20-23 (in Greek).
[80] KANKARE, V., ANTILA, V., PAHKALA, E., RANTAVAARA, A., PAAKKOLA, O., Cesium 137:N Ja 134:N Siirtyminen Maidon Fraktioihin, Posted Eleintarvikepaivilla, Food Congress, Helsinki (1987).
[81] KANKARE, V., ANTILA, V., PAHKALA, E., RANTAVAARA, A., PAAKKOLA, O., Transfer of Cesium-137 and Cesium-134 into Milk Fractions, Kemia-Kemi 14 (1987).
[82] KIRCHMANN, R., ADAM, V., VAN PUYMBROECK, S., Radiocontamination des derives du lait de vache, Radioisot. Radiation Dairy Sci. Technology, Proc. Seminar (1966) 189-201.
[83] LAGONI, H., Dekontamination von Milchprodukten mit Hilfe von Molkereitechnischen Verfahren, Strahlenschutz 86 (1965).
[84] LENGEMANN, E.W., Distribution of radiostrontium and radiocesium in milk and milk products, Journal of Dairy Sciences 45 (1962) 538-539.
[85] MARSHALL, R.O., SPARLING, E.M., HEINEMANN, В., BALES, RE., Large scale fixed bed ion-exchange system for removing iodine-131 and strontium-90 from milk, Journal of Dairy Sciences 51 (1965) 673-678.
[86] McENRI, С.М., MITCHELL, P.J., CUNNINGHAM, J.D., The transfer of radiocesium from whole milk and milk products. Radioactivity Transfer during Food Processing and Culinary Preparation (Proc. Sem. Cadarache), CEC, Luxembourg (1989) 251-273.
[87] McENRI, C.M., MITCHELL, P.I., CUNNINGHAM, J.D., An Experimental Study of the Transfer of Radiocesium from Raw Whole Milk to a Wide Range of Milk Products Produced by the Irish Dairy Industry, Nuclear Energy Board Interim Rep. Dublin (1988) 1-28.
[88] KERKHOF-MOGOT, M.F., VERINGA, H.A., MOL, J.J., The processing of whole milk powder from milk contaminated with 131I and its consequences for the environment, Health Physics 47 (1984) 644-648.
[89] OBINO, A.M., Radiocontamination de l’hommе par la chaine alimentaire: le cas des products laitiers dans les differentes regions de la CEE en 1977, CEPN EURATOM SC/14-099-78-P.S.A.F. (1979) 49-51.
[90] OMOMO, Y., TSUGO, Т., Distribution of radioactive strontium and caesium in milk, Journal of Agricultural Chemical Society 37 (1963) 725-728 (in Japanese).
[91] PIRHONEN, Т., UUSI-RAUVA, E., RANTAVAARA, A.N., RAURAMAA, A., The radioactivity of milk and milk products in Finland, Meyeritieteellinen Aikakauskirja 45 (1987) 62-75.
596
[92] RAYMOND, A.E., WILLIAMS, G.W., Effect of the evaporation and powdering processes on the iodine-131 content of milk, Radiological Health Data 5 (1964) 70-72.
[93] REAVEY, T.C., Distribution of radionuclides in products from two milk processing plants, Journal of Environmental Health 27 (1965) 809-817.
[94] VRIGASOV, A., MARINOV, V., Distribution of strontium-90 and cesium-137 in dairy products in the processing of ewe's milk, Veterinarnomeditsinski Nauki 5 (1968) 83-86 (in Russian).
[95] WALKER, J.P., EDMONDSON, F.L., Studies on ion exchange resins for the removal of radionuclides from milk, Health Physics 16 (1969) 85-61.
[96] WALTER, H.E., SADLER, A.M., EASTERLY, D.G., EDMONDSON, L.F., Pilot plant fixed-bed ion exchange resin system for removing iodine-131 and radiostrontium from milk, Journal of Dairy Sciences 50 (1967) 1221-1225.
[97] WALTER, H.E., Pilot plant and commercial scale development of processes for removing radionuclides from milk, Radioisot. Radiat. Dairy Sci. Technol. Proc. Semin. (1966) 99-110.
[98] WHELLER, S.M., FLEET, G.H., ASHLEY, R.J., Effect of processing upon concentration and distribution of natural and iodophor-derived iodine in milk, Journal of Dairy Sciences 66 (1983) 187-195.
[99] WHITE, M.M., MOGHISSI, A.A., Transfer of 131I from milk into cheese, Health Physics 21 (1971) 116-118.
[100] WILSON, L.G., BOTTOMLEY, R.C., SUTTON, P.M., SISK, C.H., Transfer of radioactive contamination from milk to commercial dairy products, Journal of Society of Dairy Technology 41 (1988) 10-13.
[101] WOOD, G.M., WILSON, L.G., BOTTOMLEY, R.C., SUTTON, P.M., SISK, C.H., Transfer of radioactive contamination from milk to commercial dairy products, Radioactivity Transfer during Food Processing and Culinary Preparation (Proc. Seminar Cadarache), CEC, Luxembourg (1989) 275-294.
[102] YASHCHENKO, V.F., Transfer of strontium-90 from milk into milk products, Veterinariya 8 (1969) 93-95 (in Russian).
[103] YASHCHENKO, V.F., Some regularities in the passage of 90Sr from milk to milk products during commercial processing, Hygiene and Sanitary 36 (1971) 108-109 (in Russian)
[104] PETÄJÄ E, RANTAVAARA A, PAAKKOLA O, PUOLANNE E. Reduction of radioactive caesium in meat and fish by soaking, Journal of Environmental Radioactivity 16 (1992), 273-285.
[105] BARTLEY, J.C., RABER, E.F., Effect of roasting on radiostrontium in fresh ham, Journal of the American Dietetic Association 37 (1960) 466-467.
[106] BELL, M.C., BUESCHER, R.G., Effect of bone on Sr-89 and Ca-45 in beef roasts, Journal of the American Dietetic Association 39 (1961) 567-568.
[107] BELOVA, O.M., Transfer of strontium-90 from meat to broth when applying different technological processes and treatments, Hygiene and Sanitary 31 (1966) 111-112 (in Russian).
[108] BELOVA, O.M., DIBOBES, J.K., DUBROVINA, Z.V., Correlation of strontium-90 content in raw and thermally treated food products, Hygiene and Sanitary 32 (1967) 40-42 (in Russian).
[109] DUBROVINA, Z.V., BELOVA, O.M., Changes in the strontium-90 content of food products after cooking, Hygiene and Sanitary 29 (1964) 40-43 (in Russian).
[110] EYMAN, L.D., Changes in 137Cs concentration in fish flesh during preparation for human consumption, Health Physics 28 (1975) 475-477.
[111] GERNON, G.D., Removal of radiocesium from beef, Nature 203 (1964) 1189-1190. [112] HALFORD, D.K., Effect of cooking on radionuclide concentration in waterfowl tissues, Journal
of Environmental Radioactivity 5 (1987) 229-233. [113] HECHT, H., Dekontamination radioaktive belasteten Wildbrets mittels Beizverfahren,
Fleischwirtschaft 67 (1987) 250-256. [114] HEMBRY, F.G., BELL, M.C., 90Sr phytate and 90Sr chloride in sheep and swine and roasting
effect on 90Sr in meat, Journal of Animal Sciences 25 (1966) 199-202. [115] MEYER, В., FORRESTER, J., Effects of three cooking methods on cesium-134 content of beef
from orally dosed steers, Food Technology 16 (1962) 110-112. [116] PAKULO, A.G., Changes in the l37Cs concentration of fish by culinary preparations, Hygiene
and Sanitary 36 (1971) 49-51 (in Russian).
597
[117] PAKULO, A.G., The influence of different food preparation procedures on the transfer of 137Ce from crawfish to men, Hygiene and Sanitary 46 (1981) 86-87 (in Russian).
[118] STEGER, U., BURGER, A., ZIEGLER, W., WALLNOFER, P.R., Verteilung von Cs-134 und Cs-137 bei der ktichentechnischen Verarbeitung verschiedener Lebensmittel, Deutsche Lebensmittel Rundschau 83 (1987) 85-88.
[119] WAGNER, H., Ubergang von radioaktiven Stoffen vom Futter in das Fleisch von Schlachttieren, Fleischwirtschaft 68 (1988) 656-664.
[120] WAHL, R., KALLEE, E., Decontamination puts meat in a pickle, Nature 323 (1986) 208. [121] WOOD, G.M., CLARK, S.A., WILSON, L.G., SUTTON, P.M., The effect of processing on the
radiocaesium content of lamb, Radioactivity Transfer during Food Processing and Culinary Preparation (Proc. Seminar Cadarache), CEC, Luxembourg (1989) 403-408.
[122] WORSECK, M., NIEPEL, J., KRUGER, I., Dekontamination von Fleisch, Monatshefte fuer Veterinaermedizin 25 (1970) 439-440.
[123] VAN GELDER, E., HURTGEN, G., KIRCHMANN, R., Etude experimentale de la contamination residuelle des aliments preparees a partir des fruits de mer, Radioactivity Transfer during Food Processing and Culinary Preparation (Proc. Seminar Cadarache), CEC, Luxembourg (1989) 445-455.
[124] MASON, M., GERMAIN, P., EYSSANTEER, В., GRAUBY, A., Evolution de la radioactivite de produits marins des cotes de la Manche au cours de la transformation agroalimentaire (algues) ou au cours de la preparation culinaire (moules), Radioactivity Transfer during Food Processing and Culinary Preparation (Proc. Seminar Cadarache), CEC, Luxembourg (1989) 457-468.
[125] Personal communication, G Forder, Chartered Institute of Environmental Health. [126] SHELEST, Z.M., KURBET, T.V., KOROTKOVA, E.Z., Decreasing of 137Cs content in forest
food production by technological processing, Problems of forest ecology and forest using in Ukrainian Polessye 6 (1999) 92-96 (in Ukrainian).
[127] KURBET, T.V. Decreasing 137Cs content in fruitbodies of edible mushrooms by culinary processing, Proc. Intern. Conf. 15 years of Chernobyl catastrophe, Kiev 2001, Chernobyl Inform, Kyiv (2001) 2-41 (in Ukrainian).
[128] ANTONOVA, V.A., SEDITSKAYA, Z.L. Influence of processing technology of medicinal preparations on transfer of caesium-137 into liquid medicinal form, Hygiene and Sanitary 7 (1989) 87-88 (in Russian).
[129] ANTONOVA, V.A., PROKOFIEV, O.N. Methods of sampling preparation for analysis of 137Cs and 90Sr, Agrochemistry 7 (1982) 138-141 (in Russian).
[130] DMITRIEV, S.V., FETISOV, A.A., PERTSEV V.A., KOTOV N.N. Contamination of wild medicinal plants by caesium-137, Hygiene and Sanitary 12 (1991) 51-53 (in Russian).
[131] PROKOFIEV, O.N., ANTONOVA, V.A., SEDITSKAYA, Z.L. Calculation of temporary permissible levels of sum specific activity of mixture of radionuclides in liquid medicinal forms and plant raw, Hygiene and Sanitary 6 (1992) 31-34 (in Russian).
[132] ALI, S.L. The radioactive contamination of medicinal plants after Chernobyl accident, Proc. Intern. Symp. on ecological aspects in pharmacy, Moscow, 1990, Moscow (1990) 4 (in Russian).
[133] KRASNOV, V.P., ORLOV, A.A., GET’MANCHUK, A.I., Radioecology of medicinal plants, Zhytomyr, Polissya Publishers (2005) 216 (in Ukrainian).
[134] ORLOV, A.A., KRASNOV, V.P., GRODZINSKY, D.M., KHOMLYAK, M.N., KOROTKOVA, E.Z. Radioecological aspects of use of wild medicinal plants: transfer of 137Cs from raw to water medicinal forms, Problems of forest ecology and forest using in Ukraine, Polessye 6 (1999) 51-61 (in Ukrainian).
[135] GUBIN, Yu.I., DZYUBAK, O.P., DZYUBAK, S.M. et al. Dependence of 137Cs extraction fron alcohol concentration in solvent, Ukrainian Radiological Journal 4 (1999) 469 (in Ukrainian).
[136] GUBIN, Yu.I., DZYUBAK, O.P., DZYUBAK, S.M. et al. Investigation of 137Cs transfer in the system medicinal plant raw material – infusion, Ukrainian Radiological Journal 2 (2000) 168-170 (in Ukrainian).

598
APPENDIX
List of publication used for evaluation of food processing factors values
INTERNATIONAL ATOMIC ENERGY AGENCY, Handbook of parameter values for the prediction of the radionuclide transfer in temperate environments. IAEA, Technical Report Series N° 364, (1994) 74. BOGDEVITCH, I., SANZHAROVA, N., PRISTER, B., TARASIUK, S., “Countermeasures on natural and agricultural areas after Chernobyl accident”, Role of GIS in Lifting the Cloud off Chernobyl, (J. KOLEJKA Ed.), Kluwer Academic Publishers (2002) 147-158. DEVILLE-CAVELIN, G., ALEXAKHIN, R.M., BOGDEVITCH, I.M., PRISTER, B.S., BIESOLD, H., PEREPELYATNIKOVA, L.V., SANZHAROVA, N.I., TARASIUK, S.V., “Countermeasures in agriculture: assessment of efficiency“, Proc. of the International Conference “Fifteen Years after the Chernobyl Accident. Lessons Learned”, Kiev (2001) 118-128. NOORDIJK, H., QUINAULT, J.M., The influence of food processing and culinary preparation on the radionuclide content of foodstuffs: A review of available data, Modelling of Resuspension, Seasonality and Losses during Food Processing, First report of the VAMP Terrestrial Working Group, IAEA-TECDOC-647, Vienna (1992) 35-59. GREEN, N., The effect of storage and processing on radionuclide content of fruit, Journal of Environmental Radioactivity 52 (2001) 281-290. GREEN, N., WILKINS, B.T., Effects of processing on radionuclide content of foods: derivation of parameter values for use in radiological assessments. NRPB-M587, National Radiological Protection Board, Chilton (1995). LONG, S., POLLARD, D., CUNNINGHAM, J.L., ASTASHEVA, N.P., DONSKAYA, G.A., LABETSKY, E.V., The effects of food processing and direct decontamination techniques on the radionuclide content of foodstuffs: A literature review. Part 2: Meat, fruit, cereals and drinks, Journal of Radioecology 3(2) (1995) 15-38. INTERNATIONAL ATOMIC ENERGY AGENCY, Modelling the transfer of radionuclides to fruit, IAEA-BIOMASS-5, IAEA, Vienna, (2003) 151. RODOS: Decision support system for off-site nuclear emergency management in Europe (EHRHARDT, J., WEIS, A., Eds.) Report EUR 19144, ISBN No.92-828-9773-7 (2000) 259. FOOD STANDARDS AGENCY, McCance Widdowson's The Composition of Foods, Sixth summary edition. Cambridge: Royal Society of Chemistry, ISBN 0-85404-428-0, (2002), 537, STATE HYGIENIC STANDARDS, Permissible levels of 137Cs and 90Sr content in foodstuffs and drinking water (PL-97), Kyiv, Chornobyinterinform. (1997) 10. IVANOVA, T.N., PEREPELYATNIKOVA, L.V., GRYTZUK, N.R., Assessment of radionuclides distribution at the processing of the vegetable stuff: Problems of agricultural radiology, Collection of the scientific articles (Prister, B. Ed.) 4, UIAR. Kiev, Ukraine (1996) 188-198 (in Ukraine). Radionuclides in Food–MAFF Food Surveillance Paper 43, HMSO, London (1994) 221. The effects of processing on cadmium and lead levels in food, FSA Final Report C01006 (2000) 62. WATTERSON, J., NICHOLSON, K., The effects of food preparation on the radionuclide content of food, MAFF Report AEAT/43710001/REME-194, (1996) 13. WATTERSON, J., NICHOLSON, K., Change in radionuclide content in crops as a result of food preparation, AEA/CS-10400 (1995) 24. Removal of Radionuclide during Food Processing and Culinary Preparation, Environmental parameters, series 4, Radioactive Waste Management Center, Japan (1994) (in Japanese). KASHPAROV V., COLLE C., LEVCHUK S., YOSCHENKO V., SVYDYNUK N. Transfer of radiochlorine from the environment to agricultural foodstuffs, Journal of Environmental Radioactivity 94(1) (2007) 1-15.

599
ADRIANO, D.C., DOSWELL, A.C., CIRAVOLO, T.G., PINDER, J.E., III., MCLEOD, K.W., Radionuclide content of selected root vegetables as influenced by culinary preparation, Journal of Environmental Radioactivity 49, (2000) 307-317. WATTERSON J., NICHOLSON K. W. Change in radionuclide content of crops as a result of food preparation Journal of Radiological Protection 16(3) (1996) 191–200. ARNAUD, M.J., The removal and/or reduction of radionuclides in the food chain, Radionuclides in the Food Chain, ILSI Monographs, Berlin (1988) 195-213. RANTAVAARA, A.H., Transfer of radionuclides during processing and preparation of foods; Finnish studies since 1986, Radioactivity Transfer during Food Processing and Culinary Preparation (Proc. Seminar Cadarache), CEC, Luxembourg (1989) 69-94. DELMAS, J., GRAUBY, A., Influence des technologies de transformation agroalimentaire sur la radioactivite des aliments, Foodstuffs Intervention Level Following a Nuclear Accident (Proc. Sem. Luxembourg), Rep. Eur. 11232, CEC, Luxembourg (1987) 183-197 (in French). ENDRES, O., FISCHER, E., Untersuchungen zur Dekontamination von Gemuse, Deutsche Lebensmittel-Rundschau 65 (1969) 1-5. FOOD AND DRUG ADMINISTRATION, Strontium-90 in food at intermediate stages of preparation for canning and freezing, Radiological Health Data 5 (1964) 222-226. GRUETER, H., Radioactive fission product Cs-137 in mushrooms in West Germany during 1963-1970, Health Physics 20 (1971) 655-656. HISAMATSU, S., TAKIZAWA, Y., ABE, Т., Reduction of 131I content in leafy vegetables and seaweed by cooking, Journal of Radiation Research. 28 (1987) 135-140. LAUG, E.P., Temporal and geographical distributions of strontium-90 and cesium-137 in food, Radiological Health Data (1963) 448-455. MURAMATSU, Y., UCHIDA, S., SUMIYA, M., YOSHIDA, S., OHMOMO, Y., Decontamination of radioiodine from waste and vegetables, Radioactivity Transfer during Food Processing and Culinary Preparation, Proc. Seminar Cadarache, CEC, Luxembourg (1989) 341-349. PAULUS, K., Beurteilung pflanzlicher Lebensmittel nach Behandlungen zur Beseitigung der radioaktiven Kontamination, Z. Lebensmittel-Untersuchung 142 (1969) 17-24. PAULUS, K., Dekontamiantion von mit 137Cs and 85Sr kontaminiertem Blattgemuse (Salat, Kohl, Spinat), Z. Lebensmittel-Untersuchung 138 (1969) 329-334. PAULUS, K., Dekontamination von mit 137Cs and 85Sr kontaminiertem Blattgemuse (Salat, Kohl, Spinat), Z. Lebensmittel-Untersuchung 139 (1969) 7-12. PAULUS, K., Dekontamination von pflanzlichen Lebensmitteln, insbesondere von Obst und Gemuse, sowie damit zusammenhangende Probleme. Kontamin. Decontamination Lebensmittel, Proc. Conf. Karlsruhe (1974) 197-228. PAULUS, K., Die Dekontamination von mit radioaktiven Stoffen oberflachig ver-seuchtem Gemuse und Obst, Industrielle Obst- und Gemueseverwertung 53 (1968) 85-88. PAULUS, K., Zur Dekontamination von Rote Beete, Kohlrabi und Rosenkohl, Industrielle Obst- und Gemueseverwertung 53 (1968) 635-638. RANTAVAARA, A., Radioactivity of Vegetables and Mushrooms in Finland after the Chernobyl Accident in 1986, Suppl. 4 to Annual Rep. STUK-A55, Finnish Centre for Radiation and Nuclear Safety, Helsinki (1987). RALLS, J.W., MAAGDENBERG, H.J., GUCKEEN, T.R., MERCER, W.A., Removal of radioactive strontium and caesium from vegetables and fruits during preparation for preservation, Journal of Food Science 36 (1971) 653-656. RALLS, J.W., et al., Distribution of strontium and calcium in major vegetable and fruit crops and criteria for use of fallout-contaminated foods, Radiological Health Data Rep. 8 (1967) 355-358. RALLS, J.W., MAAGDENBERG, H.J., GUCKEEN, T.R., MERCER, W.A., Removal of radioactive strontium and caesium from certain vegetables and fruits during normal preparation for preservation, Isotopes and Radiation Technology 6 (1969) 146-149. ROHLEDER, K., Uber die radioaktive Dekontamination von Speisepilzen durch Blan-chieren, Industrielle Obst- und Gemueseverwertung 52 (1967) 64-66.

600
ROHLEDER, K., Untersuchungen uber die Aufnahme radioaktiver Stoffe durch Grunkohl aus dem Boden and aus der Atmosphare und Versuche zur Dekontamination, Zeitschrift fuer Lebensmittel-Untersuchung und -Forschung 149 (1972) 223-227. THOMPSON, J.C., HOWE, M., Retention and removal of I31I from contaminated vegetables, Health Physics 24 (1973) 345-351. THOMPSON, J.C., Sr removal in vegetables prepared for home consumption, Health Physics 11 (1965) 136-137. WEAVER, СМ., HARRIS, N.D., Removal of radioactive strontium and cesium from vegetables during laboratory scale processing, Journal of Food Science 44 (1979) 1491-1493. WILKINS, B.T., BRADLEY, E.J., DODD, N.J., The effects of culinary preparation on radionuclide levels in vegetable foodstuffs, Radiation Protection Dosimetry. 20 (1987) 187-190. “De radioactieve besmetting in Nederland t.g.v. het kernongeval in Tsjernobyl” Part 1, Chapter 12, Werkdocumenten CCRX-rapport (1986). BRADLEY, E.J., POPPLEWELL, D.S., WILKINS, B.T., The influence of simple culinary preparation on the radionuclide content of vegetables, Radioactivity Transfer during Food Processing and Culinary Preparation (Proc. Seminar Cadarache), CEC, Luxembourg (1989) 311-324. PAULUS, K., Zur Dekontamination totalkontaminierter Kartoffeln. Zeitschrift fuer Lebensmittel-Untersuchung und -Forschung 139 (1969) 282-287. PERKINS, H.J., STRACHAN, J., Decontamination of potato tubers containing caesium-137, Science 144 (1964) 59-60. HISAMATSU, S., TAKIZAWA, Y., ABE, T., Radionuclide contents of leafy vegetables; their reduction by cooking. Journal of Radiation Research 29 (1988), 110-118. FRIEDLI, C, GEERING, J.J., LERCH, P., Strontium-90 measurements in Switzerland, Impact des Accidents d'Origine Nucleaire sur l'Environnement (Proc. Sem. Cadarache), Centre d'etudes nucleaires de Cadarache (1988) F114-F121. APOSTOLATOS, G., HADJIANTONIOU, A., Caesium contamination transfer in wheat products, Radioactivity Transfer during Food Processing and Culinary Preparation (Proc. Seminar Cadarache), CEC, Luxembourg (1989) 377-400. ARAPIS, G., MARTI, J.M., KOUSKOUTOPOULOS, A., KARANDINOS, M., IRANZO, E., Low radioactivity contribution of cereals to diet due to their specific composition and processing, Radioactivity Transfer during Food Processing and Culinary Preparation (Proc. Seminar Cadarache), CEC, Luxembourg (1989). BUNZL, K., KRACKE, W., Soil to plant transfer of 239+240Pu, 238Pu, 241Am, 137Cs and 90Sr from global fallout in flour and bran from wheat, rye, barley and oats, as obtained by field measurements, Science of the Total Environment 63 (1987) 111-124. BUNZL, K., KRACKE, W., Transfer of 137Cs and 90Sr to flour, bran and straw from wheat, rye, barley and oats during the years 1982, 1986 (reactor accident at Chernobyl) and 1987 in field measurements, Zeitschrift fuer Lebensmittel-Untersuchung und -Forschung (in press). LIU, D.J., ROBBINS, G.S., POMERANZ, Y., Composition and utilization of milled barley products, Cereal Chemistry 51 (1974) 309-316. LOFTI, M., NOTARO, M., AZIMI-GARAKANI, D., PIERMATTEI, S., TOM-MASINO, L., Loss of radioactivity in cooked spaghetti, Science of the Total Environment 79 (1989) 291-293. MULLER, H., Radiaktivitats-Kontamination von Brotgetreide nach Tschernobyl, Die Muhle+Mischfuttertechnik 123 (1986) 392-393. OHMOMO, Y., et al., Transfer of radioiodine into rice grains, Impact des Accidents d'Origine Nucleaire sur l'Environnement (Proc. Symp. Cadarache), Part 1, Centre d'etudes nucleaires de Cadarache (1988) D68-D74. PFEIFER, V.F., PEPLINSKI, A.J., HUBBARD, J.E., Strontium-90 in plant parts and milling fractions from a 1963 Illinois wheat, Radiological Health Data 5 (1964) 283-284. RIVERA, J., Sr-90 in U.S. wheat and flour produced in 1962 and predictions of levels in the 1963 crop, Fallout Program Quarterly Summary Report HASL-140, Office of Technical Services, Department of Commerce, Washington, DC (1964) 276-282.
601
VOIGT, G., MULLER, H., PROHL, G., PARETZKE, H.G., Caesium activity distribution in cereals after milling processes, Radioactivity Transfer during Food Processing and Culinary Preparation (Proc. Seminar Cadarache), CEC, Luxembourg (1989) 351-360. BOVARD, P., BENARD, P., DELMAS, J., GRAUBY, A., Transfert des produits de fission dans le vigne et le vin, C.R. Seances Acad. Agric. Fr. (1968) 989-995. CASTRO, J., SANCHO, A., VEIGA, E., DIAS YUBERO, J., MURIAS, B.S.F., Transfert de Cs-134 et Cs-137 dans les infusions d'herboristerie, Radioactivity Transfer during Food Processing and Culinary Preparation (Proc. Seminar Cadarache), CEC, Luxembourg (1989) 205-218. GEDIKOGLU, A., SIPAHI, B.L., OSKAY, Т., KURUGLU, M., Chernobyl radio-activity in Turkey, Radioactivity Transfer during Food Processing and Culinary Preparation (Proc. Seminar Cadarache), CEC, Luxembourg (1989) 193-204. MASSCHELEIN, W.J., Elimination d'isotopes radioactifs par les filieres convention-nelles de traitement des eaux potables, Radioactivity Transfer during Food Processing and Culinary Preparation (Proc. Seminar Cadarache), CEC, Luxembourg (1989) 167-192. MIRIBEL, J., DELMAS, J., Utilisation de traceurs activables pour l' etude de devenir de la contamination radioactive au cours de la vinification, Radioactivity Transfer during Food Processing and Culinary Preparation (Proc. Seminar Cadarache), CEC, Luxembourg (1989) 219-227. GIESE, W., SCHIMANSKY, K., KLUGE, K., ROINER, F., Radiocesium transfer to whey and whey products: whey decontamination on an industrial scale, Radiactivity Transfer during Food Processing and Culinary Preparation (Proc. Seminar Cadarache), CEC, Luxembourg (1989) 295-308. ANNENKOV, В., Radiobiology and radioecology of farm animals, Radiobiol. Radioekol. Sel'skokhoz. Zhivotn. (1973) (in Russian). ASSIMAKOPOULOS, PA., IOANNIDES, K.G., PAKOU, A.A., PARADOPOULOU, C.V., Transport of the radioisotopes iodine-131, cesium-134 and cesium-137 from the fallout following the accident at the Chernobyl nuclear reactor into cheese and other cheesemaking products, Journal Dairy Sciences 70 (1987) 1338-1343. ANTILA, V, KANKARE, V, PAHKALA, E., PAAKKOLA, O., RANTAVAARA, A., Radionuklidien siirtyminen meijeriprosesseissa eri maitovalmisteisiin ja maidon fraktioihin, Meijeriteollisuus 3 (1987) 36-37. BALES, R.E., HICKEY, J.L.S., Commercial processing of milk for concurrent removal of cationic and anionic radionuclides, Radioisot. Radiat. Dairy Sci. Technol. Proc. Semin. (1966) 121-145. BUMA, T.J., MEERESTRA, J., Transfer of radiostrontium from milk to cheese and whey, Nature 202 (1964) 310-311. CALAPAJ, G.G., ONGARO, D., Sul comportamento del 90Sr e del l37Cs nei processi di burrificazione e caseificazione del latte, Minerva Nucleare 9 (1965) 93-98. CIGNA, A., MARIANI, A., SPADONI, M.A., TOMASSI, G., Research on radiocontamination transport in food chains: 90Sr in Parmigiano Reggiano cheese during 1957 to 1963, Nuclear Science 23 (1969) 297. DUBROVINA, S.V., BELOVA, O.M., Transfer of strontium-90 from milk into several milk products by different technological processes, Hygene and Sanitary 28 (1963) 105-108 (in Russian). EASTERLY, D.G., BROOKS, J.B., HASUIKE, J.K., WEAVER, C.L., Development of Ion Exchange Processes for the Removal of Radionuclides from Milk, US Environmental Protection Agency Techn. Rep. RO/EERL 71-1, Washington, DC (1971). FOOKS, J.H., TERRILL, J.G., HEINEMANN, B.H., BALDI, E.J., WALTER, H.E., Evaluation of full scale strontium removal system for fluid milk, Health Physics 13 (1967) 279-286. KANDARAKIS, J.K., ANIFANTAKIS, E.M., Distribution of 131I, 134Cs and 137Cs in ewe’s milk during processing into different products, Deltio-Ethnikes Epitropes Galaktos 3 (1986) 20-23 (in Greek). KANKARE, V., ANTILA, V., PAHKALA, E., RANTAVAARA, A., PAAKKOLA, O., Cesium 137:N Ja 134:N Siirtyminen Maidon Fraktioihin, Posted Eleintarvikepaivilla, Food Congress, Helsinki (1987). KANKARE, V., ANTILA, V., PAHKALA, E., RANTAVAARA, A., PAAKKOLA, O., Transfer of Cesium-137 and Cesium-134 into Milk Fractions, Kemia-Kemi 14 (1987).

602
KIRCHMANN, R., ADAM, V., VAN PUYMBROECK, S., Radiocontamination des derives du lait de vache, Radioisot. Radiation Dairy Sci. Technology, Proc. Seminar (1966) 189-201. LAGONI, H., Dekontamination von Milchprodukten mit Hilfe von Molkereitechnischen Verfahren, Strahlenschutz 86 (1965). LENGEMANN, E.W., Distribution of radiostrontium and radiocesium in milk and milk products, Journal of Dairy Sciences 45 (1962) 538-539. MARSHALL, R.O., SPARLING, E.M., HEINEMANN, В., BALES, RE., Large scale fixed bed ion-exchange system for removing iodine-131 and strontium-90 from milk, Journal of Dairy Sciences 51 (1965) 673-678. McENRI, С.М., MITCHELL, P.J., CUNNINGHAM, J.D., The transfer of radiocesium from whole milk and milk products. Radioactivity Transfer during Food Processing and Culinary Preparation (Proc. Sem. Cadarache), CEC, Luxembourg (1989) 251-273. McENRI, C.M., MITCHELL, P.I., CUNNINGHAM, J.D., An Experimental Study of the Transfer of Radiocesium from Raw Whole Milk to a Wide Range of Milk Products Produced by the Irish Dairy Industry, Nuclear Energy Board Interim Rep. Dublin (1988) 1-28. KERKHOF-MOGOT, M.F., VERINGA, H.A., MOL, J.J., The processing of whole milk powder from milk contaminated with 131I and its consequences for the environment, Health Physics 47 (1984) 644-648. OBINO, A.M., Radiocontamination de l’hommе par la chaine alimentaire: le cas des products laitiers dans les differentes regions de la CEE en 1977, CEPN EURATOM SC/14-099-78-P.S.A.F. (1979) 49-51. OMOMO, Y., TSUGO, Т., Distribution of radioactive strontium and caesium in milk, Journal of Agricultural Chemical Society 37 (1963) 725-728 (in Japanese). PIRHONEN, Т., UUSI-RAUVA, E., RANTAVAARA, A.N., RAURAMAA, A., The radioactivity of milk and milk products in Finland, Meyeritieteellinen Aikakauskirja 45 (1987) 62-75. RAYMOND, A.E., WILLIAMS, G.W., Effect of the evaporation and powdering processes on the iodine-131 content of milk, Radiological Health Data 5 (1964) 70-72. REAVEY, T.C., Distribution of radionuclides in products from two milk processing plants, Journal of Environmental Health 27 (1965) 809-817. VRIGASOV, A., MARINOV, V., Distribution of strontium-90 and cesium-137 in dairy products in the processing of ewe's milk, Veterinarnomeditsinski Nauki 5 (1968) 83-86 (in Russian). WALKER, J.P., EDMONDSON, F.L., Studies on ion exchange resins for the removal of radionuclides from milk, Health Physics 16 (1969) 85-61. WALTER, H.E., SADLER, A.M., EASTERLY, D.G., EDMONDSON, L.F., Pilot plant fixed-bed ion exchange resin system for removing iodine-131 and radiostrontium from milk, Journal of Dairy Sciences 50 (1967) 1221-1225. WALTER, H.E., Pilot plant and commercial scale development of processes for removing radionuclides from milk, Radioisot. Radiat. Dairy Sci. Technol. Proc. Semin. (1966) 99-110. WHELLER, S.M., FLEET, G.H., ASHLEY, R.J., Effect of processing upon concentration and distribution of natural and iodophor-derived iodine in milk, Journal of Dairy Sciences 66 (1983) 187-195. WHITE, M.M., MOGHISSI, A.A., Transfer of 131I from milk into cheese, Health Physics 21 (1971) 116-118. WILSON, L.G., BOTTOMLEY, R.C., SUTTON, P.M., SISK, C.H., Transfer of radioactive contamination from milk to commercial dairy products, Journal of Society of Dairy Technology 41 (1988) 10-13. WOOD, G.M., WILSON, L.G., BOTTOMLEY, R.C., SUTTON, P.M., SISK, C.H., Transfer of radioactive contamination from milk to commercial dairy products, Radioactivity Transfer during Food Processing and Culinary Preparation (Proc. Seminar Cadarache), CEC, Luxembourg (1989) 275-294. YASHCHENKO, V.F., Transfer of strontium-90 from milk into milk products, Veterinariya 8 (1969) 93-95 (in Russian).
603
YASHCHENKO, V.F., Some regularities in the passage of 90Sr from milk to milk products during commercial processing, Hygiene and Sanitary 36 (1971) 108-109 (in Russian)
PETÄJÄ E, RANTAVAARA A, PAAKKOLA O, PUOLANNE E. Reduction of radioactive caesium in meat and fish by soaking, Journal of Environmental Radioactivity 16 (1992), 273-285.
BARTLEY, J.C., RABER, E.F., Effect of roasting on radiostrontium in fresh ham, Journal of the American Dietetic Association 37 (1960) 466-467.
BELL, M.C., BUESCHER, R.G., Effect of bone on Sr-89 and Ca-45 in beef roasts, Journal of the American Dietetic Association 39 (1961) 567-568.
BELOVA, O.M., Transfer of strontium-90 from meat to broth when applying different technological processes and treatments, Hygiene and Sanitary 31 (1966) 111-112 (in Russian).
BELOVA, O.M., DIBOBES, J.K., DUBROVINA, Z.V., Correlation of strontium-90 content in raw and thermally treated food products, Hygiene and Sanitary 32 (1967) 40-42 (in Russian).
DUBROVINA, Z.V., BELOVA, O.M., Changes in the strontium-90 content of food products after cooking, Hygiene and Sanitary 29 (1964) 40-43 (in Russian).
EYMAN, L.D., Changes in 137Cs concentration in fish flesh during preparation for human consumption, Health Physics 28 (1975) 475-477.
GERNON, G.D., Removal of radiocesium from beef, Nature 203 (1964) 1189-1190.
HALFORD, D.K., Effect of cooking on radionuclide concentration in waterfowl tissues, Journal of Environmental Radioactivity 5 (1987) 229-233.
HECHT, H., Dekontamination radioaktive belasteten Wildbrets mittels Beizverfahren, Fleischwirtschaft 67 (1987) 250-256.
HEMBRY, F.G., BELL, M.C., 90Sr phytate and 90Sr chloride in sheep and swine and roasting effect on 90Sr in meat, Journal of Animal Sciences 25 (1966) 199-202.
MEYER, В., FORRESTER, J., Effects of three cooking methods on cesium-134 content of beef from orally dosed steers, Food Technology 16 (1962) 110-112.
PAKULO, A.G., Changes in the l37Cs concentration of fish by culinary preparations, Hygiene and Sanitary 36 (1971) 49-51 (in Russian).
PAKULO, A.G., The influence of different food preparation procedures on the transfer of 137Ce from crawfish to men, Hygiene and Sanitary 46 (1981) 86-87 (in Russian).
STEGER, U., BURGER, A., ZIEGLER, W., WALLNOFER, P.R., Verteilung von Cs-134 und Cs-137 bei der ktichentechnischen Verarbeitung verschiedener Lebensmittel, Deutsche Lebensmittel Rundschau 83 (1987) 85-88.
WAGNER, H., Ubergang von radioaktiven Stoffen vom Futter in das Fleisch von Schlachttieren, Fleischwirtschaft 68 (1988) 656-664.
WAHL, R., KALLEE, E., Decontamination puts meat in a pickle, Nature 323 (1986) 208.
WOOD, G.M., CLARK, S.A., WILSON, L.G., SUTTON, P.M., The effect of processing on the radiocaesium content of lamb, Radioactivity Transfer during Food Processing and Culinary Preparation (Proc. Seminar Cadarache), CEC, Luxembourg (1989) 403-408.
WORSECK, M., NIEPEL, J., KRUGER, I., Dekontamination von Fleisch, Monatshefte fuer Veterinaermedizin 25 (1970) 439-440.
VAN GELDER, E., HURTGEN, G., KIRCHMANN, R., Etude experimentale de la contamination residuelle des aliments preparees a partir des fruits de mer, Radioactivity Transfer during Food Processing and Culinary Preparation (Proc. Seminar Cadarache), CEC, Luxembourg (1989) 445-455.
MASON, M., GERMAIN, P., EYSSANTEER, В., GRAUBY, A., Evolution de la radioactivite de produits marins des cotes de la Manche au cours de la transformation agroalimentaire (algues) ou au cours de la preparation culinaire (moules), Radioactivity Transfer during Food Processing and Culinary Preparation (Proc. Seminar Cadarache), CEC, Luxembourg (1989) 457-468.
Personal communication, G Forder, Chartered Institute of Environmental Health.
SHELEST, Z.M., KURBET, T.V., KOROTKOVA, E.Z., Decreasing of 137Cs content in forest food production by technological processing, Problems of forest ecology and forest using in Ukrainian Polessye 6 (1999) 92-96 (in Ukrainian).
604
KURBET, T.V. Decreasing 137Cs content in fruitbodies of edible mushrooms by culinary processing, Proc. Intern. Conf. 15 years of Chernobyl catastrophe, Kiev 2001, Chernobyl Inform, Kyiv (2001) 2-41 (in Ukrainian). ANTONOVA, V.A., SEDITSKAYA, Z.L. Influence of processing technology of medicinal preparations on transfer of caesium-137 into liquid medicinal form, Hygiene and Sanitary 7 (1989) 87-88 (in Russian). ANTONOVA, V.A., PROKOFIEV, O.N. Methods of sampling preparation for analysis of 137Cs and 90Sr, Agrochemistry 7 (1982) 138-141 (in Russian). DMITRIEV, S.V., FETISOV, A.A., PERTSEV V.A., KOTOV N.N. Contamination of wild medicinal plants by caesium-137, Hygiene and Sanitary 12 (1991) 51-53 (in Russian). PROKOFIEV, O.N., ANTONOVA, V.A., SEDITSKAYA, Z.L. Calculation of temporary permissible levels of sum specific activity of mixture of radionuclides in liquid medicinal forms and plant raw, Hygiene and Sanitary 6 (1992) 31-34 (in Russian). ALI, S.L. The radioactive contamination of medicinal plants after Chernobyl accident, Proc. Intern. Symp. on ecological aspects in pharmacy, Moscow, 1990, Moscow (1990) 4 (in Russian). KRASNOV, V.P., ORLOV, A.A., GET’MANCHUK, A.I., Radioecology of medicinal plants, Zhytomyr, Polissya Publishers (2005) 216 (in Ukrainian). ORLOV, A.A., KRASNOV, V.P., GRODZINSKY, D.M., KHOMLYAK, M.N., KOROTKOVA, E.Z. Radioecological aspects of use of wild medicinal plants: transfer of 137Cs from raw to water medicinal forms, Problems of forest ecology and forest using in Ukraine, Polessye 6 (1999) 51-61 (in Ukrainian). GUBIN, Yu.I., DZYUBAK, O.P., DZYUBAK, S.M. et al. Dependence of 137Cs extraction fron alcohol concentration in solvent, Ukrainian Radiological Journal 4 (1999) 469 (in Ukrainian). GUBIN, Yu.I., DZYUBAK, O.P., DZYUBAK, S.M. et al. Investigation of 137Cs transfer in the system medicinal plant raw material – infusion, Ukrainian Radiological Journal 2 (2000) 168-170 (in Ukrainian).

605
USE OF ANALOGUES
E. LECLERC
Andra, National Radioactive Waste Management Agency, France
K. TAGAMI and S. UCHIDA
National Institute of Radiological Sciences, Japan
B. VARGA
Central Agricultural Office, Hungary
Abstract
The use of analogues is necessary in the case where directly applicable data are not available or are of dubious quality. Three
main types of analogue are considered in this document: the same parameter obtained for another isotope of the same element
(e.g. using data obtained for a stable isotope of a radioactive element) – analogue isotopes; the same parameter obtained for
another element – analogue elements; and the differening parameter obtained for the same element (e.g. applying the soil–
plant transfer factor for one crop to another crop) – analogue parameters. An analogue could only be proven to be valid by
comparing its behaviour in the conditions of interest with that of the thing for which it is an analogue. Hence, while
confidence in the validity of an analogue will increase as the quality of the justification increases, there will always be some
residual uncertainty.
1. INTRODUCTION
The bioavailability of hazardous materials depends on their physical and chemical properties,
as well as the nature of release and the biogeochemistry of the environment at their location of
deposition. The self-cleaning capacity of the receptor medium also has a determining role.
The movement of radionuclides between different physical and chemical phases in different
parts of various ecosystems has been studied, but only for a few radionuclides (mainly of
caesium and strontium) and is still not well understood in details. Finding a proper analogue
either for a process or for an isotope often leads to a better, more reliable description of
environmental behaviour. The use of analogues is not an accurate way of modelling, but may
be used if no data are available in the frame of screening models. Analogues can be used to
provide input values for model parameters as default values, though care has to be exercised
in not pushing such analogies beyond their legitimate domain of applicability. Thorough
knowledge is required of the system for which an analogue is sought to derive parameter
values. Relevant processes and features have to be known, such as time scales of these
processes, physical, chemical and biological properties of the environment and relevant
media.
Three main types of analogue that can be used for derivation of values if measured or
recommended values given in this document are not available:
• The same parameter obtained for another isotope of the same element (e.g. using data
obtained for a stable isotope of a radioactive element) – analogue isotopes;
• The same parameter obtained for another element – analogue elements; and
• A different parameter obtained for the same element (e.g. applying the soil–plant
transfer factor for one crop to another crop) – analogue parameters.

606
2. ANALOGUE ISOTOPES
Application of analogue isotopes is the most common form and is often used without any
specific justification or even recognition that data for an analogue are being used. Short-lived
fission products whose environmental behaviour has been extensively studied in the context
of reactor accidents or routine discharges used as analogues for long-lived isotopes of
relevance for solid waste disposal, like data of 131
I for long lived 129
I and data on well studied 134
Cs or 137
Cs for the long lived 135
Cs; similarly, short-lived and readily available tracer
radionuclides are used in experiments as analogues for the isotopes found in radioactive
discharges or disposed as wastes.
Stable isotopes whose environmental behaviour has been extensively studied in the context of
chemical toxicity can be used as analogues for less common and less studied radioactive
isotopes found in radioactive discharges or disposed as wastes.
Since radionuclides remain in the environment for a long time, obtaining transfer factors
values under equilibrium conditions is important because a freshly added radionuclide may
not be at equilibrium in the environment. Many long-lived radionuclides generated in nuclear
power plants do not exist in the natural environment and there is a general lack of information
on their environmental behaviour over decades. To fill these gaps, measurement of Fv values
of naturally existing elements rather than radionuclides can be a powerful tool to obtain Fv
values under equilibrium conditions.
It has been also reported that the Fv values of fallout 137
Cs are 3-6 times higher than those of
native Cs [1, 2, 3] suggesting that the physico-chemical forms of global fallout 137
Cs differ
from those of naturally occurring stable Cs. Fig 1. compares Fv values for 137
Cs and stable Cs
for white rice collected in Akita, Japan over 1987 to 1999 [4, 5]. Fv data for the period 1959-
1986 were excluded because they were affected by global fallout [6]. Fv data for fallout 137
Cs
and stable Cs for crops collected from the 2002 to 2005 are also plotted for comparison in
Fig 2. The values recorded were rather similar but the Fv values for 137
Cs were usually slightly
higher than the Fv values for stable caesium (p<0.01).
10-4
10-3
10-2
10-1
1988 1990 1992 1994 1996 1998
Cs-137Cs-133 (stable)
TF
s o
f n
ati
ve C
s a
nd
137
Cs f
or
wh
ite r
ice
Year
Average of 137
Cs-TF
Average of native Cs-TF
FIG. 1. Transfer factors of 137
Cs and stable native 133
Cs for white rice collected in Akita, Japan [4, 5].

607
10-5
10-4
10-3
10-2
10-1
100
10-5
10-4
10-3
10-2
10-1
100
Brown rice
White rice
Wheat
Tubers
Green vegetables
Root vegetables
Fruit vegetables
TF-137
Cs
TF-1
33
Cs
FIG. 2. Relationship between Fv
137Cs and Fv stable native
133Cs for various crops [1-3].
This phenomenon of initial higher bioavailability of 137
Cs than stable Cs can be explained as
follows: fresh, artificial 137
Cs is more mobile and more easily adsorbed by plants than stable
Cs in the soil. Stable Cs is present in the interlayer lattice of clays, where it is relatively
unavailable compared with 137
Cs.
However, 137
Cs slowly becomes incorporated in the interlayer lattice, so that eventually it is
well-mixed with the whole stable Cs pool in soil; therefore, in the long term, the v
F value for
stable Cs can be used to evaluate transfer of 137
Cs in the environment. The same reasoning can
be adopted for other elements. For several radioisotopes, there is/are stable isotope(s), such as 88
Sr for 90
Sr, 127
I for 129
I and 133
Cs for 135
Cs or 137
Cs, so that the stable isotopes can serve as
analogues. Table 1 provides, for some crops, Fv values of elements that might serve as
analogues for radionuclides [3, 9-11].
The uptake of 79
Se by plants will be strongly determined by the stable selenium status of the
soil. Similarly, in upland areas, soils can be low in stable iodine and chlorine, so affecting
transfers of radioisotopes of these elements. In particular, for iodine the fraction of a
radioisotope entering the blood that is taken up by the thyroid is enhanced in iodine-deficient
conditions. For chlorine, homeostatic requirements mean that the half life of retention in the
bodies of animals varies in inverse proportion to the level of the stable element in the diet.
This may be a significant factor in selecting data values, but should not affect the selection of
analogues.
For radioisotopes that have no stable isotopes, it might be possible to use other elements with
similar biogeochemical characteristics as a way to add information. For instance, Ba is
considered a good analogue for Ra [7, 26] and Re for Tc [8].
In general, the behaviour of isotopes of the same element is identical, except for light
elements especially in case of hydrogen. An important limitation and consideration is whether
the timescale over which behaviour of a short-lived radionuclide can be studied is sufficient to
reveal the significance of long-term processes that may influence the behaviour of a long-
lived radioisotope of the same element. In particular, equilibration of a short-lived isotope in
environmental media may be strongly influenced by its physical decay, whereas equilibration
of a long-lived isotope may be almost entirely determined by biogeochemical transfer
processes.
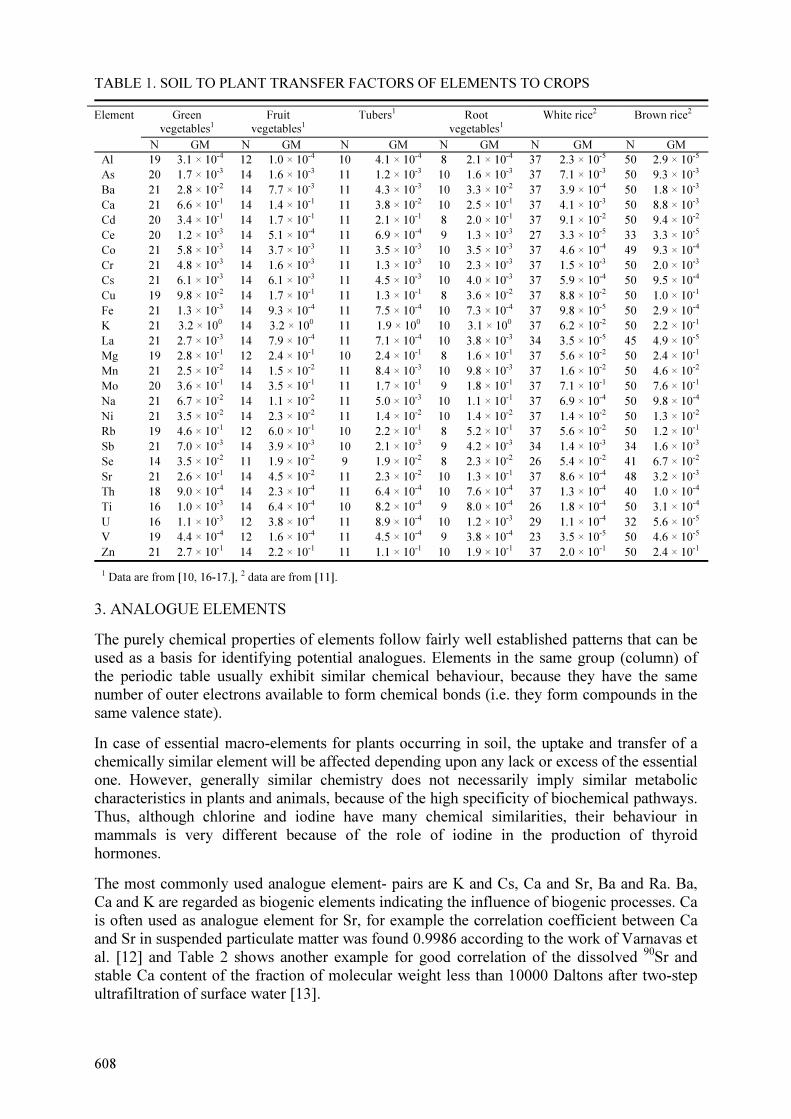
608
TABLE 1. SOIL TO PLANT TRANSFER FACTORS OF ELEMENTS TO CROPS
Element Green
vegetables1
Fruit
vegetables1
Tubers1 Root
vegetables1
White rice2 Brown rice2
N GM N GM N GM N GM N GM N GM
Al 19 3.1 × 10⁻⁴ 12 1.0 × 10⁻⁴ 10 4.1 × 10⁻⁴ 8 2.1 × 10⁻⁴ 37 2.3 × 10⁻⁵ 50 2.9 × 10⁻⁵
As 20 1.7 × 10⁻³ 14 1.6 × 10⁻³ 11 1.2 × 10⁻³ 10 1.6 × 10⁻³ 37 7.1 × 10⁻³ 50 9.3 × 10⁻³
Ba 21 2.8 × 10⁻² 14 7.7 × 10⁻³ 11 4.3 × 10⁻³ 10 3.3 × 10⁻² 37 3.9 × 10⁻⁴ 50 1.8 × 10⁻³
Ca 21 6.6 × 10⁻¹ 14 1.4 × 10⁻¹ 11 3.8 × 10⁻² 10 2.5 × 10⁻¹ 37 4.1 × 10⁻³ 50 8.8 × 10⁻³
Cd 20 3.4 × 10⁻¹ 14 1.7 × 10⁻¹ 11 2.1 × 10⁻¹ 8 2.0 × 10⁻¹ 37 9.1 × 10⁻² 50 9.4 × 10⁻²
Ce 20 1.2 × 10⁻³ 14 5.1 × 10⁻⁴ 11 6.9 × 10⁻⁴ 9 1.3 × 10⁻³ 27 3.3 × 10⁻⁵ 33 3.3 × 10⁻⁵
Co 21 5.8 × 10⁻³ 14 3.7 × 10⁻³ 11 3.5 × 10⁻³ 10 3.5 × 10⁻³ 37 4.6 × 10⁻⁴ 49 9.3 × 10⁻⁴
Cr 21 4.8 × 10⁻³ 14 1.6 × 10⁻³ 11 1.3 × 10⁻³ 10 2.3 × 10⁻³ 37 1.5 × 10⁻³ 50 2.0 × 10⁻³
Cs 21 6.1 × 10⁻³ 14 6.1 × 10⁻³ 11 4.5 × 10⁻³ 10 4.0 × 10⁻³ 37 5.9 × 10⁻⁴ 50 9.5 × 10⁻⁴
Cu 19 9.8 × 10⁻² 14 1.7 × 10⁻¹ 11 1.3 × 10⁻¹ 8 3.6 × 10⁻² 37 8.8 × 10⁻² 50 1.0 × 10⁻¹
Fe 21 1.3 × 10⁻³ 14 9.3 × 10⁻⁴ 11 7.5 × 10⁻⁴ 10 7.3 × 10⁻⁴ 37 9.8 × 10⁻⁵ 50 2.9 × 10⁻⁴
K 21 3.2 × 100 14 3.2 × 100 11 1.9 × 100 10 3.1 × 100 37 6.2 × 10⁻² 50 2.2 × 10⁻¹
La 21 2.7 × 10⁻³ 14 7.9 × 10⁻⁴ 11 7.1 × 10⁻⁴ 10 3.8 × 10⁻³ 34 3.5 × 10⁻⁵ 45 4.9 × 10⁻⁵
Mg 19 2.8 × 10⁻¹ 12 2.4 × 10⁻¹ 10 2.4 × 10⁻¹ 8 1.6 × 10⁻¹ 37 5.6 × 10⁻² 50 2.4 × 10⁻¹
Mn 21 2.5 × 10⁻² 14 1.5 × 10⁻² 11 8.4 × 10⁻³ 10 9.8 × 10⁻³ 37 1.6 × 10⁻² 50 4.6 × 10⁻²
Mo 20 3.6 × 10⁻¹ 14 3.5 × 10⁻¹ 11 1.7 × 10⁻¹ 9 1.8 × 10⁻¹ 37 7.1 × 10⁻¹ 50 7.6 × 10⁻¹
Na 21 6.7 × 10⁻² 14 1.1 × 10⁻² 11 5.0 × 10⁻³ 10 1.1 × 10⁻¹ 37 6.9 × 10⁻⁴ 50 9.8 × 10⁻⁴
Ni 21 3.5 × 10⁻² 14 2.3 × 10⁻² 11 1.4 × 10⁻² 10 1.4 × 10⁻² 37 1.4 × 10⁻² 50 1.3 × 10⁻²
Rb 19 4.6 × 10⁻¹ 12 6.0 × 10⁻¹ 10 2.2 × 10⁻¹ 8 5.2 × 10⁻¹ 37 5.6 × 10⁻² 50 1.2 × 10⁻¹
Sb 21 7.0 × 10⁻³ 14 3.9 × 10⁻³ 10 2.1 × 10⁻³ 9 4.2 × 10⁻³ 34 1.4 × 10⁻³ 34 1.6 × 10⁻³
Se 14 3.5 × 10⁻² 11 1.9 × 10⁻² 9 1.9 × 10⁻² 8 2.3 × 10⁻² 26 5.4 × 10⁻² 41 6.7 × 10⁻²
Sr 21 2.6 × 10⁻¹ 14 4.5 × 10⁻² 11 2.3 × 10⁻² 10 1.3 × 10⁻¹ 37 8.6 × 10⁻⁴ 48 3.2 × 10⁻³
Th 18 9.0 × 10⁻⁴ 14 2.3 × 10⁻⁴ 11 6.4 × 10⁻⁴ 10 7.6 × 10⁻⁴ 37 1.3 × 10⁻⁴ 40 1.0 × 10⁻⁴
Ti 16 1.0 × 10⁻³ 14 6.4 × 10⁻⁴ 10 8.2 × 10⁻⁴ 9 8.0 × 10⁻⁴ 26 1.8 × 10⁻⁴ 50 3.1 × 10⁻⁴
U 16 1.1 × 10⁻³ 12 3.8 × 10⁻⁴ 11 8.9 × 10⁻⁴ 10 1.2 × 10⁻³ 29 1.1 × 10⁻⁴ 32 5.6 × 10⁻⁵
V 19 4.4 × 10⁻⁴ 12 1.6 × 10⁻⁴ 11 4.5 × 10⁻⁴ 9 3.8 × 10⁻⁴ 23 3.5 × 10⁻⁵ 50 4.6 × 10⁻⁵
Zn 21 2.7 × 10⁻¹ 14 2.2 × 10⁻¹ 11 1.1 × 10⁻¹ 10 1.9 × 10⁻¹ 37 2.0 × 10⁻¹ 50 2.4 × 10⁻¹
1 Data are from [10, 16-17.], 2 data are from [11].
3. ANALOGUE ELEMENTS
The purely chemical properties of elements follow fairly well established patterns that can be
used as a basis for identifying potential analogues. Elements in the same group (column) of
the periodic table usually exhibit similar chemical behaviour, because they have the same
number of outer electrons available to form chemical bonds (i.e. they form compounds in the
same valence state).
In case of essential macro-elements for plants occurring in soil, the uptake and transfer of a
chemically similar element will be affected depending upon any lack or excess of the essential
one. However, generally similar chemistry does not necessarily imply similar metabolic
characteristics in plants and animals, because of the high specificity of biochemical pathways.
Thus, although chlorine and iodine have many chemical similarities, their behaviour in
mammals is very different because of the role of iodine in the production of thyroid
hormones.
The most commonly used analogue element- pairs are K and Cs, Ca and Sr, Ba and Ra. Ba,
Ca and K are regarded as biogenic elements indicating the influence of biogenic processes. Ca
is often used as analogue element for Sr, for example the correlation coefficient between Ca
and Sr in suspended particulate matter was found 0.9986 according to the work of Varnavas et
al. [12] and Table 2 shows another example for good correlation of the dissolved 90
Sr and
stable Ca content of the fraction of molecular weight less than 10000 Daltons after two-step
ultrafiltration of surface water [13].

609
TABLE 2. FRACTIONAL DISTRIBUTION OF DISSOLVED 90Sr AND STABLE Ca IN THE
FRACTION LESS THAN 10000 Daltons AFTER TWO-STEP ULTRAFILTRATION OF THE SURFACE WATER [13]
Sampling place 90Sr, % Ca, %
Sahan River, March 1996 80 97
Sahan River, August 1996 98 97
Glubokoye Lake, August 1996 97 98
Kiev Reservoir, April 1998 97 99
The counter-example is that an increase in soil strontium concentration of over 4 orders of
magnitude range was accompanied by increase in tissue strontium burdens of earthworms
according to the work of Morgan et al. [14], whereas tissue calcium burdens appeared to be
maintained at fairly uniform levels, irrespective of soil calcium concentrations. The
contrasting behaviour suggest that differences exist in the ability of earthworms to
physiologically control tissue burdens of these two analogue elements and this may relate to
differences in the solubility of sequestration products of strontium and calcium.
The availability and distribution of radiocaesium in soil-plant systems is affected by the soil
exchangeable K status, clay content and time. Cs is a chemical analogue of K, therefore, they
behave as competitors for plant and soil sorption sites [15]. Transfer factors can be reduced by
increasing K supply at low K status of a soil, whereas the transfer factor will be increased by
increasing K supply at high K status of the soil. At K concentrations up to 1mM, the plant and
soil solution concentration ratio can be decreased by more than 2 orders of magnitude with
increasing K concentrations. However, this dependence is not linear and above 1mM K, the
concentration ratio is almost unaffected by K supply.
These results show that K fertilisation can be a successful countermeasure for reduction of 137
Cs transfer, as has been demonstrated for cereals [16]. Transport patterns in bean plants
following the foliar uptake for periods longer than 1 day are similar for K and Cs [17]. It is
likely Cs is taken up by the K transport systems of the plasma membranes of root cells.
Uptake of K (and therefore also probably of Cs) at low external K+ concentrations (<10-
12 mg/l) is dominated by a carrier-mediated high-affinity transport system, which can operate
against an electrochemical gradient requiring energy. Conversely, at higher external
concentrations of K+ (>12-40 mg/l) the electrochemical gradient is diminished or reversed,
and uptake has dominantly channel-like properties [18].
Unfortunately, no stable Ra isotope exists, but several studies have demonstrated that Ba
behaves in the environment similarly to 226
Ra. For example, the oceanic 226
Ra/Ba ratio is
constant nearly everywhere [19]. This similarity of the two elements means that 133
Ba can be
used as a tracer in laboratory experiments instead of 226
Ra having high radiotoxicity for
example to quantify the uptake kinetics by sediments in aqueous suspensions [20].
Transition elements in the same period (row) of the periodic table also tend to be chemically
similar to each another.
There are strong similarities among all the lanthanides, though there are some subtle
differences due to variations in the dominant and subsiduary oxidation states along the series.
Also, there are analogies between the lanthanides and higher actinides. Lanthanides are

610
oxidation state analogues for actinides, so their distribution can give an indication of the long-
term behaviour of the radioactive transuranic elements. Exceptions to the typical lanthanide
pattern are cerium and europium with their 4+ and 2+ oxidation states, contrasting with the 3+
oxidation state common to all lanthanides. This property gives the possibility of using cerium
as an analogue of isotopes of various higher actinides. Their ionic radii are close enough to
justify this analogy, for example 0.114 nm – Ce3+
, 0.111 nm – Ce4+
, 0.105 nm – Th4+
,
0.096 nm – Pu4+
, 0.106 nm – Am3+
. There are several geological studies where thorium serves
as an analogue for Pu4+
which is a most common oxidation state of plutonium in the
environment, and La3+
as an analogue for Cm3+
and Am3+
. In the migration studies Th serves
as usually as an analogue for Pu4+
, and La3+
as an analogue for Cm3+
and Am3+
. Moreover the
precipitation of lanthanides is closely linked to the behaviour of the transition metals iron and
manganese. Nd3+
, which occurs only in this chemical form, gives more adequate analogy for
Pu3+
and Am3+
, which have solubilities at least one order higher than that of Pu4+
in the
environmental conditions, in different kind of natural water. Regarding the bioconcentration
factors for lanthanides in river biota are in a narrow range [21].
Chemical similarity does not necessarily translate into similar behaviour in the environment;
sometimes the size of the ionic form of a radionuclide can cause differences particularly in the
chemical association processes in environmental conditions. Subtle differences in chemistry
can result major distinctions in biochemical processes.
4. ANALOGUE PARAMETER
Soil Kd values can vary significantly with the soil type19
. Where knowledge of soil
characteristics is not available, a generic soil Kd value can be adopted. This may be an average
over soil types, a value for the soil type expected to maximise doses, or simply a value for the
soil type for which data are most extensive. If data are limited, the Kd for a soil can be used
for a sediment with similar characteristics (pH, Eh etc.).
In case of plants, some analogues may seem relatively obvious, e.g. between pasture grass and
forage. However, closer inspection may show that the analogy is not close and may be
misleading, e.g. if information is required for 60
Co in a non-leguminous pasture and the
available data are for 60
Co in clover. Similarly, generic data for ‘grain’ might be expected to
provide a good analogue for rice, but the growing conditions for rice are so different from
those for cereals that the analogue is not, in general, a good one20
. For example the
PATHWAY [22] model uses a single transfer factor value for all crops and soil types,
whereas ECOSYS has crop-specific transfer factor values that are independent of soil type
[23]. In the case of PATHWAY the higher uncertainty of the predicted values should be taken
into account. During the parameterisation of the model of ECOSYS, to the results observed
for ryegrass appeared satisfactory for a variety of crops for example for grass and cereals [15],
applying experimental values of ryegrass as an analogue plant to cereals. If plant analogues
are used, it is normally assumed that the soil–plant transfer factor is the same for different
plant types on a dry weight (of plant) basis, allowing for the consideration that the fresh
weight values differ according to the water content of the different plant types.
Phylogenetic effects at the level of plant family and order have been observed for C, Ca, Cs,
Cu, K, Mg, Ni and Zn, from this comes a hypothesis, by analogy with the behaviour of Ca
and other minerals, that phylogenetic attributes of a species can be used to estimate the soil to
19 See paper by Vidal et al ‘Soil-Radionuclide Interactions‘ in this publication. 20 See paper by Uchida et al ‘Transfer to rice’ in this publication.