Embed Size (px)
Citation preview

Quantification of processing artifacts in textile composites Christopher M. Pastore
One of the greatest difficulties in developing detailed models of the mechanical response of textile-reinforced composites is an accurate model of the reinforcing elements. In the case of elastic property prediction, the variation of fibre position may not have a critical role in performance. However when considering highly localized stress events, such as those associated with cracks and holes, the exact position of the reinforcement probably dominates the failure mode. Models have been developed for idealized reinforcements which provide an insight into the local behaviour. However, even casual observation of micrographical images reveals that the actual material deviates strongly from the idealized models. In this paper, some of the deviations and causes are presented for triaxially braided and three-dimensionally woven textile composites. The necessary modelling steps to accommodate these variations are presented with some examples. Some of the ramifications of not accounting for these discrepancies are also addressed.
Keywords: neutron tomography; material inhomogeneities
INTRODUCTION
One of the principal objectives of composite materials is to replace catastrophic failure, typical of metal structures, with dispersive failure. This is accomplished by physically separating the brittle and ductile phases (fibre and matrix) within the composite.
The goal is realized to the greater part in the case of laminated composite materials. It has been demonstrated that dispersive failure occurs. However, a new problem arises with the introduction of these laminated materials: damage tolerance. When subject to impact, some local delamination of the composite is likely to occur, and when subsequently put in compression, the composite suffers a premature failure associated with this delamination zone. This low compression-after-impact (CAI) strength becomes the design allowable for this material, and greatly reduces the benefits associated with the material.
Improved CA1 strength is one of the driving forces for textile-reinforced composites. In addition to the labour reduction and shape formation ability of these materials, the intertwined nature of the reinforcing elements (fibres and yarns) hinders delamination. In fact, in the case of three-dimensional (3-D) fabrics, delamination cannot occur due to the lack of laminae. Clearly the entanglement of yarns within the fabric structure reduces in-plane properties, but if the CA1 strength is superior to the equivalent laminate, the design allowable has increased, making the textile composite the more attractive candidate.
However, if some particular architectural phenomena within the composite material detract from this dispersive failure, then one might conclude that the main goal has been defeated. Thus it is necessary when modelling textile- reinforced composites to guarantee that failure modes are not catastrophic. It is conceivable that particular
architectures combined with some local deformation events will combine to create an unfavourable failure mode.
It is the intent of this paper to consider process variations (intentional and accidental) which may have an impact on the local performance of the textile composite. Performance may be characterized by stiffness, variation in properties, or mode of failure. In any of these cases, it is necessary to have some handle on the performance of the textile composites. This performance is dictated by the reinforcing material, and consequently deviations from the ‘expected’material must be examined. The types of deviations typically associated with different fabric structures are presented and discussed. Localized deformation events which correlate to particular architec- tural variations are introduced. In most of these cases, the actual impact of architecture on performance is not known. Thus, some analytical tools are proposed to examine these phenomena in more detail.
PROCESS DEVIATIONS
Process deviations can be the result of an error in processing, the natural random events associated with fabrication, or the consequences of particular manufacturing schemes. In any of these events, it is useful to have some model of the corresponding material response. There are many types of process deviations, and each fabric system has distinct particulars of deviation types and effects.
In this section, both types of deviations (random and fixed) are discussed with some examples. As is frequently the case when studying textile-reinforced structures, the author is left with more questions than answers when investigating these issues.
0956-7143/93/040217-10 @ 1993 Butterworth-Heinemann Ltd
Composites Manufacturing Vol 4 No 4 1993 217

Yarn misorientation One typical process deviation is the misorientation of the yarns within the fabric specimen. This can occur from the natural deviation of the fabrication equipment or as a result of post-fabrication handling. To get some understanding of how this impacts the composite performance, an idealized model was run. The intention is to determine the distribution of yarn orientations within the specimen and then calculate the effects of these orientation distributions on the elastic properties of the unit cell.
In this case, a plain weave fabric was considered. The fabric is a standard 12 K carbon fabric with 12 epi and 12 ppi. Composites were made with one, two, and four layers of fabric. The composite structures were subject to neutron tomography to create a rendering of the internal structure of the actual composite. It is worth pointing out that the application of neutron tomography to textile composites is not a traditional method of inspection. Composites are usually examined with ultrasonics (C-scan), or with X-radiography to determine damage. C-scan is based upon the consideration that the material under inspection is a layered system, and reflections are caused by delaminations. Since the general textile is not a layered construction, these assumptions are invalid, and it is not clear exactly what the ultrasonic responses reveal. X-radiography is not sufficient for composite materials since epoxies and carbon fibres have similar diffraction patterns when subject to X-rays. X-radiography is most commonly used by applying some radio-opaque liquid to the cracks and delaminations on the surface and then taking an image of the opaque liquid. Since we are interested in determining the reinforcing architecture in a complex structure, it is not useful to look only for cracks. Neutron tomography is intriguing in that the epoxies and the carbon fibres may have sufficiently distinct diffraction patterns at work.
Using this philosophy, some woven composite specimens were exposed to a collimated neutron beam and a photographic plate was held on the other side. (True tomography will involve rotating the target specimen and creating a series of images for 3-D reconstruction.) Figure I shows the unprocessed neutron radiogram for a single layer woven composite. This is not the complete
Figure 1 Neutron radiogram of plain weave fabric showing in-plane projection of fabric structure
Figure 2 Image analysis rendering of in-plane warp and fill yarn paths for a plain weave composite
o.35 I 0.30 I- I
Yam Orientation (deg)
Figure 3 Distribution of in-plane angles, QWuarP (---) and Ori,, (---), for a plain weave fabric
tomographical image, but rather a simple planar projection of neutron penetration of the specimen.
From this picture, it is possible to determine more information about the reinforcing structure. Since the issue of importance at this moment is simply the yarn orientation, image analysis techniques were used to highlight the yarn structure (difference of Gaussians), distinguish between warp and fill yarns (derivative operators and Laplacian transforms), and finally reduce the grey scale images to line structures (skeletonization). Figure 2 shows the yarn structure after image analysis techniques have reduced the farbic to line elements. As can be seen in these figures, there is a fair amount of random orientation of the yarns within the fabric.
From -these images, it is possible to determine the orientation parameters associated with the fabric structure. Figure 3 shows the distribution of in-plane warp yarn orientation (&,arp), and in-p1 ane fill yarn orientation (8,,,,). It can be seen in these figures that the filling yarns
218 Composites Manufacturing No. 4 1993

generally had a tighter dispersion of orientation than the warp yarns. This may be due to handling of the fabric, wherein a shear displacement was applied to the fabric. These distributions are not intended to be typical of plain weave composites, but rather indicate a specific material under investigation for this study.
Additionally, from photomicrographs of the composite specimens, the out-of-plane orientations (4warp and &r) were measured. When measuring 4, the measurements can take on the total average of the’out-of-plane, or distinguish between the relatively flat portions which correspond to the floating region of the interlacing yarn. If the entire yarn path is measured, the mean of $J is around 0. However, if the flat component of the yarns is taken as a separate element, the means are non-zero. In this research, the total arc length of the yarns was used for determining the distribution of angles. The distribution of properties is accounted for in the Monte-Carlo simulation (described below). Figure 4 shows the distri- bution of the out-of-phase components for the warp and filling yarns. Numerically, the means and standard deviations of these orientation parameters are given in Table 1. An illustration of the angles measured is shown in Figure 5.
For example, if we consider a plain weave fabric allowing random variations in architectural parameters, we can calculate the expected distribution of elastic properties. This was accomplished through a Monte-Carlo simulation using a geometry based stiffness averaging
0.3
0.2
: 3
k
0.1
0.0 .^ -1” 0
Out-of-Plane Orientation (deg)
10
Figure 4 Distribution of out-of-plane angles, &varp (p) and &,, (---), for a plain weave fabric
Table 1 Geometric parameters of plain weave fabric
System Mean Standard deviation (deg) (deg)
0.4399 6.3451 0.2495 1.0121
90.1724 4.9632 0.2195 0.1225
Figure 5 Schematic diagram of plain weave fabric showing orientations measured
calculation of elastic properties’. For the purposes of this discussion, the probability distribution functions of the in-plane and out-of-plane orientations described above were used. The material was modelled with carbon yarns and epoxy resin as the matrix. A fibre volume fraction of 55% was assumed for calculation purposes.
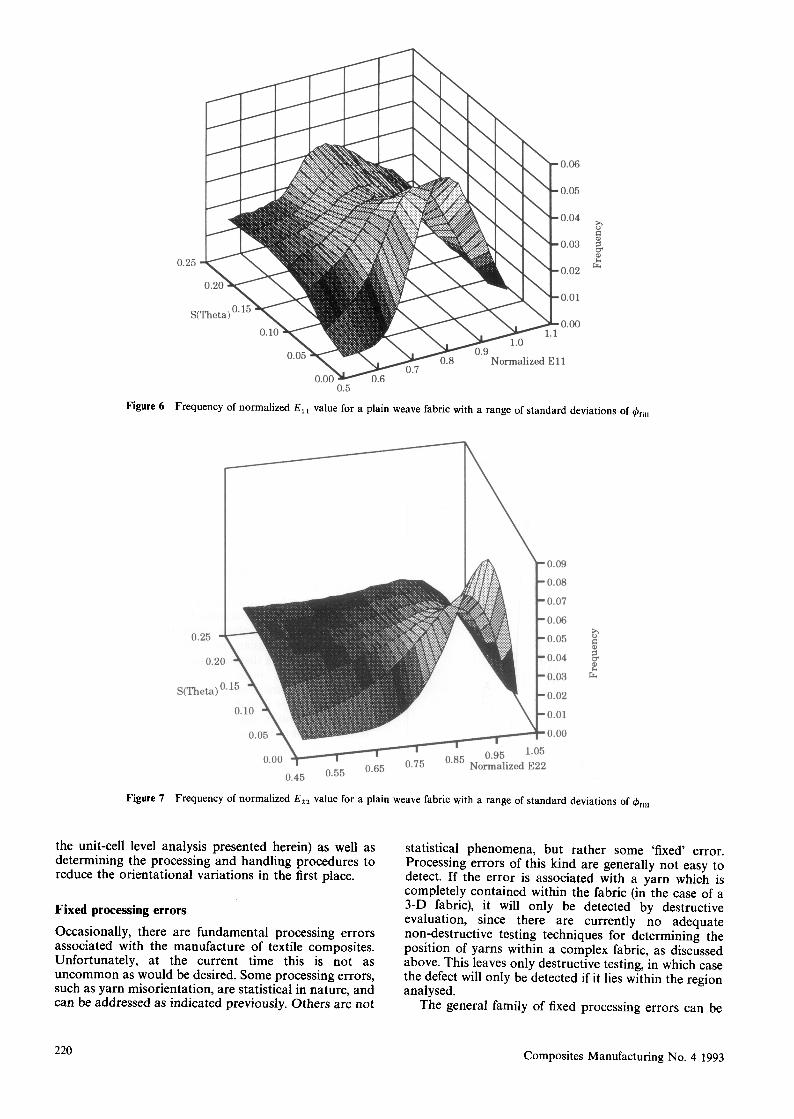
In addition to modelling the particular probability distribution functions generated, the modelling was extended to include the effects of increasing the freedom of out-of-plane orientation. For these cases, the out-of- plane distribution was assumed to be Gaussian, and the standard deviation of this distribution was the variable parameter for the modelling. A total of 100000 trials were carried out for each particular distribution. Figure 6 shows the frequency distribution of E,, for this plain weave fabric. It can be seen here that the distribution of properties is fairly Gaussian. As the freedom of the out-of-plane angle, 4, increases (i.e., the standard deviation of 4 increases), the distribution becomes less Gaussian, tending more towards a uniform distribution, as might be expected.
However, when considering the distribution of E,, (which has a smaller standard deviation of both the in-plane and out-of-plane angles) the distribution is distinctly non-Gaussian, as illustrated in Figure 7. The behaviour shows a distinctly non-symmetric peak when the out-of-plane angle is restricted, as in the data generated from image analysis. This looks something like a X-squared type distribution, and is directly related to the restricted out-of-plane orientation for the filling yarns. When the out-of-plane distribution is increased, the distribution becomes more Gaussian.
When considering the shear modulus distribution, G,,, in Figure 8, the distribution is Gaussian until the standard deviation of the out-of-plane angle reaches high values. When the out-of-plane angle has substantial freedom of movement, the shear modulus takes on a relatively uniform distribution of properties.
Clearly these distributions of elastic properties will influence the performance of a structural part formed from these materials. The important factor is to account for these distributions as actual material deviations and develop stochastic models of reliability when the deviations are significant.
It must also be determined if it is possible to reduce the variations in these materials. Clearly, if the distributions are significant, the design criteria for these materials will make them unacceptable for application in structural components. Thus it is necessary to examine both the influence of these variations on a component (rather than
Composites Manufacturing No. 4 1993 219
0.25
Figure 6 Frequency of normalized E, 1 value for a plain weave fabric with a range of standard deviations of &,,
Figure 7 Frequency of normalized E,, value for a plain weave fabric with a range of standard deviations of +,,,
the unit-cell level analysis presented herein) as well as determining the processing and handling procedures to reduce the orientational variations in the first place.
Fixed processing errors
Occasionally, there are fundamental processing errors associated with the manufacture of textile composites. Unfortunately, at the current time this is not as uncommon as would be desired. Some processing errors, such as yarn misorientation, are statistical in nature, and can be addressed as indicated previously. Others are not
statistical phenomena, but rather some ‘fixed’ error. Processing errors of this kind are generally not easy to detect. If the error is associated with a yarn which is completely contained within the fabric (in the case of a 3-D fabric), it will only be detected by destructive evaluation, since there are currently no adequate non-destructive testing techniques for determining the position of yarns within a complex fabric, as discussed above. This leaves only destructive testing, in which case the defect will only be detected if it lies within the region analysed.
The general family of fixed processing errors can be
220 Composites Manufacturing No. 4 1993
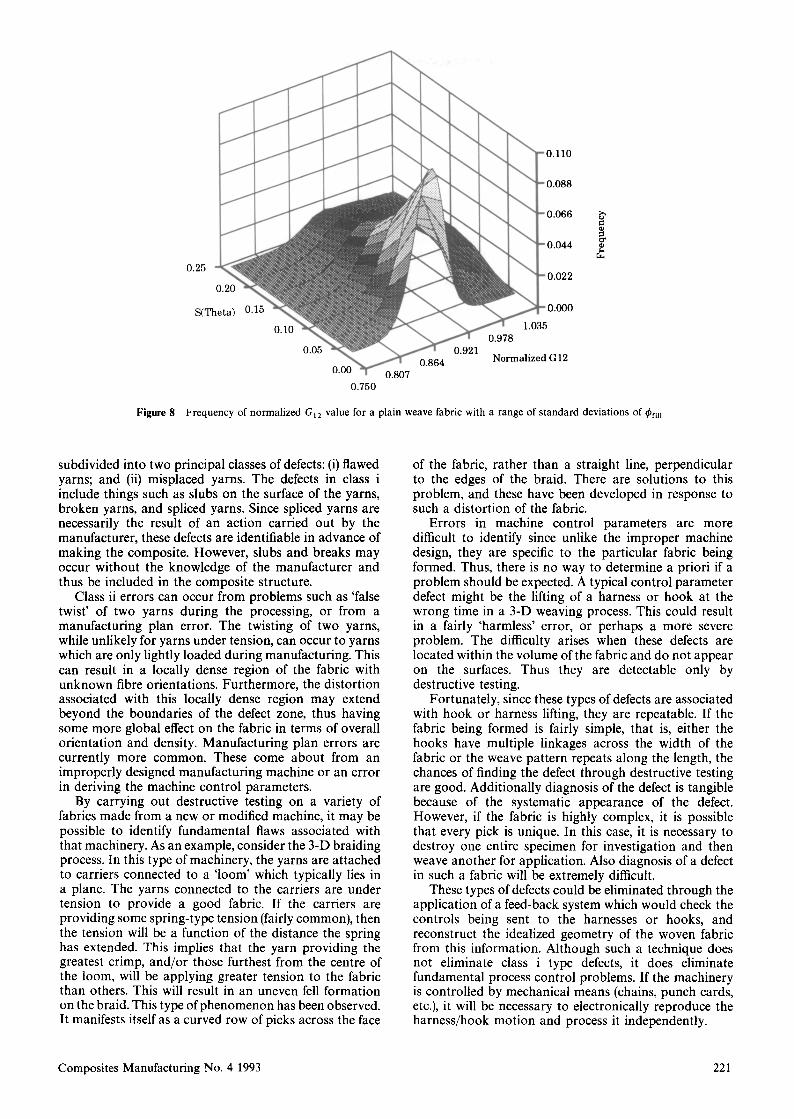
Figure 8 Frequency of normalized G 1 z value for a plain weave fabric with a range of standard deviations of &,,
subdivided into two principal classes of defects: (i) flawed yarns; and (ii) misplaced yarns. The defects in class i include things such as slubs on the surface of the yarns, broken yarns, and spliced yarns. Since spliced yarns are necessarily the result of an action carried out by the manufacturer, these defects are identifiable in advance of making the composite. However, slubs and breaks may occur without the knowledge of the manufacturer and thus be included in the composite structure.
Class ii errors can occur from problems such as ‘false twist’ of two yarns during the processing, or from a manufacturing plan error. The twisting of two yarns, while unlikely for yarns under tension, can occur to yarns which are only lightly loaded during manufacturing. This can result in a locally dense region of the fabric with unknown fibre orientations. Furthermore, the distortion associated with this locally dense region may extend beyond the boundaries of the defect zone, thus having some more global effect on the fabric in terms of overall orientation and density. Manufacturing plan errors are currently more common. These come about from an improperly designed manufacturing machine or an error in deriving the machine control parameters.
By carrying out destructive testing on a variety of fabrics made from a new or modified machine, it may be possible to identify fundamental flaws associated with that machinery. As an example, consider the 3-D braiding process. In this type of machinery, the yarns are attached to carriers connected to a ‘loom’ which typically lies in a plane. The yarns connected to the carriers are under tension to provide a good fabric. If the carriers are providing some spring-type tension (fairly common), then the tension will be a function of the distance the spring has extended. This implies that the yarn providing the greatest crimp, and/or those furthest from the centre of the loom, will be applying greater tension to the fabric than others. This will result in an uneven fell formation on the braid. This type of phenomenon has been observed. It manifests itself as a curved row of picks across the face
Composites Manufacturing No. 4 1993
of the fabric, rather than a straight line, perpendicular to the edges of the braid. There are solutions to this problem, and these have been developed in response to such a distortion of the fabric.
Errors in machine control parameters are more difficult to identify since unlike the improper machine design, they are specific to the particular fabric being formed. Thus, there is no way to determine a priori if a problem should be expected. A typical control parameter defect might be the lifting of a harness or hook at the wrong time in a 3-D weaving process. This could result in a fairly ‘harmless’ error, or perhaps a more severe problem. The difficulty arises when these defects are located within the volume of the fabric and do not appear on the surfaces. Thus they are detectable only by destructive testing.
Fortunately, since these types of defects are associated with hook or harness lifting, they are repeatable. If the fabric being formed is fairly simple, that is, either the hooks have multiple linkages across the width of the fabric or the weave pattern repeats along the length, the chances of finding the defect through destructive testing are good. Additionally diagnosis of the defect is tangible because of the systematic appearance of the defect. However, if the fabric is highly complex, it is possible that every pick is unique. In this case, it is necessary to destroy one entire specimen for investigation and then weave another for application. Also diagnosis of a defect in such a fabric will be extremely difficult.
These types of defects could be eliminated through the application of a feed-back system which would check the controls being sent to the harnesses or hooks, and reconstruct the idealized geometry of the woven fabric from this information. Although such a technique does not eliminate class i type defects, it does eliminate fundamental process control problems. If the machinery is controlled by mechanical means (chains, punch cards, etc.), it will be necessary to electronically reproduce the harness/hook motion and process it independently.
221

STRUCTURAL INHOMOGENEITIES
In addition to the process deviations discussed above, it is also necessary to consider the variations of fibre architecture that are fundamental to the fabrication of the structure under consideration. These variations may be on a fairly large scale, or within the unit cell of the structure. These structural inhomogeneities are assumed to be associated with idealized textile structures, and as such can be considered part and parcel of the general problem of analysis of textile-reinforced composites.
Textile composites have strong advantages over laminates by their ability to be formed in near-net-shape structures. Furthermore, 3-D reinforcement available with textiles provides the damage tolerance mechanisms. Both of these advantages create difficulties when trying to analyse the behaviour of the material.
In this paper, we will consider three types of structural inhomogeneities: architectural variations (change in fabric structure throughout a component), sub-unit-cell characteristics (events associated with behaviour smaller than a unit cell), and the formation of holes (an unanswered debate about the merits of cutting versus forming).
Architecture variation
In the case of a complex shaped textile-reinforced composite, it is necessary to consider the distribution of fibre architecture throughout the structural component. The need for such a subdivision of the structure into distinct zones of mechanical properties has been investigated previously 2S3 What is needed is a method . for combining these properties in a material-smart fashion in order to achieve correct solutions to the analytical problem.
The correct solution of the problem begins with the correct discretization of the component into mesovolumes4. This must be carried out with attention paid to both the material being examined and the structural analysis code. If we consider a braided stiffened panel
Figure 9 Schematic representation of braided stiffened panel and possible analytical mesh for analysing this structure
transitional zones between them. The mesh shown in this figure corresponds to a potential analytical description of the material. The grey levels are intended to indicate differing stiffness (and strength) characteristics of the structure. This description is based on treating the braided structure as a three-layer system.
It should be pointed out that this variation in properties is probably beneficial to the response of the structure. As is well known, the interface of distinct materials, particularly at a sharp corner, is a stress raiser. Having an architecture which effectively blends the materials between panel and stiffener is likely to somewhat reduce the stress concentration. In order to identify if there is a beneficial effect from this type of construction, it is necessary to use a detailed material model along with an appropriate structural analysis code which takes into consideration the material properties and distributions thereof.
Sub-unit-cell inhomogeneities
Traditional analysis of textile-reinforced composites, and composites in general, assumes that there is a unit cell associated with the material under investigation. However, if the event under consideration has some highly localized effects, the response of the composite may be dictated by sub-unit-cell architectures. Also, the integrated 3-D nature of many textile reinforcements requires the analyst to either accept the composite as having no property variation through the entire thickness of the part, or to subdivide the material in the thickness direction and then model the material as some layered structure which does not have physical discontinuities between the layers.
Even in the condition of simple tension, the inhomo- geneities associated with the unit cell may play an important role. As an example, consider a triaxially braided composite. When a braided composite is loaded under simple tension, there exists distinct stripes of opposing shear (y,,) across the width of the specimen.
Tests carried out by Dr Peter Ilju using Moire interferometry5 have identified these phenomena. The cause of these bands of shear is the sub-unit-cell architecture of the braided material at the free surface (z = 0, z = h). In order to model this behaviour, it is useful to treat the braid as stripes of a three-layer material, each stripe having the inverse stacking sequence of its neighbours. A schematic representation of this type of model is presented in Figure 10. In this case, the outer layer of the braid appears as bands of + 8, -8 across the width. For some increased level of modelling, it is possible to include the out-of-plane orientation associated with the crimp of the yarns in each layer. In either case, each of these stripes is clearly anisotropic, with C,, terms and others non-zero. It is necessary to treat this as a general in-plane anisotropic material (13 constants).
To model the surface shear striping effects, the braid was treated as a three-layer composite material. The first and last layers consist of bands of anisotropic material, while the middle layer is a homogeneous braid. The detailed material model is shown in Figure 11. To simulate tension testing, the braid was sandwiched between clamps at the ends, and a soft material was applied to the surface to provide rectangular continuity. The clamping and location of unit displacements are shown in Figure 12. The structural analysis was carried out using a ‘material-smart’ structural analysis code
222 Composites Manufacturing No. 4 1993

Figu re 10 Schematic diagram of braided fabric showing cut sections used for analysis
Material Model “A [e/o/al
0.012” 0.96’
0.012”
Figure 11 Schematic diagram of material model used for braided composite subject to simple tension
unit displacement
Figure 12 Schematic diagram of structural analysis configuration used for braided composite subject to simple tension
Figure 13 Numerical predictions of shear band formation in biaxi braided composite specimen subject to simple axial tension: dark ba indicate negative shear; light bands show positive shear
ally nds
Figure 14 Possible locations and types of holes in a plain weave fabric
developed by the author and his colleagues4. Carrying out the analysis, the shear stress distribution on the surfaces becomes apparent. Figure 13 shows the distribution of rXY on the upper surface of the braid. This corresponds very well to the experimental data achieved by Ifju.
Hole formation
The ability to form near-net-shape structures greatly reduces the labour intensity in many applications. However, in certain instances, it is not clear if near-net- shape provides a better solution than machining. A case in point is the formation of holes in textile composite materials. With most textile composites, it is quite possible to form the hole directly in the structure.
Determining the benefits of manufacturing holes in this manner is not simple. Figure 14 shows a schematic rendering of holes in a plain weave fabric. The left diagram shows machined holes, while the right shows a formed hole.
The considerations of benefits/risks associated with both are not finalized. The issues range from actual manufacturing costs to performance characteristics.
In terms of manufacturing, it can be argued that the formed hole reduces labour in that the hole can be formed in the composite during densification (by inclusion of a pin in the tool). Conversely, if there is some small tolerance error in the consolidation, it cannot be
Composites Manufacturing No. 4 1993 223

corrected easily. Forming the hole through machining operations allows the assembly engineer to guarantee that the part fits correctly each time it is assembled. If there is some small fluctuation in part dimensions, it can be accounted for in machining.
The machined hole has problems in terms of hole location with respect to the unit cell. Clearly the deformation processes associated with an open hole are highly localized. Thus the problem becomes one of sub-unit-cell analysis. Holes ‘A’ and 3 in Figure 14 show the problem of machining. The holes can be located in an arbitrary position with respect to the unit cell. From the analysis and testing point of view, this means that every possible position must be considered, and the worst case must be used for design. When the hole is formed, it will be located in the same place every time.
However, the formation of a hole in the structure causes disruption to the surrounding architecture. Hole ‘c’ indicates an extreme example of this kind of disruption. Clearly the fibre volume fraction changes with position around the hole, as does the fibre orientation. This means that the elastic properties vary around the hole. From the testing point of view, this problem is relatively straightforward, but for the analyst, this is a difficult task indeed.
Considering failure, having cut yarns (free fibre ends) at the points of stress concentration seems to be a likely place for crack initiation and subsequent failure. This indicates that the cut hole is probably not good for strength. On the other hand, the locally high fibre volume fractions associated with the formed holes provide an ideal place for failure initiation, as it is well known that fracture typically occurs at the points of highest fibre volume fraction.
This leads to a request for the experimentalist to make the determinations. Several studies have been carried out in laboratories to determine the advantages/disadvantages of formed holes versus machined holes. In several studies brought to the attention of the author, the results have varied dramatically. Sometimes the machined holes show higher open-hole-tension strengths, and other times the formed holes are stronger. Clearly the ‘truth’ of this matter is complex. The fibre orientation, fibre/matrix bonding strength, dimension of hole relative to coupon, dimension of hole relative to unit cell, and other factors determine the optimal selection of material.
l material-smart structural analysis (deformation and strength)
l stochastic structural analysis (reliability) l neural network modelling (speed, non-intuitive solutions)
Each of these analytical methods is addressed briefly below.
Unit-cell modelling
Much has been written about unit-cell modelling6-‘0. In many cases, unit-cell modelling refers to the calculation of elastic properties of the textile composite on the basis of the reinforcing geometry”. Thus, in order to carry out this analysis, it is necessary to have a good description of the unit cell in terms of the reinforcing geometry.
A processing science model can be used to create a geometric description of the reinforcement3’i2. The difficulty is in making this geometric model correspond well with the reality of the reinforcement. This means including variations of yarn path through the structure, predicting accurate orientation angles (in-plane and crimp), ensuring proper fibre volume fraction, and including the correct fibre volume fraction within a yarn. In many laminated textiles (wherein layers of fabric are stacked to form the thickness), as well as in 3-D textiles wherein some debulking of the fabric has been carried out, the yarn paths and positions are not ideal. There is nesting of layers and buckling of yarns in the structure. To carry out a detailed unit-cell model, these parameters must be accounted for in the geometry.
This is not a trivial task. The implications are that each individual textile composite must be examined independently. This clearly will not allow textile reinforce- ments to be used as structural materials. Thus, some alternative must be found.
The approach would be to carry out an ‘effects of defects’ study on the unit-cell level. Analytically, it can be determined how important parameters such as nesting are on the overall stiffness characteristics of the reinforcement. If, as expected, small variations in nesting do not have dramatic influences on the performance of the composite, it will be possible to carry out the analysis with such a tedious level of detail.
This approach can be coupled with experimental tests to verify the results. Only by eliminating the questions can these materials be adopted.
ANALYSIS Material-smart structural analysis
Having identified several problems and levels of complexity for the general problem of textile structural composites, it is only appropriate to also present some opportunities for addressing these issues. In order to use these materials, it will be necessary to acquire a substantial data base of properties, and to develop analytical tools for screening materials before testing. The costs of manufacturing these composites is currently too high to have a large experimental programme looking into many aspects of performance.
Depending on the properties of interest, there are several approaches available to prediction of performance. The following represent four categories which the author has identified as promising for the successful application of these materials:
In order to carry out a structural analysis of some textile composite component, a division of the component into discrete elements is desirable. Then, the analysis can be carried out using some elemental type analysis. This division into elements will typically be in terms suitable to the analyst, and from the textile point of view, is constructed in terms of arbitrary volume, called meso- volumes. These elements may or may not be directly related to the ‘natural’ underlying textile structure, and it is necessary for the analysis to account for this. It is important to realize that in the case of a ‘general’ textile composite (i.e., when a unit-cell model is insufficient for the component), the elastic properties, density, and strength properties of each element may be unique. Thus, we must consider the kth mesovolume as being characterized by some unique stiffness matrix, C,,(k), and
l unit-cell modelling (elastic properties) some unique density, p(k).
224 Composites Manufacturing No. 4 1993

Thus, the solution becomes rather complicated, since it must be constructed in such a way to satisfy the necessary continuity conditions between adjacent mesovolumes. These adjacent mesovolumes may have equal or distinct properties depending on their location. The continuity conditions change depending on whether the adjacent mesovolumes have equal or distinct characteristics. Simply applying these discrete C(k) values to a standard finite element analysis will not guarantee that all continuity conditions are met. Thus it is necessary to develop an analytical procedure that can accommodate some ‘understanding’ of the material being modelled. Some techniques have been developed for this purpose13 - ’ 5 and are currently being employed and developed further for the specific problems associated with textile-reinforced composites.
One of the issues to be resolved in this analysis is the technique for addressing adjacent mesovolumes which have different elastic characteristics, but this distinction is purely artificial. In this case, some smoothing of stresses and strains must be achieved. Currently two approaches are being considered for the solution. In the first case, the idea of introducing interfacial elements between such mesovolumes is proposed. These interfacial mesovolumes can have smoothed stress/strain relationships which effectively make the problem one of developing these elements and incorporating them into the global analysis. In such a case of an interfacial element analysis, the whole volume of a structural part consists of mesovolumes and interfacial sub-elements characterized by distinct Cii and p values.
Another approach, based on a global smoothing of textile properties, can be realized in a similar way. By use of some interpolating/approximating techniques, the spatial distribution of mechanical properties associated with each mesovolume can be smoothed. This results in continuous Cij and p values depending on x, y, and z coordinates. The discretization of the structural part’s volume in this case will be controlled by global boundary and loading conditions as well as by global variation of textile properties. This kind of solution would be efficient for a global type problem (traditional deformation, low-frequency vibration, buckling) for which detailed local stress analysis is not of primary concern.
Stochastic structural analysis
In order to predict reliability of a structure, it is necessary to have some description of the probability of failure. These statistical phenomena can be derived through a combination of activities. Unidirectional materials (representing composite yarns) can be tested extensively and distributions of stiffness and strength in various directions can be compiled. These data can then be linked to the random distribution of orientation throughout the composite structure, creating a distribution of stiffnesses and strength properties for the textile structure. The structure can be analysed in a stochastic model including fluctuating loading conditions to make predictions of failure probability under specific loading. This approach is rather complex. Existing stochastic models of reliability separate the stiffness variations and the strength variations. Even more, the stiffness characteristics are modelled as independent events.
In order to fully understand the reliability of the textile- reinforced structure, new stochastical models are required,
which may, for instance, treat the stiffness tensor as the random variable, rather than the 21 constants as independent variables.
It should be pointed out that stochastic modelling is not Monte-Carlo type simulation. Although it is much easier to construct a Monte-Carlo simulation, it has short comings, particularly in terms of quantification of the ‘goodness’ of the probabilistic results. Stochastic modelling, on the other hand, is analytical in nature and thus provides a complete track of the error associated with the analysis.
Although much more difficult, the stochastic modelling provides an excellent opportunity for developing detailed understanding of the critical parameters which affect the performance of textile-reinforced composites.
Neural network modelling
Another approach is the use of neural networks for the prediction of properties. A neural network is a complex relationship building algorithm. The advantage (and disadvantage) of these constructions is that they have no mechanistic description of the relationships being constructed. The network will map a set of input parameters onto a set of output parameters by constructing rules of relationships through transcendental functions.
The idea of applying neural nets is to create a quick, unbiased model of performance. These nets can be built from experimental data or from predicted response, or a combination of both. The author is currently working with a colleague on the development of a neural net which uses geometric parameters and physical properties as input, and outputs stiffness, crack initiation, and failure stress for a simple tension test.
The net can be trained to some maximum precision, after which the net can be queried. Structural analysis is generally non-invertible, but the neural net con- struction provides a ‘back-propagation’ algorithm which allows the user to request a set of inputs which meet some specified output set. This provides a degree of freedom to the designer not available with traditional analytical tools.
Clearly the lack of mechanistic descriptions causes some concern, but a sufficiently trained net will demonstrate its accuracy on unknown data sets, and should be able to make predictions as accurate as any other technique, given sufficient input data.
CONCLUSIONS
The relative novelty of textile reinforcements is directly associated with the high level of variations and processing defects in the materials. However, one must be careful when considering these variations not to ‘throw out the baby with the bath water’. The structural inhomogeneities associated with textile composites are beneficial to the performance characteristics, but provide complexities to analysis and manufacturing. We should be aware that metal structures have comparable levels of complexity, but the scale and randomness, coupled with the long history of study, allow the designer to use these materials readily. Presumably with improvements in understanding, testing, and manufacturing, it will soon be possible to design textile composites with the same level of confidence metals currently enjoy.
Composites Manufacturing No. 4 1993 225

There are two basic approaches needed to optimize these materials and make them acceptable to designers as structural materials: (i) reduce manufacturing variability; and (ii) identify effects of defects for textile composites. It is not clear which approach takes priority; rather, both should be pursued simultaneously. As with any manufacturing process, there is no theoretical limit to the controls available, but this reduces productivity and increases cost. What is necessary is to determine the critical manufacturing flaws and eliminate them.
Many manufacturing defects can be resolved by careful processing science modelling of the material, employing a real-time data acquisition system to verify the architecture of the fabric. The identification of processing errors requires the development of better non-destructive testing, development of statistical models in order to create a quality assurance and testing programme for manufacturing, and application of total quality management (TQM) procedures to the entire process flow. The determination of ‘critical’ flaws should be made by a combination of testing and analysis. Testing must be developed not on the history of metals, but with an understanding of the actual material. Just improving testing and correlating the data acquisition system to the material may show a dramatic reduction in reported property scatter. By understanding the interaction of local defects and the performance of the structure, it will be possible to carry out sensitivity studies on the manufacturing parameters and identify the proverbial ‘20%’ of the flaws which create ‘80%’ of the problems.
Clearly the advantages of textile-reinforced composites outweigh the current problems in manufacturing and analysis. Many of the existing defects will be identified and removed in a short time, and analytical tools are rapidly developing to handle these materials. The complexity of the material and the implicit hierarchical nature of the corresponding analysis should be considered as an opportunity for the advancement of the science of composites.
ACKNOWLEDGEMENTS
The author wishes to extend his thanks to several individuals for assistance in the development of this paper. Mr Kip Clyburn provided the neutron tomography images, Mr Alexander Birger provided the numerical solutions to the braid shear stripes problem, and Mr Wade Jackson provided the photomicrographs of the plain weave specimens. Professor Alexander Bogdanovich was of critical assistance in discussing the problems and possible solutions in all aspects. The numerical solutions were carried out on a Convex supercomputer through
a grant from the North Carolina Supercomputing Association.
REFERENCES
1
2
3
4
5
6
I
8
9
10
11
12
13
14
15
Pastore, C.M., Bogdanovich, A.E. and Gowayed, Y.A. ‘Applications of a meso-volume based analysis for textile composite structures’ Composites Eng 3 No 2 (1993) pp 181-194 Tan, T., Pastore, C. and Ko, F. ‘Engineering design of tough ceramic matrix composites for turbine components’ J Eric, Gas Turbines and Pm&l13 No 2 (1991) pp 3121317 Pastore. CM., Gowaved. Y.A. and Cai. Y.J. Aoolications of Computer Aided Geomekc Modelling for Text% Structura~l Composites (Computational Mechanics Publications, Southampton, 1990) pp 45-53 Bogdanovich, A., Pastore, C. and Birger, A. Analysis of Composite Shallow Shell Structures Reinforced with Textiles, Vol. 2 (Editions Pluralis, Paris, 1992) pp 35-44 Masters, J., Foye, R., Pastore, C. and Gowayed, Y. ‘Mechanical properties of triaxially braided composites: experimental and theoretical results’ J Composites Technol Res 15 No 2 (1993) pp 112-122 Foye, R.L. ‘Finite element analysis of unit cells’ Fiber Tex ‘90, Hampton, VA, May 1992 edited bv J. Bucklev (NASA Langlev Research Center, Hampton, VA, 1991) pp 45553
1 .
Lei. C.. Wang. AS. and Ko. F. ‘A finite cell model for 3-D braided composites’ Proc ASME ‘Winter Annual Meeting, June 1988, Chicago, IL (ASME, Cleveland, OH, 1988) pp 123-132 Pastore, C. and Gowayed, Y. ‘A self consistent fabric geometry model: modification and application of a fabric geometry model to predict the elastic properties of textile composites’ J Composites Technol Res 16 No 1 (1994) pp 32-36 Whyte, D.W. ‘On the structure and properties of 3-D braided composites’ PhD Thesis (Drexel University, Philadelphia, 1986) Kregers, A.F. and Melbardis, Yu.G. ‘Determination of the deformability of three-dimensionally reinforced composites by the stiffness averaging method’ Polymer Mechanics 1 (1978) pp 3-8 Gowayed, Y.A. and Pastore, C.M. ‘Analytical techniques for the prediction of elastic properties of textile reinforced composites’ Mechanics Composite Mater 5 (1993) pp 579-596 Gowayed, Y.A. ‘An integrated approach to the mechanical and geometrical modefling of textile structural composites’ PhD Thesis (North Carolina State University, Raleigh, 1992) Bogdanovich, A.E. and Yarve, E.V. ‘Stress analysis in multilayered beams under transverse dynamic bending’ Mechanics Composite Mater 5 (1983) pp 824-837 Bogdanovich, A.E. and Yarve, E.V. ‘Numerical solution of the two-dimensional transient deformation problem for a laminated media’ Mechanics Composite Mater 1 (1988) pp 3644 Bogdanovich, A.E. and Yarve, E.V. ‘Numerical analysis of impact deformation of laminated composite plates’ Mechanics Composite Mater 5 (1989) pp 804820
AUTHOR
Christopher M. Pastore is with the Program of Textile Materials Science, North Carolina State University, Raleigh, NC 276958301, USA.
226 Composites Manufacturing No. 4 1993