Embed Size (px)
Citation preview
Kaplan, R.M. (1985) Quantification of Health Outcomes
For Policy Studies In Behavioral Epidemiology.
In Behavioral Epidemiology and Disease Prevention edited
by R.M. Kaplan and M. H. Criqui. Plenum Press, New York.
pp 31-54.
3
QUANTIFICATION OF HEALTH OUTCOMESFOR POLICY STUDIES IN
BEHAVIORAL EPIDEMIOLOGY
Robert M. Kaplan, Ph.D.*
Epidemiological research requires the quantification of health outcomes.
Some outcomes are hard or directly observable. These include mortality and
observable lesions. Other outcomes, such as symptomatic complaints, are soft.
The objective of health care is to achieve positive outcomes. Through prevention
or medical care we hope to avoid negative outcomes.
Outcomes should not be confused with process. Many scientists seem to haveconfused variables known to be relevant to outcomes with outcomes themselves.
1. Supported by Grant K04 HL 00809 from the National Heart, Lung, and Blood Institute of the Na-tional Institutes of Health.
31

Chapter 3 Kaplan
For example, hypertension is not an outcome. However. high blood pressure may.be associated with negative outcomes or may mediate undesirable events.Similarly, stress, lack of exercise, cigarette smoking, and a variety of other factorsare important because they may affect outcomes. The importance of epidemiologicresearch is in its identification of processes that. may control outcomes. Strong
epidemiologica] research avoids linking process directly to process. For example, aprocess-process study might link dietary changes to changes in serum cholesterol.A strong epidemiologic study would link dietary changes to health status. Thus, aquantitative expression of health status is very important.
1. :Health Status
In a variety of publications, we have argued that a single index of health
status is both feasible and highly desirable {Bush, Kaplan, and Berry, in press;Kaplan, 1982: Kaplan and Bush, 1982; Kaplan, Bush, and Berry, 1976, 1978, 1979;Kaplan and Ernst, 1983}. The traditional approach to health status assessmentfocuses on measures of mortali_y. A variety of mortality indexes, such as the crude
mortality rate and the age-specific mortality rate, exist. There are also a variety ofdisease-specific mortality rates. Sometimes. global comparisons of health care indifferent nations are made using extremely crude indices such as the infant
mortality rate or the number of infants to die at or under one year per 1,000 livebirths.
There are many difficulties with focusing only on mortality as a healthoutcome. The most obvious problem is that mortality ignores all those who are
alive. Most of health care is oriented toward improving the quality of life inaddition to extending the duration of life. Measures of quality of life typicallyconsider morbidity. The other extreme from mortality alone is the breakdown of
morbidity into numerous specific disease categories. Considering different specificdisease indicators makes it impossible to make rational comparisons betweenprograms or treatments that have very different specific objectives. For manytreatments in medical care, it is possible to meesure effectiveness using a singleindicator such as diastolic blood pressure or serum cholesterol. These approaches
are not suitable, however, for comparing the relative output of differentinterventions for different disease groups.
Very specific measures may overlook the consequences or side effects oftreatment. (Jette, 1980; Mosteller, 1981). A treatment for hypertension, for
example, may cause gastric irritation, nausea, and bed disability. Although theactivities of different health care providers are diverse, they share the commonobjective of improving health status. That objective is to extend the duration oflife and to improve the quality of life. Our work has been directed towardquantifying progress toward this objective. Further, we hope to assess the relative
contributions of different approaches designed to improve health status. These
32

Quantificationof HealthOutcomes
approaches might include medical and surgical treatments, behavioralinterventions, prevention and screening programs, and legislative changes {such asauto infant restraint laws). The method can combine hard and soft indicators, ifdesirable, into a single unit.
A major trend in this field is the use of decision models such as cost-benefitanalysis and cost-effectiveness analysis. Both of these models are used to weight
positive and negative alternatives in order to reach a rational decision about theutilization of resources. The methods differ in the unit they use to express the
efficacy of a program or a treatment. In cost-benefit analysis, both the healthoutcome and the costs of the program are expressed in monetary units. In cost-effectiveness analysis, the consequences of a program are expressed in some non-
monetary unit. The most popular approaches to cost-effectiveness analysis expressoutcomes in terms of years of life produced by a program or equivalents of well-
years of life making adjustment for diminished quality of life. In some of ourprevious work (Kaplan and Bush. 1982} we make the distinction between cost-effectiveness and cost-utility. Cost-utility is a special case of cost-effectiveness thattakes expressed preference for health states into consideration. Although we preferthe cost-utility terminology, the distinction is subtle and the terms cost-effectiveness and cost-utility will be used interchange.ably for the purpose of this
paper. Within the last decade, the growth of published cost-benefit and cost-effectiveness studies has been exponential. Recent trends suggest that cost-
effectiveness analysis is emerging as the preferred method {Warner and Hutton,1980).
2. Well-Years or Quality Adjusted Life Years
Our approach is to express the benefitsof medical care. behaviora]
intervention,or prevenLiveprogramsintermsofwell-years.Othershave chosento
describe the same ouLcome as Quality Adjusted Life Years {Weinstein and SLason.
1977J. Welt-Years integrate mortality and morbidity to express health status interms of equivalents of well-years of life. If a man dies of heart disease at age 50and we would have expected him to live to age 75, it might be concluded that thedisease caused him to lose 25 life-years. If 100 men died at age 50 (and also had
life expectancy of 75 years), we might conclude that 2.500 {100 men X 25 years}life-years had been lost.
Yet, death is not the only outcome of concern in heart disease. Many adults
suffer myocardial infarctions leaving them somewhat disabled over a long period oftime. Although they are still alive, the quality of their lives has diminished. Ourmodel permits various degrees of disability to be compared to one another. A
disease that reduces the quality of life by one-half will take away .5 well-years overthe course of one year. If it affects two people, it will take away 1.0 well-year
{equal to 2 X .5} over a one-year period. A medical treatment that improves the
33
Chapter 3 Kaplan
quality of life by .2 for each of five individuals will result in the production of one
well-year if the benefit is maintained over a one-year period. Using this system, it
is possible to express the benefits of the various programs by showing how many
equivalents of years of life they produce. Yet nol all programs have equivalent
costs. In periods of scarce resources, it is necessary to find the most efficient uses
of limited funds. Our approach may provide a framework within which to make
policy decisions that require selection between competing alternatives. In recent
years, expenditures for health care services have increased relentlessly. Preventive
services must compete with traditional medical services for the scarce health care
dollar. We believe preventive services can be shown to be competitive in such
analyses. Yet. performing such comparisons requires the use of a formal decisionmodel.
In the next section, the general model of health status assessment and cost.-
effectiveness analysis will be presented. Then, case studies from a variety of areas
will be offered. These case studies include traditional surgical interventions such as
bypass surgery, preventive medical programs such as pneumococcal vaccination
programs, and behavioral prevention programs such as compliance programs for
hypertension and behavioral interventions in chronic lung disease.
3. Building a Health Decision Model
The health decision model grew out of substantive theory in economics,
psychology, medicine, and public health. These theoretical linkages have been
presented in several previous papers (Bush, Chen, and Patrick, 1973; Chen, Bush,
and Patrick, 1975; Fanshel and Bush, 1970). Building a health decision modelrequires at least five distinct steps.
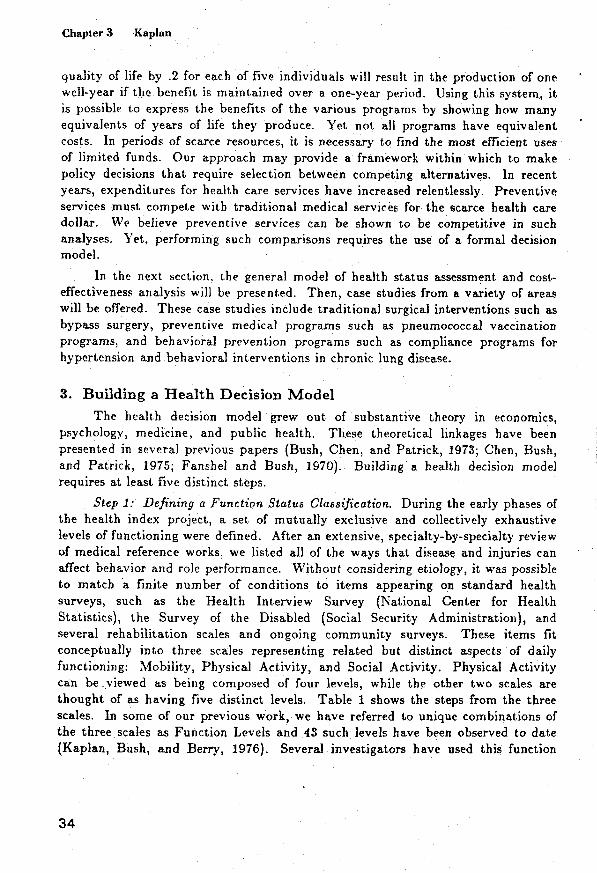
Step I: Defining a Function Status Classificalion. During the early phases of
the health index project, a set of mutually exclusive and collectively exhaustive
levels of functioning were defined. After an extensive, specialty-by-specialty review
of medical reference works, we listed all of the ways that disease and injuries can
affect behavior and role performance. Without considering etiology, it was possible
to match a finite number of conditions to items appearing on standard health
surveys, such as the Health Interview Survey (National Center for Health
Statistics), the Survey of the Disabled (Social Security Administration), and
several rehabilitation scales and ongoing community surveys. These items fit
conceptually into three scales representing related but distinct aspects of daily
functioning: Mobility, Physical Activity, and Social Activity. Physical Activity
can be _viewed as being composed of four levels, while the other two scales are
thought of as having five distinct levels. Table 1 shows the steps from the three
scales. In some of our previous work, we have referred to unique combinations ofthe three scales as Function Levels and 43 such levels have been observed to date
{Kaplan, Bush, and Berry, 1976). Several investigators have used this function
34

Quantificationof Health Outcomes
Table 1
Dimensions and Steps for Function Levels in theQuality of Well-Being Scale
Mobility Physical Activity Social Activity
Drove car and used Walked without physical Did work, school, or
bus or train without problems {4) housework and other
help (5) activities (5)Walked with physical
Did not drive, or limitations (3) Did work, school, or
had help to use bus houseworkbut otheror train (4) Moved own wheelchair activities limited (4)
without help (2)
In house (3) Limited in amount orkind of work, school,
Inhospital(2) orhousework(3)
In bed orchair(i)
In specialcare Performedself-care
unit(I) but notwork,schoolor housework(2)
Had help with self-
care (I)
status classification (or a modified version of it) as an outcome measure for healthprogram evaluation {Reynolds, Rushing, and Miles. 1974; Stewart et al., 1978).
However, the development of a truly comprehensive health status indicator requiresseveral more steps.
Step 2: Classifying Symptoms and Problems. There are many reasons aperson may not be functioning at the optimum level. Subjective complaints are an
important component of a general health measure because they relate dysfunctionto a specific problem. Thus, in addition to Function Level classifications, anexhaustive list of symptoms and problems has been generated. Included in the listare 35 complexes of symptoms and problems representing all of the possible
symptomatic complaints that might inhibit function. A few examples of thesesymptoms and problems are shown in Table 2.
Step 3: Weights for the Quality of Weli-Belng. Each combination ofFunction Level and Symptom/Problem complex might describe how a person
35

Chapter 3 Kaplan
Table 2
Examples of Symptom-Problem Complexes and LinearAdjustments for Level of Well-Being Scores
Symptom-Problem Complex Adjustment
I. Pain, stiffness, numbness, or discomfort
of neck. hands, feet., arms. legs, orseveral joints -.0343
2. One hand or arm missing, deformed Icrooked),paralyzed (unable to move}, or broken{includes wearing artificial limbs orbraces}. -.0608
3. Burn over large areas of face. body,armsor legs. -.1100
functioned on a particular day in his or her life. One function state might bedescribed for example, as follows:
In house
Walked with physical limitationsPerformed self-care, but not work, school, or houseworkPain,. stiffness, numbness, or discomfort of neck,
hand, feet, arms, legs, or several joints
As we noted earlier, the health decision mode] includes the impact of health
conditions upon the quality of life. This requires that the desirability of healthsituations be evaluated on a continuum from death to completely well. An
evaluation such as this is a matter of utility or preference, and thus, functionlevel-symptom/problem combinations are scaled Lo represent precise degrees ofrelative importance.
Human judgment studies are needed _o determine weights for the differentstates. We have asked random samples of citizens from the community to evaluate
the relative desirability of a good number of health conditions. In a series ofstudies, a mathematical model was developed to describe the consumer decisionprocess. The validity of the model has been cross validated with an R 2 of .94
(Kaplanl Bush, and Berry, 1978). These weights, then, describe the relativedesirability of all of the function states on a scale from zero (for death) to 1.0 (for
optimum function). Thus, a state with a weight of .50 is viewed by the members
36

Quantificationof HealthOutcomes
of the community as being about half as desirable as optimum function or abouthalfway between optimum function and death.
Using these weights, one component of the general model of health is defined.This is the "Quality of Well-Being Scale," which is the point in time component of
the Health Status Index {Fanshe] and Bush, 1970; Kaplan, Bush, and Berry, 1976}.The Quality of Well-Being score for any individual can be obtained from values
associated with his/her function level, adjusted for symptom or problem.
The example above shows Function Level 19 for which a weight of .5824 hasbeen obtained. This weight is adjusted by the value associated with thesymptom/problem which in this case is-.0343 {associated with complex number 1
in Table 2). So, the Quality of Well-Being score is .5481 {=.5824 + {-) .0343).Using the symptom-problem adjustments, the Index becomes very sensitive to
minor "top end" variations in health status. For _xample, there are symptom-problem complexes for wearing eyeglasses, having a runny nose, or breathing
polluted air. These symptom adjustments apply even if a person is in the top stepin the other three scales. For example, a person with a runny nose receives a scoreof .84 on the Quality of Well-Being Scale when he is at the highest Function Level(see Kaplan et al.. 1976). Thus, the Index can make fine as well as grossdistinctions.
Mathematically, the Quality of Well-Being Score may be expressed as
£1
w =W_=1
where
W is the symptom standardized time-speclfic Quality of Well-Being Score,
_: indexes the Function Levels [c=l,....,Ll.Wc is the Quality of Well-Being {weight, utility, relative
desirability, social preference} for each Function Level,
standardized {adjusted) for all possible Symptom/ProblemComplexes,
Nc is the number of persons in each Function level, and
N is the total number of persons in the group, cohort, orpopulation.
Thus, Quality of Well-Being is simply an average of the relative desirabilityscores assigned to a group of persons for a particular day or a defined interval oftime.
37
Chapter 3 Kaplan
Several studies attest to the reliability (Kaplan. Bush. and Berry, 1978; Bush,
Kaplan, and Berry, 1983) and validity {Kaplan, Bush, and Berry, 1976) of the
Quality of Well-Being Scale. For example, convergent evidence for validity is
given by significant positive correlations with self-rated health and negative
correlations with age, number of chronic illnesses, symptoms, and physician visits.
However, none of these other indicators were able to make the fine discrimination
between health states which characterize the Quality of Well-Being Scale. These
data support the convergent and discrimi_ant validity of the Scale (see Kaplan,
Bush, and Berry, 1976}.
Step 4: The Well-Life Expectancy. Quality of Well-Being is only one of the
two major components of the Health Decision Model. The other component
requires consideration of transitions among the levels over time. Consider the
health situation we described earlier (e.g., Function Level 19}. Suppose that thiscondition described two different individuals; one who was in this condition
because of participation in a marathon race and another because of arthritis. Thefact that. these individuals are in these conditions for different reasons is reflected
by different expected transitions to other levels over the course of time. The
marathon runner probably is sore from her ordeal, but is expected to be off and
running again within a few days. However, the arthritis sufferer will probablycontinue to convalesce at a low level of function. A Health Decision Model must
consider both current functioning and probability of transition to other FunctionLevels over the course of time. When transition is considered and documented in
empirical studies, the consideration of a particular diagnosis is no longer needed.
We fear diseases because they affect our current functioning or the probability that
there will be a limitation in our functioning some time in the future. A person at
high risk for heart disease may be functioning very well at present, but may have a
high probability of transition to a lower level (or death} in the future. Cancer
would not be a concern if the disease did not affect current functioning or the
probability that functioning would be affected at some future time.
When weights have been properly determined, health status can be expressed
precisely as the expected value {product) of the preferences associated with the
states of function at a point in time and the probabilities of transition to other
states over the remainder of the life-expectancy. Quality of Well-Being (W) is a
static or time-specific measure of function, while the Well Life Expectancy (E) also
includes the dynamic or prognostic dimension. The Weighted Life Expectancy is
the product of Quality of Well-Being times the expected duration of stay in each
Function Level over a standard life period. The equation for the Weighted Life
Expectancy isL
I¢= 1
38

Quantification of Health Outcomes
where
E is the symptom-standardized Weighted Life Expectancy in
equivalents of completely well-years, and
Y is the expected duration of stay in each Function Level or
case type estimated with an appropriate statistical
{preferably stochastic} model.
An example computation of the Weighted Life Expectancy is shown in Table
3. Suppose that a group of individuals was in a well state for 65.2 years, in a state
of non-bed disability for 4.5 years, and in a state of bed disability for 1.9 years
before their deaths at the average age of 71.6 calendar years. In order to make
adjustments for the dimifiished quality of life they suffered in the disability states,
the duration of stay in each stale is multiplied by the preference associated with
the state. Thus, the 4.5 years of non-bed disability become 2.7 equivalents of well
years when we adjust for the preferences associated with inhabiting that state.
Overall, the Weighted Life Expectancy for this group is 68.5 years. In other words.
disability has reduced the quality of their lives by an estimated 3.1 years.
Table 3
Illustrative Computation of the Weighted Life Expectancy
State Y_: W K W_ YK
Well A 65.2 1.00 65.2
Non-beddisability B 4.5 " .59 2.7
Beddisability C 1.9 .34 .6
Total 71.6 68.5
Source: Kaplan and Bush. 1982
L
Weighted Life Expectancy = _ WK: Y_= 68.5 Well Years
K=I
L
Current Life Expectancy = _ YK: = 71.6 Calendar Years
I<=1
39

Chapter 3 Kaplan
Step 5: Estimating the Co_t/Effectlvene_8 Ratio. The San Diego Health
Index Group has shown in a variety of publications hog" the concept of a Well orWeighted Life Expectancy can be used to evaluate the effectiveness of programs
and health interventions. The output of a program has been described in a variety
of publications as Quality Adjusted Life Years (Bush, Chen, and Patrick, 1973;Bush, Fanshel, and Chen, 1972), Well Years, Equivalents of Well-Years, orDiscounted Well-Years (Kaplan, Bush, and Berry, 1970, 1976; Patrick, Bush, and
Chen, 1973a, 1973b). Weinstein (1980a, 1980b) has popularized the concept and
calls the same output Quality-Adjusted Life Years {QALYS) and this has recentlybeen adopted by the Congressional Office of Technology Assessment (1979). It is
worth noting that the Quality Adjusted Life Years terminology was originallyintroduced by Bush, Patrick, and Chen in 197_, but later abandoned because it hassurplus meaning. The term "wellness" or "well-years" implies a more direct
linkage to health conditions. Whatever the term, the Index shows the output of aprogram in years of life adjusted by the quality of life which has been lost becauseof diseases or disability.
4. Utilization of a Well-Years Measure
By comparing experimental and control groups on a health status index, it ispossible to estimate the output of a program in terms of the well-years it produces.
This is shown as the area between curves representing the two groups in Figure 1.Dividing the cost of the program by the well years it yields gives the cost-effectiveness ratio.
5. Examples of Cost-Utility Studies
In this section, studies using the cost-utility model well be reviewed. A
variety of studies with very different specific objectives have been chosen tohighlight the general nature of the model.
Coronary Artery Bypass Surgery {CABS). Despite some controversy(Braunwald, 1977; DeBakey and Lawrie, 1979; Hultgren et al., 1978}, coronary
arLery bypass surgery (CABS) has become a major treatment for systematiccoronary artery disease. The number of procedures performed in the United Stateshas steadily grown to an estimated ll0,000 procedures in 1980 at an estimated cost
of $15,220 per operation {Kolata, 1981). Because of the significance of theprocedure and the expenses associated with it, Weinstein and Stason (1982)conducted a systematic evaluation of the literature on CABS using a cost-utilitymodel. The data for the Weinstein and Stason evaluation were provided by
clinical reports, systematic longitudinal data banks, and clinical trials including themajor trials conducted by the European Coronary Surgery Study Group and theVeterans Administration Cooperative Study.
4O

Quantification of Health Outcomes
WELL
1.0-
.75 With the treatment or program
jNean output far
E u,e.25
Without the treatment
orprogram0.0
OEATH toTIME
Figllre 1. Theoretica] compariso_ of treated and untreated groups. The area betweenthe two curves is the output or benefit of a program in Well-Year units.
Source: Kaplan and Bush, 1982.
The analysis considered the benefit for a 55-year old male population, since
55 years is approximately the median age for receipt of CABS. The analysis
considers only those men who would be deemed operable by cardiologists on the
basis of clinical characteristics and angiography. The analysis was clone separately
for men with obstruction (defined as 50 percent or more) of 1, 2, or 3 coronaryarteries or left main coronary artery disease. In each of these cases, ventricular
function was good--with at least a 40 percent ejection fraction. The analysis for
patients with poor ventiruclar function will not be considred here.
In order to calculate quality adjusted life years, Weinstein and Stason needed
to integrate morbidity and mortality information. They used data about
symptomatic relief from the European study {European Coronary Surgery Study
Group, 1979, 1980) and from the Montreal Heart Institute (Campeau et al., 1979}.
They also simulated the benefit results using a variety of preferences for observed
levels of functioning and symptomatic angina.
41

Chapter 3 Kaplan
The approach used by Weinstein and Stason does not depend on specific data
sets. Figure 2 shows differences in the life expectancy as obtained from differentdata sets. Notice that the VA data and the European data differ in their
evaluation of the benefits of surgery for one-vessel and two-vessel disease. The VA
data suggest that surgery may be detrimental in these cases, while the Europeandata indicate there will be benefits. The figure also shows how these two trials andother data are merged to obtain central assumptions that are operative in theanalysis. However, the analysis can also consider differing assumptions, and the
impact" these assumptions have upon qualily adjusted life expectancy. Under theassumption that the preference for life with angina is .7 {on s scale from 0 to 1),Weinstein and Stason estimated the benefits of surgical treatment over medicaltreatment, for the various conditions. The)' found that the benefits and well-years
or quality adjusted life years would be .5. 1.1. 3.2, and 6.2 years for 1 vessel, 2vessels, 3 vessels, and left main disease respectively. Figure 3 shows the cost-utilityof bypass surgery under the central assumptions. As the figure shows, the cost-effectiveness ranges from $30.000/year for one vessel disease to $3,800/year for left
main artery disease. Weins_ein and St,ason performed these analyses under avariety of assumptions. In doing so, they revealed the impact of consideringquality of life. One assumption ignored quality of life and considered only life
expectancy. The cost-effectiveness of bypass surgery for one vessel disease underthis assumption cannot be estimated since surgery has no effect upon survival.However, many of the benefits of surgery are directed toward the quality of liferather than survival. A model that did not integrate mortality and morbiditywould have missed these benefits.
In summary, the Weinstein and Stason (1983) analysis demonstrates that thecost-utility of CABS differs by characteristic of disease state. However, the cost-utility figures compare favorably with those from other widely-advocated medical
procedures and screening programs.
Pneurnococcal Vaccine. There is little question that vaccination programs
have had a major beneficial impact; Diseases that once threatened the masses,such as polio and smallpox, have virtually been eliminated. The largest promoterand user of vaccines has been the United States government. Every year or two,
Congress is asked to enact new legislation on vaccines. The legislation authorizesgovernment purchase and distribution of vaccines for use by state and localgovernment programs. Nevertheless, the production of vaccines in the UnitedStates has-steadily declined since the 1940s {Riddough and Willems, 1980).Preventive health measures, like vaccination programs, have given way to the use
of curative pharmaceuticals, including the sulfa drugs, the penicillins, and the
tetraeyclines (Office of Technology Assessment, 1979). A number of factors havecontributed to the decrease in the number of product licenses issued for vaccines
(see Riddough and Willems, 1980). Vaccines are not entirely without risk. Evenvery safe products may be associated with a small probability of side effects. For

Quantification of Health Outcomes
CEIVTR/_L V,4D,4TX/ EUROPEAN_gZlTx]8 ./ISSUMPTIONS
iliill ii !ii!iiiiiil!ili-
3.4:':':':':-:-:-:.: : :,:.:.:
- i!i!i!!! - ...... ':'::':i::ili::i::1
......"" .... :i:i:i:i:::::: _',.-.....!:!:i:! ":':+: ::::::
/6_ !:i:_:i:':::::: Surgery"4 ! !i:::::/::::i!i!::!! ::::::::::::i0.'1:::::::::::::: ! Be,er
O _ ",_5_/_ JSurgery02 _ _WorseAllLaD'LAD"
2 =IVD2VD3VOLMO IVD2NO3_ LMD L-2VD--J3VDLMD
Figure 2. Effect of annual survival estimates on differences in life expectancy.
Source: Weinstein and Stason. 1982. reproduced with permission.
example, some recipients of the swine flu vaccine developed a temporary form of
paralysis known as Guillian Barrd Syndrome. Popular journalists, such as those
from CBS's 60 Minutes. (a popular magazine program in the U.S.) filmed these
people and suggested that the promoters of the vaccine program were risking the
lives of the public for personal and political benefit. These media presentations did
not consider the potential overall benefit of the program, and public faith in
vaccination programs deteriorated. In order to make an informed decision about
the program, it is necessary to have some measure of effectiveness that maps
benefits and side-effects on the same scale. The United States Congressional Office
of Technology Assessment (OTA) (1979) performed such an analysis for
pneumococcal vaccines using a health-decision model.
Using the data from the existing clinical studies, the OTA was able toassemble estimates of the effectiveness of the vaccine. However, data also
suggested that about 5 percent of the recipients reacted with swelling and fever,
and that severe reactions, such as Guillian Baxr4 Syndrome axe expected to occur
in one case per 100,000.
About 15 percent of pneumonia cases are caused by pneumococci. The
mu]tivalent polysaccharide vaccine provides protection against 14 types of
pneumococci. These 14 types account for 75 percent of the cases of pneumococca]
infections. The vaccine is estimated to be 80 percent effective for these 14 types.
Using the health decision model it was estimated that the cost per well-yeax
yielded by the vaccine is $4,800 (1979 dollars). This differs for different age
43

Chapter 3 Kap|an
3O
5
0IVD 2VD 3VD LMD
Figure 3. Cost-effectiveness of coronary artery bypass surgery.
Source: Weinsteir and Stason, 1982, reproduced with permission.
groups. For example, the costs for young children, who rarely die of pneumococcal
pneumonia, were as high as $77,200,/year, while the costs for the aged (older than
65 years}, who are the most frequent victims, are less than $1,000 per well-year.
And what about Guillain Barr_ Syndrome, which has caused so much
concern. Considering the decreased effectiveness of reducing the well-year yield by
adding the Guillian-Barr_ disabled (at the same rate as from Swine Flu program}
or adding to the costs by the increase in insurance premiums inflates the
cost/well-year to $4,900--a modest increase of $100. For the elderly it has no
44

Quantification of Health Outcomes
measurable effect. Stated another way, the large number of well-years produced by
avoiding pneumonia through pneumococca] vaccine greatly outweigh the setbackscaused by the low probability of severe side effects. Further, the vaccine program
produces well-years at a fraction of the cost of curative programs. Once a commonunit of outcome is defined, the appropriate decision becomes obvious.
This section reviewed the cost-utility of two very different health careinterventions: coronary artery bypass surgery and pneumococca] vaccine. Thesame system can be used to estimate the benefits of non-medlcal interventions such
as passive restraints in automobiles and laws requiring reduced exposure to toxicsubstances in the work place, However, our focus here is on behavioral programs.and the remainder of this section will review cost-utility studies on the benefits ofbehavioral interventions.
Adherence to Antihypertensive Medication. HyperLension is a major publichealth problem because of its high. prevalence and its association with heart, disease
and stroke. Many people are unaware that they have hypertension, or those whoare aware are unwilling to take the necessary actions to control the condition.
Weinstein and Stason {1976) and other colleagues at the Center for the
Analysis of Health Practices at the Harvard School of Public Health have analyzedthe cost-utility of hypertension screening programs in great detail. They report the
cost-utility for programs screening severe hypertension [diastolic > 105 mm Hg) tobe $4,850/well-year while the corresponding figure for mild hypertension screeningprograms (diastolic 95-104 mm Hg) to be $9,800/year in 1976 dollars.
However, their analysis also considered a variety of factors that influencethese cost-utility ratios. One of the most important factors is adherence to theprescribed medical regimen once cases have been detected. The figures givenabove assume full adherence to the regimen. Yet, substantial evidence reveals that
full or 100 percent adherence is rare (see DiMatteo and DiNicola, 1982).Compliance with antihypertensive medications is of particular interest becausetaking the medication does noL relieve symptoms. In fact, medication adherencecan increase rather than decrease somatic complaints. More studies have been
devoted to compliance among hypertensive patients than to compliance in anyother disease category. Some studies suggest that behavioral intervention can be
very useful in increasing adherence to prescribed regimens (Haynes et at., 1976).
In their analysis, Weinstein and Stason (1977) considered the value ofprograms designed to increase adherence to antihypertensive medication. Two
separate problems were considered. First, there are drop-outs from treatment.
Second, there is failure to adhere to treatments that have been prescribed. Thet.wo cases may differ in their cost. One extreme is the patient who fails to see aphysician and purchase medication. Here the costs would be very low. The otherextreme would be the patient who remains under medical care, purchases
medications, but does not take them. In this case, the costs would be high.
45
Chapter 3 Kaplan
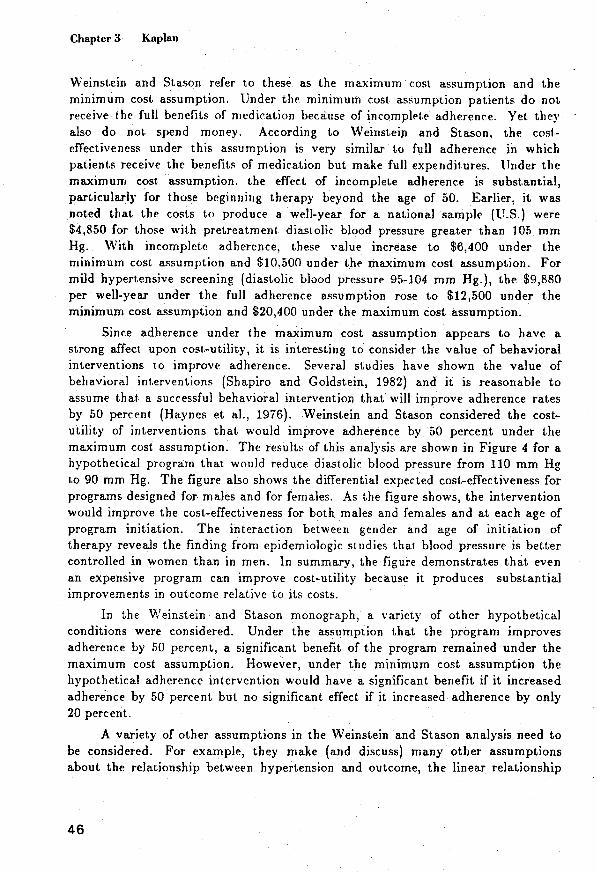
Weinstein and Stason refer to these as the maximum cost assumption and theminimum cost assumption. Under the minimum cost assumption patients do notreceive the full benefits of medication because of incomplete adherence Yet they
also do not spend money. According to Weinsteip and Stason. the cost-effectiveness under this assumption is very similar to full adherence in which
patients receive the benefits of medication but make full expenditures. Under themaximum cost assumption, the effect of incomplete adherence is substantial,particularly for those beginning therapy beyond the age of 50. Earlier, it was
noted that the costs to produce a well-year for a national sample {U.S.) were$4,850 for those with pretreatment diastolic blood pressure greater than 105 mmHg. With incomplete adherence, these value increase to $6,400 under theminimum cost assumption and $10,500 under the maximum cost assumption. For
mild hypertensive screening {diastolic blood pressure 95-104 mm Hg.), the $9,880per well-year under the full adherence assumption rose to $12,500 under theminimum cost assumption and $20,400 under the maximum cost assumption.
Since adherence under the maximum cost assumption appears to have astrong affect upon cost-utility, it is interesting go consider the value of behavioralinterventions to improve adherence. Several studies have shown the value of
behavioral int.erventlons {Shapiro and Goldstein, 1982) and it is reasonable toassume that a successful behavioral intervention that will improve adherence rases
by 50 percent (Haynes et al., 1976). Weinstein and Stason considered the cost-utility of interventions that would improve adherence by 50 percent under themaximum cost assumption. The results of this analysis are shown in Figure 4 for ahypothetical program that. would reduce diastolic blood pressure from 110 mm Hg
Lo 90 mm Hg. The figure also shows the differential expected cost-effectiveness forprograms designed for males and for females. As the figure shows, the interventionwould improve the cost-effectiveness for both males and females and at each age ofprogram initiation. The interaction between gender and age of initiation of
therapy reveals the finding from epidemiologic studies that blood pressure is bettercontrolled in women than in men. In summary, the figure demonstrates that evenan expensive program can improve cost-utility because it produces substantialimprovements in outcome relative to its costs.
In the Weinstein and Stason monograph, a variety of other hypotheticalconditions were considered. Under the assumption that the program improves
adherence by 50 percent, a significant benefit of the program remained under themaximum cost assumption. However, under the minimum cost assumption thehypothetical adherence intervention would halve a significant benefit if it increased
adherence by 50 percent but no significant effect if it increased adherence by only20 percent.
A x,ariety of other assumptions in the Weinstein and Stason analysis need tobe considered. For example, they make (and discuss) many other assumptionsabout the relationship between hypertension and outcome, the linear relationship
46

Quantification of Health Outcomes
Males,
tlo intervention
30.000
25.000
Males,
Net do;lar with intervention
cost per
yMr of 20,000increased
quality-
IKIjustedlife
expectancy %,15,000 %
Females.
_. no intervention
10.000
Females.
"_'"_"'_ with intervention
5.000
I I I I I J2O 30 40 50 60
Age at =n=t=ationof therapy
Figure 4. Effect of a hypothetical behavioral program that improves adherence by 50
percent under the maximum cost assumption.
Source: Weinstein and Stason, 1976, reproduced with permission.
between adherence and outcome, and the effect of adherence programs. However,
some data support the reasonableness of each of these assumptions.
Community-wide Interventions to Prevent Heart Disease. Another approach
to cost-effectiveness is provided in an exceptional monograph by Berwick, Cretin,
and Keeler (t980). This analysis differs from the others considered in this paperbecause the unit of benefit is years of life saved unadjusted for quality of life.
However, the Berwick and colleagues analysis is unusually thoughtful and helps
pinpoint some of the major problems in this area. The purpose of the analysis was
to compare the cost-effectiveness of different programs designed to lower cholesterol
in childhood. The approaches included screening, early dietary intervention, and
p0pulation-wide educational programs. Data on the relationship between
cholesterol and hear_ disease were taken from the Framingham Heart study.
Estimates of the benefits of community-wide behavioral interventions were
47
Chapter 3 Kaplan
extrapolated from the Stanford Heart Disease Prevention Program (Farquhar etal., 1977} and the North Karelia project (Salonen et al.. ]979}. The costs of a massmedia campaign were estimated to be about $.50 per person per year. This isapproximately the amount spent to advertise coffee, tea, and cocoa products. ]twas assumed that the mass media program would reduce cholestero] by 2 percent.
This program was compared with a hypothetical school education program whichmay cost $5.00 to reduce cholesterol by 1 percent. However, the school education
program may be argued to be more effective because it directs resources specificallytow ard children.
Discount rates are used by economists to estimate the future value of currentmoney. Programs designed for children to prevent heart disease in later life aredifficult _o analyze. The money spent on them now could also be invested and by
the time the benefits accrue_ the money _¢ould have increased in value. Futurevalue of money can be calculated as {I_-D) " where D is the discount rate and Y isthe number of years. Benefits can also be discounted using the same system.Berwick et al. (1980) considered the cost-effectiveness of mass media versus schooleducation interventions for males and females using three different discount rates
(0 percent, 5 percent and l0 percent). They found that the discount rate had avery substantial effect upon the cost-effectiveness. This is because current moneyis invested to buy benefits which occur much later in the life cycle.
Comparing the cost-effectiveness of three different programs: targetedscreening, school education, and mass media, Berwick and colleagues concluded
thai. mass media campaigns may be the most cost-effective approach. One of themost important lessons to be learned from the Berwick, Cretin, and Keeler study isthat the value of different approaches to the same problem can be readily
compared using cost-effectiveness analysis. However, the analyses may be sensitiveto certain assumptions such as the discount rate. At low discount rates, primaryprevention programs are very cost-effective. However. at high discount rates, thevalue of these programs becomes questionable. A comparison of programs designed
for children versus those des!gned for the elderly will be given in the next section.
Another issue raised by the Berw;.ck, Cretin, and Kee]er study is the data
base upon which these cost-effectiveness studies are performed. As we have seen,these analyses are based on many assumptions. For example, Berwick andcolleagues base their estimates on total cholesterol, yet current work suggests thatHDL or apoproteins (see Avogaro, this volume) may be better predictors of
mortality. Others {Stallones, 1983) have suggested that the relationship betweendiet and heart disease may be independent of cholesterol. These analyses alsomake the assumption that dietary changes will result in reductions in heart disease.This, too, is a matter of continuing debate (Laren et al., 1983; MRFIT, 1982}.These authors are aware of the limitations, and the analysis can vary these
assumptions and determine _helr impact upon any policy decision.

Quantification of Health Outcomes
Behavioral Program_ for Patients with Chronic Lung Disease. The analyses
above all use secondary data for the cost-effectiveness calculations. Unfortunately,
such analyses depend upon a variety" of unverified assumptions, In this section.
data are presented from a prospective study that attempted to combine
observations of changes in health status with cost-effectiveness analysis.
Chronic Obstructive Pulmonary Disease (COPD} is one of the most rapidly
growing health problems in most western countries. In the United States, deathsdue to COPD are rising at a rate of 1.4 percent per year. COPD is now the most
rapidly increasing of the top ten leading causes of death. COPD is the second
leading cause of permanent disability for older adults. From 1970 to 1975, the
mortality, rate from Chronic Obstructive Pulmonary Disease increased from 16 per
100.000 of the population Lo 19 per 100:000 (Brashear, 1980). In addition to itsassociation with premature mortality, COPD is also a major cause of permanent
disability and decreased quality of life. Morbidity from COPD results in
approximately 34 days of restricted activity per 100 person years. In the United
States from January 1975 to December 1976. an estimated 163.4 million office-
based physician visits were attributed to respiratory diseases. These visits
comprised approximate]}' 14 percent of all office visits for any condition during
that period. COPD accounts for approximately" one-fifth of these visits (U.S.
Government Task Force. 1977). Total costs of COPD have been estimated to be
4.55 billion per year in 1972 dollars. Of this figure, an estimated $803.000 were
spent for direct costs of hospital treatment, physician service and prescribed drugs.
Indirect costs were estimated at $3.05 billion for disability payments and $645
million for death benefits (U.S. Government Task Force, 1977).
There is no medical cure for COPD. Medical management includes the use
of antibiotics, bronchodilators, corticosteroids, and a variety of other medications
to prevent influenza and other medical complications. However, mounting
evidence suggests that behavioral programs for rehabilitation do produce
substantial benefits for COPD patients (Petty and Cherniak, 1981). These
programs result in reduced symptoms, improved exercise tolerance, reduction in
hospital days, more gainful employment, slowing the progress of disease, and
increased survival. Perhaps the most important element in the rehabilitation
program is the daily activity and exercise portion. Although COPD patients can
benefit from exercise, compliance with exercise programs is usually poor because
activity causes discomfort and shortness of breath.
Over the course of the last few years, we have been conducting an
experimental trial evaluating the benefits of behavioral programs designed to
increase compliance to an exercise regimen for COPD patients. Seventy-five
COPD patients were randomly assigned to either experimental or control groups.
All patients were given an exercise stress test and an exercme prescription.
Experimental groups were given strategies for improving adherence to the regimen
while control subjects were simply monitored (Atkins, Kaplan, Timms et al. 1984).
49

Chapter 3 Kaplan
Health sial,us information was collected over 18 months and the health decision
mode] was used to translate program benefits into well-year equivalents. By the
end of the program there were significant differences between the treated and
control patients on the Quality of Well-Being Scale. Figure 5 shows the mean
differences between experimental and control subjects over the 18-month period. Atotal of 7.$3 well-years were attributed directl_ to the program.
Costs of the experimental program were tablulated for expenses directly
charged to the program. Expenses incurred by family and friends in helping thepatient comply with their program were not considered. Both costs and health
effects were disc6unted to present value using a 5 percent discount rate. A total of
$174,100 was spent on the project. Dividing these costs by the benefits produces a
well-year at approximately $24,000. Sensitivity analysis demonstrated that using
other discount rates (0 percent and 10 percent} for both costs and effects had little
impact because the benefits were produced late in the life cycle. In other words,
programs designed for the elderly that produce health benefits without delay can
40
.22
(D .04I.D',,9 -.14Z< -.32 Treated-1-
-.50.68
"r-.86
-.104
-.122 Control*.140 I ,
initial 3-rno, 6-mo. 12-mo, 18-toO.
Figure 5. Differences between treated and control groups i_ COPD study.
5O

Quanti/_cationof Health Outcomes
be shown to be cost-effective even at high costs because they are not sensitive todiscounting assumptions. Comparing the cost-utility figure to other healtll care
programs using the General Health Policy Model. the behavioral adherenceprogram appears reasonably cost-effective as an adjunct therapy for patientssuffering from COPD (Toevs, Kaplan, and Atkins, 1984).
One facet of the COPD project is particularly interesting. There is noevidence that the behavioral interventions affected physiological processes. Forexample, experimental and control groups were not different on tests of pulmonaryfunction or arterial oxygen saturation. The difference seems to be primarilyattributable to improved quality of life. The behavioral interventions appeared to
affect quality of life directly by making people more active, encouraging them toparticipate in more activities, and getting them to lead more productive lives. Inother words, they appeared to alter the extent to which _he disease interfered withdaily function. Thus. it was argued that a health care program designed todirectly modify quality of life can be shown to be cost-effective when evaluated
using the same methods designed for the assessment of medical treatments.
6. Limitations
Despite the many advantages of cost-effectiveness or cost-utility analysis, we
must also consider some of its limitations. Several major problems will be listedbelow. These include
1. In most applications, the analysis is completely dependent uponinformation provided by epidemiologists. Yet, as demonstrated by the chapters inthis vo]ume, there continues to be debate about the determinants of many healthoutcomes. As policy scientists, we must review the evidence carefully, and
summarize current knowledge. When the evidence is inconsis_ant, it is possible tosimulate outcomes under a variety of assumptions. For example, it is possible soconsider several different levels of the relationship between diet and heart disease
and to estimate the impact these variations have upon the production of well-years.
2. The analysis also requires many assumptions about the efficacy ofinterventions. To date, there have been very few population based interventionstudies. Most behavioral interventions studies are based on small samples of
volunteers. Studies such as the Stanford Heart Disease Prevention Program andthe North Karelia study are among the very few population based studies thatprovide estimates of the efficacy of behavioral interventions.
3. As noted in the discussion of the Berwick, Cretin, and Keeler study,assumptions about discount rates can be very important in some cases. Yet, there
is no consensus about what the discount rate should be. For example, someanalysts prefer to use the inflation rate. Others suggest that discount rate shouldreflect preference5 for different levels of health at diffbrent periods in the life cycle.
However, analysts are uncertain as to how these preferences should be measured
{Kane and Kane, 1982).
51

Chapter 3 Kaplan
7. Summary
This paper has reviewed a mat.hematica] health decision mode] that can beused for policy analysis in health. The mode] may have great benefit for
comparing preventive programs with different specific objectives. Proper use of themodel should help policy makers decide between very different policy alternatives.
The value of the mode] is highly dependent upon quality epidemiologicresearch. The interface between policy science, epidemiology, and behavioralscience must be an important focus for continuing development of this approach.
References
Atkins,C. J.,Kaplan, R. M., Timms. R. M.. Reinsch,S., and Lofback,K.
BehavioralExercisePrograms in the Management of Chronic Obstructive
Pulmonary Disease. Journal of Consulting and Clinical Psychology 52 (1984)491-603.
Avogaro, P. ApolipoproLeins, the Lipid Hypothesis, and Ischemic Heart Disease.
In R. M. Kaplan and M. H. Criqui, (ads.) Behavioral Epidemiology andDisease Prevention. New York: Plenum Press, in press.
Berwick. D. M.. Cretin, S., and Keeler, E. B. Cholesterol, Children, and Heart
Disease: An Analysis of Alternatives. New York: Oxford University Press,1980.
Braunwa]d. E. Coronary-artery surgery at the crossroads. New England Journal of
Medicine 297 (1977} 661.Bush, J. W._ Chen, M. M., and Patrick, D. L. Cost-effectiveness using a health
status index: Analysis of the New York State PKU screening program. ]n R.
Berg (ed.) Health Status Indexes. Chicago: Hospital Research and EducationTrust, 1973.
Bush, J. W., Fanshel, S., and Chen, M. M. Analysis of a tuberculin testing pro-
gram using a health status index. Social-Economic Planning Sciences 6
(1972)49-69.Bush, J. W.. Kaplan, R. M., and Berry, C. C. Sources of variability in a health
policy model. Medical Care, in press.
Campeau, L. et al. Loss of improvement of angina between 1 and 7 years alteraorto coronary bypass surgery. Correlations with changes in vein grafts andin coronary arteries. Circulation 60 (suppl. I) (1979) I-1.
Chen, M. M., Bush, J. W., and Patrick, D. L. Social indicators for health planningani5 policy analysis. Policy Sciences 6 {1975) 71-89.
DeBakey, M. E. and Laurie, G. M. Response to commentary of Hultgren et al. on
"Aortocoronary-artery bypass assessmen_ after 13 years." Journal of theAmerican Medical Association 241 (1979) 2393.
DiMatteo, M. R. and DiNicola, D. D. Achieving Patient Compliance. Elmsford,
NY: Pergamon Press, ]ne.. 1982.
52

Quantification of Health Outcomes
European Coronary _urgery Study Group. Coronary-artery bypass surgery in
stable angina pectoris: Survival at two years. Lancet {1979) 889.
European Coronary Surgery Study Group. Prospective randomized stud): of
coronary artery bypass surgery in stable angina pectoris. Lancet {1980) 491.
Fanshel, S. and Bush, M. W. A health status index and its applications to health
services outcomes. Operations Research 18 {1970} 1021-1066.
Farquhar, J. W. Community education for cardiovascular health. Lancet I {1977]1192-1195.
Haynes, R. B. et al. Improvement of medication compliance in uncontrolled hyper-
tension. Lancet 1 (1976) 1265-1268.
Hultgren. H.. W., Takaro. T., Detre, K. M., and Murphy, M. L. Aortocoronarv-
artery bypass assessment after 13 years. Journal of the American .Medical
Asociation. 240 (1978) 1353.
Jette, A. M. Health status indicators: Their utility inchronic disease evaluation
research. Journal of Chronic Disease 33 (1980) 567-579.
Kaplan, R. M. Human preference measurement for health decisions and the
evaluation of long-term caste. In R. Kane and R. Kane (eds.) Values and
Long-Term Care. Lexington, Mass.: D. C. Heath [1982}-
Kaplan, R. M. and Bush, J. W. Health-related quality of life measurement for
evaluation research and policy analysis. Health Psychology 1.1 (1982) 61-80.
Kaplan, R. M., Bush, J. W., and Berry, C. C. Health status: Types of validity for
an index of well-being. Health Services Research i1 (1976} 478-507.
Kaplan, R. M., Bush, J. W., and Berry, C. C. The reliability, stability, and gen-
eralizability of a health status index. American Statistical Association,
Proceedings of the Social Statistics Section (1978} 704-709.
Kaplan, R. M., Bush, J. W., and Berry, C. C. Health status index: Cagtegory rat-
ing versus magnitude estimation for measuring levels of well-being. Medical
Care 5 {1979) 501-523.
Kaplan, R. M. and Ernst, M. S. Do category rating scales produce biased prefer-
ence weights for a health index? Medical Care 21.2 (1983) 193-207.
Kolata, G. B. Consensus on bypass surgery. Science 211 (1981) 42.
Laren, P., Helgeland, A., Hjermann, I., and Holme, I. MRFIT and the Oslo Study.
Journal of the American Medical Asociation. 249 (1983} 893-894.
Mosteller, F. Innovation and Evaluation. Science 211 (1981) 881-886.
MRFIT. Multiple Risk Factors Intervention Trial. Journal of the American Medb
cal Association. 248 {1982) 1485-1477.
Murphy, M.L. et al. Treatment of chronic stable angina: A preliminary report of
survival data of the randomized Veterans Administration Cooperative Study.
New England Journal of JVIedicine 297 {1977) 621.
Office of Technology Assessment. United States Congress. A Review of Selected
Federal Vaccine Immunization Policies: Based on Case Studies of Pne_mococ-
cal Vaccine. Washington D.C.: U.S. Government Printing Office, 1979.
Patrick. D. L.. Bush. J. V_:.. and Chen. M. Toward an operational definition of
health. Journal of Health and Social Behavior 14 {1973a) 6-23.
53

Chapter 3 Kaplan
Patrick, D. L.. Bush. J. W., and Chen, M. Methods for measuring levels of well-being for a health status index. Health Services Research 8 (1973b) 228-245.
Pliskin, J. S., Sbepard, D. S.. and Weinstein, M. C. Utility functions for life yearsand health status. Operations Research 28 (1980) 206.
Reynolds, W. J., Rushing, W. A., and Miles, D. L. The validation of a functionstatus index. Journal of Health and Social Behavior I5 (1974} 27I.
Riddough, M. A. and Willems: J. S. Federal policies affecting vaccine research andproduction. Science 209 {1980) 563-566.
Salonen, J., Puska, P., and Mustaniemi, H. Changes in morbidity and mortality
during compressive community program to control cardiovascular diseasesduring 1971-7 in North Karelia. British Medical Journal 2 (1979) 1178-1183.
Shapiro, D. and Goldstein, I. B. Biobehavioral perspectives on hypertension.Journal of Consulting and Clinical Psychology 50 (1982) 841-858.
Stallones, R. A. lschemic heart disease and lipids in blood and diet. Annual Re-
view of Nutrition 3 (1983) 155-185.Stewart, A. L., Ware, J. E., Brook, R. H., and Davies-Avery, A. Conceptualization
and Measurement of Health for Adults: Vol. _ Physical Health in Terms ofFunctioning. Santa Monica: Rand Corp., 1978.
Takaro, T. et al. The VA cooperative randomized study of surgery for coronary
occlusive disease. II. Subgroup with significant left main lesions. Circula-tion 54 (suppl. III) (1976) III-107.
Toevs, C. D., Kaplan, R. M., and Atkins, C. 3. The Costs and Effects ofBehavioral Programs in Chronic Obstructive Pulmonary Disease. Medical
Care, in press.Warner, K. E. and Hutton, R. C. Cost-benefit and cost-effectiveness analysis in
health care. Medical Care 10, ] 1 (1980) 1069-1084.Weinstein, M. C. and Stason, W. B. Cost-effectiveness of Coronary Artery Bypass
Surgery. Circulation 66 (suppl. 3) (1982) 56-66.Weinstein, M. C. and Stason, W. B. Foundations of cost-effectiveness analysis for
health and medical practices. NewEngland Journal of Medicine 296 (1977)716.
Weinstein: M. C. and Stason, W. B. Hypertension: A Policy Perspective. Cam-
bridge, Mass.: Harvard University Press, 1976.Weinstein, M. C. and Feinberg. H. Clinical Decision Analysis. Philadelphia: W.
B. Saunders. 1980.
54