Embed Size (px)
Citation preview

Journal of Sedimentary Research, 2015, v. 85, 544–561
Research-Article
DOI: http://dx.doi.org/10.2110/jsr.2015.35
QUANTIFICATION OF A DISTRIBUTIVE FLUVIAL SYSTEM: THE SALT WASH DFS OF THE MORRISONFORMATION, SW U.S.A.
AMANDA OWEN,*,1 GARY J. NICHOLS,{1 ADRIAN J. HARTLEY,2 GARY S. WEISSMANN,3 AND LOUIS A. SCUDERI3
1Department of Earth Sciences, Royal Holloway, University of London, Egham TW20 0EX,U.K.2Department of Geology and Petroleum Geology, School of Geosciences, University of Aberdeen, Aberdeen AB24 3UE,U.K.
3Department of Earth and Planetary Sciences, MSC03 2040, 1 University of New Mexico, Albuquerque, New Mexico 87131-0001, U.S.A.
e-mail: [email protected]
ABSTRACT: Recent analysis of modern aggradational continental sedimentary basins reveals that sedimentation patterns aredominated by distributive fluvial systems (DFSs). The Salt Wash Member of the Late Jurassic Morrison Formation haspreviously been described as a fan-shaped fluvial system. This study characterizes facies variations across the Salt Wash DFS toquantitatively test predicted trends in conceptual DFS models. Notable proximal-to-distal trends include a change in totalthickness of the fluvial succession from 174 m to 40 m, and an average grain size from coarse sand to silt, while the percentage ofsand decreased from 70% in the proximal region to 8% in the distal region. The proportion of amalgamated channel-belt depositsdecreased from 67% to 0%, while floodplain facies and lacustrine deposits increase (38% to 94% and 0.1% to 7% respectively). Adownstream decrease in average channel-belt thickness (15 m to 3.8 m, from thickest to thinnest) and average story thickness (7.7m to 2.3 m, from thickest to thinnest) is also recorded. Significant downstream changes in deposit architecture were also noted,with proximal regions dominated by stacked channel-belt deposits with a high degree of amalgamation. Distal deposits aredominated by floodplain muds and sheet sandstones and sparse ribbon channels, with little to no amalgamation of channel deposits.This study provides quantified information for an ancient DFSs with the aim of providing a dataset that can be used for objectivecomparison between different DFSs, as well as providing numerical data to aid resource exploration and modelling efforts.
INTRODUCTION
Non-aggrading rivers and their associated floodplain deposits havelimited preservation potential (Bristow et al. 1999). It is thereforeimperative that correct modern analogues be used when applyingobservations from modern geomorphic studies to the geologic record.A remote-sensing study on over 700 modern aggrading continentalsedimentary basins (Weissmann et al. 2010, 2011) reveals that fluvialsedimentation patterns are dominated by distributive fluvial systems(DFSs), thus deposits of DFSs are consequently expected to constitutea substantial part of the continental geologic record. It is thereforeimportant that facies models for DFS be tested and defined.
Descriptions of modern and ancient DFSs exist. Modern examplesinclude the Okavango DFS (Stanistreet and McCarthy 1993), the TaquariDFS (Assine 2005; Buehler et al. 2011), systems in the Himalayanforedeep (Shukla et al. 2001), systems in the Andean foreland basin(Horton and Decelles 2001), and others discussed in Hartley et al. (2010)and Davidson et al. (2013). Ancient examples include the Permian OrganRock Formation, Utah (Cain and Mountney 2009, 2011), Devoniansystems of Greenland and Ireland (Kelly and Olsen 1993) and Spitsbergen(Friend and Moody-Stuart 1972), the Permo-Triassic Beaufort Group(Gulliford et al. 2014), the Late Jurassic Salt Wash Member of the
Morrison Formation (Craig et al. 1955; Mullens and Freeman 1957),Cenozoic deposits of the Andes (Horton and Decelles 2001), Oligocene toMiocene Huesca and Luna DFSs in Spain (Hirst and Nichols 1986;Nichols 1987; Nichols and Fisher 2007), and Miocene deposits of SiwalikGroup in northern Pakistan (Willis 1993a, 1993b).
However, as noted by Colombera et al. (2013), most traditional faciesmodels lack quantitative information about deposit variations, particularlyacross an entire depositional system. Exceptions include Hirst (1983, 1991),who measured facies association ratios and channel-body thicknessesacross the Huesca DFS, and Cain and Mountney (2011), who measuredfacies and facies association trends across the Organ Rock Formation.
DFSs have been shown to contain important petroleum and gasreservoirs (e.g., Moscariello 2005; Kukulski et al. 2013), to hostsignificant mineral deposits (e.g., Peterson 1977; Turner-Peterson 1986),and to constitute major aquifers (e.g., Weissmann et al. 1999, 2002, 2004).Therefore, gaining a better understanding of spatial variations acrossDFSs, particularly information on system-wide quantitative trends, willfacilitate resource exploration. Such analysis also permits objectivecomparisons between different systems to refine conceptual DFS models.
This paper documents lateral trends across the Salt Wash fluvial systemof the Morrison Formation. Excellent vertical and lateral exposure acrossthis fluvial system enables a detailed system-wide study to be conducted.Recent work on apex estimation conducted by Owen et al. (2015) allowsoutcrops to be more precisely located within proximal, medial, and distaldomains. Detailed documentation of vertical trends in the Salt Wash DFShave been documented in Weissmann et al. (2013), thus we focus insteadon observed proximal-to-distal trends in this work.
* Present Address: Department of Geology and Petroleum Geology, School of
Geosciences, University of Aberdeen, Aberdeen AB24 3UE, U.K.
{ Present Address: Nautilus Limited, Ashfields Farm, Priors Court Road,
Hermitage, Berkshire RG18 9XY, U.K.
Published Online: May 2015
Copyright E 2015, SEPM (Society for Sedimentary Geology) 1527-1404/15/085-544/$03.00

Salt Wash DFS
The Morrison Formation was deposited across the western interior ofthe United States and southern Canada during the Late Jurassic (Turnerand Peterson 2004), when the eastward-dipping paleo-Pacific oceanicplate was subducting beneath the continental northwestward-propagatingNorth American plate (Decelles 2004; Turner and Peterson 2004). Anorthogonal compressional regime was present in the northern portion ofthe margin, resulting in crustal shortening and formation of the SevierHighlands (Decelles 2004). A nearly parallel compressional regime waspresent in the southwest portion of the margin which resulted in theformation of a sinistral strike-slip intracontinental rift, the Bisbee–McCoy Basin (Dickinson and Lawton 2001b; Spencer et al. 2011), andthe formation of elevated rift shoulders, including the MogollonHighlands, which bounded the southern edge of the Morrison deposi-tional basin (Dickinson and Lawton 2001b; Decelles 2004; Turner andPeterson 2004).
The timing of thrusting is debated (Turner and Peterson 2004). It hasbeen argued (Decelles and Burden 1991; Decelles and Currie 1996; Currie1997, 1998), that deposition occurred in a foreland basin or in the back-bulge of an overfilled foreland basin. The latter requires the presence ofa foredeep, which cross sections in Royse (1993) demonstrate as plausible.Forebulge migration and flexural and regional dynamic subsidence aredrivers for subsidence and accommodation in this case (Currie 1997,1998; Decelles 2004). Heller et al. (1986), Lawton (1994), and Decelles etal. (1995) argue that significant thrusting, and therefore foreland-basindevelopment, did not occur until the Early Cretaceous. Heller et al. (1986)suggest that accommodation for Morrison deposits was created throughregional tectonothermal subsidence and hypothesize that this was theresult of a Middle Jurassic thermal metamorphic event and/or thrustingto the west of the Sevier thrust sheet. Dickinson and Lawton (2001a)argue that the subduction of the Farallon Plate could have played a far-field role in creating subsidence for Morrison deposits.
The Salt Wash Member of the Morrison Formation extends acrosscentral Utah, west-central Colorado, northeast Arizona, and northwest-ern New Mexico (Fig. 1) (Craig et al. 1955; Mullens and Freeman 1957).
It is composed of fluvial channel deposits interbedded with floodplaindeposits (Craig et al. 1955; Mullens and Freeman 1957; Tyler andEthridge 1983; Peterson 1980, 1984, 1988; Robinson and McCabe 1997,1998; Turner and Peterson 2004; Kjemperud et al. 2008; Weissmann et al.2013). It has been described as a fan-shaped fluvial deposit (Craig et al.1955; Mullens and Freeman 1957), which data from this study support(Fig. 1), which helps define proximal, medial, and distal domains. We usethe lithostratigraphic definition of Mullens and Freeman (1957) to definethe areal limits of the Salt Wash Member in this study (Fig. 1).
Peterson (1980, 1984), Kjemperud et al. (2008), and Weissmann et al.(2013) suggest that the Salt Wash fluvial system prograded into itssedimentary basin. Distal facies of the Tidwell Member (composed ofminor fluvial, mudflat, and lacustrine facies), typically underlie the moreproximal facies of the Salt Wash Member (composed of large-scale fluvialchannels and associated floodplain deposits). These two memberstogether comprise the ‘‘Salt Wash DFS’’ defined in this study (Fig. 1),representing deposition from a single fluvial system. A genetic rather thana lithostratigraphic approach is taken to ensure that the focus is on thedistribution of facies across a single depositional system as opposed toa lithostratigraphic unit which may contain several different individualsystems or represent only part of a system.
The regionally extensive J5 unconformity of Pipiringos and O’Sullivan(1978) defines the contact between the base of the Morrison andformations below (Fig. 1). The J5 is both a conformable and anunconformable contact (Cadigan 1967) and has a relatively low relief(Pipiringos and O’Sullivan 1978). In areas where a conformable contact ispresent, depicting the boundary between the Summerville (topmoststratigraphic unit in the San Rafael Group) and Morrison Formation isdifficult due to the gradational contact. The Summerville Formation(Fig. 1), was deposited in a shallow-water hypersaline environment as theWestern Interior Seaway retreated (Peterson 1988). The base of the SaltWash DFS in this study is therefore defined as the first point at whichtrue fluvial deposits are recognized. Peterson (1980) defines the top of theSalt Wash Member as the topmost appreciable sandstone body in whicha significant amount of mudstone was not present beneath channel
FIG. 1.—A) Location map of the Salt Wash fluvial system. Location map of the Salt Wash fluvial system. Apex position defined by Owen et al. (2015). B) Stratigraphyof the study area.
QUANTIFICATION OF THE SALT WASH DFS 545J S R

deposits. The transition from the Salt Wash to the overlying Brushy BasinMember can be ambiguous (Peterson 1988), particularly in the distalportions. The identification by Demko (2004) of the mid-Morrisonpaleosol unconformity (which separates the Salt Wash and Brushy Basinmembers), and a change in mudstone color from red to green-graybetween the Salt Wash and Brushy Basin members (Fig. 2), helps definethe top of Salt Wash deposits. However, Salt Wash facies can be aboveDemko’s paleosol, making the contact diachronous in places (Kjemperudet al. 2008). We speculate that the Brushy Basin Member may also bea DFS; but a regional study is needed to test this hypothesis and is thusbeyond the scope of this work. Material that can be radiometrically datedis largely absent in the Salt Wash Member. However, dates obtained fromthe base of the Tidwell (154.75 6 0.54 Ma, 154.82 6 0.58 Ma, 154 6 1.4Ma) and the top of the Brushy Basin (148.1 6 0.5 Ma) by Kowallis et al.(1998) indicate seven million years of deposition for the MorrisonFormation. Unfortunately, sections studied are unable to be tied togetherdue to the lack of marker beds. The Salt Wash DFS is thereforeconsidered as one depositional unit, but it is not implied that depositswere coeval within the system, and it is more likely that deposition tookplace within a series of DFS lobes through time.
The apex for the Salt Wash DFS has been predicted using a statisticalprojection of paleocurrent data (Fig. 1; Owen et al. 2015). Owen et al.(2015) use a methodology based on the von Mises distribution and themethod of maximum likelihood to obtain an estimated apex andassociated confidence regions for the system. The authors determinedthat the apex of this DFS was located in northeastern Arizona (Fig. 1)and suggest the Salt Wash DFS was likely sourced from the Mogollon–Sevier Highlands syntaxis or solely from the western portion of MogollonHighlands, in north-central Arizona. This is supported by provenancestudies conducted by Dickinson and Gehrels (2008), who use U-Pbdetrital zircon data to show that the Salt Wash could have been eitherpartly or wholly sourced from the Mogollon Highlands.
The termination type (Hartley et al. 2010) for the Salt Wash DFS is notfully understood due to exposure limitations; however, Dunagan andTurner (2004) state that the Salt Wash DFS eventually grades laterallyinto a wetland environment. Hartley et al. (2010) define the toe of a DFSas the most distal point at which a fluvial planform is defined. Distalcharacteristics displayed at South Canyon (Fig. 1 for location), corre-spond to the criteria given by Hartley et al. (2010) due to the scarcity ofsimple, small-scale fluvial channel bodies (documented below). SouthCanyon is tentatively considered to be the toe of the DFS, as we assumethat substantial facies variations do not occur beyond this point. This is
considered to be a reasonable assumption based on the downstreamtrends documented in this paper. This gives the Salt Wash DFSa potential apex-to-toe length of approximately 550 km and an arealextent of approximately 100,000 km2.
DATA AND METHODS
Distributive fluvial systems are defined by: 1) channel patterns thatradiate away from an apex; 2) a decrease in channel size and abundancedownstream; 3) an increase in preservation of floodplain deposits relativeto channel deposits downstream; 4) a decrease in grain size downstream;and 5) a change from amalgamated channel deposits in proximal areas tosmaller fixed channels in distal areas (Friend and Moody-Stuart 1972;Friend 1978; Nichols 1987; Hirst 1991; Stanistreet and McCarthy 1993;Nichols and Fisher 2007; Cain and Mountney 2009; Hartley et al. 2010;Weissmann et al. 2010; 2013).
In this study these parameters are calculated from sedimentary logsmeasured in 26 locations. Sites were selected based on exposure quality andto ensure a good areal coverage across the exposed DFS (Fig. 1). The overallthickness of the DFS deposit, sand-to-mud ratio, grain size, and average bedthickness of each facies association are measured at each locality. Whencalculating the sand-to-mud ratio, covered sections are assumed to be mud,and therefore presented statistics are underestimates. This is a reasonableassumption, inasmuch as the exposure style causes mud-dominatedintervals to be less well exposed than sandier intervals. Cited trends forisolated channels may also be underestimated due to exposure style, whereaschannel-belt elements are considered to be accurate because they formdistinct ledges at outcrop. Sites with less than 50% exposure (6 out of 26locations) are shown in gray on all maps. This is not envisaged to affecttrends cited within this paper, in that the vast majority of sites have exposurethat is considered to be representative of the fluvial system.
Calculations of average bed thickness and grain size were conductedonly on beds that were exposed, because it is not possible to specifya grain size or bed thickness for covered sections. For the amalgamated-channel-belt facies association the mean thickness of channel belts andstories were calculated. Datasets for the channel-belt, isolated-channel-fill, and lacustrine facies do not show any trends in a distribution analysis.However, floodplain datasets do show a negative skew, and it should benoted that the derived bed thickness means are less meaningful whenconcerned with floodplain analysis. Average grain size is calculated byconverting Wentworth class nomenclature to phi (w). Averages are thencalculated and weighted according to thickness within each succession to
FIG. 2.—Outcrop photo of Little Park (distalDFS) demonstrating the color change betweenthe Salt Wash and Brushy Basin members.
546 A. OWEN ET AL. J S R

ensure a fair statistical representation. Architectural style is documentedin a qualitative manner because a suitable quantified methodology wasnot established. Facies associations, as defined by Collinson (1969), asopposed to lithofacies (Reading and Lovell 1996), were analyzed becausethey were deemed to be the most appropriate for a system-scale study,and are more comparable to modern datasets. A study on differentialcompaction conducted by Peterson (1984), estimated from contortedsandstone-filled desiccation cracks in mudstone beds, shows thatapproximately 23% compaction of mudstone with respect to sandstoneoccurred. Although significant, this amount is not considered to affectgeneral trends within the data presented here; statistics stated heretherefore do not take compaction into consideration and are calculatedfrom outcrop data directly.
Measured parameters were plotted onto graphs and maps fora quantified spatial analysis. Because the positions of the apex and toeare approximately constrained, the distance downstream, both inabsolute distance and percentage downstream, can be calculated. Thesetwo criteria form the horizontal axis on the graphs and allow the positionof locations to be put into a system-scale context.
Regression analysis of each parameter relative to position on the DFSrefines the significance of observed trends. Because none of the datasetsshowed evidence for autocorrelation, i.e., whether the values weredependent on one another (also known as serial correlation andautocovariance), the Spearman’s rank correlation coefficient for mono-tonic trends (r) (Davis 2002) was used to indicate the presence andstrength of observed trends. A critical value (CV) was calculated to definea correlation coefficient value, indicating the likelihood of resultsoccurring by chance (Davis 2002). Results that have a CV value less than0.05 indicate a less than 5% chance that the trends occurred by chance.
Parameter trends with less statistical significance in some cases stillappeared to have defined spatial patterns on graphs and maps. In some ofthese cases we infer these patterns to be significant even though they did notchange in a linear way with distance along the DFS. Contour maps weredrawn manually, because computer-generated contour maps were found tobe geologically unrealistic and varied depending on the algorithm used.Original data are in the JSR Data Archive (see Supplemental Material).
RESULTS
Descriptions of Facies Associations
Four broad facies associations were identified from sedimentary logs: 1)amalgamated channel-belt (Fig. 3A), 2) isolated channel-fill (Fig. 3B), 3)floodplain (Fig. 4A), and 4) shallow-ephemeral-lake facies associations.
Amalgamated-Channel-Belt Facies Association.—The amalgamated-channel-belt facies association is composed of fine-grained to pebbly,cross-bedded sandstones. The presence of trough and planar crossbedding, current ripples, trace fossils that are indicative of terrestrialfluvial environments (sauropod tracks, Camborygma, and Staphylinidaeburrows amongst others (Hasiotis 2004)), and paleosols, above and belowthe deposits, collectively imply deposition in a fluvial channel environment(e.g., Miall 1978; Walker and Cant 1984; Robinson and McCabe 1998;Nichols and Cantrill 2002; Bridge 2003; Cain and Mountney 2009).Accretion surfaces, which define deposits of bar features, are present andrange in thickness from 1 to 2.5 m, dip between 5 and 30 degrees, and oftenlie above erosional surfaces that are not laterally persistent. Downstreamaccretion surfaces are inferred when cross-bedding dips in the sameorientation as the accretion surfaces, and lateral-accretion surfaces areinferred when cross-bedding dips obliquely to accretion surfaces.
The deposits form large-scale sheet complexes (up to 26 m thick andgreater than 10 km wide) (Fig. 3A) within which one to four stories areobserved (see Fig. 5 for example log). Story surfaces represent erosionevents where the once-active river has eroded into previous channel
deposits. A high degree of paleocurrent variability (up to 100u) issometimes observed between stories, and in such cases when lateral-accretion deposits are also observed, a sinuous planform can be inferred.When the edge of the sheet complex could be observed, a gradualthinning is noted. The deposits are generally poorly sorted and often havemud- and pebble-size clasts lining the base of story, bar, and trough setsurfaces (Figs 3, 5). These characteristics, coupled with the presence ofhorizontal lamination, mud and sand drapes, and irregular cross-beddingthickness collectively imply that this facies was deposited from rivers thatexperienced a seasonally flashy discharge (Miall 1977, 1978; Stear 1985;Lorenz and Nadon 2002), a view mirrored by Robinson and McCabe(1998), Good (2004), and Turner and Peterson (2004). The lateral andvertical amalgamation of stories records the lateral migration of riversand juxtaposition of their deposits over time (Friend et al. 1979; Gibling2006). The juxtaposition of deposits appears to be random in most cases,with only isolated cases showing a systematic migration in one direction.Paleocurrents from the amalgamated-channel-belt facies associationdemonstrate a radial pattern in a northeast to east direction (Fig. 1).
Many have suggested that the Salt Wash DFS was deposited froma dominantly braided fluvial system (Peterson 1977; Tyler and Ethridge1983; Peterson 1984; Robinson and McCabe 1998), an interpretation thathas been based largely on the sand-rich, highly reworked nature of thedeposits. Our system-wide study has identified both downstreamaccretion- and lateral-accretion elements throughout the system, as wellas scroll bars in planform, an example of which can be seen in Figure 3Afrom the proximal to medial portion of the system. This implies thata mixed meandering to braided planform existed. Meandering elements,either minor or large, have been previously noted in various parts of thesystem by Fischer and Hilpert (1952), Stokes (1954), Peterson (1977),LeBaron (1980), Peterson (1984), and more recently Holzweber (2013)and Owen (2014). We suggest that the previous emphasis on interpreta-tions as braided stream deposits is misplaced, a viewpoint shared byEthridge et al. (1980), and we interpret the sandy characteristics to bea function of the low accommodation/sediment supply (A/S) regime thatpersisted in the basin, a view echoed by Kjemperud et al. (2008).Amalgamated channel-belt deposits constitute 37% of all sections logged.
Isolated-Channel-Fill Facies Association.—These are simple lens-shapedsandstones, with a clear channel geometry in cross section and sandywings in the adjacent overbank successions (Fig. 3B). Erosional bases andsimple, single-story sandy fills that range in grain size from fine sand togranules are common. Occasional mud plug fills are also observed(Fig. 3B). These characteristics suggest deposition from a fixed fluvialchannel in which little lateral migration occurred (Friend et al. 1979;Friend 1983; Hirst 1991; Gibling 2006). Such deposits are alternativelyreferred to as ribbon or fixed channels (Friend et al. 1979; Friend 1983;Gibling 2006). This facies association ranges from 5 cm to 4.7 m thick andcan extend laterally for up to 400 m. Either asymmetric (Fig. 3B) orsymmetric channel forms are observed. Asymmetric channels aregenerally regarded to represent deposition within a fixed sinuous channel(e.g., Leopold and Wolman 1960; Miall 1996; Jobe et al. 2010), whereassymmetric channels are considered to represent relatively straight reachesof a fixed channel (Pyles et al. 2010), although asymmetric channels canalso form in straight reaches (Bridge 2003).
Ribbon-shaped channel-fill bodies have already been noted byKjemperud et al. (2008) in Salt Wash deposits around Capitol ReefNational Park, Utah. Kjemperud et al. (2008) term the deposits ‘‘steer-head channels’’ and interpret them as being distributary channels thatdrain into floodplain lakes and wetland systems. In this study, isolatedchannel-fill deposits are found throughout vertical successions across thewhole system with no apparent relation to lacustrine deposits, but theyare more commonly associated with floodplain deposits (Fig. 5). Theisolated-channel-fill facies association has a less consistent paleocurrent
QUANTIFICATION OF THE SALT WASH DFS 547J S R

pattern than the channel-belt facies association (Fig. 1), but a broadnortheasterly flow direction can still be seen. When data are available forboth facies associations, four out of eleven locations have a paleocurrentdirection that is within 10 degrees of each other. Those that are not within10 degrees of the channel-belt facies deviate away from the main trunkchannel. These data suggests that the isolated-channel-fill faciesassociation are splay and/or smaller distributary channels (relationshipconceptualized in Fig. 3C), but differ in that they are fixed channels thatshow no evidence for lateral migration. The deposits are not considered tobe from anastomosing channels, because no more than one isolatedchannel-fill was found within each stratigraphic horizon when extensive(1 km) exposure was available. Isolated-channel-fill deposits constitute4% the Salt Wash DFS deposits.
Floodplain Facies Association.—The floodplain facies association iscomposed of interbedded sandstones and mudstones. The beds arecommonly tabular but can often have an undulating form (Fig. 4A).
Packages of floodplain deposits can be either mud- or sand-dominated(Fig. 4A). This can be related to proximity to a channel (Pizzuto 1987;Guccione 1993), to flood magnitude, or to sediment supply. Root traces,rhizoliths (rhizoconcretions), nodules, and color mottling help determinethe presence of paleosols. Two broad types of palesols are observed in thesuccession; red, to red-brown well-drained argillic calcisols and green-gray poorly drained protosols (Fig. 4). Burrows, dinoturbation, rootlets,and tree stumps were observed in the deposits. Collectively these featuresindicate deposition in a vegetated floodplain environment. Comprehen-sive reviews of paleosols and ichnofossils found in Salt Wash deposits arefound in Demko et al. (2004) and Hasiotis (2004). Floodplain depositsconstitute 57% of the Salt Wash DFS deposits logged. This calculationincludes sections that are inferred to be floodplain based on outcrop style,and therefore may overestimate the actual percentage.
Shallow-Ephemeral-Lake Facies Association.—All beds of this faciesassociation have a tabular to undulating geometry, are no thicker than 2.9
FIG. 3.—Example images. A) Amalgamated-channel-belt facies association. Various images show the characteristics of the channel belt deposits at a variety of scales.Scroll-bar deposit shown in satellite imagery is located in the proximal to medial portion of the system and is typical of scroll-bar deposits in the Salt Wash. Storythickness in the scroll bars typically ranges from 4 to 7 m. B) Isolated-channel-fill facies association. Example image of an isolated channel-fill taken from Hanksville(proximal to medial DFS). C) Schematic representation of isolated-channel deposits to channel-belt deposits. Satellite image from the Gilbert DFS, Australia. Satelliteimages taken from Google Earth (2014).
548 A. OWEN ET AL. J S R
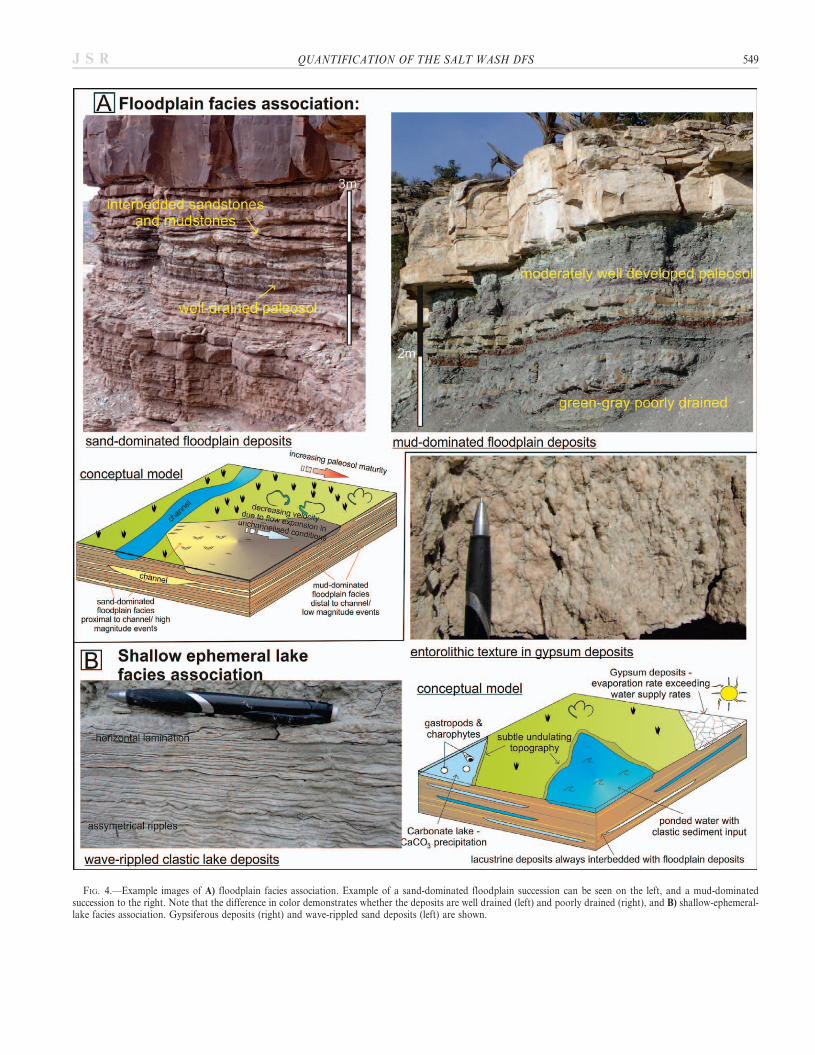
FIG. 4.—Example images of A) floodplain facies association. Example of a sand-dominated floodplain succession can be seen on the left, and a mud-dominatedsuccession to the right. Note that the difference in color demonstrates whether the deposits are well drained (left) and poorly drained (right), and B) shallow-ephemeral-lake facies association. Gypsiferous deposits (right) and wave-rippled sand deposits (left) are shown.
QUANTIFICATION OF THE SALT WASH DFS 549J S R

m, and do not exceed 1 km in lateral extent, indicating they were minorelements on the Salt Wash landscape (constituting 3% of the Salt WashDFS deposits). Three different types of ephemeral-lake deposits arepresent in the Salt Wash DFS. Gypsiferous lake deposits consists solely ofgypsum deposits that have an enterolithic or bladed texture (Fig. 4B)(Warren 1999), and represent periods in which evaporation rates exceededwater recharge rates. Carbonate lake deposits are generally fine grained(wackestone) and have good preservation of gastropods and charophytesindicating a low-energy fresh-water environment. Clastic ephemeral lakedeposits are composed predominantly of horizontally laminated mudsand wave-rippled sandstones (Fig. 4B). This, coupled with the presence ofSteinichnus and Cochlinus burrows, indicates deposition in a shallowlacustrine environment in which there was clastic input (Hesse andReading 1978; Talbot and Allen 1996; Hasiotis 2004).
This facies association is commonly interbedded with the floodplainfacies association (Fig. 5). This relationship, along with the presence ofmudcracks in some beds, indicates that the lakes were not permanentfeatures on the landscape, appearing only during wetter periods
(Rogers and Astin 1991). It is likely that the standing bodies of waterformed within depressions on the floodplain in which floodwaterscollected and ponded before subsequently drying out. This, coupled witha flashy discharge regime, suggests the Salt Wash DFS was depositedunder a semiarid climate that had seasonal precipitation. Turner andPeterson (2004) share this view and state that the Morrison Formationhad a climate that is similar to a modern African savannah. Depositsare found primarily at the bases of successions in the Tidwell Member,and only rarely in the overlying more proximal Salt WashMember. Lacustrine deposits within the Salt Wash are also noted byPeterson (1980, 1984), Tyler and Ethridge (1983), and Kjemperud et al.(2008).
Architecture
The architecture of the Salt Wash DFS varies greatly across the system.In the most proximal sections studied, such as Bullfrog (Fig. 6A), theoutcrops are composed of laterally extensive highly amalgamated channelsheet sandstones. The sandstone complexes can be traced . 10 kmlaterally and display a high degree of amalgamation. Connectivitybetween the sandstone bodies is clear, where approximately 80 to 90% ofchannel bodies amalgamate and connect, with floodplain depositsforming only intermittent pockets due to crosscutting fluvial channels.These characteristics suggest a regime with a low ratio of accommodationto sediment supply in an environment in which channels were mobile(Weissmann et al. 2013).
In the medial portion of the system, channel sandstone bodies are lessamalgamated and organized into distinct channel-belt packages, separat-ed by floodplain deposits (Fig. 6B). Channel complexes are laterallyextensive (. 1 km lateral extent) and connect and amalgamate in places(approximately 20% of channels amalgamate and connect) (Fig. 6B),implying that a degree of connectivity is still present between thesandstone bodies. A regime with a higher ratio of accommodation tosediment supply is inferred in the medial domain (Weissmann et al. 2013),where the channel deposits are less mobile, allowing floodplain depositsto be better preserved (Fig. 6).
Deposits exposed in the distal domain, (e.g., Smith Fork, Fig. 6C), arecharacterized by isolated channel deposits in a floodplain-dominatedsuccession. No apparent amalgamation or connectivity was observedbetween sandstone bodies. A regime with a high ratio of accommodationto sediment supply is inferred, with little evidence of lateral migration orreworking by the channels.
Salt Wash DFS Sand:Mud Ratio
A clear downstream and radial decrease in sandstone proportion isobserved (Fig. 7A, B). Highest sandstone percentages occur in the mostproximal regions, such as at Fifty Mile Point (70%) and Bullfrog (75%).The lowest sand percentages are present in the most distal area, such as atBlue Mesa Reservoir (8%) and South Canyon (26%). Slick Rock hasa higher sand percentage (71%) than surrounding sites (Fig. 7A), makingit anomalous to the general trend. Vernal (50%) is also anomalous to thegeneral trend.
Thickness of the Salt Wash DFS
The thickest portion of the Salt Wash DFS (174 m thick at Fifty MilePoint), defined as the observed thickness from the J5 unconformity to thetop of the Salt Wash Sandstone, is in the relatively proximal southwesternpart of the system. The system thins to the northeast, with the thinnestsuccession exposed at South Canyon (40 m thick), the most distal sectionstudied (Fig. 7C). If a relatively flat basal topography and uniformsubsidence is assumed, it can be inferred that the Salt Wash DFS hada convex-upward profile. Alternatively, an area of depression or increased
FIG. 5.—Example sedimentary log from Atkinson Creek demonstrating typicalrelationships between each facies association.
550 A. OWEN ET AL. J S R

FIG
.6.
—A
rch
itec
ture
pan
els
of
thre
elo
cati
on
sac
ross
the
DF
S.
No
teth
ech
ange
inar
chit
ectu
red
ow
nst
ream
fro
mam
alga
mat
ed-c
han
nel
shee
td
epo
sits
tois
ola
ted
-ch
ann
eld
epo
sits
ina
mu
d-d
om
inat
edsu
cces
sio
n.
A)
Pan
elo
fB
ull
fro
g.B
)P
anel
of
Atk
inso
nC
reek
.C
)P
anel
of
Sm
ith
Fo
rk.
D)
Lo
cati
on
map
hig
hli
ghti
ng
the
po
siti
on
of
pan
els
A–C
on
the
DF
S.
See
text
for
exp
lan
atio
no
fk
eych
arac
teri
stic
so
fea
chsi
te.
QUANTIFICATION OF THE SALT WASH DFS 551J S R
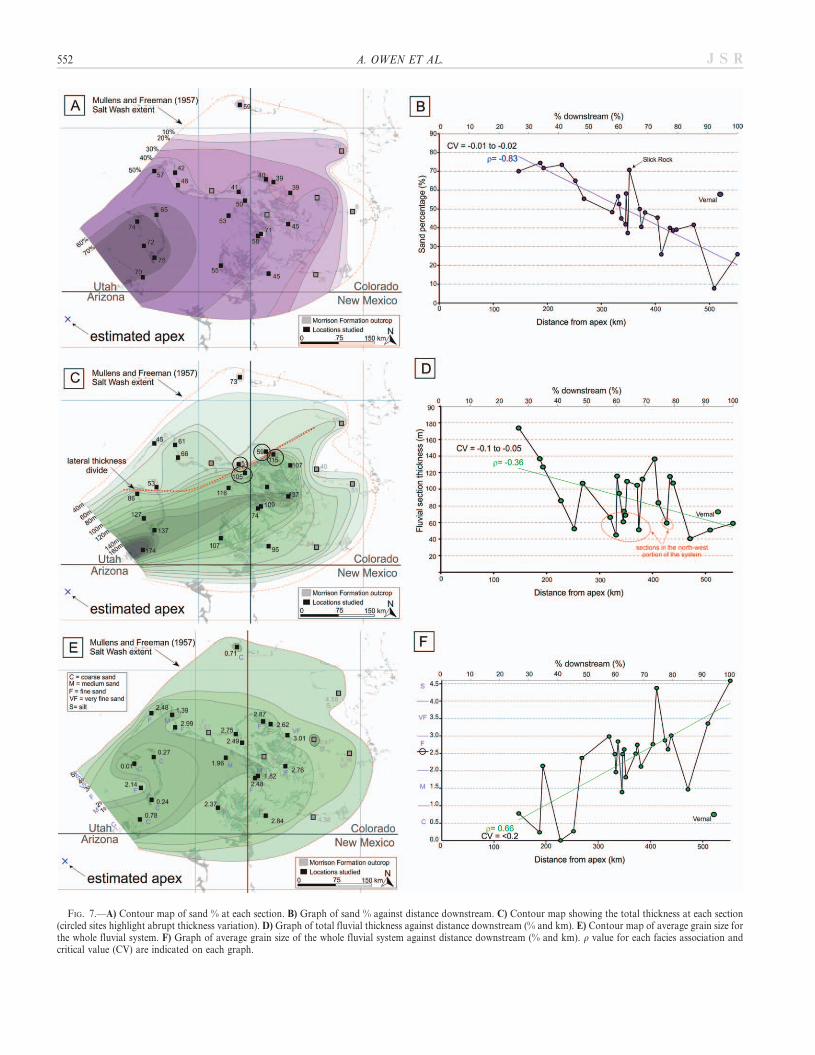
FIG. 7.—A) Contour map of sand % at each section. B) Graph of sand % against distance downstream. C) Contour map showing the total thickness at each section(circled sites highlight abrupt thickness variation). D) Graph of total fluvial thickness against distance downstream (% and km). E) Contour map of average grain size forthe whole fluvial system. F) Graph of average grain size of the whole fluvial system against distance downstream (% and km). r value for each facies association andcritical value (CV) are indicated on each graph.
552 A. OWEN ET AL. J S R

subsidence rate can be assumed in the center and proximal portion of thesystem (alternatives that are not mutually exclusive). Compaction isdeemed to have a relatively minor influence on the deposits, based ona study by Peterson (1984), who noted that isopach thickness maps do notchange significantly when compaction is taken into consideration.
A relatively abrupt thinning is recognized laterally across the systemfrom the southeast to the northwestern portion (Fig. 7C). For example,the fluvial section is 51 m thick at Dewey, yet 22 km away at Polar Mesathe system it is 105 m thick. The fluvial system thickens from ColoradoNational Monument (59 m thick) to Little Park (115 m thick), 11 kmaway (Fig. 7C). The weak negative relationship between DFS thicknessand distance downstream (Fig. 7D), despite obvious mapped thicknesspatterns (Fig. 7C), reflects pronounced lateral thickness variability,particularly in the medial sections (i.e., jagged pattern circled in Fig. 7D).A more significant r value of –0.56, calculated when data points from thenorthwest are removed, indicates a stronger downstream correlation.Possible causes for the thickness variation are discussed later. Thethickness divide is also observed in maps presented in Craig et al. (1955)for the Dewey to Grand Junction area, but it is not found on maps inMullens and Freeman (1957), where a coarser contour interval of 100 ft(approximately equal to 30 m) masks this variation. Vernal is againanomalous to the general trend.
Salt Wash DFS Grain Size
The average grain size generally decreases down DFS, with the coarsestsuccessions commonly found in the most proximal regions and the finestin the distal region (Fig. 7E, F). A few exceptions fall off this trend; SmithFork has slightly coarser deposits (medium sand) in an area in whichdeposits average very fine sand. We speculate that sediment bypass toSmith Fork may have resulted in the coarser average grain size. HallsCreek has a finer grain size (fine sand) in an area dominated by coarsesand, which might be attributed to a higher degree of reworking, ordelivery of finer sediment at this location. Downstream fining is alsoevident with distance along the DFS (Fig. 7F), despite local anomalies.This is interpreted to reflect a decrease in transport capacity downstreamas a result of lateral expansion of the river into the sedimentary basin.Channel bifurcation, infiltration, and evaporation may have furthercontributed to a decrease in transport capacity (Nichols and Fisher 2007;Weissmann et al. 2010, 2013).
Analysis of Facies Associations
Analysis of Facies Percentage.—Strong downstream trends and radialcontour patterns are observed in the relative abundance of amalgamated-channel-belt (Fig. 8A), floodplain (Fig. 8C), and shallow-ephemeral-lake(Fig. 8D) facies associations. Vernal is anomalous in all criteriaevaluated.
The statistically strongest downstream trend is observed in theamalgamated-channel-belt facies association dataset, with the highestpercentages observed in the most proximal areas, e.g., Bullfrog (67%) andFifty Mile Point (61%) (Fig. 8A). Downstream, the amalgamated-channel-belt facies association becomes less dominant, constituting only17% of the succession at Smith Fork, 16% of the succession at ColoradoNational Monument, and is entirely absent at the most distal localities(South Canyon and Blue Mesa Reservoir) (Fig. 8A). A strong negativecorrelation is evident when the data are plotted onto a scatter graph(Fig. 8E). A downstream decrease in energy, infiltration of water andchannel bifurcation are considered to be the causal mechanisms behindthe trends observed.
A strong positive correlation is observed for the floodplain faciesassociation (Fig. 8E). The lowest values are present in the most proximalareas (30% at Bullfrog, 33% at Caineville, and 38% at Fifty Mile Point),
with the floodplain facies association dominating successions fartherdownstream (78% at Colorado National Monument; 82% at SouthCanyon and 94% at Blue Mesa Reservoir) (Fig. 8C).
A downstream increase is also observed in the shallow-ephemeral-lakefacies association dataset (Fig. 8D), but to a lesser degree. No lacustrinedeposits are observed in the center of the medial area, but towards theperiphery of the system an increase is observed in all directions, i.e., 4.%at Buckhorn Flat, 7% at South Canyon, 3% at Durango, and 3% at HallsCreek. Overprinting this trend is a general downstream increase in values,with higher percentages generally present in the distal area (i.e., 22% atDominguez Canyon and 6% at Smith Fork) and relatively lowpercentages in the most proximal area studied (i.e., , 1% at Fifty MilePoint and 2% at Bullfrog). The combination of the two patterns hasresulted in a relatively flat positive trend line (Fig. 8E).
The low proportion of floodplain and ephemeral-lake facies associa-tions in the proximal area is largely a function of preservation potentialcoupled with a decrease in energy downstream. It is evident from satelliteimagery of modern DFSs that low-energy geomorphic elements (i.e.,floodplain deposits) are not absent from proximal regions. However, theyare not commonly observed in proximal deposits in the geologic recorddue to the high degree of channel migration and reworking (Cain andMountney 2011; Weissmann et al. 2013). Downstream, a decrease inenergy as a result of channel bifurcation, infiltration, and evapotranspi-ration, along with the increasing depositional area due to increasing widthof the DFS downfan, and an increase in the A/S regime, allows lower-energy environments to be better preserved. We speculate that the lack oflacustrine deposits in the medial portion of the system may be a functionof the convex-upwards profile of the fan or a function of a low A/S regimein the center of the DFS.
The isolated-channel-fill facies association displays the weakeststatistical trends. A weak downstream increase may be present becausea cluster of lower values is present in the relatively proximal and medialareas (0.8% at Fifty Mile Point, 1.8% at Bullfrog, 0.6% at Salt Valley, and1.8% at Atkinson Creek) and a cluster of higher values in the distal area(18.1% at Smith Fork, 9.9% at Little Park, and 10.8% at South Canyon)(Fig. 8B). However, high, or low, values are not exclusive to anyparticular area of the system, as is evident by a relatively flat lineartrendline in Figure 8E. These data suggest no downstream controls on thepresence of the isolated-channel-fill facies association. It is possible thatthe isolated channel form appears to be more prevalent downstreamon DFS due to it becoming the dominant fluvial form, as opposed toactually increasing in presence, since amalgamated channel-beltsdiminish downstream. This is evident in data presented in Hirst (1991)from the Huesca DFS, with the proportion of ribbon sandstonerelative to the total number of channel sandstone bodies increasingsignificantly beyond 45 km downstream (approximately equal to 65%downstream).
Analysis of Average Thickness.—Only moderate to weak trends areobserved when the average thickness of each facies association isplotted against distance downstream (Fig. 9). Statistically the strongesttrend is observed in the amalgamated-channel-belt facies associationdataset. Broadly speaking, a crude downstream decrease in averagethickness is observed when analyzing both the average belt and storythickness, with thinner averages generally, although not exclusively,observed in distal areas. Importantly, thin channels are also present in theproximal region, as is evident in the range of thicknesses recorded(Fig. 9A). The range of thicknesses recorded for the amalgamated-channel-belt facies association does not substantially differ downstream,with only a weak decrease observed as large ranges are absent . 350 kmdownstream (Fig. 9A).
The data suggest that the Salt Wash channels decrease in sizedownstream, but maybe not as strongly as one might have expected, in
QUANTIFICATION OF THE SALT WASH DFS 553J S R

FIG. 8.—Contour maps showing the percentage that each facies constitutes of the whole fluvial section at each locality. A) Amalgamated-channel-belt faciesassociation. B) Isolated-channel-fill facies association. C) Floodplain facies association. D) Shallow-ephemeral-lake facies association. E) Graph of facies percentageagainst distance downstream (% and km). r value for each facies association and critical value (CV) are indicated on the graph.
554 A. OWEN ET AL. J S R
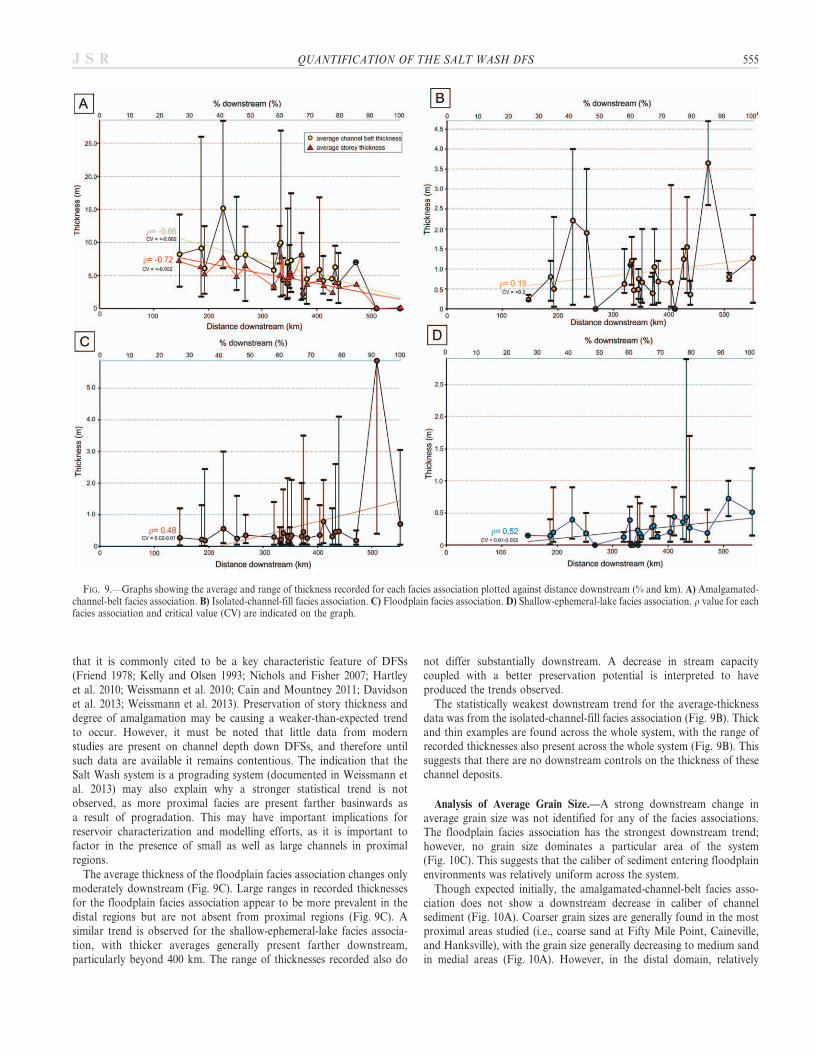
that it is commonly cited to be a key characteristic feature of DFSs(Friend 1978; Kelly and Olsen 1993; Nichols and Fisher 2007; Hartleyet al. 2010; Weissmann et al. 2010; Cain and Mountney 2011; Davidsonet al. 2013; Weissmann et al. 2013). Preservation of story thickness anddegree of amalgamation may be causing a weaker-than-expected trendto occur. However, it must be noted that little data from modernstudies are present on channel depth down DFSs, and therefore untilsuch data are available it remains contentious. The indication that theSalt Wash system is a prograding system (documented in Weissmann etal. 2013) may also explain why a stronger statistical trend is notobserved, as more proximal facies are present farther basinwards asa result of progradation. This may have important implications forreservoir characterization and modelling efforts, as it is important tofactor in the presence of small as well as large channels in proximalregions.
The average thickness of the floodplain facies association changes onlymoderately downstream (Fig. 9C). Large ranges in recorded thicknessesfor the floodplain facies association appear to be more prevalent in thedistal regions but are not absent from proximal regions (Fig. 9C). Asimilar trend is observed for the shallow-ephemeral-lake facies associa-tion, with thicker averages generally present farther downstream,particularly beyond 400 km. The range of thicknesses recorded also do
not differ substantially downstream. A decrease in stream capacitycoupled with a better preservation potential is interpreted to haveproduced the trends observed.
The statistically weakest downstream trend for the average-thicknessdata was from the isolated-channel-fill facies association (Fig. 9B). Thickand thin examples are found across the whole system, with the range ofrecorded thicknesses also present across the whole system (Fig. 9B). Thissuggests that there are no downstream controls on the thickness of thesechannel deposits.
Analysis of Average Grain Size.—A strong downstream change inaverage grain size was not identified for any of the facies associations.The floodplain facies association has the strongest downstream trend;however, no grain size dominates a particular area of the system(Fig. 10C). This suggests that the caliber of sediment entering floodplainenvironments was relatively uniform across the system.
Though expected initially, the amalgamated-channel-belt facies asso-ciation does not show a downstream decrease in caliber of channelsediment (Fig. 10A). Coarser grain sizes are generally found in the mostproximal areas studied (i.e., coarse sand at Fifty Mile Point, Caineville,and Hanksville), with the grain size generally decreasing to medium sandin medial areas (Fig. 10A). However, in the distal domain, relatively
FIG. 9.—Graphs showing the average and range of thickness recorded for each facies association plotted against distance downstream (% and km). A) Amalgamated-channel-belt facies association. B) Isolated-channel-fill facies association. C) Floodplain facies association. D) Shallow-ephemeral-lake facies association. r value for eachfacies association and critical value (CV) are indicated on the graph.
QUANTIFICATION OF THE SALT WASH DFS 555J S R

coarse grain sizes are also present (Fig. 10A). Turner and Peterson (2004)noted that the Ancestral Rockies, located in central Colorado, provideddistinct angular chert to the Morrison Basin in the eastern Front Rangefoothills. Paleocurrent data presented in this study (Fig. 1) and Owen etal. (2015) do not support this inasmuch as paleoflow is shown to be goingeast towards the ancestral Rockies, as opposed to west and away fromthem. A petrographic analysis conducted by Owen (2014) also discountsthis view, in that a change in composition was not found.
As noted by Shukla et al. (2001), flow competency and sediment supplycontrol the distribution of grain sizes in a channel. A decrease in flowcompetency and deposition of coarse sediment in proximal areas explainsthe initial downstream decrease. A hypothesis of sediment bypass hasbeen used by other authors (Evoy et al. 1997; Nemec and Postma 1993;Parsons et al. 2012) to explain sediment distribution patterns in a range ofenvironments, and is a favorable explanation for the unusual grain-sizetrends observed in the Salt Wash DFS.
Mixtures of medium and fine sand are found across the system for theisolated-channel-fill dataset (Fig. 10D), suggesting that grain size variedwithin the fixed channel environments.
DISCUSSION
Paleogeographic Implications for the Salt Wash System
Due to the lack of correlative markers it cannot be proved thatchannels measured are coeval. However, the described down-systemtrends suggest that the Salt Wash fluvial system was a distributive fluvialsystem. A radial paleocurrent (Fig. 1), downstream decrease in sandpercentage and overall system grain size, decrease in thickness ofamalgamated channel bodies, and increase in the percentage of floodplainrelative to amalgamated-channel facies associations is evident, andconsistent with the DFS model proposed by Weissman et al. (2010).These combined characteristics suggest a downstream decrease in energy,which is attributed to channel bifurcation, infiltration, evapotranspira-tion, and deceleration of flow as the system radiates outwards from theapex (Kelly and Olsen 1993; Nichols and Fisher 2007; Weissmann et al.2010; Hartley et al. 2010; Davidson et al. 2013).
Robinson and McCabe (1998) speculated that vertical trends observedin the Salt Wash reflect base-level changes associated with shrinking andexpanding lacustrine systems. Our study, however, takes an alternative
FIG. 10.—Average grain size for each facies association. A) Amalgamated channel-belt facies association. B) Isolated-channel-fill facies association. C) Floodplainfacies association. D) Graph of average grain size for each facies association plotted against distance downstream (% and km). r value for each facies association andcritical value (CV) are indicated on each graph.
556 A. OWEN ET AL. J S R
viewpoint inasmuch as the lakes are documented to be minor features onthe distal fringes of the system. It is unlikely that such small intermittentbodies of water could control a system the size of the Salt Wash. In thisrespect, the Salt Wash fluvial system is deemed to be an upstream fluvialsystem (Kukulski et al. 2013), in that it is controlled primarily byupstream influences (i.e., sedimentation rate and discharge). Currie (1998)also interpreted patterns observed in Salt Wash sediments to be related tointeractions between basin accommodation development and sedimentsupply, but additionally interpreted migration of the flexural componentsof the foreland-basin system to be a key factor. Marine base-levelinfluences are discounted, because the western interior shoreline isreported to be in southern Canada, over 1000 km away, at the time of SaltWash deposition (Turner and Peterson 2004).
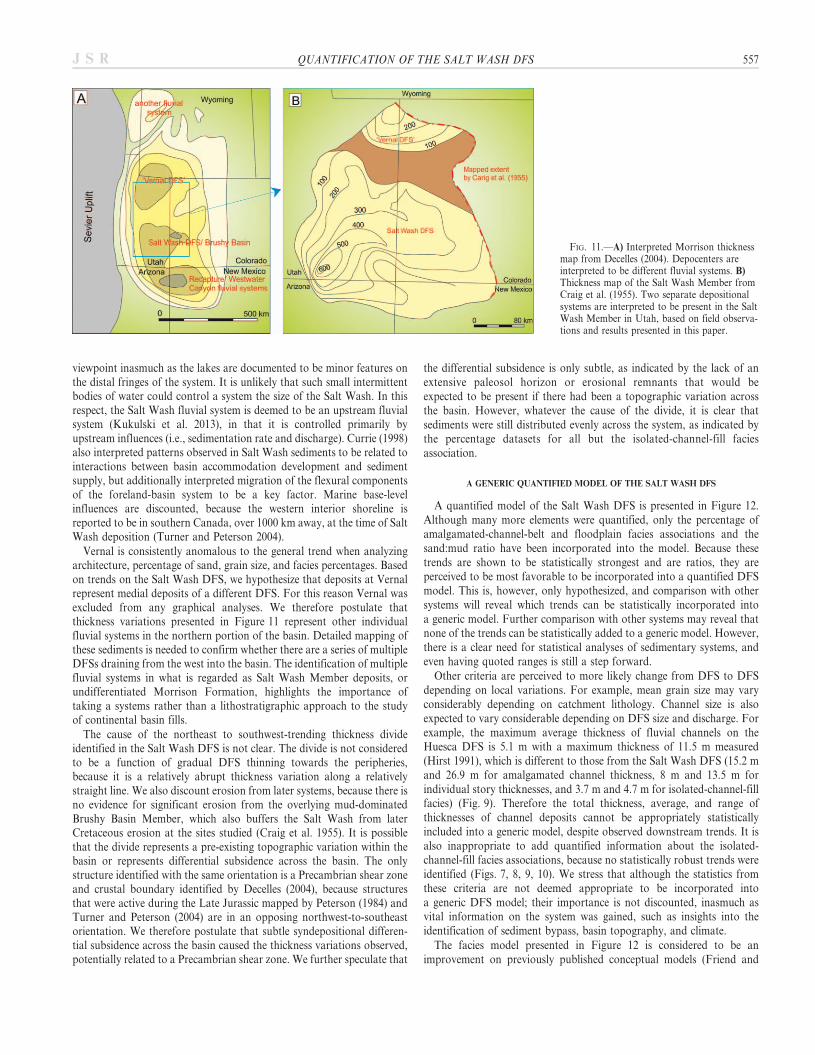
Vernal is consistently anomalous to the general trend when analyzingarchitecture, percentage of sand, grain size, and facies percentages. Basedon trends on the Salt Wash DFS, we hypothesize that deposits at Vernalrepresent medial deposits of a different DFS. For this reason Vernal wasexcluded from any graphical analyses. We therefore postulate thatthickness variations presented in Figure 11 represent other individualfluvial systems in the northern portion of the basin. Detailed mapping ofthese sediments is needed to confirm whether there are a series of multipleDFSs draining from the west into the basin. The identification of multiplefluvial systems in what is regarded as Salt Wash Member deposits, orundifferentiated Morrison Formation, highlights the importance oftaking a systems rather than a lithostratigraphic approach to the studyof continental basin fills.
The cause of the northeast to southwest-trending thickness divideidentified in the Salt Wash DFS is not clear. The divide is not consideredto be a function of gradual DFS thinning towards the peripheries,because it is a relatively abrupt thickness variation along a relativelystraight line. We also discount erosion from later systems, because there isno evidence for significant erosion from the overlying mud-dominatedBrushy Basin Member, which also buffers the Salt Wash from laterCretaceous erosion at the sites studied (Craig et al. 1955). It is possiblethat the divide represents a pre-existing topographic variation within thebasin or represents differential subsidence across the basin. The onlystructure identified with the same orientation is a Precambrian shear zoneand crustal boundary identified by Decelles (2004), because structuresthat were active during the Late Jurassic mapped by Peterson (1984) andTurner and Peterson (2004) are in an opposing northwest-to-southeastorientation. We therefore postulate that subtle syndepositional differen-tial subsidence across the basin caused the thickness variations observed,potentially related to a Precambrian shear zone. We further speculate that
the differential subsidence is only subtle, as indicated by the lack of anextensive paleosol horizon or erosional remnants that would beexpected to be present if there had been a topographic variation acrossthe basin. However, whatever the cause of the divide, it is clear thatsediments were still distributed evenly across the system, as indicated bythe percentage datasets for all but the isolated-channel-fill faciesassociation.
A GENERIC QUANTIFIED MODEL OF THE SALT WASH DFS
A quantified model of the Salt Wash DFS is presented in Figure 12.Although many more elements were quantified, only the percentage ofamalgamated-channel-belt and floodplain facies associations and thesand:mud ratio have been incorporated into the model. Because thesetrends are shown to be statistically strongest and are ratios, they areperceived to be most favorable to be incorporated into a quantified DFSmodel. This is, however, only hypothesized, and comparison with othersystems will reveal which trends can be statistically incorporated intoa generic model. Further comparison with other systems may reveal thatnone of the trends can be statistically added to a generic model. However,there is a clear need for statistical analyses of sedimentary systems, andeven having quoted ranges is still a step forward.
Other criteria are perceived to more likely change from DFS to DFSdepending on local variations. For example, mean grain size may varyconsiderably depending on catchment lithology. Channel size is alsoexpected to vary considerable depending on DFS size and discharge. Forexample, the maximum average thickness of fluvial channels on theHuesca DFS is 5.1 m with a maximum thickness of 11.5 m measured(Hirst 1991), which is different to those from the Salt Wash DFS (15.2 mand 26.9 m for amalgamated channel thickness, 8 m and 13.5 m forindividual story thicknesses, and 3.7 m and 4.7 m for isolated-channel-fillfacies) (Fig. 9). Therefore the total thickness, average, and range ofthicknesses of channel deposits cannot be appropriately statisticallyincluded into a generic model, despite observed downstream trends. It isalso inappropriate to add quantified information about the isolated-channel-fill facies associations, because no statistically robust trends wereidentified (Figs. 7, 8, 9, 10). We stress that although the statistics fromthese criteria are not deemed appropriate to be incorporated intoa generic DFS model; their importance is not discounted, inasmuch asvital information on the system was gained, such as insights into theidentification of sediment bypass, basin topography, and climate.
The facies model presented in Figure 12 is considered to be animprovement on previously published conceptual models (Friend and
FIG. 11.—A) Interpreted Morrison thicknessmap from Decelles (2004). Depocenters areinterpreted to be different fluvial systems. B)Thickness map of the Salt Wash Member fromCraig et al. (1955). Two separate depositionalsystems are interpreted to be present in the SaltWash Member in Utah, based on field observa-tions and results presented in this paper.
QUANTIFICATION OF THE SALT WASH DFS 557J S R

Moody-Stuart 1972; Friend 1978; Hirst 1991; Stanistreet and McCarthy1993; Nichols and Fisher 2007; Cain and Mountney 2009; Weissmann etal. 2010, 2013). The trends have been statistically tested and quantifiedparameters have been added to trends that are considered to bepotentially common to most DFSs. Those that have been testedstatistically, but are not considered as common features of most DFSs,are qualitatively present in the model. The model provides a basis forobjective comparisons to be made. We view this to be a starting point anda framework to build on as more system-scale studies are conducted. Wehope that through further comparison of the data from different DFSspresent under different conditions, insights into key controls on DFS canbe gained. Although there may be a degree of variation from the modelpresented depending on local conditions, it has potential in aidingsubsurface exploration of resources because it provides quantified criteriafor DFS which will aid reservoir modelling, characterization, andprediction at the system scale. The provision of statistical parametersalso allows reservoir analogues to be more readily constructed andensures geological realism.
CONCLUSIONS
This study illustrates and statistically tests proximal-to-distal trendsacross the Salt Wash DFS. We document that downdip the total fluvialthickness changes from 174 m to 40 m, the grain size of the whole fluvial
system changes from coarse sand to silt, and the percentage of sand
decreases from 70% to 8%. The percentage of amalgamated-channel-belt
facies association decreases downstream from 67% to 0%. Alternatively
the floodplain facies association becomes increasingly dominant (from
38% to 94%), as does the lacustrine facies association, but to a lesser
degree (0.1% to 7%). When present, the average thickness of the channel
belts and individual stories decreased downstream from at its thickest 15
m to 3.8 m at its thinnest, and 7.7 m to 2.3 m respectively. The
architectural style of the deposits distinctively changed, with proximal
regions dominated by deposits of stacked channel-belts with a high degree
of amalgamation, and distal regions dominated by floodplain muds and
sheet sandstones and sparse ribbon channels, with little to no
amalgamation of channel deposits.
FIG. 12.—A depositional model for the Salt Wash DFS.
558 A. OWEN ET AL. J S R

Weaker trends were present in all grain-size datasets for each faciesassociation and average-thickness datasets for the floodplain andshallow-ephemeral-lake facies associations. The isolated-channel-fillfacies association displayed the weakest trends out of all facies analyzed.Trends that may be generic in a quantified state (sand:mud ratio andpercentage of channels present) have been added to the Salt Wash faciesmodel, and it is hoped that the model will provide a platform for latercomparisons. Those trends that are not quantified (e.g., grain-size andthickness datasets and architectural style) are included in a qualitativestate and are still deemed to be of value because important insights intocharacter and controls on the system have been gained. A decrease inenergy downstream, related to flow expansion as the river entersa sedimentary basin, channel bifurcation, and infiltration, are interpretedto be key controls
Measured downstream facies trends provide a basis for objectivecomparison with other DFSs deposited under differing conditions, whichmay lead to better predictions of variations across distributive fluvialsystems. Such data may aid resource exploration and reservoircharacterization within these systems.
SUPPLEMENTAL MATERIAL
Datasets are available from JSR’s Data Archive: http://sepm.org/pages.aspx?pageid=229.
ACKNOWLEDGEMENTS
This research has been funded by the Fluvial Systems Research GroupDFS consortium phase 1, sponsored by BG, Chevron, ConocoPhillips,and Total. The authors would also like to thank Anna Kulikova, GuyPrince, Kelsey McNamara, and Karen Oud for assistance in the field.Extended thanks are given to Pete Peterson for a reconnaissanceexcursion of the Salt Wash deposits. Comments provided by BrianWillis, Cari Johnson, and associate editor Janok Bhattacharya are greatlyappreciated and helped improve the original manuscript.
REFERENCES
ASSINE, M.L., 2005, River avulsions on the Taquari megafan, Pantanal wetland, Brazil:Geomorphology, v. 70, p. 357–371.
BRIDGE, J.S., 2003, Rivers and Floodplains: Forms, Processes and Sedimentary Record:Oxford, U.K., Blackwell Publishing, 504 p.
BRISTOW, C.S., SKELLY, R.L., AND ETHRIDGE, F.G., 1999, Crevasse splays from therapidly aggrading, sand-bed, braided Niobrara River, Nebraska: effect of base-levelrise: Sedimentology, v. 46, p. 1029–1047.
BUEHLER, H.A., WEISSMANN, G.S., SCUDERI, L.A., AND HARTLEY, A.J., 2011, Spatial andtemporal evolution of an avulsion on the Taquari River distributive fluvial systemfrom satellite image analysis: Journal of Sedimentary Research, v. 81, p. 630–640.
CADIGAN, R., 1967, Petrology of the Morrison Formation in the Colorado PlateauRegion: U.S. Geological Survey, Professional Paper 556, 113 p.
CAIN, S.A., AND MOUNTNEY, N.P., 2009, Spatial and temporal evolution of a terminalfluvial fan system: the Permian Organ Rock Formation, South-east Utah, USA:Sedimentology, v. 56, p. 1774–1800.
CAIN, S.A., AND MOUNTNEY, N.P., 2011, Downstream changes and associated fluvial–eolian interactions in an ancient terminal fluvial system: the Permian Organ RockFormation, SE Utah, USA, in Davidson, S.K., Leleu, S., and North, C., eds, FromRiver To Rock Record: The Preservation of Fluvial Sediments and Their SubsequentInterpretation: SEPM, Special Publication 97, p. 1–19.
COLLINSON, J.D., 1969, The sedimentology of the Grindslow Shales and KinderscoutGrit: a deltaic complex in the Namurian of northern England: Journal of SedimentaryPetrology, v. 39, p. 194–221.
COLOMBERA, L., MOUNTNEY, N.P., AND MCCAFFREY, W.D., 2013, A quantitativeapproach to fluvial facies models: methods and example results: Sedimentology, v. 60,p. 1526–1558.
CRAIG, L.C., HOLMES, C.N., CADIGAN, R.A., FREEMAN, V.L., MULLENS, T.E., AND WEIR,G.W., 1955, Stratigraphy of the Morrison and related formations Colorado PlateauRegion, a preliminary report: U.S. Geological Survey, Bulletin 1009-E, p. 125–168.
CURRIE, B.S., 1997, Sequence stratigraphy of nonmarine Jurassic–Cretaceous rocks,central Cordilleran foreland-basin system: Geological Society of America, Bulletin,v. 109, p. 1206–1222.
CURRIE, B.S., 1998, Upper Jurassic–Lower Cretaceous Morrison and Cedar Mountainformations, northeastern Utah–northwestern Colorado: relationships between non-marine deposition and Early Cordilleran foreland-basin development: Journal ofSedimentary Research, v. 68, p. 632–652.
DAVIDSON, S.K., HARTLEY, A.J., WEISSMANN, G.S., NICHOLS, G.J., AND SCUDERI, L.A.,2013, Geomorphic elements on modern distributive fluvial systems: Geomorphology,v. 180–181, p. 82–95.
DAVIS, J.C., 2002, Statistics and Data Analysis in Geology, Third Edition: New York,John Wiley and Sons, 656 p.
DECELLES, P.G., 2004, Late Jurassic to Eocene evolution of the Cordilleran thrust beltand foreland basin system, western U.S.A.: American Journal of Science, v. 304,p. 105–168.
DECELLES, P.G., AND BURDEN, E.T., 1991, Non-marine sedimentation in the overfilledpart of the Jurassic–Cretaceous Cordilleran foreland basin: Morrison and Cloverlyformations, central Wyoming, USA: Basin Research, v. 4, p. 291–313.
DECELLES, P.G., AND CURRIE, B.S., 1996, Long-term sediment accumulation in theMiddle Jurassic–early Eocene Cordileran retroarc foreland-basin system: Geology, v.24, p. 591–594.
DECELLES, P.G., LAWTON, T.F., AND MITRA, G., 1995, Thrust timing, growth ofstructural culminations, and synorogenic sedimentation in the type Sevier orogenicbelt, western United States: Geology, v. 23, p. 699–702.
DEMKO, T.M., CURRIE, B.S., AND NICOLL, K.A., 2004, Regional paleoclimatic andstratigraphic implications of paleosols and fluvial/overbank architecture in theMorrison Formation (Upper Jurassic), Western Interior, USA: Sedimentary Geology,v. 167, p. 115–135.
DICKINSON, W.R., AND LAWTON, T.F., 2001a, Carboniferous to Cretaceous assembly andfragmentation of Mexico: Geological Society of America, Bulletin, v. 113, p. 1142–1160.
DICKINSON, W.R., AND LAWTON, T.F., 2001b, Tectonic setting and sandstone petrofaciesof the Bisbee basin (USA–Mexico): Journal of South American Earth Sciences, v. 14,p. 475–504.
DICKINSON, W.R., AND GEHRELS, G.E., 2008, Sediment delivery to the Cordilleranforeland basin: insights from U-Pb ages of detrital zircons in Upper Jurassic andCretaceous strata of the Colorado Plateau: American Journal of Science, v. 308,p. 1041–1082.
DUNAGAN, S.P., AND TURNER, C.E., 2004, Regional paleohydrologic and paleoclimaticsettings of wetland/lacustrine depositional systems in the Morrison Formation (UpperJurassic), Western Interior, USA: Sedimentary Geology, v. 167, p. 269–296.
ETHRIDGE, F.G., ORTIZ, N.V., SUNADA, D.K., AND TYLER, N., 1980, Laboratory, Field, andComputer Flow Study of the Origin of Colorado Plateau Type Uranium Deposits, SecondInterim Report: U.S. Geological Survey, Open File Report 80-805, 90 p.
EVOY, R., MOSLOW, T., AND LUTERNAUER, J., 1997, Grain size distribution patternssupporting sediment bypassing on the Fraser River Delta foreslope, British Columbia,Canada: Journal of Coastal Research, v. 13, p. 842–853.
FISCHER, R.P., AND HIPERT, L.S., 1952, Geology of the Uravan mineral belt: U.S.Geological Survey, Bulletin 988-A, 13 p.
FRIEND, P.F., 1978, Distinctive features of some ancient river systems, in Miall, A.D.,ed., Fluvial Sedimentology: Canadian Society of Petroleum Geologists, Memoir 5,p. 531–541.
FRIEND, P.F., 1983, Towards the field classification of alluvial architecture or sequence,in Collinson, J.D., and Lewin, J., eds., Modern and Ancient Fluvial Systems:International Association of Sedimentologists, Special Publication 6, p. 345–354.
FRIEND, P.F., AND MOODY-STUART, M., 1972, Sedimentation of the Wood BayFormation (Devonian) of Spitsbergen: regional analysis of a late orogenic basin:Norsk Polarinstitutt, v. 157, p. 1–77.
FRIEND, P.F., SLATER, M.J., AND WILLIAMS, R.C., 1979, Vertical and lateral building ofriver sandstone bodies, Ebro Basin, Spain: Geological Society of London, Journal,v. 136, p. 39–46.
GIBLING, M.R., 2006, Width and thickness of fluvial channel Bodies and valley fills inthe geological record: a literature compilation and classification: Journal ofSedimentary Research, v. 76, p. 731–770.
GOOD, S.C., 2004, Paleoenvironmental and paleoclimatic significance of freshwaterbivalves in the Upper Jurassic Morrison Formation, Western Interior, USA:Sedimentary Geology, v. 167, p. 163–176.
GUCCIONE, M.J., 1993, Grain-size distribution of overbank sediment and its use to locatechannel positions, in Marzo, M., and Puigdefabregas, C., eds., Alluvial Sedimentation:International Association of Sedimentologists, Special Publication 17, p. 185–194.
GULLIFORD, A.R., FLINT, S.S., AND HODGSON, D.M., 2014, Testing applicability ofmodels of distributive fluvial systems or trunk rivers in ephemeral systems:reconstructing 3-D fluvial architecture in the Beaufort Group, South Africa: Journalof Sedimentary Research, v. 84, p. 1147–1169.
HARTLEY, A.J., WEISSMANN, G.S., NICHOLS, G.J., AND WARWICK, G.L., 2010, Largedistributive fluvial systems: Characteristics, distribution, and controls on develop-ment: Journal of Sedimentary Research, v. 80, p. 167–183.
HASIOTIS, S.T., 2004, Reconnaissance of Upper Jurassic Morrison Formationichnofossils, Rocky Mountain Region, USA: paleoenvironmental, stratigraphic, andpaleoclimatic significance of terrestrial and freshwater ichnocoenoses: SedimentaryGeology, v. 167, p. 177–268.
HELLER, P.L., BOWDLER, S.S., CHAMBERS, H.P., COOGAN, J.C., HAGEN, E.S. Shuster,M.W., AND WINSLOW, N.S., 1986, Time of initial thrusting in the Sevier orogenic belt,Idaho–Wyoming and Utah: Geology, v. 14, p. 388–391.
QUANTIFICATION OF THE SALT WASH DFS 559J S R
HESSE, R., AND READING, H.G., 1978, Subaqueous clastic fissure eruptions and otherexamples of sedimentary transportation in the lacustrine Horton Bluff Formation(Mississippian), Nova Scotia, Canada, in Matter, A., and Tucker, M.E., Modern andAncient Lake Sediments: International Association of Sedimentologists, SpecialPublication 2, p. 241–257.
HIRST, J.P.P., 1983, Oligo-Miocene alluvial systems in the northern Ebro Basin, HuescaProvince, Spain [Unpublished PhD thesis]: University of Cambridge, 247 p.
HIRST, J.P.P., 1991, Variations in alluvial architecture across the Oligo-Miocene Huescafluvial system, Ebro Basin, Spain, in Miall, A.D., and Tyler, N., eds., The ThreeDimensional Facies Architecture of Terrigenous Clastic Sediments and Its Implica-tions for Hydrocarbon Discovery and Recovery: SEPM, Concepts in Sedimentologyand Paleontology 3, p. 111–121.
HIRST, J.P.P., AND NICHOLS, G.J., 1986, Thrust tectonic controls on Miocene alluvialdistribution patterns, southern Pyrenees, in Allen, P.A., and Homewood, P., eds., ForelandBasins, International Association of Sedimentologists, Special Publication 8, p. 247–258.
KOWALLIS, B.J., CHRISTIANSEN, E.H., DEINO, A.L., PETERSON, F., TURNER, C.E., KUNK,M.K.M., AND OBRADOVICH, J.D, 1998, The age of the Morrison Formation: ModernGeology, v. 22, p. 235–260.
HOLZWEBER, B., 2013, Bar-scale alluvial geometry: controlling parameters, identificationin the rock record and implications for reservoir modelling [Unpublished PhD thesis]:University of Aberdeen, 251 p.
HORTON, B.K., AND DECELLES, P.G., 2001, Modern and ancient fluvial megafans in theforeland basin system of the central Andes, southern Bolivia: implications fordrainage network evolution in fold–thrust belts: Basin Research, v. 13, p. 43–63.
JOBE, Z.R., BERNHARDT, A., AND LOWE, D.R., 2010, Facies and architectural asymmetryin a conglomerate-rich submarine channel fill, Cerro Toro Formation, Sierra delToro, Magallanes Basin, Chile: Journal of Sedimentary Research, v. 80, p. 1085–1108.
KELLY, S.B., AND OLSEN, H., 1993, Terminal fans: a review with reference to Devonianexamples: Sedimentary Geology, v. 85, p. 339–374.
KJEMPERUD, A.V., SCHOMACKER, E.R., AND CROSS, T.A., 2008, Architecture andstratigraphy of alluvial deposits, Morrison Formation (Upper Jurassic), Utah:American Association of Petroleum Geologists, Bulletin, v. 92, p. 1055–1076.
KUKULSKI, R.B., HUBBARD, S.M., MOSLOW, T.F., AND KEEGAN RAINES, M., 2013, Basin-scalestratigraphic architecture of upstream fluvial deposits: Jurassic–Cretaceous Foredeep,Alberta Basin, Canada: Journal of Sedimentary Research, v. 83, p. 704–722.
LAWTON, T.F., 1994, Tectonic setting of Mesozoic sedimentary basins, Rocky Mountainregion, United States, in Caputo, M.V., Peterson, J.A., and Franczyk, K.J., eds.,Mesozoic Systems of the Rocky Mountain Region, USA: SEPM, Rocky MountainSection, p. 1–25.
LEBARON, M.R., 1980, Depositional environment of the Upper Jurassic Salt WashMember of the Morrison Formation Montezuma Canyon, San Juan County, Utah[Unpublished Master’s thesis]: New Mexico Institute of Mines and Technology, 186 p.
LEOPOLD, L.B., AND WOLMAN, G.M., 1960, River Meanders: Geological Society ofAmerica, Bulletin, v. 71, p. 769–794.
LORENZ, J.C., AND NADON, G.C., 2002, Braided-river deposits in a muddy depositionalsetting: the Molina Member of the Wasatch Formation (Paleogene), West-CentralColorado, U.S.A.: Journal of Sedimentary Research, v. 72, p. 376–385.
MIALL, A.D., 1977, A review of the braided-river depositional environment: Earth-Science Reviews, v. 13, p. 1–62.
MIALL, A.D., 1978, Lithofacies types and vertical profile models in braided riverdeposits: a summary, in Miall, A.D., ed., Fluvial Sedimentology: Canadian Society ofPetroleum Geologists, Memoir 5, p. 597–604.
MIALL, A.D., 1996, The Geology of Fluvial Deposits; Sedimentary Facies, BasinAnalysis, and Petroleum Geology: New York: Springer-Verlag, 582 p.
MOSCARIELLO, A., 2005, Exploration potential of the mature Southern North Sea basinmargins: some unconventional plays based on alluvial and fluvial fan sedimentationmodels: in Dore, A.G., and Vinnin, B.A., eds., Petroleum Geology, North-WestEurope and Global Perspectives: Geological Society of London, 6th PetroleumGeology Conference, Proceedings, p. 595–605.
MULLENS, T.E., AND FREEMAN, V.L., 1957, Lithofacies of the Salt Wash Member of theMorrison Formation, Colorado Plateau: Geological Society of America, Bulletin, v.68, p. 505–526.
NEMEC, W., AND POSTMA, G., 1993, Quaternary alluvial fans in southwestern Crete:sedimentation processes and geomorphic evolution, in Marzo, M., and Puigdefabre-gas, C., eds., Alluvial Sedimentation: International Association of Sedimentologists,Special Publication 17, p. 235–276.
NICHOLS, G.J., 1987, Structural controls on fluvial distributary systems: the Luna system,northern Spain, in Ethridge, F.G., Flores, R.M., and Harvey, M.D., eds., RecentDevelopments in Fluvial Sedimentology: SEPM, Special Publication 39, p. 269–277.
NICHOLS, G.J., AND CANTRILL, D.J., 2002, Tectonic and climatic controls on a Mesozoicforearc basin succession, Alexander Island, Antarctica: Geological Magazine, v. 139,p. 313–330.
NICHOLS, G.J., AND FISHER, J.A., 2007, Processes, facies and architecture of fluvialdistributary system deposits: Sedimentary Geology, v. 195, p. 75–90.
OWEN, A., 2014, Analyses of the Salt Wash fluvial system: quantificationof a distributive fluvial system in the Late Jurassic Morrison Formation, SW USA[Unpublished PhD thesis]: Royal Holloway, University of London, 392 p.
OWEN, A., JUPP, P.E., NICHOLS, G.J., HARTLEY, A.J., WEISSMANN, G.S., AND SADYKOVA,D., 2015, Statistical estimation of the position of an apex: application to the geologicrecord: Journal of Sedimentary Research, v. 85, p. 142–152.
PARSONS, A.J., MICHAEL, N.A., WHITTTAKER, A.C., DULLER, R.A., AND ALLEN, P.A., 2012,Grain-size trends reveal the late orogenic, tectonic and erosional history of the south-central Pyrenees, Spain: Geological Society of London, Journal, v. 169, p. 111–114.
PETERSON, F., 1977, Uranium deposits related to depositional environments in theMorrison Formation (Upper Jurassic), Henry Mountains mineral belt of southernUtah: U.S. Geological Survey, Uranium-Thorium Symposium, Short Papers, Circular753, p. 45–47.
PETERSON, F., 1980, Sedimentology of the uranium-bearing Salt Wash Member and Tidwellunit of the Morrison Formation in the Henry and Kaiparowits Basin, Utah, in UtahGeological Association, Henry Mountains Symposium, Publication 8, p. 305–322.
PETERSON, F., 1984, Fluvial sedimentology on a quivering craton: influence of slightcrustal movements on fluvial processes, Upper Jurassic Morrison Formation, WesternColorado Plateau: Sedimentary Geology, v. 38, p. 21–49.
PETERSON, F., 1988, Stratigraphy and nomenclature of Middle and Upper Jurassic rocks,western Colorado Plateau, Utah and Arizona: U.S. Geological Survey, Bulletin 1633-B, in Revisions to Stratigraphic Nomenclature of Jurassic and Cretaceous Rocks ofthe Colorado Plateau, p. 13–56.
PIPIRINGOS, G.N., AND O’SULLIVAN, R.B., 1978, Principal unconformities in Triassic andJurassic rocks, Western Interior United States: a preliminary survey: U.S. GeologicalSurvey, Bulletin 1035-A, 38 p.
PIZZUTO, J.E., 1987, Sediment diffusion during overbank flows: Sedimentology, v. 34,p. 301–317.
PYLES, D.R., JENNETTE, D.C., TOMASSO, M., BEAUBOUEF, R.T., AND ROSSEN, C., 2010,Concepts learned from a 3D outcrop of a sinuous slope channel complex: BeaconChannel Complex, Brushy Canyon Formation, West Texas, U.S.A.: Journal ofSedimentary Research, v. 80, p. 67–96.
READING, H.G., AND LOVELL, B.K., 2010, controls on the sedimentary rock record, inReading, H.G., ed., Sedimentary Environments: Processes, Facies and Stratigraphy,Third Edition: Oxford, UK, Blackwell Publishing, p. 5–37.
ROBINSON, J.W., AND MCCABE, P.J., 1997, Sandstone-body and shale-body dimensionsin a braided fluvial system: Salt Wash Sandstone Member (Morrison Formation),Garfield County, Utah: American Association of Petroleum Geologists, Bulletin, v.81, p. 1267–1291.
ROBINSON, J.W., AND MCCABE, P.J., 1998, Evolution of a braided river system: the SaltWash Member of the Morrison Formation (Jurassic) in southern Utah, in Shanley,K.W., and McCabe, P.J., eds., Relative Role of Eustasy, Climate, and Tectonism inContinental Rocks: SEPM, Special Publication 59, p. 93–107.
ROGERS, D., AND ASTIN, T., 1991, Ephemeral lakes, mud pellet dunes and wind-blownsand and silt: reinterpretations of Devonian lacustrine cycles in north Scotland, inAnadon, P., Cabrera, L., and Kelts, K., Lacustrine Facies Analysis: InternationalAssociation of Sedimentologists, Special Publication 13, p. 199–222.
ROYSE, F., 1993, Case of the phantom foredeep: Early Cretaceous in west-central Utah:Geology, v. 21, p. 133–136.
SHUKLA, U.K., SINGH, I.B., SHARMA, M., AND SHARMA, S., 2001, A model of alluvialmegafan sedimentation: Ganga Megafan: Sedimentary Geology, v. 144, p. 243–262.
SPENCER, J.E., RICHARD, S.M., GEHRELS, G.E., GLEASON, J.D., AND DICKINSON, W.R.,2011, Age and tectonic setting of the Mesozoic McCoy Mountains Formation inwestern Arizona, USA: Geological Society of America, Bulletin, v. 123, p. 1258–1275.
STANISTREET, I.G., AND MCCARTHY, T.S., 1993, The Okavango Fan and the classificationof subaerial fan systems: Sedimentary Geology, v. 85, p. 115–133.
STEAR, W.M., 1985, Comparison of the bedform distribution and dynamics of modernand ancient sandy ephemeral flood deposits in the southwestern Karoo Region, SouthAfrica: Sedimentary Geology, v. 45, p. 209–230.
STOKES, W.L., 1954, Some stratigraphic, sedimentary and structural relations ofUranium deposits in the Salt Wash Sandstone: U.S. Atomic Energy Commission,Final Report RME-3102, 50 p.
TALBOT, M.R., AND ALLEN, P.A., 1996, Lakes, in Reading, H.G., ed., SedimentaryEnvironments: Processes, Facies and Stratigraphy, Third Edition: Oxford, U.K.,Blackwell Publishing, p. 83–124.
TURNER-PETERSON, C.E., 1986, Fluvial sedimentology of a major Uranium-bearingsandstone: a study of the Westwater Canyon Member of the Morrison Formation,San Juan Basin, New Mexico, in Turner-Peterson, C.E., Santos, E.S., and Fishman,N.S., eds., A Basin Analysis Case Study: The Morrison Formation, Grants UraniumRegion, New Mexico: American Association of Petroleum Geologists, Studies inGeology, no. 22, p. 47–76.
TURNER, C.E., AND PETERSON, F., 2004, Reconstruction of the Upper JurassicMorrison Formation extinct ecosystem: a synthesis: Sedimentary Geology, v. 167,p. 309–355.
TYLER, N., AND ETHRIDGE, F.G., 1983, Fluvial architecture of Jurassic uranium-bearingsandstones, Colorado Plateau, Western United States, in Collinson, J.D., and Lewin,J., eds., Modern and Ancient Fluvial Systems: International Association ofSedimentologists, Special Publication 6, p. 533–547.
WALKER, R.G., AND CANT, D.G., 1984, Sandy fluvial systems, in Walker, R.G., FaciesModels: Geological Association of Canada, p. 71–89.
WARREN, J., 1999, Evaporites: Their Evolution and Economics: Oxford, U.K., BlackwellScience, 448 p.
WEISSMANN, G.S., CARLE, S.A., AND FOGG, G.E., 1999, Three-dimensional hydrofaciesmodelling based on soil survey analysis and transition probability geostatistics: WaterResources Research, v. 35, p. 1761–1770.
WEISSMANN, G.S., MOUNT, J.F., AND FOGG, G.E., 2002, glacially driven cycles in
accumulation space and sequence stratigraphy of a stream-dominated alluvial fan,
San Joaquin Valley, California, U.S.A.: Journal of Sedimentary Research, v. 72,
p. 240–251.
560 A. OWEN ET AL. J S R

WEISSMANN, G.S., ZHANG, Y.K., FOGG, G.E., AND MOUNT, G.F., 2004, Influence ofincised valley fill deposits on hydrogeology of a glacially-influenced, stream-dominated alluvial fan, in Bridge, J., and Hyndman, D.W., eds. AquiferCharacterization: SEPM, Special Publication 80, p. 15–28.
WEISSMANN, G.S., HARTLEY, A.J., NICHOLS, G.J., SCUDERI, L.A., OLSEN, M., BUEHLER,H., AND BANTEAH, R., 2010, Fluvial form in modern continental sedimentary basins:distributive fluvial systems: Geology, v. 38, p. 39–42.
WEISSMANN, G.S., HARTLEY, A.J., NICHOLS, G.J., SCUDERI, L.A., OLSEN, M.E.,BUEHLER, H.A., AND MASSENGIL, L.C., 2011, Alluvial facies distributions incontinental sedimentary basins: distributive fluvial systems, in Davidson, S.K.,Leleu, S., and North, C., eds., From River To Rock Record: The Preservation ofFluvial Sediments and Their Subsequent Interpretation: SEPM, Special Publication97, p. 327–355.
WEISSMANN, G.S., HARTLEY, A.J., SCUDERI, L.A., NICHOLS, G.J., DAVIDSON, S.K., OWEN,A., ATCHLEY, S.C., BHATTACHARYYA, P., CHAKRABORTY, T., GHOSH, P., NORDT, L.C.,MICHEL, L., AND TABOR, N.J., 2013, Prograding distributive fluvial systems:geomorphic models and ancient examples, in Dreise, S.G., Nordt, L.C., andMcCarthy, P.L., eds., New Frontiers in Paleopedology and Terrestrial Paleoclima-tology: SEPM, Special Publication 104, p. 131–147.
WILLIS, B., 1993a, Ancient river systems in the Himalayan foredeep, Chinji Village area,northern Pakistan: Sedimentary Geology, v. 88, p. 1–76.
WILLIS, B., 1993b, Evolution of Miocene fluvial systems in the Himalayan foredeepthrough a two kilometer-thick succession in northern Pakistan: Sedimentary Geology,v. 88, p. 77–121.
Received 21 August 2014; accepted 9 February 2015.
QUANTIFICATION OF THE SALT WASH DFS 561J S R