Embed Size (px)
Citation preview
THE REGULATION OF QUALITY IN DISTRIBUTION SYSTEMS
Proposing a Pan-Nordic Quality Regulation Model
Master of Science Thesis
Emil Andersson Department of Energy and Environment
Division of Electric Power Engineering
CHALMERS UNIVERSITY OF TECHNOLOGY
Göteborg, Sweden, 2006
Report No. xxxx
1
Copyright © 2006 Emil Andersson
Cover picture by Graham Hughes, edited by Emil Andersson
Title
The regulation of quality in distribution systems- Proposing a Pan-Nordic quality
regulation model
Swedish title
Kvalitetsreglering i distributionsnätet – Förslag till en nordisk regleringsmodell för
kvalitet.
Author
Andersson Emil
Publisher
Department of Energy and Environment
Chalmers Univerity of Technology
412 58 Göteborg, Sweden
ISSN
M. Sc. Thesis No.
Subject
Electric power systems
Examiner
Daalder Jaap, Department of Energy and Environment,
Chalmers University of Technology
Tutor
Holmqvist Sanna, Fortum Distribution
Date
2006-06-06
2
EXECUTIVE SUMMARY This report is the result of a master thesis work at Chalmers University of Technology in
cooperation with Fortum Distribution. The main objective of the thesis work was to
propose a pan-Nordic quality regulation model to simplify work for DSOs like Fortum
Distribution operating in several of the Nordic countries. The investigation, which serves
as a basis for the proposed model, also provides a view on the quality regulation situation
of today.
As the distribution part of the electricity industry is a natural monopoly, regulation is
needed to protect customers from DSOs’ potential misuse of the monopoly situation.
Quality regulation is relatively new. It complements the efficiency regulation in order to
counteract incentives to cut costs and investments in the grid which the efficiency
regulation provides. The main theory of quality regulation is finding a trade-off between
the cost and benefit of quality.
Quality in electricity delivery is mainly divided into three parts: continuity of supply,
voltage quality and customer service quality.
Continuity of supply concerns interruptions of varying duration. Commonly interruptions
lasting longer than three minutes are included in this aspect of quality but in this work
short interruptions (less than three minutes) are included but treated separately. To
describe the quality situation concerning interruptions it is common to use some sort of
continuity index.
Voltage quality includes every technical aspect of the distributed electricity apart from
interruptions. Naturally, voltage quality is more complex to regulate as it includes many
quality issues and in turn each issue have several dimensions.
Customer service quality involves the transactions between DSOs and customers and is
not directly related to the quality of the distributed electricity. As for voltage quality this
aspect of quality is very complex and includes a high number of issues which could be
regulated and every issue could be multi-dimensional.
The quality regulation investigation has focused primarily on the European countries but
also the USA, Austrialia and South Africa have been investigated. The European
regulatory models represent more than well most of the models in use. In this report three
countries, Great Britain, Norway and Sweden have been selected as the most interesting
to look at when it comes to regulation of continuity of supply. Concerning the two other
aspects of quality the investigation has been of a more summarizing kind as the
regulation models are not that detailed and / or complicated.
There are mainly two approaches to quality regulation; individual or collective regimes.
Basically this means that in an individual regimes a single customer can negotiate a
certain level of quality at a certain price. Collective regimes set a minimal level of quality
which all customers should be able to enjoy at a certain price. The two approaches are
3
suitable in different situations. Continuity of supply is typically a collective issue, voltage
quality an individual issue and customer service could be both.
Continuity of supply regulation often includes interruptions longer than three minutes as
a basis for some continuity index (SAIDI, SAIFI or ENS). The DSO-specific index is
compared to a value set through historical or fictional data. This, in turn, has an effect on
the capping mechanism of a DSO’s permitted revenues or costs. The financial outcome of
this mechanism can either be paid out as compensation or as price control. Furthermore it
is very common to have a compensation scheme for very long interruptions, typically
longer than 12 hours.
Voltage quality is not often regulated. It is not included in any incentive scheme in
Europe. Voltage quality regulation is based on operating standards with minimal levels
of quality on certain issues. In some countries the regulator provides or approves
contracts between customers and DSOs which is meant to create incentives to maintain a
certain level of voltage quality.
Customer service quality is often regulated. Some quality issues are connected to
operating standards and there are compensations connected to non-compliance. It is not
common to have customer service affect income or costs caps but the British regulation
model is an example of this.
All regulatory models are meant to create financial incentives for DSOs to maintain or
change their delivered quality level. How to decide on the right amount of financial
impact of quality is an important issue. The impact can be limited or unlimited and based
on different things. Exemplifying by continuity of supply the regulator can decide on a
maximum or minimum impact in percentage of revenues or by setting a financial value of
an interrupted kWh based on customer surveys into the matter.
As for any model, the input is highly important. Mainly two different types of input is
necessary for quality regulation models; technical data (e.g. interruption data) and
customer values.
Technical data can be collected through manual or automatic recording via a reporting
standard. Automatic recording is associated with high costs but also high data quality.
The reverse applies for manual recording. Automatic recording is somewhat required
when recording voltage quality phenomena. The data can be separated by cause, origin
and time of occurrence.
Customer values are mainly derived from customer surveys. This has been proven a hard
task because of the scattered results. Customer values can be separated depending on
customer types and area of location.
There are many different approaches to regulating quality and a regulation model may or
may not acknowledge a number of things. A consistency throughout the model should
4
exist and could be based on a regulation policy. The findings from this investigation have
resulted in including the following points in a policy: fair trade-offs, connection to
reality, long-term focus, transparency, predictability and flexibility.
The proposed model for regulating quality in the Nordic countries acknowledges that
there are differences between the current quality regulation models. Independent of the
proposed model is implemented or not, common ground should be established through
common reporting standards, common methods for performing customer surveys and a
more strict pan-Nordic voltage quality standard.
The proposed model for regulating continuity of supply is based on energy not supplied
and customers’ value of interruptions separated by customer type and time of occurrence.
Interruptions are separated by cause and origin. All interruptions are reported, manually
recorded on LV and automatically on MV and up, but only the ones longer than three
minutes are included in quality dependent revenue cap. The capping mechanism is
limited on both up- and downside. Interruptions caused in and by transmission systems
are contributed to the TSOs which are regulated in the same way as DSOs. When force
majeure rules apply interruptions are excluded. Expected amount of energy not supplied
is derived from comparison of historical data.
Together with the quality dependent revenue cap the regulatory tools are compensations
for interruptions longer than 12 hours and special condition tools. The total yearly
compensation amount is limited to the customer specific yearly grid charge. The special
conditions apply in areas outside the range of the other regulatory tools and include
investment demands, cost allowances and special customer investigations.
The revenue cap mechanism is not based on yearly performance but is smoothened as
there is a quality account. Deficits over a number of years result in investment demands
and a surplus enables higher prices.
There is no collective regime regulating voltage quality. Customers that need a certain
voltage quality level are allowed to negotiate a contractual agreement with their DSO in a
controlled way. Costs for investigating the quality situation are divided between the DSO
and the customer depending on the situation. The voltage quality contracts are based on
the pan-Nordic voltage quality standard.
Customer service quality regulation consists of operation standards concerning certain
issues which are of common interest for many customers. There are compensations for
non-compliance.
This model will increase involvement by the regulator and require investments in
monitoring systems and investigations into customer values and load curves.
Furthermore, it is important to start by establishing common ground, as mentioned above,
and then investigate if there are differences between the countries.

5
The future of quality regulation will probably include a movement towards voltage
quality and to some extent also customer service quality as the problems with continuity
of supply hopefully will decrease. Together with the movement towards regulating
voltage quality there will also be an increased level of automatic monitoring of both
voltage quality phenomena and interruptions.
6
CONTENTS EXECUTIVE SUMMARY
CONTENTS
LIST OF ABBREVIATIONS
1. INTRODUCTION......................................................................................................... 1 1.1 Background ............................................................................................................... 1
1.2 Purpose and Method ................................................................................................. 1
1.3 Thesis outline ............................................................................................................ 1
1.4 Delimitations ............................................................................................................. 2
2. REGULATION OF ELECTRICITY MARKETS IN GENERAL .......................... 3
3. ASPECTS OF QUALITY ............................................................................................ 5 3.1 Continuity of supply .................................................................................................. 5
3.1.1 Indices of reliability ........................................................................................... 5
3.1.2 Planned and unplanned interruptions ................................................................. 7
3.2 Voltage quality .......................................................................................................... 7
3.3 Customer service quality......................................................................................... 11
4. QUALITY REGULATION OF DISTRIBUTION NETWORKS .......................... 13 4.1 Regulation of continuity of supply .......................................................................... 14
4.1.1 Network performance data ............................................................................... 14
4.1.2 Customer compensation ................................................................................... 17
4.1.3 Models for regulating continuity of supply ..................................................... 17
4.1.4 Conclusions on regulation of continuity of supply .......................................... 36
4.2 Regulation of voltage quality .................................................................................. 40
4.2.1 Voltage quality standards ................................................................................. 40
4.2.2 Regulatory authority ........................................................................................ 41
4.2.3 Voltage quality monitoring .............................................................................. 41
4.2.3 Individual verification of quality levels ........................................................... 42
4.2.4 Regulation through contracts ........................................................................... 42
4.2.5 Conclusions on regulation of voltage quality .................................................. 44
4.3 Regulation of customer service quality ................................................................... 44
4.3.1 Regulation by standards ................................................................................... 45
4.3.2 Regulation by caps ........................................................................................... 46
4.3.3 Conclusion on regulation of customer service quality ..................................... 46
5. GATHERING INPUT ................................................................................................ 47 5.1 Technical data ......................................................................................................... 47
5.2 Customer opinions .................................................................................................. 48
5.3 Conclusions on gathering input .............................................................................. 49
6. RESULTS .................................................................................................................... 50 6.1 Main findings .......................................................................................................... 50
6.2 Proposal for a Pan-Nordic quality regulation ....................................................... 54
6.2.1 Nordic prerequisites ......................................................................................... 54
6.2.2 The Pan-Nordic quality regulation model........................................................ 55
6.2.3 Reasons for the suggested regulatory design ................................................... 57
6.2.4 Implementation and impact.............................................................................. 59
6.3 Expectations on future development and work ....................................................... 60
REFERENCES ................................................................................................................ 62

7
BIBLIOGRAPHY ........................................................................................................... 64
ACKNOWLEDGEMENTS ........................................................................................... 66
APPENDIX A: QUALITY REGULATION MODELS: FINLAND
APPENDIX B: QUALITY REGULATION MODELS: DENMARK
8
LIST OF ABBREVIATIONS CAIDI Customer Average Interruption Duration Index
CAIFI Customer Average Interruption Frequency Index
CEER Council of European Energy Regulator
CENS Cost of Energy Not Supplied
CI Customer Interruptions
CML Customer Minutes Lost
DEA Danish Energy Authority
DERA Danish Energy Regulatory Authority
DSO Distribution System Operator
EMI Swedish Energy Market Inspectorate
EMV Finnish Energy Market Authority
EN-50160 European Standard of Voltage characteristics of electricity supplied by
public distribution systems, in English
ENS Energy Not Supplied
EPRI Electric Power Research Institute
ERGEG European Regulators' Group for Electricity and Gas
EU European Union
FASIT Norwegian reporting scheme for interruptions
IEEE Institute of Electrical and Electronics Engineers
kV Kilovolt
kWh Kilowatt hour
NOK Norwegian Krone
MAIFI Momentary Average Interruption Frequency Index
NPAM Network Performance Assessment Model
NRS048 National Rationalised Standards, South Africa
NVE Norwegian Water Resources and Energy Inspectorate
OFGEM Office of Gas and Electricity Markets
PTS Swedish National Post and Telecom Agency
RMS Root Mean Square
SAIDI System Average Interruption Duration Index
SAIFI System Average Interruption Frequency Index
SARFI System Average RMS (variation) Frequency Index
SIARFI System Instantaneous Average RMS-variation Frequency Index
SMARFI System Momentary Average RMS-variation Frequency Index
STARFI System Temporary Average RMS-variation Frequency Index
STEM Swedish Energy Agency
TSO Transmission System Operator
1
1. INTRODUCTION
1.1 Background
Many countries around the world have a deregulated electricity industry; among them are
the Nordic countries and many other European countries. As the electricity industry is
deregulated a natural monopoly evolves as distribution system operators are the only
local grid owners in their respective areas. This calls for a reregulation to avoid any
misuse of the monopoly situation.
As the deregulation has started on different points in history and has progressed at
different speeds the reregulation methods are different throughout reregulating countries.
This, together with social and historical reasons, has lead to a great variance in regulation
models, all having their positive and negative effects.
For distribution companies active in several countries the difference in regulation can be
a problem causing companies to conduct business in different ways, abiding to different
rules and laws. This is the case for Fortum Distribution.
Fortum Distribution runs local distribution grids in Finland, Sweden and Norway and
there is a desire to harmonize the regulation in these countries, creating a Pan-Nordic
regulation.
This master thesis was written in cooperation with Fortum Distribution as a part of a
Master of Science degree in electric power engineering at Chalmers University of
Technology.
1.2 Purpose and Method
This thesis primarily aims to propose a Pan-Nordic quality regulation model mainly for
Finland, Norway and Sweden based on investigations of the quality regulation situation
in selected parts of the world. By investigating other models and comparing prerequisites
in other countries to Nordic ones a suitable model for the Nordic countries means to be
suggested. The bonus result is an informational report for orientation into the subject. The
main source of information are reports from government authorities, branch organizations
and investigations similar to this one. In addition to describing the regulation situation a
brief description of the quality issues in electricity distribution is given.
1.3 Thesis outline
The report starts with some background to the subject in chapter 2, Regulation in general,
and 3, Aspects of quality which should give more information on the problems involved.
Chapter 4, Quality Regulation in distribution networks, will give a summary of the
performed investigation in terms of describing how quality regulation is carried out in
general and with some examples. Chapter 5, Gathering input, is a result of the
investigation and aims to shed some light on the problems of collecting reliable data. The
2
results are shown in chapter 6 and will present the main findings of the investigation and
the proposal based on the investigation, own ideas and some policy issues.
1.4 Delimitations
Quality regulation is a large subject and a master thesis does not allow a deep
investigation into all parts of it. However, this investigation has attempted to cover most
of the topics but not on a very detailed level. As this thesis mainly aims to describe the
situation today most of the emphasis has been put on regulation of continuity of supply.
Any attempt to investigate what effect different models would have if introduced in other
countries has not been made due to the amount of data that would have to be available
and adapted to give a reasonable comparison. No communication with the other two big
distribution companies, E-On and Vattenfall to exchange ideas has been made. This could
have been desirable; however, it can also be interesting to see if results from similar
investigations moves in the same direction.

3
2. REGULATION OF ELECTRICITY MARKETS IN GENERAL The deregulation of electricity markets is not a new phenomenon and it started in Chile in
the early 1980s and other countries in South America soon followed [1]. In Europe Great
Britain and Norway were the first countries to deregulate the electricity market, both
started in 1990 [2,3]. The deregulation includes sales, generation and transport of
electricity.
The deregulation, or perhaps reregulation, includes separating generation, transmission
and distribution and sales, creating a competitive market for the sale of electricity and
eliminating monopolies. However, in transmission and distribution this is not an easy
task. The transmission and distribution of electricity is limited to the power grid which
has been built up during a long period of time. To build a parallel power grid and thus
creating competition is not even close to being economically viable. Therefore the
transmission and distribution part of the industry is considered to be a natural monopoly.
As a monopoly the need for regulation of transmission and distribution is clear, as there is
a possibility for abuse of its monopolistic nature. Whereas transmission companies are
often few in numbers within a country and sometimes closely connected to the state, the
number of distribution companies within a country varies a lot, from just a handful or less
to a couple of hundred. The regulation of distribution companies can therefore be
considered to be more complex and needing more work.
It is important to remember that regulation should work for the customers, as it is them
the regulation is trying to protect against the companies' misuse of monopoly status. But,
distribution companies should be allowed to work as efficient enterprises taking home a
certain amount of profit and conducting business in a normal way. A good regulation
model handles both issues.
Regulation in each country is conducted by the authority appointed by the government,
local or federal, and shall comply with relevant electricity laws in use. In Europe there
are EU-laws and there are also country-wise laws, which correspond well to for example
federal and state laws in the United States.
There are many different issues within the regulation design including legal, financial and
technical issues. The regulation models are applied for a period of time, normally ranging
from one to five years, and can be of either ex ante or ex post type. Ex ante implies that
distribution companies are controlled before they take actions within the regulation
period and ex post means that they are judged afterwards. Ex ante is regarded as a
regulation more heavy to handle compared to ex post [1].
Many regulation schemes in operation today use some sort of financial capping
mechanism; capping of price, revenue or cost are common. The cap limits the allowed
price, cost or whatever the factor might be. The exact way of how each mechanism works
will not be dealt with in this report, but these schemes all include strong incentives for
4
financial efficiency and cutting costs for the concerned company. The performance is
judged based on some sort of benchmarking technique which grades the company. The
authority has the possibility to change the cap for the company.
Although the financial regulation gives strong incentives to run a tight economic ship and
cut costs it has its downsides. It is widely accepted that having only an economic
approach in the regulation may cause a deteriorating level of quality in the company's
grid as a cause of less resources being put to maintenance and investments. In order to
avoid this deterioration, quality as well as finance must also be a part of the regulation.
5
3. ASPECTS OF QUALITY The term quality is widely used; therefore it needs to be defined for this specific topic.
The quality concept in distribution networks is commonly divided into three parts:
Continuity of supply
Voltage quality
Customer service quality
The name of each part may vary a bit from country to country. The above names are used
by CEER [4] and most of the information in the subtopics below is gathered from
CEER's third benchmarking report on quality of electricity supply. Definitions of
phenomena which are included in the two first aspects can be found in European
technical standards EN50160 [5].
The quality concept in distribution network is associated with costs. The two first aspects
mentioned above can be connected to direct costs for both distribution companies and
customers while the third aspect has soft values. [6]
3.1 Continuity of supply
The quality aspect which is used in almost every quality regulation model is the
continuity, or reliability, of supply. This aspect deals with interruptions in the power
system. An interruption is a loss of 99 percent or more of the nominal voltage [5]. What
is regarded as an interruption in common practice has not been established in this
investigation.
An interruption is fairly one-dimensional, meaning it is mainly described by its duration.
However, interesting factors are also whether the interruption was planned or unplanned,
at which voltage level it occurred and, at a regulatory level, how often interruptions
occur.
The duration of interruptions vary from just a fraction of a second to several hours or
even days. In network statistics often only interruptions lasting over 3 minutes are taken
into account when making diagnostics for a network. These are called long interruptions.
Short interruptions are defined as lasting between 1 second up to 3 minutes. The shortest
interruptions, up to a second in duration are called transient [5]. As mentioned, common
practice is to include only long interruptions in network statistics forming reliability
indices while short interruptions are dealt with as a voltage quality problem. However,
the concerns of short interruptions and problems thereof are increasing. CEER, for
example, includes indices for short interruptions as an index for continuity of supply; the
same practice will be conducted here [4].
3.1.1 Indices of reliability
Distribution companies are often required by regulatory authorities to report interruptions
in their network and form indices describing how well their network is performing. These
6
indices are average values and can be defined in various ways, differentiating customer
groups, time of day, planned or unplanned and/or at voltage level. Common indices are:
SAIFI (System Average Interruption Frequency Index)
SAIDI (System Average Duration Frequency Index)
MAIFI (Momentary Average Interruption Frequency Index)
Variations of the above
SAIFI relates to the number of interruptions and the number of customers affected by
interruptions per year in a specific area, or how many times per year energy is not
supplied. SAIFI is calculated in the following way:
tot
i
i
N
N
SAIFI , where Ni is the number of customers affected by the interruption i and
Ntot is the total number of customers in that system. [7]
The variations of this index includes CI, Customer Interruptions which is just SAIFI
multiplied by 100, making it more percentage-like. [4]
SAIDI deals with the average duration of interruptions in the following way:
,tot
i
ii
N
DN
SAIDI where Ni is the number of customers affected by the interruption i, Di
is the duration of interruption i and Ntot is the total number of customers in that
system.[7]
Another way that this is expressed is the CML (Customer Minutes Lost) which is the
same SAIDI [4]. ENS (Energy Not Supplied) is another variation of the duration index
where the load size is multiplied by the duration, giving the energy not supplied during
the interruption [7].
MAIFI is the same as SAIFI but it includes only interruptions lasting shorter than three
minutes. Corresponding duration index is not in use as the duration is set with the
interruptions to be included [4].
SAIFI and SAIDI refer to the system as a whole as the duration and frequency of the
interruptions are weighted against total number of customers in the system. In
comparison to SAIFI and SAIDI there are the CAIFI and CAIDI indices. In these indices
system (S) is changed to customer (C). In the frequency case this means that instead of
using the total number of customers in the network one only uses the number of
customers affected by the largest interruption. In the duration case, CAIDI gives the
average duration per interruption and not per interruption and customer. The C-indices
relate to what can be expected by customer and the S-indices relate to what the system
operator can expect. [7]
7
3.1.2 Planned and unplanned interruptions
Above it is mentioned that it is interesting to distinguish planned from unplanned
interruptions. The difference between these two is the origin of the interruption.
Planned interruptions are due to maintenance work in the grid. Customers affected by
these interruptions must be informed before hand; otherwise the interruption will be
regarded as unplanned. The customer costs of a planned interruption can be less than an
unplanned one as the customer has the chance to make preparations to minimize the
costs. The term before hand is treated differently throughout the world and varies a lot
[1]. In countries where there is no weighting between planned and unplanned interruption
this has no effect in regulation.
Unplanned interruptions can have a wide number of reasons such as weather, equipment
failure and vandalism. Unplanned interruptions are regarded as random. Interruptions
included in MAIFI are regarded as unplanned and are often due to switching and fault
clearing, which makes the regard natural.
As mentioned, interruptions are fairly one dimensional and thereby easy to understand.
Awareness toward problems regarding interruptions is high, which is reflected in the
number of regulatory models which include reporting of at least long interruptions.
3.2 Voltage quality
The term voltage quality includes a number of different phenomena occurring in a power
system. Basically it means any deviation from the sine curve of desired magnitude. The
EN50160 defines values for acceptable standards for these phenomena which include:
Frequency variation
Voltage variation
Rapid voltage variation
Voltage dips and swells
Transient over-voltage
Signaling voltage
Asymmetry
Harmonics
Interharmonics
Flicker
The standards also include interruptions but since these are already covered above they
are excluded here. The standard EN50160 is only viable in grid with a nominal voltage of
35 kV or less. The standard also differentiates between low voltage (<1 kV) and medium
voltage (between 1 kV and 35 kV) but the differences are not all that large.
Frequency variation is an issue mainly on a balancing operator level as frequency
variation is a question of supply and demand of electricity but can be an issue for isolated
networks or networks not synchronously connected to the power grid.
8
The standard sets mandatory tolerance levels for voltage variation, flicker severity,
harmonic distortion and signaling voltage and just indicative values for the remaining
quality issues. The tolerance levels are mainly set to ±10% for 95% of the average of
RMS values from 10 minute-measurements during a week, this during normal operating
conditions and not during interruptions.
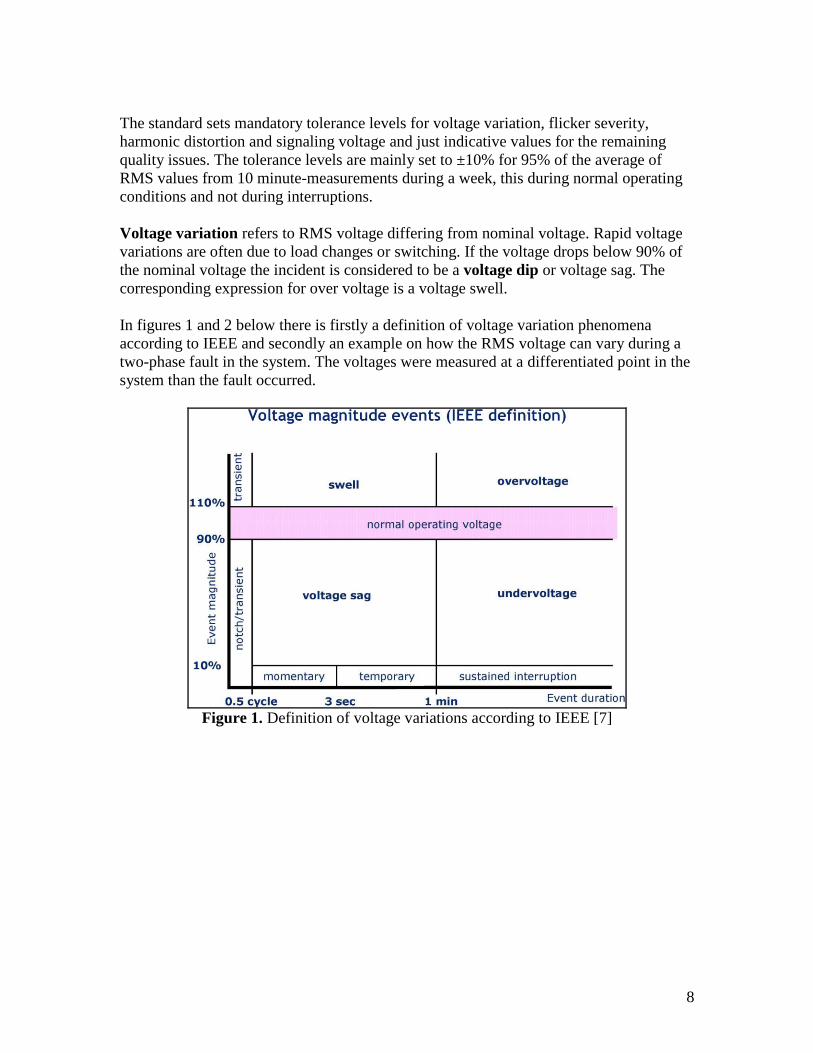
Voltage variation refers to RMS voltage differing from nominal voltage. Rapid voltage
variations are often due to load changes or switching. If the voltage drops below 90% of
the nominal voltage the incident is considered to be a voltage dip or voltage sag. The
corresponding expression for over voltage is a voltage swell.
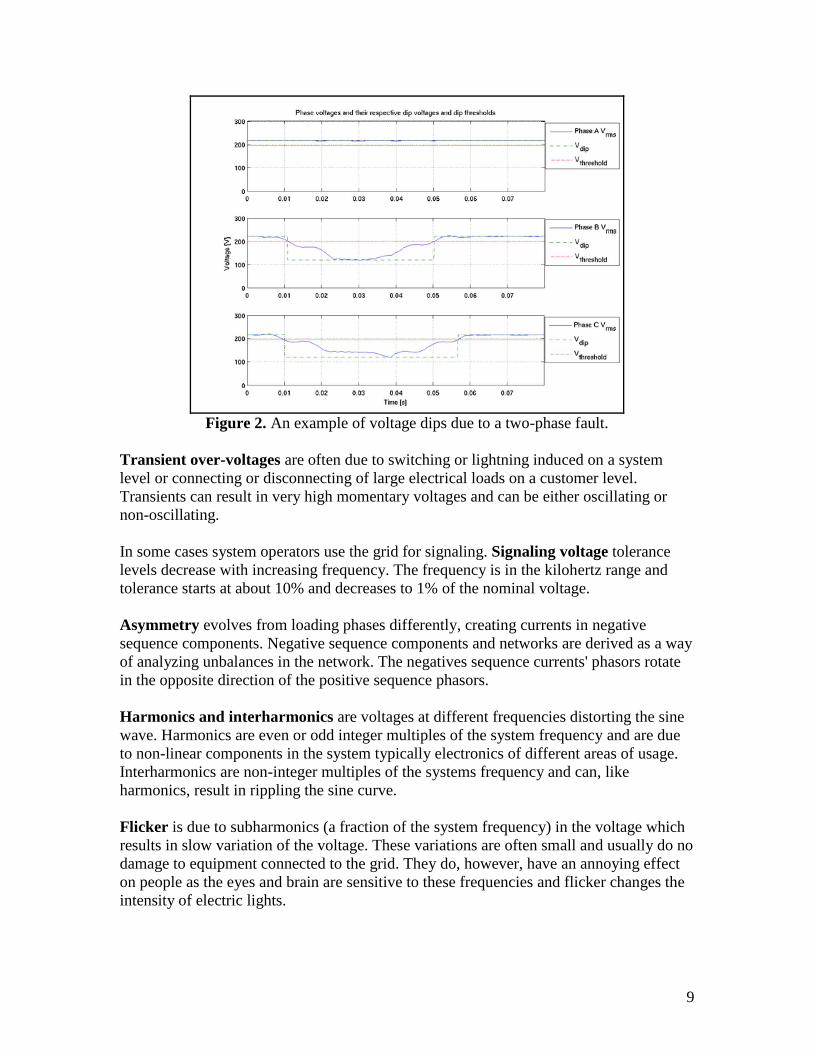
In figures 1 and 2 below there is firstly a definition of voltage variation phenomena
according to IEEE and secondly an example on how the RMS voltage can vary during a
two-phase fault in the system. The voltages were measured at a differentiated point in the
system than the fault occurred.
Figure 1. Definition of voltage variations according to IEEE [7]
9
Figure 2. An example of voltage dips due to a two-phase fault.
Transient over-voltages are often due to switching or lightning induced on a system
level or connecting or disconnecting of large electrical loads on a customer level.
Transients can result in very high momentary voltages and can be either oscillating or
non-oscillating.
In some cases system operators use the grid for signaling. Signaling voltage tolerance
levels decrease with increasing frequency. The frequency is in the kilohertz range and
tolerance starts at about 10% and decreases to 1% of the nominal voltage.
Asymmetry evolves from loading phases differently, creating currents in negative
sequence components. Negative sequence components and networks are derived as a way
of analyzing unbalances in the network. The negatives sequence currents' phasors rotate
in the opposite direction of the positive sequence phasors.
Harmonics and interharmonics are voltages at different frequencies distorting the sine
wave. Harmonics are even or odd integer multiples of the system frequency and are due
to non-linear components in the system typically electronics of different areas of usage.
Interharmonics are non-integer multiples of the systems frequency and can, like
harmonics, result in rippling the sine curve.
Flicker is due to subharmonics (a fraction of the system frequency) in the voltage which
results in slow variation of the voltage. These variations are often small and usually do no
damage to equipment connected to the grid. They do, however, have an annoying effect
on people as the eyes and brain are sensitive to these frequencies and flicker changes the
intensity of electric lights.
10
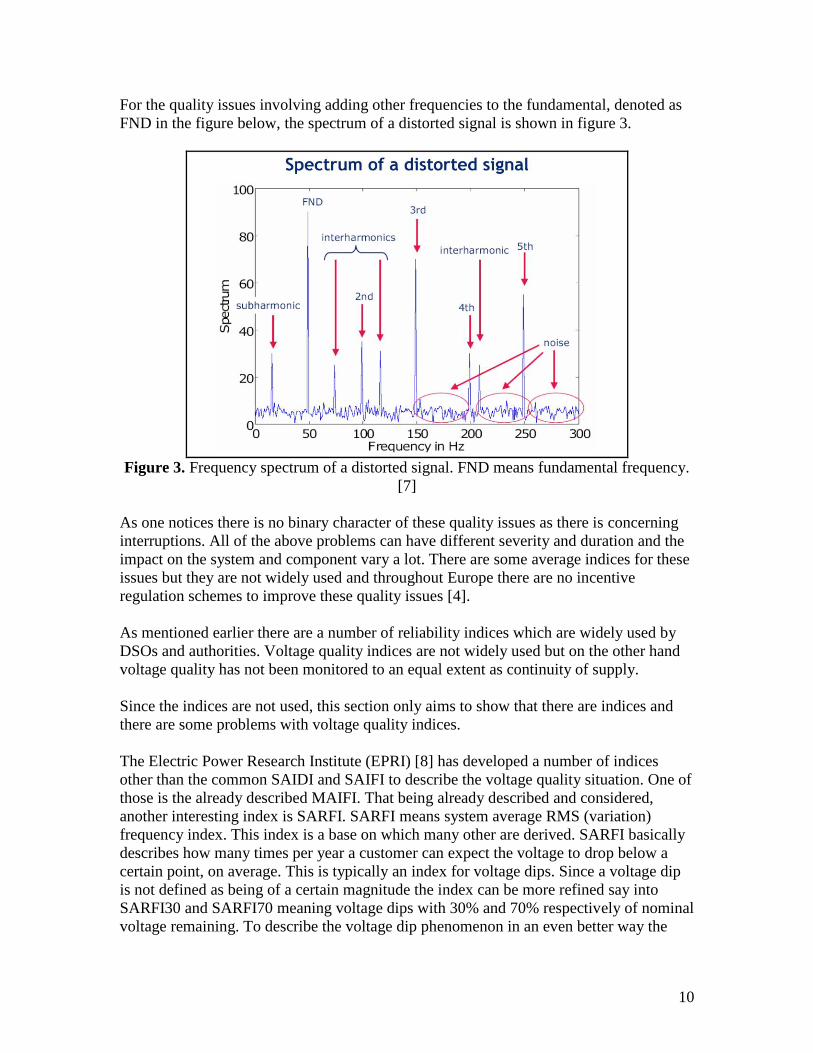
For the quality issues involving adding other frequencies to the fundamental, denoted as
FND in the figure below, the spectrum of a distorted signal is shown in figure 3.
Figure 3. Frequency spectrum of a distorted signal. FND means fundamental frequency.
[7]
As one notices there is no binary character of these quality issues as there is concerning
interruptions. All of the above problems can have different severity and duration and the
impact on the system and component vary a lot. There are some average indices for these
issues but they are not widely used and throughout Europe there are no incentive
regulation schemes to improve these quality issues [4].
As mentioned earlier there are a number of reliability indices which are widely used by
DSOs and authorities. Voltage quality indices are not widely used but on the other hand
voltage quality has not been monitored to an equal extent as continuity of supply.
Since the indices are not used, this section only aims to show that there are indices and
there are some problems with voltage quality indices.
The Electric Power Research Institute (EPRI) [8] has developed a number of indices
other than the common SAIDI and SAIFI to describe the voltage quality situation. One of
those is the already described MAIFI. That being already described and considered,
another interesting index is SARFI. SARFI means system average RMS (variation)
frequency index. This index is a base on which many other are derived. SARFI basically
describes how many times per year a customer can expect the voltage to drop below a
certain point, on average. This is typically an index for voltage dips. Since a voltage dip
is not defined as being of a certain magnitude the index can be more refined say into
SARFI30 and SARFI70 meaning voltage dips with 30% and 70% respectively of nominal
voltage remaining. To describe the voltage dip phenomenon in an even better way the
11
duration of a dip must be introduced dividing duration into instantaneous, momentary and
temporary giving us the following;
SIARFI - System Instantaneous Average RMS-variation Frequency Index
SMARFI - System Momentary Average RMS-variation Frequency Index
STARFI - System Temporary Average RMS-variation Frequency Index
The duration division is done according to an IEEE standard 1195:1995. The indices can
be refined even more.
There is no set standard to characterize voltage quality through statistical indices and
there are other examples of how to describe voltage dips [9].
To give a good picture of only voltage dips we need a number of indices. Describing all
the quality aspects in a similar way gives a large number of indices. Even though indices
describe the situation in the grid they do not describe how customers and/or equipment
are affected by the phenomena. The interruption phenomenon has different effects on
customers but is more easily predicted than the voltage quality phenomena.
Above it is mentioned that there are no incentive schemes in use concerning voltage
quality problems, these aside, many countries are aware of the problems and costs the
lack of voltage quality is producing. Some authorities are adopting lower tolerance levels
and/or allowing customers to enter contracts with their distribution system operator to
guarantee a certain level of quality, with fines for the operator if they cannot meet the
contracted levels. Outside Europe some countries, e.g. South Africa, have their own
standards and conduct investigations into quality issues for future regulatory work.
When looking at the voltage quality aspect one should look at both emission and
immunity and recognize the fact that customers both affect and are affected by the
voltage quality.
3.3 Customer service quality
This topic covers the soft side of quality regulation and has little to do with the quality of
the actual supply of electricity. After a deregulation an electricity customer has contact
with more than one party which means that the possibilities for misunderstandings
increase. Which company that deals with which issue is not always clear. Customer
service quality deals mainly with human relations in transactions between a customer and
the distribution company.
Customer service quality is not an easy issue. The desired level of regulation of customer
service quality may vary a lot throughout the world as attitudes of customers, distribution
companies and authorities also vary a lot.
CEER divides the transactions into those related to conditions of distribution and supply
and those that take place during the period of the contract. The first group relates to

12
transactions that take place before a contract has come into force, such as prices for
connection and installations. The second group of transactions takes place within the
contract time and includes billing, payment arrangement, complaints, queries and claims,
as listed by CEER. [4]
CEER has gathered a list of transactions being acknowledged for regulation in Europe
[4]. Below is a summary of that list.
Preparations of a cost estimates
Execution of work
Start of supply
Reconnection of the customer to the network after the payment of debt
Average response time to demands for low voltage supply
Time of connection of a new customer to the network
Time of starting the supply
Distributor’s fuse failure
Average time of restoration
Voltage complaints
Meter readings and problems
Correction of voltage faults
Information (notice) on scheduled supply interruptions
Responding to queries for information associated with charges and payments
Answering customers' letters
Average response time of answering written queries
Keeping scheduled appointments
Attendance of customer centers
Average waiting time in the customer Centers
Service level indicators of Call Centers
Average waiting time measured in Call Centers
Responses to customers’ complaints
There will be no attempt to explain all of these points in this report. This list is an attempt
to give an idea as to by which means the quality of customer services can be regulated.
As mentioned, the list is only gathered from authorities in Europe and not every country
adopts all standards, if any at all. On the topic of customer service quality regulation only
the mind sets the limits. As new ways of communicating are developed the information
part of transactions can be evolved and improved for both customers and distribution
companies.
13
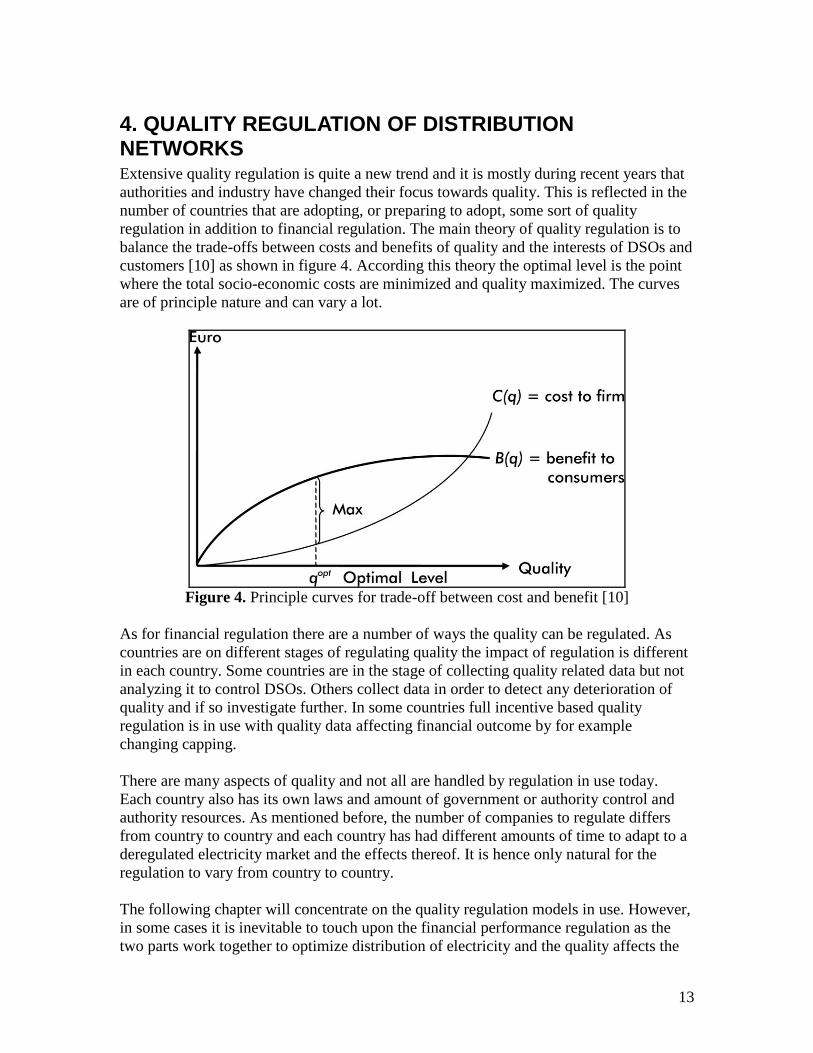
4. QUALITY REGULATION OF DISTRIBUTION NETWORKS Extensive quality regulation is quite a new trend and it is mostly during recent years that
authorities and industry have changed their focus towards quality. This is reflected in the
number of countries that are adopting, or preparing to adopt, some sort of quality
regulation in addition to financial regulation. The main theory of quality regulation is to
balance the trade-offs between costs and benefits of quality and the interests of DSOs and
customers [10] as shown in figure 4. According this theory the optimal level is the point
where the total socio-economic costs are minimized and quality maximized. The curves
are of principle nature and can vary a lot.
Figure 4. Principle curves for trade-off between cost and benefit [10]
As for financial regulation there are a number of ways the quality can be regulated. As
countries are on different stages of regulating quality the impact of regulation is different
in each country. Some countries are in the stage of collecting quality related data but not
analyzing it to control DSOs. Others collect data in order to detect any deterioration of
quality and if so investigate further. In some countries full incentive based quality
regulation is in use with quality data affecting financial outcome by for example
changing capping.
There are many aspects of quality and not all are handled by regulation in use today.
Each country also has its own laws and amount of government or authority control and
authority resources. As mentioned before, the number of companies to regulate differs
from country to country and each country has had different amounts of time to adapt to a
deregulated electricity market and the effects thereof. It is hence only natural for the
regulation to vary from country to country.
The following chapter will concentrate on the quality regulation models in use. However,
in some cases it is inevitable to touch upon the financial performance regulation as the
two parts work together to optimize distribution of electricity and the quality affects the

14
financial outcome. Moreover, the chapter will be divided into three parts dealing with
each aspect of quality on its own, making it easier to compare models in each aspect
respectively. Also, the extent of regulation of each aspect differs so much that a country-
wise comparison of all aspects is not easy to get an overview of.
4.1 Regulation of continuity of supply
Reliability indices and customer compensation are the two most common approaches to
regulating continuity of supply. As mentioned above, continuity is the aspect of quality
which is the easiest to comprehend and the aspect, if any, included in most quality
regulation models. The indices which are used are easy to construct and gives a picture of
how well the distribution company is performing. It is also an aspect of quality which
customers are aware of and can relate costs to. Below is an attempt to categorize a
number of models. Of course, every model in use has not been looked closely upon and
some of the models that have been investigated resemble each other a lot. The reason for
resemblance or, in other cases distinct difference, is not always the success or failure of
the original model but can be, for example, historic.
In regulation quality authorities act on different activity levels. Some are modestly active
and only react to and investigate into deteriorating quality, while other models have a
high activity level and give economic incentives to invest in quality increasing
components in the grid.
Comparing different countries and thereby regulation models, trying to find the best, is
not an easy task. There are many differences within and between countries and it is not
necessarily so that what suits one suits the other. By only looking at trends for reliability
indices and trying to see what level of regulation a certain country has does not give a
good picture. Interruptions occur stochastically and for good comparisons data from long
periods of time should be available. It is difficult to decide if improvements in statistic
data for a large area during regulation period are the results of regulatory actions during
that period, actions taken before or just stochastic variations. To compare regulatory
models the qualitative approach has to be applied, meaning that the regulation models are
compared as to the principles on which they are built and not the actual parameter values.
4.1.1 Network performance data
The use of reliability indices is a common way of determining network performance. The
reliability indices mostly deal with length of interruptions and frequency of occurrence.
There are variations of these indices but they are all related to measuring frequency
and/or duration of interruptions. In this chapter the use of reliability indices in different
countries will be compared. The following indices will be mentioned (explained in
chapter 3.1.1):
SAIDI
SAIFI
ENS
CI
CML
15
MAIFI
These are all average values of interruption frequency and duration. Although they are
average per customer in similar ways, the input for the statistics varies as rules for
reporting interruptions vary throughout the investigated countries. As mentioned above,
interruptions shorter than 3 minutes are excluded from interruption data, except the odd
case when calculating MAIFI.
For number of countries, European and non-European, the use of reliability indices for
measuring continuity of supply has been investigated. As can be seen below Sweden,
Norway and Great Britain have been selected for a deeper investigation as they have been
found to represent most other models in use.
For the European countries CEER has done extensive work in putting together useful,
comparable data. The non-European countries which have been investigated (Australia,
USA) are state-divided and have different approaches within the country due to the fact
that the issue of regulation of electricity distribution is on a state-level.
Hopefully, the following subtopics will give an idea of how it is possible to vary the use
of the reliability indices and explain that one cannot only compare numbers in tables to
compare performance of different operators.
4.1.1.1 Interruption reporting
It is always important to know which inputs you have in a model and how reliable the
data is. The input data for calculating reliability indices can be collected at different
voltage levels, manually or automatically and weighted at different levels in the system.
The voltage levels available in distribution networks are medium or low voltage. They
vary a bit throughout the world but low voltage is typically lower than 1 kV and medium
voltage includes anything above 1 kV up to 20 or 40 kV. The upper limit of medium
voltage, and thereby the minimum limit of high voltage, differs a lot.
The method of recording and reporting interruption data is an important issue in the
distribution network, especially when a regulatory system is based on the data. In a
system with collection of data at a high system level there can be an automatic
measurement system installed which records interruption data. If the requirement
includes interruption data at a customer level the data must often be recorded manually
by customers, maintenance crew, operators and automatic recording equipment together.
The chain of manual reporting of data is associated with human error but the cost of this
system is lower than an automatic system at customer level.
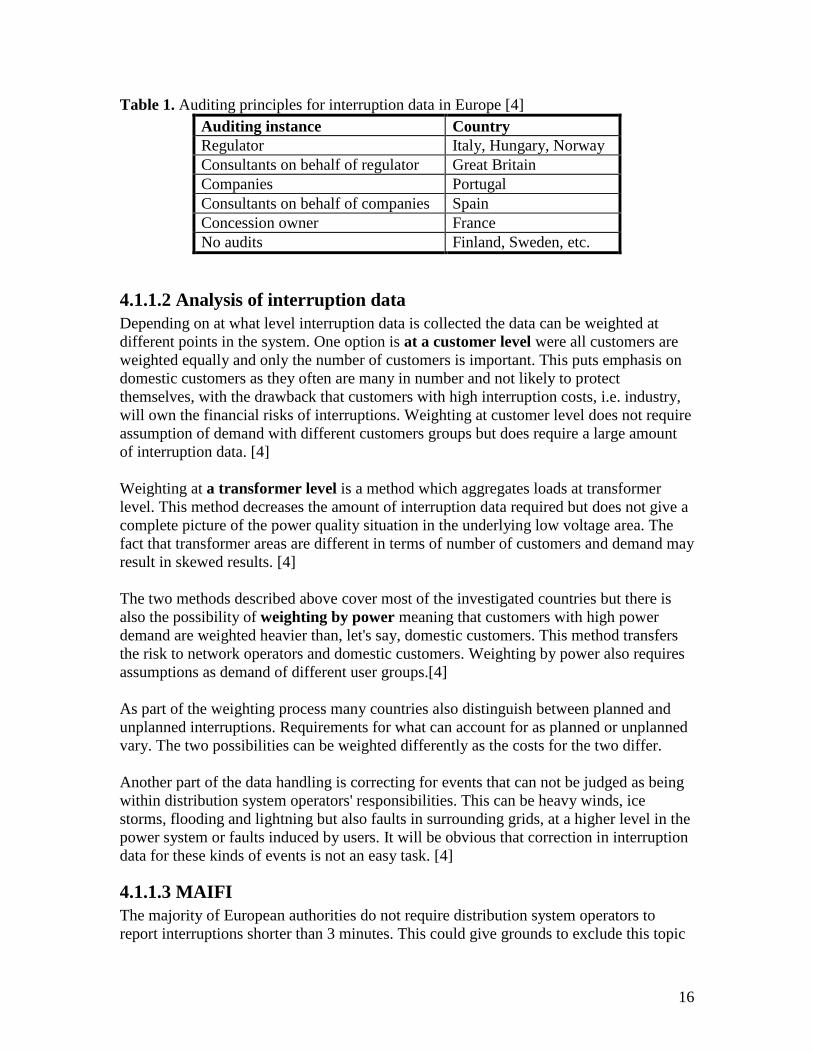
Furthermore, it is worth mentioning that in most countries in Europe which have some
sort of incentive scheme, audits of reported data is conducted to assure its quality [4]. A
summary of auditing methods in Europe is shown in table 1.
16
Table 1. Auditing principles for interruption data in Europe [4]
Auditing instance Country
Regulator Italy, Hungary, Norway
Consultants on behalf of regulator Great Britain
Companies Portugal
Consultants on behalf of companies Spain
Concession owner France
No audits Finland, Sweden, etc.
4.1.1.2 Analysis of interruption data
Depending on at what level interruption data is collected the data can be weighted at
different points in the system. One option is at a customer level were all customers are
weighted equally and only the number of customers is important. This puts emphasis on
domestic customers as they often are many in number and not likely to protect
themselves, with the drawback that customers with high interruption costs, i.e. industry,
will own the financial risks of interruptions. Weighting at customer level does not require
assumption of demand with different customers groups but does require a large amount
of interruption data. [4]
Weighting at a transformer level is a method which aggregates loads at transformer
level. This method decreases the amount of interruption data required but does not give a
complete picture of the power quality situation in the underlying low voltage area. The
fact that transformer areas are different in terms of number of customers and demand may
result in skewed results. [4]
The two methods described above cover most of the investigated countries but there is
also the possibility of weighting by power meaning that customers with high power
demand are weighted heavier than, let's say, domestic customers. This method transfers
the risk to network operators and domestic customers. Weighting by power also requires
assumptions as demand of different user groups.[4]
As part of the weighting process many countries also distinguish between planned and
unplanned interruptions. Requirements for what can account for as planned or unplanned
vary. The two possibilities can be weighted differently as the costs for the two differ.
Another part of the data handling is correcting for events that can not be judged as being
within distribution system operators' responsibilities. This can be heavy winds, ice
storms, flooding and lightning but also faults in surrounding grids, at a higher level in the
power system or faults induced by users. It will be obvious that correction in interruption
data for these kinds of events is not an easy task. [4]
4.1.1.3 MAIFI
The majority of European authorities do not require distribution system operators to
report interruptions shorter than 3 minutes. This could give grounds to exclude this topic
17
from this part of the report and handle it under regulation of voltage quality. However, as
there are some countries in which the use of MAIFI, a reliability index for short
interruptions, has begun, it is worth taking into account in this part of the report. [4]
4.1.2 Customer compensation
There are other ways than average values of interruption duration and frequency to assess
the performance of distribution system operators. Taking the indices aside and looking at
the possibility to create financial incentives for the DSOs to increase reliability without
changing for example the revenue caps, there is the possibility of compensating specific
customers for specific interruptions. While the change of caps has an effect on the whole
area in which the DSO operates, this is a more direct approach compensating the affected
customers. The method of compensation has not been adopted to compensate for costs
associated with interruption but to give incentives to the DSO to avoid interruptions. The
compensation method is typically used when customers have very long interruptions,
typically more than 12 hours [4]. This is a sort of self-regulating method with some
drawbacks. Given a DSO with mostly a rural system with often reoccurring long
interruptions it may well be a too strong incentive having negative effects on
performance. Given a DSO with mostly an urban grid and only a small portion of the grid
having long interruption the compensation scheme may have no effect at all.
4.1.3 Models for regulating continuity of supply
The following three models have been investigated the most and represent most models
in use on a summarizing level. Going into depth there are of course many variations to
the basic approaches which Norway, Sweden and Great Britain will represent. After the
three model descriptions a small chapter will follow to bring some variations into light
for later discussions.
Sometimes, if not to say always, it is difficult to describe the quality regulation without
describing the regulation of financial performance. The Swedish model is the perfect
example of this. Even though the two other models are more separate from the financial
performance or efficiency regulation there will be a brief description of them too.
4.1.3.1 Sweden
4.1.3.1.1 Prerequisites
Sweden has 265 concession areas in distribution voltage level divided amongst
approximately 210 companies where Fortum, Vattenfall and E-On are the largest having
17%, 15% and 15% of customers respectively. Each concession is not necessarily
individually handled in regulation. [3]
In Sweden the Energy Market Inspectorate (EMI) is the regulating authority and works as
a part of the Swedish Energy Agency (STEM) and reports to the Swedish government.
EMI yearly evaluates the DSOs using the regulatory model called Nätnyttomodellen or
Network Performance Assessment Model (NPAM).
18
The Swedish electricity market was deregulated in 1996 and electricity trading was
separated from electricity distribution. To start with the distribution was regulated with a
light-handed, ex post framework which concentrated in keeping tariffs low and stable.
Since 1996 there was an interim regulatory period in which prices were frozen, but in
2003 NPAM was introduced. It is a rather unusual form of regulation which uses
yardstick comparison for an area in which a distribution company has concession and
compares it to a fictive company with a fictive network serving the same customers in
that area. The development of NPAM was started in fall of 1998 as a reaction to the
regulation model in use in the beginning of deregulation due to the vague directions for
monitoring in the Electricity Act of 1997, and came into use in assessing the tariffs of
2003. Revisions of the Electricity Act in 2001 and 2002 gave a somewhat more stable
ground to base regulation of tariff on. [3, 11]
Of course the legislative work is ever forth-going and following a major storm in January
of 2005 the so-called Gudrun-laws were passed stating that DSOs are obliged to resume
supply within 24 hours of interruptions in the year 2011. This law came in to force in
January of 2006. [12]
4.1.3.1.2 Efficiency regulatory model
As mentioned above NPAM uses a yardstick based on a fictional grid and company in the
same area, with the same location and number of customers, as the real DSO operates.
The model compares the performance of the fictional company with the real one giving it
a grade of charging which is later used for selection of further audit. The ideal value of
charge rate is set to 1 but the limit for further audit was for 2003's tariffs set to 1.2. There
is also a quality index within the model which is explained below, but this has been
eliminated from audit selections. If deemed so, DSOs are required to pay back excess
income to the individual customers from the audited year.
DSOs are required for each year to report a number of inputs to EMI which include, on a
customer level:
X and Y location of customer
Maximum load (Effektabonnemang)
Delivered energy
Net income from customer
SAIDI and SAIFI, (aggregated for all customers during the whole year).
There is also a number of data from the real grid, such as line lengths, number of
transformers etc. to verify the feasibility of the fictional grid.
Based on the inputs given by DSOs the fictional grid is built through a number of
algorithms which will not be described here in a detailed level. From the fictional grid the
model calculates the capital cost that the DSO should have in association with the grid as
well as the operation and maintenance costs and this gives ground to comparison.
19
Other parameters give e.g. the customer related costs that the DSO should have. By
adding all these calculated costs, the model calculates the maximum income that the DSO
should be allowed to have.
In building the fictional grid the model starts by building a radial reference grid,
connecting all customers at all voltage levels and placing transformers connecting the
levels. Connection of loads, based on location and dimensioning of transformers, is
performed. Furthermore, as it is impossible to build a power grid in straight lines from
customer to customer, line lengths are adjusted depending on density of customers.
On top of the above a certain amount of costs are added, based on a number of
algorithms, for maintaining a certain level of reliability in the fictional grid. The cost
level corresponds to the cost that the customers are willing to pay for reliability in their
grid. It is those reliability costs that are the basis of the quality regulation. [11]
4.1.3.1.3 Quality regulation model
The basic idea behind the reliability costs added in the model is to limit the costs to the
level where customers are no longer willing to pay for the improvement. Whether this
corresponds to the point denoted the optimum quality level in figure 4 or if it means the
intersection between the two curves remains uncertain. The aim is to find the optimal
point of redundancy. Costs are decided through a number of steps where the grid is tested
and the method which gives the highest decrease of interruptions at the lowest cost is
chosen and added to the grid. With the whole grid in place simulations are done to get the
expected number and duration of interruptions per year. These interruptions are
subsequently associated with costs for customers affected. Customers are classified by
the customer density in the area where they are situated. The costs are said to include
both cost of interruption and the energy not supplied.
As DSOs report their real interruption statistics these are translated into the cost of
interruptions for the whole area for which the DSO reports. These are called reported
interruption costs. Through the following formula the quality of delivery addition is
decided:
Quality of delivery addition = +Yearly costs of redundancy
- (Reported costs of interruptions - Expected costs of interruptions)
There are some limitations in this formula. It can never become negative. Reported costs
can never be smaller than expected costs as that would imply that the DSO is supplying
customers with a higher quality than they are willing to pay for. The yearly costs are
calculated in the model for the grid with perfect correspondence between the cost of
redundancy and what customers are willing to pay for. Therefore the formula is limited
between a floor of zero and a ceiling corresponding to the yearly costs of redundancy.
Between them is a straight line. The addition is not a measurement of how much
redundancy is needed in the grid but rather a measurement of how much redundancy
customers are willing to pay for. [13]
20
The result of the formula gives an effect on the financial performance regulation. The
outcome of the financial regulation is a factor called net performance. The quality of
delivery addition affects this factor directly. In audit reports from STEM/EMI one can see
that for 2004 the addition, or more so the deduction, was 3% of allowed revenue on
average. The maximum deduction was 15%. For 2003 the average was 6% and the
maximum was 18%. [15]
From these reports it is not possible to see what the theoretical maximum impact is for
each company but 20% is the approximate maximum for one of the DSOs [1].
It is inherent in this quality regulation method that it is only a penalty scheme. The
optimum point of operation lies in the breaking point between the ceiling and the straight
line point down to the floor. Any DSO performing above this "hits the ceiling". It is
inherent in this model that it gives no incentives to outperform the optimum performance
as it is set to be the optimum. Taking a poorly performing DSO the floor catches this
DSO making the fee stop at a certain level so that the DSO may still be able to perform
financially.
Looking at results from pilot tests, one can see that without the limitations in the formula
the average addition is a deduction, so given the prerequisites of the model the average
DSO is performing somewhere along the floor. It is also worth adding that there are some
DSOs that receive 100% of the addition thereby performing along the ceiling. [13,15]
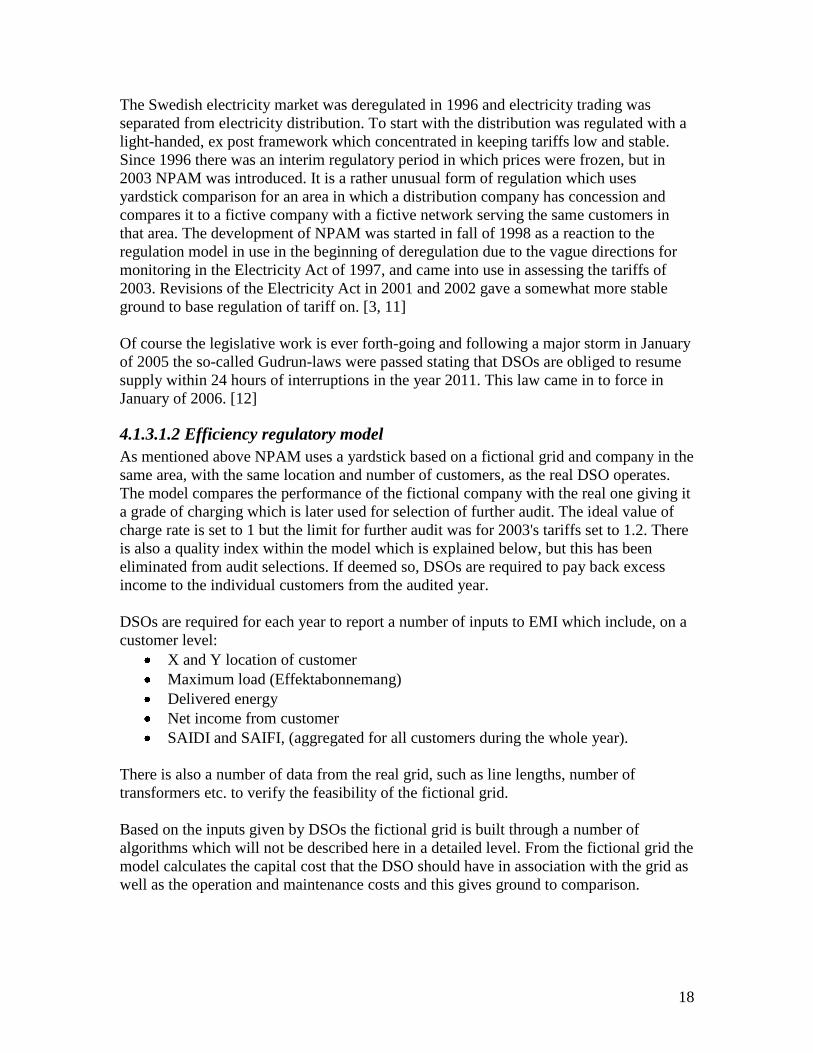
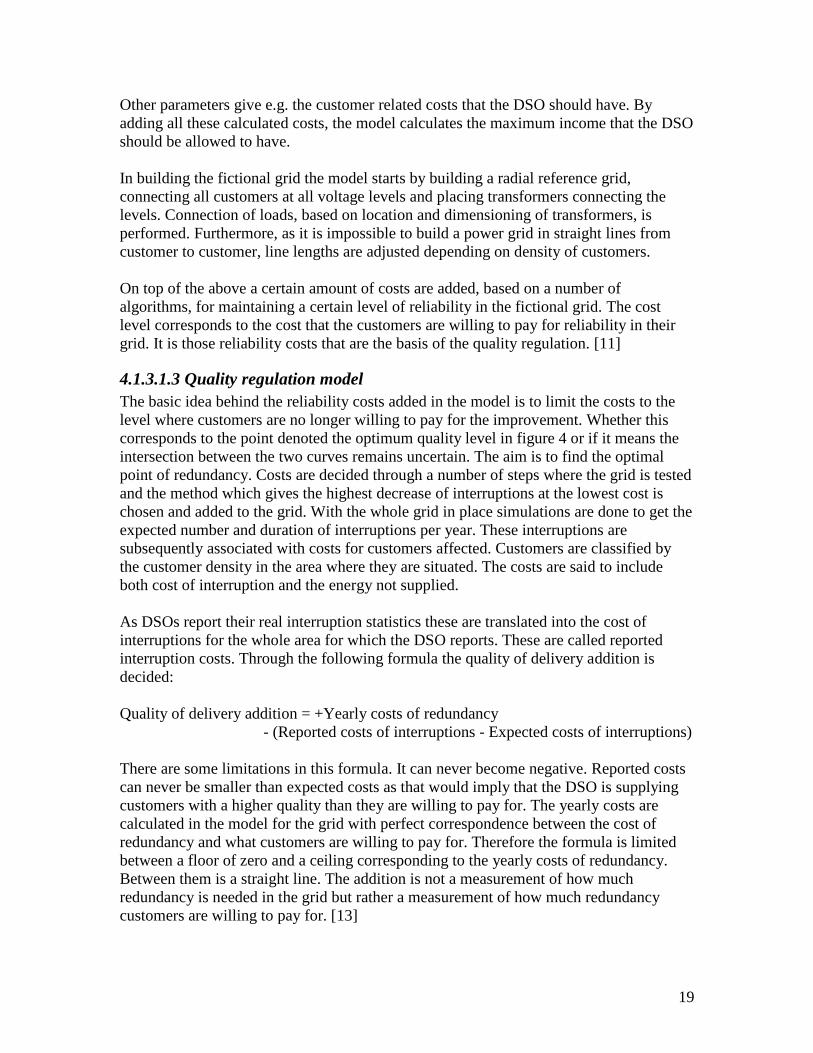
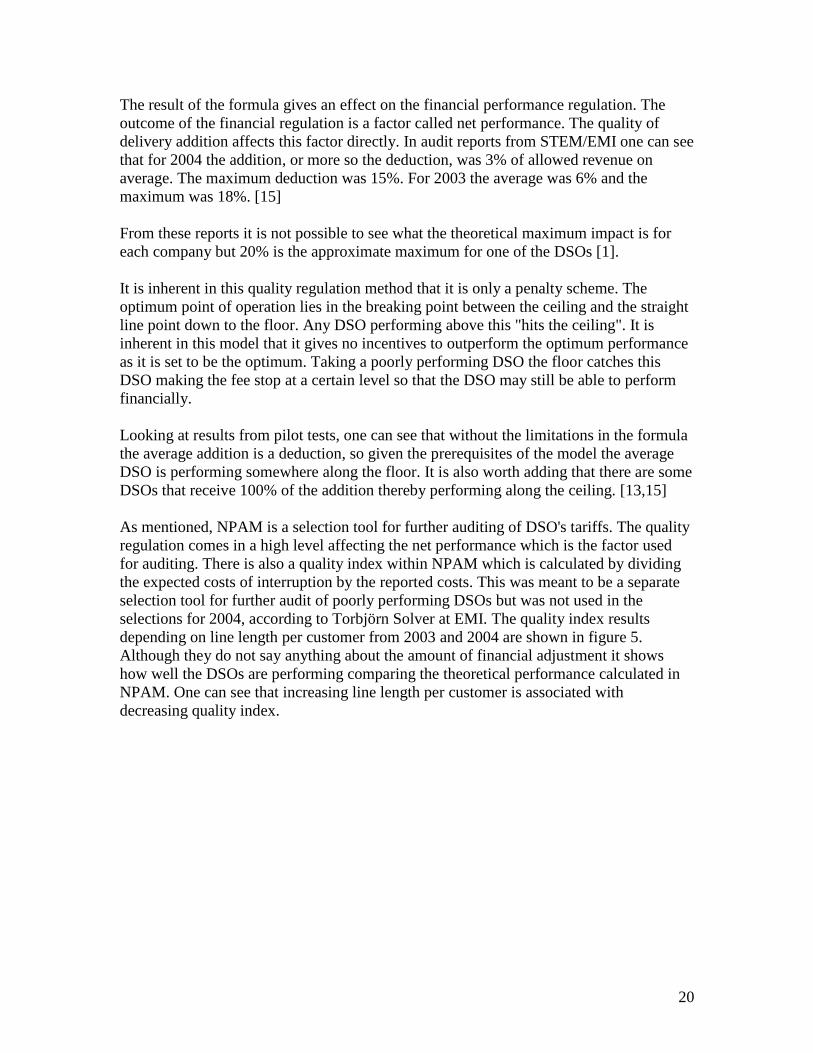
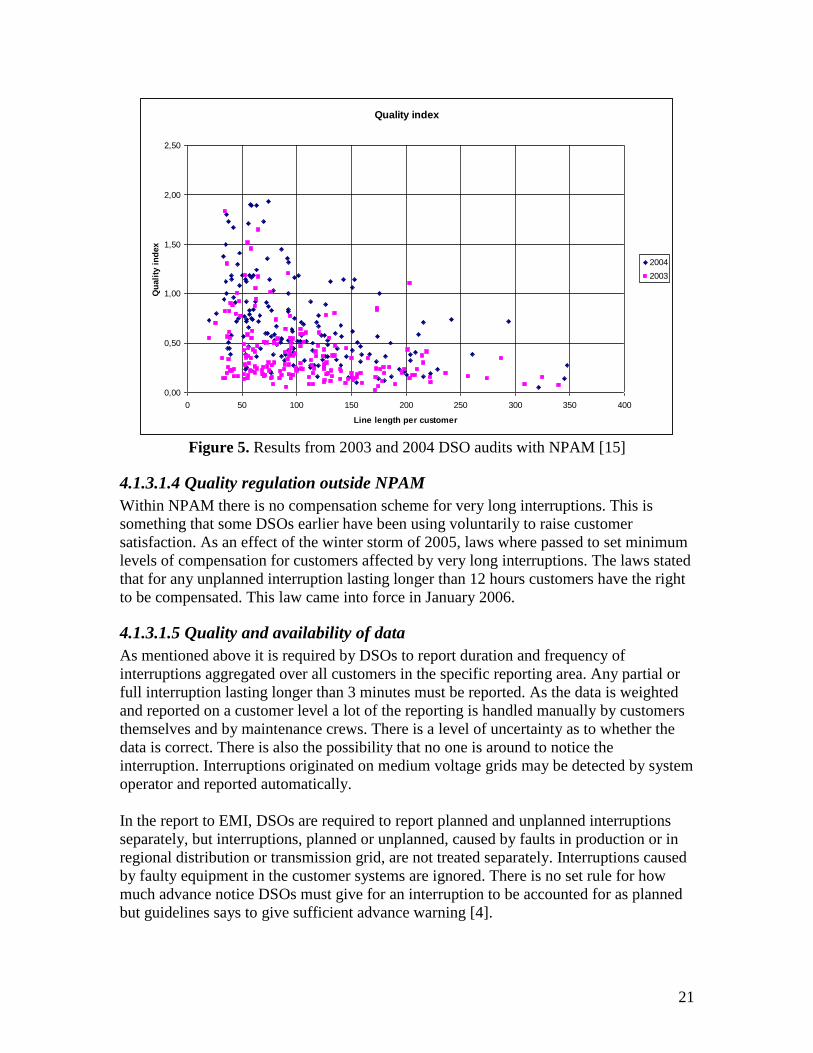
As mentioned, NPAM is a selection tool for further auditing of DSO's tariffs. The quality
regulation comes in a high level affecting the net performance which is the factor used
for auditing. There is also a quality index within NPAM which is calculated by dividing
the expected costs of interruption by the reported costs. This was meant to be a separate
selection tool for further audit of poorly performing DSOs but was not used in the
selections for 2004, according to Torbjörn Solver at EMI. The quality index results
depending on line length per customer from 2003 and 2004 are shown in figure 5.
Although they do not say anything about the amount of financial adjustment it shows
how well the DSOs are performing comparing the theoretical performance calculated in
NPAM. One can see that increasing line length per customer is associated with
decreasing quality index.
21
Quality index
0,00
0,50
1,00
1,50
2,00
2,50
0 50 100 150 200 250 300 350 400
Line length per customer
Qu
ali
ty i
nd
ex
2004
2003
Figure 5. Results from 2003 and 2004 DSO audits with NPAM [15]
4.1.3.1.4 Quality regulation outside NPAM
Within NPAM there is no compensation scheme for very long interruptions. This is
something that some DSOs earlier have been using voluntarily to raise customer
satisfaction. As an effect of the winter storm of 2005, laws where passed to set minimum
levels of compensation for customers affected by very long interruptions. The laws stated
that for any unplanned interruption lasting longer than 12 hours customers have the right
to be compensated. This law came into force in January 2006.
4.1.3.1.5 Quality and availability of data
As mentioned above it is required by DSOs to report duration and frequency of
interruptions aggregated over all customers in the specific reporting area. Any partial or
full interruption lasting longer than 3 minutes must be reported. As the data is weighted
and reported on a customer level a lot of the reporting is handled manually by customers
themselves and by maintenance crews. There is a level of uncertainty as to whether the
data is correct. There is also the possibility that no one is around to notice the
interruption. Interruptions originated on medium voltage grids may be detected by system
operator and reported automatically.
In the report to EMI, DSOs are required to report planned and unplanned interruptions
separately, but interruptions, planned or unplanned, caused by faults in production or in
regional distribution or transmission grid, are not treated separately. Interruptions caused
by faulty equipment in the customer systems are ignored. There is no set rule for how
much advance notice DSOs must give for an interruption to be accounted for as planned
but guidelines says to give sufficient advance warning [4].
22
When it comes to storms, lightning and other events for which DSOs cannot be held
responsible, there are ways of excluding these from performance data. Although faults
caused by a third part are reported separately, the cause of interruption is ignored in
Sweden and all interruptions are included in the performance data [4].
Sweden is one of few countries with an incentive-based regulatory regime which has no
audit of reported interruption data [4]. EMI does have some demands that the data must
be of good quality meaning it must be filed in running order and established in a
systematical way. However, laws passed after the winter storm of 2005 gives the
possibility to tighten demands of DSOs.
Metering in Sweden is something that is under development. Within a couple of years
each customer's meter must be read each month. Already, there is the possibility for
customers who require hourly metering to get that by covering the costs. There are
undergoing investigations concerning the increased metering demands and if they may
pave the way for more reliable interruptions metering at a customer level.
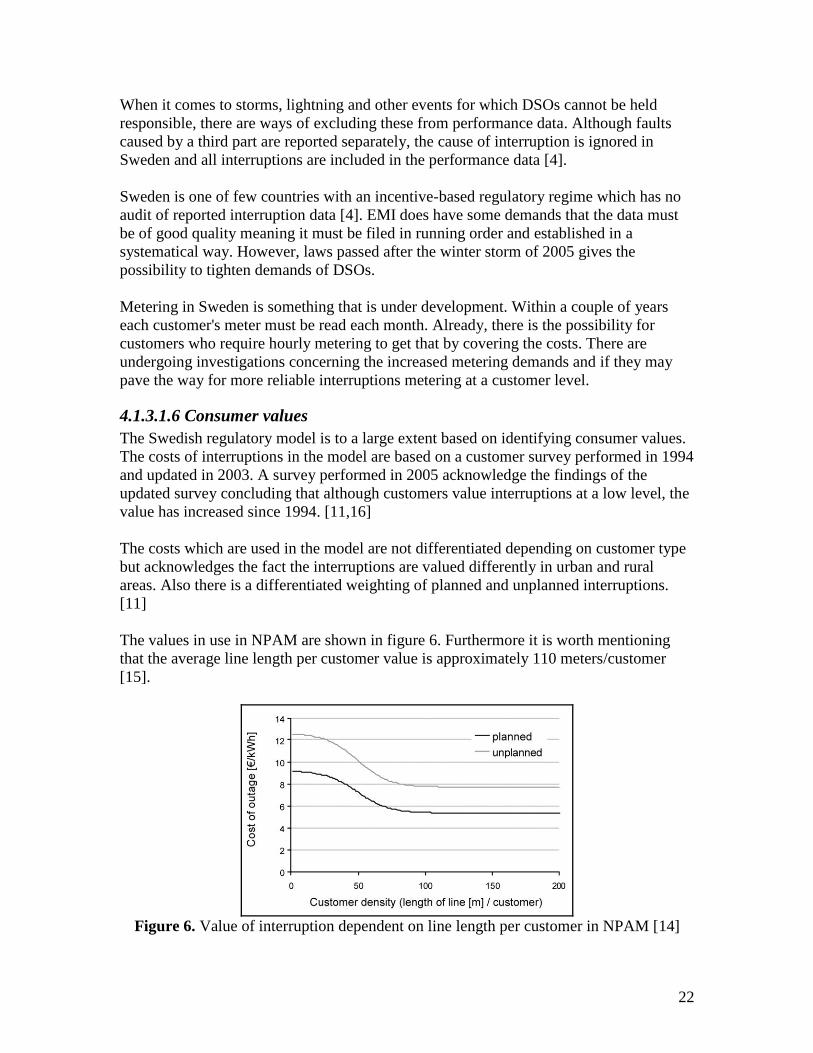
4.1.3.1.6 Consumer values
The Swedish regulatory model is to a large extent based on identifying consumer values.
The costs of interruptions in the model are based on a customer survey performed in 1994
and updated in 2003. A survey performed in 2005 acknowledge the findings of the
updated survey concluding that although customers value interruptions at a low level, the
value has increased since 1994. [11,16]
The costs which are used in the model are not differentiated depending on customer type
but acknowledges the fact the interruptions are valued differently in urban and rural
areas. Also there is a differentiated weighting of planned and unplanned interruptions.
[11]
The values in use in NPAM are shown in figure 6. Furthermore it is worth mentioning
that the average line length per customer value is approximately 110 meters/customer
[15].
Figure 6. Value of interruption dependent on line length per customer in NPAM [14]

23
4.1.3.1.7 Interruptions in Sweden
Over the last few years there have been some major interruptions in Sweden, especially
in the southern parts. In 2003 there was a major black out and in 2005 long interruptions
due to a major storm. There are certain areas which are always affected by weather
conditions such as heavy snow and wind. On a national average level Sweden is among
the best performers in Europe during a normal year. In the table below are the national
figures from 1999-2004.
Table 2. National interruption data from Sweden [4]
Interruption index 1999 2000 2001 2002 2003 2004
Unplanned SAIFI 1.38 1.23 1.34 1.32 1.64 1.05
Unplanned SAIDI 165.77 89.17 162.90 101.84 148.05 59.73
Planned SAIFI 0.45 0.25 0.23 0.26 0.22 0.22
Planned SAIDI 90.07 34.53 42.28 37.12 25.41 29.59
4.1.3.1.8 Acceptance of regulatory model
The NPAM has been used to audit the tariffs of 2003. From the results of the audit quite a
few DSOs have been deemed to have too high tariffs and must repay their customers
from that year. In some cases it is because of too high tariffs but sufficient quality, often
in urban areas, while DSOs in more rural areas should increase their quality and thereby
not risking further audit. The three big DSOs, Vattenfall, E-On and Fortum are all being
audited. Overall it can be said that the acceptance of this relatively new model is quite
low among the DSOs and court cases will be appealed to the highest legal instance. [15]
4.1.3.1.9 Summarizing pros and cons
To start out, the Swedish model aims to be a selection tool for further auditing of DSOs
that are not performing well. It has not been in use for long and may need further
adjustment, although it has been under development since 1998 [11]. As Sweden has a lot
of reporting areas and a relatively small authority dealing with regulatory issues, it is a
good approach to have a model for making a first assessment. And the intention of
finding the optimal way of operating and maintaining a grid is good.
The quality regulation is an incentive-based model but has the initial view of the optimal
point of operation. Companies have no incentives to outperform the optimal point even if
they should find a cheap and efficient way of doing so. Companies which today are
outperforming the optimal have the incentive to lower their quality standard. Companies
which are performing at floor level have no incentives to increase their quality unless
they are close to the beginning of the upgoing line on which they are less penalized for
their increasing performance. As the quality index is no longer used for selection for
further audit poorly performing DSOs have incentives to decrease their quality. As shown
by the fact that the average DSO is performing at the floor there are companies facing
this perverse incentive. By introducing minimum compensation levels enforced by law
for very long interruptions one might hope that this would help the worst served
customers.
24
Even though the performance model may be a good way of measuring performance in the
financial area the output of the model is only as good as the input. As mentioned the
reporting of interruption data is done at a low-tech level and the accuracy may be small,
this leading to results of the model's quality addition being uncertain.
The use of a model grid for comparison is a rather deviant approach but it has advantages
for a small regulatory authority. However, the fact that it creates a model of the grid and
has to make simplifications which act in both positive and negative ways for customers
and DSOs give rise to skepticism and may lower acceptance. Changing parameters for
model grid creation and changing input may result in completely different results
compared to before, affecting the optimal quality level and the parameters for the quality
addition. Also small changes in customer configuration may result in large differences in
outcome.
More so the focus is put on domestic customers and their willingness to pay through
aggregating all customers and not weighting in industrial customers' higher costs of
interruptions. One can also argue that the approach of basing allowed costs on results of
customer survey may give subjective results. And again the input for a model of any kind
should be of high accuracy.
The reliability statistics are not fair in the sense that all interruptions independent of cause
are included in the review of DSOs. Faults in higher levels of the grid are regarded as
being the responsibility of the DSO.
Authority's pros:
A model as a selection tool with limited amount of input results in small amount
of work during yearly auditing suitable for a small authority.
Model results are easy to interpret and;
may grant acceptance with non-industry interests.
Authority's cons:
The model has resulted in many complaints causing;
change of parameters and;
lengthy court cases
Customers' pros:
As for authority, results are easy to interpret.
Model focuses on customers' values.
All customers are valued the same, placing emphasis on domestic customers.
Additional Gudrun-laws will increase quality in worst served areas.
Not separating interruptions by cause places risk on DSO instead of customers.
Customers' cons:
NPAM itself does not give incentives to increase quality in worst served areas.
25
DSOs' pros:
Some simplifications in the model design acts to overcompensate DSOs.
Gudrun laws have given clear incentives for investments which NPAM has not
been able to.
DSOs' cons:
Some simplifications in the model design acts to under-compensate DSOs.
Quality adjustment only works for those performing lower than the set optimal
but not too low.
Repayment to customers due to overcharging requires much administrative work
and;
long court cases may increase this work.
Interruption statistics are not affected by cause or by which customer groups that
are affected.
Regulation period only last one year which makes long term planning hard and
variations in interruptions are not smoothened over a longer period of time.
4.1.3.2 Norway
4.1.3.2.1 Prerequisites
In Norway there are approximately 170 distribution system operators and 150 of them
operate and own local distribution grids. 75 of the DSOs also own and operate regional
distribution grids. Most of the local DSOs are municipal.[3]
The Norwegian regulatory authority is NVE. DSOs report economic and technical data to
NVE on a yearly basis. [3]
The electricity market has been deregulated since 1990 when a new electricity act came
into force. Since then there has been some changes in the electricity laws and regulation
and focus has been put more and more on quality. Starting out in 1991, the economic
regulation was rate of return-type and had no distinct quality regulation, although DSOs
were required to report information on quality. In 1995 it became mandatory for DSOs to
report any interruption longer than 3 minutes at a customer level and in 1997 the
regulation was changed to a revenue cap method. Since 2001 the revenue caps have been
quality dependent to counteract the possible under-investments associated with the strong
costs cutting incentives of revenue regulation, the arrangement is CENS. This
arrangement is reviewed together with other aspects of quality than long
interruptions.[3,17]
4.1.3.2.2 Efficiency regulation model
As mentioned, NVE uses a revenue cap regulation. This works by benchmarking each
DSO and yardstick comparison. The regulation period length is 5 years and the current
one ends in 2006. The efficiency and quality regulations are separate and the efficiency
regulation will be described below.[3]
26
At the start of a regulation period DSOs are given targets of efficiency based on figures
from earlier regulation periods. The figures are analyzed through an economic efficiency
model and compared to other DSOs on a local and regional level. [18]
There is an initial efficiency requirement of 1.5% and from the efficiency model there
can be added additional requirement ranging from zero to approximately 5%. Within this
requirement the DSO can work out their tariffs. [18] There is also a minimum rate-of-
return on capital of 2% and a maximum of 20% [19].
NVE examines efficiency and updated incentives for DSOs each year. If revenues for
DSOs are more than the revenue cap allows NVE can take legal action requiring DSOs to
pay back money to the customers through lowering tariffs the following year. If the
opposite should occur DSOs are allowed to raise tariffs to recover lower income. [18]
4.1.3.2.3 Quality regulation model
The quality regulation in Norway is based on the CENS arrangement. CENS is short for
cost of energy not supplied. Earlier in this report ENS was explained as a reliability
index. In Norway this index is used multiplied by standard costs of interruptions to get a
total interruption cost. The aim is to find the optimal level of operation from a socio-
economic view by letting this affect the revenue caps.[18,20]
The standard costs are based on a number of customer surveys and customers are divided
into six cost groups based on their cost of interruptions according to the table 3. There is
a further separation of customers into 26 customer groups in the reporting scheme but
cost are just separated into 6 groups. [21]
Table 3. Customer groups value of interruption in Norway [21]
Customer group Interruption cost,
unplanned [NOK/kWh]
Interruption cost, planned
[NOK/kWh]
Industry 66 46
Commercial 99 68
Agriculture 15 10
Domestic 8 7
Public business 13 10
Wood, paper and energy
intensive industry
13 11
Interruptions at distribution transformers and medium voltage customers are recorded and
have an effect on the CENS. Since the reporting is carried out at a transformer level each
transformer has data on the composition of customers connected to it. There are also
standard load curves for customer groups in order to estimate the load during
interruption. Together with the costs for customers groups for each reported interruption
a CENS-value can be calculated. By adding all interruptions at every delivery point the
total CENS-value is calculated. [22]

27
TSOs are regulated using the same regime as for DSOs [4] and the CENS associated with
faults in the medium and high voltage grid are contributed the grid operators CENS,
according to Brekke Karstein at NVE.
The revenue cap is not changed with the total amount of CENS for a DSO but rather the
deviance from the expected amount of CENS. The expected CENS is set by NVE based
on historical ENS data and other variables such as weather condition, energy supplied
and network extension. The expected CENS is individual for each DSO. This model will
not give the optimum level of quality but describes an average value of quality today.
[20]
There are no actual limitations in the quality adjustment through CENS, neither floor nor
ceiling. However, again according to Bjekke Karsten at NVE, the limitation in the
efficiency regulation in practice limits the impact of quality. The expected CENS is set ex
ante and the change of revenue cap is set ex post. A permanent shift in quality results in a
permanent shift in revenue cap unless expected CENS is changed. Furthermore, DSOs
are not allowed to change their tariffs if the change in CENS is due to stochastic
variations as most changes in interruptions are. The small changes are accumulated over
the regulation period. The tariffs should only change if DSO expectations deviate from
the regulators. [20]
CENS was introduced with the notion that DSOs must find their own optimum level of
quality as it is impossible for the regulator to find the optimum for each DSO. As
mentioned, the initial expected CENS is not the optimal but a description of the average
for each DSO and introduced as a starting point to see to that operating results do not
drastically change for the DSO. [20]
In 2007, NVE will introduce a direct compensation scheme for very long interruptions.
The threshold will be 12 hours [23]. There are also discussions on including the CENS-
arrangement in the efficiency model [24]. Furthermore the inclusion of interruptions in
the low-voltage grid and the possibility of making CENS into a compensation scheme are
being discussed [25].
4.1.3.2.4 Quality and availability of data
The CENS-arrangement places high focus on the quality of data as the requirement is to
report interruptions for each medium voltage customer or delivery point. Any interruption
lasting longer than 3 minutes is to be reported including interruptions caused by third
parties. NVE can exclude certain events from CENS based on applications from the
DSOs but that has not happened since the CENS-scheme was introduced in 2001.
Planned and unplanned interruptions are differentiated. As in Sweden, the requirement
for notification of interruption has to be sufficient. Also interruptions shorter than 3
minutes are reported according to requirements from NVE but are not used in the
regulation. In total the duration, frequency and energy not supplied are separated by
voltage level and per customer group [4,19].

28
NVE has had mandatory reporting since the deregulation in 1991 [26] and during the first
years a reporting tool called FASIT was developed by the industry organization[4].
FASIT is used to report interruptions and fault in the power system. DSOs are required to
report according to FASIT. In total there are more than 120000 points of measuring and
reporting [27].
Included in the CENS-arrangement is the use of load profiles. The profiles are
determined through hourly metering for at least a year and the method for determining
should be well-documented. The load curves are separated per customer category and
there are 11 curves available [22].
Although the reporting method is well-established, NVE conducts audits of reported data
by controlling samples of the reported data and the reporting method. If errors are
detected the DSO involved receives a deadline for correcting the errors. If failing to meet
this deadline, the DSO is fined daily until corrections are made [4].
Taking into account both the accepted and established method of reporting and audits of
reported data, the quality and availability of data used in the quality regulation model can
be said to be satisfactory.
4.1.3.2.5 Consumer values
As for Sweden, focus has been put on what customers are willing to pay for quality of
supply through introduction of the CENS-arrangement. The CENS levels are determined
through customer surveys [26].
A customer survey was conducted in 1991 and again in the early 21st century [17]. At
first there were only two customer groups in the CENS-arrangement [20] but in 2003 this
was updated and customers were divided into six groups instead [21]. While there is a
separation of cost groups there has been no separation between urban and rural areas, as
seen in table 3.
4.1.3.2.6 Interruptions in Norway
NVE has decided that DSOs must report SAIDI and SAIFI data starting from 2006 so for
now there is no data on the indices [4]. However, ENS-values have been reported for a
relatively long time. Over the last couple of years, with the CENS-regulation in place the
total ENS-values have gone down, mostly the planned interruptions have decreased.
During the regulatory period, before 2002 and the introduction of CENS, Norway saw a
decrease in both planned and unplanned interruptions [27].
4.1.3.2.7 Acceptance of regulatory model
The model for regulating quality in Norway has been used during this last regulatory
period, ranging from 2002 to 2006. Although a new overall regulatory model is being
discussed, the CENS-arrangement is still considered as a part of the new model [23]
granting it some acceptance. There have not been any big court cases concerning the
CENS-arrangement during the last regulatory period other than a company wanting to
exclude CENS originating from a storm in 2001. Recently the ruling against the company
was announced, according to Carl-Petter Haugland at NVE.
29
4.1.3.2.8 Summarizing pros and cons
The quality regulation model sets out to find the optimal level of quality for each DSO.
However, it does not aim to find the optimal level itself but rather creating incentives for
the DSO to find this level itself. The reason for this approach has been that no regulatory
authority can have all the information to set the optimal level for every DSO. This gives
credibility to the authority and freedom of operation to the DSOs.
In the CENS-arrangement there is neither ceiling nor floor of the effect of CENS. This
puts weight on the certainty of customer valuation of quality as it may create incentives
for over- or under-investments if the values for customer groups do not coincide with
reality. The removal of the floor may result in a large effect on a certain DSOs which
may not have the financial ability to handle the decrease of allowed revenue. As there are
no compensations for very long interruptions there is probably need to remove the floor
to include the worst served customers. As mentioned, there is no ceiling in the model and
there is no need to have one as there are no incentives for over-investing in quality.
NVE sets initial values based on historical data and real conditions. Perhaps this can give
rise to questions about weighting different parameters but as this is only used for an
initial comparison the impact of this initial value may not be large.
The requirements for input to NVE in terms of quality are quite large and the amount of
measuring points is also large. Increasing demands from NVE may lead to large costs for
DSOs. As the low voltage grid is ignored in the data, many interruptions may be
overlooked. An inclusion of the low voltage grid may have a large effect on DSOs.
In Norway customer groups are separated in their valuation of quality. In itself this is
good as most surveys conclude that different customer groups value quality completely
different. However, this creates incentives to invest accordingly perhaps getting a quality
which is more skewed than the valuation.
DSOs are not required to pay back customers in real money but rather in changing tariffs.
This is a practical approach but may exclude some customers that, for example, have
moved during the year.
Having the regime applied to TSOs as well is good as that aims to include the more of
chain of transport of electricity and that places regulatory impact where it is needed.
Authority's pros:
Good acceptance of regulation model from both customers and industry.
Model decreases work load placing it on DSOs to find their own optimal quality
level.
Authority's cons:
Heavy work load due to reporting requirements and setting initial values.
30
Customers' pros:
Customer values are taken into account and;
placing emphasis on the customers that are willing to pay through;
differentiated customer groups.
Stable tariffs due to smoothing of regulatory effect.
Customers' cons:
Some customers may experience decreasing quality as they are put in a customer
group which does not reflect their own values.
Faults in the low voltage grid are not included which means a customer
experiences a larger number of interruptions than statistics show.
No special interest in the worst served customers.
DSOs' pros:
Freedom to set their own optimal quality.
Incentives to focus on customer groups willing to pay for quality.
Compensation for under- or over-performance is paid back through changes
tariffs and can be smoothened over the regulatory period.
Exclusion of the low voltage grid in interruption statistics.
Well-established reporting method.
DSOs' cons:
No floor in quality adjustment scheme may cause a severe financial effect.
Initial values of quality may be misguiding.
4.1.3.4 Great Britain
4.1.3.4.1 Prerequisites
There are 14 distribution areas in Great Britain, operated by 7 DSOs which are regulated
OFGEM which is governed by an authority consisting of expert representatives from
concerned branches of society. [2,28]
In addition to the 7 DSOs there are also 3 other DSOs, so-called independent, which are
not completely included in the regulation. The special rules for the independent DSOs
will not be described in the report. The independent DSOs operate and own networks
connected to other distribution networks built after 2000.[29]
Great Britain was a pioneer in Europe when it comes to deregulation of the electricity
sector. The deregulation started in 1990 and was a part of a wave of privatization and
deregulating of other state-owned industries. The industry was completely deregulated in
1996. The distribution section of the industry has been subject to many attempted and
successful mergers. [30]
31
The method of regulating the distribution system operator is and has been, since 1990,
through revenue caps with different evaluation factors [31].
4.1.3.4.2 Efficiency regulation model
As mentioned above OFGEM sets allowed revenues in accordance to guidance by
government departments concerning social and environmental issues. External
consultation is also used for financial efficiency evaluation of DSOs. The revenue cap is
individual for each distribution area and company on base of reported efficiency data.
The current regulatory period lasts from 2005 to 2010. Revenues are set for the whole
regulation period and are decided on together with the DSOs. [28]
4.1.3.4.3 Quality regulation model
The quality regulation in Great Britain is based on revenue cap changes and customer
compensation. The first version of the quality regulation model was introduced in 2002
and has been updated but is basically the same as then. In the current regulation period
OFGEM has set targets for significant improvements for each DSO together with strong
incentives to meet and beat these targets by increasing the impact of quality on revenues.
[28]
The British model uses CI and CML indices for determining performance by DSOs.
These indices are described above in chapter 3 and are more or less the same as SAIFI
and SAIDI. For each DSO, OFGEM sets targets to be achieved each year of the
regulation period until 2010. A long term goal for 2020 is also set. The average
improvement until 2010 is set to approximately 10% for CML and 1% for CI. [28]
To set these targets, OFGEM uses historical data together with a benchmarking process
comparing the DSOs. OFGEM creates a number of circuit groups from performance data
and physical characteristics on all medium voltage circuits from every DSO. Circuits are
classified so that physical differences are minimized and no DSO is dominant in a group.
Each circuit group is then benchmarked for performance and each DSO gets its targets
depending upon composition of circuit groups. [32]
As mentioned, revenue is affected by interruption performance. In the current regulation
period 3% of revenues are subjected to risk as cause of failing to meet interruption
targets. But the incentives scheme is symmetrical so there is a possibility of getting an
increased allowed revenue of 3%. In the scheme 1.8% is affected by CML and 1.2% by
CI in accordance with identified customer values [33]. Planned interruptions are weighted
by 50% for both CI and CML. Unplanned by 100% for both indices. Interruptions due to
faults in transmission or other connected networks are weighted by 0% for CI and by
10% for CML. [28]
In addition to the revenue capping mechanism there is also a standard of performance for
supply restoration as in many other countries. But OFGEM has separated events related
to normal weather conditions and severe weather conditions on different levels. For
normal weather conditions any domestic customer is entitled to £50 if their supply is not
restored within 18 hours. Non-domestic customers receive £100. For each subsequent 12
32
hours another £25 is received. No capping is applied. If weather conditions are deemed
severe, which is depending on duration and number of customers affected, the trigger
period for payment is longer. There are additional rules for the Highlands and islands and
for weather condition directly hindering personnel from restoring supply. [28] DSOs are
not liable for compensations due to transmission interruptions.[34]
While there are revenue caps and compensation schemes, OFGEM also lets quality affect
finance on a more detailed level. In accordance with increased demands on quality DSOs
are allowed more expenditure for managing to reach set target. If there should be
exceptional events DSOs get higher cost allowances for restoration. [28]
In Great Britain TSOs are regulated using a set value for ENS with a adjustment span of
+1.0% to -1.5%. Currently only the English TSO is regulated through this scheme,
however, the Scottish is meant to be included. [35] As mentioned earlier transmission
losses are in principle handled solely by TSOs. However, there is no compensation
scheme for very long interruptions concerning transmission [35].
4.1.3.4.4 Quality and availability of data
The interruption data from DSOs are reported at a customer level. DSOs are required to
know how many customers are affected by interruptions on each low voltage feeder. This
is called a connectivity model. The same method is used, but in more detail, in Norway.
As always, when reporting interruptions at a customer level, reliability of data may be
low. However, OFGEM hires consultants to perform audits on reported data from DSOs.
[4]
There is another similarity with Norway with the requirement to report short
interruptions. As for the Norway case, there is no inclusion of short interruptions in the
incentives scheme.[4]
A very interesting part of the British regulation is its recognition of weather events
affecting DSOs, changing compensation levels as one effect. This, of course, requires
information about the weather and events that might affect customers. To be accounted
for as an exceptional event DSOs must report the event to OFGEM within 14 days and if
so, the appropriate changes to compensation can be made. [28]
It is also possible to exclude certain exceptional events from performance data. The effect
of these events must be out of the DSOs control if such exclusion is to be considered.
Such events are defined as caused by third party, act of God or which are outside DSOs
experience. [28] Since there is this distinction between fault caused by DSO and outside
problems, statistics on performance may be fairer.
As there is different weighting of unplanned and planned interruptions it is important to
give notice to customers when conducting maintenance. The advance notice minimum is
48 hours in Great Britain. If there is agreement with affected customer it can be shorter.
[4] This may give rise to subjective reporting.
33
4.1.3.4.5 Consumer values
Consumer values have been taken into account when designing the British quality
regulation model. It is not as visible as in Norway and Sweden where an exact amount
has been set for interruption and has been included in the model.
In 2004 there was a customer survey determining the willingness to pay for quality. From
this survey OFGEM found that people are willing to pay for increased service.[36]
Therefore the quality regulation is designed to increase quality with adjusted revenues as
an incentive [28].
4.1.3.4.6 Interruptions in Great Britain
According to statistics gathered by CEER, Great Britain has a low rate of interruptions
both in frequency and duration compared to the other European countries included in the
statistics. Since the introduction of the quality regulation Great Britain has experienced a
significant decrease in both CI and CML. [4]
4.1.3.4.7 Acceptance of model
OFGEM is a relatively big regulatory authority and together with the fact that the number
of DSOs is small, it has the ability to conduct much work for each DSO. The regulatory
model is easy to comprehend and adjust together with the DSOs. Without any facts on
appeals or protests against OFGEM, the regulatory model's acceptance has potential for
being high.
4.1.3.4.8 Summarizing pros and cons
OFGEM has chosen a regulatory approach which suits them quite well as they have a
relatively large amount of resources. The regulation model requires some work in
determining individual and long term targets for each DSO. The acceptance for such an
approach may be low and not that transparent if it is not designed together with involved
parties. It is also not completely transparent how customer values are integrated in the
regulation which may lower acceptance with customers.
In the model there is no distinction between customer groups in the tariff control. This
places the emphasis on the domestic customers which may not reflect the real demands in
distribution quality. However, there is a distinction of compensation levels between
domestic and non-domestic customers affected by very long interruptions.
Even though the tariff control is symmetric around the set targets there are some negative
sides to having a limited amount of revenue subjected to risk, in other words having a
floor and ceiling in the caps. DSOs operating on the floor somewhat distant from the
quality slope do not have obvious incentives to improve quality, rather the opposite, as
where DSOs operating on the ceiling level also have incentives to reduce quality as they
will not loose any revenue.
The use of a compensation scheme for very long interruptions helps the worst served and
creates incentives to improve quality in these areas. The possibility to exclude some
34
events from performance data and getting lower compensation levels in some cases may
create incentives not to take steps to prevent the effect of these events.
The overall economic effect of the regulation model is uncapped but the tariff impact is
quite low, even though it has increased. Such small effect may be seen as only a penalty
or reward and not as incentives for change. However, the long term targets lets OFGEM
know if DSOs are keeping up and they may take special actions to make everyone follow
their plan.
Authority's pros:
Inclusion of DSOs on an individual level in the regulation design grants
acceptance.
Authority's cons:
Heavy work load before each regulatory period.
Customers' pros:
Emphasis on domestic customers.
Compensations for customers in worst served areas.
Customers' cons:
Emphasis on domestic customers.
Exclusion of extreme events may cause needed investment to forgotten.
Exclusion of interruptions due to events outside of DSOs responsibilities puts the
risk on customers.
Customer values are not included in a clear way.
DSO's pros:
Clear targets to meet, short and long term.
Clear rewards and penalties according to targets.
Exclusion of extreme events and interruption caused by others.
DSO's cons:
An overall strict regulation.
Short and long term goals may prevent innovations.
4.1.3.5 Other regulation approaches
As mentioned there are many variations within the three main regulation model
approaches which the three above have been made to represent. Below there will be an
attempt to exemplify these variations and present interesting facts on work in other
countries.
4.1.3.5.1 Spain
The Swedish regulatory approach has been described as rather unique or at least deviant
from others. Spain is among the few other that use a fictional grid as reference for
35
performance and setting initial revenue caps. The model is more detailed than NPAM and
takes into account for example geographical and typographical restraints. The quality
regulation is carried out through interruption duration and frequency targets on a system
and customer level. Areas are divided into four density groups. If the system levels are
exceeded DSOs are obligated to make an improvement plan to be approved by authority.
If the plan is delayed or fails in any another way, DSOs can be penalized. If customer
target levels are exceeded, compensation of five times the price of ENS is paid to the
affected customer. If this should happen this is the only direct transfer of money between
customer and DSO, as other transaction takes place through regulator. [1]
4.1.3.5.2 Netherlands
The Dutch regulation is based on quality dependent price caps. The quality factor is set
ex-ante and from statistics from the two previous regulation periods. Since the
Netherlands is only in their second regulation period with the current regulation, the
factor is set through a method other than described in the regulation. Any deeper
description of the methods will not be presented here but in short it uses SAIDI, SAIFI
and CAIDI and weighting by customer type and different value is set on frequency and
duration. [1]
The reason for mentioning the Dutch regulation in this chapter is the long history of
interruption recording and the well-established reporting system. The system of reporting,
which is called Nestor, has been in use since 1976 [37]. The reporting includes SAIFI,
SAIDI and CAIDI according to international standards but also underlying causes and
other characteristics of interruptions. Work has been done to streamline the reporting of
DSOs to make the data more comparable [38]. By having a usable reporting system in
place data for a regulatory model may already be available and transition periods may not
be long.
4.1.3.5.3 Italy
While many authorities require reporting by company, in Italy the reporting is on a
territorial level where each territory is made up by all the municipals which have the
same population density and are served by the same DSO.[4]
Other than the different division of reporting areas there are a couple of things that makes
Italy interesting. Remaining at a reporting level, DSOs are required to have automatic
monitoring of interruptions on all medium and high voltage lines thereby knowing which
medium and high voltage customers and which transformers that are affected. To know
how many low voltage customers that are affected DSOs are allowed to use an averaging
method. [4] In comparison, in Norway, NVE demand a customer composition of each
transformer.
Additionally, the set targets for DSOs have a dead band of ±5% meaning that there is a
tolerance level from authority where no action is being taken. This dead band exists to
compensate for natural variations, for example varying weather conditions. [39] Italian
authority also requires reporting of short interruptions and separating short interruptions
and transients [4].
36
4.1.3.5.4 Hungary
In most countries with a quality dependant tariff control, the effects are symmetrical
meaning that the scale of cap change for example is the same when outperforming as
when failing to meet targets. Sweden has a semi-symmetrical system as the model in use
considers the optimum level of quality the maximum level for which DSOs can be
compensated. That aside, Hungary has adopted an even more asymmetrical model. The
authority sets targets for three reliability indices, including SAIDI and SAIFI. When
outperforming target by 10% by any of the indices not failing to meet target by the
others, the DSO can increase their profit by 10%. When underperforming in the 5-10%
range, the tariff decrease by 0.5% per index underperforming. If underperformance is
larger than 10% the decrease is 1% per index. There are also asymmetrical fines for
failing to meet other targets. [4]
4.1.4 Conclusions on regulation of continuity of supply
Every quality regulation model which has an active impact on tariffs and require
compensation to customers use continuity of supply as a measure for deciding the level of
impact or compensation. This is the aspect of quality which is most visible for customers,
DSO and authority through the obvious costs of an interrupted electricity supply. As seen
in the topics above, there is a number of ways of regulating continuity. The Norwegian,
Swedish and British models summarize most of the models in use.
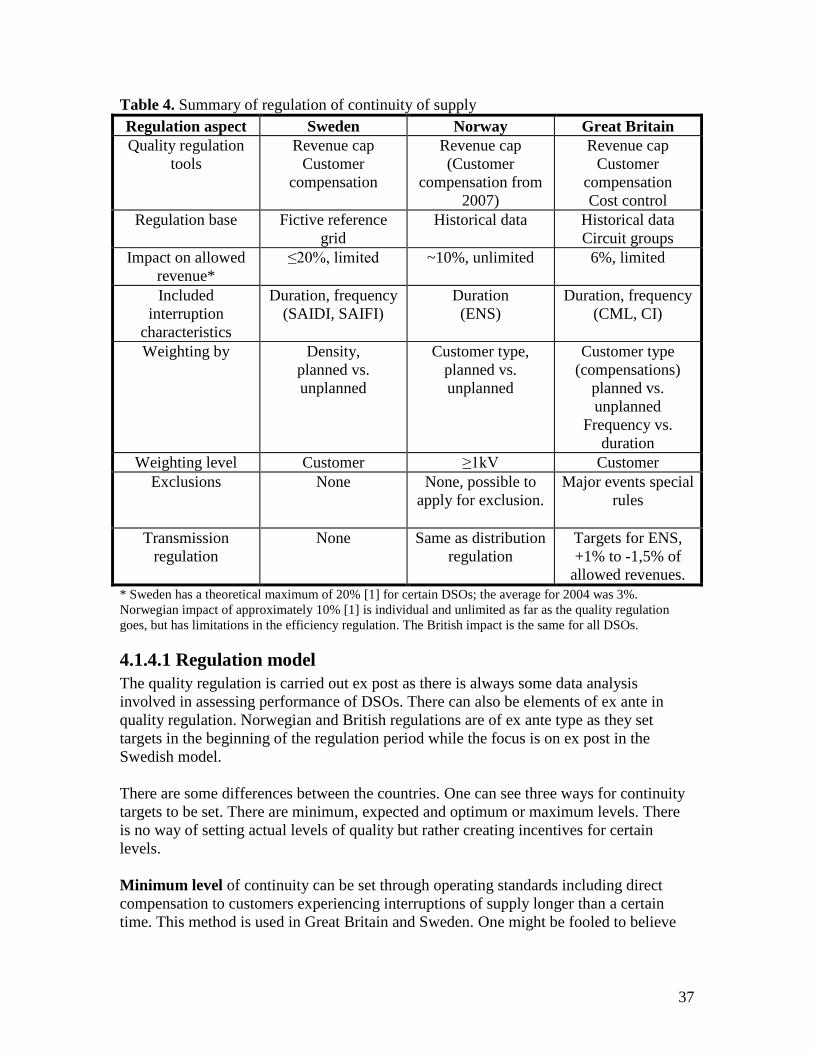
37
Table 4. Summary of regulation of continuity of supply
Regulation aspect Sweden Norway Great Britain
Quality regulation
tools
Revenue cap
Customer
compensation
Revenue cap
(Customer
compensation from
2007)
Revenue cap
Customer
compensation
Cost control
Regulation base Fictive reference
grid
Historical data Historical data
Circuit groups
Impact on allowed
revenue*
≤20%, limited ~10%, unlimited 6%, limited
Included
interruption
characteristics
Duration, frequency
(SAIDI, SAIFI)
Duration
(ENS)
Duration, frequency
(CML, CI)
Weighting by Density,
planned vs.
unplanned
Customer type,
planned vs.
unplanned
Customer type
(compensations)
planned vs.
unplanned
Frequency vs.
duration
Weighting level Customer ≥1kV Customer
Exclusions None None, possible to
apply for exclusion.
Major events special
rules
Transmission
regulation
None Same as distribution
regulation
Targets for ENS,
+1% to -1,5% of
allowed revenues.
* Sweden has a theoretical maximum of 20% [1] for certain DSOs; the average for 2004 was 3%.
Norwegian impact of approximately 10% [1] is individual and unlimited as far as the quality regulation
goes, but has limitations in the efficiency regulation. The British impact is the same for all DSOs.
4.1.4.1 Regulation model
The quality regulation is carried out ex post as there is always some data analysis
involved in assessing performance of DSOs. There can also be elements of ex ante in
quality regulation. Norwegian and British regulations are of ex ante type as they set
targets in the beginning of the regulation period while the focus is on ex post in the
Swedish model.
There are some differences between the countries. One can see three ways for continuity
targets to be set. There are minimum, expected and optimum or maximum levels. There
is no way of setting actual levels of quality but rather creating incentives for certain
levels.
Minimum level of continuity can be set through operating standards including direct
compensation to customers experiencing interruptions of supply longer than a certain
time. This method is used in Great Britain and Sweden. One might be fooled to believe

38
that setting a floor for penalties in tariff control creates a minimum level of quality but as
described earlier it rather creates incentives to decrease quality even more.
Expected level of continuity is, in a model with symmetrical tariff control, the point
where penalty or reward is paid. Among the three thoroughly described models, this only
applies in full to the British model. Although there are operating points in both the
Swedish and Norwegian model where there are no rewards or penalties.
The Swedish and the Norwegian model both tries to make DSOs operate at an optimum
level. In Sweden the NPAM decides what the optimum level is and if DSOs operate
below that they are penalized. Operating above optimum gives nothing extra. In Norway,
authority makes no attempt to find the optimum level of quality. It is up the each DSO to
find their own optimum level, theoretically when investment costs are the same as
avoided cost for interruptions but more probable is that the optimum level for DSOs
occur when the profit for quality is the largest. The penalties or rewards are not limited
and are dependent on an initial value reflecting on historical data. In a way, the optimum
can also be called the maximum as there are no incentives for outperforming the optimum
levels.
In figure 7 there is a summary of the tariff impact in the three quality regulation models.
Great Britain has structured the limited impact with a set expected value in the middle (2)
with a floor and a ceiling. The Swedish model sets an optimum value corresponding to
the point denoted 1. Furthermore it also has the floor and ceiling. The Norwegian model
sets an expected quality level (2) but has not actual floor or ceiling in the quality
regulation model.
Figure 7. Principles for tariff impact of quality
Tariff impact of quality
Quality
Imp
act
Limited impact
Unlimited impact
Ceiling
Floor
1.
2.
39
4.1.4.2 Quality and availability of data
All the models are dependent on reliable data as the output can never be better than the
input. There are differences between the countries which are important when it comes to
this topic. The Swedish and British DSOs are required to report interruptions at a
customer level meaning that interruptions at every voltage level are included in
performance statistics. There is no automatic recording of interruptions in the low voltage
grid in neither Sweden nor Great Britain thus making interruptions data having lower
quality. Norway has taken a step up and does not require reporting of interruptions in the
low voltage grid. Norway has an established reporting system which gives more
credibility to the statistics.
Another difference between Norway and the others is that both Sweden and Great Britain
uses average values while Norway uses the total sum interruption duration.
One can also see differences in handling interruption data as cause of event outside DSOs
responsibility or control. As seen, Great Britain has adopted a scheme in which DSOs can
apply for exclusion of certain events while in Sweden cause of interruption is not
acknowledged as a reason for exclusion from performance data. The Norwegian authority
has the possibility to exclude CENS due to certain events but there are no cases where
they have done so.
4.1.4.3 Consumer values
It is important to include consumer values in the quality regulation model to gain
approval for the models; however, there is a possibility that too much emphasis is being
put on consumer values derived from customer surveys. There is a risk that data from
surveys may not be of sufficiently high quality. The three models have included
consumer values to some degree. In the Swedish and Norwegian models the costs for
interruptions have been set through customer surveys. Both countries have acknowledged
that there are different costs associated with planned and unplanned interruptions.
Norway has identified different customer types and Sweden has identified differences
due to customer density. In the British model the customer values are more hidden.
Different valuation of frequency and duration of interruption and weighting of planned
interruptions by 50% are two points where consumer values are visible. Also the overall
improvement targets are results of customers willing to pay more for a more reliable
supply.
4.1.4.4 Acceptance
As mentioned before it is hard to compare models without taking into account national
prerequisites. Norway and Great Britain have models, including the financial efficiency
parts, which require more work by the authority compared to the Swedish model.
Without any information on court appeals in the Norway and Great Britain, there seems
to be higher acceptance of their models than of the Swedish one. In total the amount of
work the different authorities has to put in, might be the same. This contradicts the notion
that a theoretical model will gain more acceptance than a model where targets are set
manually by some authority [8]. Perhaps this notion is based on experience where the
theoretical models give what all parties agree to be reasonable results.
40
4.2 Regulation of voltage quality
There are few countries which adopt any sort of regulation of voltage quality. According
to CEER there is no country that has a tariff control scheme based on voltage quality
issues [4]. As a reminder, interruption is not regarded as a voltage quality issue. This
said, this chapter will be short in comparison to the chapter on continuity regulation.
As for interruption of supply there are costs for customers and DSOs because of lack of
voltage quality. In both Norway and Sweden it has been shown that costs only for voltage
dips and short interruptions amount to the same order as for long interruptions [6,40].
Voltage quality has been an issue mostly concerning industries but as domestic customers
use more and more equipment which are sensitive to, and also create, poor voltage
quality, awareness and perhaps also a desire to enjoy a certain level of voltage quality.
It is not obvious if to include short interruptions in this area as many countries do not
measure short interruption and regard them as a voltage quality issue, typically doing
nothing about them in a regulatory way. As set out earlier, short interruptions were
included in the continuity chapter and will only be touched upon in this chapter if so
needed in describing current work.
4.2.1 Voltage quality standards
This chapter will try to raise awareness of the fact that there are differences between
international and national standards.
4.2.1.1 Europe
As mentioned earlier, there is a common European standard for voltage quality,
EN50160. According to the CEER investigation, often referred to in this report, many
European countries have adopted or acknowledged all or some parts of the standard. A
country which has adopted the standard in full and also enforced a stricter standard
concerning some issues is Norway. A major difference from the EN50160 is that the
Norwegian standard introduces some limits for the high voltage system and not just up to
35 kV. In many parts of Europe the voltage quality is already higher than the one
recommended in EN50160. [4] Voices have been raised calling for more strict standards
which would give a more realistic approach to some parts of the voltage quality problem.
4.2.1.2 Others
It is not only Europe that has adopted voltage quality standards. A country which has
adopted a standard which is similar to the EN50160 is South Africa. The NRS048
standard became a national standard in 1997 and includes not only minimum standards
for voltage quality but also procedures for measuring and reporting and guidelines for
compliance. The standard also includes equipment for measuring and recording of
voltage quality phenomena. [8]
In Argentina there was a gradual development of a national standard to increase the
overall quality. The first step included allowed voltage variation. Variations were
different depending on voltage level and geographical factors. The next step of
41
development saw increased demands and also included limitation of harmonics and
flicker. The standard also included limits for interruptions, penalties for non-compliance
and reporting methods among other things. [8]
National standards aside some DSOs adopt their own standards. These are often
introduced together with some sort of contractual agreement with their customers. This
will be described in more detail and exemplified below.
4.2.2 Regulatory authority
In most European countries the authority which handles regulation of DSOs also is the
authority to handle voltage quality issues. There are some exceptions. As mentioned
earlier, OFGEM has the regulatory power in Great Britain; however, when it comes to
voltage quality issues it is the Department of Trade and Industry, Engineering
Inspectorate that has the responsibilities. [4] In Sweden, it is unclear how a regulation of
power quality would work. While it is STEM that has the regulatory power,
Elsäkerhetsverket, another Swedish authority, adopts and enforces power quality
standards. It has been pointed out by Riksrevisionen, the State Audit Institution, that in
order to have a good supervision of power quality, cooperation between STEM and
Elsäkerhetsverket must work better. [41] In Finland and Norway the same problem does
not exist as there is no split responsibility, according to Fortum co-workers.
4.2.3 Voltage quality monitoring
As described earlier the voltage quality aspect covers many phenomena, all of which are
impossible to monitor manually and getting any reliable or usable data due to their
multidimensional nature. The exception could be short interruptions which occur mainly
because of switching. Counters on switches can be used to create basis for reliable data.
However, other reasons for short interruptions exist, that decrease data reliability, such as
manual switching during maintenance work.
The monitoring systems for interruptions cannot without changes be made to monitor
voltage quality. As there are many parameters to be analyzed a more complex monitoring
system is needed. [4]
Even though there are difficulties in monitoring voltage quality a number of European
countries have installed or are preparing to install voltage quality monitoring systems.
These systems are different in many aspects. Important differences can be how many
points are measured; at what levels in the system these points are situated and which
parameters are measured. There are also financial differences as who pays for the
monitoring and who owns the monitoring system. Norway is again interesting to look at.
Norway has had a monitoring system in use for a number of years and from 2006 it is
mandatory for all DSOs to monitor some quality parameters. Apart from long
interruptions and short interruptions also voltage dips, temporary overvoltages and rapid
voltage changes must be monitored at certain points in every part of the system except on
the low voltage level. Measurement of other quality parameters is only required if
customers experience problems due to these parameters.[4]
42
The Hungarian regulator own 400 voltage quality recorders. The cost for monitoring
system and the actual monitoring work is shared between the regulator and the DSO.
Measuring points are chosen randomly and does not reflect on complaints or previous
events. [4]
Slovenia also has a monitoring system in which all the voltage quality parameters,
mentioned in EN50160, are measured. A selection of high voltage and medium voltage
points have been chosen for monitoring. [4]
Other countries that have a voltage quality monitoring system include Italy, Spain and
Portugal. [4]
4.2.3 Individual verification of quality levels
Although monitoring systems placed in a strategic way may give a view as to the general
quality situation the issues involved in voltage quality can be very local where one
customer is affecting only a few others. Together with each customer's individual
sensitivity to voltage quality issues the need for individual verification exists.
The rules for these measurements can be rather different. The common approach in
Europe is that if a customer experiences voltage quality related problem he can request
identification of voltage quality levels in his connection point. The concerned DSO then
installs a voltage quality meter for a period of time. Costs for measuring are usually paid
by the customer but in some countries customers pay if the voltage quality complies with
standards and if not, the DSO will pay. Portugal has a further payment division, where if
the reasons for the possible voltage quality problem are attributable to the customers, he
pays for the measurements. [4]
There are a few countries which allow customers to install their own voltage quality
monitors. The general approach has been that the installed monitors must comply with
technical standards and be approved by the DSO. This is the case in France, where
customers who enter contracts for receiving high quality must have a voltage quality
monitor installed. The freedom to install individual monitor has lead to a wide variety of
monitors being installed. [4]
4.2.4 Regulation through contracts
So far voltage quality has not been included in any of the tariff control systems reviewed
in the work connected to this report. However, on different detail levels contracts
between DSOs and customers, with or without authority involvement, are being set up to
ensure the customer a certain level of quality.
This section will provide examples on how contractual agreements between DSOs and
customers are carried out. In Europe France and Italy are the two countries in which the
regulator has strongest role in setting up contracts.
43
Starting out with France, both customers on a transmission and distribution level can
enter contracts to ensure a minimum level of quality in their supply. If the customer
should need to, he can ask the operator for better quality in his contract. If this should be
the case the operator proposes a financial and technical plan to describe what technical
improvements have to be made and at what cost. If agreed upon, the changes are made at
the expense of the customer. Should a contract of better quality exist, the operator must
submit an annual or biannual report of the quality at that customer to the customer.
Contracts can include both voltage quality and interruptions. [4,8]
The regulator in France receives a copy of every new contract to get an influence on the
design of contracts. Suggestions on changes are often taken into consideration by the
companies. [4]
In France this contractual agreement method was in place before the regulator was, and
the use of the method is widely spread and accepted. However, contracts including other
issues than interruption duration and frequency are not very common.[4]
In Italy, the regulator provides the power quality contracts and sets the rules for
minimum criteria. The essential rule is that contract must include contractual level of
quality, yearly premium and penalty for non-compliance. There are a number of other
rules and DSOs are required to report on any contract agreed on by customer and DSO.
The rules were set in 2004 and so far no power quality contracts have been signed.[4]
As mentioned South Africa has adopted a national standard for voltage quality and since
1996 Eskom, a DSO and one of the largest power companies in the world, has offered
power quality contracts on three different levels. [8]
NRS048 - The basic option where Eskom guarantees the minimum quality
according to the national standard. This is the level which all customers have right
to. If the standard level is not fulfilled, Eskom must improve quality without
getting paid anything more.
Network specific option - The next level ensures the customer to get a higher
level of quality than described in NRS048. Eskom investigates how much quality
can be achieved from the existing grid and then an individual contract is written
with the customer. The customer in turn has to pay for a part of the investigation.
Premium Power Option - If the customer wants a higher quality then the previous
option can offer, Eskom will make investments in the grid or in the customer's
equipment. The option ensures a high level of quality for the customer in
exchange for a set amount of money during the contractual period. If Eskom does
not fulfill their obligation the customer is paid an amount which is agreed upon in
the contract.
The customers are also required to take part in the quality work and existing customers
must follow the national standard and take actions if their equipment is emitting
disturbances affecting other customers, if no disturbance can be detected, no work is
44
required. New customers, however, are required to follow the standard independent of
influence on other customers.[8]
Similar work in setting minimum levels and penalties for non-compliance has been
carried out in the USA in Detroit where car manufacturers needed a higher level of
quality to secure production.[8]
4.2.5 Conclusions on regulation of voltage quality
As the awareness of voltage quality issues is increasing there will probably be an increase
of regulatory action in the field. At the moment, the regulation is only in its beginning
and much work will be done in the future.
Since voltage quality is such a complex issue and every subissue in its own is complex, a
first step towards regulation, as always, is to get a good grip on the current situation for
further evaluation.
The use of quality indices is not obvious since the number of indices would be large in
order to get a clear view on the quality situation. Together with that the indices alone do
not create an understanding on how customers are affected in the same way as indices for
continuity do.
As the impact of voltage quality is rather deviant depending on customer the individual
contract agreements are satisfactory for raising voltage quality for customers who
demand it. These arrangements may also have a cascade effect. Customers who do not
demand high voltage quality may receive it as an effect of the actions taken by parties
involved in the contract.
Currently, the activity level of regulatory authority in the voltage quality issues is quite
low. As awareness and probably the interest for a voltage quality regulation increases, it
is important that authorities' respective responsibilities are clear.
In order to have some kind of regulation of quality it is inevitable to have a quality
standard, not only including minimum levels but also guidelines for customers and DSOs
on measurement, implementation, emission and sensitivity. Being on a national or
international level, a good standard will give a base for regulation.
4.3 Regulation of customer service quality
This chapter will set out to describe the situation of regulation of customer service
quality. The variations in overall strategy between the countries that have introduced
regulation of this issue are not large. However standard levels within the main strategy
may vary a lot and comparison is not viable based on the examined data as definitions of
indicators may also vary.
As standard levels and the number of issues included in regulation may vary a lot, Great
Britain will be used to exemplify how standards are designed. OFGEM uses the common
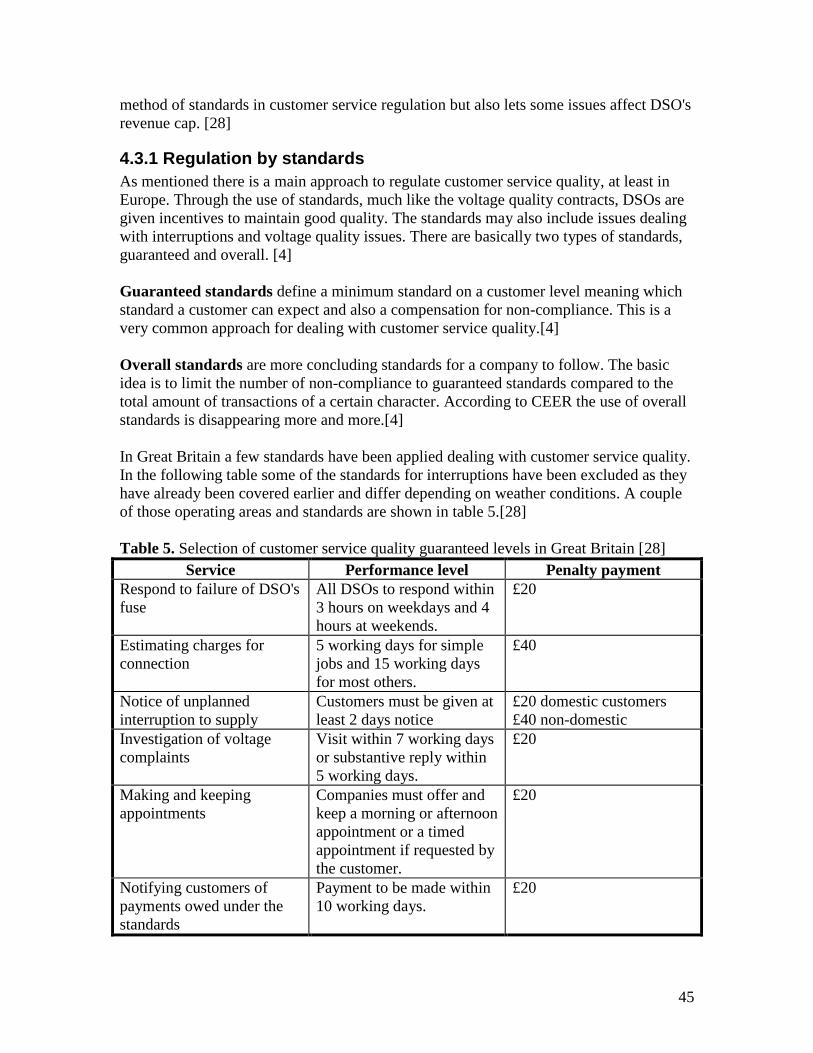
45
method of standards in customer service regulation but also lets some issues affect DSO's
revenue cap. [28]
4.3.1 Regulation by standards
As mentioned there is a main approach to regulate customer service quality, at least in
Europe. Through the use of standards, much like the voltage quality contracts, DSOs are
given incentives to maintain good quality. The standards may also include issues dealing
with interruptions and voltage quality issues. There are basically two types of standards,
guaranteed and overall. [4]
Guaranteed standards define a minimum standard on a customer level meaning which
standard a customer can expect and also a compensation for non-compliance. This is a
very common approach for dealing with customer service quality.[4]
Overall standards are more concluding standards for a company to follow. The basic
idea is to limit the number of non-compliance to guaranteed standards compared to the
total amount of transactions of a certain character. According to CEER the use of overall
standards is disappearing more and more.[4]
In Great Britain a few standards have been applied dealing with customer service quality.
In the following table some of the standards for interruptions have been excluded as they
have already been covered earlier and differ depending on weather conditions. A couple
of those operating areas and standards are shown in table 5.[28]
Table 5. Selection of customer service quality guaranteed levels in Great Britain [28]
Service Performance level Penalty payment
Respond to failure of DSO's
fuse
All DSOs to respond within
3 hours on weekdays and 4
hours at weekends.
£20
Estimating charges for
connection
5 working days for simple
jobs and 15 working days
for most others.
£40
Notice of unplanned
interruption to supply
Customers must be given at
least 2 days notice
£20 domestic customers
£40 non-domestic
Investigation of voltage
complaints
Visit within 7 working days
or substantive reply within
5 working days.
£20
Making and keeping
appointments
Companies must offer and
keep a morning or afternoon
appointment or a timed
appointment if requested by
the customer.
£20
Notifying customers of
payments owed under the
standards
Payment to be made within
10 working days.
£20
46
The overall standards were removed during the review of the regulation model going in
to the current regulation period. If OFGEM sees deteriorating level of quality they will
perhaps reapply the overall standards. [28]
4.3.2 Regulation by caps
Although the use of standards is the single most common approach Great Britain has
adopted a quite unique way of regulating customer quality through changing DSO's
revenue caps.
OFGEM has selected the quality and speed of telephone response to affect the revenue
caps. OFGEM will conduct monthly interview with the customers who have been in
touch with DSOs' telephone service and they will be asked to rate the service on a scale
of 1 to 5. If the average annual score is lower than 4.1 the DSO in question will have to
reduce their revenue according to a sliding scale. At 3.6 there is a floor of 0.25% of
revenue. If a DSO is performing better than 4.5 there is a reward of 0.05% of revenue.
[28]
OFGEM has also set targets for performance of telephone centers in case of severe
weather conditions. Revenues have not yet been exposed to this performance. [28]
Customers in Great Britain have a telephone number on their electricity bill to call in case
of faults which goes to the DSO, according to James Hope at OFGEM.
4.3.3 Conclusion on regulation of customer service quality
The work being done in this field is quite easily summarized in its qualitative measure.
Regulation through standards on some issues and compensation to customers directly
affected by non-compliance is the most common method.
There are a lot of possible issues to be included in a regulation of customer quality. A
question which the method of standards gives rise to is who decides what issues are to be
included in the regulation, if any at all? As always with compensational schemes one
must also ask if the level of compensation is reasonable.
Of course, it is possible for the regulator to set all the rules but it should be important to
know which issues the customers value the most. If there should be issues which have a
technical and social effect that customers perhaps may not be aware of, it should also be
included.
As mentioned the use of overall standards is decreasing. This puts emphasis on having
the right level of compensation. The compensation method is not to cover any costs that
customers may have in association with quality problems but to create incentives for
DSOs to increase quality. By excluding overall standards and having a correct
compensation level the overall quality may decrease or remain low without creating
incentives for DSOs to change.
47
5. GATHERING INPUT This chapter will try to show some of the ways of collecting data for regulation of quality
in distribution networks and also some thoughts that have come up during this
investigation, on what weight to put into the data collected.
Any model requires a certain amount of data to base its calculations and results on.
Independent of what kind of model it may concern, the results can never be better than
the input upon which they are based.
The three aspects of quality require different types of input. In order to design a well
working regulatory system one must look at what relevant data is or can be made
available and what significance that data has. Reliability and voltage quality regulation
rely on both technical data and customer opinions. Customer service regulation mostly
relies on customer opinions.
5.1 Technical data
As mentioned, technical data is mostly used in reliability and voltage quality issues.
There are mainly two methods of gathering data of performance concerning these two
aspects; manually and by monitoring systems. Common practice includes both systems.
Italy is an example where there is extensive monitoring of the medium and high voltage
system [4]. Together with the choice of recording method there is a need to have a
reporting system in use.
In these cases of automated monitoring the limitation is the number of measuring
points. The reliability and significance of the data must be considered to be high but it is
possible to question the relevance as this excludes events in unmonitored parts of the
grid.
Manual recording is possible in terms of interruptions but not many voltage quality
issues can be identified. Manual recording follows a chain of people, including customer,
maintenance personnel, and central operations personnel [4]. There is the possibility of
human error included in this chain and that lowers reliability of data but if the emphasis is
on a customer level in the regulation this might be the only way to include events on the
low voltage level.
The manual recording is associated with low costs as it is a by-product of repair and the
costs only occur whenever there is a fault, unless there is some sort of misreporting.
DSOs usually have a way of covering these costs in those cases. However, manual
recording may include errors and can not be used to record voltage quality events.
Automatic monitoring of faults gives high costs but give reliable data. The data however
does not cover all faults as there are costs for each monitoring point. Through strategic
placing of monitoring points it is possible to get a good view on most parts of the grid.
Different regulators require different recording methods but must also take in to account
which method they use and perhaps correct results accordingly. In order to include
48
voltage quality issues in the regulation, some sort of automatic monitoring system must
be used except for some short interruptions. Data on short interruptions can be related to
counters on switches in the grid. The measuring points must be chosen wisely to not
measure to many points but still detect problems.
Two other issues which have been mentioned earlier are reporting methods and audits of
reported data. These two issues deal with the handling of the gathered data. To increase
the quality of the reported data, especially if indices are to be calculated or any other
calculation is to be performed, it is important that every DSO follows the same
procedure. There should also be a way of checking that they do this correctly if a
reasonable comparison between DSO is to be made.
5.2 Customer opinions
As regulation is meant to protect customers, their opinion is an important part of
regulation. Opinions may include the willingness to pay to avoid interruptions, what level
of voltage quality that should be provided, and the satisfaction with the DSO's service.
To get customers' opinions one must ask for it. Through customer surveys input for
especially continuity regulation models have been created. One of the most important
inputs for regulating continuity of supply derived from customer surveys is customers'
valuation of interruptions. In some regulation models this is an essential part as there is
supposed to be equilibrium between what customers pay and the value of the
interruptions they avoid by paying.
In the three countries that will exemplify continuity of supply regulation, Great Britain,
Norway and Sweden, customer surveys have been conducted in order to determine
customer values of interruption. While the surveys have been used as a direct part of the
regulation in Norway and Sweden to put a value on interruptions, in the British regulation
there is no exact valuation of interruption. The surveys seem to have been used to
examine overall opinions and what to include in regulation [28,36]. The three surveys
were conducted during 2001-2004 [4]. There has also been another survey in Sweden in
2005 which pretty much confirmed earlier studies [16].
In reports on these surveys much space is given to explain the methodology behind the
survey, the design of the survey and the selection of customers to ask. This is important
to gain credibility for the survey and to base interpretation of results on.
When examining results of survey, there are many questions to be answered and the
answers may have a big effect on the usability of the survey. Typical questions could be:
Were the questions clear and on the correct detail level?
Would the results have been different if the questions were put in another way?
Do the respondents understand the questions?
Do the respondents know enough to answer the questions?
Are respondents answering the questions or expressing other opinions, typically
discontent in related subjects?
Are the answers reasonable?
49
The big question of course; is it possible to base input for a regulation on the survey?
Of course there are other ways of creating inputs based on customers' opinions. Working
groups with representatives from all or some parts of the electricity value chain including
representatives from customer groups could do just that. This may take somewhat longer
time but will possibly open a dialogue to creating acceptable inputs.
5.3 Conclusions on gathering input
This chapter set out to describe and evaluate methods of collecting data for regulation. As
seen there are a couple of ways of doing this. For the technical data there are manual and
automatic recordings of quality aspects. As mentioned the common practice is a mix of
the two. DSOs often have some sort of automatic surveillance of certain points but the
rest is up to manual recording which is associated with errors. Automatic monitoring in
turn is associated with high costs. One can argue that the manual surveillance is
sufficient, the margin of error is reasonable, and that customers' participation in the
recording is the only economically viable way to include voltage quality issues on a low
voltage level. The trade-off is between error, detail level and costs.
Using customers' opinions in regulation is unavoidable when striving to create an
acceptable regulation. Placing to much emphasis on uncertain survey data may however
create slightly askew inputs. Customers' opinions must however be used to see in what
overall way regulation should be designed.
50
6. RESULTS This chapter will be divided into three parts. The first, main findings, will include the
findings and ideas on what to think about when designing a regulation model derived
from research performed in this thesis work. The second, proposal for a Pan-Nordic
quality regulation, will combine the main findings with Fortum Distribution's view on
certain issues into a regulation model proposal, what impact and acceptance it might have
and what the problems of implementation might be. The third part is the discussion of
future work and expectations in quality regulation. This topic is ever so important as
regulation should provide incentives for the future and therefore also should be able to
adapt to what the future might bring.
6.1 Main findings
Regulation is a necessity for the current situation in the electricity distribution industry.
Other solutions for handling the monopoly situation are not applicable. Besides a
financial and efficiency regulation there is also a pressing need for a quality regulation.
Experience has shown that when emphasis is placed on cutting costs which financial and
efficiency regulation does, quality may often deteriorate. The reason for having a good
quality is the costs for customers and society involved with the lack of quality.
Before giving any concern to regulation of quality it is a good thing to identify what is
included in the term quality and in that way investigate if regulation can be performed
and in what way. The three areas into which different quality issues are generally divided
are reliability of supply, voltage quality and customer service quality. Reliability is
related to long and short interruptions. Voltage quality relates to any deformation of the
sinusoidal voltage waveform of nominal amplitude. This could be issues like voltage dips
or harmonics. The third aspect of quality is the more soft values of customer service
which basically can include any transaction between customers and DSO excluding
quality of the actual electricity delivery.
The main theory of quality regulation is to find the optimal trade-off between the costs of
and willingness to pay for quality. This has proven to be a challenging task mainly in
identifying the willingness to pay. It can also be difficult to predict and identify the effect
of certain investments on quality which to match a cost against. However challenging the
task may be, attempts have been made which could be deemed successful.
Most of the quality regulation models act separately from the other regulation and has an
impact on a general financial parameter such as revenues or total costs.
The first aspect of quality, the reliability of supply, is represented in all the investigated
regulation models. As it is the most common parameter to regulate most of the work in
this thesis has been investigating the way of regulating interruptions. It is possible to
transfer the same ideas of regulating reliability of supply to the other aspects.
The common approach is to include interruptions longer than three minutes in regulation.
There is no existing model which includes interruptions shorter than three minutes but the
51
Norwegian regulation investigation is looking in that direction [25]. Other countries have
required recording of short interruption and may also be looking in that direction.
To regulate quality the authority must know what the quality situation is. It is very
common to have a regulation approach were DSOs are required to calculate some sort of
average interruption data, mostly frequency and duration of interruptions. The SAIDI and
SAIFI are the most common indices. They do have a flaw in that they are average values
of all customers in the system in question and not the customers affected by interruption.
This gives a more false view on interruptions as far as customers are concerned. The
same problem exists when using ENS. The CAIDI and CAIFI represent a truer picture for
customers and could together with SAIDI and SAIFI provide a picture on how
widespread the possible quality problem is. The result of dividing CAIDI with SAIDI
provides a relation of customers affected by interruptions and total number of customers.
This could be a tool for authority when auditing DSOs together with the absolute values
of SAIDI and/or CAIDI.
To report interruption data DSOs must have some sort of recording method. It is common
to have manual recording through personnel on different levels. However, there are
movements towards automatic monitoring systems. There are of course large investment
costs associated with this but if there are reasonable demands on what level monitoring
should be carried out it can be feasible. However, by choosing to have monitoring on a
high voltage level a great extent of interruptions may be excluded. This gives light to
another part of regulation problems; what is the trade-off between demands on DSOs and
costs which does not necessarily improve quality for customers? Another issue in
recording of interruption data is whether to include every interruption or if there are
circumstances under which the DSOs are not required to be able to operate. This can be
handled differently. Some countries require DSOs to deal with almost everything while
there are countries which apply different rules during severe weather conditions or might
exclude the data from certain events.
The question of demands on DSOs and regulatory costs is obvious when it comes to
voltage quality. To identify voltage quality problem there is a need for monitoring system
due to the nature of voltage quality problems. There is also the fact that voltage quality
problems can be very local and the need for a grid-wide monitoring system may not exist.
There are average indices for many of the aspects of voltage quality but as there are
several dimensions to each aspect they are more complex to use in regulation. This being
said there is the possibility to simplify the problems' description. A possible way of doing
this might be to regard voltage dips of a certain severity as interruptions and include them
in interruption statistics. However, to do this in too large extent it would mean having
some monitoring system. The costs of voltage quality issues are more hidden than for
reliability. Voltage dips may cause the same problems as interruptions but other problems
like harmonics may cause rapid ageing of products.
As far as customer service quality is concerned there are perhaps not many costs involved
with poor quality. However, one could expect or, speaking in an authority manner,
require a DSO to maintain some quality of the relation between them and customers.
52
Which issues that should be included is a question to investigate among customers. The
variety of transactions that are included in different regulation is large.
As mentioned, one of the regulating issues is to include customer values. This report has
touched upon different ways and values of customers including acknowledgement of
customer types, location area type and valuation of planned versus unplanned
interruption. It is obvious that if customers can relate to the group they are put in and the
values of that group the acceptance level is high. However, the difficulty of identifying
values and dividing customers remains. Customers' values have mainly been derived
from customer surveys and help to set exact values for single interruptions of certain
duration. The method leaves much wanting in terms of the certainty of the data. The
results from the latest survey in Sweden confirm that variation in certain customer groups
is large [16]. The other way of using surveys and thereby also customer values in
regulation would be to identify trends in opinions and from that decide on reasonable
regulatory actions. A part from surveys, including representatives from customer groups
in work groups to form regulation is a good approach.
So far, most of this chapter has included questions regarding how to establish what
quality situation is and how to know what issues to regulate. The next thing is to establish
the way of creating the incentives for DSOs to supply reasonable quality.
Regulatory models can mainly be divided into two groups, collective and individual. The
collective model sets out to ensure the same quality for everyone. The individual allows
for customers to negotiate their own level of quality according to demand. [10]
To further refine the two, the basic idea of the regulation model can define the model.
Investigations have shown that there are three target levels of quality, not necessarily
different per se but the ideas behind them are different. The three are minimal, maximal
and optimal level. Minimal level is set through penalties for non-compliance with
standards or unlimited negative effect on revenues. Maximal level is set through a roof of
impact on revenues or when the DSO deems that investments are not feasible compared
to the compensation from the increased quality the investment may give. Optimal level
and maximal level are somewhat and sometimes tied together. Optimal level is where
investment costs and benefits, i.e. what DSO can charge extra for the quality the
investment will provide, are the same. This can be the marginal cost and benefit or the
absolute value. From a socioeconomic perspective the marginal is the best but if the
regulation sets out to maximize quality the investments should be made until the absolute
values are the same. In regulation if there is a set optimal level it is the same as the
maximal which the Swedish and Norwegian models have in different ways. The maximal
level exists in the British model among others where there is no attempt to find the
optimal level. However, there is usually an expected level of quality in the middle
between a roof and floor of revenue impact. The three models mentioned here all have or
will have setting of minimal level through customer compensation of very long
interruptions.
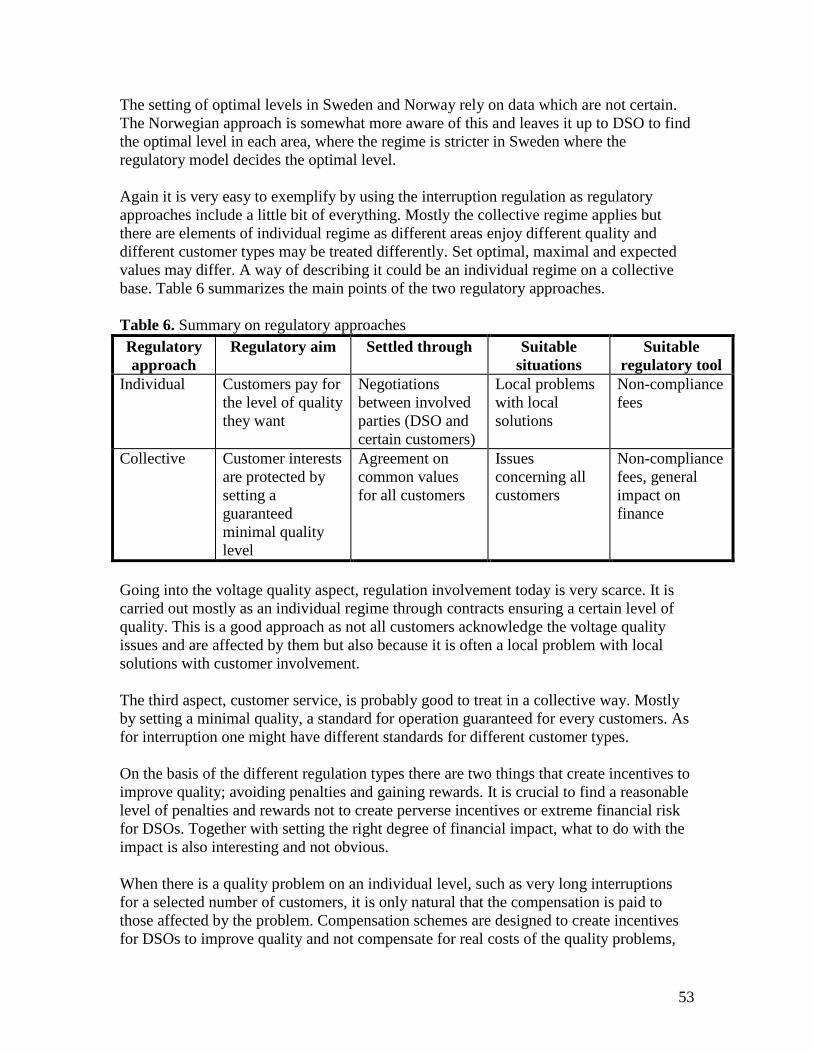
53
The setting of optimal levels in Sweden and Norway rely on data which are not certain.
The Norwegian approach is somewhat more aware of this and leaves it up to DSO to find
the optimal level in each area, where the regime is stricter in Sweden where the
regulatory model decides the optimal level.
Again it is very easy to exemplify by using the interruption regulation as regulatory
approaches include a little bit of everything. Mostly the collective regime applies but
there are elements of individual regime as different areas enjoy different quality and
different customer types may be treated differently. Set optimal, maximal and expected
values may differ. A way of describing it could be an individual regime on a collective
base. Table 6 summarizes the main points of the two regulatory approaches.
Table 6. Summary on regulatory approaches
Regulatory
approach
Regulatory aim Settled through Suitable
situations
Suitable
regulatory tool
Individual Customers pay for
the level of quality
they want
Negotiations
between involved
parties (DSO and
certain customers)
Local problems
with local
solutions
Non-compliance
fees
Collective Customer interests
are protected by
setting a
guaranteed
minimal quality
level
Agreement on
common values
for all customers
Issues
concerning all
customers
Non-compliance
fees, general
impact on
finance
Going into the voltage quality aspect, regulation involvement today is very scarce. It is
carried out mostly as an individual regime through contracts ensuring a certain level of
quality. This is a good approach as not all customers acknowledge the voltage quality
issues and are affected by them but also because it is often a local problem with local
solutions with customer involvement.
The third aspect, customer service, is probably good to treat in a collective way. Mostly
by setting a minimal quality, a standard for operation guaranteed for every customers. As
for interruption one might have different standards for different customer types.
On the basis of the different regulation types there are two things that create incentives to
improve quality; avoiding penalties and gaining rewards. It is crucial to find a reasonable
level of penalties and rewards not to create perverse incentives or extreme financial risk
for DSOs. Together with setting the right degree of financial impact, what to do with the
impact is also interesting and not obvious.
When there is a quality problem on an individual level, such as very long interruptions
for a selected number of customers, it is only natural that the compensation is paid to
those affected by the problem. Compensation schemes are designed to create incentives
for DSOs to improve quality and not compensate for real costs of the quality problems,
54
therefore if the quality is too low for many customers changes will be made if the
financial impact is sufficient. The revenue control will probably do more good if the
revenues above allowed can work for the company as a net instead of being divided
among every customer as compensation. The approach where revenues are kept within
the DSO may be more natural with a regulatory period stretching over a number of years.
In that way variations due to quality may be smoothened out during a regulatory period.
This approach also eliminates some administrative work.
If the revenues effect is not smoothened it can be a good idea to have the regulatory tools
to allow and/or demand investments related to the amount of revenue surplus if there are
quality problems.
To conclude the ideas on how to design a quality regulation model there are number of
issues which are to be considered. Many of the solutions are related to some sort of basic
idea or policy as to what the regulation should achieve. Whatever the policy might look
like it is important that the word trade-off is included as regulation includes three parties,
customer, DSO and authority and all interests should be protected. As mentioned in the
report a good regulation protects customer interests and allows DSOs to conduct business
in an ordinary way. Creating incentives should be done in connection to the real quality
situation. Other important issues are transparency, predictability and allowance of long
term planning and investing. Any new regulation model should also be able to include the
quality aspects which are usually not regulated today. Finally, the regulatory framework
should be flexible as any one model cannot handle every situation.
6.2 Proposal for a Pan-Nordic quality regulation
As mentioned this part of the result is meant to combine the main findings with some
policy issues discussed within the regulation group at Fortum Distribution. The proposal
will be presented as a reasonable vision for quality regulation in Finland, Norway and
Sweden. Denmark is also included in the Nordic electricity market and therefore also a
possible part of a Pan-Nordic quality regulation. However, when discussing the
prerequisites for the Nordic countries, Denmark has been left out since it is outside
Fortum Distribution’s area of operation. A description of both Danish and Finnish
regulation can be found in appendices.
6.2.1 Nordic prerequisites
The Nordic countries have a number of similarities. In terms of ownership there are a lot
of DSOs in each country and some of the big ones operate in more than one country.
There are also sociogeographical similarities. There is mainly one city of extremely high
density in each country. There are areas which are affected by extreme weather
conditions on a regular basis. A way of describing the geography would be to say that
Sweden is a mix of Norway's mountain-based geography with the Finnish forest and
lake-based dito. The countries are of relatable size geographically and concerning
inhabitants. There are industries which are extremely sensitive to quality of supply.
In terms of regulation the prerequisites are very different. While Norway is the pioneer in
many aspects and is evolving their regulation along a line of acceptance, Sweden is
55
struggling to gain acceptance through court rulings of a regulation model which has been
a long time in the making, while at the same time conducting investigations as to how an
alternative regulation might look. Both of the countries have a quality regulation which is
affecting the DSOs on a high level. Finland is yet to implement a general quality
regulation. There is a compensation scheme for very long interruptions. As seen, the three
countries are all changing or in some way thinking about changing their regulation. A
constant evolvement of regulation is a good prerequisite to be able to synchronize
regulation implementation and model. There are however differences which will cause
problems of implementation which will be described after the presentation of the Pan-
Nordic quality regulation model. Overall, it can be said that there is general awareness of
quality in electricity distribution in the Nordic countries.
In terms of interruptions it is hard to compare the Nordic countries as statistics are not
created on the same basis and weighting is performed differently.
6.2.2 The Pan-Nordic quality regulation model
The Pan-Nordic quality regulation model has a regulatory period of 5 years during which
there is a yearly audit of DSOs through report on the quality situation. The regulation
model includes both individual and collective regimes depending on the quality aspect
which is regulated.
6.2.2.1 Regulation of continuity of supply
Basically it is a CENS-scheme where interruption regulation is carried out through tariff
control through revenue caps and direct compensations. The impact of cap and
compensation is set through investigation of historical data and customers' value of
interruptions.
The authority sets expected values of interruption duration, frequency and ENS from
historical data from comparable circuits within reporting areas. On the medium voltage
level the circuit design is the factor considered for comparison while on the low voltage
side the customer density, geographical factors, etc. is the factor for comparison. From
this investigation a performance band is also calculated based on the span of historical
data. Furthermore the tariff impact has a ceiling and a floor in the tariff control dependent
upon the span of performance and customer composition.
Together with the tariff control there is a direct compensation scheme for very long
interruptions which acts as setting a minimal operational level. Interruptions longer than
12 hours are seen as very long. The maximum annual compensation is 100% of the
annual customer fee based on the previous year. The amount of each compensation is
independent of the annual customer fee.
Customers' value of interruption is set through surveys and involvement by
representatives from customer groups in working groups during preparations for each
regulatory period. Furthermore DSOs are required to investigate if results from surveys
56
and working groups are true in areas where quality is outside the span set from historical
data. These investigations are meant to check if there are grounds to change quality.
Interruption impact is divided according to a) preset customer types and at what b) time
of day and c) year the interruption occurs. DSOs must know what the layout of customer
groups is for each distribution transformer and have load curves for each customer group.
Interruption data is collected through automatic monitoring as well as manual reporting.
A common Nordic reporting protocol is used to ensure the quality of interruption data.
The automatic monitoring is carried out on the low-voltage side of each distribution
transformer and at medium and high voltage customers. Faults in the low voltage grid are
included via manual reporting. The reporting includes interruptions longer than three
minutes separated on voltage level and cause. The reporting also includes short
interruptions from the automatic monitoring system but that has no regulatory effect. The
very long interruptions are also specially reported both the number of compensations paid
and how many would be paid if there were no limits. Planned and unplanned
interruptions are also reported separately.
All normal weather related events are included in the interruption statistics but
interruptions due to faults in higher level of network or other distribution networks are
excluded from judging performance but must be reported. In case of other events and/or
severe weather conditions there are three issues that must be taken into consideration if
the event should be excluded from interruption statistics:
The interruption is out of the control of the distribution company (storm, snow,
animals does not qualify to this “out of control” definition).
The interruption is such that it is not reasonable for the distribution company to
take it into account in its operation.
The distribution company could not have avoided the interruption even when
operating very carefully.
The tariffs should remain stable and the impact of tariff control can be accumulated over
the regulatory period. If quality changes to the more negative not due to natural variations
the authority can take special actions allowing investments or other costs over the normal
to come to terms with the quality problems.
Customers with special needs can negotiate special terms with DSOs. Depending upon
the terms the customer may be excluded from the interruptions statistics and the financial
impact of quality.
6.2.2.2 Regulation of voltage quality
Regulation of voltage quality is carried out through contracts based on a Nordic standard
evolved from EN-50160 and the Nordic countries' own ideas. Much like the South
African model, there are different contractual levels which a single customer or customer
area, experiencing quality related problems, can enter together with the DSO. The basic
contract level is designed by the authority in compliance with quality standard. The cost
of improvements up to this level is handled by the DSO and so is the investigation cost. If
57
the cause of voltage quality problems could be contributed to the customer the cost is
handled by the customer also. If the customer wants greater quality than described in the
standard and basic level contract there is a great freedom in designing the contracts. The
customer pays for the investments necessary to achieve the quality. The penalties for non-
compliance by the DSO are related to the investment size. The contracts also include
improvements and operational changes which the customers should perform.
The contracts are sent to the authority which has the possibility to suggest changes. The
DSO is required to report to the customer on a yearly basis the actual quality situation.
6.2.2.3 Regulation of customer service quality
There are standards of operation for the DSOs concerning customer service. Issues which
have been established as important for customers have been included in regulation and
are connected to fees which the DSO will pay to the customer in the case of non-
compliance.
6.2.3 Reasons for the suggested regulatory design
The main thoughts in designing the proposal described above are fairness and correct
reflection of reality. Together with that, every aspect of quality does not need to be
regulated and if regulated the regulation should be reflecting on the value of customers.
The regulation model does not claim to be able to find an optimal level of quality just a
reasonable level from the data available. The regulation model does not set out to be the
solution to every problem and therefore there should possibilities to adapt to special
conditions and individual demands of each DSO.
Furthermore the suggestion does not include any parameter values as that has to come
from further investigations. The suggestion concentrates more on which parameters a
Pan-Nordic regulation model should include.
6.2.3.1 Regulation of continuity of supply
Starting out with the regulation of continuity of supply the model chosen is somewhat
close to the Norwegian model described earlier in the report. The dividing of customers
into customer groups and having different valuation depending on the time of day or year
increase credibility and fairness of the model. This also coincides with the
recommendation from the Swedish State Audit which states that the Swedish reporting
scheme should be more refined to have an efficient revision of electricity distribution
tariffs [41]. Furthermore it is important to have the same base for reporting interruptions
so there are no differences from country to country or DSO to DSO. This also gives the
base for good comparison of interruption data for deciding expected level of CENS. The
automatic monitoring system on a distribution transformer level is probably the way to
create a base of high quality interruption statistics. The short interruption regulation is
probably a question for the near future but the monitoring system gives ground for
investigating the situation and probably inclusion in the regulation.
The five year regulation period is chosen to have possibility to smoothen the effect of the
stochastic change in interruptions. The tariff control is not a compensation scheme so that
negative impact of quality is put back into the company to improve or maintain quality.
58
Internalizing the impact of quality also allows for the cause of interruptions to be
acknowledged as the financial impact of interruptions in other parts of the grid than a
certain DSO controls. The net effect of those interruptions will be placed on the DSO or
TSO which is causing the problem. Therefore TSOs should also be regulated in a similar
way as the DSOs to include the whole chain of electricity transport.
The regulation sets an expected and a minimal level of quality. The optimal level is up to
the DSO to find given their customer layout and the value of interruptions from
customers but there is a ceiling in the tariff control. This is to acknowledge that the input
into the model in terms of customer value may not be correct and give a signal to the
DSOs that it is not reasonable to have perfect quality. To ensure a minimal level of
quality there are compensations for very long interruptions. Together with the floor in the
tariff control this hopefully sets reasonable risk for the DSO and the incentive to move
towards the slope of regulation rather than towards less quality. With the given
suggestions the financial impact will vary from DSO to DSO which is only reasonable as
they all have different number and layout of customers in different areas. In addition, of
course, how roughly the comparison of circuits and areas is made will also affect the
impact.
The idea with the regulation model is also to make it possible for the regulator not just to
have one tool, revenue caps, but also have the ability to allow individual costs and
investments if there are quality problems. The special condition tool is meant for a few
areas with large problems and should not create incentives to decrease quality so that the
special tool may be applicable to this area. The other regulatory tools should create the
incentives not to decrease quality. The reason for setting the expected amount of
interruptions through historical data and comparison between DSOs is that is gives a
reasonable base for yardstick comparison without designing a fictional network.
As far as the definition of events that should be excluded from interruption statistics it is
found in the description of the Finnish model from CEER. CEER states that regulation
should include a definition of force majeures [4]. The suggested definition gives the
regulator freedom to act when so decided upon.
The main problem area with regulation is including customers' value of interruptions. An
additional problem is dividing customers into groups. Both have been done in Norway
through customer surveys. Customers’ values have been investigated in Sweden but no
attempt of dividing customers into groups has been made. Setting an exact value of an
interrupted kWh from a survey is hard since at least the latest Swedish survey show very
deviant results within customer groups. However, if combining with customer group
representatives in regulatory working groups and further investigations in problem areas
could give a more true value to use in the regulation model.
The costs of special investigations into customer values and also into cost allowances and
investments demands in problems should probably mainly be handled by the DSOs but
also to some extent by the authority.
59
6.2.3.2 Regulation of voltage quality
There has not been enough work performed in this area as far a determining if there are
grounds for a collective regime. However, work with designing a more well-defined
standard in the Nordic countries on basis of investigations into the voltage quality
situation should be performed. Although there is no collective regulation, the contractual
approach is good since the problem can be solved on a customer level. Dividing the costs
among customers and DSOs in the described way is probably a good idea to create the
right incentives.
6.2.3.3 Regulation of customer service quality
If some customer service issues are deemed necessary to regulate the easy and probably
most reasonable way to regulate is according to a collective regime. The compensation
way is probably the best since it is hard to judge the quality on some sort of scale but
setting a minimal level is probably easier.
6.2.4 Implementation and impact
As mentioned, much of the ideas are connected to the Norwegian system as it has most
things in common with the basic idea for the suggested regulation. This being said most
investments and investigations have to be made in Sweden and Finland. Norway is
moving away from a separate quality regulation and Finnish investigations are looking
into the same direction. This suggestion comes in contrast with those tendencies. It is,
however, a good thing that the basis for the suggested quality regulation has some
connection to all the Nordic countries and a strong basis in Norway for achieving
acceptance.
Since there is already a well-established reporting scheme, FASIT, in place in Norway
the natural way is to base the Nordic reporting scheme on FASIT.
There will be a need for a transition period in both Sweden and Finland, perhaps also in
Norway but it would probably be shorter. It is important to establish the data collecting
principles and collect sufficient data before implementing the regulation. The data
includes interruption statistics, load curves and customer values. Furthermore having a
shorter regulatory period than 5 years may be necessary to start with to correct initial
errors.
As mentioned, the customer values are difficult. Possible differences within countries and
customer types and between countries needs to be established and, if established, handled
in the best suitable way. Even though it is not really a fair way of doing it, the surveys
performed in each country can be a basis for further investigation during a transition
period.
One thing that the suggested model does not handle is the frequency of interruptions.
Having as few interruptions as possible rather than minimizing the duration of one
interruption could be something that customers value. It is possible to include this in the
suggested model as some sort of scaling factor depending on SAIFI for each reporting
point.
60
The impact of quality will probably be in the area of between the Swedish model and
Norwegian model today. The exact impact is impossible to predict without placing
figures on all the suggested parameters. Comparing to the Norwegian model more
interruptions are included increasing the impact. Comparing to the Swedish model the
interruption statistics are more refined and will not give every interruption the same
value. Perhaps this will decrease the impact of quality.
As mentioned the TSOs should be regulated in a similar way as the DSOs with the given
model layout. There may be a need to adjust parameters to suit transmission systems.
So far the continuity of supply has only been mentioned in this chapter. The other two
aspects are not subject to an extensive regulation and the implementation problems will
probably not be large. Concerning voltage quality the contract design and development of
contracts is the main work area. Another area of work is to clarify who has the regulatory
authority in the Swedish case.
The customer service quality is an area where the authority and DSO shall have to work
to investigate if there are problems and in what areas but also agreeing on a reasonable
compensation level.
In all, the suggested model involves more work from DSOs and the regulator. The
increase in Finland will probably be the largest. As electric energy is of high importance
through the Nordic countries it is only natural that it should involve much work from
involved parties. However, this means higher costs for customers. There are differences
throughout the Nordic countries but these may not have any effect on having the same
framework with country-wise special conditions. Even if not having the exact same
parameter values in every country, having the same framework and principles for
regulation it is reasonable to make comparisons between the Nordic countries to further
improve the regulation of quality.
6.3 Expectations on future development and work
The area of quality regulation is fairly new and the regulation models are often changing.
Together with the hopeful intention that quality regulation will give better or at least the
right level of quality there will probably be a need to change the regulation when the
desired effect has been achieved. Hence, the work in this area will probably continue.
This report has been looking closely on the countries which can be considered the
pioneers of quality regulation. Having done so the investigation shows that there are still
problems and aspects of quality regulation which needs further work.
Firstly the regulation of continuity of supply has come far since it is easy to detect and
derive costs from interruptions. Most of the work of quality regulation has been put into
this area. The main problem is the input to the regulatory models. There will probably be
a movement towards automatic monitoring as monitoring equipment will probably be
cheaper. This will increase the quality of interruption data and gives grounds for a more
61
refined interruption reporting. The other input which some regulation models are
dependent on is the customer value of interruption. This area will probably require much
work to make the results credible. The development of surveys and other methods is
important. As IT-systems are becoming cheaper and well spread it is not impossible to
conduct more surveys in a cheaper way with a more refined choice of respondents. This
may also increase awareness among the greater number of customers giving the results
more credibility.
With a working quality regulation, over time, the continuity of supply could evolve so
that there is little room for improvement and strict minimal requirements can work as the
only regulatory tool and emphasis will be placed on the other two aspect of quality.
When it comes to voltage quality, regulation is very limited. Investigation must be done
on a wide scale to establish if there are widespread problems, which aspects of voltage
quality that could be up for regulation and how to regulate in the best way. There will
probably be a movement towards regulation of voltage quality but first the investigations
must take place.
Customer service quality is not a big issue in the Nordic countries at least in a regulatory
manner. It could be interesting to investigate if there are real problems and in which cases
it would be of value for the customers to have a regulation. It should be a process towards
deciding which issues to regulate and what demand to place on DSOs. As the DSO has
insight into what they can offer and what the customers complain about, a first step for
the regulator should be to gather that information to give a sort of span of operation and
complaint levels. Together with that the regulator should investigate if the complaints
have support in the general public. If so a regulatory involvement could be of interest.
Feedback from DSOs and customers should be collected before implementing. A possible
issue to regulate could be the information flow during extreme conditions such as
hurricanes or snow storms as it concerns many customers throughout all of the Nordic
countries.
According to Ulrika Björnerot at PTS, PTS are currently investigating a regulatory
change including demands on telecommunications operators to at least present figures on
certain parameters dealing with service quality which could be a basis for comparison for
customers. It could be interesting in the future to look at which parameters are regulated,
how these parameters are treated and if there are corresponding parameters in electricity
distribution.
62
REFERENCES [1] Solver T., Reliability in Performance-Based Regulation, Licentiate Thesis, Electric
Power Systems, Department of Electric Power Systems, Royal Institute of Technology,
Sweden, 2005
[2] OFGEM, Ofgem's submission to the Eurpean Commission (DGTREN) Report, 2005
[3] SUMICSID AB and Nordenergi, Nemesys Subproject A: System Analysis, May 2005
[4] CEER, Third Benchmarking Report on Quality of Electricity Supply, 2005
[5] SS-EN50160
[6] Åkerlund J., Dippar och avbrott kostar miljarder, ERA, no. 3, page 33, 2005
[7] Le Tuan A, Power Quality and Electromagnetic Compability Course notes, Lecture 2,
Chalmers University of Technology, Department of Energy and Environment, Spring
2005
[8] STEM, God Elkvalitet bilagor, bilaga 2, 2003
[9] Sabin D., Indices Used to Assess RMS Voltage Variations, IEEEP 1564 00 09,
[10] SUMICSID AB and Nordenergi, Nemesys Subproject B: Regulatory Market Design,
September 2005
[11] Larsson M. B. O., Nätnyttomodellen från Insidan, 2004
[12] Swedish Electricity Act 1997:857, latest change in 2005.
[13] Larsson M. B. O., Ny Leveranssäkerhet i Nätnyttomodellen, 2004
[14] Honkapuro S. et al., Effects of benchmarking of electricity distribution companies in
Nordic countries - comparison between different benchmarking methods, Nordac, 2004
[15] EMI, DSO reports, 2003-2004
[16] Carlsson F. & Martinsson P., Kostnader av elavbrott - En studie av svenska
elkunder, Elforsk rapport 06:15, January 2006
[17] Sand K. et al., Quality of supply regulation – status and trends, Nordac, 2004
[18] NVE, Report on regulation and the electricity market Norway, July 2005
[19] NVE, Forskrift om økonomisk og teknisk rapportering, inntektsramme for
nettvirksomheten og tariffer, FOR 1999-03-11 nr 302, Latest change in 2006
[20] Langset T. et al., Quality dependent revenue caps - a model for quality of supply
regulation, 16th International Conference and Exhibition on Electricity Distribution
(CIRED 2001), June 2001
[21] NVE homepage, KILE-satser fra 01.01.2003 til 31.12.2006, http://www.nve.no.
2006-06-01
[22] Heggset J. et al., Quality of Supply in the Deregulated Norwegian Power System,
Power Tech Proceedings, 2001 IEEE Porto, vol 1, 2001
[23] NVE, Den økonomiske reguleringen av nettvirksomheten - Forslag til endring av
forskrift om økonomisk og teknisk rapportering, m.v., Høringsdokument, July 2005
[24] Storset K., NVE’s forslag til ny nettregulering; Fikk vi det vi ønsket ?, Nett-
konferansen, EBL, December 2005
[25] E-CO Tech, Utredning av aktuelle modeller for en utvidet KILE-ordning Utarbeidet
for NVE, January 2005
[26] Sand K., The Use of Payment for Electricity not Delivered in Norway: Is It Enough
to Give Incentives for Investments?, Nordac, 2004
[27] NVE, Avbruddstatistikk 2004, September 2005
63
[28] OFGEM, Electricity Distribution Price Control Review, Final Proposals, November
2004
[29] OFGEM homepage, Electricity Distribution > IDNOs, www.ofgem.gov.uk, 2006-
06-01
[30] U.S Department of Energy, Privatization and the Globalization of Energy Markets,
October 1996
[31] Koivuranta K., The Pan-Nordic Regulation Model - Opportunity or Threat to the
Financial Outcome of Fortum's Distribution Business, Institute for Executive Education,
Turku School of Economics and Business Administration, Finland, 2004
[32] OFGEM, 2003/04 Electricity Distribution Quality of Service Report, November
2004
[33] OFGEM, Electricity Distribution Price Control Review, Initial proposals, June 2004
[34] OPSI, Statutory Instrument 2005 No. 1019 - The Electricity (Standards of
Performance) Regulations 2005, March 2005
[35] OFGEM, Electricity transmission network reliability incentive schemes; Final
proposals, December 2004
[36] Accent Marketing & Research, Consumer Expectations of DNOs and WTP for
Improvements in Service, Report prepared for OFGEM, June 2004
[37] Office of Energy Regulation, Dte, Yardstick Competition Regional Electricity
Network Companies, Second Regulatory Period, Information and Consultation
Document, 2002
[38] Ajodhia, V.S. Franken B Lippe C, van der, Integrated Regulation of Price and
Quality: the Dutch Experience, Market Design Seminar, 2003
[39] Garribba S. F., AEEG, Quality of Electricity Supply: The Regulation in Italy, CEER
Seminar, June 2001
[40] Samdal K. et al., Customers' interruption costs - What's the Problem?, 17th
International Conference on Electricity Distribution (CIRED 2003), May 2003
[41] Swedish State Audit, Kvalitén i Elöverföringen, RiR 2006:3, 2006
[42] Silvast A. et al, Sähkönjakelun keskeytyksestä aiheutuva haitta, Helsinki University
of Technology & Tampere University of Technology, December 2005
[43] DERA, Annual Report to the European Commission Denmark, September 2005
[44] DERA homepage, Rapport om registrering af leveringssikkerhed, www.dera.dk,
2006-06-01.
64
BIBLIOGRAPHY EC Group, Evaluering av Gjeldende KILE-ordning, project report, August 2004
EMV, Annual Report to the European Commission Finland, August 2005
EMV, Riktlinjer för bedömning av skälig prissättning inom
eldistributionsnätverksamheten åren 2005-2007, June 2004
Essential Services Commission, Electricity Distribution Businesses - Comparative
Performance Report 2004, July 2005
Essential Services Commission, Electricity Distribution Price Review 2006-10 Final
Decision Volume 1 Statement of Purpose and Reasons, October 2005
Essential Services Commission, Review of Electricity Distribution prices 2006-10
Final Decision Fact Sheet 4, October 2005.
Essential Services Commission of South Australia, Electricity Distribution Code
EDC/05, January 2003
Forsberg K. & Fritz P., Methods to Regulate Unbandled Transmission and
Distribution Business on Electricity Markets, Elforsk report 03:31, 2003
Gammelgård M. & Solver T., The network performance assessment model as a
regulatory tool - focusing on objectives and goals, Nordac, 2004
Grasto K., Incentive-based regulation of electricity monopolies in Norway
background, principles and directives, implementation and control system, NVE
paper, 1997
Joint Working Group Cigré C4.07 / CIRED, Power Quality Indices and Objectives,
January 2004
Larsson M. B. O., The Performance Assessment Model - Regulation with a Reference
Network, Market Design, 2003
Lindqvist C., Will the Proposed Swedish Model Give the Proper Incentives to Invest
in More Robust Networks?, Market Design, 2003
Malaman R., AEEG, Regulation of Electricity Supply Quality: Why and How, CEER
Seminar, June 2001
NER, Directive on Power Quality, A Regulatory Framework for the Management of
Power Quality in South Africa, Final Draft, March 2002
NVE, Regulations Relating to the Quality of Supply in the Norwegian Power System,
November 2004
NVE, Rundskriv EMØ 6/2001 - Nærmere begrunnelse for vedtak om beregning av
forventet KILE-beløp, 2001
Office of the Tasmanian Electricity Regulator, Guaranteed Service Levels, September
2003
Office of the Tasmanian Energy Regulator, Improvement to Performance Reporting -
Ascertaining Baseline Performance, Issues Paper, April 2003
OFGEM, Electricity Distribution Price Control Review, Price control cost reporting
rules: Instructions and Guidance (version 2.1), March 2006
Queensland Competition Authority, Final Decision Regulation of Electricity
Distribution, April 2005
Rivier J. & Gomez T., Critical analysis of Spanish power quality regulation design,
Market Design, 2003
65
STEM, God Elkvalitet, ER 24:2003, 2003
SUMICSID AB and Nordenergi, Nemesys Subproject C; Subproject E; White paper,
2005
Swedish Government Proposition 2005/06:27, 2005
Tahvanainen K. et al., Quality Regulation in Electricity Distribution Business,
Nordac, 2004
Viljainen S. et al., Regulation of Electricity Distribution Business, Nordac, 2004
Wyk W., van, Integrated Power Quality Metering, Tech Meeting, AMEU, 2002

66
ACKNOWLEDGEMENTS The work on this master thesis was carried out at Fortum Distribution in Stockholm.
I would like to thank my examiner Jaap Daalder at the Department of Energy and
Environment at Chalmers University of Technology.
I would also like to thank my tutor Sanna Holmqvist and the regulation group at Fortum
Distribution for the continuous support and valuable input.
For answering my many questions, I would like to thank the people at regulating
authorities around the globe.
In addition, my thanks to my co-habitee, Fredrik, for sharing his apartment with me
during these months. Further I would like to thank my sister and her husband for the use
of their apartment in times of severe need of work and enjoyment.
Additionally, I'd like to thank my brother-in-law for the linguistical input.
1
APPENDIX A: QUALITY REGULATION MODELS: FINLAND
Finland
Sweden and Norway are the two Nordic countries which have done most in quality
regulation. However, small steps are being taken in Finland towards a more extensive
quality regulation. Even though the work itself may not be interesting for comparison
since not regulation is in use, the country itself is interesting to have in mind since the
purpose of this report is to suggest a quality regulation model which could be used in all
of the Nordic countries.
Prerequisites
Like Sweden and Norway, Finland has large number of distribution companies of
different sizes. In 2005 the number of distribution companies was 91. The two biggest
companies are Fortum and Vattenfall. The regulatory authority is called the Energy
Market Authority (EMV).[3]
Finland took the first steps towards deregulation in 1995 and has gradually reformed its
electricity market. In 2004 some major reforms were made making some effort for the
possibility of quality regulation.[3]
Efficiency regulation model
Since January of 2005 Finland uses the rate-of-return regulation model including all
network operators. The regulation period lasts until 2007. The next regulation period will
last from 2008 to 2012. The approach during the present regulation period is to keep
network tariffs at a reasonable level. Annual profits will be calculated by regulator but
nothing will be decided on based on the calculations. However, if tariffs are deemed to
high network companies can be required to return profits to customers through future
price reductions.[31] The model in use before 2005 did in some cases violate some EU
requirements but the new one acts in accordance with European law[3].
Quality regulation model
As stated, Finnish regulation is moving towards a more quality recognizing regulation
model. The following information was given by Heini Laamanen at EMV, unless
otherwise referred. During the present regulation period network operators are required to
report a number of interruption indices to the regulator. These are concentrated on the
average duration and frequency of interruption weighted by yearly consumption of
customer and distribution area. The regulator requires reporting at a distribution
transformer level. Finnish networks operators are also required to monitor and report
short interruptions [4].
The regulator will collect data during first regulation period and from 2008 there will be
some sort of quality regulation model in use. Decisions will be made during 2007.
Including customer costs of interruption has been mentioned as a possible approach.
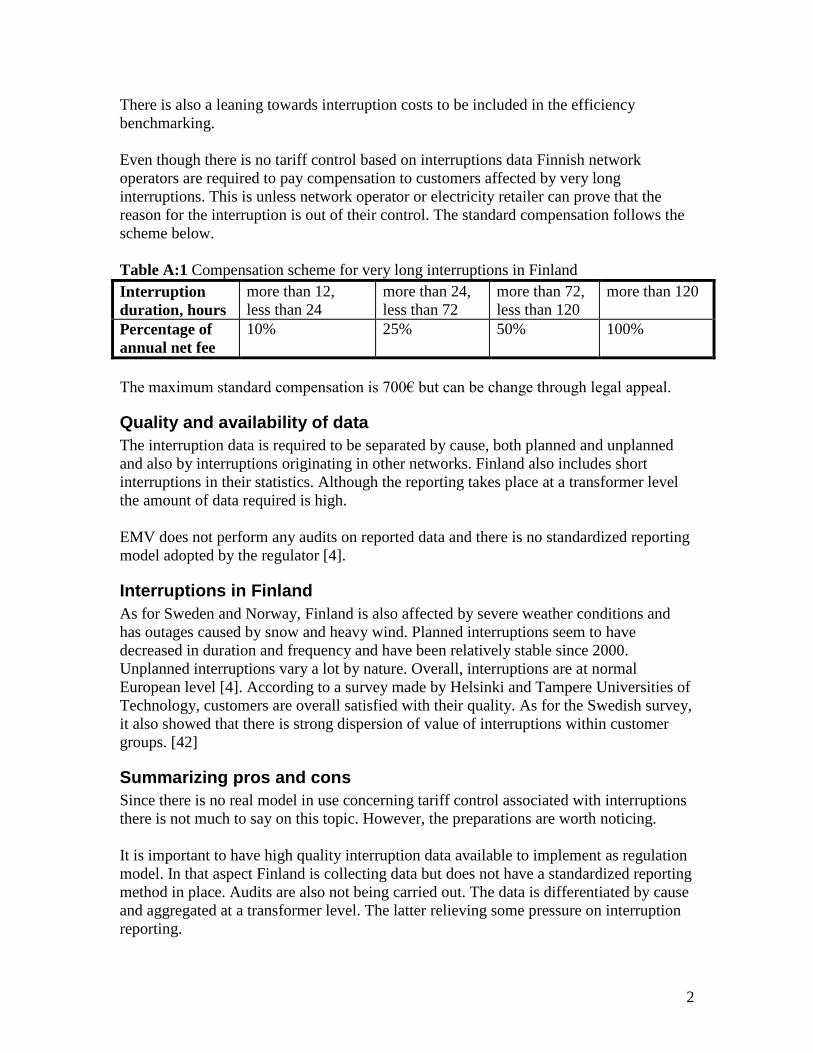
2
There is also a leaning towards interruption costs to be included in the efficiency
benchmarking.
Even though there is no tariff control based on interruptions data Finnish network
operators are required to pay compensation to customers affected by very long
interruptions. This is unless network operator or electricity retailer can prove that the
reason for the interruption is out of their control. The standard compensation follows the
scheme below.
Table A:1 Compensation scheme for very long interruptions in Finland
Interruption
duration, hours
more than 12,
less than 24
more than 24,
less than 72
more than 72,
less than 120
more than 120
Percentage of
annual net fee
10% 25% 50% 100%
The maximum standard compensation is 700€ but can be change through legal appeal.
Quality and availability of data
The interruption data is required to be separated by cause, both planned and unplanned
and also by interruptions originating in other networks. Finland also includes short
interruptions in their statistics. Although the reporting takes place at a transformer level
the amount of data required is high.
EMV does not perform any audits on reported data and there is no standardized reporting
model adopted by the regulator [4].
Interruptions in Finland
As for Sweden and Norway, Finland is also affected by severe weather conditions and
has outages caused by snow and heavy wind. Planned interruptions seem to have
decreased in duration and frequency and have been relatively stable since 2000.
Unplanned interruptions vary a lot by nature. Overall, interruptions are at normal
European level [4]. According to a survey made by Helsinki and Tampere Universities of
Technology, customers are overall satisfied with their quality. As for the Swedish survey,
it also showed that there is strong dispersion of value of interruptions within customer
groups. [42]
Summarizing pros and cons
Since there is no real model in use concerning tariff control associated with interruptions
there is not much to say on this topic. However, the preparations are worth noticing.
It is important to have high quality interruption data available to implement as regulation
model. In that aspect Finland is collecting data but does not have a standardized reporting
method in place. Audits are also not being carried out. The data is differentiated by cause
and aggregated at a transformer level. The latter relieving some pressure on interruption
reporting.
3
In all there is a potential to create a working quality regulation in Finland to work
together with efficiency regulation.
1
APPENDIX B: QUALITY REGULATION MODELS: DENMARK
Denmark
As for the case of Finland, compared with Sweden and Norway, Denmark is somewhat
left behind as far as regulation of quality is concerned. Looking into the future Denmark
will probably introduce some sort of quality regulation as companies are required report
interruptions in form SAIDI and SAIFI.
Prerequisites
As with the rest of the Nordic countries described in this report the ownership in the
distribution network is divided among a large number of DSOs. The ownership is divided
on 120 concessions. The companies vary a lot in size and the largest accounts for 25% of
consumption. [3]
Denmark experienced an initial deregulation in 1999 and since then more and more of the
industry has been included in deregulation. The electricity market was deemed fully
liberalized in 2003. The regulatory authority is divided among DEA and DERA. [43]
DEA handles tasks related to production, supply and consumption of energy, for example
granting concessions, whereas DERA's task is to monitor and regulate monopoly
companies in the energy sector. [43]
Efficiency regulation model
Since 1999 Danish authority has used a number of different methods for efficiency
regulation such as rate of return, price fixation and revenue cap. Currently revenue cap
regulation is in use. [3,31]
There have been problems introducing a regulation system and it is still under
development. DERA is going to develop a new benchmarking system. From 2008 it will
affect the regulated prices based on data from 2006 and it will include individual
efficiency requirements. [3]
Quality regulation model
As mentioned, DSOs are required to report SAIDI and SAIFI, this in effect from 2006.
However this only includes the medium voltage level and up. Recording of the low
voltage grid has been postponed to 2007, this according to Thorbjørn Nejsum at DERA.
At the moment there is no regulation in form of any compensation or cap reduction
scheme. This has said to be included in the new regulation from 2008 [44].
Although there is a lack of quality regulation, awareness is good and energy policy
agreements have been set up to prepare "a national action plan for the future
infrastructure" [3].
2
Quality and availability of data
The interruption reporting is separated by cause, such as third party, faults in higher level
network and planned or unplanned. Reporting is also separated by voltage level. Any
interruption lasting longer than one minute shall be reported. [44]
DERA has introduced guidelines to base reporting on. Recording will be carried out
manually as the low voltage grid is included. [44]
Interruptions in Denmark
Interruption statistics has so far included the medium and high voltage grids. The national
average between 1994 and 2003 has been SAIDI 60 minutes and SAIFI 0.7. [44]
In 1999 and 2003 there were extreme events which affected the statistics. In 1999 there
was a hurricane which affected many of the overhead lines in the medium voltage grid. In
2003 the same fault in the high voltage grid which caused a black out in the south of
Sweden, affected the western part of Denmark.[44]
Summarizing pros and cons
As can be seen above there is nothing much to summarize in the field of quality
regulation in Denmark. However it is good to establish a reporting scheme and gather
data before introducing any form of regulation.
Denmark has a good possibility to include quality in the regulation of revenue caps. As
for the case in Finland, one must wait and see what the proposed model will look like.