Embed Size (px)
Citation preview
New Ways of Listening to Library Users: New Tools for Measuring Service Quality
A. ParasuramanUniversity of Miami
Washington, DCNovember 4, 2005

Defining, Assessing, and Measuring Service Quality: A Conceptual Overview
© A. Parasuraman, University of Miami; not to be reproduced or disseminated without the author’s permission 2

Multi-Phase, Multi-Sector, Multi-Year Program of Research to Address the
Following Issues • How do customers perceive and evaluate service
quality?• What are managers’ perceptions about service
quality?• Do discrepancies exist between the perceptions
of customers and those of managers?• Can customers’ and managers’ perceptions be
combined into a general model of service quality?• How can service organizations improve customer
service and achieve excellence?
© A. Parasuraman, University of Miami; not to be reproduced or disseminated without the author’s permission 3

Determinants of Perceived Service Quality
ExpectedService
PerceivedService
ServiceQuality
GapPerceived
ServiceQuality
Word ofMouth
PersonalNeeds
PastExperience
External Communication
to Customers
© A. Parasuraman, University of Miami; not to be reproduced or disseminated without the author’s permission 4

A “GAPS” MODEL OF SERVICE QUALITY
Customers’ Service
Expectations
CUSTOMER SERVICE ORGANIZATION
Service Quality
Gap
Customers’ Service
Perceptions
GAP 5
Organization’s Understanding of
Expectations
Organization’s Service Standards
Organization’s Service
Performance
Organization’s Communications to
Customers
Market Information
Gap
Service Performance
Gap
Internal Communication
Gap
Service Standards
Gap
GAP 1GAP 2
GAP 3GAP 4
© A. Parasuraman, University of Miami; not to be reproduced or disseminated without the author’s permission 5

POTENTIAL CAUSES OF POTENTIAL CAUSES OF INTERNAL SERVICE GAPSINTERNAL SERVICE GAPS
[GAPS 1 - 4][GAPS 1 - 4]
© A. Parasuraman, University of Miami; not to be reproduced or disseminated without the author’s permission 6

GAP 1
CustomerExpectations
Key Factors:• Insufficient marketing research• Inadequate use of marketing research• Lack of interaction between management and customers• Insufficient communication between contact employees and managers
ManagementPerceptions of
Customer Expectations
Lack of “Upward
Communication”
© A. Parasuraman, University of Miami; not to be reproduced or disseminated without the author’s permission 7

GAP 2
Key Factors:• Inadequate management commitment to service quality• Absence of formal process for setting service quality goals• Inadequate standardization of tasks• Perception of infeasibility -- that customer expectations cannot be met
ManagementPerceptions of
Customer Expectations
ServiceQuality
Specifications
© A. Parasuraman, University of Miami; not to be reproduced or disseminated without the author’s permission 8

GAP 3
Key Factors:
• Lack of teamwork• Poor employee - job fit• Poor technology - job fit• Lack of perceived control (contact personnel)• Inappropriate evaluation/compensation system• Role conflict among contact employees• Role ambiguity among contact employees
ServiceQuality
Specifications
ServiceDelivery
© A. Parasuraman, University of Miami; not to be reproduced or disseminated without the author’s permission 9

GAP 4
Key Factors:• Inadequate communication between salespeople and operations• Inadequate communication between advertising and operations• Differences in policies and procedures across branches or departments• Puffery in advertising & personal selling
ServiceDelivery
ExternalCommunications
to Customers
Lack of “Horizontal
Communication”
© A. Parasuraman, University of Miami; not to be reproduced or disseminated without the author’s permission 10
SUGGESTIONS FOR CLOSING SUGGESTIONS FOR CLOSING INTERNAL SERVICE GAPSINTERNAL SERVICE GAPS
[GAPS 1 - 4][GAPS 1 - 4]
© A. Parasuraman, University of Miami; not to be reproduced or disseminated without the author’s permission 11
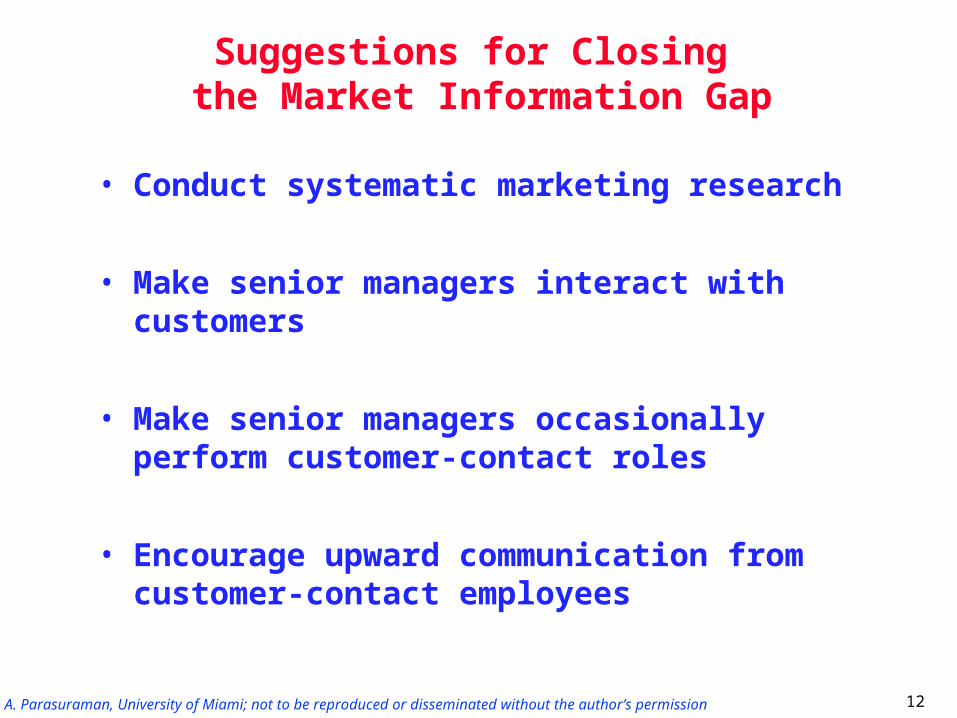
Suggestions for Closing the Market Information Gap
• Conduct systematic marketing research
• Make senior managers interact with customers
• Make senior managers occasionally perform customer-contact roles
• Encourage upward communication from customer-contact employees
© A. Parasuraman, University of Miami; not to be reproduced or disseminated without the author’s permission 12
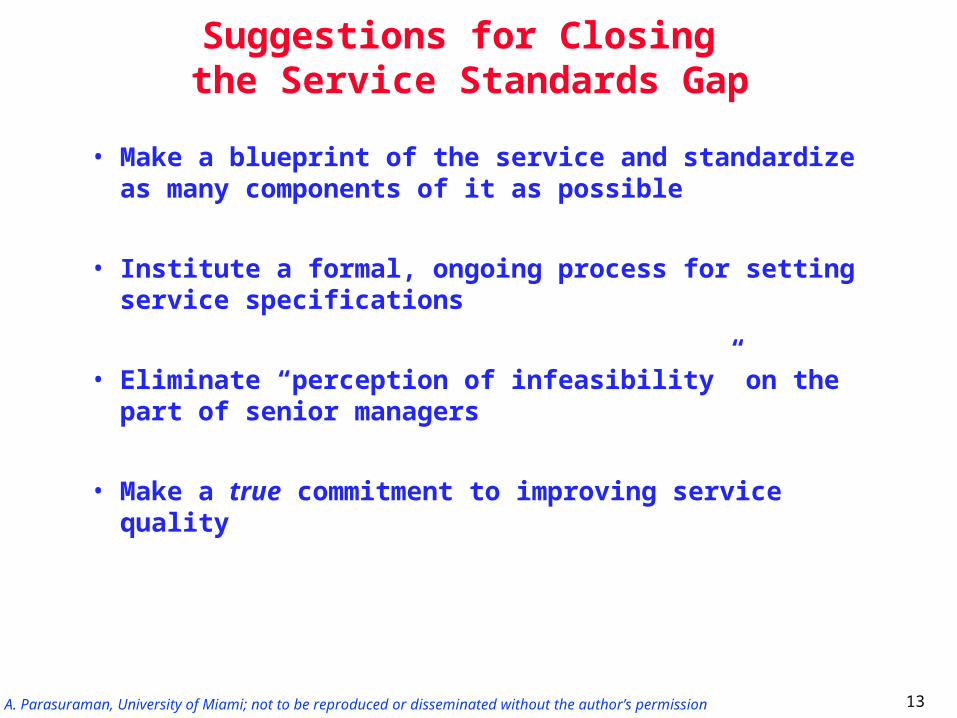
Suggestions for Closing the Service Standards Gap
• Make a blueprint of the service and standardize as many components of it as possible
• Institute a formal, ongoing process for setting service specifications
• Eliminate “perception of infeasibility” on the part of senior managers
• Make a true commitment to improving service quality
© A. Parasuraman, University of Miami; not to be reproduced or disseminated without the author’s permission 13

Suggestions for Closing the Service Performance Gap
• Invest in ongoing employee training
• Support employees with appropriate technology and information systems
• Give customer-contact employees sufficient flexibility
• Reduce role conflict and role ambiguity among customer-contact employees
• Recognize and reward employees who deliver superior service
© A. Parasuraman, University of Miami; not to be reproduced or disseminated without the author’s permission 14

Suggestions for Closingthe Internal Communication Gap
• Facilitate effective horizontal communication across functional areas (e.g., marketing and operations)
• Have consistent customer-related policies and procedures across branches or departments
• Resist the temptation to promise more than the organization can deliver
© A. Parasuraman, University of Miami; not to be reproduced or disseminated without the author’s permission 15

Process Model for Continuous Measurement and Improvement of Service Quality
Do your customers perceiveyour offerings as meeting
or exceeding their expectations?
Do you have an accurate understanding of
customers’ expectations?
Are there specificstandards in place to meetcustomers’ expectations?
Do your offerings meet orexceed the standards?
Is the informationcommunicated to customers
about your offerings accurate?
Continue to monitorcustomers’ expectations
and perceptions
YES
NO
YES
YES
YES
YES
Take corrective action
Take corrective action
Take corrective action
Take corrective action
NO
NO
NO
NO
© A. Parasuraman, University of Miami; not to be reproduced or disseminated without the author’s permission 16
SERVQUAL: Development, Refinement, and Empirical Findings
© A. Parasuraman, University of Miami; not to be reproduced or disseminated without the author’s permission 17

Determinants of Perceived Service Quality
Dimensions of Service Quality
1. Access2. Communication3. Competence4. Courtesy5. Credibility6. Reliability7. Responsiveness8. Security9. Tangibles10. Understanding/Knowing
the Customer
ExpectedService
PerceivedService
ServiceQuality
Gap
PerceivedServiceQuality
Word ofMouth
PersonalNeeds
PastExperience
External Communication
to Customers
© A. Parasuraman, University of Miami; not to be reproduced or disseminated without the author’s permission 18

Correspondence between SERVQUAL Dimensions and Original Ten Dimensions for Evaluating Service Quality
Original Ten Dimensions for
Evaluating ServiceQuality
TANGIBLESRELIABILITYRESPONSIVENESSCOMPETENCE
COURTESY
CREDIBILITY
SECURITY
ACCESS
COMMUNICATION
UNDERSTANDING/ KNOWING THECUSTOMER
TANGIBLES RELIABILITY RESPONSIVENESS ASSURANCE EMPATHY
SERVQUAL Dimensions
© A. Parasuraman, University of Miami; not to be reproduced or disseminated without the author’s permission 19

Definitions of the SERVQUAL Dimensions
• Tangibles: Appearance of physical facilities, equipment, personnel, and communication materials.
• Reliability: Ability to perform the promised service dependably and accurately.
• Responsiveness: Willingness to help customers and provide prompt service.
• Assurance: Knowledge and courtesy of employees and their ability to inspire trust and confidence.
• Empathy: Caring, individualized attention the firm provides its customers.
© A. Parasuraman, University of Miami; not to be reproduced or disseminated without the author’s permission 20

Relative Importance of Service Dimensions When Respondents
Allocate 100 Points [Study 1]
TANGIBLES 11%
EMPATHY 16%
RELIABILITY 32%
ASSURANCE 19%
RESPONSIVENESS 22%
© A. Parasuraman, University of Miami; not to be reproduced or disseminated without the author’s permission 21
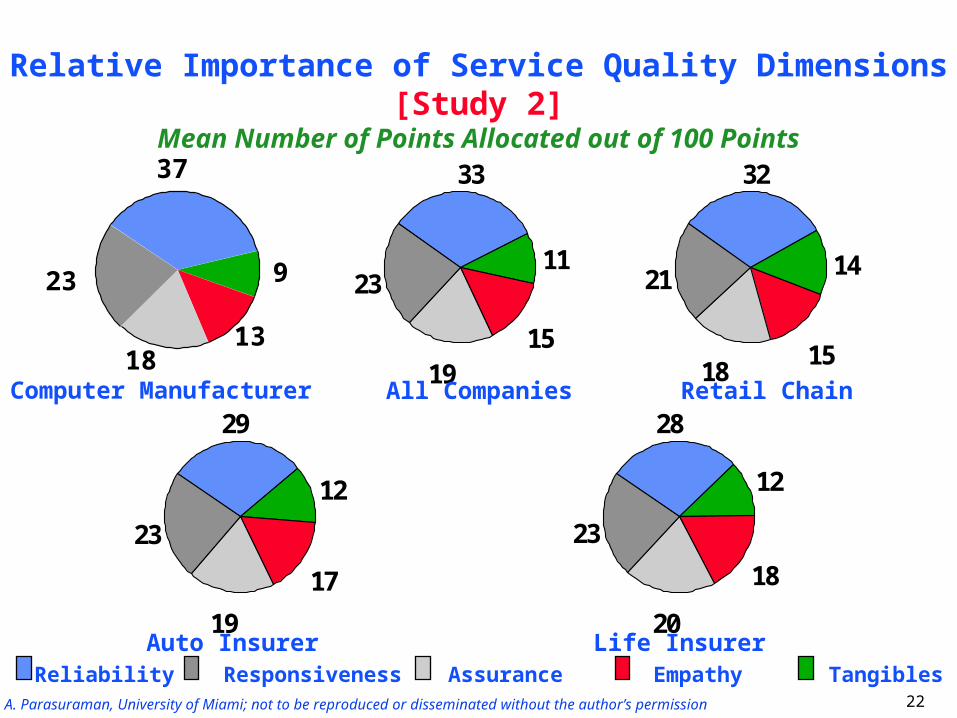
Relative Importance of Service Quality Dimensions [Study 2]Mean Number of Points Allocated out of 100 Points
37
9
1318
23
29
12
1719
23
28
12
18
20
23
33
11
1519
23
32
14
1518
21
Computer Manufacturer All Companies Retail Chain
Auto Insurer Life InsurerReliability Responsiveness Assurance Empathy Tangibles
© A. Parasuraman, University of Miami; not to be reproduced or disseminated without the author’s permission 22

1.00
0.00
-1.00
-2.00Tangibles Reliability Responsive-
nessAssurance Empathy
Mean SERVQUAL Scores by Service Dimension [Study 1]
© A. Parasuraman, University of Miami; not to be reproduced or disseminated without the author’s permission 23
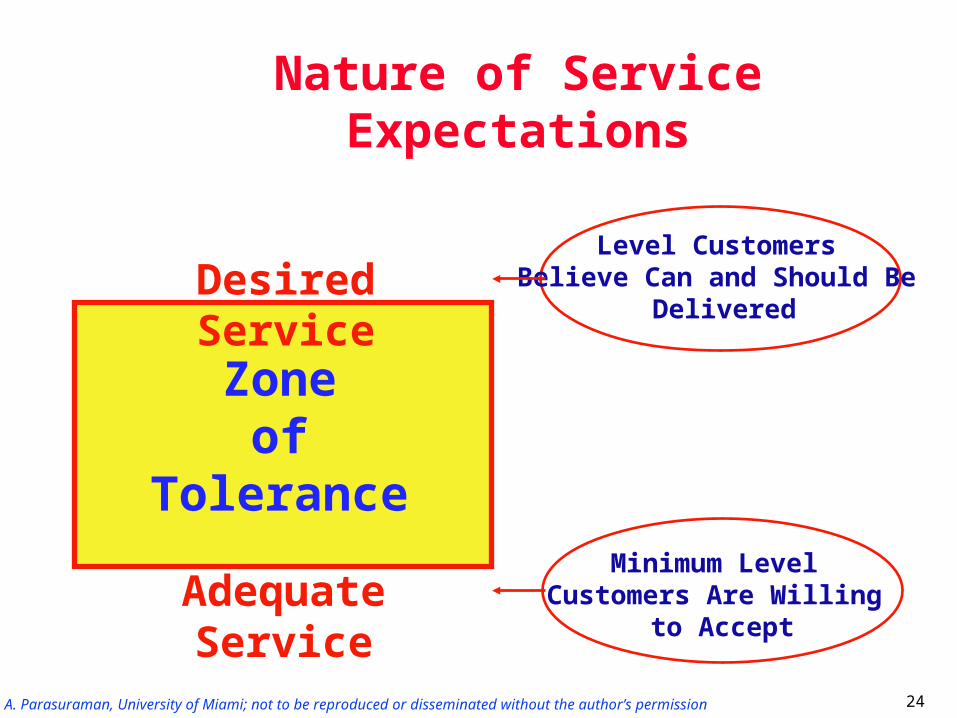
Nature of Service Expectations
Desired Service
Zoneof
Tolerance
Adequate Service
Level Customers Believe Can and Should Be
Delivered
Minimum Level Customers Are Willing
to Accept
© A. Parasuraman, University of Miami; not to be reproduced or disseminated without the author’s permission 24
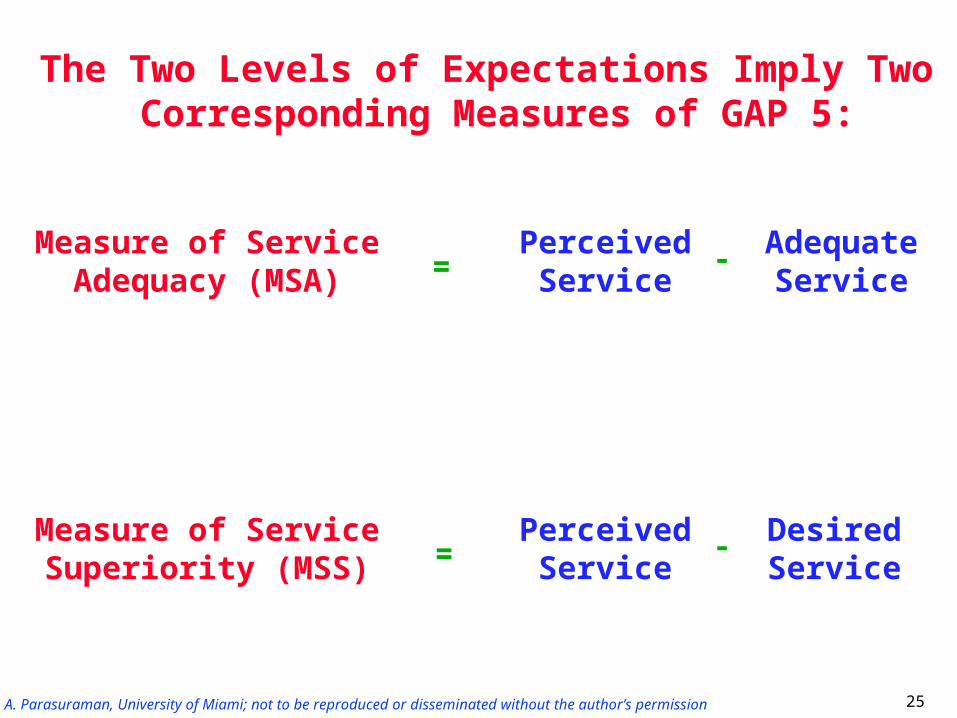
Measure of ServiceAdequacy (MSA)
Measure of ServiceSuperiority (MSS)
=
=
PerceivedService
PerceivedService
-
-
AdequateService
DesiredService
The Two Levels of Expectations Imply Two Corresponding Measures of GAP 5:
© A. Parasuraman, University of Miami; not to be reproduced or disseminated without the author’s permission 25

TWO APPROACHES FOR MEASURING MSA AND MSS
• Two-Column Format Questionnaire–Direct measures of MSA and MSS
• Three-Column Format Questionnaire–Difference-score measures of MSA and MSS
© A. Parasuraman, University of Miami; not to be reproduced or disseminated without the author’s permission 26

TWO-COLUMN FORMAT
Please think about the quality of service ________ offers compared to the two different levels ofservice defined below:
MINIMUM SERVICE LEVEL - the minimum level of service performance you consider adequate.
DESIRED SERVICE LEVEL - the level of service performance you desire.
For each of the following statements, please indicate: (a) how ______’s performance compareswith your minimum service level by circling one of the numbers in the first column; and (b) how______’s performance compares with your desired service level by circling one of the numbersin the second column.
Compared to My Minimum Compared to My Desired Service Level ____’s Service Level ____’s Service Performance is: Service Performance is:
The No The NoWhen it comes to … Lower Same Higher Opin- Lower Same Higher Opin-
ion ion
1. Prompt service 1 2 3 4 5 6 7 8 9 N 1 2 3 4 5 6 7 8 9 Nto policyholders
2. Employees who are 1 2 3 4 5 6 7 8 9 N 1 2 3 4 5 6 7 8 9 Nconsistently courteous
© A. Parasuraman, University of Miami; not to be reproduced or disseminated without the author’s permission 27
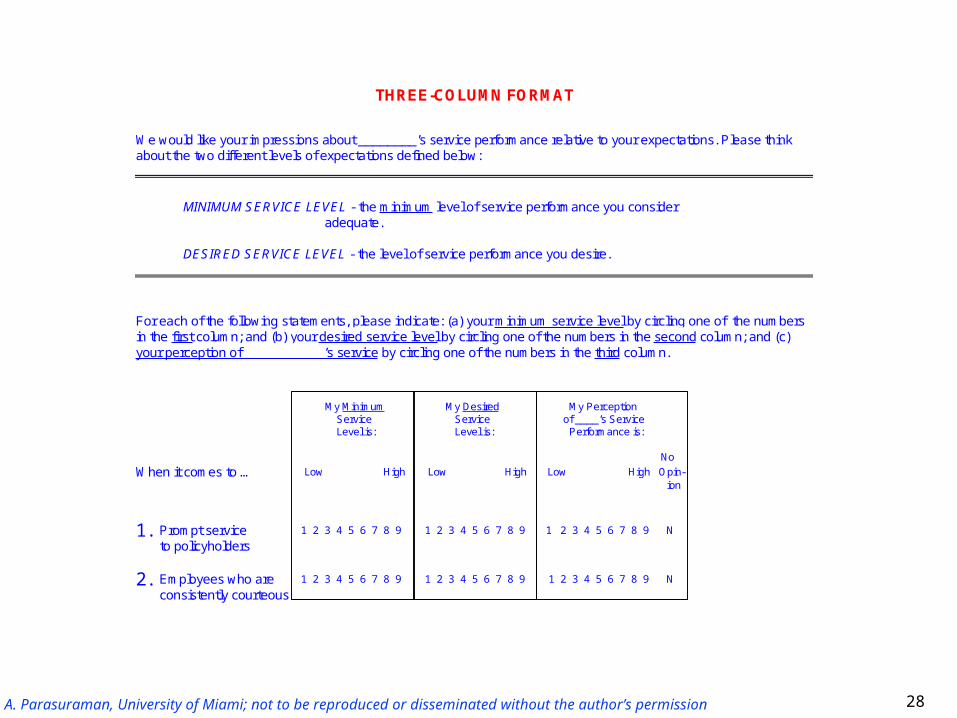
THREE-COLUMN FORMAT
We would like your impressions about ________’s service performance relative to your expectations. Please thinkabout the two different levels of expectations defined below:
MINIMUM SERVICE LEVEL - the minimum level of service performance you consider adequate.
DESIRED SERVICE LEVEL - the level of service performance you desire.
For each of the following statements, please indicate: (a) your minimum service level by circling one of the numbersin the first column; and (b) your desired service level by circling one of the numbers in the second column; and (c)your perception of ___________’s service by circling one of the numbers in the third column.
My Minimum My Desired My Perception Service Service of ____’s Service Level is: Level is: Performance is:
NoWhen it comes to … Low High Low High Low High Opin-
ion
1. Prompt service 1 2 3 4 5 6 7 8 9 1 2 3 4 5 6 7 8 9 1 2 3 4 5 6 7 8 9 Nto policyholders
2. Employees who are 1 2 3 4 5 6 7 8 9 1 2 3 4 5 6 7 8 9 1 2 3 4 5 6 7 8 9 Nconsistently courteous
© A. Parasuraman, University of Miami; not to be reproduced or disseminated without the author’s permission 28

Measurement Error: Percent of Respondents Answering Incorrectly
Two-ColumnFormat
Three-ColumnFormat
ComputerManufacturer 8.6% 0.6%
Retail Chain 18.2% 1.8%
Auto Insurer 12.2% 1.6%
Life Insurer 9.9% 2.7%
Type of Company
© A. Parasuraman, University of Miami; not to be reproduced or disseminated without the author’s permission 29
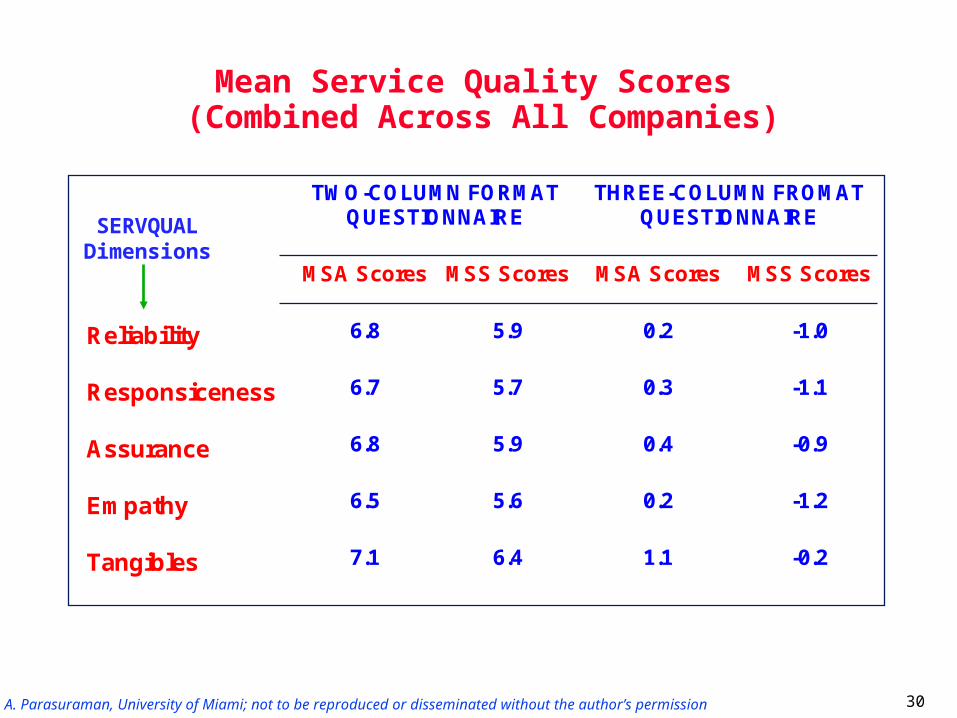
Mean Service Quality Scores (Combined Across All Companies)
TWO-COLUMN FORMATQUESTIONNAIRE
THREE-COLUMN FROMATQUESTIONNAIRE
MSA Scores MSS Scores MSA Scores MSS Scores
Reliability 6.8 5.9 0.2 -1.0
Responsiceness 6.7 5.7 0.3 -1.1
Assurance 6.8 5.9 0.4 -0.9
Empathy 6.5 5.6 0.2 -1.2
Tangibles 7.1 6.4 1.1 -0.2
SERVQUAL Dimensions
© A. Parasuraman, University of Miami; not to be reproduced or disseminated without the author’s permission 30

Revised SERVQUAL ItemsReliability
1. Providing services as promised
2. Dependability in handling customers' service problems
3. Performing services right the first time
4. Providing services at the promised time
5. Keeping customers informed about when services will be performed
Responsiveness
6. Prompt service to customers
7. Willingness to help customers
8. Readiness to respond to customers' requests
Assurance
9. Employees who instill confidence in customers
10. Making customers feel safe in their transactions
11. Employees who are consistently courteous
12. Employees who have the knowledge to answer customer questions
Empathy
13. Giving customers individual attention
14. Employees who deal with customers in a caring fashion
15. Having the customer's best interest at heart
16.Employees who understand the needs of their customers
Tangibles
17. Modern equipment
18. Visually appealing facilities
19. Employees who have a neat, professional appearance
20. Visually appealing materials associated with the service
21. Convenient business hours
© A. Parasuraman, University of Miami; not to be reproduced or disseminated without the author’s permission 31

Service Quality Perceptions Relative to Zones of Tolerance by Dimension
Computer Manufacturer
0
1
2
34
56
7
8
9
Reliability Responsiveness Assurance Empathy Tangibles
Zone of Tolerance S.Q. Perception
© A. Parasuraman, University of Miami; not to be reproduced or disseminated without the author’s permission 32

Service Quality Perceptions Relative to Zones of Tolerance by Dimension
Computer Manufacturer
0
1
2
34
56
7
8
9
Reliability Responsiveness Assurance Empathy Tangibles
Zone of Tolerance S.Q. Perception
© A. Parasuraman, University of Miami; not to be reproduced or disseminated without the author’s permission 33

Service Quality Perceptions Relative to Zones of Tolerance by Dimension
On-Line Services
0
1
2
34
567
8
9
Reliability Responsiveness Assurance Empathy Tangibles
Zone of Tolerance S.Q. Perception
6.8 7.0 6.7 6.77.07.0
8.38.4
6.8
8.4
6.8
8.3
5.7
7.56.8
© A. Parasuraman, University of Miami; not to be reproduced or disseminated without the author’s permission 34

Service Quality Perceptions Relative to Zones of Tolerance by Dimension
Tech-Support Services
0
1
2
3456
7
8
9
Reliability Responsiveness Assurance Empathy
Zone of Tolerance S.Q. Perception
8.5
6.9
8.4
6.16.6
6.7
8.1
6.46.3
8.3
6.3
6.8
© A. Parasuraman, University of Miami; not to be reproduced or disseminated without the author’s permission 35

LIBQUAL+: An Adaptation of SERVQUAL
36© A. Parasuraman, University of Miami; not to be reproduced or disseminated without the author’s permission
© Association of Research Libraries, Washington DC (2003)
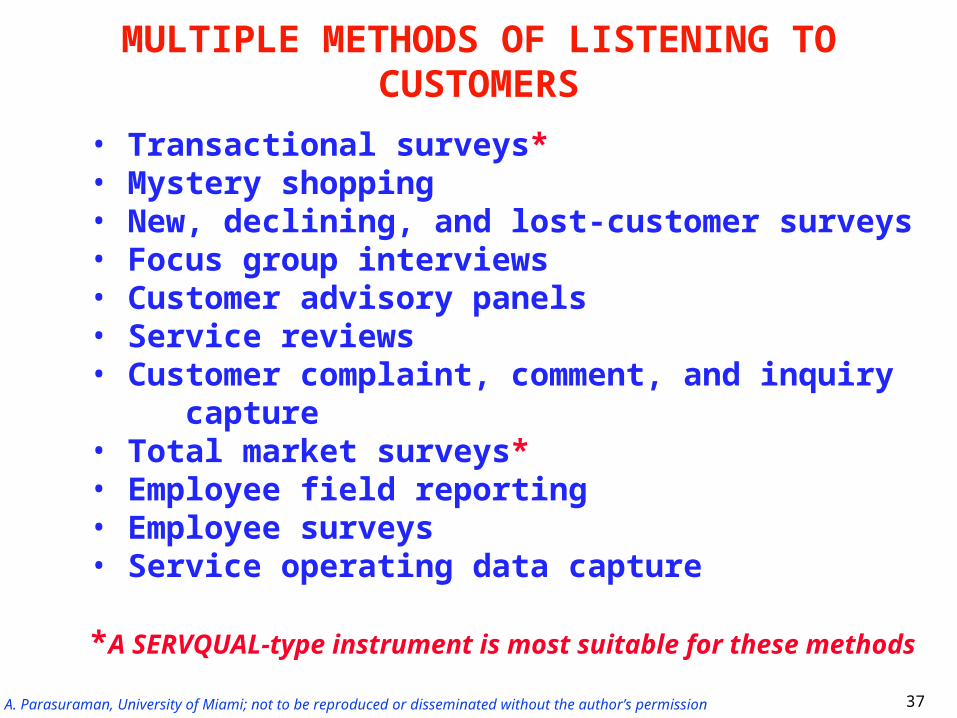
MULTIPLE METHODS OF LISTENING TO CUSTOMERS
• Transactional surveys* • Mystery shopping• New, declining, and lost-customer surveys• Focus group interviews• Customer advisory panels• Service reviews• Customer complaint, comment, and inquiry capture • Total market surveys*• Employee field reporting• Employee surveys• Service operating data capture
*A SERVQUAL-type instrument is most suitable for these methods
© A. Parasuraman, University of Miami; not to be reproduced or disseminated without the author’s permission 37

The Role Of Technology In Service Delivery: Electronic Service Quality (e-SQ) and Technology
Readiness (TR)
© A. Parasuraman, University of Miami; not to be reproduced or disseminated without the author’s permission 38

Technology’s Growing Role in Marketing to and Serving Customers: Pyramid Model
Company
Employees Customers
Technology
Internal Marketing
Interactive Marketing
External Marketing
© A. Parasuraman, University of Miami; not to be reproduced or disseminated without the author’s permission 39
Ongoing Research on e-Service Ongoing Research on e-Service Quality: Conceptual Framework and Quality: Conceptual Framework and
Preliminary FindingsPreliminary Findings
© A. Parasuraman, University of Miami; not to be reproduced or disseminated without the author’s permission 40

Research Phases and Questions
PHASE 1:• What is good service on the Web?• What are the underlying dimensions of superior
electronic service quality (e-SQ?)• How can e-SQ be conceptualized? PHASE 2:• How do these dimensions compare to those of
traditional service quality?• How can e-SQ be measured and thereby
assessed?
© A. Parasuraman, University of Miami; not to be reproduced or disseminated without the author’s permission 41

Definition of e-Service Quality (e-SQ)
e-SQ is the extent to which a Website facilitates efficient and effective shopping, purchasing and delivery of products and services
© A. Parasuraman, University of Miami; not to be reproduced or disseminated without the author’s permission 42

Dimensions of e-Service Quality from Focus Groups
• Access• Ease of Navigation• Efficiency• Customization/
Personalization• Security/Privacy
• Responsiveness• Assurance/Trust• Price Knowledge• Site Aesthetics• Reliability• Flexibility
© A. Parasuraman, University of Miami; not to be reproduced or disseminated without the author’s permission 43

ReliabilitySAMPLE ATTRIBUTES• Site does not crash• Accurate billing• Accuracy of order• Accuracy of account
information• Having items in stock• Truthful information• Merchandise arrives
on time
DEFINITION
Correct technical functioning of the site and the accuracy of service promises, billing and product information.
© A. Parasuraman, University of Miami; not to be reproduced or disseminated without the author’s permission 44

EfficiencySAMPLE ATTRIBUTES• Site is well organized• Site is simple to use• Site provides
information in reasonable chunks
• Site allows me to click for more information if I need it
DEFINITION
The site is simple to use, structured properly, and requires a minimum of information to be input by the customer.
© A. Parasuraman, University of Miami; not to be reproduced or disseminated without the author’s permission 45

Means-End Model
SPECIFIC/CONCRETE
ABSTRACT
Dimensions Higher-levelAbstractions
PerceptualAttributes
ConcreteCues
© A. Parasuraman, University of Miami; not to be reproduced or disseminated without the author’s permission 46

Ease ofNavigation
Easy to Maneuverthrough Site
Easy to FindWhat I Need
Speed of Checkout
Search Engine
One-click Ordering
Tab Structuring
Site Map
Means-End Model of e-Service Quality
Dimensions Higher-LevelAbstractions
PerceptualAttributes
ConcreteCues
© A. Parasuraman, University of Miami; not to be reproduced or disseminated without the author’s permission 47
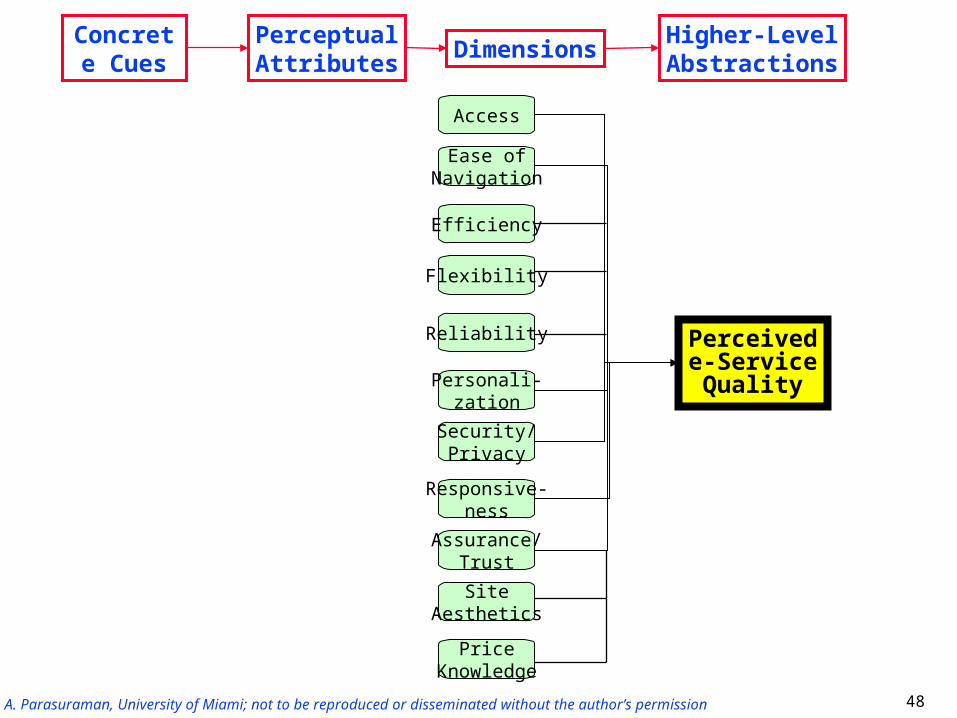
Perceivede-ServiceQuality
Security/Privacy
PriceKnowledge
Assurance/Trust
Responsive-ness
SiteAesthetics
Reliability
Flexibility
Efficiency
Ease ofNavigation
Personali-zation
Access
Dimensions Higher-LevelAbstractions
PerceptualAttributes
Concrete Cues
© A. Parasuraman, University of Miami; not to be reproduced or disseminated without the author’s permission 48

Means-End Model of e-Service Quality
PerceivedValue
PerceivedConvenience
PerceivedControl
Perceivede-ServiceQuality
PerceivedPrice
Dimensions
Higher-Level Abstractions
PerceptualAttributes
ConcreteCues
Behaviors
Purchase
Loyalty
W.O.M
© A. Parasuraman, University of Miami; not to be reproduced or disseminated without the author’s permission 49

Customer Web site
Requirements
Perceivede-SQ
PerceivedValue
Purchase/Repurchase
Management’s Beliefs
about Customer Requirements
Design and Operation
of the Web site
Marketingof the
Web site
DesignGap
InformationGap
Conceptual Model for Understanding and Improving e-Service QualityCustomer
Company
CommunicationGap
FulfillmentGap
Customer Web site
Experiences
50© A. Parasuraman, University of Miami; not to be reproduced or disseminated without the author’s permission

Dimensions of e-SQCore Dimensions[E-S-QUAL]• Efficiency• Fulfillment• System Availability• Privacy
Recovery Dimensions[E-RecS-QUAL]• Responsiveness• Compensation• Contact
Source: Parasuraman, Zeithaml, and Malhotra, “E-S-QUAL: A Multiple-Item Scale for Assessing Electronic Service Quality,” Journal of Service Research, February 2005.
© A. Parasuraman, University of Miami; not to be reproduced or disseminated without the author’s permission 51

Definitions of e-SQ Dimensions E-S-QUAL Dimensions
Efficiency: The ease and speed of accessing and using the site.
Fulfillment: The extent to which the site’s promises about order delivery and item availability are fulfilled.
System Availability: The correct technical functioning of the site.
Privacy: The degree to which the site is safe and protects customer information.
E-RecS-QUAL Dimensions Responsiveness: Effective handling of problems and returns through the
site.
Compensation: The degree to which the site compensates customers for problems.
Contact: The availability of assistance through telephone and online representatives.
Source: Parasuraman, Zeithaml, and Malhotra, “E-S-QUAL: A Multiple-Item Scale for Assessing Electronic Service Quality,” Journal of Service Research, February 2005.© A. Parasuraman, University of Miami; not to be reproduced or disseminated without the author’s permission 52
An Important Implication of the Pyramid Model
An organization’s ability to use technology effectively in marketing to and serving customers critically depends on the technology readiness of its customers and employees
© A. Parasuraman, University of Miami; not to be reproduced or disseminated without the author’s permission 53

What is Technology Readiness [TR]?
TR refers to “people’s propensity to embrace and use new technologies for accomplishing goals in home life and at work”
© A. Parasuraman, University of Miami; not to be reproduced or disseminated without the author’s permission 54

Multinational Research Studies on Technology Readiness
• Began in 1997 in the USA and still ongoing• Being conducted in collaboration with Charles Colby,
President, Rockbridge Associates• Have thus far involved several qualitative and
quantitative studies• Completed studies include three “National Technology
Readiness Surveys” in the USA [NTRS 1999, 2000, 2001, 2002 and 2004]
• National studies also have been done or are underway in Austria, Chile, Germany, Singapore and Sweden
© A. Parasuraman, University of Miami; not to be reproduced or disseminated without the author’s permission 55

Key Insights from Qualitative Research Studies
• TR doesn’t just refer to possessing technical skills; TR is much more a function of people’s beliefs and feelings about technology
• People’s beliefs can be positive about some aspects of technology but negative about other aspects
• The relative strengths of the of positive and negative beliefs determine a person’s receptivity to technology
© A. Parasuraman, University of Miami; not to be reproduced or disseminated without the author’s permission 56

Receptive toTechnology
NeutralResistant toTechnology
Technology-Beliefs Continuum
57© A. Parasuraman, University of Miami; not to be reproduced or disseminated without the author’s permission
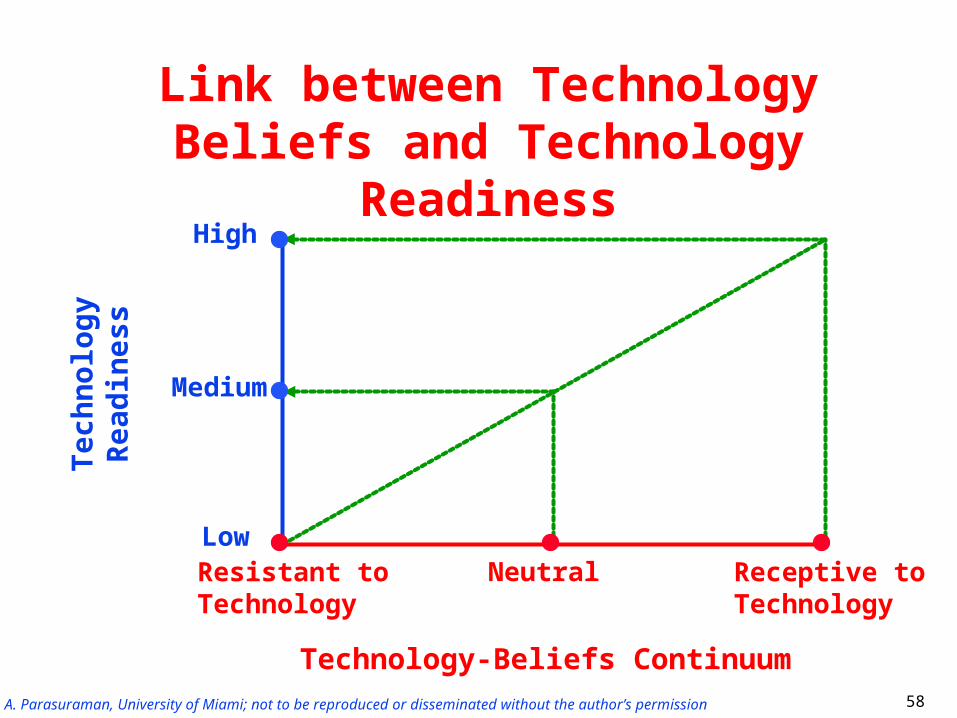
Link between Technology Beliefs and Technology Readiness
High
Receptive toTechnology
NeutralResistant toTechnology
Low
Medium
Tech
nolo
gyR
eadi
ness
Technology-Beliefs Continuum© A. Parasuraman, University of Miami; not to be reproduced or disseminated without the author’s permission 58
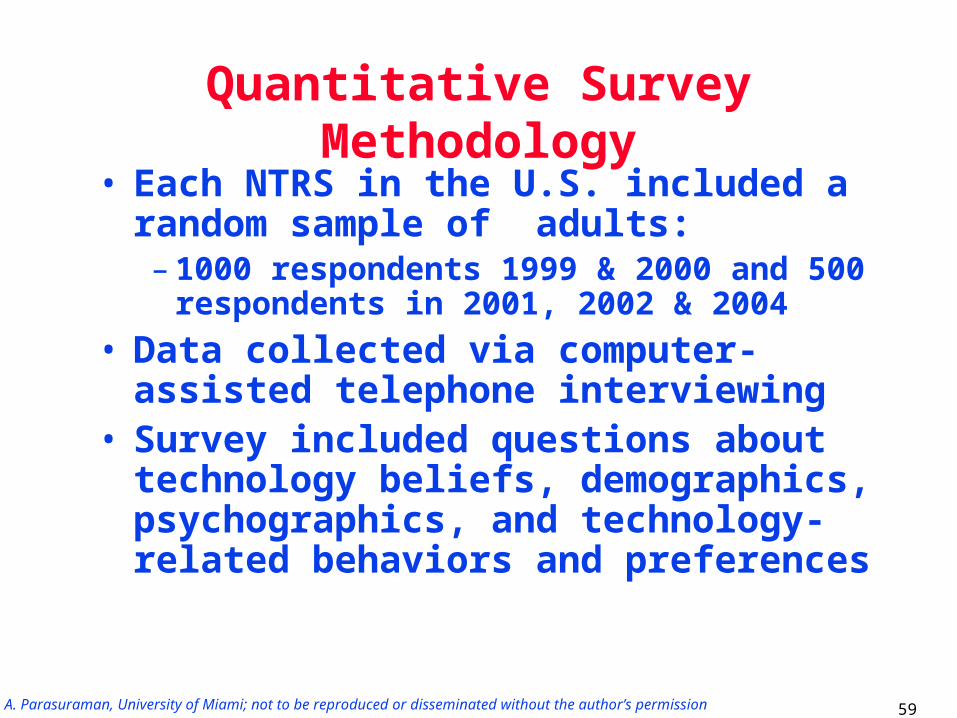
Quantitative Survey Methodology
• Each NTRS in the U.S. included a random sample of adults:– 1000 respondents 1999 & 2000 and 500
respondents in 2001, 2002 & 2004• Data collected via computer-assisted
telephone interviewing• Survey included questions about
technology beliefs, demographics, psychographics, and technology-related behaviors and preferences
59© A. Parasuraman, University of Miami; not to be reproduced or disseminated without the author’s permission

Key Insights from Quantitative Research Studies
• TR consists of four facets or dimensions that are fairly independent of one another
• People’s ratings on a set of belief statements about technology can be combined to create a reliable and valid measure of TR -- i.e., a “Technology Readiness Index” [TRI]
• The TRI is a good predictor of people’s technology-related behaviors and preferences
• A meaningful typology of customers can be created based on their TR scores on the four dimensions
© A. Parasuraman, University of Miami; not to be reproduced or disseminated without the author’s permission 60
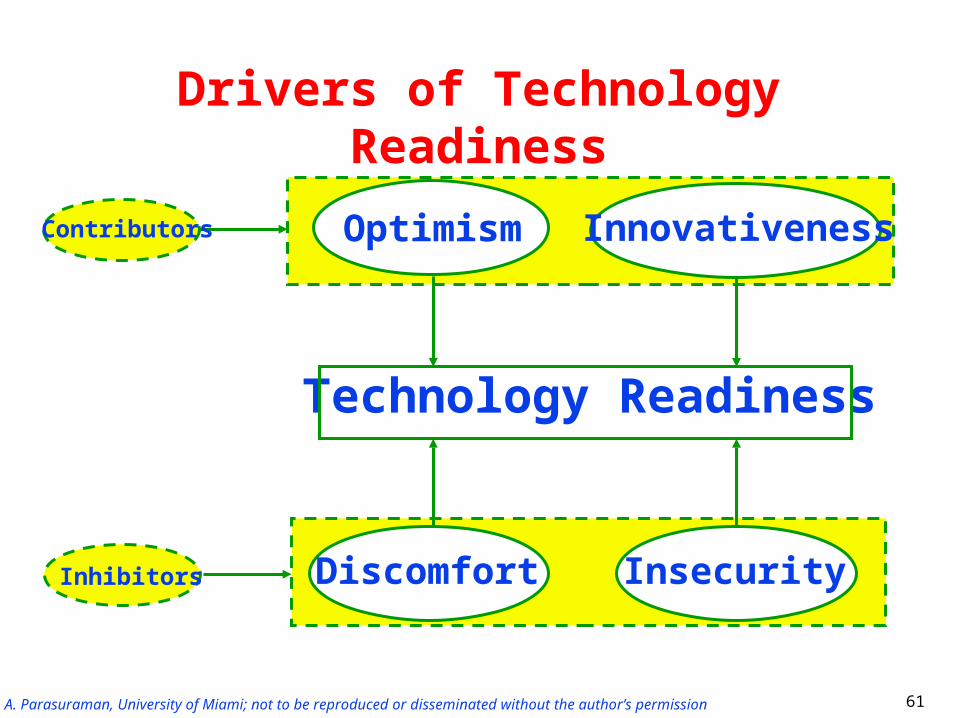
Drivers of Technology Readiness
Technology Readiness
Discomfort InsecurityInhibitors
Contributors InnovativenessOptimism
© A. Parasuraman, University of Miami; not to be reproduced or disseminated without the author’s permission 61

Definitions of the TR Drivers• Optimism: Positive view of technology;
belief that it offers increased control, flexibility and efficiency
• Innovativeness: Tendency to be a technology pioneer and thought leader
• Discomfort: Perceived lack of control over technology and a feeling of being overwhelmed by it
• Insecurity: Distrust of technology and skepticism about its working properly
© A. Parasuraman, University of Miami; not to be reproduced or disseminated without the author’s permission 62

• Optimism 10 items
• Innovativeness 7 items
• Discomfort 10 items
• Insecurity 9 items
The TRI: A 36-Item, 4-Dimensional Scale to Measure TR
© A. Parasuraman, University of Miami; not to be reproduced or disseminated without the author’s permission 63

• Example of Optimism: “Technology gives people more control over their daily lives”
% of respondents agreeing: 61% in 199968% in 200065% in 200165% in 200267% in 2004
• Example of Innovativeness: “You keep up with the latest technological developments in your areas of interest”
% of respondents agreeing: 68% in 199969% in 200065% in 200159% in 200260% in 2004
Customer Beliefs About Technology
© A. Parasuraman, University of Miami; not to be reproduced or disseminated without the author’s permission 64
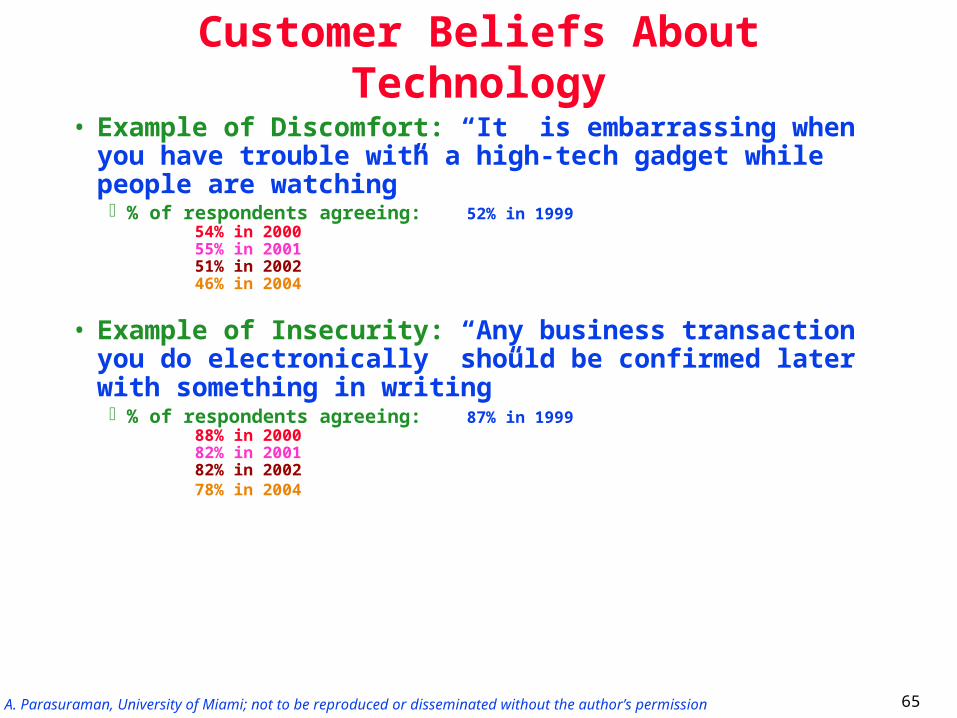
• Example of Discomfort: “It is embarrassing when you have trouble with a high-tech gadget while people are watching”
% of respondents agreeing: 52% in 199954% in 200055% in 200151% in 200246% in 2004
• Example of Insecurity: “Any business transaction you do electronically should be confirmed later with something in writing”
% of respondents agreeing: 87% in 199988% in 200082% in 200182% in 200278% in 2004
Customer Beliefs About Technology
© A. Parasuraman, University of Miami; not to be reproduced or disseminated without the author’s permission 65
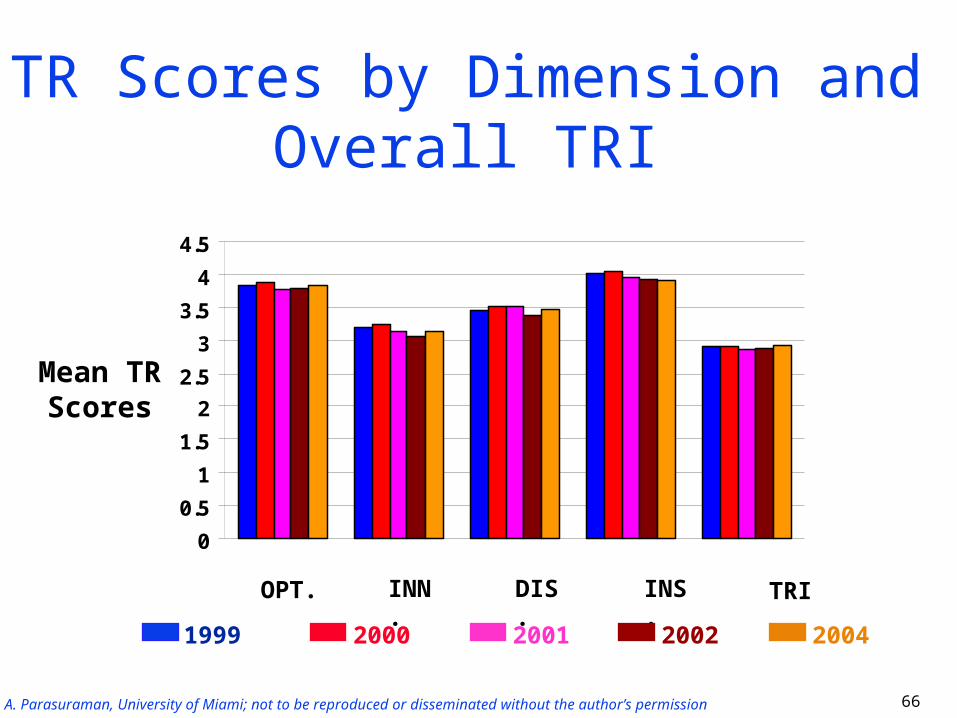
OPT. TRIINS.DIS.INN.
Mean TRScores
TR Scores by Dimension and Overall TRI
00.5
11.5
22.5
33.5
44.5
1999 2000 2001 20042002
© A. Parasuraman, University of Miami; not to be reproduced or disseminated without the author’s permission 66

Online Acitivities of High and Low TR Customers (NTRS 2004)
0 20 40 60 80 100
Bought stocksApplied for credit card
Did business with govt.Bought items > US$100
Booked travelChecked bank acct info
Read newspaper
Low TRHigh TR
%
© A. Parasuraman, University of Miami; not to be reproduced or disseminated without the author’s permission 67

3.032.83
3.133.01
2.852.68
3.032.96
2.77
3.142.88
2.83
2.4 2.5 2.6 2.7 2.8 2.9 3 3.1 3.2
Male Female
18-33 years34-47 years48-59 years60-88 years
College Grad or MoreSome College
High School or Less
$75K or More$40K to $75K
Less than $40K
TRI Scores by Demographics (NTRS 2004)
© A. Parasuraman, University of Miami; not to be reproduced or disseminated without the author’s permission 68
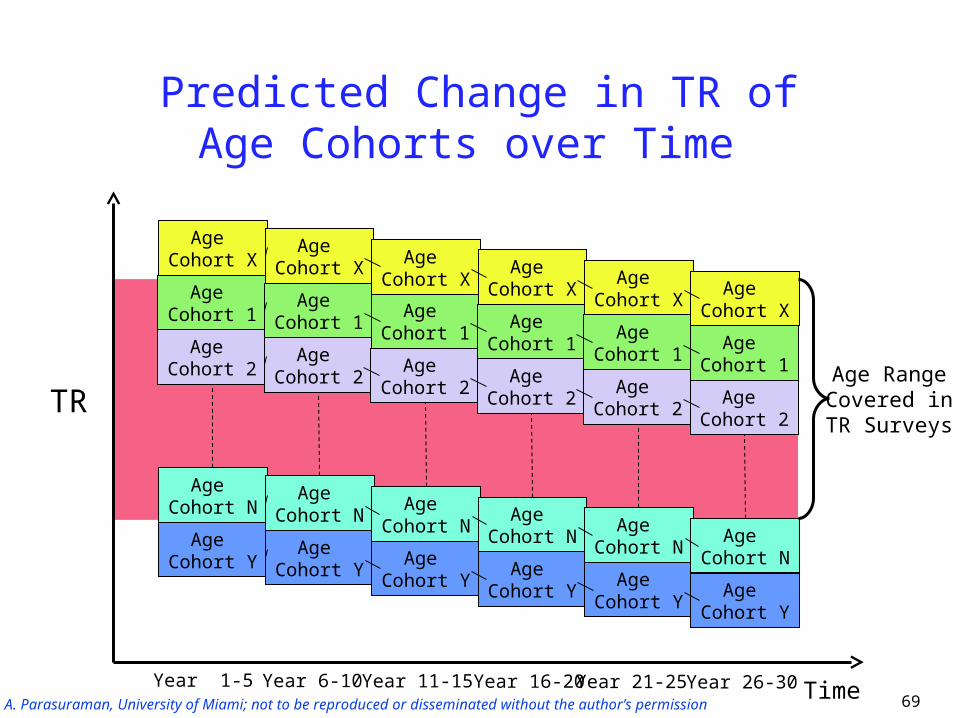
Predicted Change in TR of Age Cohorts over Time
TR
Age Cohort 1
Age Cohort 2
Age Cohort N
Age Cohort X
Age Cohort Y
Year 1-5
Age Cohort 1
Age Cohort 2
Age Cohort N
Age Cohort X
Age Cohort Y
Age Cohort 1
Age Cohort 2
Age Cohort N
Age Cohort X
Age Cohort Y
Age Cohort 1
Age Cohort 2
Age Cohort N
Age Cohort X
Age Cohort Y
Age Cohort 1
Age Cohort 2
Age Cohort N
Age Cohort X
Age Cohort Y
Age Cohort 1
Age Cohort 2
Age Cohort N
Age Cohort X
Age Cohort Y
Year 6-10 Year 11-15 Year 16-20 Year 21-25 Year 26-30 Time
Age RangeCovered inTR Surveys
© A. Parasuraman, University of Miami; not to be reproduced or disseminated without the author’s permission 69
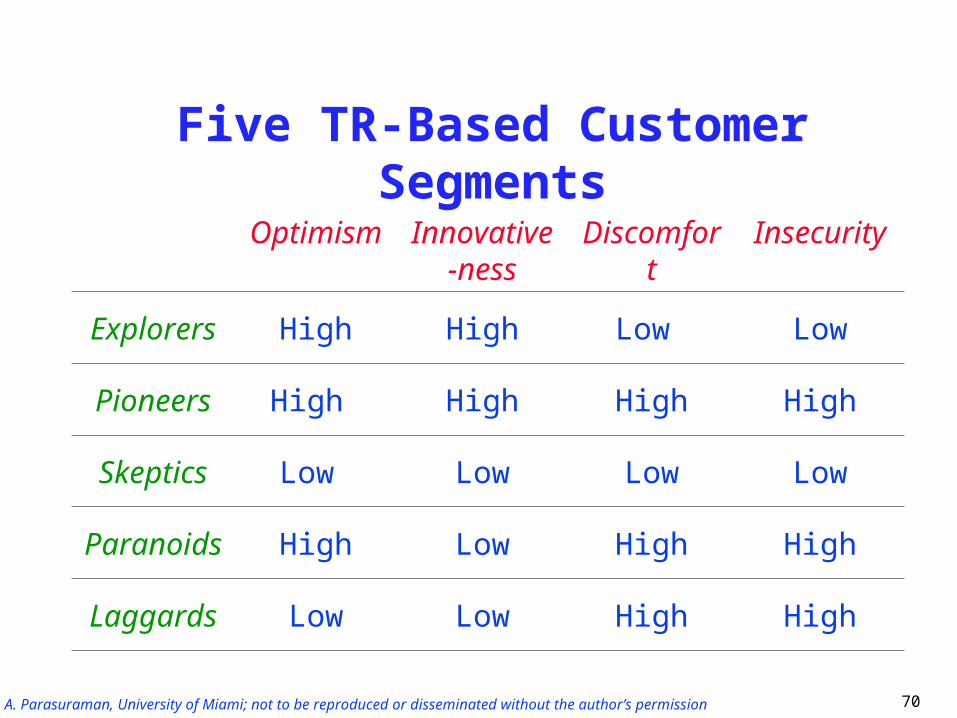
Five TR-Based Customer Segments
Optimism Innovative-ness
Discomfort Insecurity
Explorers High High Low Low
Pioneers High High High High
Skeptics Low Low Low Low
Paranoids High Low High High
Laggards Low Low High High
© A. Parasuraman, University of Miami; not to be reproduced or disseminated without the author’s permission 70

05
1015202530
%
Typology of Technology Customers: Percent of Population in Each Segment
1999 2000 2001 20042002
© A. Parasuraman, University of Miami; not to be reproduced or disseminated without the author’s permission 71

TR Segments and Technology Adoption
High
Low
Tech
nolo
gyR
eadi
ness
Time of Adoption of New Technologies
Explorers
Pioneers
Skeptics
Paranoids
Laggards
Early Late
72© A. Parasuraman, University of Miami; not to be reproduced or disseminated without the author’s permission

New Customer Composition by Age of Techno-Based Product/Service
Early
Late
Firs
t-tim
e U
sers Laggards
ParanoidsSkepticsPioneersExplorers
© A. Parasuraman, University of Miami; not to be reproduced or disseminated without the author’s permission 73

High-Tech versus High-Touch Customer Service
High
Low
App
eal o
f Hig
h-Te
ch
Serv
ice
Cha
nnel
s
Appeal of High-Touch Service Channels
Explorers
Pioneers
Skeptics
Paranoids
Laggards
Low High
74© A. Parasuraman, University of Miami; not to be reproduced or disseminated without the author’s permission
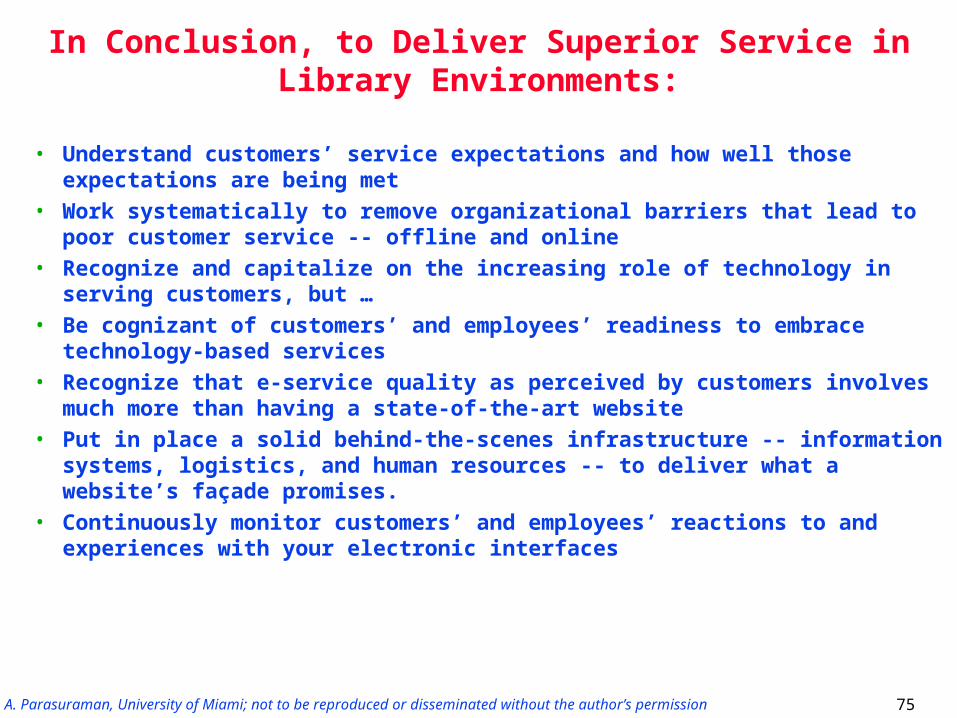
In Conclusion, to Deliver Superior Service in Library Environments:
• Understand customers’ service expectations and how well those expectations are being met
• Work systematically to remove organizational barriers that lead to poor customer service -- offline and online
• Recognize and capitalize on the increasing role of technology in serving customers, but …
• Be cognizant of customers’ and employees’ readiness to embrace technology-based services
• Recognize that e-service quality as perceived by customers involves much more than having a state-of-the-art website
• Put in place a solid behind-the-scenes infrastructure -- information systems, logistics, and human resources -- to deliver what a website’s façade promises.
• Continuously monitor customers’ and employees’ reactions to and experiences with your electronic interfaces
75© A. Parasuraman, University of Miami; not to be reproduced or disseminated without the author’s permission

Sources of Information about Customer Service and Technology Readiness
www.technoreadymarketing.com76

Thank You!
© A. Parasuraman, University of Miami; not to be reproduced or disseminated without the author’s permission 77