Embed Size (px)
Citation preview
QUALITY

QUALITY
Disclaimer:
This project has been funded with support from the European Commission. This publication [communication] reflects
the views only of the author, and the Commission cannot be held responsible for any use which may be made of the
information contained therein.
Project Title: Lean Learning Academies (LLA)
Project Number: 503663-LLP-1-2009-1-BE-ERASMUS-ECUE
Grant Agreement: 2009 – 3308 / 001 - 001
Sub-programme or KA: ERASMUS

- -
Learning Objectives
The purposes of the this module are to:
Present the main quality issues related to lean production
Explain the meaning of ‘quality’ and ‘value for the customer’
Describe the main quality tools used within lean management systems
Understand the concept of “Continuous Improvement”
Identify the different steps in the PDCA (continuous improvement) cycle
Quality 311/03/2021

- -
Content
1. Quality – Brief Introduction
2. Quality Planning2.1. Built-in Quality
2.2. Design for Lean
3. Quality Control3.1. Quality at the Source
3.2. Quality Process Mapping
3.3. Quality Analysis Matrix
4. Quality Improvement4.1. Main Quality Tools: Pareto, Ishikawa
4.2. PDCA – Deming Circle
5. Conclusions
Quality 411/03/2021

1. Quality
Brief Introduction
Quality Definition
Quality Concept Evolution and Main Quality Experts
Quality Perspectives and Dimensions
Lean and/or Quality?

- -
Why Is Quality So Important?
Quality is no longer just a technical issue, it is a:
Business issue:
Customers have rising expectations and require low quantity of high quality products at low costs.
Quality gives customers satisfaction and differentiates good supplier companies from the competition.
Poor quality reduces productivity and increases costs.
Cultural issue:
Organisational culture based upon the management’s commitment to quality and continuous improvement.
Quality 611/03/2021

- -
The Consequences of Poor Quality
Loss of business Customers are no longer satisfied and their complaints are not
properly dealt with. They do not come back anymore for new orders.
Loss of production Loss of customers Loss of jobs
Reduced productivity Many hours of rework or scrap. More input but less quality output
Higher costs Liability
Losses due to damages or injuries resulting from poor quality (design, conformance, ease of use, service)
Quality 711/03/2021

- -
“Quality is free. It’s not a gift, but it is free.
What costs money are the unquality things --
all the actions that involve not doing jobs
right the first time.”(Philip B. Crosby, 1979)
Quality 811/03/2021

Quality
Quality Definition

- -
Quality?
What do you think that quality is?
Quality 1011/03/2021

- -
So, What Is Quality Eventually?
There is no single and general accepted definition of quality.
Different people and different organisations have formulated different definitions at different moments in time.
Some common views refer to quality as: Conformance to specifications (Philip B. Crosby)
Does the product/service meet the requirements defined by designers?
Fitness for intended use (Joseph Juran) It evaluates the operational performance - how well the product or service
does what the consumer thinks it is supposed to do
Value for price paid It indicates the usefulness degree vs. price paid
Support services Quality depends upon the after sale support
Psychological perception e.g. status, ambiance, prestige, friendly staff
Quality 1111/03/2021

- -
Some Definitions
A product or a service possesses quality if it helps somebody and enjoys a good and sustainable market. (Deming)
Quality is delivering defect free product with competitive price.
Totality of characteristics of an entity that bear upon its ability to satisfy stated or implied needs.
Quality of a product or services is its ability to consistently and continuously satisfy the needs and expectations of the customer.
A degree or level of excellence – the ability of the product or service to exceed customer expectations
Quality is determined by what customers want and what they are willing to pay for.
Quality is inversely proportional to variability.
ISO 9000:2005 defines quality as: “Degree to which a set of inherent characteristics fulfils requirements.”
Quality 1211/03/2021

- -
Remember!
Quality 1311/03/2021

Quality
Quality Concept Evolution and Main Quality Experts

- -
Evolution of Quality
Before the industrial revolution
Skilled craftsmanship during middle ages
High costs, low volume
Custom products built to order, simple tools, highly skilled workforce, quality by repeated adjustments and rework
Integrated product development
The skilled craftsmen were building quality into their products – a very developed workmanship pride
Quality 1511/03/2021

- -
Evolution of Quality (2)
After the Industrial Revolution, till the 2nd World War Higher volumes, lower costs
Production of interchangeable parts and use of inspection to separate the good products form the bad ones
Sorting, grading, reworking
End of the 19th century – Development of the “scientific management” Thomas Jefferson and F. W. Taylor emphasized on production efficiency and
decomposed jobs into smaller and simpler work tasks.
1920’s – Dr. Walter A. Shewhart studied variation in the production processes and developed the concept of statistical process control charts. He is currently referred to as the father of statistical quality control.
1930’s – development of tables for acceptance sampling and use of statistical thinking outside manufacturing
1940’s – W.E. Deming edits Shewhart’s book and develops the ‘Deming’s 14 points’ and the ‘Plan-Do-Study-Act’ (PDSA) cycle
Quality 1611/03/2021

- -
Evolution of Quality (3)
During the 2nd World War Quality control
Self-inspection, product sampling and testing, basic quality planning, records and analysis to detect and solve any non-conformance product
Extensive use of statistical concepts
Quality 1711/03/2021

- -
Evolution of Quality (4)
After the 2nd World War (50-70’) Quality management in Japan
Joseph M. Juran and W. Edwards Deming were sent to Japan to teach statistical methods and statistical quality control.
1950/60’s: Systems of improvement
Joseph M. Juran published the first edition of Quality Control Handbook and advocated 3 basic management processes for quality, which are now known as the Juran Trilogy
Quality Planning, Quality Control and Quality Improvement
P.B. Crosby: Zero defects - do it right the first time
A. Feigenbaum develops an integrated view of quality - Total Quality Control (TQC)
K. Ishikawa introduces cause-effect (fishbone) diagrams
G. Taguchi develops the quality cost function
Quality 1811/03/2021

- -
Evolution of Quality (5)
After 1980’s Quality is no longer seen as the result of sorting good parts
during inspection, but as ‘built-in’ quality into the production processes
ISO 9000 series on Quality Management
Quality assurance
Quality management systems development, advanced quality planning, comprehensive quality manuals, quality costs, involvement of non-production operations, failure mode and effects analysis (FMEA), SPC.
Total Quality Management (TQM)
Policy deployment, involve all stakeholders and all operations, process management, performance measurement, teamwork, employee involvement
Quality 1911/03/2021

- -
Evolution of Quality (6)
New trends nowadays: 6Sigma
Lean
Lean six sigma
Design for six sigma
BSC
TPM
QFD
TOC
Excellence models
TRIZ – Creative problem solving
Quality 2011/03/2021

- -
Some of the Main Quality Experts
Walter A. Shewhart (1891-1967) – ‘father’ of statistical quality control, statistical control charts
Armand V. Feigenbaum – Total Quality Control
W. Edwards Deming – Total Quality Management
Joseph M. Juran – ‘Fitness of Use’, the Quality Trilogy
Philip B. Crosby – ‘Zero Defects’, Quality is Free
Kaoru Ishikawa – Cause and Effect Diagram, Quality Circles
Genichi Taguchi – Total Loss Function
Taiichi Ohno – Muda
Masaaki Imai – Kaizen
Shigeo Shingo – Poka Yoke, SMED
Quality 2111/03/2021

- -
W. Edwards Deming
W. Edwards Deming (1900 – 1993) Sent to Japan after the 2nd World War
Japanese adopted many aspects of Deming’s management philosophy
The major contributions to the theory of quality Theory of Variation (Statistical Theory);
The 14 points for management
PDCA/PDSA cycle
The theory of profound knowledge
The company is a large system including a set of interdependent elements.
Every worker has quite infinite potential if placed in a proper environment, that supports, educates, and fosters senses of pride and responsibility. Deming stated that the vast majority (85 percent) of a worker's effectiveness is determined by his environment and the rest of 15% by his own skill and faults.
A manager using the system of profound knowledge must understand the psychology of groups and individuals and employ management tools accordingly.
Quality 2211/03/2021

- -
W. Edwards Deming’s 14 Points for management
1. Create constancy of purpose towards improvement of product and services. Create and publish a company mission statement and commit to it, provide innovation, investment in research and education, continuous improvement of product and service, maintenance of equipment, furniture and fixtures, and new aids to production.
2. Adopt the new philosophy. It is no more acceptable to work with the same levels of delays, mistakes, defective products, wastes. Lead to promote change.
3. Understand the purpose of inspection. Cease dependence on mass inspection to achieve quality. Require, instead, statistical evidence that quality is built in in the first place. Inspect products and services only enough to be able to identify ways to improve the process.
4. End business practices driven by price alone. Instead, minimise total cost. Move towards single suppliers, based on a long-term relationship of loyalty and trust.
5. Find problems and improve constantly the system of production and service. Improvement is not a one-time effort; management is responsible for leading the organization into the practice of continual improvement in quality and productivity.
6. Institute modern methods of training and retraining on the job. Workers need to know how to do their jobs correctly even if they need to learn new skills.
7. Emphasize leadership. Institute modern methods of supervision of production workers. The responsibility of foremen must be changed from numbers to quality. Manage things, but lead people. Failing organizations are usually over-managed and under-led.
Source: www.deming.org
Quality 2311/03/2021
- -
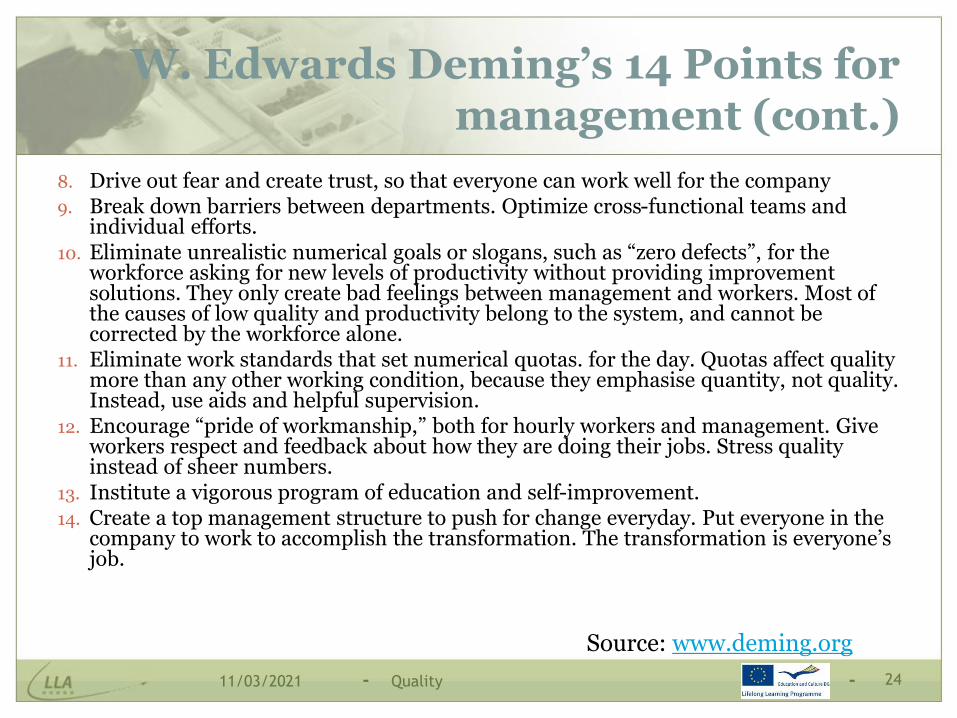
W. Edwards Deming’s 14 Points for management (cont.)
8. Drive out fear and create trust, so that everyone can work well for the company9. Break down barriers between departments. Optimize cross-functional teams and
individual efforts.10. Eliminate unrealistic numerical goals or slogans, such as “zero defects”, for the
workforce asking for new levels of productivity without providing improvement solutions. They only create bad feelings between management and workers. Most of the causes of low quality and productivity belong to the system, and cannot be corrected by the workforce alone.
11. Eliminate work standards that set numerical quotas. for the day. Quotas affect quality more than any other working condition, because they emphasise quantity, not quality. Instead, use aids and helpful supervision.
12. Encourage “pride of workmanship,” both for hourly workers and management. Give workers respect and feedback about how they are doing their jobs. Stress quality instead of sheer numbers.
13. Institute a vigorous program of education and self-improvement.14. Create a top management structure to push for change everyday. Put everyone in the
company to work to accomplish the transformation. The transformation is everyone’s job.
Source: www.deming.org
Quality 2411/03/2021
- -
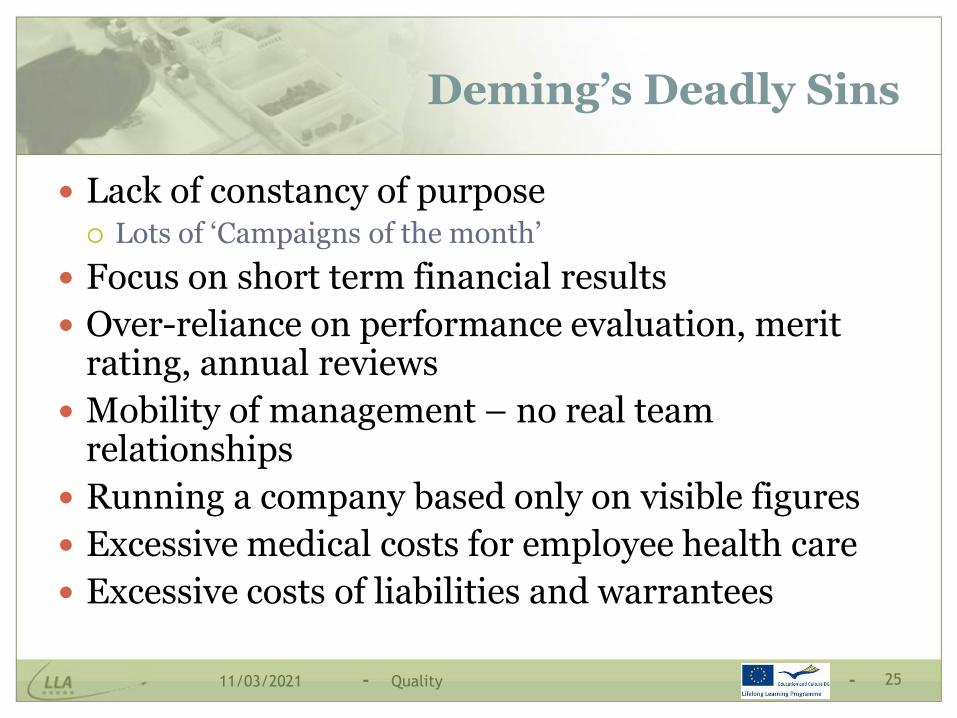
Deming’s Deadly Sins
Lack of constancy of purpose Lots of ‘Campaigns of the month’
Focus on short term financial results
Over-reliance on performance evaluation, merit rating, annual reviews
Mobility of management – no real team relationships
Running a company based only on visible figures
Excessive medical costs for employee health care
Excessive costs of liabilities and warrantees
Quality 2511/03/2021

- -
Joseph M. Juran
Joseph M. Juran (1904 – 2008) Born in Romania, immigrated to the US Quality is defined as “fitness for use” and it incorporates
Quality of design Quality of conformance Availability Safety Field use
The major contributions to quality management development: Quality Habit The Quality Control Handbook The Quality Trilogy: Quality Planning, Quality Control and
Quality Improvement Focus on management Quality improvement based on project-by-project team
approach
Quality 2611/03/2021

- -
Juran’s Trilogy
Quality Planning
Quality Control
Quality Improvement
Quality 2711/03/2021

- -
Juran’s Trilogy
Quality 2811/03/2021
- -
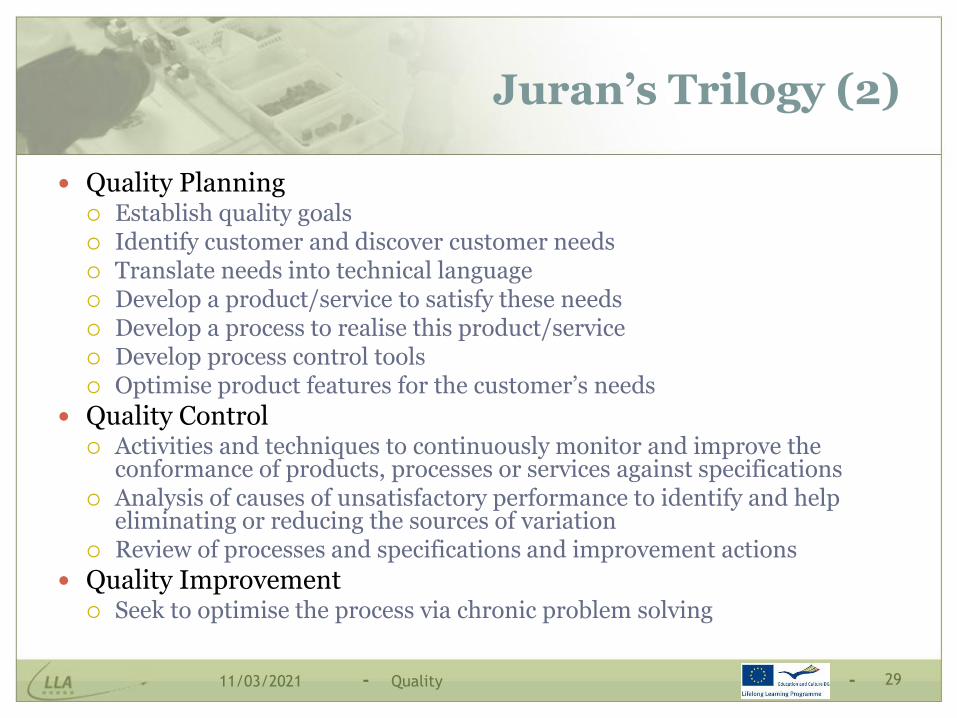
Juran’s Trilogy (2)
Quality Planning Establish quality goals Identify customer and discover customer needs Translate needs into technical language Develop a product/service to satisfy these needs Develop a process to realise this product/service Develop process control tools Optimise product features for the customer’s needs
Quality Control Activities and techniques to continuously monitor and improve the
conformance of products, processes or services against specifications Analysis of causes of unsatisfactory performance to identify and help
eliminating or reducing the sources of variation Review of processes and specifications and improvement actions
Quality Improvement Seek to optimise the process via chronic problem solving
Quality 2911/03/2021
- -
Philip B. Crosby
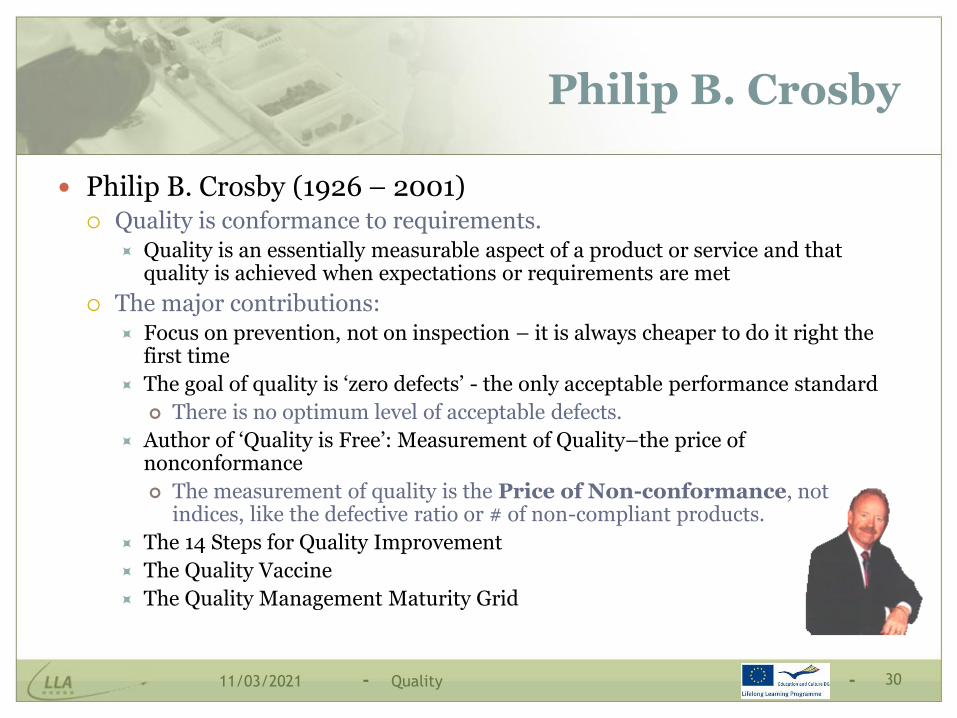
Philip B. Crosby (1926 – 2001) Quality is conformance to requirements.
Quality is an essentially measurable aspect of a product or service and that quality is achieved when expectations or requirements are met
The major contributions: Focus on prevention, not on inspection – it is always cheaper to do it right the
first time
The goal of quality is ‘zero defects’ - the only acceptable performance standard
There is no optimum level of acceptable defects.
Author of ‘Quality is Free’: Measurement of Quality–the price of nonconformance
The measurement of quality is the Price of Non-conformance, not indices, like the defective ratio or # of non-compliant products.
The 14 Steps for Quality Improvement
The Quality Vaccine
The Quality Management Maturity Grid
Quality 3011/03/2021
- -
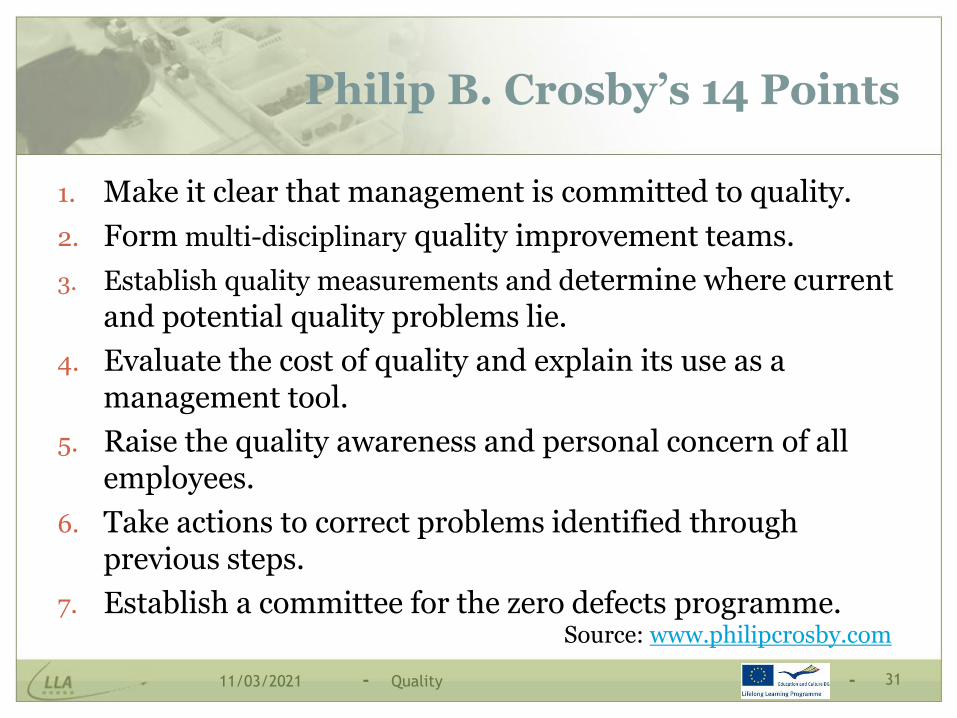
Philip B. Crosby’s 14 Points
1. Make it clear that management is committed to quality.
2. Form multi-disciplinary quality improvement teams.
3. Establish quality measurements and determine where current and potential quality problems lie.
4. Evaluate the cost of quality and explain its use as a management tool.
5. Raise the quality awareness and personal concern of all employees.
6. Take actions to correct problems identified through previous steps.
7. Establish a committee for the zero defects programme.Source: www.philipcrosby.com
Quality 3111/03/2021

- -
Philip B. Crosby’s 14 Points (2)
8. Train supervisors and managers to actively carry out their part of the quality improvement programme.
9. Hold a ‘zero defects day’ to let all employees realise that there has been a change within the company.
10. Encourage all individuals to establish improvement goals for themselves and their groups.
11. Encourage employees to communicate to management the obstacles they face in attaining their improvement goals.
12. Recognise and appreciate those who participate.13. Establish quality councils to communicate on a regular
basis.14. Do it all over again to emphasise that the quality
improvement programme never ends.
Source: www.philipcrosby.com
Quality 3211/03/2021
- -
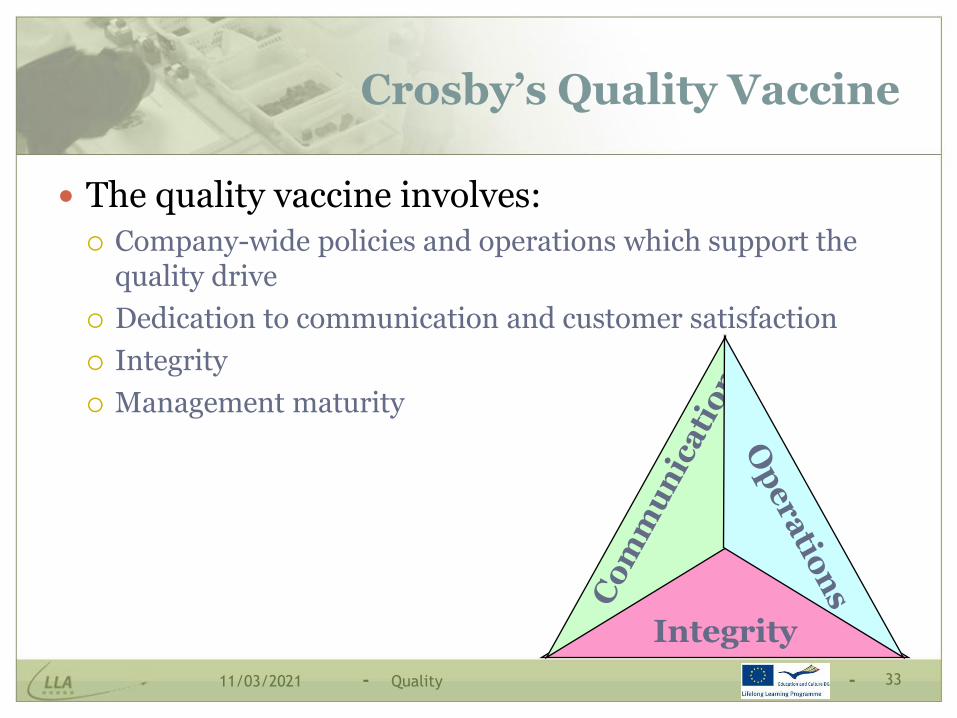
Crosby’s Quality Vaccine
The quality vaccine involves:
Company-wide policies and operations which support the quality drive
Dedication to communication and customer satisfaction
Integrity
Management maturity
Integrity
Quality 3311/03/2021

- -
Shigeo Shingo
Shigeo Shingo (1909 – 1990 )
The major contributions:
Poka-yoke (Mistake Proofing)
Shingo considered that ‘statistical methods detect errors too late in the manufacturing process’, so he emphasised the need for error prevention, as he believed that humans are fallible.
Single-minute exchange of dies (SMED)
Quality 3411/03/2021
- -
Taiichi Ohno
Taiichi Ohno (1912 – 1990)
‘Father’ of the Toyota Production System
The major contributions:
Muda – Muri – Mura
7 Wastes
Quality 3511/03/2021

- -
Kaoru Ishikawa
Kaoru Ishikawa (1915 – 1989 )
The major contributions:
The Cause and Effect Diagram (also known ad the "Ishikawa" or "fishbone" diagram)
Showed the importance of integrating the seven basic quality tools in running daily activities:
Run Charts, Histograms, Pareto Charts, Cause and Effect Diagrams, Scatter Diagrams, Process Flow Charts, Control Charts
Defined the ‘internal customer’
Influenced participative approaches involving all workers
Quality Circles
Quality 3611/03/2021

- -
Genichi Taguchi
Genichi Taguchi (born in 1924) Taguchi realized methods of identifying those noise sources
which have the greatest effects on product variability. The major contributions:
The Loss Function Both non-compliance and over-compliance may cause losses (cost of
non-quality, loss of reputation and goodwill). Taguchi devised an equation to quantify the decline of a customer's
perceived value of a product as its quality declines. Orthogonal Arrays and Linear Graphs
Method used to isolate main outside factors or noise which cause deviations from the mean, based upon the costs induced.
The Concept of Robustness Robustness is seen as the ability of a process or product to work as
intended regardless of uncontrollable outside factors. Design of Experiments
Quality 3711/03/2021

Quality
Quality Perspectives and Dimensions

- -
Facets of Quality
To summarize, quality was defined by different experts, from many points of view, during its evolution.
So, there have been identified many:
Perspectives of quality
Dimensions of quality
Levels of quality
Quality 3911/03/2021

- -
Quality Perspectives
Each quality definition is based on a specific perspective. Here there are the relevant five quality perspectives:
1. Transcendent definition, from a judgmental perspective
2. Product-based perspective
3. User-based perspective
4. Value-based perspective
5. Manufacturing-based perspective
Quality 4011/03/2021

- -
Quality Perspectives (2)
1. Transcendent quality definition
Quality is not something very clear to define, but is equivalent to excellence, “goodness of a product” and is universally recognizable
Examples of ‘quality’ products: Rolex watches, Ferrari cars, Ritz hotels
2. Product-based perspective of quality
Quality is a precisely defined and measurable variable. Differences in quality reflect differences in quantity of some product attributes.
Quality 4111/03/2021

- -
Quality Perspectives (3)
3. User-based perspective Quality is “fitness for intended use” and refers to product
characteristics and features that affect customer satisfaction As individuals have different needs and expectations, quality means meeting customer requirements, hence different quality standards should be met.
4. Value-based perspective It is the perspective of quality vs. price. Quality means best
combination of price and product features, namely products as good as the competing ones, sold at a lesser price, or products offering best performance at an acceptable price, or conformance at an acceptable costs.
5. Manufacturing-based perspective Quality is “conformance to specifications” or the degree to which
a product conforms to design specification.
Quality 4211/03/2021

- -
Dimensions of Product Quality
Performance Primary product characteristics
Special features Secondary product characteristics, added features
Time Waiting in line Concept to production Speed of delivery
Reliability Extent of failure-free operation, meaning that
product operates properly within an expected time frame; average time for the unit to fail, probability of failing
Durability Useful life, including repair time and failure
frequency, until replacement is preferable to repair
Conformance and consistency Meeting specifications, customer’s expectations or
industry standards
Uniformity Low variation among repeated outcomes of
a process
Serviceability - service after sale Handling the customer complaints or
checking on customer satisfaction, resolution of problems
Ease of repair, speed of repairs
Aesthetics Characteristics that relate to the senses,
such as exterior finish, sound, appearance, feel, smell, taste, colours
Perceived Quality Indirect evaluation of quality (e.g.
reputation, past performance and other intangibles)
Responsiveness Characteristics of the human-to-human
interface (speed, courtesy, competence)
Safety Limited and controlled risk of injury
When we think of quality, we are considering many aspects, referred to as the ‘dimensions’ of quality:
Quality 4311/03/2021
- -
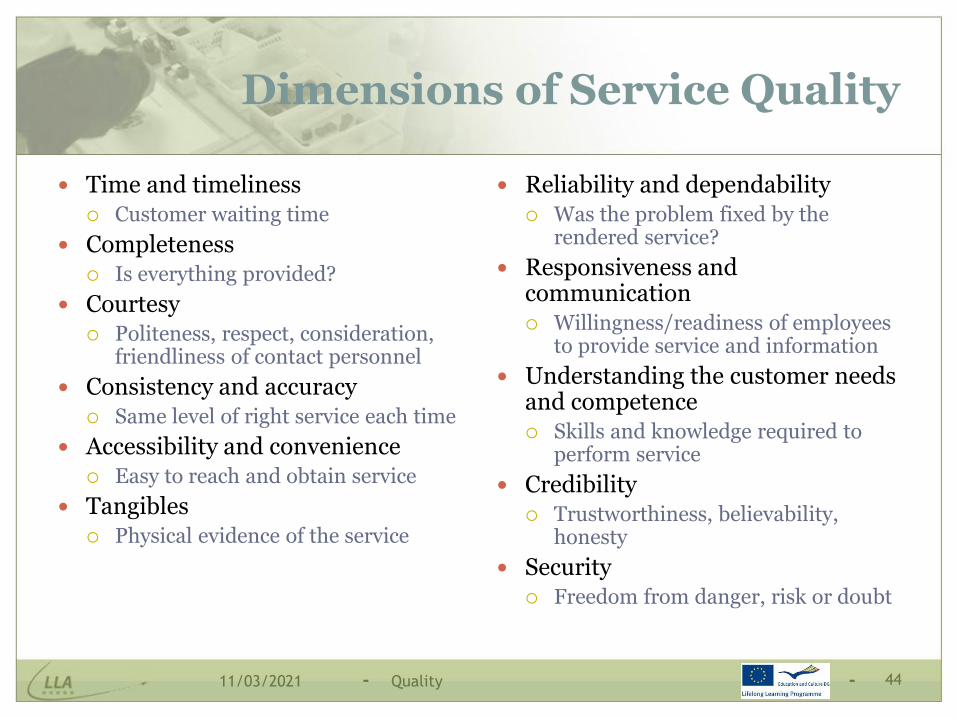
Dimensions of Service Quality
Time and timeliness Customer waiting time
Completeness Is everything provided?
Courtesy Politeness, respect, consideration,
friendliness of contact personnel
Consistency and accuracy Same level of right service each time
Accessibility and convenience Easy to reach and obtain service
Tangibles Physical evidence of the service
Reliability and dependability Was the problem fixed by the
rendered service?
Responsiveness and communication Willingness/readiness of employees
to provide service and information
Understanding the customer needs and competence Skills and knowledge required to
perform service
Credibility Trustworthiness, believability,
honesty
Security Freedom from danger, risk or doubt
Quality 4411/03/2021

Quality
Lean and/or Quality?

- -
Lean vs. Quality Management
Lean is a set of concepts, principles and tools used to systematically find and eliminate waste in a production system, as to create and deliver the most value from the customer’s perspective while consuming the fewest resources. Success Indicator
% of Value Added Activities
Method of Achievement Continuous Improvement
Quality Management is what an organization does to fulfil the customer's quality requirements, and applicable regulatory requirements, while aiming to enhance customer satisfaction, and achieve continual improvement of its performance. (ISO 9000:2005) Success Indicator:
% Customer Satisfaction
Method of Achievement: Continuous Improvement
Quality 4611/03/2021

- -
Lean and/or Quality?
Poka Yoke
Standard Word
Problem Solving
Design for Lean
Built-in Quality
Cause-Effect Analysis
Product Value
Analysis
•Quality at the Source
•Statistical Process Control
•Process QualityMapping
•Quality Methods (Pareto, Ishikawa, PDCA - Deming Circle)
•Quality Analysis Matrix
•Failure Mode Analysis
•Process Audits
▪Waste Elimination
▪5S+Safety
▪Visual Management
▪Total Preventive
Maintenance
▪Kaizen
▪SMED
▪Value Stream Analysis
▪KANBAN
LEAN
QUALITY
Quality 4711/03/2021

- -
Lean vs. Quality
The main similarity of the two approaches is that both quality and lean principles start from the customer’s point of view.
The main difference: Quality aims at customer satisfaction.
Satisfaction is not a directly quantifiable indicator; usually it is appreciated the customers’ perception of own satisfaction.
Nowadays, many companies declare that their quality goal is to satisfy and to go beyond the customers’ needs and expectations.
Lean is focused on the value added for the customer. The value is seen from the customers’ point of view and it usually refers to those
activities that help transform a product or service from its raw state into its customer’s desired form, done right the first time at the right time and in due time.
The value added activities are either the activities that customer thinks as important and willing to pay for them, or required by the law, regulations or ethical considerations.
Quality 4811/03/2021

- -
Lean and Quality
Lean induces major improvements in overall quality levels: Reduced internal quality costs
Better quality during the overall product life cycle.
Lean tackles many quality chronic problems.
Lean goes beyond the product specifications and deals with other relevant quality dimensions, such as responsiveness, on-time delivery performance, and reputation.
Lean philosophy, when correctly understood and deployed, enables an environment of continuous improvement.
Quality 4911/03/2021
- -
So, Quality means … ?
Quality 5011/03/2021

- -Quality 5111/03/2021

2. Quality Planning
2.1. Built-in Quality
2.2. Design for Lean

- -
Current Organisation Management
Continuous Improvement
ServiceQuality
Quality Planning
ManufacturingQuality
Quality 5311/03/2021

- -
The Four Determinants of Quality
Quality of design - Planned Quality
Determining which features to include or exclude in the final product/service design, according to customer requirements
Quality of conformance to specifications - Executed Quality
Production processes are selected and set up to meet product/service specifications
Ease of use
Instructions, manuals for operations, maintenance, training, safety
Service after delivery
Responsiveness, serviceability, spare parts
Bu
ilt-
inQ
ua
lity
Qu
ali
ty a
t th
e S
ou
rc
e
Quality 5411/03/2021

2.1. Built-in Quality
Product and Process Design

- -
Customer Satisfaction
There are two main drives to provide high customer satisfaction:
Built-in-quality
During product and process design
Product specification
Freedom from deficiencies
Quality-at-the-source
During production and use of the product
Quality of conformance
• Higher conformance means fewer complaints and increased customer satisfaction.
Quality 5611/03/2021

- -
ISO 9001:2008 - Relevant Sections for Quality Planning
7 Product Realization 7.1 Planning of product realization
7.2 Customer-related processes 7.2.1 Determination of requirements related to the product
7.2.2 Review of requirements related to the product
7.2.3 Customer communication
7.3 Design and development 7.3.1 Design and development planning
7.3.2 Design and development inputs
7.3.3 Design and development outputs
7.3.4 Design and development review
7.3.5 Design and development verification
7.3.6 Design and development validation
7.3.7 Control of design and development changes
Quality 5711/03/2021

- -
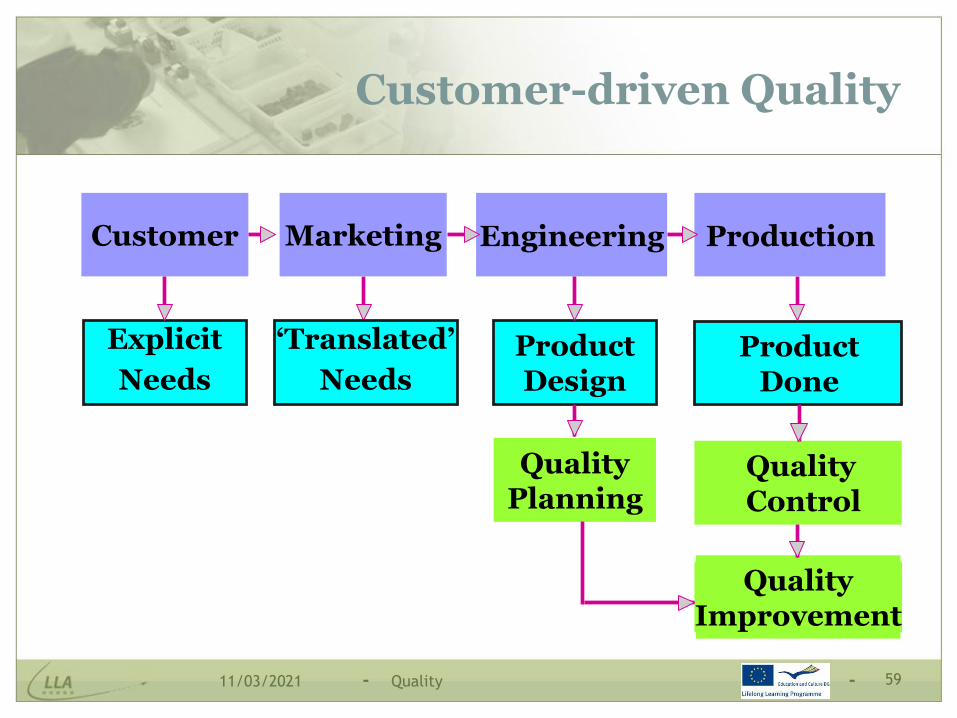
Quality Planning
Steps:A. Identify who are the customers
B. Find out the needs of those customers
C. Product/service development Translate the customers’ needs and general requirements into product
specifications
D. Product/service design
E. Process design
F. Design review and product design improvement, so as to meet: Customer needs
Other general needs
Internal specific needs – efficiency, profitability, ethics
External requirements – laws, regulations
Quality 5811/03/2021
- -
Customer-driven Quality
Explicit
Needs
Customer
‘Translated’
Needs
Marketing
ProductDesign
QualityPlanning
Engineering
ProductDone
QualityControl
QualityImprovement
Production
Quality 5911/03/2021

A. Who Are the Customers?

- -
Who Are the Customers?
Customers are: The most important people for any business.
They deserve the most courteous and attentive treatment we producers could give them.
They are not dependent of suppliers. Suppliers are dependent upon them.
Customers are not a bother for producers. They are the purpose of the producers’ remaining in business.
Satisfying customers is the only reason companies are still in business.
Customers have a major input for the producers’ processes.
They have not been considered just a statistic. They should be seen as individual human beings, with various feelings and emotions.
The next employee down the process flow from you is your first customer. At the end of the production line is the external customer.
Quality 6111/03/2021

- -
The Customer
Customers assign a value to the product or service in accordance with the perception of the degree of satisfaction against own needs and desires, either expressed or implicit. In exchange for this value, they pay and often go into debt,
and this constitutes the sole source of income for the business.
The nowadays trend is to move away from the strategy based on customers’ satisfaction to delighting customers, i.e. from satisfying declared needs to exceed customers’ expectations in terms of quality, cost and time.
Quality 6211/03/2021

- -
Customer’s Needs
Main concerns:
The product/service characteristics should vary according to specific customer needs.
The product/service should meet customer requirements in the simplest and most cost-effective manner
Shortest time to market
Limited number of revisions needed
A customer can be defined as one who purchases or patronizes for the purpose of receiving products or services. There are two major categories of customers:
External customers
Internal customers
Quality 6311/03/2021
- -
Internal Customers/Suppliers
The internal supplier is the product, service or advice, which represents the end-product of one stage in the process.
The internal customer is the office, shop or service which carries out the next stage.
Each worker on a process flow acts both as a supplier and a customer with respect to and for the other.
Main principle: The relationship between internal customer and internal supplier has a key role to satisfying the external customer.
Quality 6411/03/2021

- -
Society
Employees
PeopleOther organisations
Organisation
Managers
Competition
Different Customers / Stakeholders
Customers
RegulatingBodies
Suppliers
Quality 6511/03/2021

B. What Do the Customers Need?
- -
What do Customers Buy?
Customers buy satisfaction, not merely goods or services.
Examples:
Producers of cleaning products sell the benefits of clean and nicely perfumed clothes or surfaces
Producers of cosmetics sell youth hopes for adult women
Customers pay for need-satisfying supplies
The buyer decision is based on value for the customer
Lately, goods are no more sold for their inherent features, if not accompanied by suitable services
Examples:
Furniture is bought not only for its current use, but for the designer’ reputation, because it is transported and fixed on place, because there are disposal provisions in the sale offer, etc.
Quality 6711/03/2021

- -
Product
ProductUse
Package
PhysicalGood
FeaturesOther QualityDimensions
Service(Warranty)
Brand (Product Image)
Product Components
Customers buy not only a product, but also several intangible features:
Quality 6811/03/2021

- -
Customers’ Values
Customer satisfaction and delight Quality at low cost Quality is multi-dimensional for customers
Garvin identified the following quality dimensions: Performance Extra features Reliability Conformance Durability Serviceability Aesthetics Perceived quality
In addition, Schonberger has added 4 new dimensions: Quick response Quick-change response Humanity Value
Quality 6911/03/2021

- -
Customer Feedback Methods
To obtain information from the customers involves a certain range of useful tools:
Comment Cards
Surveys
Focus Groups
Toll-free Telephone Numbers
Customer Visits
Report Cards
Internet
Employee Feedback
Quality 7011/03/2021

C. Product Development
Product Specification

- -
Customer’s Needs vs. Product Specification
Customer
Needs
Implicit Needs
(Expectations)
External Requirements
Technical, technological, legal, regulatory, social, ethical, financial,
ecological, etc.
Product Specification
‘Translating’ needs into
product features
Organizational Needs
Strategy, profit, growth. standardized
work, internal requirements
Explicit Needs
(Requirements)
Quality 7211/03/2021

- -
Some Definitions
Need
Need means a lack of something requisite, desirable, or useful.
Necessity, desire, expectation, requirement, demand
A need may be:
Explicit
A clearly formulated request
Implicit
A latent, non declared desire or expectation
• Current implicit need
• Future implicit need
Quality 7311/03/2021

- -
Some Definitions (2)
Product/service
A product/service is something provided to a customer, to satisfy the customer’s need.
Product/service specification
A set of requirements to be satisfied by a product or a service
Functions
What the product is intended to do
Features (quality dimensions)
Costs
Quality 7411/03/2021

- -
Exercise
You have just been employed by a manufacturing company to be a member of the design team. The company has asked their customers and received the following input,
in different configurations: The new product should include an AM-FM radio, a CD player, a telephone with an
answering device, a clock with alarm and a timer, a flashlight, a smart screen, smoke and fire detection device;
As implicit needs, the customers had in mind a small and light portable device, low price, high fidelity performance, low energy consumption, long-lasting battery, easy to use, …
The company is trying to decide whether or not to include everything in one single product, and also if to include additional functions: a remote control for turning on/off the electrical house appliances, an external 2” TV screen and a device to synchronize communication with laptops.
Your job is to: Recommend the main features for the new product to build
Explain how you would validate the specification against the customers’ needs.
Quality 7511/03/2021

- -
Designing for the Customer
Simultaneously dealing with the many dimensions of quality demanded or expected by customers is a major design challenge.
Translating customer’s needs – the “voice of the customer” – into product specification – the “voice of the engineer” – means setting the proper features for the required product.
Designing for the customer should cover the product life cycle.
Quality 7611/03/2021

- -
Designing for the Customer (2)
It involves several tools:
Quality FunctionDeployment
(QFD)
Kano’s Model
Value Analysis/
Value Engineering
ProductSpecification
Functions, dimensions, aesthetics,
components, materials, etc.
House of Quality
Voice of the Customer
Quality 7711/03/2021

- -
Kano’s Model
Actual Performance
Customer Satisfaction
SatisfiersDissatisfiers
Delighters
+-
-
+ Excitement
Good Performance
Basic level
Quality 7811/03/2021
- -
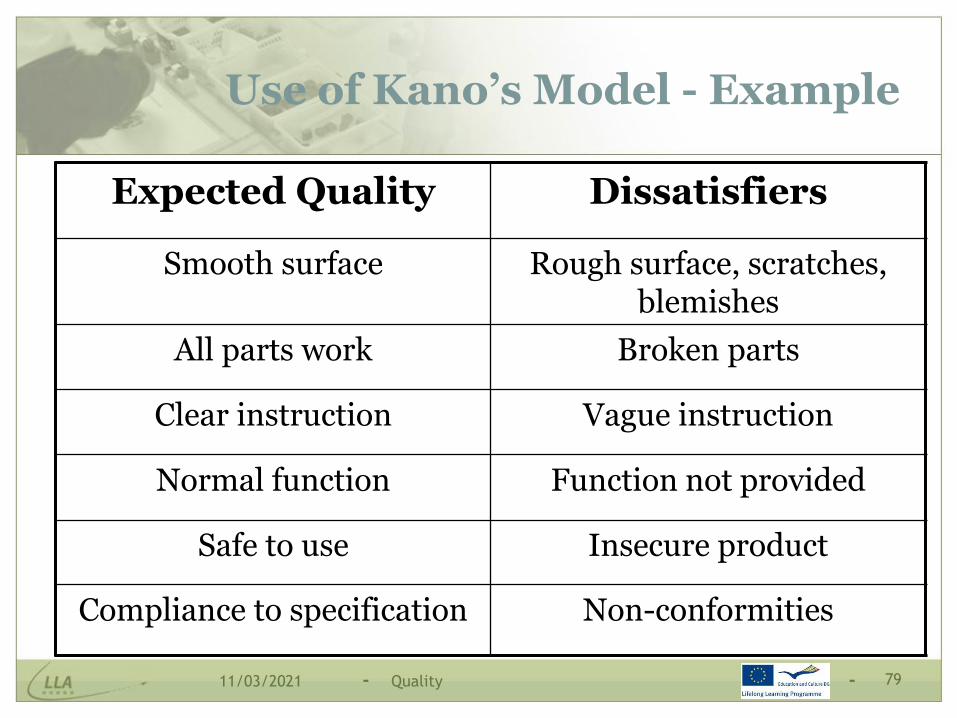
Use of Kano’s Model - Example
Expected Quality Dissatisfiers
Smooth surface Rough surface, scratches, blemishes
All parts work Broken parts
Clear instruction Vague instruction
Normal function Function not provided
Safe to use Insecure product
Compliance to specification Non-conformities
Quality 7911/03/2021
- -
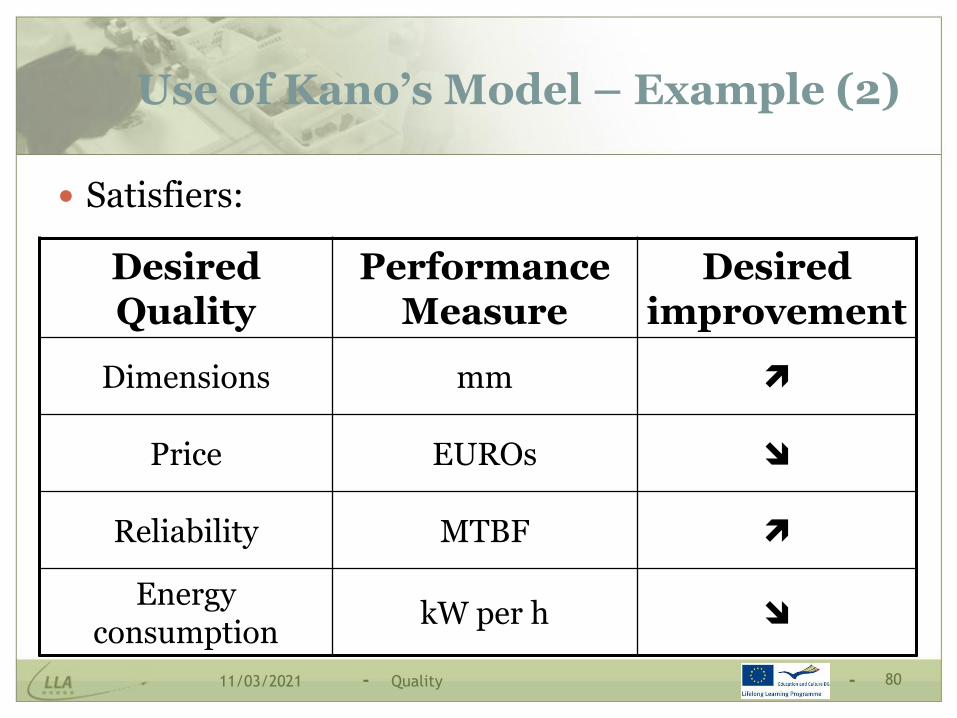
Use of Kano’s Model – Example (2)
Satisfiers:
Desired Quality
Performance Measure
Desired improvement
Dimensions mm
Price EUROs
Reliability MTBF
Energy consumption
kW per h
Quality 8011/03/2021

- -
Use of Kano’s Model – Example (3)
Delighters
Extra product features, pleasantly surprising the customers
Examples of delighters - when firstly provided:
Redial button on telephone
One-touch recording
Cup holder for drivers
Automatic car lights
Self-sharpening knife blades
Quality 8111/03/2021

- -
Quality Function Deployment (QFD)
Product quality is measured by customer satisfaction and customers are satisfied if their needs or requirements are met. QFD is a cross-functional team-based management tool for translating customer requirements into functional design. The cross-functional team should include at least marketing,
engineering, manufacturing.
QFD provides a systematic approach to identify which requirements are a priority for whom, when to implement them, and why. Customer requirements are grouped and interpreted into a visual
dynamic document, so as to identify the important requirements to be met by the product features. These in turn are translated into organisational processes and production requirements.
Quality 8211/03/2021

- -
Classical Model of QFD
Matrix What How
House of Quality Voice of CustomerTechnical Performance
Measures
Subsystem Design Matrix
Technical Performance Measures
Piece/Part Characteristics
Piece/Part Design Matrix
Piece/Part Characteristics
Process Parameters
Process Design Matrix
Process Parameters Production Operations
Quality 8311/03/2021

- -
QFD
It includes several components: Voice of the Customer
Helps to translate the ‘Voice of the Customer’ into technical design requirements
A series of four related matrix diagrams, breaking down the product design into increasing levels of detail Customer Requirements Planning Matrix – the ‘House of Quality’
A conceptual map that translates customer requirements with product characteristics and helps the company to focus effectively on the most important product features
Technical Features Deployment Matrix Translation of the technical product features into design requirements for the
product components Process Plan And Quality Control Charts
Translation of the design requirements for product components into critical processes and product parameters
Process Design Matrix Translation of critical processes and product parameters into specifications
for operations for plant personnel
Quality 8411/03/2021

- -
The Phases of QFD
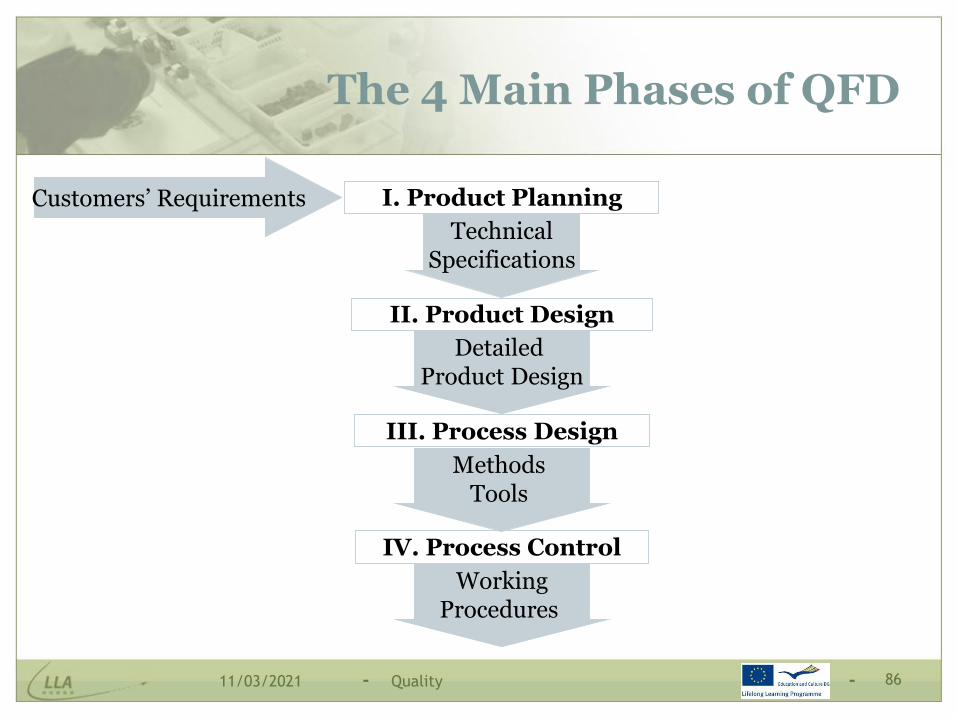
There are 4 main phases of QFD, and there are some basic rules:
Each phase requires internal iteration before proceeding to the next one.
Once a phase is completed, the method requires not to go back again.
Quality 8511/03/2021
- -
The 4 Main Phases of QFD
Customers’ Requirements I. Product Planning
II. Product Design
III. Process Design
IV. Process Control
TechnicalSpecifications
Detailed Product Design
Methods Tools
WorkingProcedures
Quality 8611/03/2021

- -
QFD - I. Product Planning
Phase I is the most relevant part for the product quality, because it is the phase where needed information is devised. Getting good data is critical for customer satisfaction. Any mistakes in
identifying and translating requirements in this phase will produce major problems in the following phases.
Key items in the product planning phase: QFD team members selection
Who are the customers?
What are their requirements?
How important is each requirement?
How will each requirement be achieved?
Relationship Matrix between what and how
Which features are the most important?
Correlation Matrix between the product features
What target values should be established for each feature?
Quality 8711/03/2021

- -
House of Quality
The “House of Quality” is main working chart of QFD. The chart documents clearly the translation of customer needs (referred
to as the “What?”), which are often vaguely formulated or even implicit ones, into technical requirements (also referred to as target requirements or the “How?”) of the product to be developed. The left wall of house of quality lists the customer requirements.
The roof of the house shows if the technical requirements interrelate with each other and the strength of any.
The relationship matrix in the middle of the chart shows the interrelationship between the customer requirements and the technical requirements.
Weighting factors can be added to the customer requirements, as well as an estimation of competing products from the point of view of the customer.
Underneath the central matrix, target values for the technical requirements are plotted along with a technical assessment of competing products (benchmark).
At the bottom the weighted values (priorities) of the technical requirements are listed.
Quality 8811/03/2021

- -
House of Quality - Detailed Layout -
7. Interrelationships
3. Technical FeaturesHOW?
5. Relationship between Customer Desired
Characteristics and Technical FeaturesRELATIONSHIP
MATRIX (WHAT vs. HOW)
6. Importance of Technical Features and
Targets(Prioritized Technical Features)
2. Importance of
Characteristics to Customer
(Prioritized Customer
Requirements)
4. Assessment
of Competition
(WHAT vs. WHY)
Voice of the
Customer
1.Customer
needs
WHAT?
CORRELATION MATRIX (HOW vs. HOW)
Needs
Features
HOW MUCH?
WHY?
Quality 8911/03/2021
- -
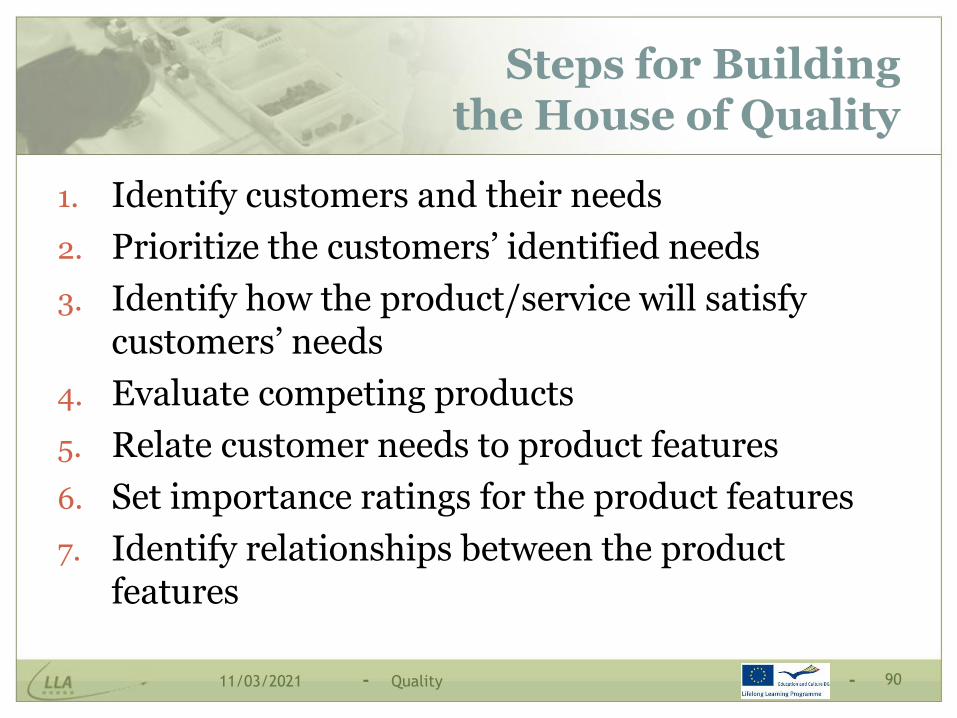
Steps for Buildingthe House of Quality
1. Identify customers and their needs
2. Prioritize the customers’ identified needs
3. Identify how the product/service will satisfy customers’ needs
4. Evaluate competing products
5. Relate customer needs to product features
6. Set importance ratings for the product features
7. Identify relationships between the product features
Quality 9011/03/2021
- -
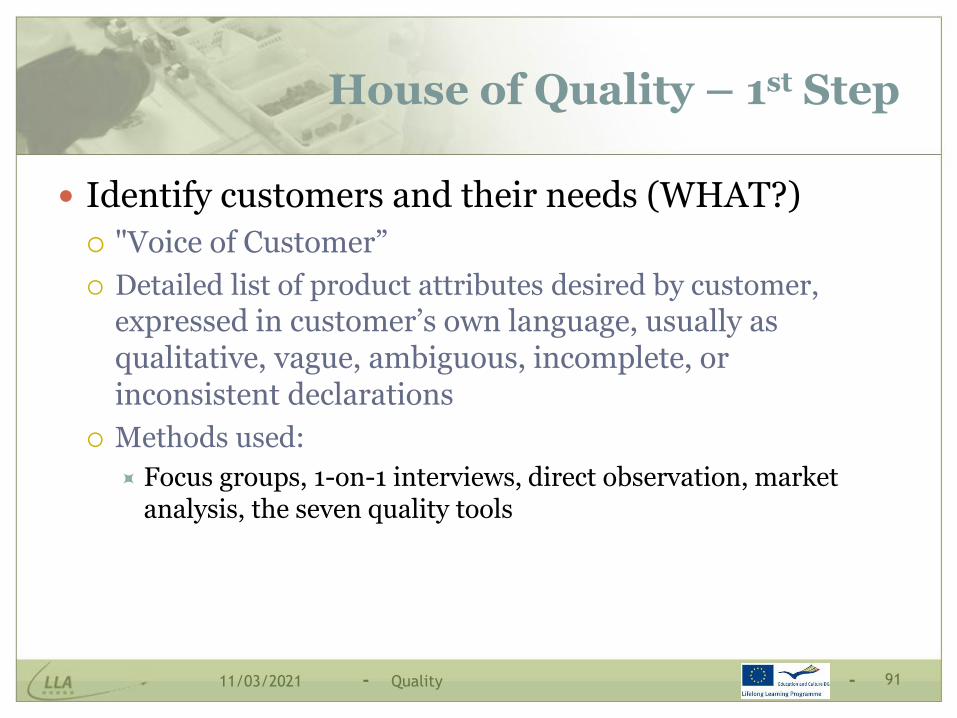
House of Quality – 1st Step
Identify customers and their needs (WHAT?)
"Voice of Customer”
Detailed list of product attributes desired by customer,
expressed in customer’s own language, usually as qualitative, vague, ambiguous, incomplete, or inconsistent declarations
Methods used:
Focus groups, 1-on-1 interviews, direct observation, market analysis, the seven quality tools
Quality 9111/03/2021

- -
House of Quality – 2nd Step
Prioritize the customers’ identified needs
Assign priorities to customer requirements, so as to focus the later analysis on the most relevant ones
Each requirement relevance is usually rated from 1 to 5, by consulting the customers, so as to illustrate their point of view
Methods used:
Surveys, market analysis
Quality 9211/03/2021

- -
House of Quality – 3rd Step
Functional Specification Step (HOW? and HOW MUCH?) Voice of the Engineers or Designers The product is defined in terms of how the product would meet the
desired attributes and the product technical characteristics are identified, to be further deployed in the final product design Each customer requirement is translated into designers’ language
For example, if the customers require an “easy to use” product, how is it to be built? Should it be a simple product? Or an “easy to use” product by teenagers? Should we provide a comprehensive set of user’s instructions?
Usually there are several potential choices for each product feature, but they have to be clearly quantifiable or measurable.
Targets are to be set for each technical feature selected. ‘How much’ of each feature is good enough to satisfy the customer? Even if the targets are not known at the time when the features are selected,
they have to be determined through analysis and clearly stated in a measurable way, so as to describe how customer requirements are met.
Methods used: Brainstorming, TRIZ, Taguchi methods, the seven quality tools
Quality 9311/03/2021

- -
House of Quality – 4th Step
Evaluate competing products A competitive assessment analysis is performed to compare
the new required product with the key competitors’ products, to identify the extra features needed - providing a competitive edge
The main question raised is: “Why the product is needed?”
The customer should be involved to evaluate relevant existing products, by comparing each requirement and giving ranks from 1 to 5. The results help to position the product on the market.
Methods used:
Benchmarking, the seven quality tools
Quality 9411/03/2021

- -
House of Quality – 5th Step
Relate customer needs to product features
Correlate customer attributes with the technical product features (WHAT vs. HOW) and the strength of each relation
A weight of 1-3-9 or 1-3-5 is often used
More “strong” relationships are ideal
Methods used:
A relationship matrix chart, used to demonstrate the intensity of the relation for each pair of customer requirement – technical feature
Use marks or symbols to show weak, medium, and strong relationships
Quality 9511/03/2021

- -
House of Quality – 6th Step
Set importance ratings for the product features
Establish priorities of the product technical features
Methods used:
Priorities are set based on several criteria:
Overall importance ratings
Degree of technical difficulty
Technical competitive relevance
Quality 9611/03/2021

- -
House of Quality – 7th Step
Identify relationships between the product features
Show the correlations (positive or negative) between design features, in the roof of the house
The relative and absolute weights for technical features are required to choose the best fit engineering decisions for including the customers’ requirements into the product design. Features with a strong positive may be combined, to reduce product
development effort
For features with negative correlation, it is required to find solutions (usually by changing targets or rankings), otherwise customer requirements will not be fully satisfied.
Methods used:
The intensity of the influence each feature has on the others is presented through the use of symbols in a correlation matrix.
Quality 9711/03/2021

- -
House of
Quality-
ExampleProduct: Umbrella
Customer Needs
Easy to open/close
Stays open in the wind
Easy to transport it
Doesn’t leak in rain
Nice colours
Importance weighting
Engineering Characteristics
Fo
rc
e t
o
op
en
/clo
se
Co
lou
r
Re
sis
tan
ce
Dim
en
sio
ns
/
wig
ht
Wa
ter
r
es
ista
nc
e
9 9 3 3 9 3
5
5
3
5
2
X
X
X
Competitive evaluationX = our companyA = Comp. AB = Comp. B(5 is best)
1 2 3 4 5
X AB
X AB
XAB
A X B
X A B
Relationships:
Strong = 9
Medium = 3
Small = 1Target values
Red
uce
fo
rce
wit
h 2
0%
Min
. f
or
50
0
usi
ng
cy
cles
20
0 g
., 6
0
cm r
ad
ius,
8
0 c
m l
eng
th
Ma
inta
incu
rren
t le
vel
Technical evaluation(5 is best)
54321
B
A
X
BA
X B
A
X
B
X
A
BXABAX
Re
lia
bil
ity
Ha
nd
lin
g
for
ce
Imp
rov
e w
ith
20
%
Ma
inta
incu
rren
t le
vel
X
*
Correlation:
Strong positive
Positive
Negative
Strong negative
X
*
Quality 9811/03/2021

- -
QFD Phase I - Output
Product Technical Specifications, to be used as input in Phase II of QFD
Usually a review conducted by the technical team is made after completing the House of Quality, to ensure the feasibility and realization of each technical feature, and to point out any:
Technical advantages or disadvantages over competitor products
Conflicts between customer evaluations and technical team evaluations
Final overall importance ratings are calculated, function of relationship ratings and customer prioritization ratings.
Final ratings are used to determine the set of technical specifications / requirements needed for the next phase – product design.
Quality 9911/03/2021

- -
QFD - II. Product Design
It is the phase in which the product is designed:
How the product will be made, based on the technical specification
Materials, component parts, detailed drawings
Quality 10011/03/2021

- -
QFD - III. Process Planning
It is the phase in which the key processes needed to actually make the product are established:
How each part of the product and the product itself will be obtained, based on the product design
Processes, process characteristics, equipment and tools needed
Quality 10111/03/2021

- -
QFD - IV. Process Control
It is the phase in which it is established how to transfer into production the results of the design phase:
How each key process should be operated and controlled to ensure the designed results, based on customer’ input
Work standards and instructions
Quality 10211/03/2021

- -
Key Benefits of QFD
Focus on customer needs, leading to increased customer satisfaction Improved formulation of requirements lists through a better
understanding of customer requirements Identification of critical product functions (customer-oriented
function structures) Definition of critical technical requirements and identification of
critical components
Reduction of the total product design costs, by avoiding trial and error cycles during the product life cycle Design costs reduced by 30% to 60% Engineering changes cut by 30% to 50% Design time reduced by 30 to 50% Start-up costs reduced by 20% to 60% Warranty claims cut by 20% to 50%
Quality 10311/03/2021

- -
Disadvantages of QFD
QFD is very resource consuming – it requires a lot of time, energy, and patience to achieve the benefits.
QFD requires full management support Cross-functional QFD team
Resources available to perform the QFD phases
QFD does not reduce product development costs. Moreover, initial costs will be higher compared with traditional designing techniques, even if on long term, savings are to appear during the product life cycle.
The extensive effort needed to complete every stage of QFD is only justified only for major long-term product development projects or for very complex and expensive products.
Quality 10411/03/2021

- -
VALUE METHODOLOGY
“The systematic application of recognized techniques which identify the functions of the product or service, establish the worth of those functions, and provide the necessary functions to meet the required performance at the lowest overall cost.” (John M. Bryant, VM Standard, Society of
American Value Engineers, Oct. 1998)
Value means:Function
Cost
Quality 10511/03/2021

- -
Value Engineering (VE)
VE is an intensive, interdisciplinary problem solving activity focusing on improving the value of the functions required for a product / process / service / organisation.
Benefits: Reduced complexity of products
Additional standardization of products
Improved functional aspects of product
Improved job design and job safety
Improved maintainability of the product
Robust design
Quality 10611/03/2021

- -
The Six Steps of VE
1) Information Phase
2) Creativity Phase
3) Evaluation Phase
4) PlanningPhase
5) Reporting Phase
6) Implementation Phase
Problem(s) to be solved, information gathering on the functions and requirements of the product / process / system
Brainstorm ideas on how to reduce the high costs, broken or inadequately performed key functions
Screen ideas for acceptance, rate and rank ideas, group ideas into categories, develop design scenarios, set selection criteria
Plan how to sell ideas to management, identify key recommendations, plan management presentation
Give oral or written presentation to management
Get management approval for starting the implementation, make management plan, perform assignments, follow-up.
Quality 10711/03/2021

- -
Value Analysis (VA)
VA aims at achieving equivalent or better performance of a product, at a lower cost, while maintaining all functional requirements defined by the customer.
Does the product have any design features that are not necessary?
Can two or more parts be combined into one?
How can the weight or material consumption be reduced?
Are there nonstandard parts that can be eliminated?
It is more used for design improvement during production phase:
Lists products in descending order of their individual sales income
Lists the total annual sales income for the analysed product
Helps management evaluate alternative strategies.
Quality 10811/03/2021

D. Product/Service Design
- -
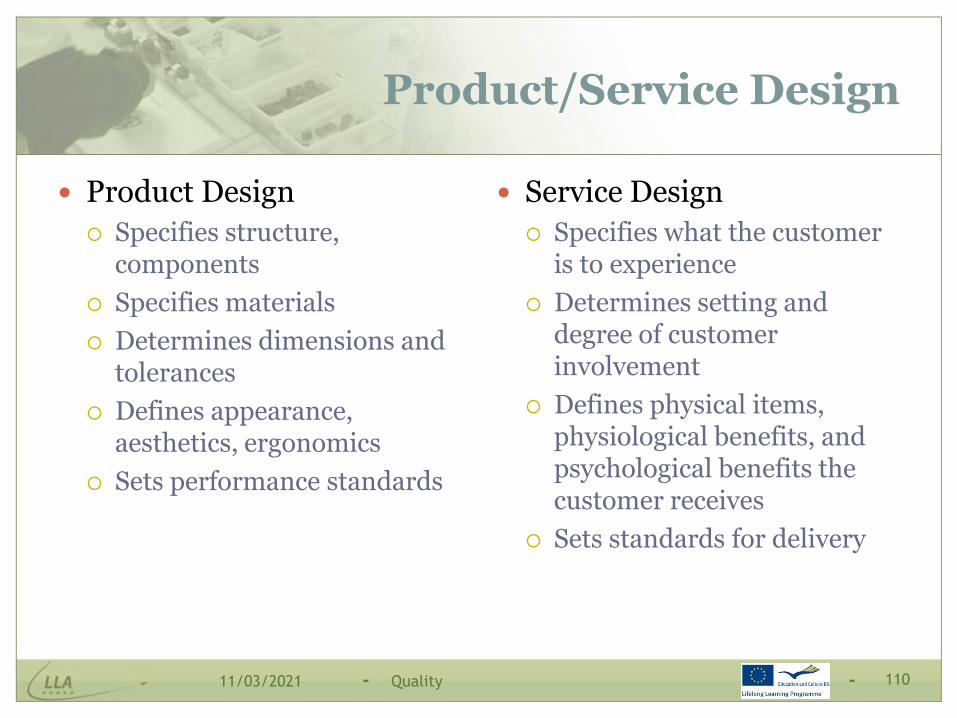
Product/Service Design
Product Design
Specifies structure, components
Specifies materials
Determines dimensions and tolerances
Defines appearance, aesthetics, ergonomics
Sets performance standards
Service Design
Specifies what the customer is to experience
Determines setting and degree of customer involvement
Defines physical items, physiological benefits, and psychological benefits the customer receives
Sets standards for delivery
Quality 11011/03/2021

- -
Product Design Phase Output
Design Documents
Engineering drawings
Showing dimensions, tolerances, and materials
Bill of Material
Product detailed structure
List of components, quantities and where used
Quality 11111/03/2021

- -
Design Methodologies
There are many approaches and several tools possible to be used: Design for the customer
The last three phases of QFD, as previously discussed
Design for quality Functional design
Design for reliability • Fault tree analysis
• FMEA
Design for maintainability
Robust design
Configuration management
Reverse engineering
Design for manufacturability
Modular design
Value analysis, as discussed previously
Environmentally friendly design (Green design)
Quality 11211/03/2021

- -
Design For Quality
Achieving product quality is equivalent to building-in quality starting with the design process and to maintaining it throughout the production process and the product life cycle.
Up to 80% of all faults can be traced back to insufficient product planning, design and development.
Up to 60% of all breakdowns that occur within the warranty period are caused by incorrect or incomplete product development.
Quality 11311/03/2021

Functional Design
Design for Reliability
Design for Maintainability
- -
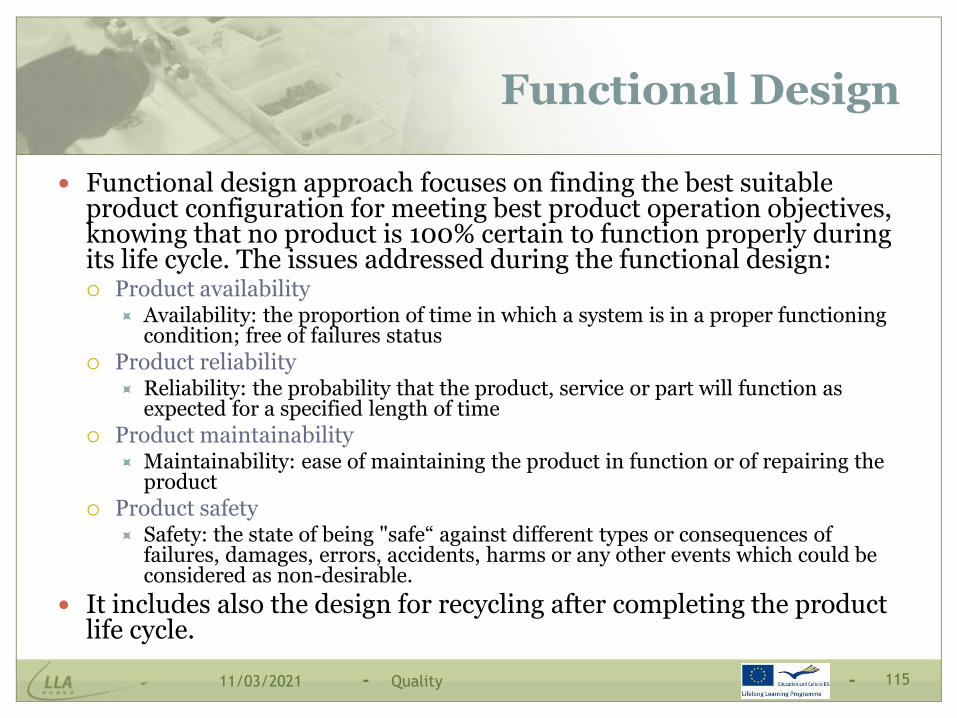
Functional Design
Functional design approach focuses on finding the best suitable product configuration for meeting best product operation objectives, knowing that no product is 100% certain to function properly during its life cycle. The issues addressed during the functional design: Product availability
Availability: the proportion of time in which a system is in a proper functioning condition; free of failures status
Product reliability Reliability: the probability that the product, service or part will function as
expected for a specified length of time
Product maintainability Maintainability: ease of maintaining the product in function or of repairing the
product
Product safety Safety: the state of being "safe“ against different types or consequences of
failures, damages, errors, accidents, harms or any other events which could be considered as non-desirable.
It includes also the design for recycling after completing the product life cycle.
Quality 11511/03/2021

- -
Design for Reliability
Reliability means fault free design Failure reduction through design measures such as:
Compensating the action of the disturbing factors (principle of balanced forces) Selecting working principles and structures in which the properties are largely
independent of the disturbing factors Choosing interfacing elements that do not require close tolerances.
There are two main tools used to analyzing potential failures: Fault tree analysis(FTA)
A visual chart showing the interrelationship between failures, assisting designers in the refining of the product design
Failure Mode and Effects Analysis (FMEA) A systematic approach for analyzing the causes of failures, prioritizing the
effects of failures and attempting to find solutions to eliminate causes of all critical and major potential failures
Apart from evaluating possible malfunctions caused by failures and disturbing factors, FMEA encourages early cooperation between the various departments involved in product development. It also functions as a means of handing over to production and supporting the overall quality management process.
Quality 11611/03/2021

- -
Fault-Tree Analysis (FTA)
FTA systematically explores the influence of faults, disturbing factors and possible failures on the proper functioning of a system. FTA is based on causality, i.e. every undesired event is considered to have
at least one cause, and that event only occurs when its cause is manifesting.
The established function structures can thus be used to identify all the functions to be checked. Considering these functions failing one by one, designers seek out the possible causes of these potential failures. An identified cause may be associated with further causes with which it has an
OR or an AND relationship. These causes and their effects can then be examined.
Grouping the remedial measures according to the departments involved simplifies their execution.
On the basis of the information gained from a fault-tree analysis, designers are able to improve and complete the product design before they proceed to the process design phase, and, if necessary, re-examine the solution concept or modify production, assembly, transport, operation and maintenance procedures, in later phases of the product life cycle.
Quality 11711/03/2021

- -
Fault Tree Analysis - Example
Pancake Breaking during
Frying
Too Sticky(OR)
Too Thin(OR)
Morelubricant
Non-stickyfrying pan
Adjust fryingprocedure
(AND)
Amountof heat
Lengthof time
Increasethickness
Reducesize
Type ofPancake
Turning Tool
Quality 11811/03/2021
- -
Failure Modes and Effects Analysis (FMEA)
FMEA is a structured approach used to analyse possible failures - to identify, estimate, prioritize, and evaluate risk of possible failures at each stage in the product life cycle, in a more extensive way than can be done with Fault-Tree Analysis. It involves a direct analysis of failures and their consequences and
causes. FMEA may be used for:
Products, during the product design phase, to verify whether the functions set out in the requirements list are possible to be fulfilled.
Processes or production, to verify whether the planned production process can produce the required product characteristics and to eliminate risks of failures.
It requires a cross-functional team, including members from design, development, production planning, quality control, purchasing, sales and customer service.
Quality 11911/03/2021

- -
Use of Product FMEA
FMEA implies creating a matrix listing possible failures, their consequences, causes, risk numbers (RN), proposed remedial solutions.
The steps of FMEA:
Risk analysis of each component (or process step)
Risk assessment:
Risk number calculation
RN > 125 is usually considered critical
Risk minimisation
Quality 12011/03/2021

- -
FMEA Steps
1. Risk analysis of each component (or process step) regarding: Potential failures and failure types Failure consequences Failure causes Planned measures to detect failures Planned measures to avoid failures
2. Risk assessment: Estimation of the probability of
occurrence Estimation of the effects of the failure on
the customer Estimation of the probability that the
failure can be detected before delivery A high probability of detection implies a
smaller risk for the customer, therefore a smaller numerical value.
3. Risk number calculation (RN), based on: The probability of
occurrence (O) The severity of failure
(S) The difficulty of
detection (D)
RN = O x S x D3. Risk minimisation
Development of measures to improve the design of the product (or its production process).
Quality 12111/03/2021
- -
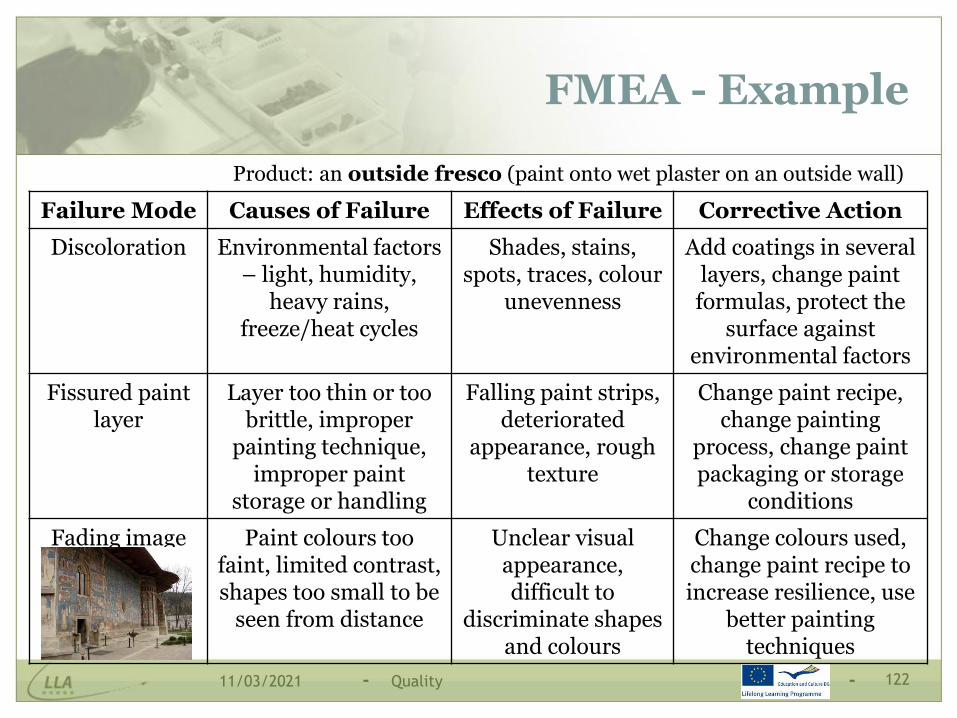
FMEA - Example
Product: an outside fresco (paint onto wet plaster on an outside wall)
Failure Mode Causes of Failure Effects of Failure Corrective Action
Discoloration Environmental factors – light, humidity,
heavy rains, freeze/heat cycles
Shades, stains, spots, traces, colour
unevenness
Add coatings in several layers, change paint formulas, protect the
surface against environmental factors
Fissured paint layer
Layer too thin or too brittle, improper
painting technique, improper paint
storage or handling
Falling paint strips, deteriorated
appearance, rough texture
Change paint recipe, change painting
process, change paint packaging or storage
conditions
Fading image Paint colours too faint, limited contrast, shapes too small to be
seen from distance
Unclear visual appearance, difficult to
discriminate shapes and colours
Change colours used, change paint recipe to increase resilience, use
better painting techniques
Quality 12211/03/2021

- -
Design for Maintainability
A concept that states that products should be designed in a way that makes them easy for consumers to maintain them in use and to readily repair them, if needed. Concepts
Components easily replaceable
Components easily removable with standard tools
Adequate access to perform maintenance activities
Non-destructive disassembly
Safe maintenance
Available manuals and documentation for users
Ease of delivery of maintenance
Quality 12311/03/2021
- -
Robust Design
The product should be designed so as small variations in production or assembly or operation do not adversely affect the product.
A product or service demonstrates robustness if it performs with same results, regardless of the operating conditions.
Designers must consider both controllable factors (design features) and uncontrollable factors (operating conditions) when designing for product robustness.
Quality 12411/03/2021

- -
Configuration Management
In the product design phase it is better to define also recommendations for configuration management:
A system by which a product’s planned and still under changing components are accurately identified and for which controls and accountability of change are maintained.
Configuration management provisions are needed for complex products or services, more than ever when the customers requirements evolve very rapidly.
Quality 12511/03/2021

- -
Reverse Engineering
A design approach used to dismantling and inspecting of a competitor’s product, as to discover useful product improvements.
Quality 12611/03/2021

- -
Design for Manufacturability
Manufacturability
It means the ease of fabrication and/or assembly, which has relevant consequences during the product life cycle, on:
Costs
Productivity
Quality
Quality 12711/03/2021

- -
Design for Manufacturing and Assembly
A design approach focusing on the simplification of the product, by reducing the number of separate parts, an easy and economical production:
During the operation of the product, does the part move relative to all other parts already assembled?
Must the part be of a different material or be isolated from other parts already assembled?
Must the part be separated from all other parts to allow the disassembly of the product for adjustment or maintenance?
Some of useful solutions of designing for manufacturability:
Use recommended parts and strategic suppliers
Products are designed to be consistent with internal and external process capabilities
Modular designs/ease of configurability
Concurrent Product and Process Design
Quality 12811/03/2021

- -
Modular Design
A design approach used to create products made by easily segmented components.
It adds flexibility to both production and product development
Quality 12911/03/2021

- -
Environmentally Friendly Design(Green Design)
There are several design approaches, considering some of the following aims: Design for Reuse
Designing products so that some of their parts to be used in later generations of other products.
Design for Disassembly A method for developing products so that they can easily be taken
apart.
“Green” Design Make products recyclable
Use recycled materials
Use less harmful ingredients
Use lighter components
Consume less resources: energy, materials, water, etc.
Quality 13011/03/2021

E. Process Design
- -
Process Design
There are several steps to be performed:
Make-or-buy decisions for each part of the product
Decide whether or not is better to produce or purchase each part of the product to be built
Selecting the ‘right’ processes
Create workable instructions for production processes
Select tooling and equipment
Prepare job descriptions
Determine operation and assembly order
Planning to network all systems needed for actually making the product
Quality 13211/03/2021

- -
Selecting the Processes
Finding the ‘right’ production processes
An effective production process must be
Executable
Structured
Applicable
Providing follow up mechanisms
Focus upon measurable outcomes
Apply to every level of product
Some actions are needed for smoothing the transfer from R&D towards Production
Concurrent design
Fail-Safe Design
Analyzing functional design (design for reliability and for maintainability)
Measuring design quality
Utilizing QFD
Designing for robustness
Quality 13311/03/2021

- -
Concurrent Design
Also known as simultaneous or concurrent engineering
Cross-functional design teams
Customers, design, production, marketing, engineering, suppliers
Simultaneous development of project design functions, with open and interactive communication among all team members for joint decision making
Aims to completing as many tasks in parallel as possible, even if some individual tasks are completed with lower efficiency
It integrates product design and process planning
Details of design more decentralized
Encourages price-minus, not cost-plus pricing
Needs careful scheduling because tasks are done in parallel
Quality 13411/03/2021

- -
Needs Assessment
Concept Development
Feasibility Assessment
Tradeoffs
Engineering Analysis
Preliminary Design Synthesis
Engineering Models
Detailed Design
Production Planning
Pilot Production
Reduced Time to Market
Source: Clausing, D., Total Quality Development,: A Step-By-Step Guide to World Class Concurrent Engineering, ASME Press, NY 1994, pp. 35
Concurrent Engineering Development Model
Quality 13511/03/2021

- -
Fail-Safe Design
Shingo observed that SQC methods do not prevent defects, which arise when people make errors. So he recommended to include in the process design phase the concern to prevent possible defects by providing workers with rapid feedback on errors or abnormalities emerged during production processes.
Shingo developed the Poka-Yoke methodology, also known as Mistake–proofing, which includes:
Checklists
Special tooling that either prevents workers from making errors, or provides rapid feedback on abnormalities, in time so as the worker could correct them
Quality 13611/03/2021
- -
Process Design Phase Output
Process Design Documents
Assembly drawings
Assembly charts
Route sheets
Work orders
Quality 13711/03/2021
F. Design Review and Product Design Improvement

- -
Before transferring the product design towards the production area, a final design review is required, as to validate the chosen solutions and to make improvements, if needed.
Methods used:
Quality engineering
Quality Loss Function
Robust Design
Quality 13911/03/2021
- -
Quality Engineering
Quality engineering is an approach originated by Genichi Taguchi
It combines engineering and statistical methods to reduce costs and improve quality by optimizing product design and manufacturing processes.
Quality 14011/03/2021

- -
Quality Loss Function
Quality Loss Function starts from the basic idea that quality is measured through customer satisfaction and states that a service or a product that barely conforms to the specifications is more likely to be a defective service or product, than a perfect one.
Quality Loss Function is optimum (zero) when the product’s quality measure is equal to the target measure.
All variation (+/-) from optimal measure results in a loss.
The method defines the Quality Loss as ‘Loss to Society’ and it quantifies it through the “Quality Loss Function”.
Quality 14111/03/2021

- -
Quality Loss Function (2)
The Loss Function Quantifies the decline of a customer's perceived value of a product
as its quality declines Tells how much revenue is lost because of variability of the
production process It is a powerful tool for projecting the benefits of a quality
improvement program
Taguchi’s View of Variation Traditional view is that quality within the lower tolerance limit
(LTL) and the upper tolerance limit (UTL) is good and that the cost of quality outside this range is constant.
Taguchi’s view is that costs increase as variability increases, so minimizing quality costs means achieve zero defects level. Any deviation from target involves a loss, no matter how small it might
be!
Quality 14211/03/2021

- -
Quality Loss Function (3)In
crem
enta
lC
ost
of
Va
ria
bil
ity
High
Zero
LTL TargetSpecification
UTL
Traditional View
High
Zero
Taguchi’s View
Incr
emen
tal
Co
st o
f V
ari
ab
ilit
yLTL Target
SpecificationUTL
Quality Loss
Loss = K(x-T)2
Quality 14311/03/2021

- -
The Loss Function – Example 1
The specifications for a product have LTL= 8 and UTL=14, with a target of 11. If 10% of the products are produced at exactly 8, 50% on target and 40% at exactly 12, what is the loss function value?
Solution:
L=0.1 x K x (8-11)2 + 0.5 x K x (11-11)2 + 0.4 x K x (12-11)2
L = 0.9K + 0.4K = 1.3K
(where K is an arbitrary constant)
Quality 14411/03/2021

- -
The Loss Function – Example 2
A company issued an average of 10 wrong invoices per month last year. In March they had 15 wrong invoices (x). Management sets an acceptable level at 2 per month (tolerance).
It is known that the costs to correct one invoice is 50 Euro. They determined the cost in delayed payable accounts to be 100 Euro.
Total cost per wrong invoice: 150 Euro.
What is the loss function value?
k = 150 Euro / 22 =37.50 Euro
L(x) = 37.50 (15-10)2
= 37.50 (5)2
= 37.50 (25)
= 937.50
The loss for the month of March is of 937.50 Euro.
Quality 14511/03/2021

2.2. Design for Lean
Lean Product Design
Design for Lean

- -
Product Design Traditional vs. Lean Approach
Designing activities are performed as soon as possible.
Decisions are made sequentially by specialists who then pass them over downward on the flow Product design is completed, then
process design begins.
Not all product life cycle stages are considered in design.
Designers build up large knowledge inventories to protect their own interests.
Stakeholder interests are not aligned.
Learning occurs sporadically.
Activities are planned to be performed at the last responsible moment.
Downstream players are involved in upstream decisions, and vice-versa. Product and process are designed
together. Systematic efforts are made to
optimize supply chains.
All product life cycle stages are considered in design.
Buffers are sized and located to perform their function of absorbing system variability.
Stakeholder interests are aligned. Learning is incorporated into the
design process.
Quality 14711/03/2021

- -
Lean Design
Lean design involves both Simple, standardized, efficient, robust product development and
design processes, with maximum value added and minimum waste, including: Integrating events instead of quality checks Late concept selection with more knowledge Managing organizational capacity versus demand Project teams “own the business” Team leadership, team design, supplier integration Simple technology to fit team needs and processes
Tools used:• Knowledge management, Target Costing, Value Engineering, Six Sigma,
Brainstorming, TRIZ
AND Design for Lean Manufacturing
Planning for Lean production process
Quality 14811/03/2021

- -
Source: Superfactory™
Key Principles of Lean Design
Well-integrated basic elements of product development
Highly skilled and well organized cross-functional design teams
Processes that minimize waste and maximize the capability of people using them
Technologies that enhance the performance of people and processes
Customer first philosophy
Understand customer defined values
Strive to give defined values to customer
Quality 14911/03/2021

- -
Key Principles of Lean Design (2)
Knowledge based organization
Learning and continuous improvement as part of job
Standardization
Skills
Design standards
Processes/milestones/deliverables
Reuse
Knowledge/experience
Design/design alternatives
Parts/configuration
Source: Superfactory™
Quality 15011/03/2021

- -
The Six Step of Lean Design
1) Cross-Functional Teams
2) Set Based Strategy
3) Structure Lean Design
4) Minimize Negative Iteration
5) Process Control Planning
6) Technologies Fit for Lean Design
Involve downstream players in upstream decisions , create and exploit opportunities to increase value in every design phase
Select from alternatives at the last responsible moment, share incomplete information, share ranges of acceptable solutions
Simultaneous design of product and process, decisions for making or purchasing the components, detailed engineering, and design
Pull scheduling, Design Structure Matrix, strategies for iterative loops
Set quality controls for the processes, measure deviations from target, identify risks and act for improvement
Technologies enabling simple, standardized, efficient, robust processes
1) Cross-Functional Teams
Involve downstream players in upstream decisions , create and exploit opportunities to increase value in every design phase
Quality 15111/03/2021

- -
Lean Concepts in Design
Value
Value added activities
Waste
Pull and flow
Workcell
Team empowerment and ownership
Quality 15211/03/2021
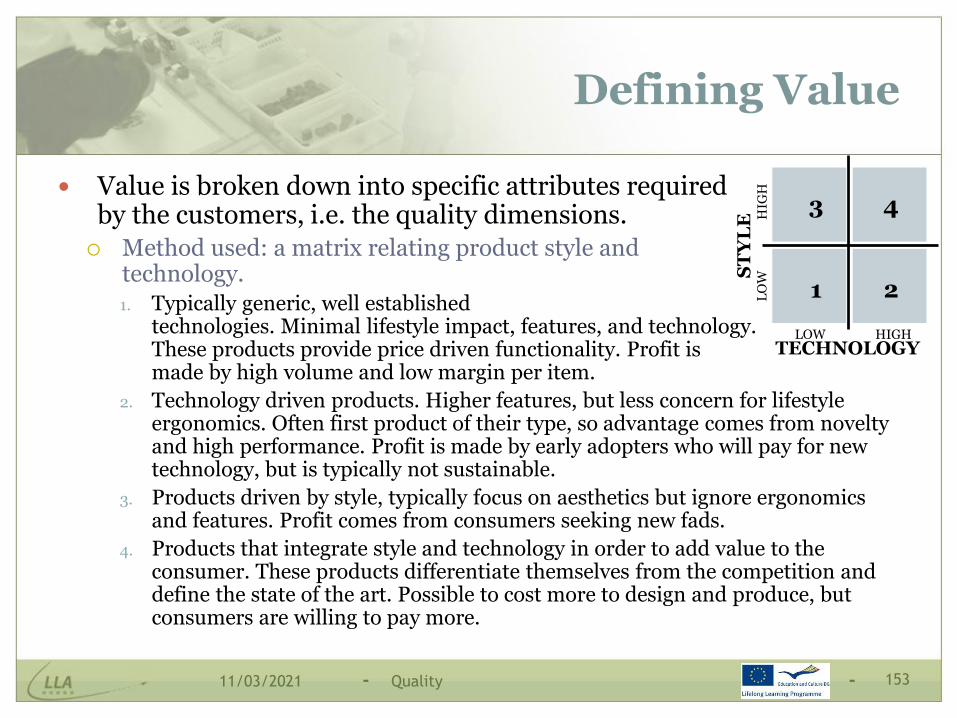
- -
Defining Value
Value is broken down into specific attributes requiredby the customers, i.e. the quality dimensions. Method used: a matrix relating product style and
technology.1. Typically generic, well established
technologies. Minimal lifestyle impact, features, and technology.These products provide price driven functionality. Profit is made by high volume and low margin per item.
2. Technology driven products. Higher features, but less concern for lifestyle ergonomics. Often first product of their type, so advantage comes from novelty and high performance. Profit is made by early adopters who will pay for new technology, but is typically not sustainable.
3. Products driven by style, typically focus on aesthetics but ignore ergonomics and features. Profit comes from consumers seeking new fads.
4. Products that integrate style and technology in order to add value to the consumer. These products differentiate themselves from the competition and define the state of the art. Possible to cost more to design and produce, but consumers are willing to pay more.
ST
YL
E
TECHNOLOGYHIGHLOW
LO
WH
IGH
1 2
3 4
Quality 15311/03/2021

- -
Value Added Activity
Finding waste in product design process is difficult, because the main flow is of immaterial ‘products’: Sometimes there are physical outputs: drawings, reports, lists, sheets, but
the aim of the design process is not to produce a bunch of written documents, but to document the relevant knowledge needed to produce the product able to satisfy the customers’ needs. Knowledge about customers, about technologies and process capabilities,
integrated into specific knowledge about how to make the designed product The relevant knowledge often resides only in the minds of the design team
members and finding waste is rather a ‘creative’ task and requires open minded designers.
Knowledge is the medium through which value is added during design Value added activities include relevant knowledge into the design. Waste (even if necessary) does not add value to the design.
Waste usually concerns knowledge acquisition and management activities. All activities referring at compliance will invariably not add value to the design
Quality 15411/03/2021

- -
The 7 Wastes in Product Design- Examples
Defects: misidentified customer needs, bad or obsolete data, drawing or code errors, misfit features to customer needs
Overproduction: future proofing design, feature inflation, poor synchronization, working with incomplete requirements, not using standard parts
Waiting: waiting for data, people, machines, specifications; more workload than capacity, excessive multi-tasking, delays due to reviews/approvals/testing/deployment/staffing over workloaded
Excessive processing: lack of design for reuse, unnecessary features, unnecessary items specified, too many approvals required, too much “paperwork”
Transport: dispersed design teams, excessive data transfer, excessive approvals and controls, repeated task switching on multiple projects
Inventory: unnecessary data storage, work-in-process exceeding capacity Motion: dispersed design data (data hunting), excessive engineering
changes, requirements changes moving info from one person/group to another
Quality 15511/03/2021

- -
Other Types of Wastes in Product Design
Common Waste in Product Design Process: Reinvention
Lean product design teams appreciate the value of knowledge, and ensure that knowledge is easy to capture, easy to reuse and always used to make decisions. Traditional product design teams prefer to ‘reinvent’ knowledge when access to already existing one is not obvious.
Excess Requirements Lean product development teams recognize that every extra feature or performance
enhancement must be designed, produced, maintained and supported – and customers pay the price in greater complexity and greater risk of failure.
Overloaded Resources Lean product development teams know that overloading resources makes them
slower and less flexible, and that task-switching costs engineers valuable time. Traditional product design teams work as hard as possible, sometimes only from pure passion.
Un-integrated Design Lean product development teams strive to understand and then manage their designs
as an integrated system, so that they can focus innovation on areas that improve the market performance of their entire portfolio of products. Traditional product design teams raise walls between functional departments and sometimes prefer to be in competition with people from Marketing or Production. Source: Superfactory™
Quality 15611/03/2021

- -
Pull and Flow in Lean Design
Lean design includes process definition and production value streams
Pull systems:
Activities performed according responsibility based planning
Everyone starts when they must to meet the gates, seeks information as needed
Knowledge, customer-driven milestones
Set-based design
Push systems:
Activities performed according task-based planning
Built around tasks: begin and end at certain planned points
Quality 15711/03/2021

- -
Set Based Design
It is the concurrent approach used by Toyota for the product development process. It includes: Identify and sequence key design decisions For each decision, generate multiple design alternatives and the
criteria for evaluating them Determine the last responsible moment for decision making Evaluate and choose from alternatives Document each key design decision: alternatives, criteria,
evaluation and selection Produce 5 or more times the number of physical prototypes than
their competitors Reject changes that expand, rather than contract, the space of
possible designs. Put new products on the market faster than their competitors and
at less cost.
Quality 15811/03/2021
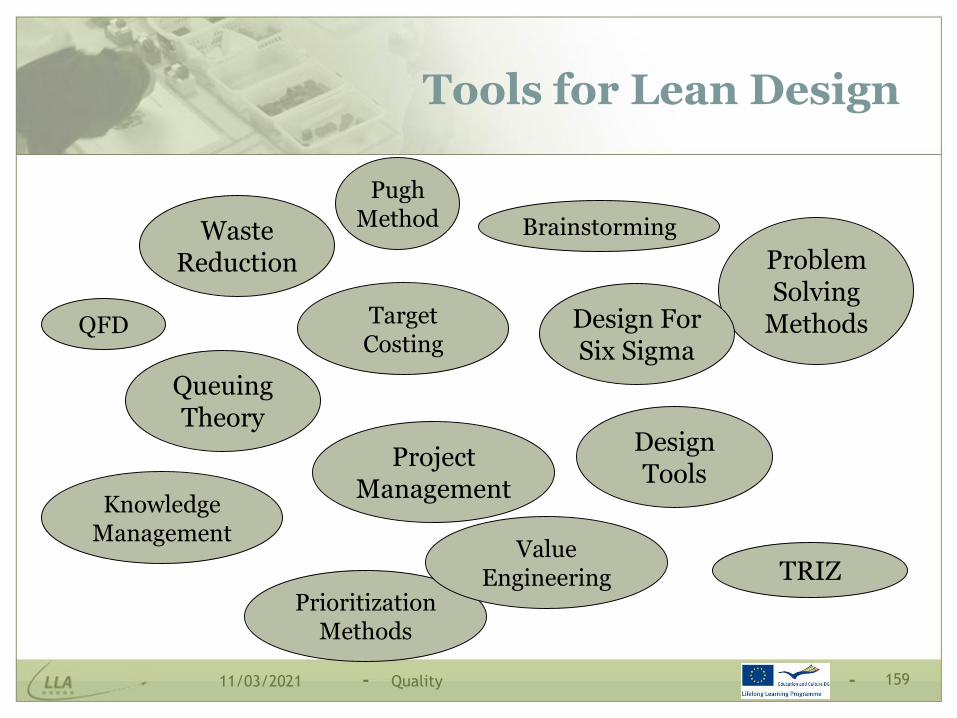
- -
Tools for Lean Design
ProblemSolving
MethodsDesign ForSix Sigma
DesignTools
WasteReduction
ProjectManagement
QueuingTheory
TRIZPrioritization
Methods
Value Engineering
Target Costing
Brainstorming
KnowledgeManagement
QFD
Pugh Method
Quality 15911/03/2021

- -
Target Costing
Henry Ford used Target Costing around 1920’s:
“We have never considered any costs as fixed. Therefore we first reduce the price to a point where we believe more sales will result. Then we go ahead and try to make the price. We do not bother about the costs. The new price forces the cost down.” (Henry Ford, My Life and Work, 1922)
Quality 16011/03/2021

- -
Designing to the Target Cost
Steps to be performed: Allocate the target cost to systems, subsystems, components, … Form teams by ‘systems’ – each team has a cost target to meet with the design Establish a personal relationship between designers and cost experts in each system
team. Ask cost experts to provide cost guidelines to designers before design begins. Require designers to consult cost experts on the cost implications of design alternatives
before they are developed. Incorporate value engineering/value management tools and techniques into the design
process. Periodically bring all teams together, to make sure they are not sacrificing project-level
value to local ‘system’ optimization. It is also used to include suppliers in these discussions – suppliers are expected to meet cost
goals, but are also expected to make a profit.
When meeting or beating the target cost, release funds for adding back lower ranking values or other scope additions valuable to the client.
Schedule cost reviews, but develop design and cost concurrently Constant monitoring of product cost by Purchasing and Manufacturing
Use computer models to automate costing to the extent feasible.
Quality 16111/03/2021

- -
Lean Indicators
Time-to-market
% NVA Activities
Product Unit Errors
% of Waiting Time in Progress
Productivity
Quality
Quality 16211/03/2021

- -
As it was designed.As the customer received it.
As Marketing understood it.As the customer has required.
Performance in Product Design
Quality 16311/03/2021

- -
Quote
When luck is on your side, you can do everything without your
brains. (Giordano Bruno)
Quality 16411/03/2021
3. Quality Control
3.1. Quality at the Source
3.2. Quality Process Mapping
3.3. Quality Analysis Matrix

- -
What is Quality Control (QC)?
Control – the activity of ensuring conformance to requirements and taking corrective action when necessary to correct problems
Quality Control: A process to ensure a certain level of quality of the product or
service completed during the production process. It helps ensuring quality at the source It involves a QC team to check the product / service / process /
people. Usually it is not the responsibility of QC team to correct problems
observed.
OperatingProduction Value Streams
OutputsInputs
Quality 16611/03/2021
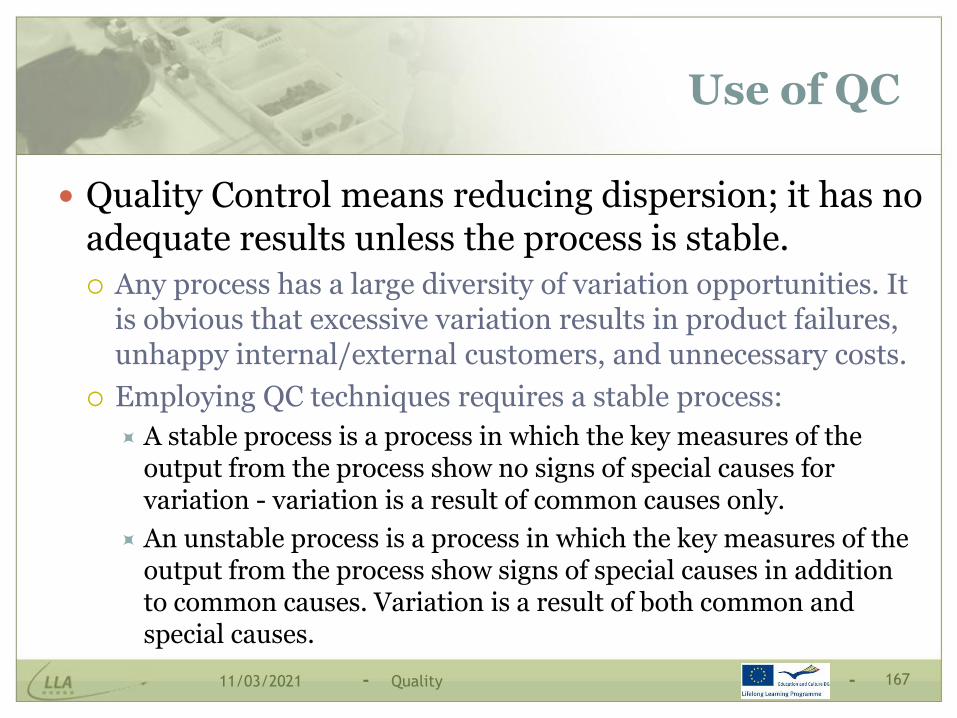
- -
Use of QC
Quality Control means reducing dispersion; it has no adequate results unless the process is stable.
Any process has a large diversity of variation opportunities. It is obvious that excessive variation results in product failures, unhappy internal/external customers, and unnecessary costs.
Employing QC techniques requires a stable process:
A stable process is a process in which the key measures of the output from the process show no signs of special causes for variation - variation is a result of common causes only.
An unstable process is a process in which the key measures of the output from the process show signs of special causes in addition to common causes. Variation is a result of both common and special causes.
Quality 16711/03/2021

3.1. Quality at the Source
The philosophy of making each worker responsible for the quality of his or her work.

- -
3.1. Quality at the Source
Quality products come from quality sources. Quality at the source is a philosophy whereby defects are caught and
corrected as closest as possible of where they were created. Accordingly, quality at the source is the approach considering that it is better to uncover source of quality problems and correct it as soon as possible, before the product leaves downwardly on the process flow.
Even if quality is built into the process, additional non-quality sources may appear during operations and additional contributing Techniques can be employed to have quality at the source : Sequential Inspection Stop the line / Fix the problem Failsafe Devices Standardized Parts and Processes Design for Manufacturability Operator Checklists 5S Vendor Base Reduction Supplier Development
Quality 16911/03/2021
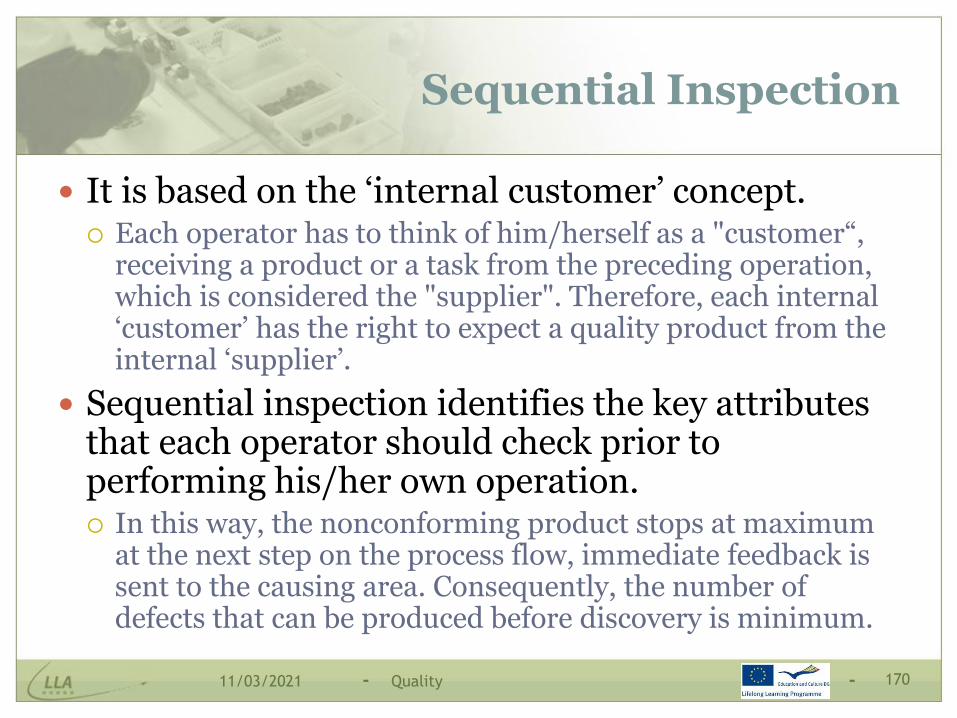
- -
Sequential Inspection
It is based on the ‘internal customer’ concept. Each operator has to think of him/herself as a "customer“,
receiving a product or a task from the preceding operation, which is considered the "supplier". Therefore, each internal ‘customer’ has the right to expect a quality product from the internal ‘supplier’.
Sequential inspection identifies the key attributes that each operator should check prior to performing his/her own operation. In this way, the nonconforming product stops at maximum
at the next step on the process flow, immediate feedback is sent to the causing area. Consequently, the number of defects that can be produced before discovery is minimum.
Quality 17011/03/2021

- -
Stop the Line / Fix the Problem
Stop the Line / Fix the Problem (also known as Jidoka) - the name of the technique gives a clear indication on the activities needed to be performed to increase quality at the source: The workers have the right to stop the production line whenever a
non-conforming product occurs.
In this way, it is obvious that the quality at the source increases, as a spotlight is put on every defect, on its occurrence, source and causes.
Production resumes only after the problem has been solved and a correction action was put into practice.
Furthermore, after correcting the problem, a clear accountability has to be assigned, so as to “failsafe” the process against problem recurrence.
Quality 17111/03/2021

- -
Failsafe
Failsafe or Poka Yoke or ‘Zero Defects’ approach is the technique of making an operation "incapable of producing a defect". Once the cause of a defect has been discovered, a failsafe device
should be introduced to enhance the process robustness - either it can no longer be possible to produce that defect, or signalling immediately the defect occurrence, for human adjustment / correction. Consequently, a failsafe: Eliminates the cause of an error at the source Detects an error as it is being made Detects an error soon after it has been made but before it reaches the
next operation.
Common failsafe devices include go/no-go gauges, limit switches, optical sensors, weight checkers, torque wrenches, on-machine gauging, lock-up devices, part re-design, one-way fixtures, parts standardization, etc.
Quality 17211/03/2021

- -
Standardized Parts and Processes
The basic idea in using standardization is to minimize the “opportunity for error”.
Standardization increases process efficiency, but has also several other benefits:
For example, the likelihood of installing a wrong part is reduced.
Learning process helps both quality and efficiency.
It reduces costs.
Quality 17311/03/2021

- -
Design for Manufacturability
It is a relevant approach to build in quality into the process, since the design phase, making processes more easy to be adequately controlled, hence enabling quality at the source.
It implies:
Simplifying the design
Standardizing parts and processes
Reviewing production methods, equipment, and tooling capabilities.
Quality 17411/03/2021

- -
Operator Checklists and 5S
If each worker has ‘Operation Checklists’ for each planned activity and is working in a neat and clean environment provided by 5S, it is very likely to minimize the chance of an error or defect to appear, right at the source.
An ‘Operation Checklist’ is a listing of critical steps/checks to make, to help operators manage their processes.
A thorough workplace organization discipline (5S) keeps tools, parts, and fixtures in pre-determined locations, reducing the chances of using wrong items.
Quality 17511/03/2021

- -
Vendor Base Reduction / Supplier Development
Vendor Base Reduction implies selecting best quality suppliers to work with, so as to provide for improved parts and raw material consistency.
It includes:
Suppliers’ evaluation based on quality problems recorded
Support offered to the suppliers, for quality improvement.
Quality 17611/03/2021

3.2. Quality Process Mapping
The philosophy of making each worker responsible for the quality of his or her work.

- -
Process Mapping
Process Mapping is the most important and powerful tool used to control and to improve the effectiveness and efficiency of a process.
Process Mapping, also called flowcharting, is a technique to visualize the stream of tasks, activities and steps that transforms a well defined input or set of inputs into a pre-defined set of outputs. The preferred method for describing a process is to identify it with
a generic name, show the workflow with a Process Map and describe its purpose with an operational description.
Process Mapping is based on identifying the inputs/outputs of each task, activity and step, and if it adds value, or not – as perceived by the customer, to the resulted product or service.
Quality 17811/03/2021

- -
Process Mapping (2)
The process map is a visual method used for displaying processes that illustrates the workflow either within a single process (Detailed Process Map) or the whole operation (High Level Process Map).
The Detailed Process Map is fit to identify potential causes and improve the process.
The High Level Process Map is utilized in understanding the links between the several process steps.
A good Process Map should:
Allow people unfamiliar with the process to understand the interaction of causes during the workflow.
Contain additional detailed information about input and output variables, time, costs.
Quality 17911/03/2021

- -
Process Mapping (3)
There are many reasons for creating a Process Map:
It integrates the whole process and allows all players to understand their part in the process and how their activity fits into the overall process.
it is a visual way to describe how activities are performed and how the work effort flows.
It can be used as an aid in training new people.
It will show you relevant points for taking measurements in view of process improvement.
It supports understanding of where problems occur and what the causes may be.
It leverages other analytical tools by providing a source of data and inputs into these tools.
Quality 18011/03/2021

- -
Quality Mapping
It is similar to Value Stream Mapping, because it defines in detail the processes to be analysed.
It starts with a walk along the process flow, gathering information about each operation performed.
A visual diagram joins up the information regarding each process step.
While mapping the process, hundreds of ideas appear, out of which some could be very useful for quality improvement.
Quality 18111/03/2021

- -
Quality Mapping (2)
Some basic steps: List all quality specification or requirements that must be
measured
For each feature, add:
The inspection method
The inspection frequency
The measurement method
List the defect potential of each measurement – what defects could be introduced or induced during the measurement process
List the potential causes for each defect listed
List the potential actions for improvement
Quality 18211/03/2021

- -
Quality Mapping - Example
It has the form of a matrix to be filled in:
Product 1 Product 2 Product 3 Product 4
Feature
Current Estimate of Rework
Inspection Method
Inspection Frequency
Defect Potential
Defect Cause
Ideas for Improvement
Quality 18311/03/2021

3.3. Quality Analysis Matrix
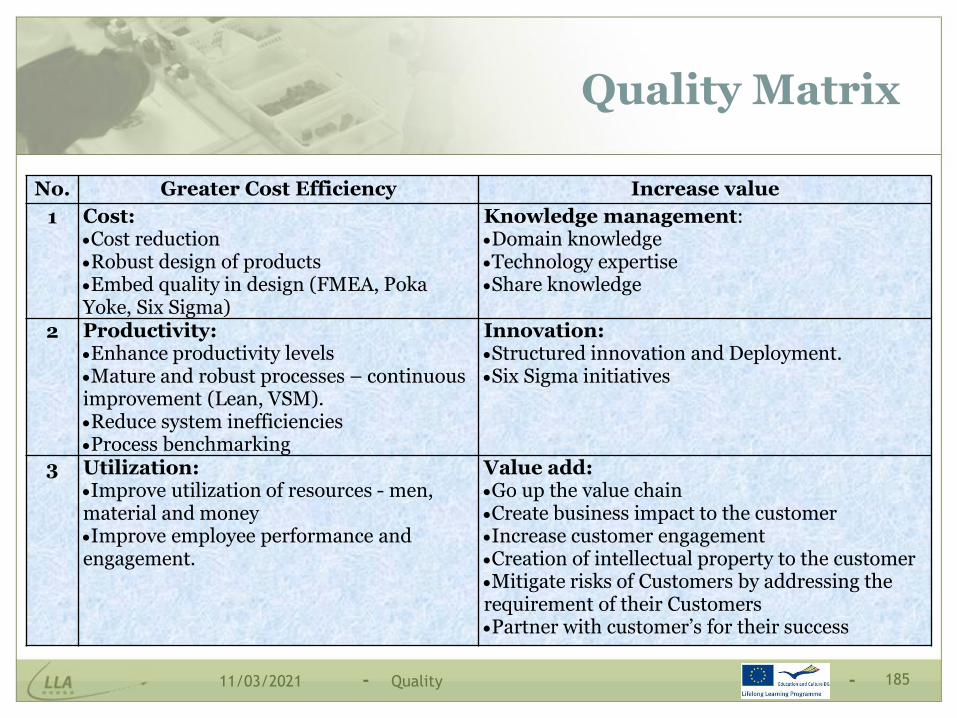
- -
No. Greater Cost Efficiency Increase value
1 Cost:•Cost reduction•Robust design of products•Embed quality in design (FMEA, Poka Yoke, Six Sigma)
Knowledge management:•Domain knowledge•Technology expertise•Share knowledge
2 Productivity:•Enhance productivity levels•Mature and robust processes – continuous improvement (Lean, VSM). •Reduce system inefficiencies•Process benchmarking
Innovation:•Structured innovation and Deployment. •Six Sigma initiatives
3 Utilization:•Improve utilization of resources - men, material and money•Improve employee performance and engagement.
Value add:•Go up the value chain•Create business impact to the customer•Increase customer engagement•Creation of intellectual property to the customer•Mitigate risks of Customers by addressing the requirement of their Customers•Partner with customer’s for their success
Quality Matrix
Quality 18511/03/2021
4. Quality Improvement
4.1. Main Quality Tools
4.2. PDCA – Deming Circle

- -
Quote
“You can’t do today’s job with
yesterday’s methods and be in business
tomorrow.“ (Anonymous)
Quality 18711/03/2021

- -
Quality Improvement
Quality comes not from inspection, but from improvement of the process.
The old way:
Inspect and sort bad quality out.
The new way:
Build good quality in and assure quality at the source.
Quality Improvement
Develop processes able to produce the product and keep optimizing it.
Quality 18811/03/2021

- -
Principles of Quality Improvement
Philosophy of proactive culture of continually seeking ways to improve quality
Top down and bottom up approach Responsibility for quality at every hierarchical level
Develop a sense of operator ownership in the process. People have unexploited resources and only people who do the
work are in the best position to improve quality – they have to work in teams and to be encouraged to involve themselves in improvement activities.
Costs of quality Continuous and gradual improvement
Process view Organization- wide involvement and commitment. Problem-solving tools used by the work teams.
Quality 18911/03/2021

- -
People Involvement in Quality Improvement
Everyone and every department must devote themselves to constant improvement.
Management must lead the way.Management’s Responsibility For Quality Cannot Be Delegated!
Decisions and actions of the Top Management Make a quality statement Serve on the quality council Select quality policies, establish and deploy quality goals Provide resources Provide team oriented training Review progress Institutionalized recognition and reward system for involvement in quality
improvement.
The focus must be on improvement and not merely fire-fighting or on assigning blame on guilty persons. Most people on the job do not know or are not told how to properly perform their
duties (including managers) and are afraid to ask for fear of being viewed as incompetent, or of punitive measures being taken, or of dismissal.
For involvement in quality improvement, people must feel secure in their positions.
Quality 19011/03/2021

- -
“Laws” of Quality Improvement
Today’s problems come from yesterday’s solutions.
The harder you push, the harder the system pushes back.
Behaviour grows better before it grows worse.
The easy way out usually leads back in.
The cure can be worse than the disease.
Faster is slower.
Cause and Effect are not closely related in time and space.
Small changes can produce big results, but the areas of highest leverage are the least obvious.
You can have your cake and eat it too, but not at once.
Dividing an elephant in half does not produce two small elephants.
There is no blame.
Quality 19111/03/2021

- -
Sporadic vs. Chronic Quality Problems
Sporadic problems are dramatic and require immediate attention. Sporadic problems are solved by fixing the control process.
Solutions consist in sudden corrections.
Chronic problems are not dramatic – being “accepted as inevitable” – they occur over a long period of time and are difficult to solve. Chronic problems are solved using process improvement
techniques.
Solutions consist in:
Corrective and preventive solutions
Actions for improvement.See slide 27 – the Juran’s Quality Trilogy
Quality 19211/03/2021

- -
Usual Work Environment
A CurrentProblem
Make wild guess at what is wrong
Adopt unproven solution
Blame someone else for the problem
The Dilbert Cycle
Quality 19311/03/2021

- -
Obstacles in Continuous Improvement
Lack of top management commitment
Setting mediocre expectations
Poorly or inadequately monitoring and diagnosing the situation
Failing to train personnel
Making continuous improvement too complex
Cause-Effect relationship not obvious
Inadequate working environment
Resistance to change
Failing to recognize and celebrate successes.
Quality 19411/03/2021

- -
Quality Improvement and the “Lean” Approach
Improving quality implies serving customers better, faster; lean implies providing the right results less expensively, by consuming fewer resources. So, anything which does not contribute either directly or indirectly to
customer satisfaction must be eliminated from the process flow, except for everything that is “just enough” in all sectors and at all levels of activity
Identify and eliminate with the goal of both Lean and continuous improvement: Causes of rework Poorly calculated workloads Excessive inventory Skills under-utilized or poorly utilized.
This step will lead to a streamlining or an overhaul of all processes.
Quality Improvement
Design for LeanValue Stream
Implementation
Quality 19511/03/2021
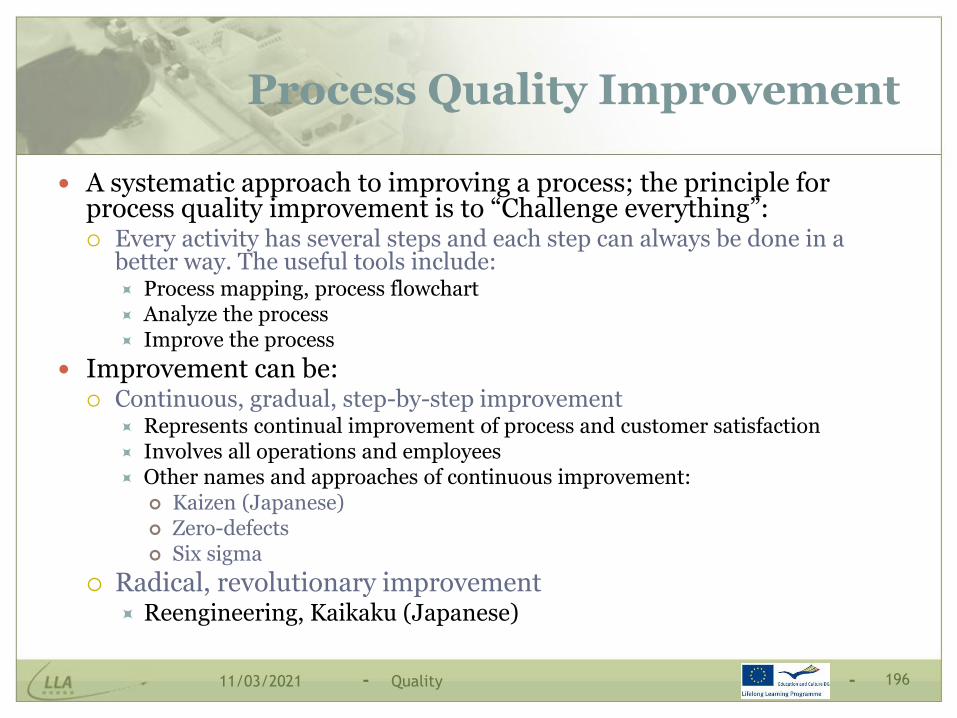
- -
Process Quality Improvement
A systematic approach to improving a process; the principle for process quality improvement is to “Challenge everything”: Every activity has several steps and each step can always be done in a
better way. The useful tools include: Process mapping, process flowchart Analyze the process Improve the process
Improvement can be: Continuous, gradual, step-by-step improvement
Represents continual improvement of process and customer satisfaction Involves all operations and employees Other names and approaches of continuous improvement:
Kaizen (Japanese) Zero-defects Six sigma
Radical, revolutionary improvement Reengineering, Kaikaku (Japanese)
Quality 19611/03/2021
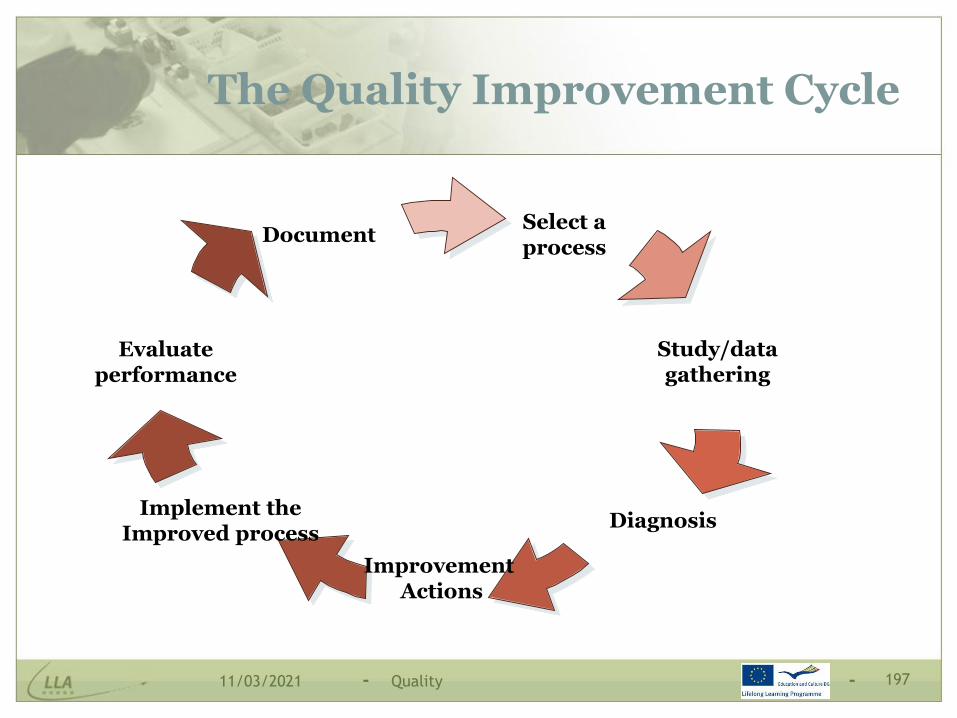
- -
The Quality Improvement Cycle
Evaluateperformance
Select aprocess
Study/datagathering
Diagnosis
Improvement Actions
Implement theImproved process
Document
Quality 19711/03/2021

- -
The Spiral of Quality Continuous Improvement
The goal of quality improvement it to make progress - not to achieve perfection This includes daily progress in routine matters as well as large-scale cross-functional
improvements, without necessarily resorting to additional investment.
There is no ideal quality level which, once reached, allows the company to quit its drive to improve quality, using one or more of the several ways of improving quality in different phases of the product life cycle: Built in quality
Quality Function Deployment Used to translate customer preferences to design
Quality at the source The 7 Basic Quality Tools
There are a number of tools that can be used for problem solving and quality improvement Quality tools aid in data collection and interpretation, and provide the basis for decision
making
The 7 New Quality Tools Problem solving methodologies PDCA Cycle
Also called the Deming Wheel – it ensures that a certain degree of progress achieved Recurrent problem solving process
Quality 19811/03/2021

4.1. Quality Tools
The 7 Basic Quality Tools
Other Quality Tools

- -
The 7 Basic Quality Tools
Kaoru Ishikawa selected 7 basic quality tools based on less complicated statistical analysis for the average person:
Check Sheet
Histogram
Run Charts
Pareto Analysis
Cause and Effect Diagram
Control Chart
Scatter Diagram
Quality 20011/03/2021

- -
Check Sheet
Check sheet = a data collecting sheet
A tool for collecting and organising data
A tally of problems or other events grouped by category
A simple data check-off sheet designed to identify type of quality problems at each work station – per shift, per machine, per operator
Objective:
To get the necessary information to answer to the following questions:
When it happens?
How many times it happens?
Quality 20111/03/2021

- -
Histogram
A vertical bar chart showing an empirical frequency distribution of a set of observed values (quantities or characteristics) of a variable
It summarizes large data sets, communicating information graphically.
It enables comparison of recorded values with specification limits It is a tool to assist in decision-making
By examining the shapes, sizes, and the spread of data of a histogram, it is possible to undertake decision-making process
It shows whether the distribution is symmetrical (normal) or skewed
Steps:1. Make the measurements or record the values of the monitored
variable2. Count the frequency of each value 3. Draw the histogram
Quality 20211/03/2021
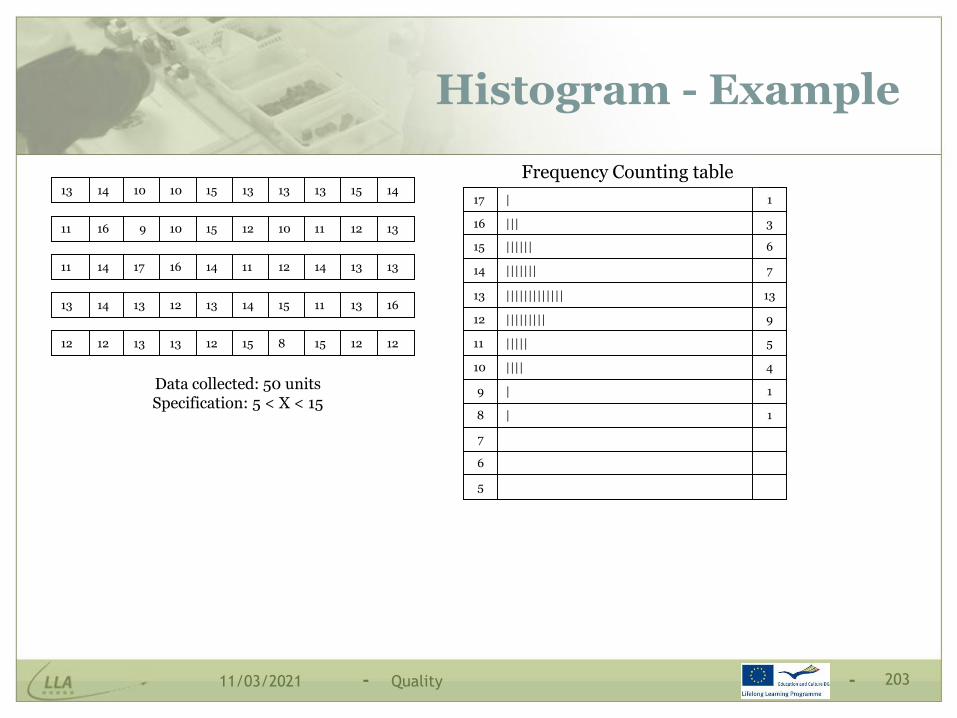
- -
1413 10 10 15 13 13 13 15 14
1611 9 10 15 12 10 11 12 13
1411 17 16 14 11 12 14 13 13
1413 13 12 13 14 15 11 13 16
1212 13 13 12 15 8 15 12 12
Data collected: 50 unitsSpecification: 5 < X < 15
|17 1
|||16 3
||||||15 6
|||||||||12 9
|||||||||||||13 13
|||||||14 7
6
7
|8 1
|9 1
||||10 4
|||||11 5
5
Frequency Counting table
Histogram - Example
Quality 20311/03/2021

- -
20
Frequency
19
18
17
15
11
13
9
7
6
4
3
2
1
5 6 7 8 9 10 11 12 16151413 17
Histogram – Example (2)
Quality 20411/03/2021

- -
Run Charts
A chart showing the history of the process and pattern or variations in time sequence It is plot of data points in time sequence, connected by a
line.
It’s very useful for identifying trends and cycles.
This tool is used: At the beginning of the change process – to see what the
problems are
At the end of the change process – to see whether the change made has resulted in permanent process improvement
To identify when equipment or processes are not behaving according to specifications
Quality 20511/03/2021

- -
Run Chart - Example
Time (Hours)
# o
f ty
pin
g e
rro
rs
7 8 9 10 11 12 13 14 15 16 17
1
2
3
4
5
6
7
Quality 20611/03/2021

- -
Steps to Build a Run Chart
Step 1: Gather data
How many typing errors are registered every hour – see the previous example
Step 2: Organise data
Determine the values for the x axis (minutes, hour, day of week, shift) and for the y axis (# of errors)
Step 3: Plot the data on the chart
Step 4 : Interpret data
# of errors increases after long working hours– see the previous example
Quality 20711/03/2021

- -
Pareto Chart
A Pareto chart is a graphic tool used to prioritize a list of variables or factors based on the distribution of effects produced by various causes, arranged from the most frequent to the least frequent.
Objective: Determine the relative importance of collected information to
select priorities in problem solving.
This chart is based on the Pareto principle, which states that typically 80% of the defects in a process or product are caused by only 20% of the possible causes
Often called the 80-20 Rule
The main idea is that quality problems are the result of only a few caused, e.g. 80% of the problems are triggered off by 20% of causes
Quality 20811/03/2021

- -
Quote
“To err is human – to fail to
document is negligent.” (Anonymous)
Quality 20911/03/2021

- -
Pareto’s Law
Vilfredo Pareto (1848-1923) originated the 80/20 Rule, which states that 80% of the problems comes from only 20% of the causes.
Pareto was an Italian economist and a political sociologist. He observed that 20% of the people in Italy owned 80% of the national wealth.
Later on, Juran enlarged the use of the Pareto’s Rule, and devised the law of the ‘trivial many’ and the ‘critical few’,starting from the 80:20 rule. So, Juran proposed many adaptations of the Pareto’s Law:
80% of the potential value can be achieved from just 20% of the effort. The remaining 80% of effort shows relatively little return.
80% of the sales income come from 20% of the customers 80% of the defects are produced by 20% of the processes/workers 80% of the non-quality costs are induced by 20% of the products, a.s.o.
Quality 21011/03/2021

- -
Steps to Build a Pareto Chart
Step 1: Gather data Define the problem to be analysed List the variables affecting the problem Set a method and collect data
Step 2: Prepare data Fill in a table with variable category, values collected, relative and cumulative occurrence,
totals Sort the table in descending order to show max. to min. frequencies
Step 3: Plot the data on the chart Vertical bar chart for relative frequency occurrence of every variable The x-axis shows the categories of variables, from the most frequent to the least frequent The y-axis is for the relative frequency; it is recommended to show also the cumulative
percentage on a second y-axis (to the right of the chart)
Step 4 : Interpret data This chart-type is used to identify if the Pareto principle is evident for the specific
situation. If the Pareto principle is evident, about 20% of the categories on the far left of the x-axis will have about 80% of the impact on the problem and they’ll be the priority to be approached for solving the analysed problem.
Quality 21111/03/2021

- -
Pareto Chart - Example
A printing company receives usually 100 complaints from customers per month.
One of the managers decided to increase the customers’ satisfaction and to decrease the monthly average # of complaints.
He started a Pareto analysis and discovered that the causes of the complaints refer to the fallowing situations:
A. Off centred printing of the titles
B. Misspellings
C. Missing words
D. Fading colours
E. Others.
Afterwards he applied the others steps needed to build a Pareto chart
Quality 21211/03/2021
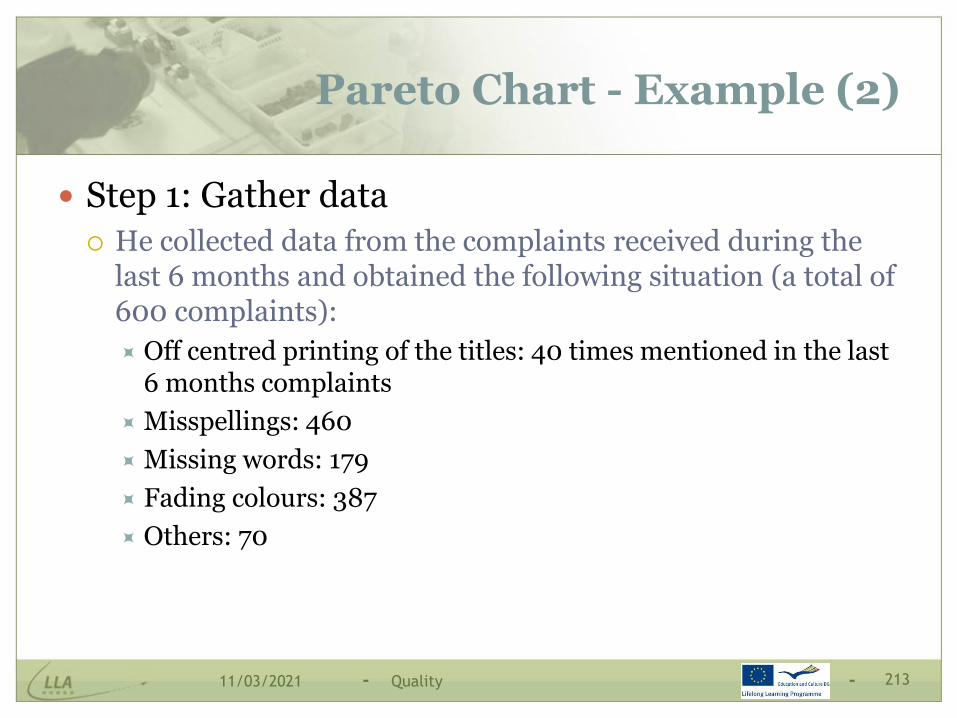
- -
Pareto Chart - Example (2)
Step 1: Gather data
He collected data from the complaints received during the last 6 months and obtained the following situation (a total of 600 complaints):
Off centred printing of the titles: 40 times mentioned in the last 6 months complaints
Misspellings: 460
Missing words: 179
Fading colours: 387
Others: 70
Quality 21311/03/2021

- -
Pareto Chart - Example (2)
Step 2: Prepare data
2.1. He filled in a table like the following:
2.2. The rows have to be sorted in a descending order
Type of defect # Cumulative #
A 40 40
B 460 500
C 179 679
D 387 1066
E 70 1136
Total 1136
Type of defect # Cumulative #
B 460 460
D 387 847
C 179 1026
E 70 1096
A 40 1136
Total 1136
Quality 21411/03/2021

- -
Pareto Chart - Example (3)
2.3. He calculated the relative and cumulative frequency for each type of defect:
Type of defect # Cumulative # % Cumulative %
B 460 460 40.49 40.49
D 387 460+387=847 34.07 40.49+34.07=74.56
C 179 847+179=1026 15.76 74.56+ 15.76 =90.32
E 70 1026+70=1096 6.16 90.32+6.16=96. 48
A 40 1096+40=1136 3.52 96.48+3.52=100
Total 1136 100
Quality 21511/03/2021

- -
Pareto Chart - Example (4)
Step 3: Pareto Chart Step 4: Interpretation To solve approx. 75% of the customer’s
complaints, it is necessary to eliminate 20% of the non-satisfaction causes (related to misspellings and fading colours) The potential improvement actions are:
More efficient proof reading tools to correct spelling before printing
Better paint
Eliminating the 3rd cause as frequency (missing words) further reduces the complaints with approx. 16%, and fighting against all other remaining sources of complaint will improve the results with less than 10%.
It is recommended that the ‘other” category to represent max. 10% of the causes. If more, the category should be split into several categories.
B
50%
100%
D C E A
50%
100%
40.49%
74.56%
90.32%
96,48%
80%
Quality 21611/03/2021

- -
Pareto Chart - Conclusions
The Pareto Chart has many advantages: Easy to use and to interpret, even for beginners in statistics and complex
data analysis techniques
The variable selected for analysis may be of different types: Quality
Number of defects, % of defective products, quantity of defective products, # of customers’ complaints, etc.
Costs
Value of sales income per product type, NVA costs, maintenance costs, etc.
Delivery
Time duration for certain activities, # of delayed deliveries, inventory quantity for product types
Employees’ moral
Turnover, absenteeism, internal complaints
Safety at work
# of work accidents, gravity of the accidents, work incidents
Quality 21711/03/2021

- -
Pareto Chart – Conclusions (2)
Other advantages of the Pareto Chart: It may be used as a recurrent tool – it can be built several times to
go into details for better understanding the problem For example, if we want to see what equipment, software or operator is
responsible for misspelling errors, we have to gather data to analyse only the causes for misspelling.
Or if we want to know which shift is responsible for the majority of the misspelling errors, we make a Pareto analysis based on occurrence of these faults during a certain shift.
Pareto chart may be also used during Quality Planning or Quality Control phases: For example, to stratify ‘Voice of the Customer’ data to indicate the
most important requirements of the customer, or to stratify data collected on the run charts, for identifying the most important causes that contribute to a specific quality problem.
Quality 21811/03/2021

- -
Cause and Effect Diagram
A cause and effect diagram is a visual tool used to logically organize in a systematic wayknown or possible causes and sub-causes for a specific problem or effect by graphically displaying them in increasing levels of detail. Objective: To find all the
possible causes of a certain problem and/or to obtain the most probable causes of the same problem.
It helps to identify root causes and ensures common understanding of the causes
Attributes of C&E Diagram: No statistics involved
Uses an orderly, easy-to-read format
Sheds light on situations
Maps out a process/problem
Increases process knowledge
Indicates possible causes of variation
Helps determine root causes
Identifies areas for collecting data
Encourages group participation
Makes improvement easier
Quality 21911/03/2021

- -
Cause and Effect Diagram
Also known as: Ishikawa Diagram
Fishbone Diagram, because it looks like a skeleton of a fish, with the main causal categories drawn as "bones" attached to the spine of the fish (the analysed effect)
The cause and effect diagram can also be drawn as a tree diagram, resembling to a tree turned on its side. From a single trunk, major categories of inputs or causes open out
like branches, leading to smaller and smaller branches of causes all the way down to thinner twigs at the ends for the sub-causes.
The tree structure has an advantage over the fishbone-style diagram: As a tree structure, all items on the same causal level are aligned
vertically and are visible even for complex diagrams.
Quality 22011/03/2021

- -
Steps to Build a Cause and Effect Diagram
Building a cause and effect diagram implies teamwork of people directly related to the problem, performing a specific methodology: Step 1: Select the problem to be solved and write it in a rectangle,
in the farthest right edge of a paper sheet.
Step 2: Draw the ‘fish bones’ and arrange the main causes according to their level of importance or detail, resulting in a depiction of relationships and hierarchy of events. This can help search for root causes, identify areas where there may be
problems, and compare the relative importance of different causes.
Step 3: Draw the thinner ‘fish bones’ by asking for each main cause: ‘What could have caused problems in this area?’ Repeat for each main cause and for each sub-cause/sub-area.
Quality 22111/03/2021

- -
Recommendations for Building up a Cause and Effect Diagram
Main causes in a cause and effect diagram are frequently arranged into four major categories, for example: Manpower, Methods, Materials, and
Machinery – recommended for manufacturing activities)
Equipment, Policies, Procedures, and People – recommended for service areas
Sometimes it is required to use other quality tools as support : Brainstorming, to identify real and
potential causes and sub-causes An affinity diagram, to identify
other main branches of the cause and effect diagram
The ‘5 Whys’ technique, to drill down to the root causes
Flow charts
Some guidelines to draw the diagram: Select a relevant effect or quality
problem to analyse its causes For each node, think what could be
its causes and add them to the tree. Pursue each line of causality back to
its root cause. Consider attaching relatively empty
branches onto others. Consider splitting up overcrowded
branches.
Be concise and do not cover all causes in a comprehensive approach, but consider which root causes are most likely to merit further detailed investigation.
Quality 22211/03/2021

- -
Cause and Effect Diagram – Example
Quality 22311/03/2021

- -
Cause and Effect Diagram– Example (2)
A distribution company is confronted with a major quality problem: many of the delivery addresses are incorrectly written on the delivery documents, therefore many of the orders are delivered late, with additional transport costs. They decided to appoint a team for analysing the causes of such situation. Step 1: Write down the effect to be investigated and draw the “backbone”
arrow to it.”
Step 2: Identify the broad areas of enquiry for the real or potential causes.
Incorrect Deliveries
Incorrect Deliveries
Communication Skills
Transport Equipment Procedures
Quality 22411/03/2021
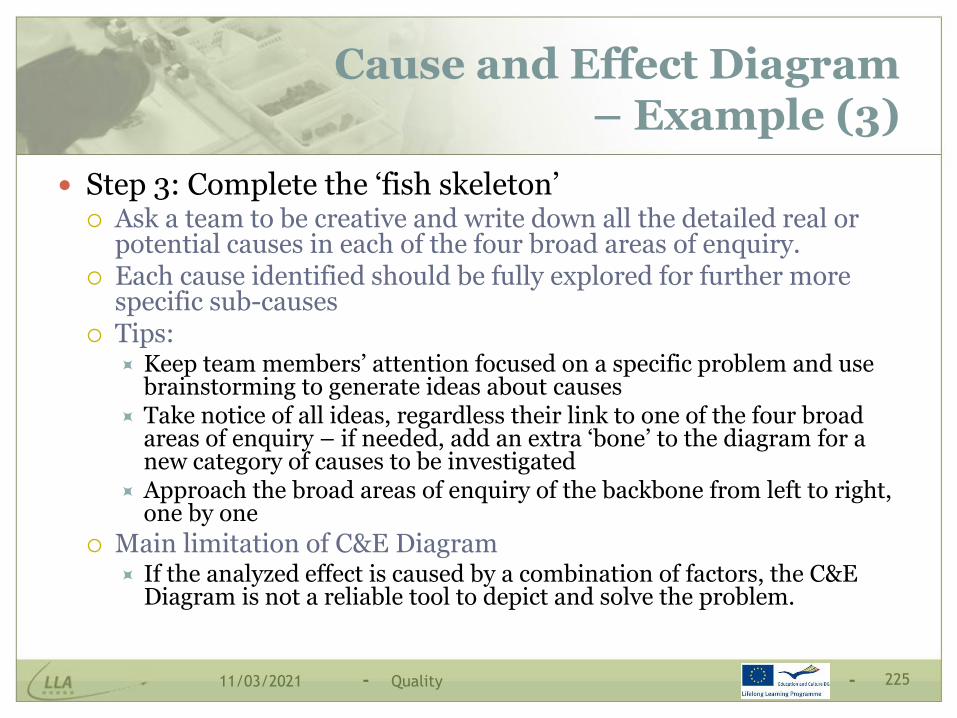
- -
Cause and Effect Diagram– Example (3)
Step 3: Complete the ‘fish skeleton’ Ask a team to be creative and write down all the detailed real or
potential causes in each of the four broad areas of enquiry. Each cause identified should be fully explored for further more
specific sub-causes Tips:
Keep team members’ attention focused on a specific problem and use brainstorming to generate ideas about causes
Take notice of all ideas, regardless their link to one of the four broad areas of enquiry – if needed, add an extra ‘bone’ to the diagram for a new category of causes to be investigated
Approach the broad areas of enquiry of the backbone from left to right, one by one
Main limitation of C&E Diagram If the analyzed effect is caused by a combination of factors, the C&E
Diagram is not a reliable tool to depict and solve the problem.
Quality 22511/03/2021

- -
Cause and Effect Diagram– Example (4)
Incorrect Deliveries
Communication Skills
Transport Equipment Procedures
Configuration
Training
Attention to details
Supervision
Load
Ability
Poor handling of large orders
Lack of experience
Poor dispatching
Too many abbreviations
Wrong address records
Attitude
Overtime
Stress
Quality 22611/03/2021

- -
Control Chart
A line chart showing the control limits and the average quality level It is a run chart with specified UTL and LTL, for easier detection of trends
and of correctable causes of variation Developed by Shewhart in 1920’s and used for SPC ever since
It provides information about process capability
It allows to identify the causes of non natural process variation
It provides diagnostic information.
It can be used to: Improve productivity by monitoring the ongoing production process
quality and quality conformance to stated standards of quality Defects prevention
Taking corrective action (if necessary)
Unnecessary process adjustments prevention
Tracking improvements
Quality 22711/03/2021

- -
Control Chart
Upper Tolerance Limit (UTL)
Lower Tolerance Limit (LTL)
Unacceptable deviation
XAverage
Quality 22811/03/2021

- -
Tracking Improvements by using Control Charts
UTL
LTL
LTLLTL
UTLUTL
Process not centeredand not stable
Process centeredand stable
Additional improvementsmade to the process
Quality 22911/03/2021

- -
Variables
(Measurable characteristics; continuous variables)
Attributes
(Discrete variables)
Average and Range
X chart and R chart
Number of non conforms items
np chart
Average and standard deviation
X chart and s chart (n>10)
Proportions of non conform items
p chart
Average and variance
X chart and s² chart
Number of defects
c chart
Individuals observations and moving ranges
X chart and MR chart
Number of unit defects
u chart
Types of Control Charts
Quality 23011/03/2021

- -
Interpretation of Control Charts
Points out of control Immediate analysis to find the possible causes If the immediate causes could not be found, the points are registered and a corrective
action should be taken
The reasons for out of control points The control limit or registered point are incorrectly marked Variability has been changed The measurement system was modified
Out of control typical situations Cyclic movements (up, down) show the existence of seasonal effects or workers rotation. Tendencies (in one direction) may imply the existence of predictable causes (blunt of
tools or a process improvement). Isolated out of control points may mean defects in material, starting up or stop of
machines. Even if the points are within the acceptable limits, decisions should be taken when one of
the following situation appears: 7 successive points at the same side of the middle line 10 in 11 points at the same side of the middle line 12 in 14 points at the same side of the middle line 16 in 20 points at the same side of the middle line
Quality 23111/03/2021

- -
Benefits of the Control Charts
Simple and easy tools to be applied by workers with the objective of getting a continuous process control and assure communication and visual management
Since the process is under statistical control, control charts allow: To identify trends of the process variation and to say when the process is stable and
effective in terms of cost and quality To improve the process performances, based on the information given by charts
They allow the use of a common language: When studying the improvements of process between workers and supervisors and the
other activities related to production (methods, materials, etc.) They establish a common language between the company and its customers
When distinguish the common causes from special causes that affect processes, the control charts provide: Precise indications about the opportunity and possibility of performing corrective
actions: By workers, directly in the job place, in certain limits, for normal variation causes By process responsibles, according to the internal procedures, for special variation causes
Quality 23211/03/2021

- -
Scatter Diagram
A graph that shows how two variables are related to one another – the pattern that exists in the relationship between two variables ‘x’ and ‘y’. Available data can be used in a regression analysis to establish the
degree of correlation between variables The degree of correlation shows if there is or not a significant
relationship between the two variables
Intuitive and qualitative conclusions could be drawn about the two variables, about their degree and direction of correlation
Quality 23311/03/2021

- -
Scatter Diagram (2)
0
5
10
15
20
25
0 20 40 60 80
Scatter plots take place on an X and Y graph. The variable on the x-axis
should be the dependent variable and the variable on the Y-axis changes according to changes of X.
Scatter diagrams may be used: To develop informal models to
predict the future based on past correlations.
To find direct or indirect relationships which can then be helpful to analyze/improve quality.
Time Cooking (minutes)
Quality 23411/03/2021
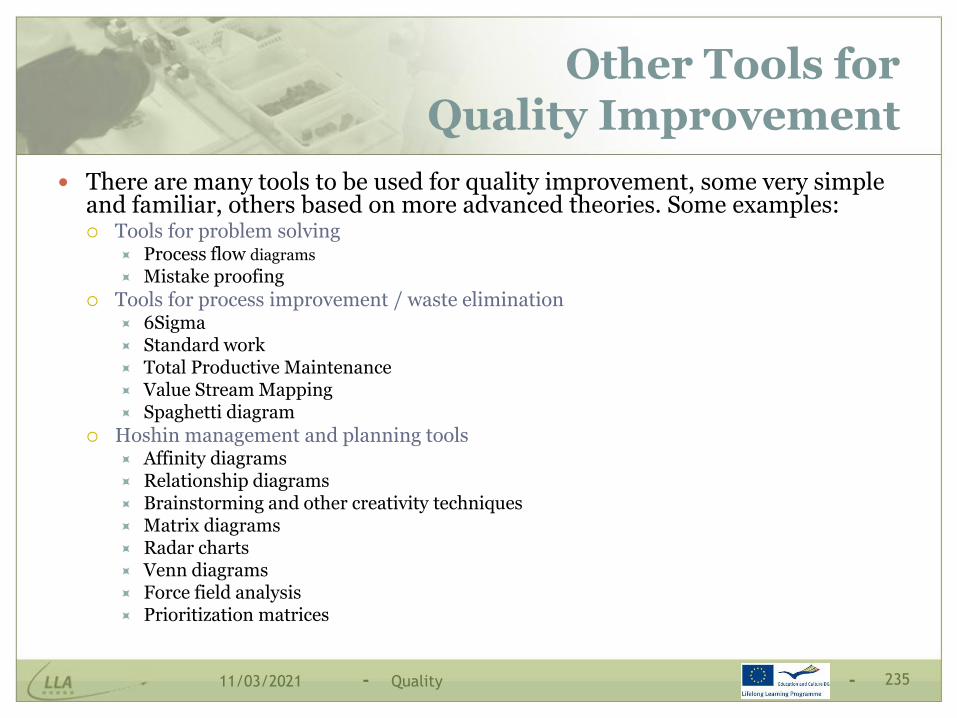
- -
Other Tools forQuality Improvement
There are many tools to be used for quality improvement, some very simple and familiar, others based on more advanced theories. Some examples: Tools for problem solving
Process flow diagrams
Mistake proofing
Tools for process improvement / waste elimination 6Sigma Standard work Total Productive Maintenance Value Stream Mapping Spaghetti diagram
Hoshin management and planning tools Affinity diagrams Relationship diagrams Brainstorming and other creativity techniques Matrix diagrams Radar charts Venn diagrams Force field analysis Prioritization matrices
Quality 23511/03/2021
4.2. PDCA – the Deming Circle

- -
Plan – Do – Check – Act (PDCA)
PDCA is a continuous quality improvement tool
Also known as:
Shewhart Cycle
• Walter Shewhart – Discussed the concept of the continuous improvement cycle PDCA in his book, "Statistical Method From the Viewpoint of Quality Control“, published in 1939
Deming Wheel
• W. Edwards Deming – Modified and popularized the Shewart cycle (PDCA) to what is now referred to as the Deming Cycle, also known as PDSA (Plan, Do, Study, Act).
Quality 23711/03/2021

- -
PDCA (2)
PDCA says that processes should be addressed through four steps: Plan
Establish a need for quality improvement
Conduct a root cause analysis
Generate potential solutions
Plan a test of the most likely solution
Do Test the most likely solution on a small scale (i.e., conduct a pilot test)
Check See if the pilot test works
Act Implement the effective solution on general level to improve quality.
Quality 23811/03/2021

- -
PDCA Model
Deming used a circular model to show that the quality improvement never ends.
Once an improvement has been achieved, next the planning should begin for further improvement.
If during the ‘Check’ step it is obvious that the improvement solution doesn’t work, Deming suggested to return to some prior step in the cycle to alter the plan so that another improvement action could be, in fact, successfully implemented.
Quality 23911/03/2021

- -
1. Plan – Identify a quality problem and plan
a quality improvement action. Predict the effect this action will have and plan how the effects will
be measured.
2. DO – Test the
implementation of the improvement action on a
small scale and measure the effects attained.
4. ACT – Institutionalize
the change and adopt the
quality improvement action as a permanent working procedure, or
abandon it or do the cycle steps again.
3. CHECK – Assess the
results to learn the level of quality improvement, if
any, and if it is possible to implement the
improvement action on larger scale.
PDCA Cycle
PLAN
CHECK
ACT
DO
Quality 24011/03/2021

- -
PDCA Details – PLAN
PLAN Identify the quality problem
Describe the process flow Question the capacity or
capability of a process.
Is process in control (repeatable)?
Analyse the quality problem Identify possible causes of the
quality problem
Solve the quality problem Establish theories on how to
improve the process
Select the most probable solution and predict measurable outcomes.
Tools to be used: Problem solving techniques
Direct observation of the process
Data gathering techniques
Process mapping
Cause and effect diagram
Pareto analysis
Brainstorming
Quality 24111/03/2021

- -
PDCA Details – DO
Select and implement a quality improvement action as a pilot project
Establish success criteria
Design experiment to test the most probable solution
Obtain management support for implementing the chosen solution
Implement the solution on a trial or pilot basis
Tools to be used:
Problem solving techniques
Design of Experiment (DoE)
On-the-job training
Quality 24211/03/2021

- -
PDCA Details – CHECK
Gather and analyze data regarding the outputs after the improvement solution testing
Measure effects of change
Determine whether improvement exists
Measure outcomes compared to predicted outcomes
Validate the solution
If YES, go to the next cycle step
If NOT, revise the plan.
Tools to be used:
Direct observation of the project
Charts, diagrams, graphical analysis
Key performance indicators
Quality 24311/03/2021

- -
PDCA Details – ACT
If the ‘Check’ step proved that the improvement action is right, adopt it on a broad scale across organization
Identify systemic changes and training needs to support general implementation of the improvement action
Continue cycle by entering Plan Monitoring the performance
Identify quality problems
Continuous improvement opportunities
Tools to be used: Process mapping
Work standards
Visual management
Error proofing
Training
Quality 24411/03/2021

- -
P DPlan Do
A CAct Check
Deming Quality Improvement Cycle
Quality 24511/03/2021

- -
The PDCA Flow Chart
The Six Stages of PDCA Cycle: Determine goals and targets for
the new improved level of quality
Determine methods of reaching the planned goals
Engage in education and training
Implement the improvement action
Check the effects of implementation
Take appropriate action Standardize the new working
procedure. Hold the gain and the new level
of quality performance
PLAN
DO
CHECK
ACT
Validate?No
Yes
Sel
ect
oth
er
imp
rov
emen
t so
luti
on
An
oth
er q
ua
lity
pro
ble
m
Quality 24611/03/2021
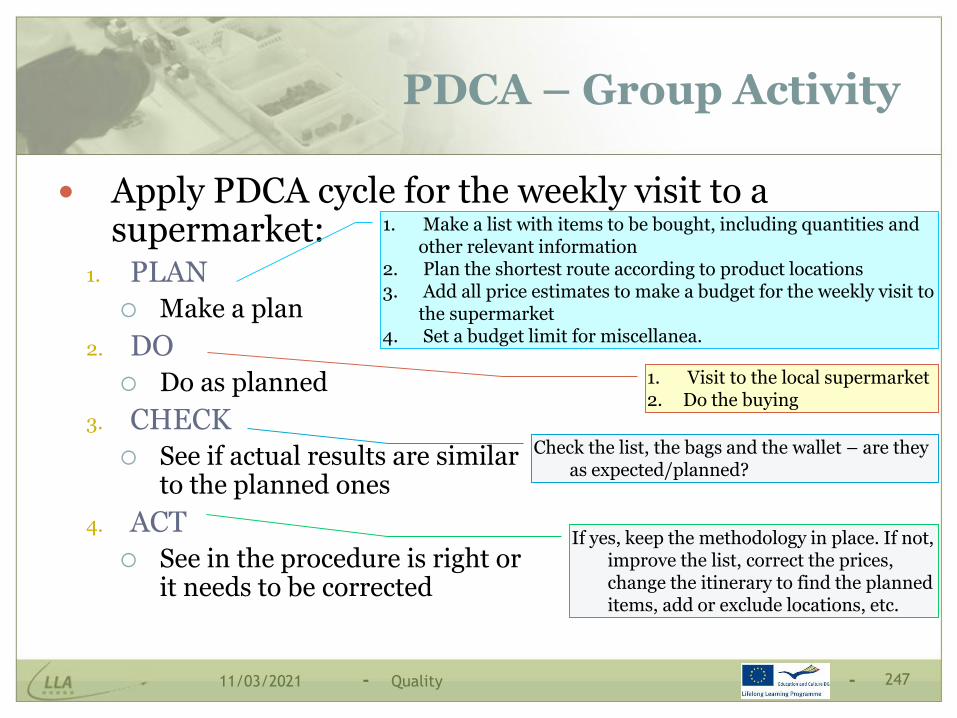
- -
PDCA – Group Activity
Apply PDCA cycle for the weekly visit to a supermarket:
1. PLAN
Make a plan
2. DO
Do as planned
3. CHECK
See if actual results are similar to the planned ones
4. ACT
See in the procedure is right or it needs to be corrected
1. Make a list with items to be bought, including quantities and other relevant information
2. Plan the shortest route according to product locations3. Add all price estimates to make a budget for the weekly visit to
the supermarket4. Set a budget limit for miscellanea.
1. Visit to the local supermarket2. Do the buying
Check the list, the bags and the wallet – are they as expected/planned?
If yes, keep the methodology in place. If not, improve the list, correct the prices, change the itinerary to find the planned items, add or exclude locations, etc.
Quality 24711/03/2021

- -
Other PDCA-type Improvement Cycles
PDSA Deming preferred the
term ‘Study’ later in his career, to replace the “Check” phase, as he considered that it takes more than merely checking to see if the pilot succeeded – it involves to study the results of the pilot test in order to better understand what happened.
PDSA stands for: Plan
Evaluate current process Collect data, identify problems Develop an improvement plan
Do Implement the plan on a trial basis
Study Collect data and evaluate performance
against objectives
Act Communicate the results from trial If successful, implement new process
Cycle is repeated After the ‘Act’ phase, start planning and
repeat process for another quality problem
Quality 24811/03/2021

- -
Other PDCA-type Improvement Cycles (2)
FAST-PDCA This model adds a few preliminary steps aiming at speeding up the PDCA
cycle: F – Focus only on a specific goal for the process improvement effort, that is
significantly beyond current expected performance
A – Analyze the data and do a cause-effect analysis.
S – Select potential improvement actions and the most likely to be effective
T – Test
Plan the test
Do the test
Check if the test is validated
Act on the knowledge gained
The primary advantage of this approach over the traditional PDCA cycle is that the process improvement effort is more carefully defined and planned before initiating the PDCA steps. FAST-PDCA is intended to be more of a quick fix tool.
Quality 24911/03/2021

- -
Other PDCA-type Improvement Cycles (3)
FOCUS-PDCA In this model, there is significant preparation before initiating PDCA.
FOCUS-PDCA is intended to be more methodical and thorough. F – Find a process to improve
Carefully select which process will be the focus of the improvement effort. O – Organize to improve the process
In this phase, all the resources needed to improve the process are gathered (a team, a facilitator, a team leader, preliminary project plans, estimated financial and equipment needs, ground rules, other resources needed)
C – Clarify current knowledge of the process A flowchart is developed depicting how the process works and quick and easy
improvements are spotted. Workers are trained on the best approach to the process as well as any necessary variations.
U – Understand types and sources of process variation In this phase, measurement are made, the key quality indicators are studied
S – Select the solution that is most likely to improve the process Using the quality tools previously discussed, the solution that is most likely
to improve the process is selected and any necessary approvals to make the process changes are obtained.
Quality 25011/03/2021

- -
PDCA – Concluding Comments
The PDCA cycle is an effective and rapid method for continuous improvement.
Each step (Plan, Do, Check, Act) is critical for consistent quality improvement and needs specific quality tools to be employed.
Quality 25111/03/2021

5. Conclusions

- -
Key Issues in Quality Management
Customer focus
A cultural change
Committed leadership and company-wide definition of quality
Real employee empowerment and strong motivation
Step-by-step improvement strategy
Time to devote to quality initiatives
Any process can be improved
An systematic approach to improvement is necessary
Good inter-organizational communication
Quality 25311/03/2021
- -
Quality Costs
“We have never considered any costs as fixed. Therefore we first reduce the price to
a point where we believe more sales will result. Then we go ahead and try to make
the price. We do not bother about the costs. The new price forces the cost down.”
- By Henry Ford, My Life and Work, 1922
Quality 25411/03/2021
- -
Quality Costs
Nothing is ever perfect. So quality affects all aspects of an organization and has dramatic cost implications on overall performance
Crosby said that ‘Quality is free”, but the lack of quality is expensive, because the customers notice every non-conformity.
The law of the competition: ‘If we don’t do it better, someone else will.’
Quality improve profit due to less costs of rework and scrap.
Quality 25511/03/2021

- -
The Iceberg of the Hidden Costs of Poor Quality
ReworkRejects
Sorting InspectionCustomer returns
Warranty expensesProduct Downgrading
Lost sales
Process downtime
Extra inventory
Lost discounts
Damaged goods
Customer allowances
Overtime to correct errors
Loss of good willPaperwork errors
Delays
Obsolete inventory
Incorrect orders shipped Extra process capacity
Competitor
Competitor
Quality 25611/03/2021

- -
Quality-Related Costs
Quality-related costs are costs incurred by an organization to ensure that the provided products or services are in compliance with the customer requirements.
Juran identified 2 types of quality-related costs :
Unavoidable Costs
Costs associated with defect prevention (inspection, sampling, sorting, QC)
Avoidable Costs
Costs associated with quality appraisal and product failures (scrapped materials, labour for re-work, complaint processing, losses from unhappy customers)
“Gold in the Mine”
Quality 25711/03/2021

- -
Cost of poor qualityCost of good quality
Quality-Related Costs
Prevention costs
Appraisal costs
Internal failure costs
External failurecosts
Quality 25811/03/2021

- -
“Costs of poor quality are huge, but the real amounts are not known with precision. In most companies, the
accounting system provides only a minority of the information needed to
quantify this cost of poor quality.”Juran on Quality by Design, The Free Press (1992)
Quality 25911/03/2021
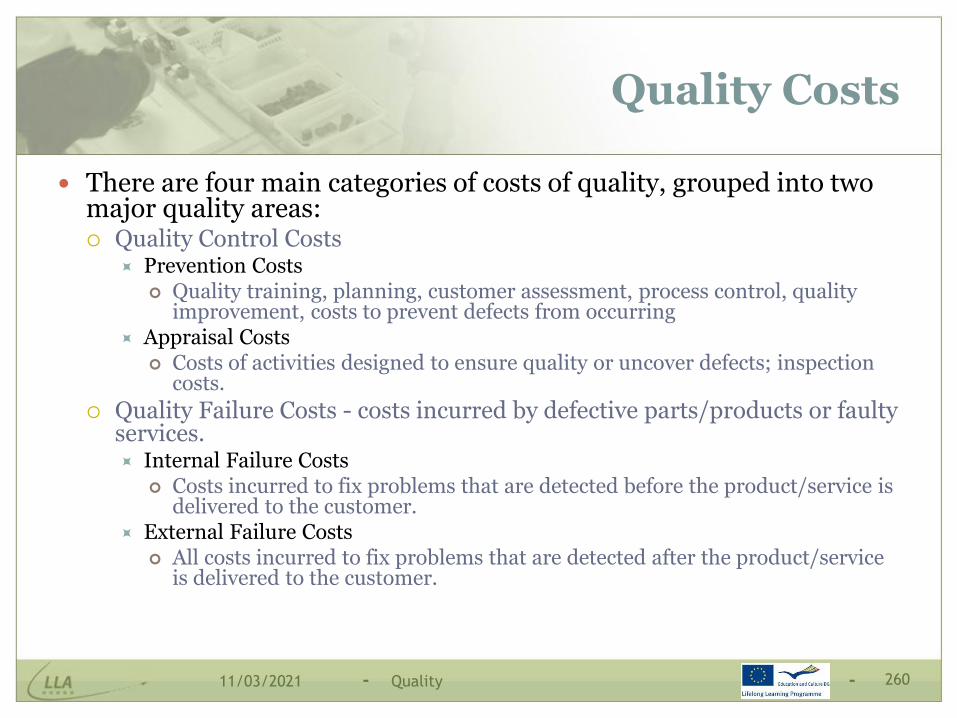
- -
Quality Costs
There are four main categories of costs of quality, grouped into two major quality areas: Quality Control Costs
Prevention Costs Quality training, planning, customer assessment, process control, quality
improvement, costs to prevent defects from occurring Appraisal Costs
Costs of activities designed to ensure quality or uncover defects; inspection costs.
Quality Failure Costs - costs incurred by defective parts/products or faulty services. Internal Failure Costs
Costs incurred to fix problems that are detected before the product/service is delivered to the customer.
External Failure Costs All costs incurred to fix problems that are detected after the product/service
is delivered to the customer.
Quality 26011/03/2021

- -
Prevention Costs
Costs associated with preventing poor quality products from reaching the customer: Quality planning costs
Preventing defects before they happen Quality improvement programmes and quality engineering Supplier evaluations
Quality training costs Training on quality, reliability, worker training and cross-training
Product design costs Design reviews Design, development and installation of quality measurement and test equipments Product qualification Reliability studies
Process design costs Acquisition analysis and reporting of quality data Preventive maintenance Process capability studies
Quality 26111/03/2021

- -
Appraisal Costs
Costs incurred to identify defective products before they are shipped to customers or other tasks performed to ensure that the process is acceptable -costs of testing, evaluating and inspecting quality Test and inspection of raw material, goods in process, finished goods Maintenance and calibration Line quality engineering Vendor rejects Process capability measurement control Product acceptance Prototype inspection and tests Receiving inspection and tests Product engineering review and shipping release Supplier surveillance Quality audits Laboratory or other measurement service Setup for test and inspection Field testing
Quality 26211/03/2021

- -
Internal Failure Costs
Costs incurred when poor quality products are discovered during appraisal process – costs of scrap, rework, repair and material loss Faulty goods or scraps/rejects.
Design changes
Trouble-shooting or defect failure analysis.
Re-inspection of reworked products
Downgrading
Downtime due to defects
Engineering change orders
Purchasing change orders
Re-testing
Material procurement
Material review activity
Rework costs
Quality 26311/03/2021

- -
External Failure Costs
Costs incurred when a defect is discovered after the customer receives the service or product, including returns, repairs, recalls Complaints and loss of customer goodwill
Lost sales costs
Warranty claims
Product returns, recall, and corrective action costs
Product reliability compensation
Product liability (insurance and settlements)
Field maintenance and product service
Replacement inventories
Strained distributor relations
Quality 26411/03/2021

- -
Co
st o
f d
etec
tio
n a
nd
co
rrec
tio
n
Process Final testing Customer
Where defect is detected
Early detection/prevention is less costly
May be less by a factor of 10
Costs of Detecting Defects
Quality 26511/03/2021

- -
Bibliography and Useful Links
Learning to See, Mike Rother, John Shook, The Lean Enterprise Institute, Inc., 1998
Gemba Kaizen, Masaaki Imai, Institutul Kaizen Romania
Toyota Production System, Taiichi Ohno, Institutul Kaizen Romania
Shigeo Shingo, Le système Shingo. Les clés de l'amélioration de la production, Les Éditions d'Organisation, Paris, 1990
www.lean.org
www.6-sigma.com
www.sixsigma.co.uk
www.lean.roCristina Musat - UTBv
Quality 26611/03/2021