Embed Size (px)
Citation preview
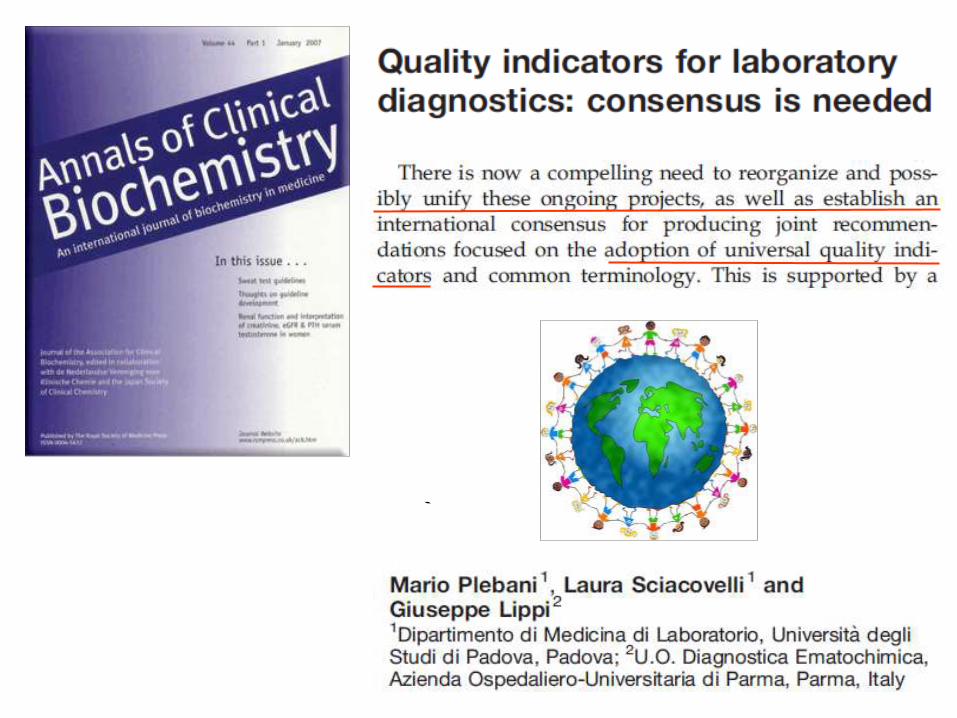
Quality in laboratory medicine
Quality indicators (QIs): definition and aims
QIs in laboratory medicine
QIs and state-of-the art
QIs: harmonization and performance criteria
QIs and state-of-the art
Take home messages
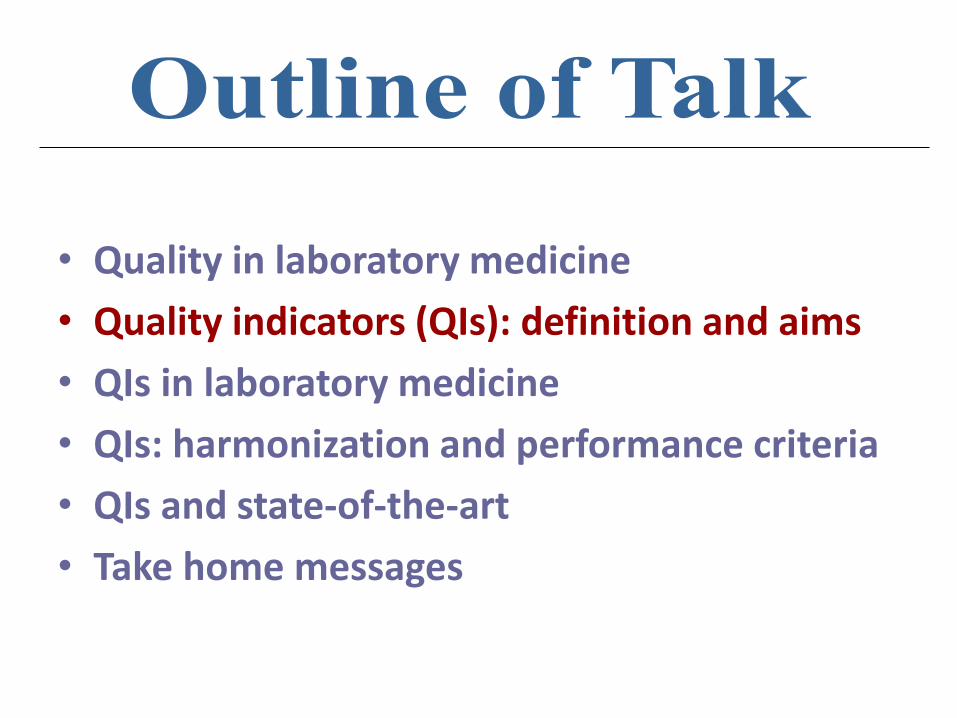
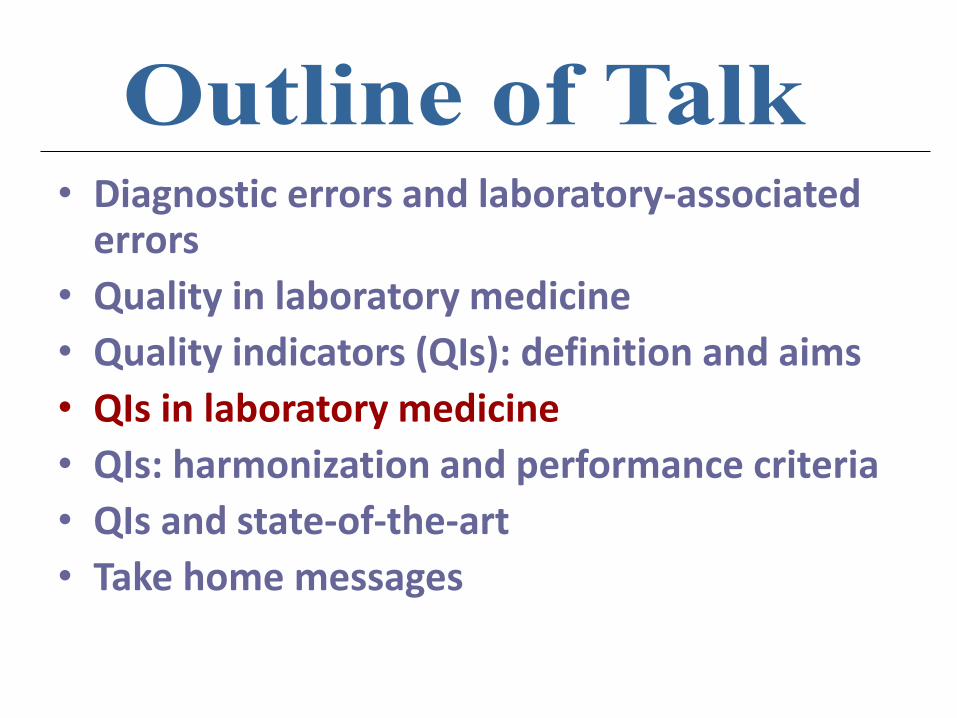
• Quality in laboratory medicine
• Quality indicators (QIs): definition and aims
• QIs in laboratory medicine
• QIs: harmonization and performance criteria
• QIs and state-of-the-art
• Take home messages
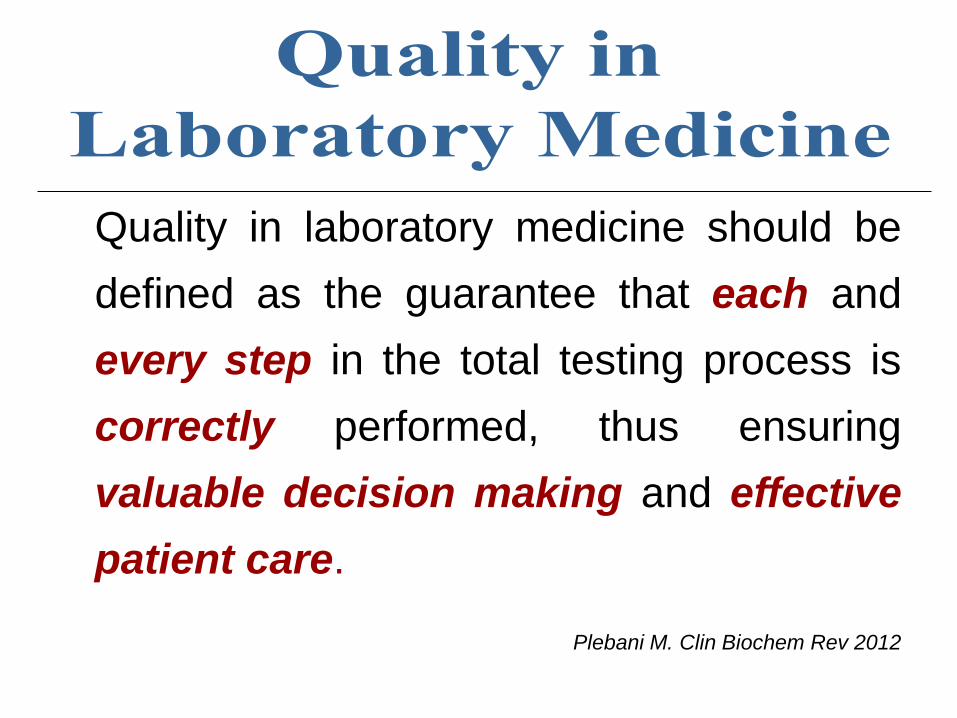
Quality in laboratory medicine should be
defined as the guarantee that each and
every step in the total testing process is
correctly performed, thus ensuring
valuable decision making and effective
patient care.
Plebani M. Clin Biochem Rev 2012
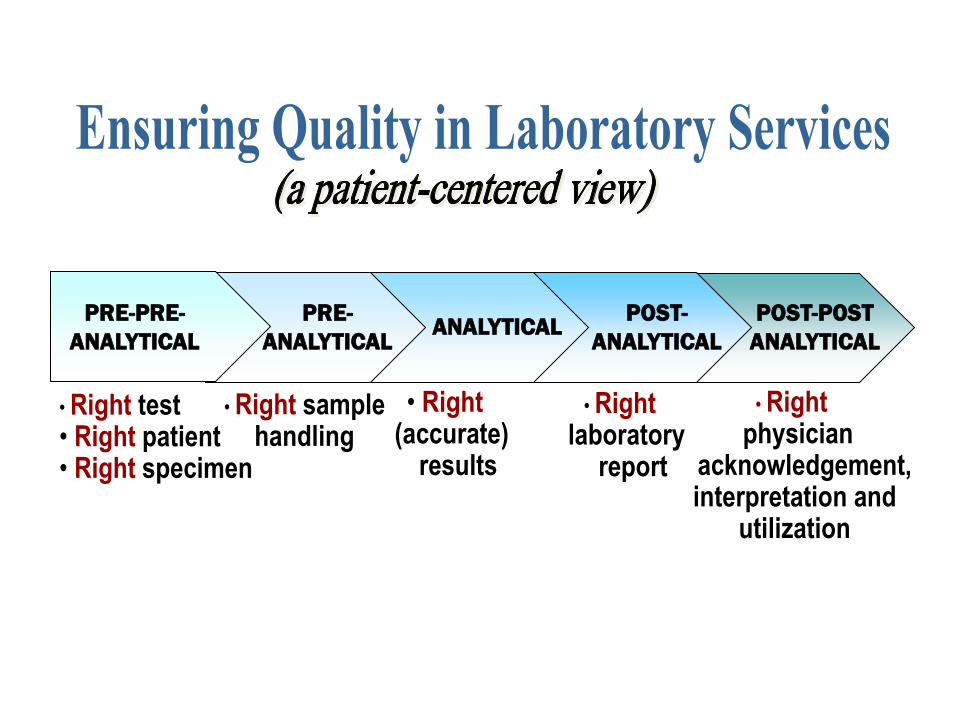
• Right test • Right patient • Right specimen
• Right sample handling
• Right (accurate) results
• Right laboratory
report
• Right physician
acknowledgement, interpretation and
utilization
PRE-PRE-
ANALYTICAL
PRE-
ANALYTICAL ANALYTICAL
POST-
ANALYTICAL
POST-POST
ANALYTICAL
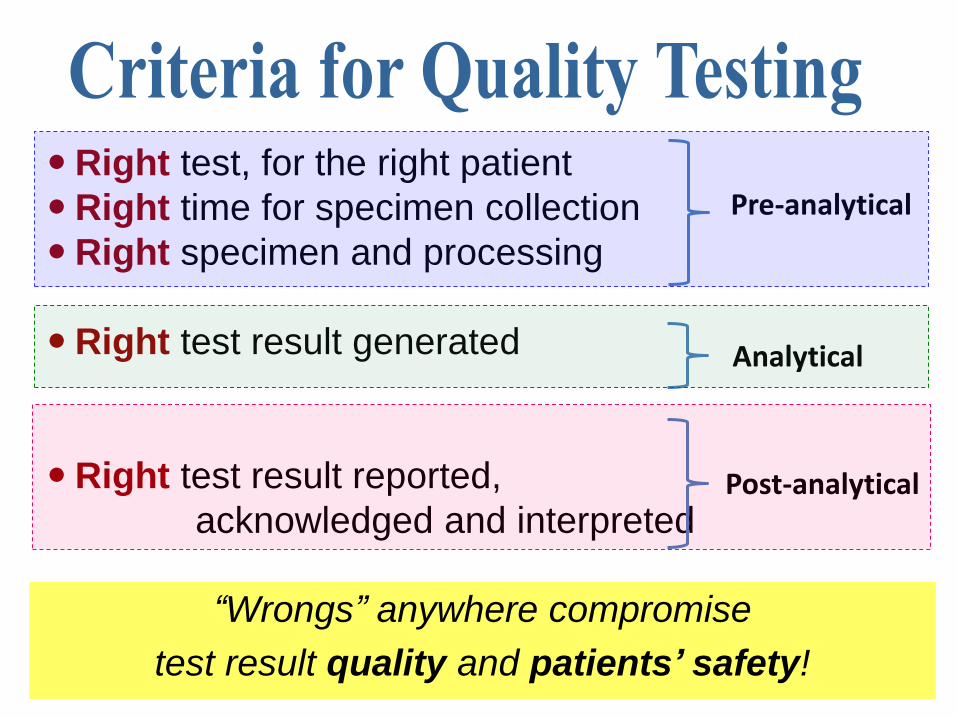
Right test, for the right patient
Right time for specimen collection
Right specimen and processing
Right test result generated
Right test result reported,
acknowledged and interpreted
Pre-analytical
Analytical
Post-analytical
“Wrongs” anywhere compromise
test result quality and patients’ safety!
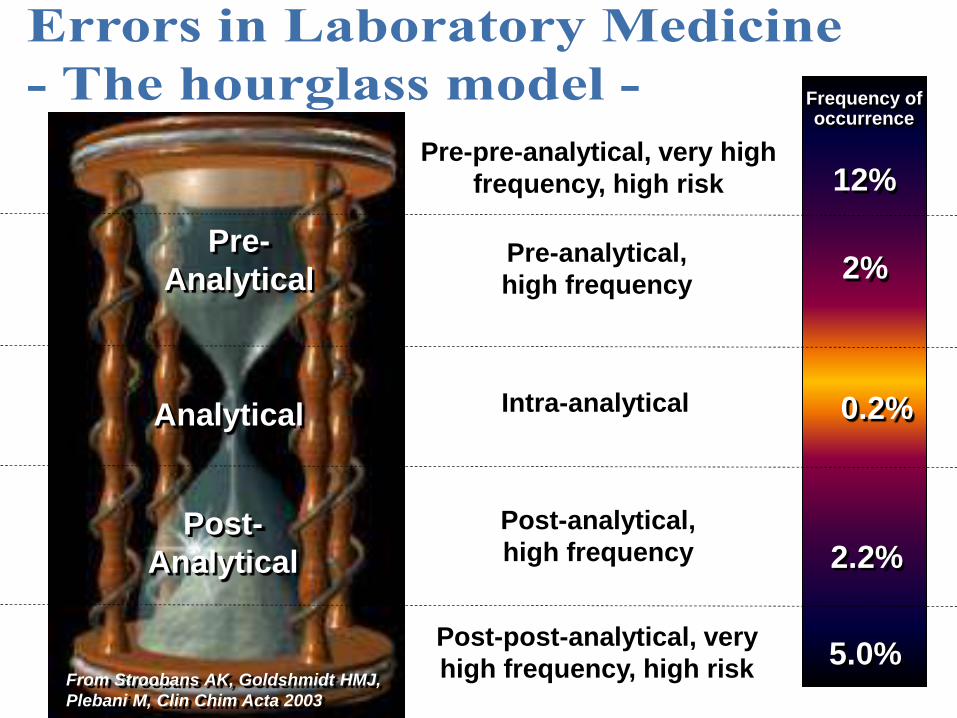
Pre-
Analytical
Analytical
Post-
Analytical
12%
Frequency of occurrence
Pre-pre-analytical, very high
frequency, high risk
Pre-analytical,
high frequency 2%
0.2%
2.2%
5.0% From Stroobans AK, Goldshmidt HMJ,
Plebani M, Clin Chim Acta 2003
Post-analytical,
high frequency
Post-post-analytical, very
high frequency, high risk
Intra-analytical
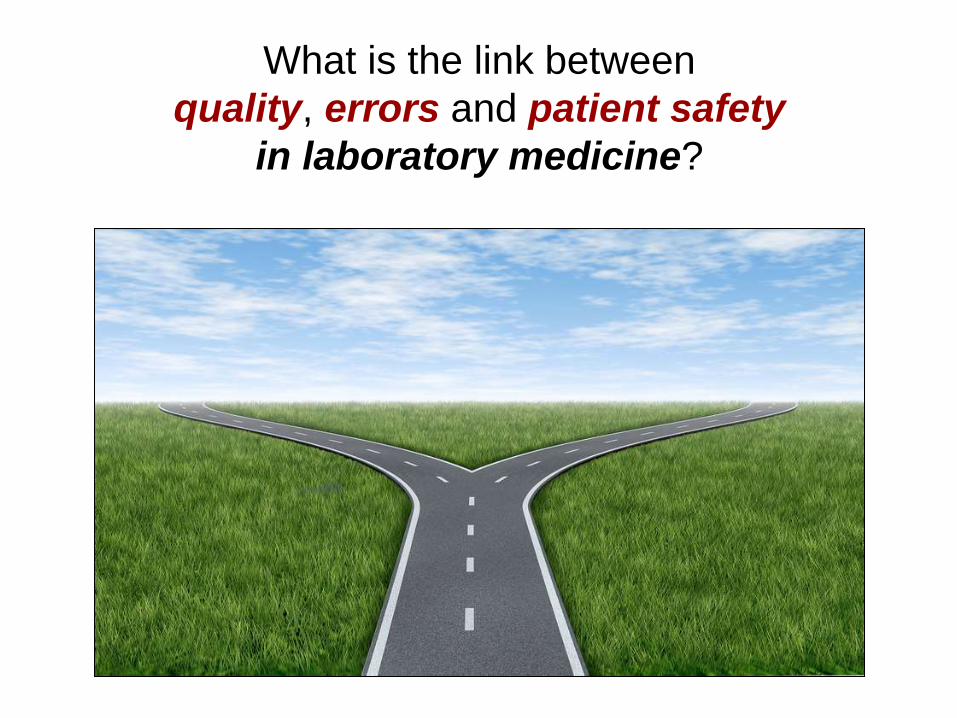
What is the link between
quality, errors and patient safety
in laboratory medicine?
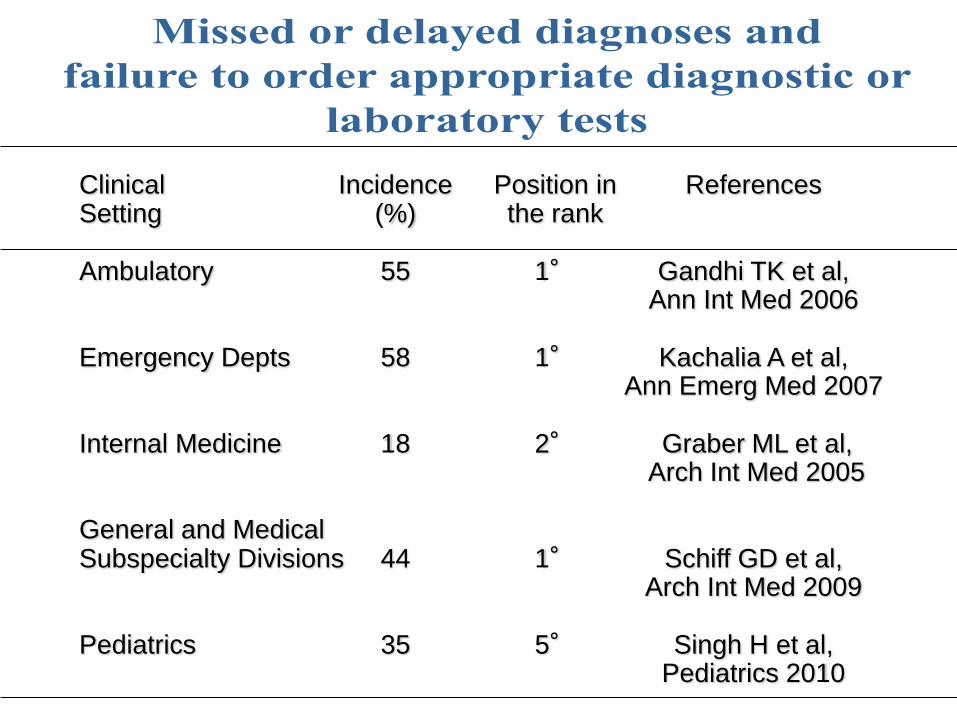
Clinical Incidence Position in References Setting (%) the rank Ambulatory 55 1° Gandhi TK et al, Ann Int Med 2006 Emergency Depts 58 1° Kachalia A et al, Ann Emerg Med 2007 Internal Medicine 18 2° Graber ML et al, Arch Int Med 2005 General and Medical Subspecialty Divisions 44 1° Schiff GD et al, Arch Int Med 2009 Pediatrics 35 5° Singh H et al, Pediatrics 2010
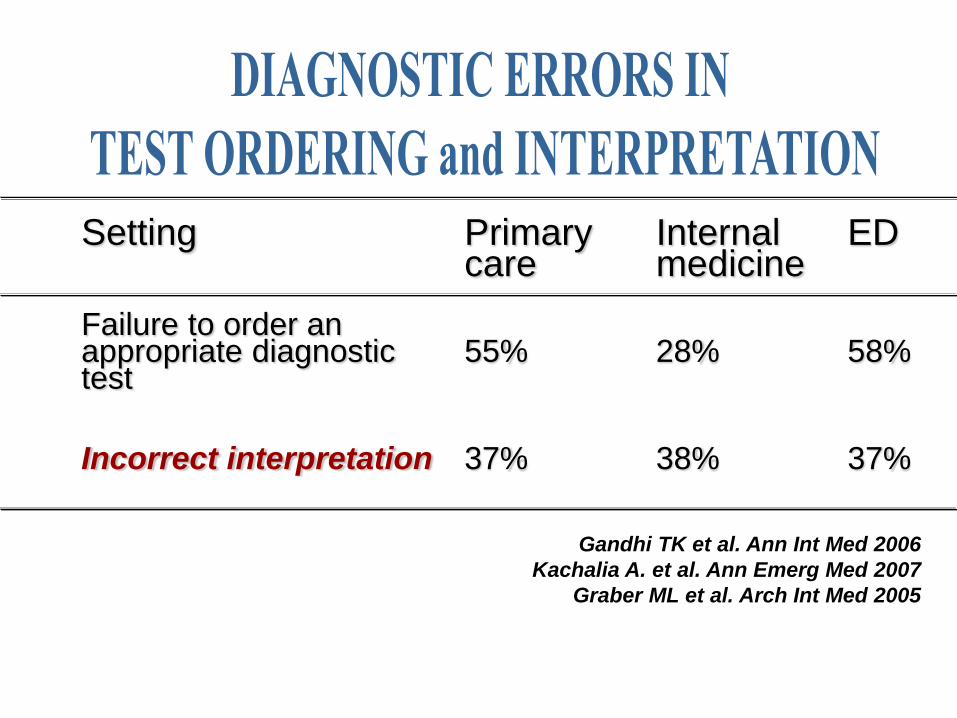
Setting Primary Internal ED care medicine Failure to order an appropriate diagnostic 55% 28% 58% test Incorrect interpretation 37% 38% 37%
Gandhi TK et al. Ann Int Med 2006
Kachalia A. et al. Ann Emerg Med 2007
Graber ML et al. Arch Int Med 2005
• Quality in laboratory medicine
• Quality indicators (QIs): definition and aims
• QIs in laboratory medicine
• QIs: harmonization and performance criteria
• QIs and state-of-the-art
• Take home messages
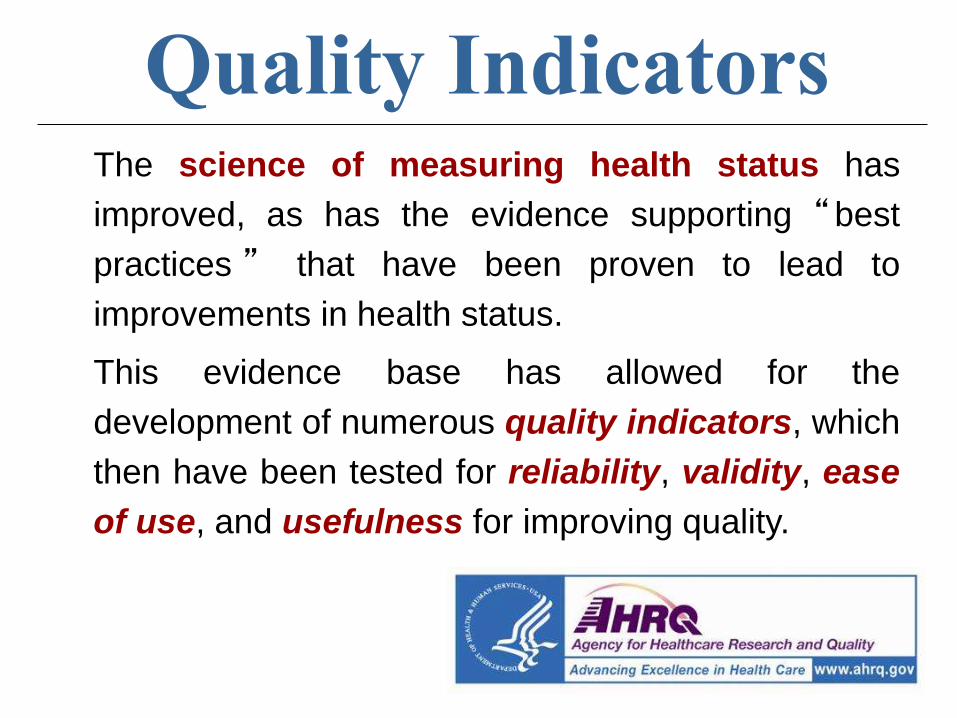
The science of measuring health status has
improved, as has the evidence supporting “best
practices ” that have been proven to lead to
improvements in health status.
This evidence base has allowed for the
development of numerous quality indicators, which
then have been tested for reliability, validity, ease
of use, and usefulness for improving quality.
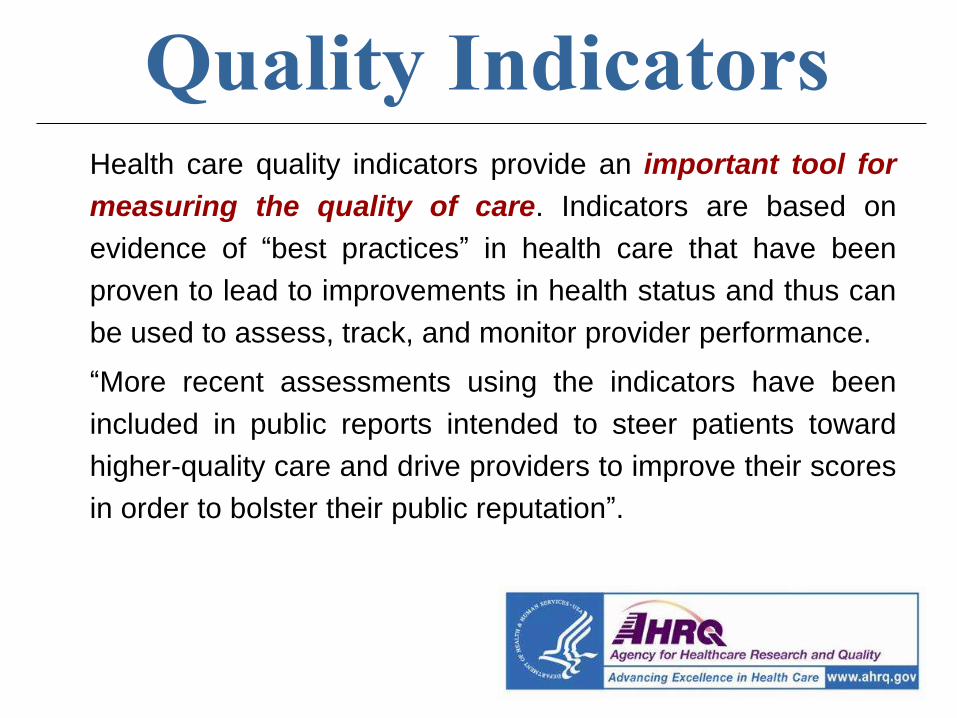
Health care quality indicators provide an important tool for
measuring the quality of care. Indicators are based on
evidence of “best practices” in health care that have been
proven to lead to improvements in health status and thus can
be used to assess, track, and monitor provider performance.
“More recent assessments using the indicators have been
included in public reports intended to steer patients toward
higher-quality care and drive providers to improve their scores
in order to bolster their public reputation”.
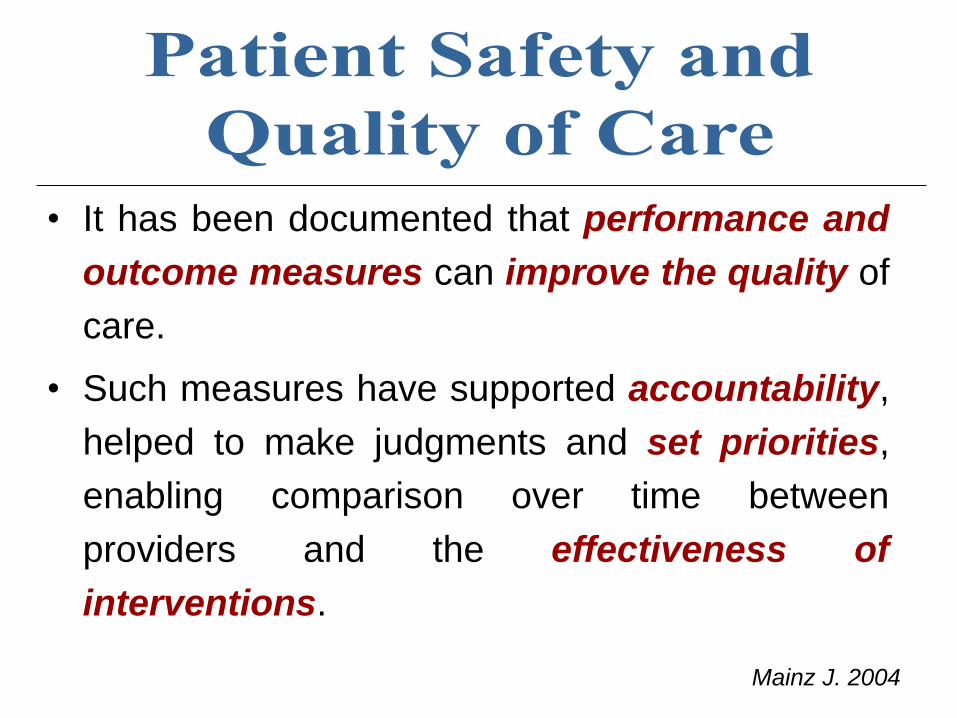
• It has been documented that performance and
outcome measures can improve the quality of
care.
• Such measures have supported accountability,
helped to make judgments and set priorities,
enabling comparison over time between
providers and the effectiveness of
interventions.
Mainz J. 2004
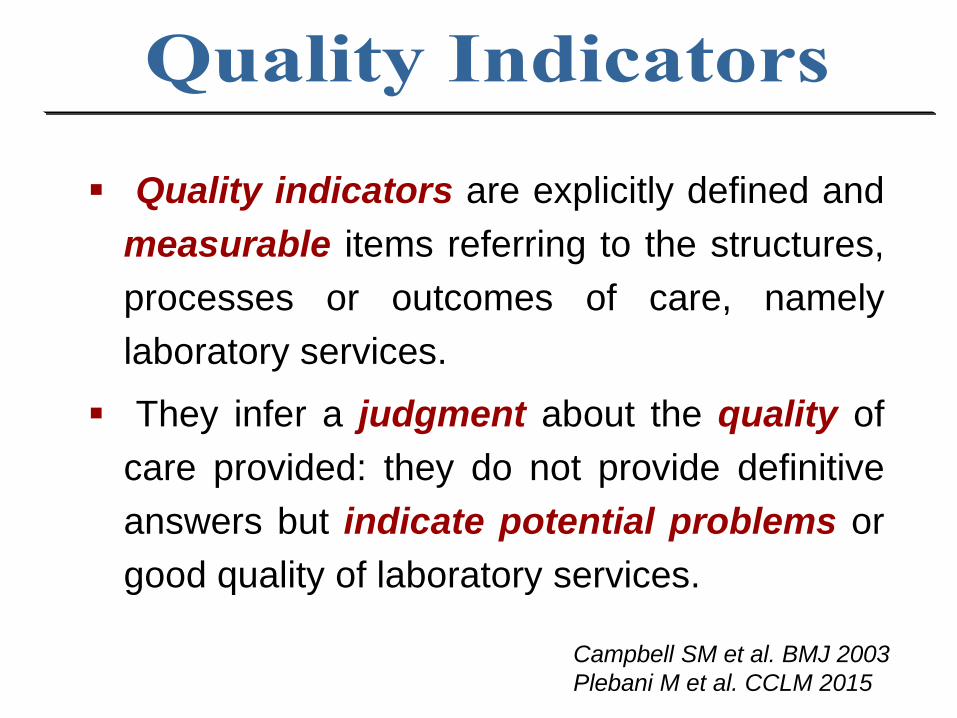
Quality indicators are explicitly defined and
measurable items referring to the structures,
processes or outcomes of care, namely
laboratory services.
They infer a judgment about the quality of
care provided: they do not provide definitive
answers but indicate potential problems or
good quality of laboratory services.
Campbell SM et al. BMJ 2003
Plebani M et al. CCLM 2015
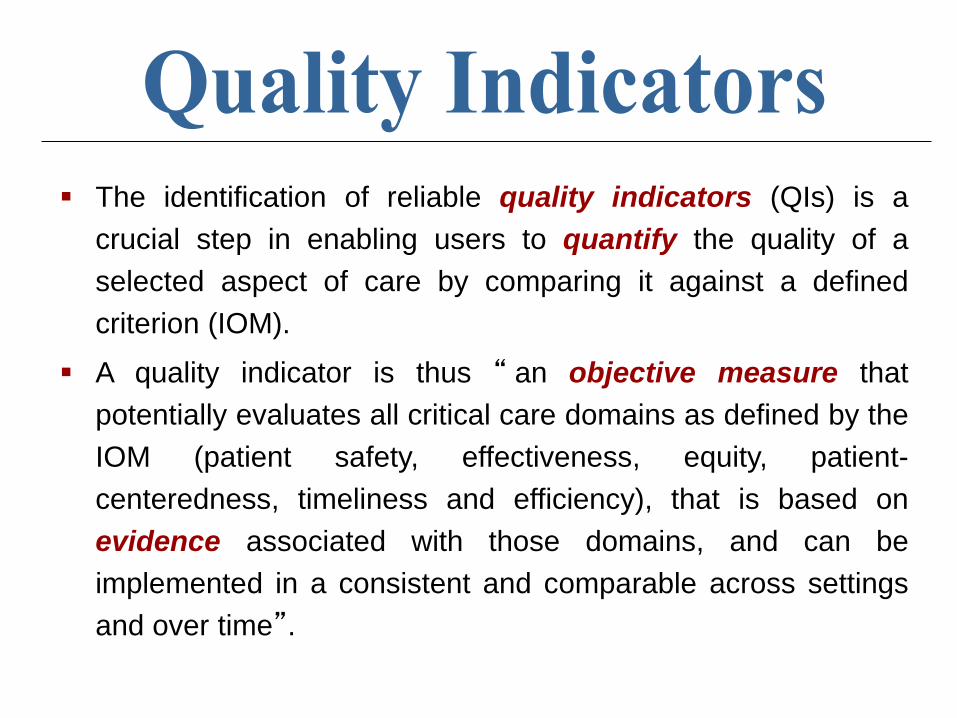
The identification of reliable quality indicators (QIs) is a
crucial step in enabling users to quantify the quality of a
selected aspect of care by comparing it against a defined
criterion (IOM).
A quality indicator is thus “ an objective measure that
potentially evaluates all critical care domains as defined by the
IOM (patient safety, effectiveness, equity, patient-
centeredness, timeliness and efficiency), that is based on
evidence associated with those domains, and can be
implemented in a consistent and comparable across settings
and over time”.
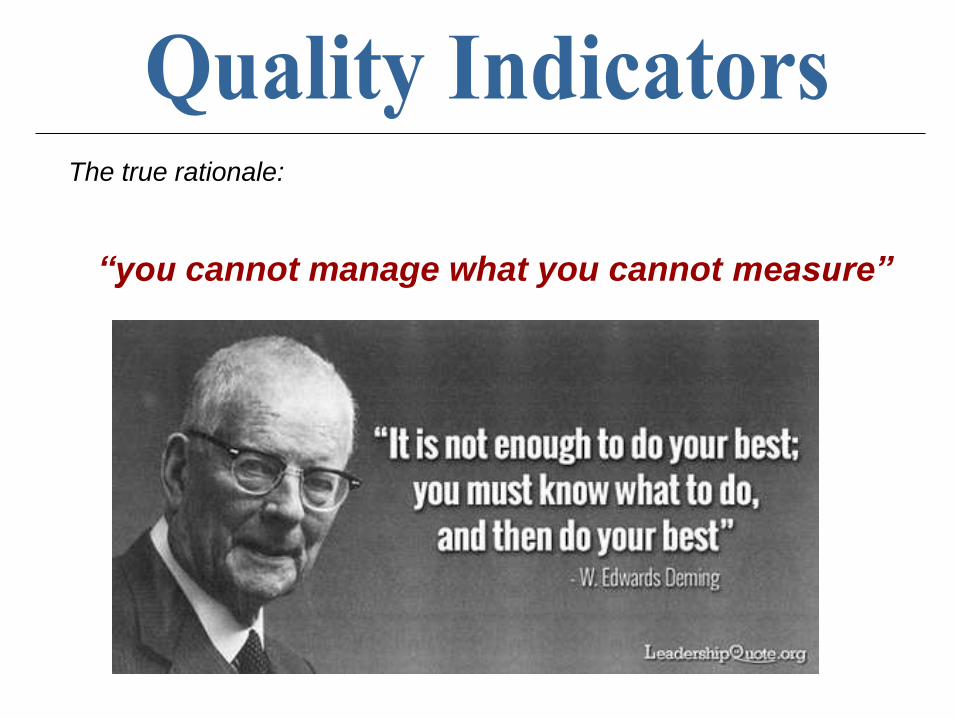
The true rationale:
“you cannot manage what you cannot measure”
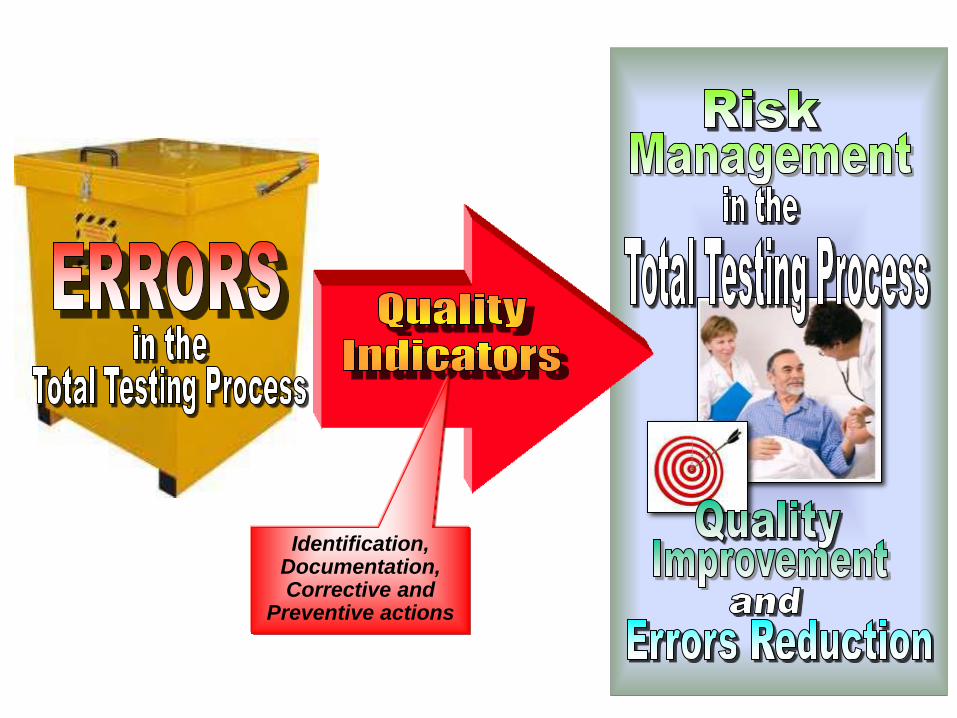
Identification, Documentation, Corrective and
Preventive actions
• Diagnostic errors and laboratory-associated errors
• Quality in laboratory medicine
• Quality indicators (QIs): definition and aims
• QIs in laboratory medicine
• QIs: harmonization and performance criteria
• QIs and state-of-the-art
• Take home messages
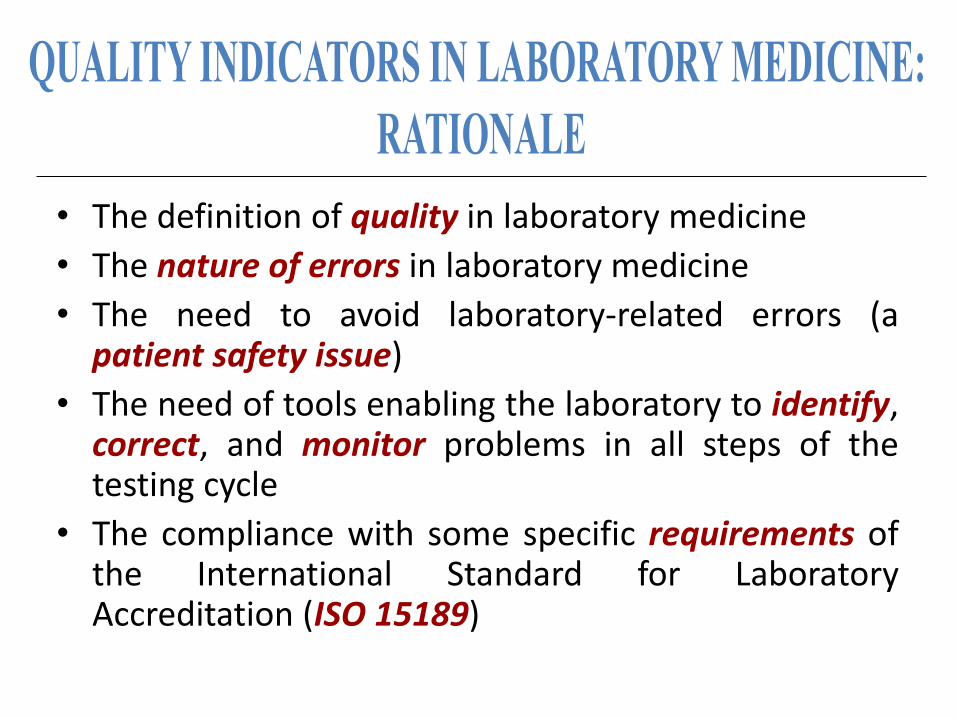
• The definition of quality in laboratory medicine
• The nature of errors in laboratory medicine
• The need to avoid laboratory-related errors (a patient safety issue)
• The need of tools enabling the laboratory to identify, correct, and monitor problems in all steps of the testing cycle
• The compliance with some specific requirements of the International Standard for Laboratory Accreditation (ISO 15189)
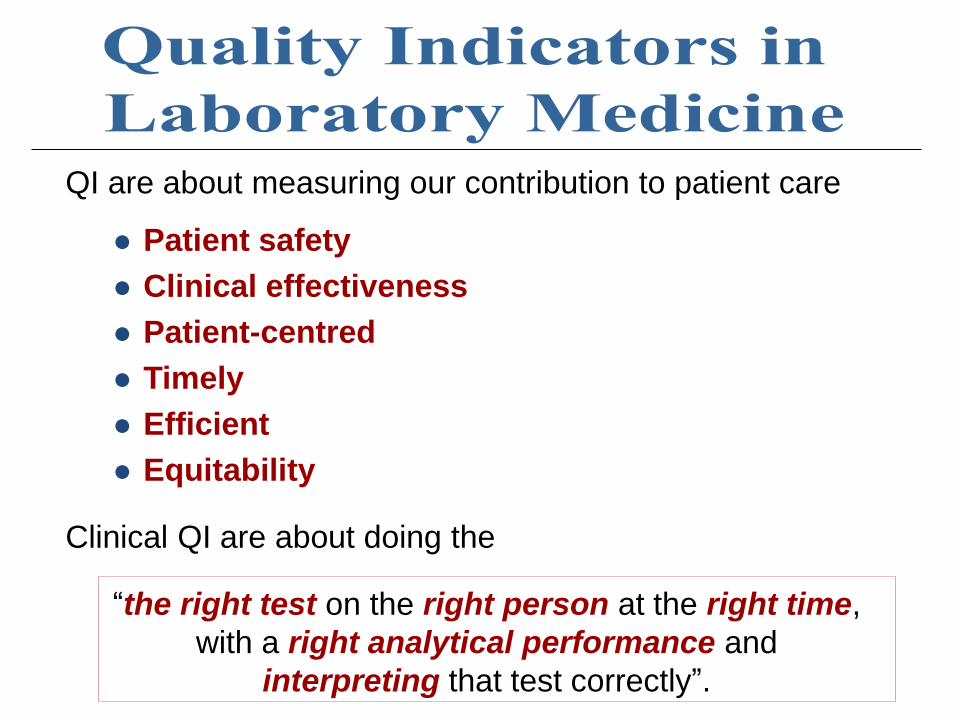
QI are about measuring our contribution to patient care
Patient safety
Clinical effectiveness
Patient-centred
Timely
Efficient
Equitability
Clinical QI are about doing the
“the right test on the right person at the right time,
with a right analytical performance and
interpreting that test correctly”.
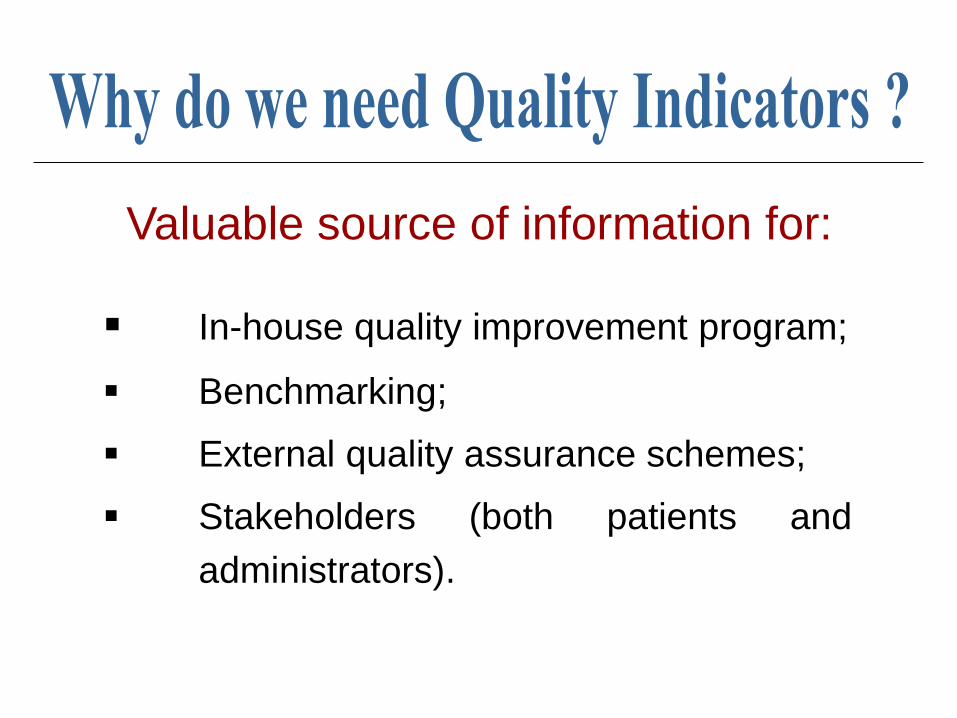
In-house quality improvement program;
Benchmarking;
External quality assurance schemes;
Stakeholders (both patients and
administrators).
Valuable source of information for:
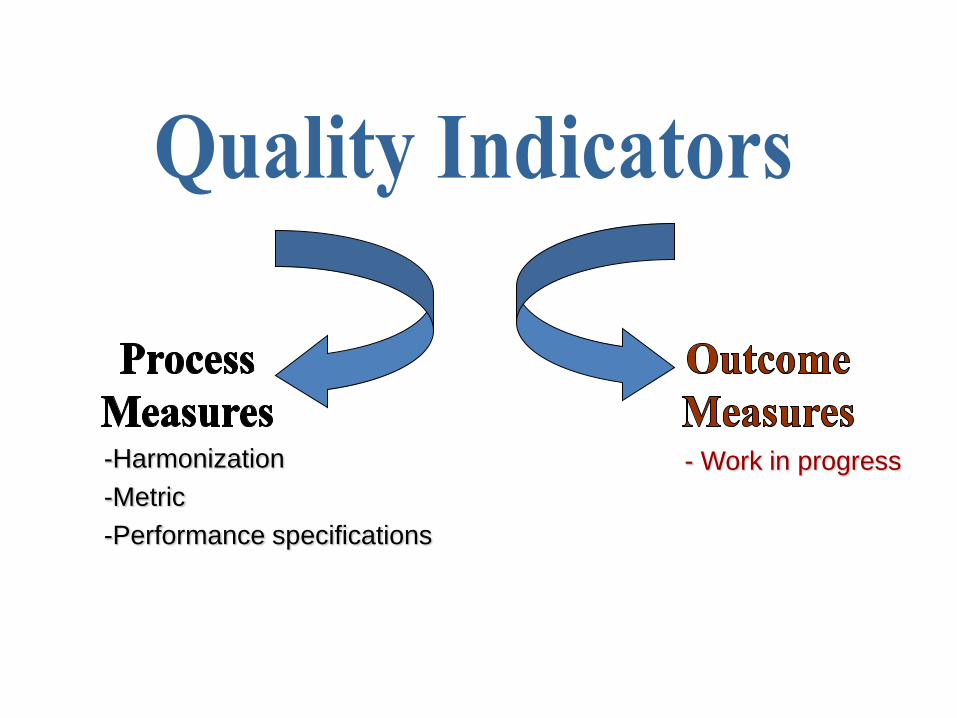
- Work in progress -Harmonization
-Metric
-Performance specifications
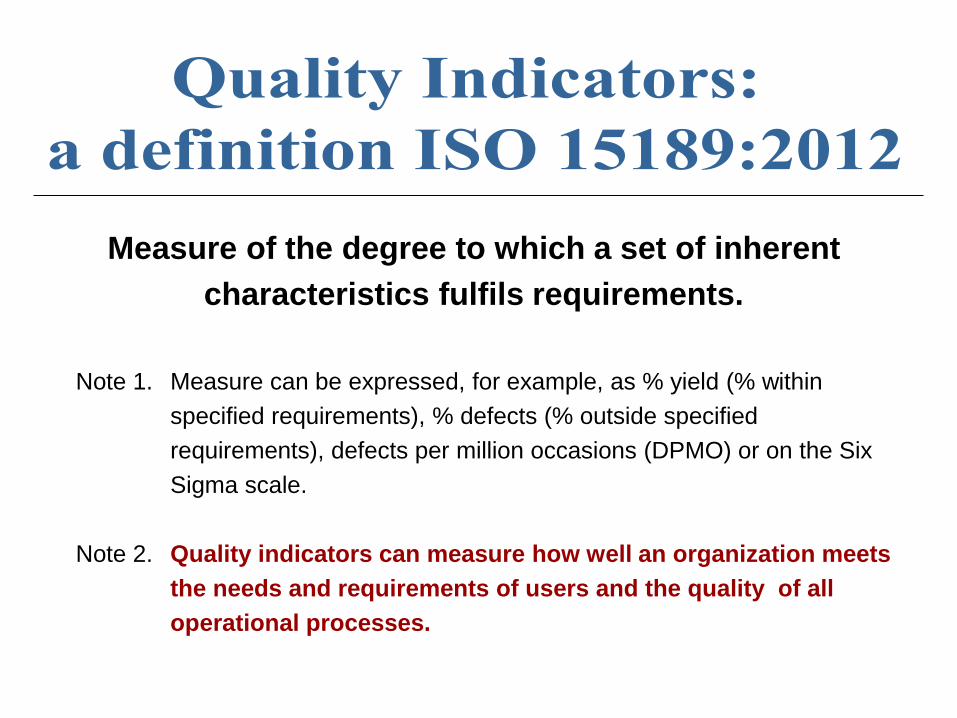
Measure of the degree to which a set of inherent
characteristics fulfils requirements.
Note 1. Measure can be expressed, for example, as % yield (% within
specified requirements), % defects (% outside specified
requirements), defects per million occasions (DPMO) or on the Six
Sigma scale.
Note 2. Quality indicators can measure how well an organization meets
the needs and requirements of users and the quality of all
operational processes.

4.14.7. The laboratory shall establish quality
indicators to monitor and evaluate performance
throughout critical aspects of pre-examination,
examination and post-examination processes.
Example: number of unacceptable samples, number of
errors at registration and/or accession, number of
corrected reports
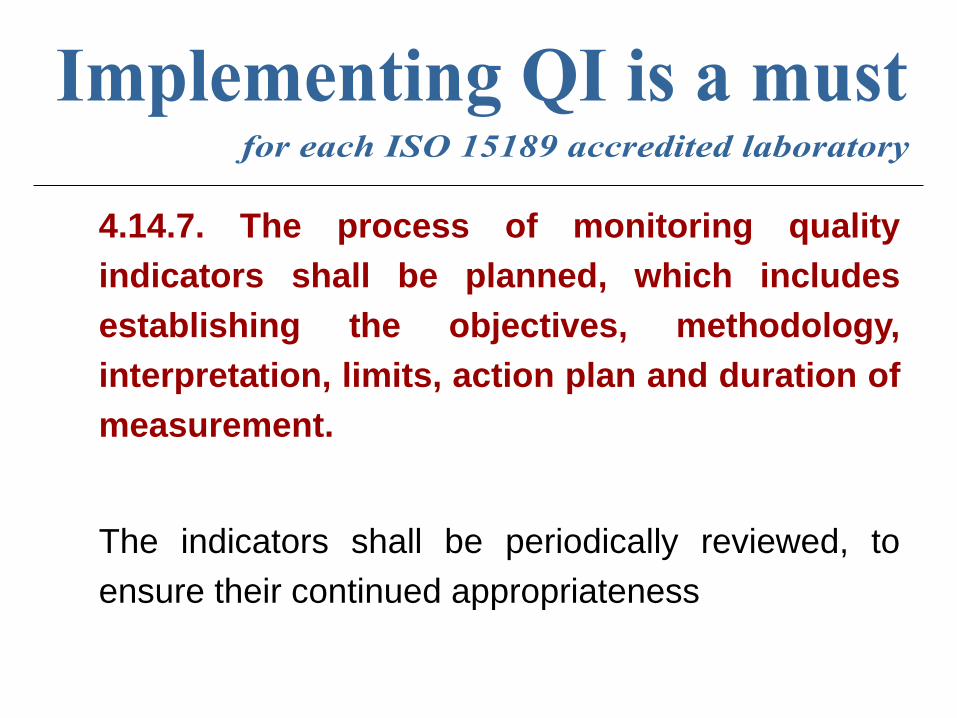
4.14.7. The process of monitoring quality
indicators shall be planned, which includes
establishing the objectives, methodology,
interpretation, limits, action plan and duration of
measurement.
The indicators shall be periodically reviewed, to
ensure their continued appropriateness


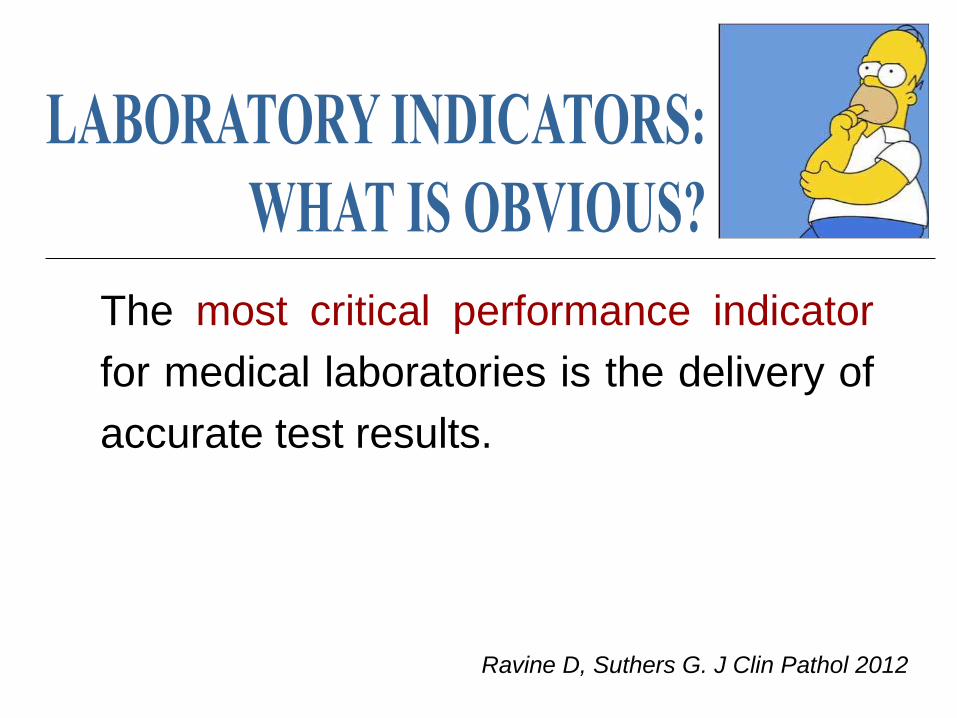
The most critical performance indicator
for medical laboratories is the delivery of
accurate test results.
Ravine D, Suthers G. J Clin Pathol 2012
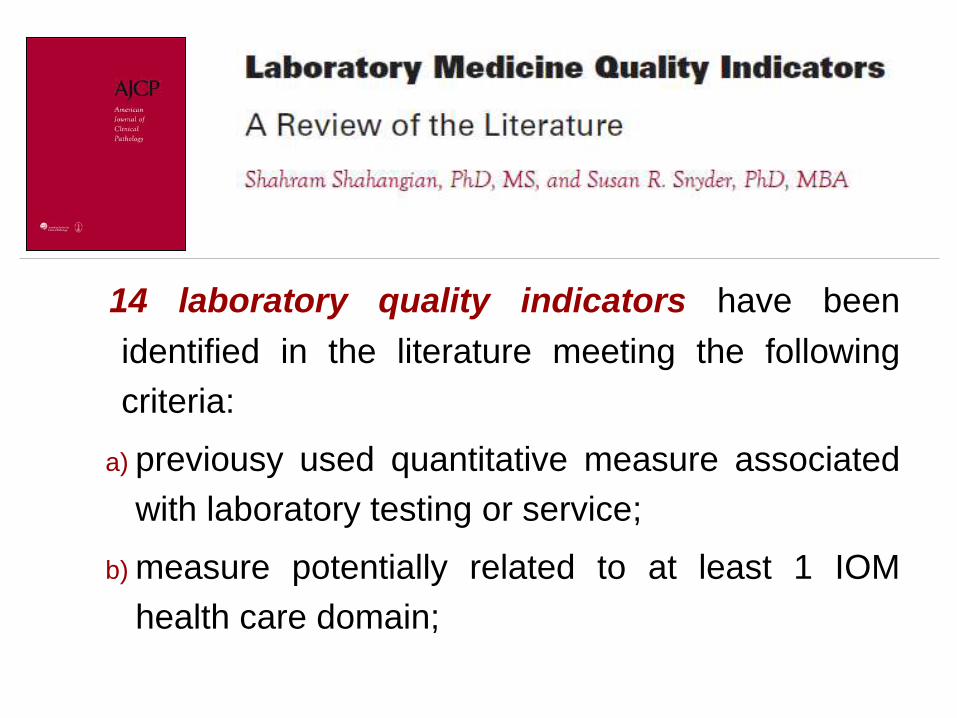
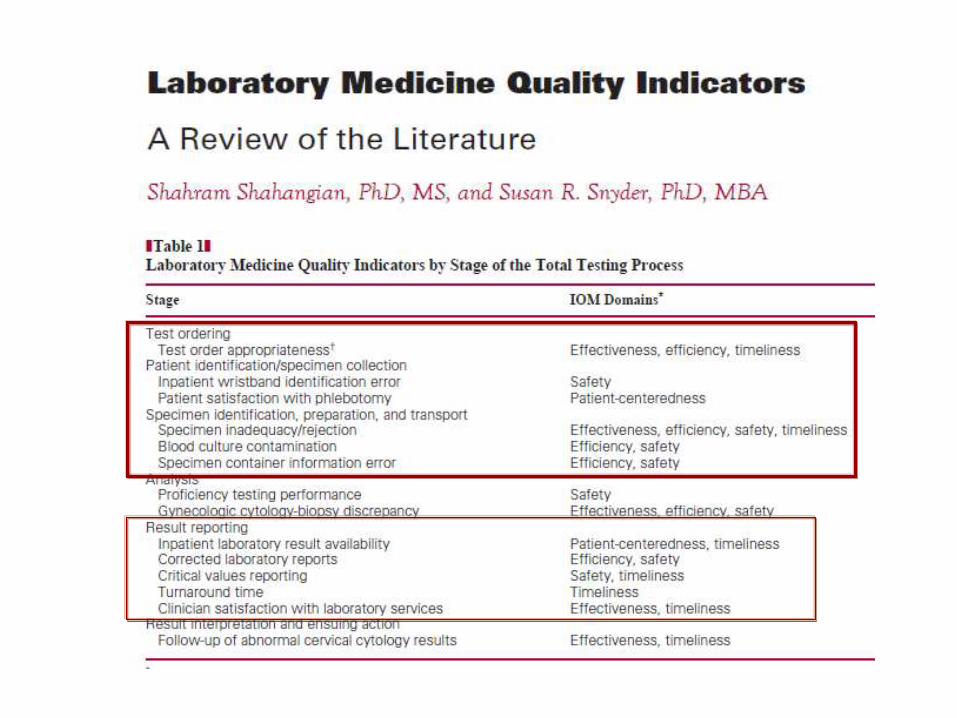
14 laboratory quality indicators have been
identified in the literature meeting the following
criteria:
a) previousy used quantitative measure associated
with laboratory testing or service;
b) measure potentially related to at least 1 IOM
health care domain;

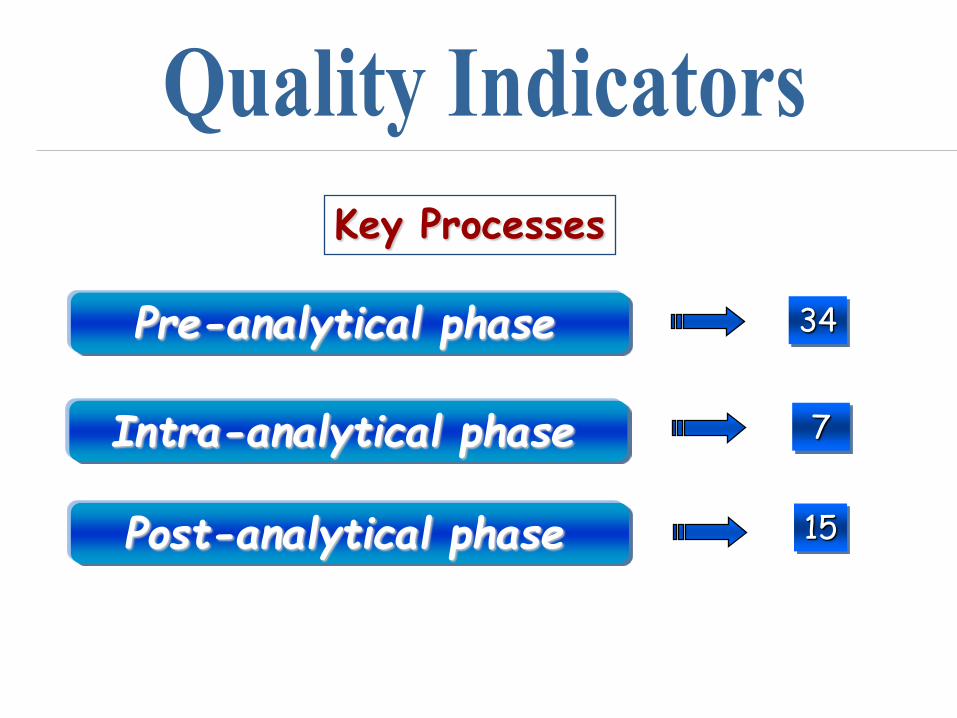
Pre-analytical phase
Post-analytical phase
Intra-analytical phase
Key Processes
34
7
15
• Diagnostic errors and laboratory-associated errors
• Quality in laboratory medicine
• Quality indicators (QIs): definition and aims
• QIs in laboratory medicine
• QIs: harmonization and performance criteria
• QIs and state-of-the-art
• Take home messages
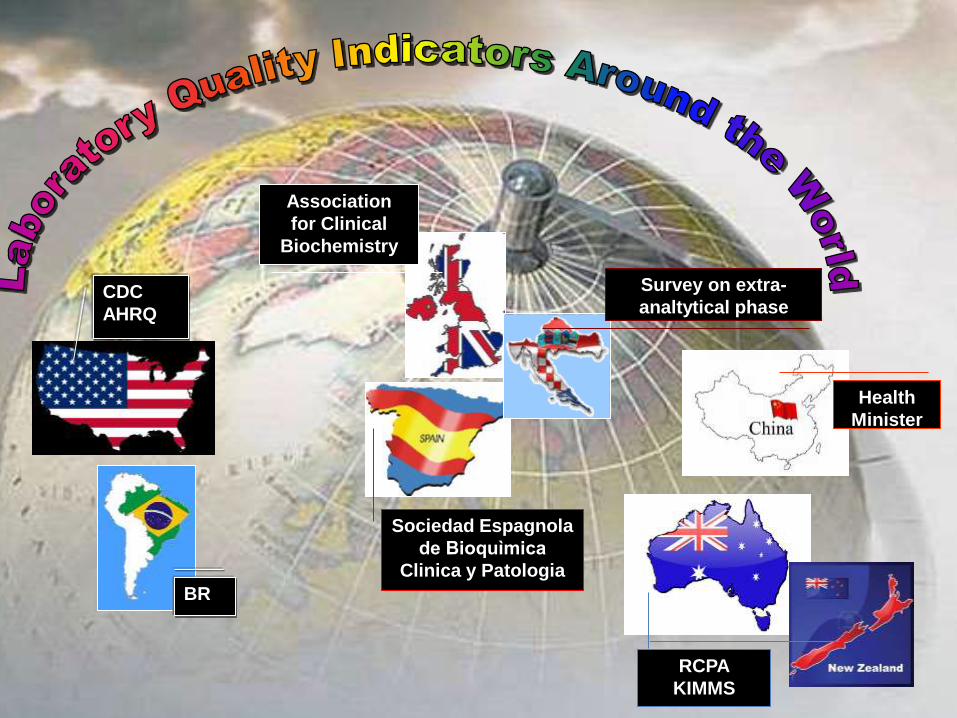
Association
for Clinical
Biochemistry
Sociedad Espagnola
de Bioquìmica
Clinica y Patologia
RCPA
KIMMS
Survey on extra-
analtytical phase
Health
Minister
CDC
AHRQ
BR

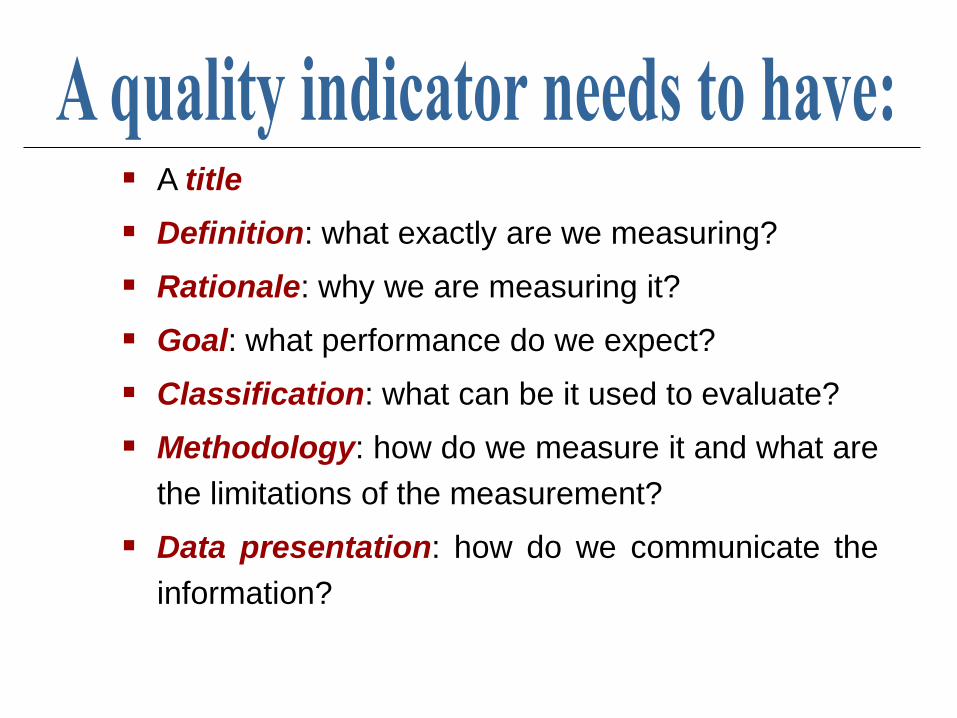
A title
Definition: what exactly are we measuring?
Rationale: why we are measuring it?
Goal: what performance do we expect?
Classification: what can be it used to evaluate?
Methodology: how do we measure it and what are
the limitations of the measurement?
Data presentation: how do we communicate the
information?
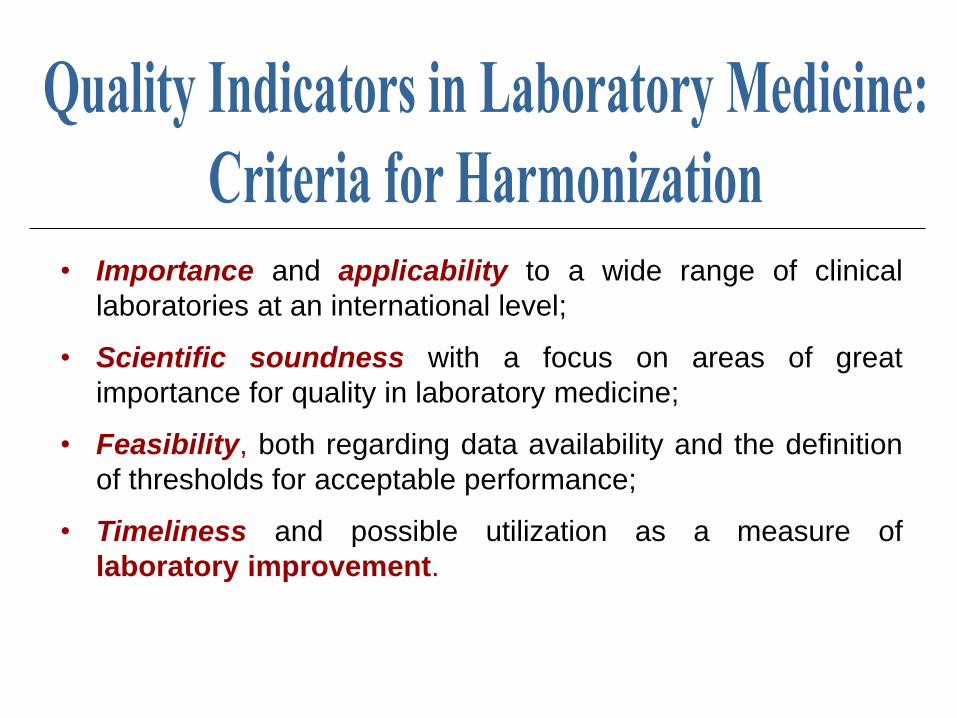
• Importance and applicability to a wide range of clinical
laboratories at an international level;
• Scientific soundness with a focus on areas of great
importance for quality in laboratory medicine;
• Feasibility, both regarding data availability and the definition
of thresholds for acceptable performance;
• Timeliness and possible utilization as a measure of
laboratory improvement.
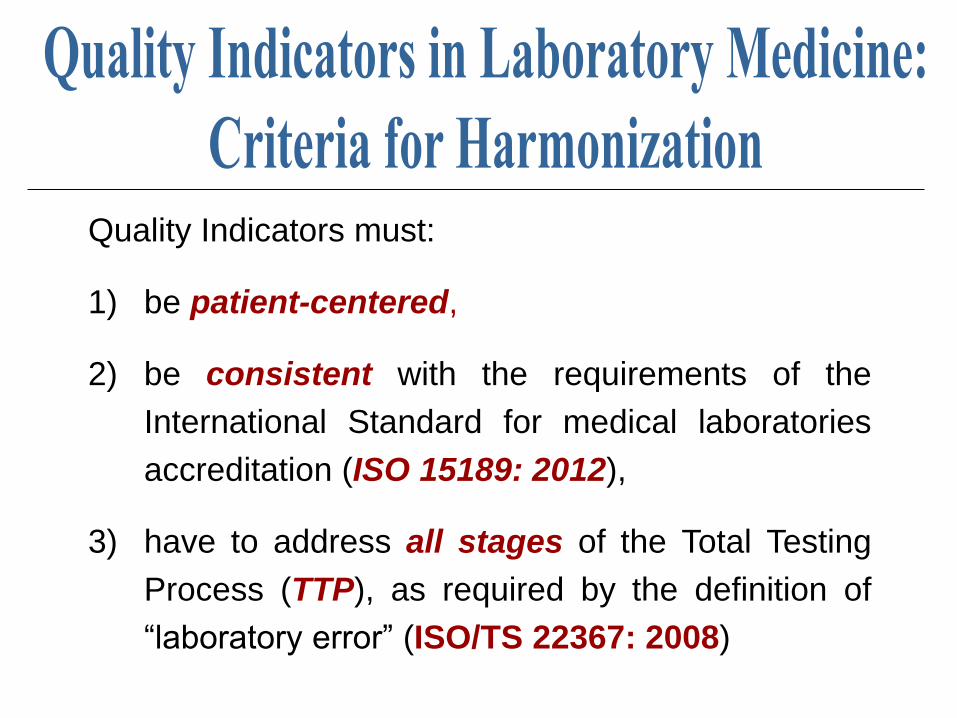
Quality Indicators must:
1) be patient-centered,
2) be consistent with the requirements of the
International Standard for medical laboratories
accreditation (ISO 15189: 2012),
3) have to address all stages of the Total Testing
Process (TTP), as required by the definition of
“laboratory error” (ISO/TS 22367: 2008)
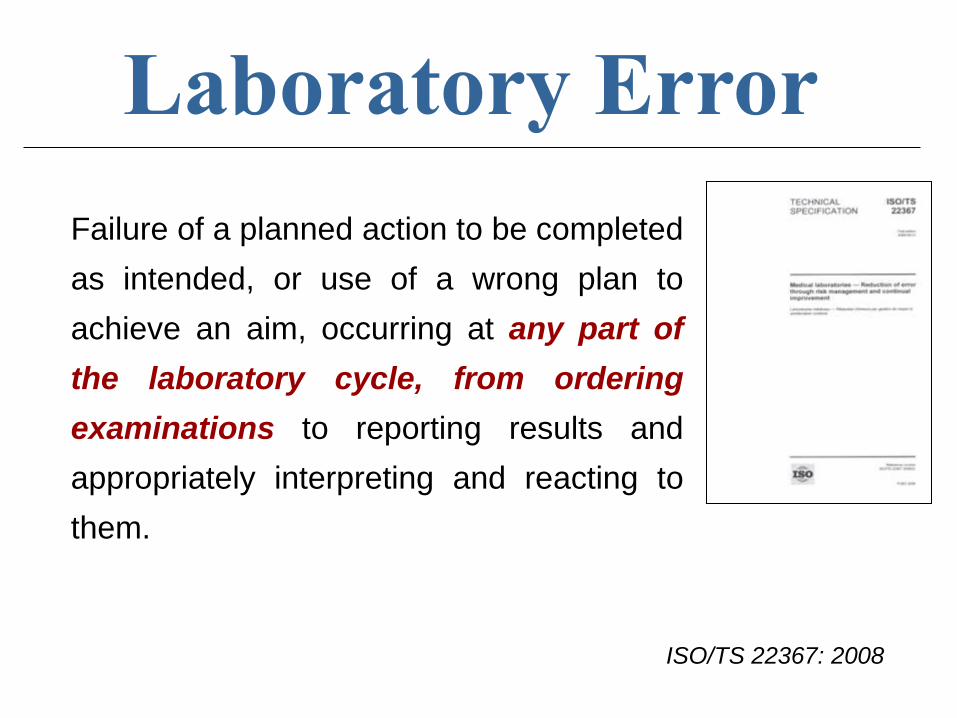
Failure of a planned action to be completed
as intended, or use of a wrong plan to
achieve an aim, occurring at any part of
the laboratory cycle, from ordering
examinations to reporting results and
appropriately interpreting and reacting to
them.
ISO/TS 22367: 2008
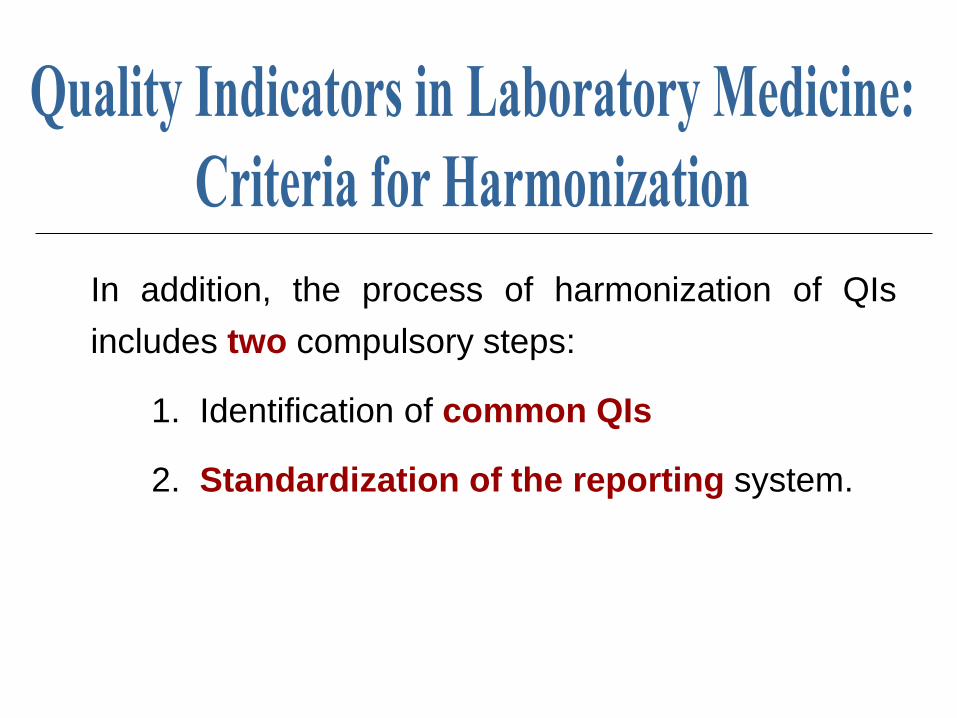
In addition, the process of harmonization of QIs
includes two compulsory steps:
1. Identification of common QIs
2. Standardization of the reporting system.
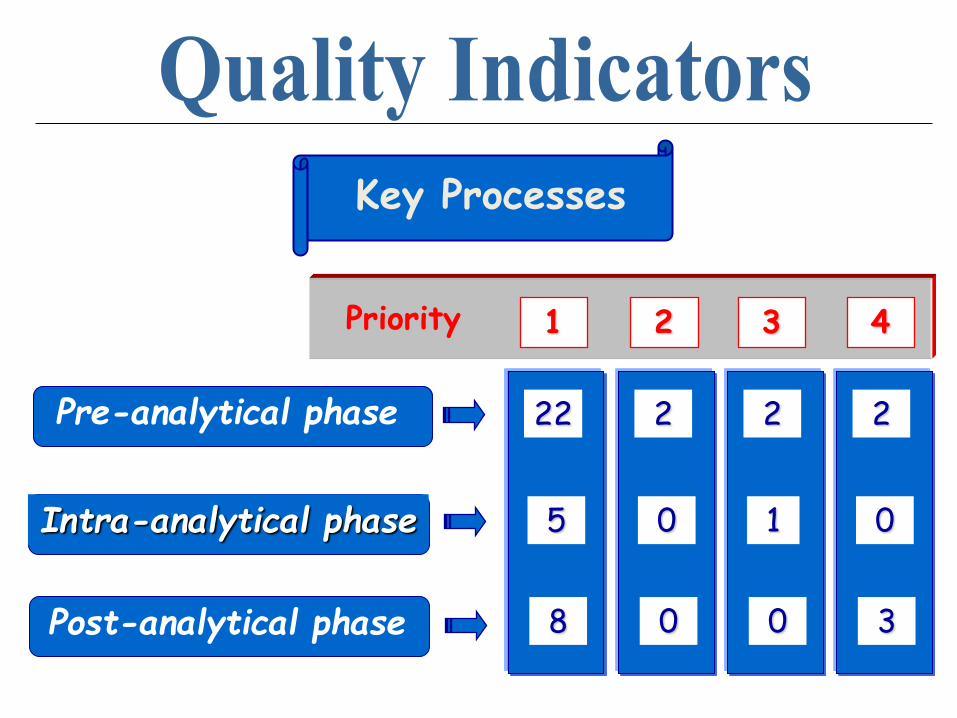
Priority
Pre-analytical phase
Post-analytical phase
Intra-analytical phase
Key Processes
2
0
3
4
2
1
0
3
2
0
0
2
22
5
8
1

Priority
Employee competence
Efficiency of LIS
Client relationship
Support Processes
0
0
0
4
0
0
1
3
2
2
0
2
0
0
0
1
Priority
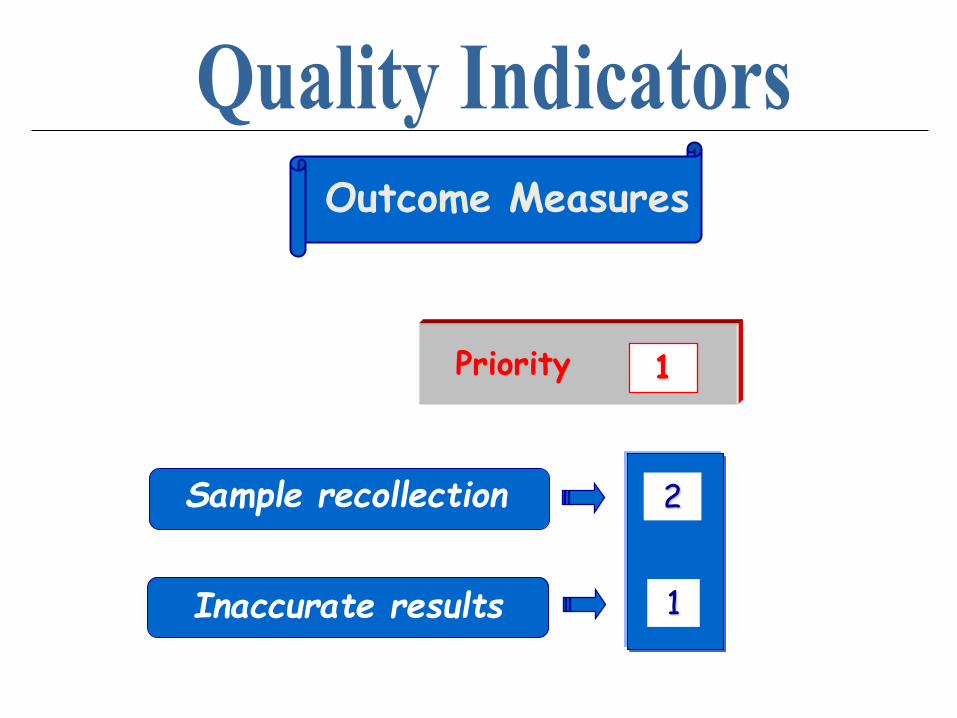
Sample recollection
Inaccurate results
Outcome Measures
2
1
1
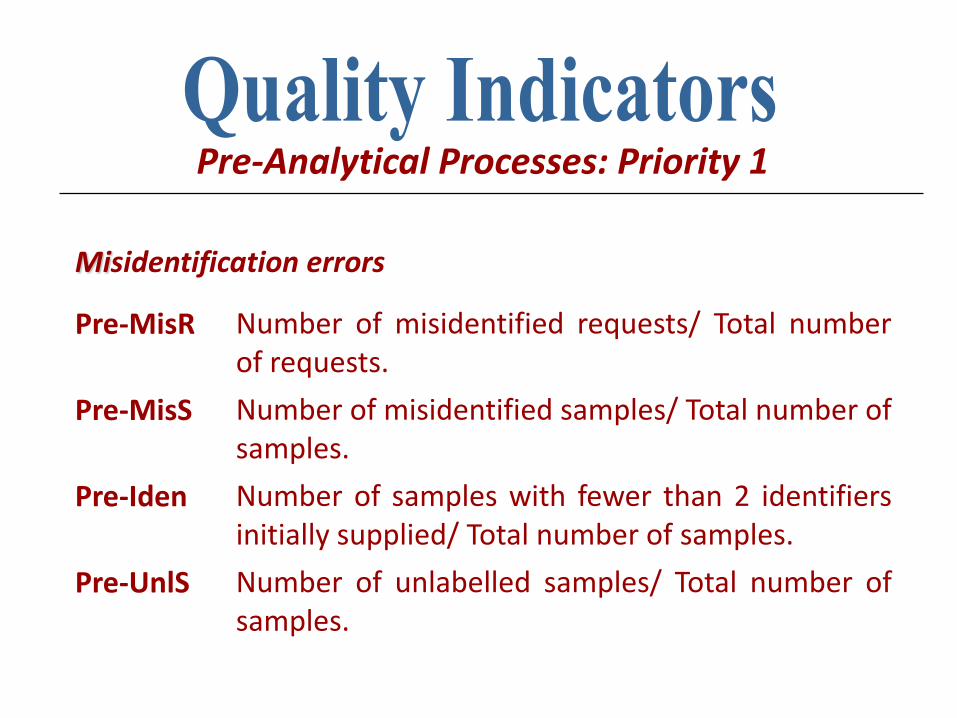
Pre-Analytical Processes: Priority 1
Misidentification errors
Pre-MisR Number of misidentified requests/ Total number of requests.
Pre-MisS Number of misidentified samples/ Total number of samples.
Pre-Iden Number of samples with fewer than 2 identifiers initially supplied/ Total number of samples.
Pre-UnlS Number of unlabelled samples/ Total number of samples.
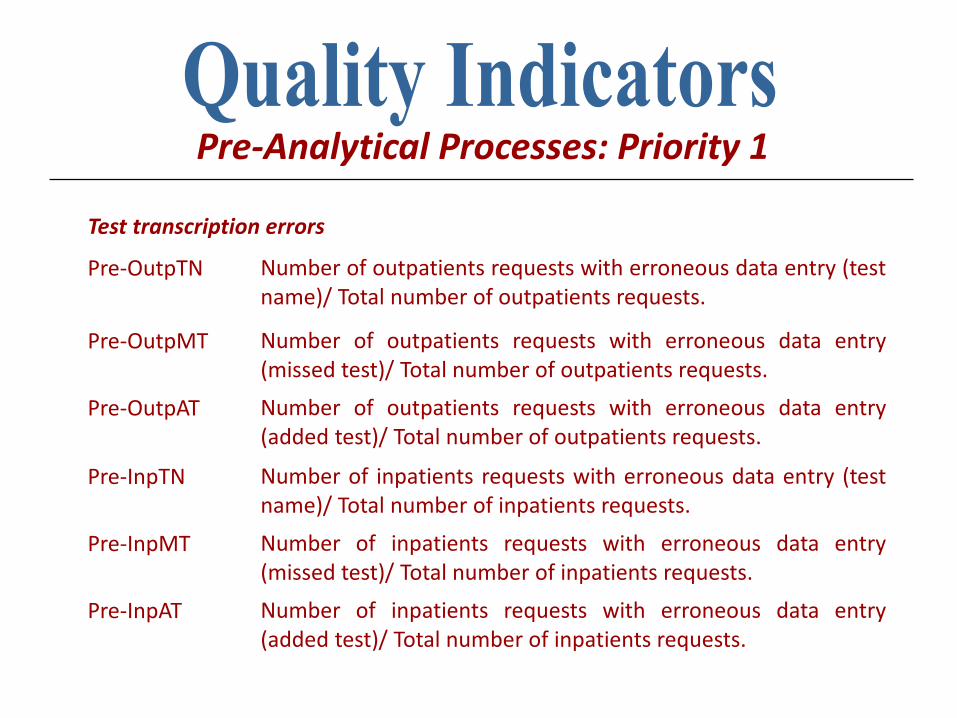
Test transcription errors
Pre-OutpTN Number of outpatients requests with erroneous data entry (test name)/ Total number of outpatients requests.
Pre-OutpMT Number of outpatients requests with erroneous data entry (missed test)/ Total number of outpatients requests.
Pre-OutpAT Number of outpatients requests with erroneous data entry (added test)/ Total number of outpatients requests.
Pre-InpTN Number of inpatients requests with erroneous data entry (test name)/ Total number of inpatients requests.
Pre-InpMT Number of inpatients requests with erroneous data entry (missed test)/ Total number of inpatients requests.
Pre-InpAT Number of inpatients requests with erroneous data entry (added test)/ Total number of inpatients requests.
Pre-Analytical Processes: Priority 1
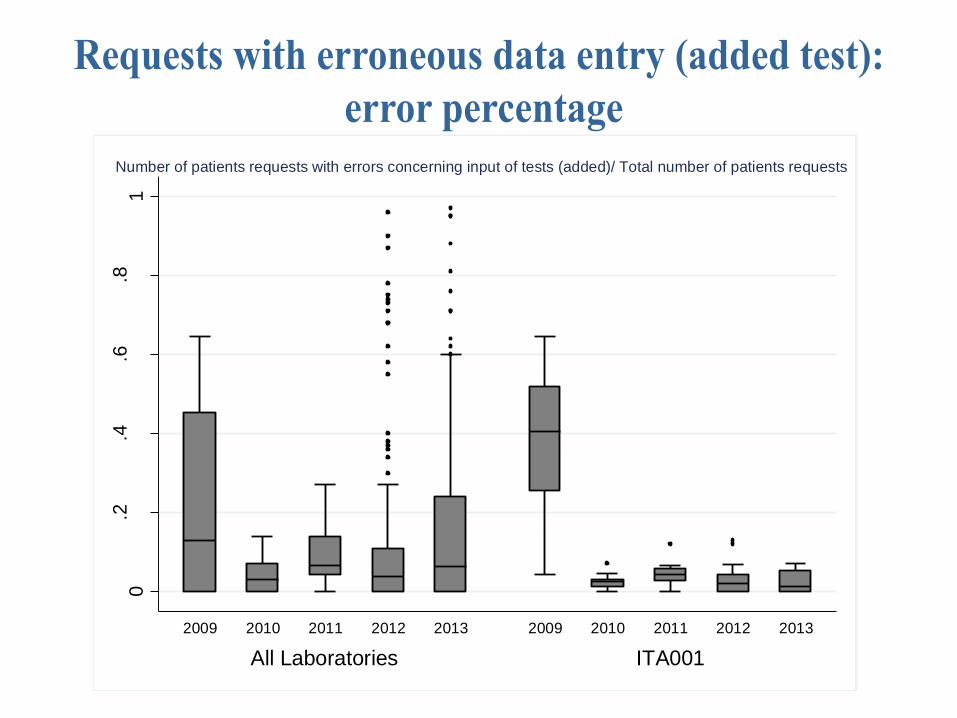
0.2
.4.6
.81
PE
RC
EN
TA
GE
All Laboratories ITA001
2009 2010 2011 2012 2013 2009 2010 2011 2012 2013
Number of patients requests with errors concerning input of tests (added)/ Total number of patients requests
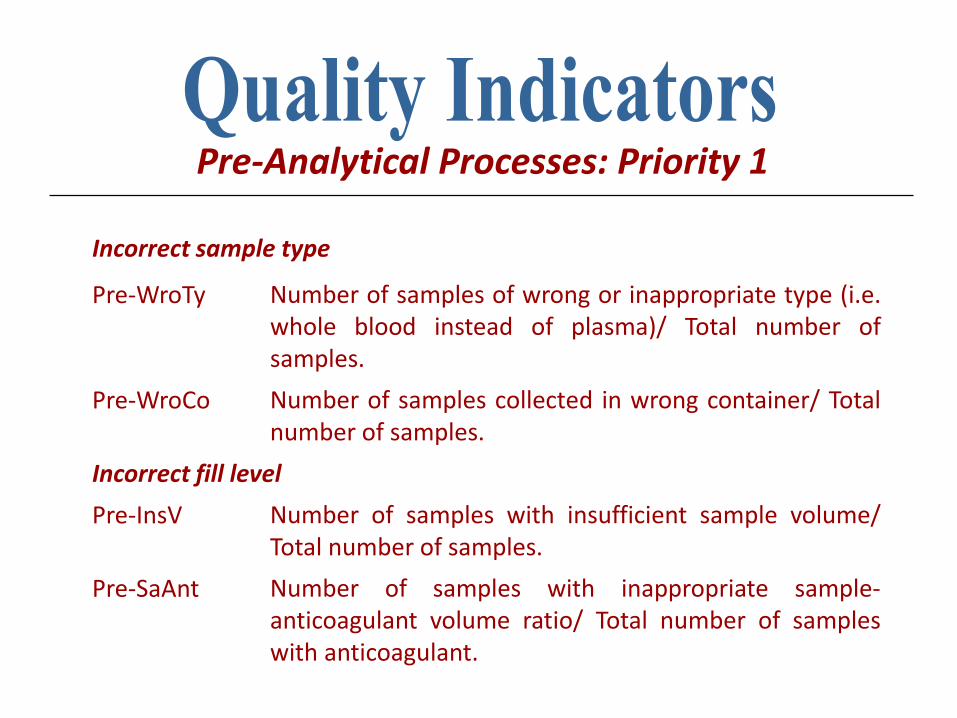
Incorrect sample type
Pre-WroTy Number of samples of wrong or inappropriate type (i.e. whole blood instead of plasma)/ Total number of samples.
Pre-WroCo Number of samples collected in wrong container/ Total number of samples.
Incorrect fill level
Pre-InsV Number of samples with insufficient sample volume/ Total number of samples.
Pre-SaAnt Number of samples with inappropriate sample-anticoagulant volume ratio/ Total number of samples with anticoagulant.
Pre-Analytical Processes: Priority 1
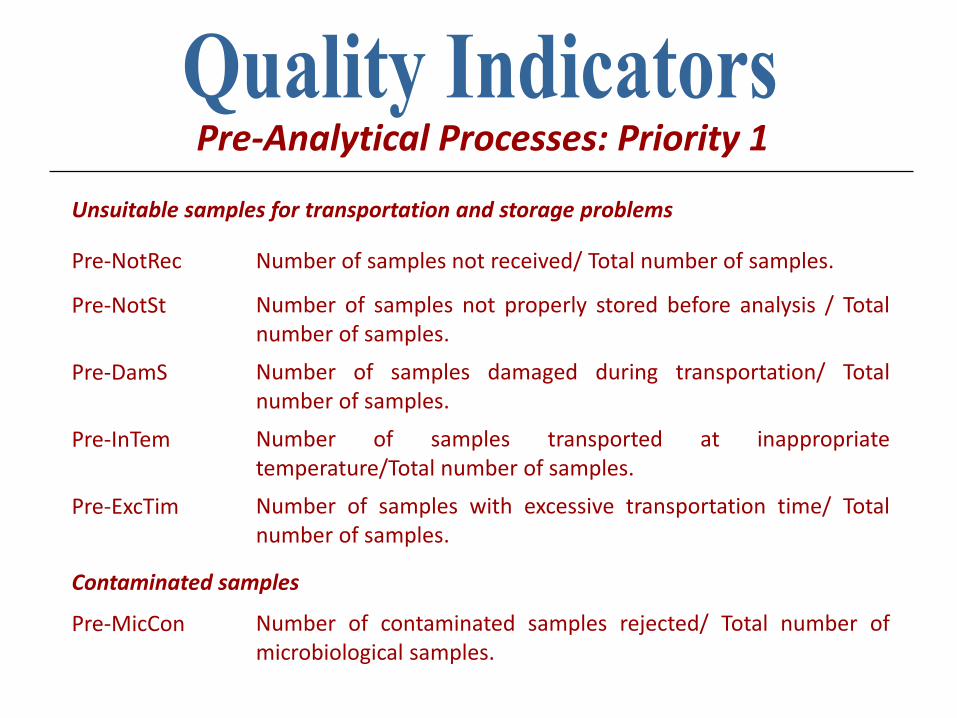
Unsuitable samples for transportation and storage problems
Pre-NotRec Number of samples not received/ Total number of samples.
Pre-NotSt Number of samples not properly stored before analysis / Total number of samples.
Pre-DamS Number of samples damaged during transportation/ Total number of samples.
Pre-InTem Number of samples transported at inappropriate temperature/Total number of samples.
Pre-ExcTim Number of samples with excessive transportation time/ Total number of samples.
Contaminated samples
Pre-MicCon Number of contaminated samples rejected/ Total number of microbiological samples.
Pre-Analytical Processes: Priority 1
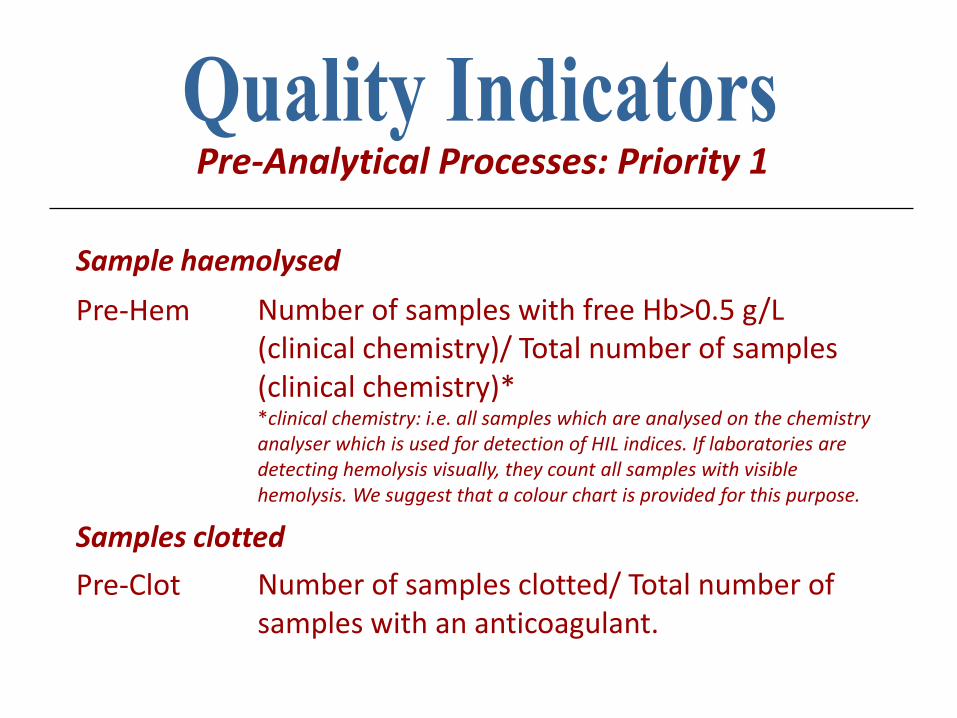
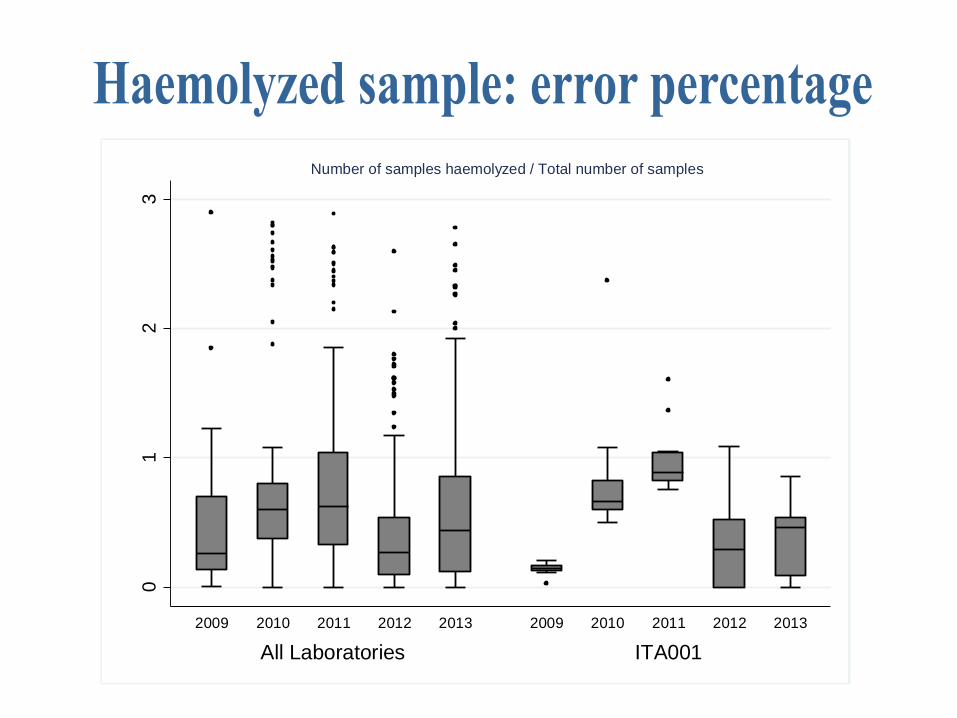
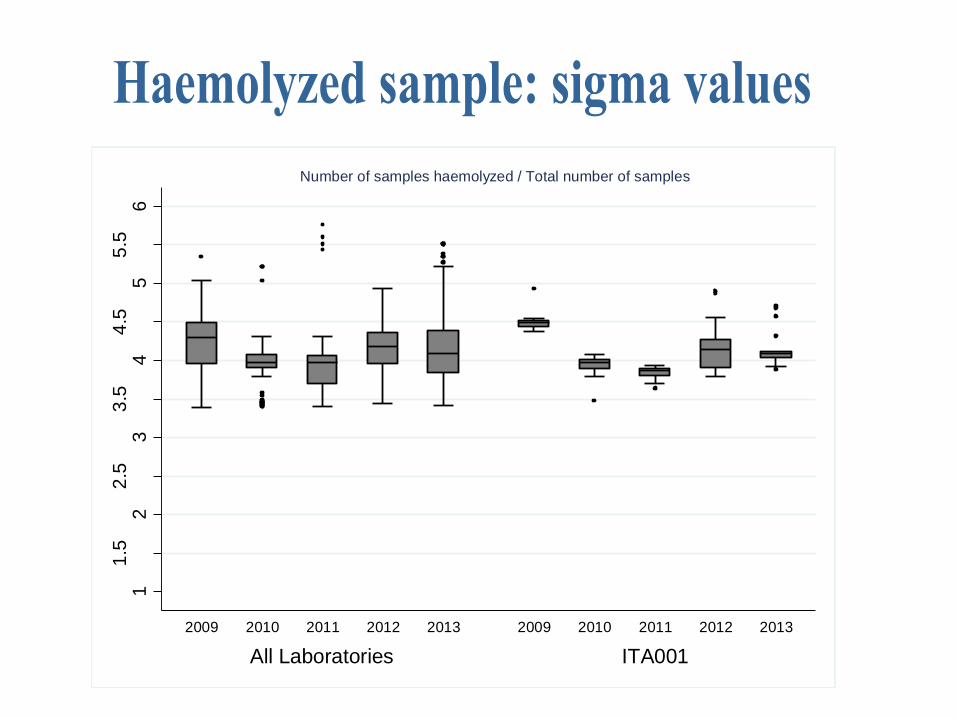
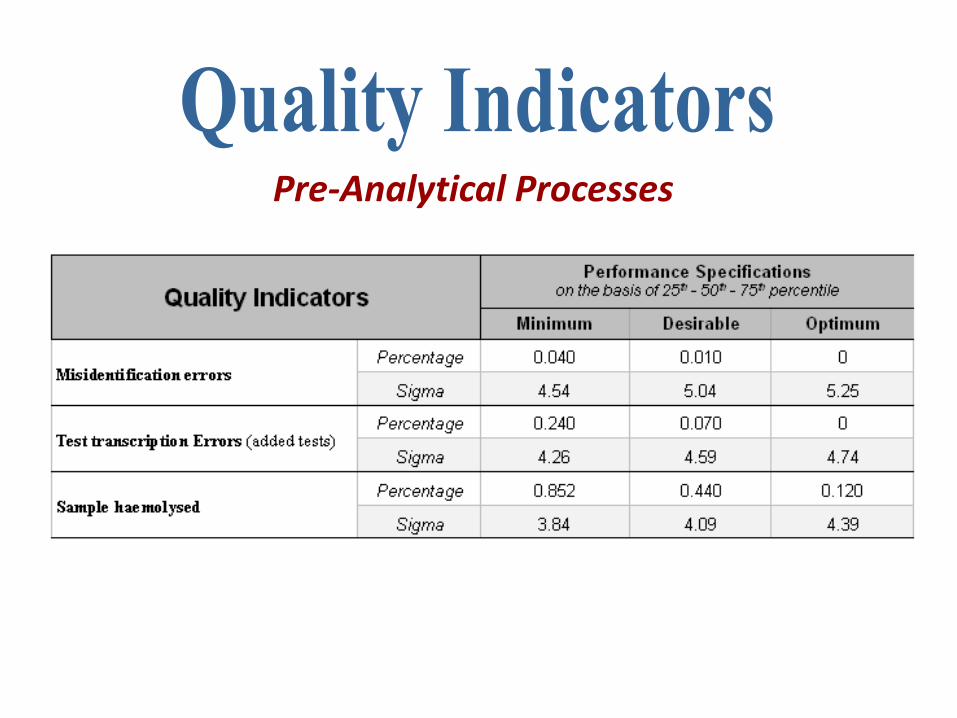
Sample haemolysed
Pre-Hem Number of samples with free Hb>0.5 g/L (clinical chemistry)/ Total number of samples (clinical chemistry)* *clinical chemistry: i.e. all samples which are analysed on the chemistry analyser which is used for detection of HIL indices. If laboratories are detecting hemolysis visually, they count all samples with visible hemolysis. We suggest that a colour chart is provided for this purpose.
Samples clotted
Pre-Clot Number of samples clotted/ Total number of samples with an anticoagulant.
Pre-Analytical Processes: Priority 1
01
23
PE
RC
EN
TA
GE
All Laboratories ITA001
2009 2010 2011 2012 2013 2009 2010 2011 2012 2013
Number of samples haemolyzed / Total number of samples
11
.52
2.5
33
.54
4.5
55
.56
Sig
ma
All Laboratories ITA001
2009 2010 2011 2012 2013 2009 2010 2011 2012 2013
Number of samples haemolyzed / Total number of samples
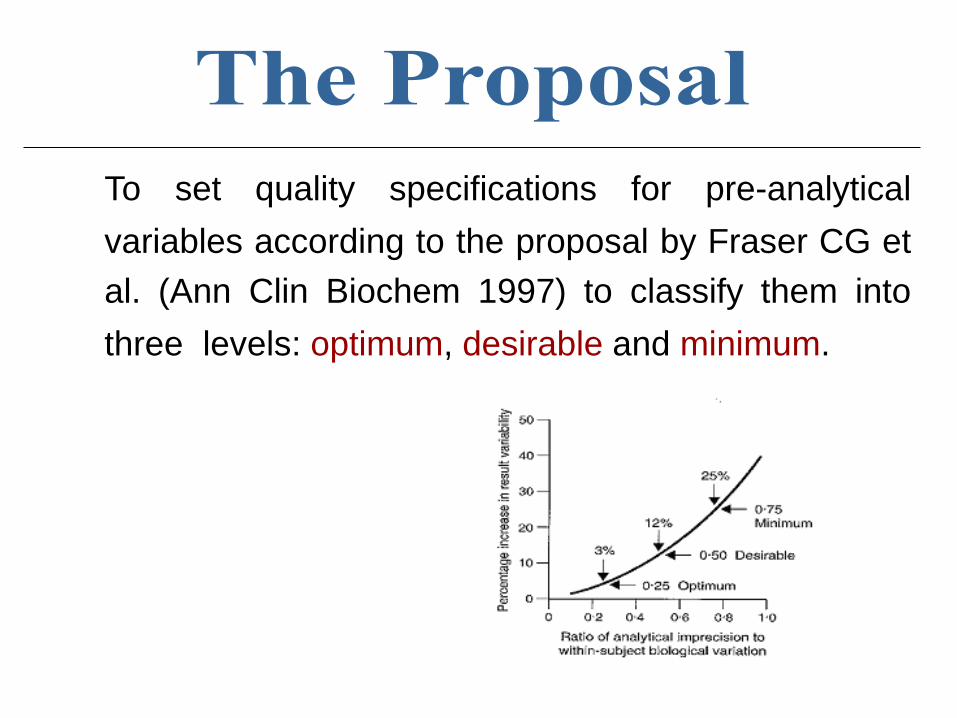
To set quality specifications for pre-analytical
variables according to the proposal by Fraser CG et
al. (Ann Clin Biochem 1997) to classify them into
three levels: optimum, desirable and minimum.
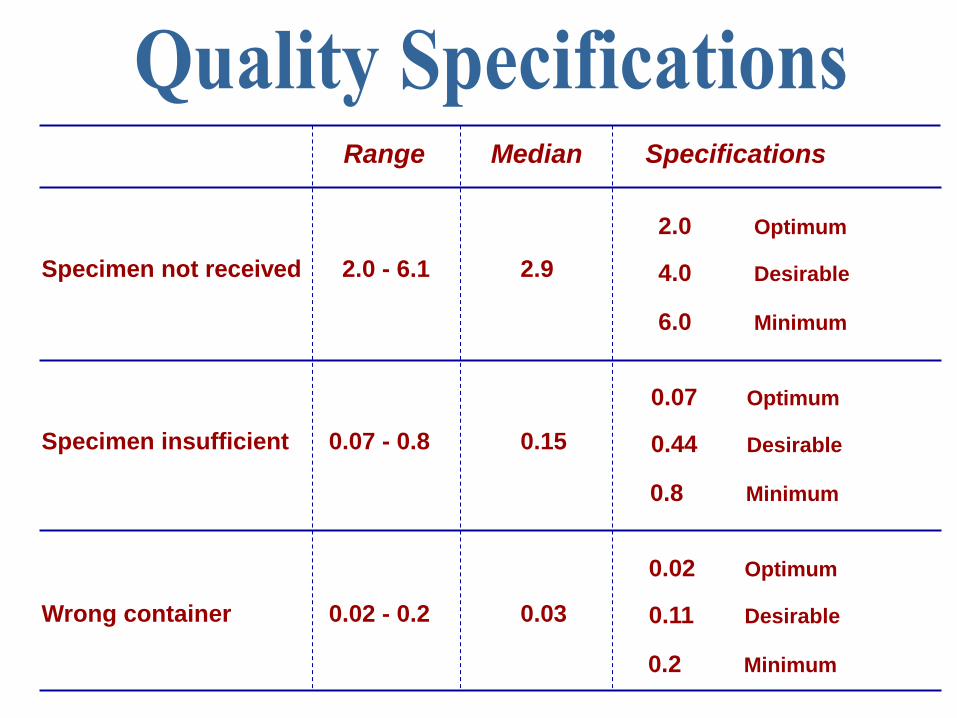
Specimen not received 2.0 - 6.1 2.9
Specimen insufficient 0.07 - 0.8 0.15
Wrong container 0.02 - 0.2 0.03
4.0 Desirable
6.0 Minimum
2.0 Optimum
0.44 Desirable
0.8 Minimum
0.07 Optimum
0.11 Desirable
0.2 Minimum
0.02 Optimum
Range Median Specifications
Pre-Analytical Processes

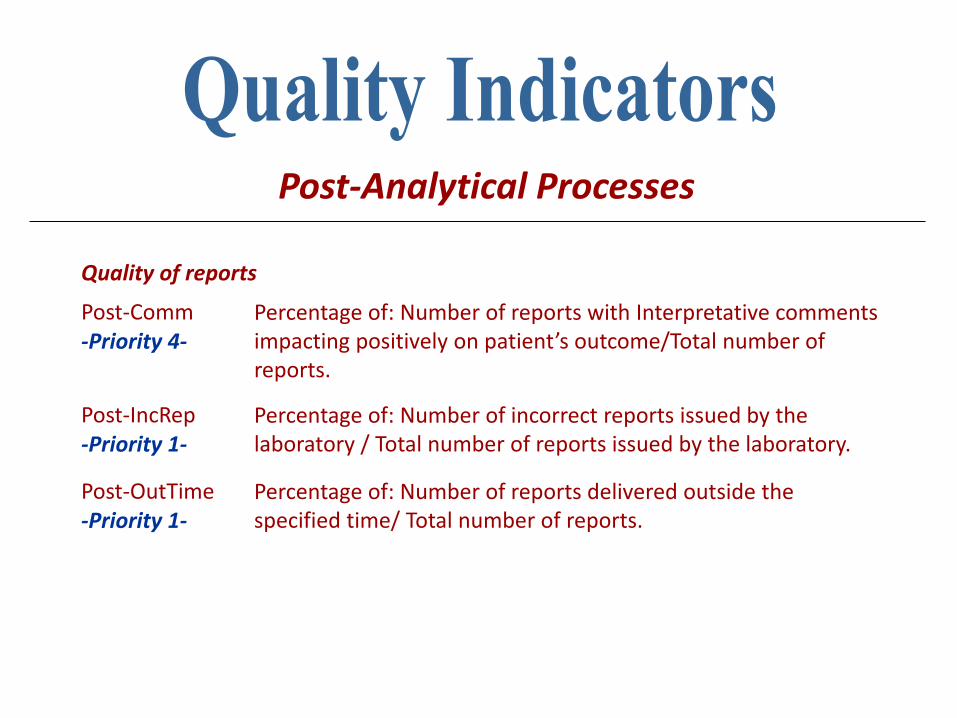
Quality of reports
Post-Comm -Priority 4-
Percentage of: Number of reports with Interpretative comments impacting positively on patient’s outcome/Total number of reports.
Post-IncRep -Priority 1-
Percentage of: Number of incorrect reports issued by the laboratory / Total number of reports issued by the laboratory.
Post-OutTime -Priority 1-
Percentage of: Number of reports delivered outside the specified time/ Total number of reports.
Post-Analytical Processes
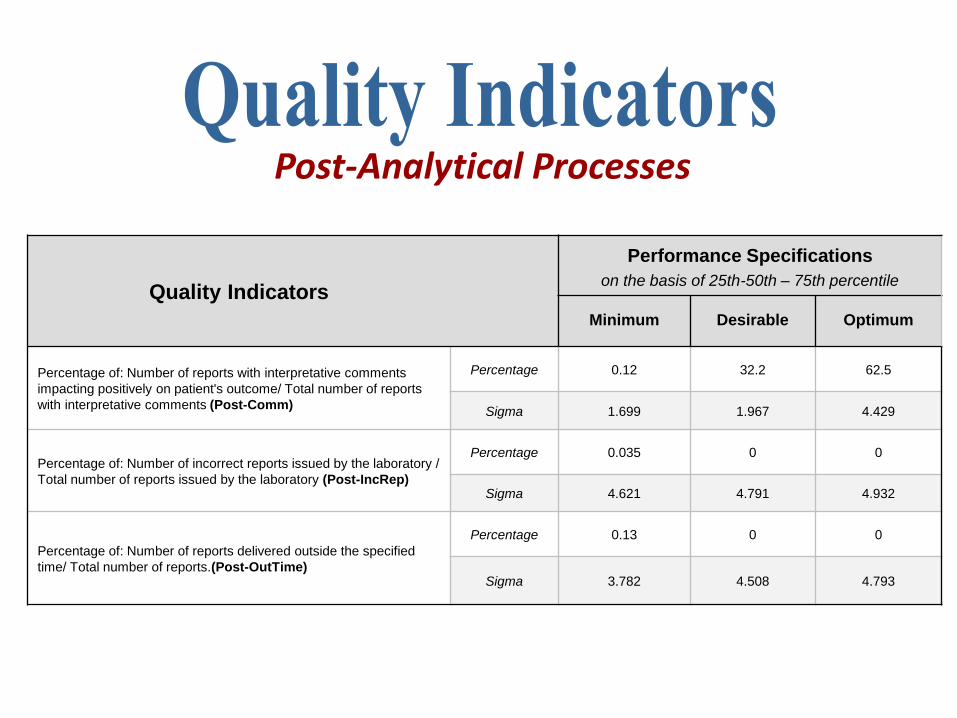
Quality Indicators
Performance Specifications
on the basis of 25th-50th – 75th percentile
Minimum Desirable Optimum
Percentage of: Number of reports with interpretative comments
impacting positively on patient's outcome/ Total number of reports
with interpretative comments (Post-Comm)
Percentage 0.12 32.2 62.5
Sigma 1.699 1.967 4.429
Percentage of: Number of incorrect reports issued by the laboratory /
Total number of reports issued by the laboratory (Post-IncRep)
Percentage 0.035 0 0
Sigma 4.621 4.791 4.932
Percentage of: Number of reports delivered outside the specified
time/ Total number of reports.(Post-OutTime)
Percentage 0.13 0 0
Sigma 3.782 4.508 4.793
Post-Analytical Processes
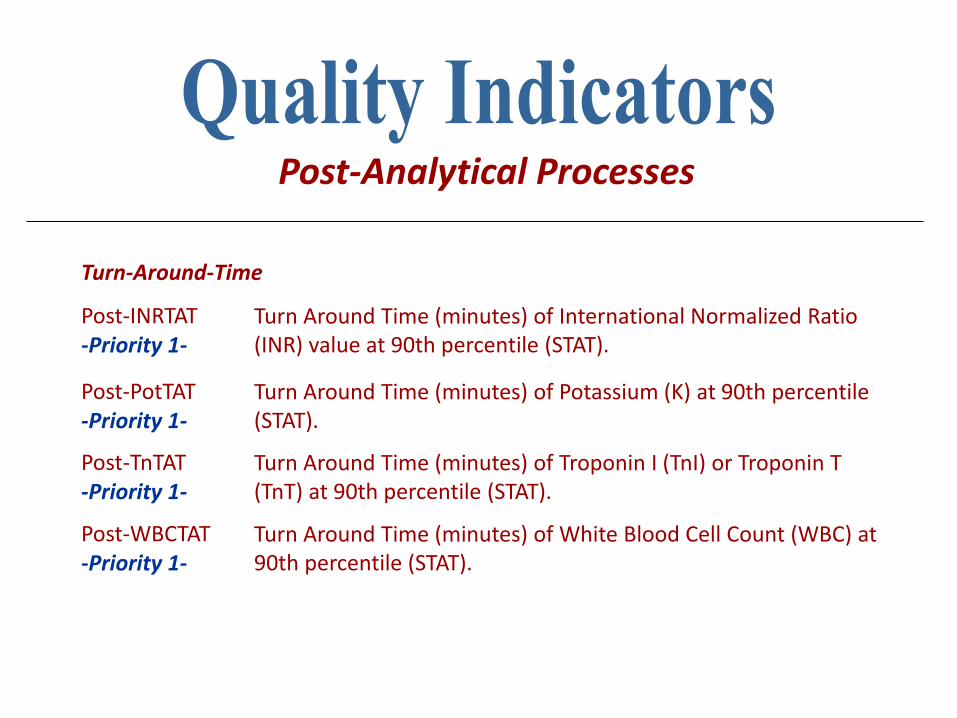
Turn-Around-Time
Post-INRTAT -Priority 1-
Turn Around Time (minutes) of International Normalized Ratio (INR) value at 90th percentile (STAT).
Post-PotTAT -Priority 1-
Turn Around Time (minutes) of Potassium (K) at 90th percentile (STAT).
Post-TnTAT -Priority 1-
Turn Around Time (minutes) of Troponin I (TnI) or Troponin T (TnT) at 90th percentile (STAT).
Post-WBCTAT -Priority 1-
Turn Around Time (minutes) of White Blood Cell Count (WBC) at 90th percentile (STAT).
Post-Analytical Processes
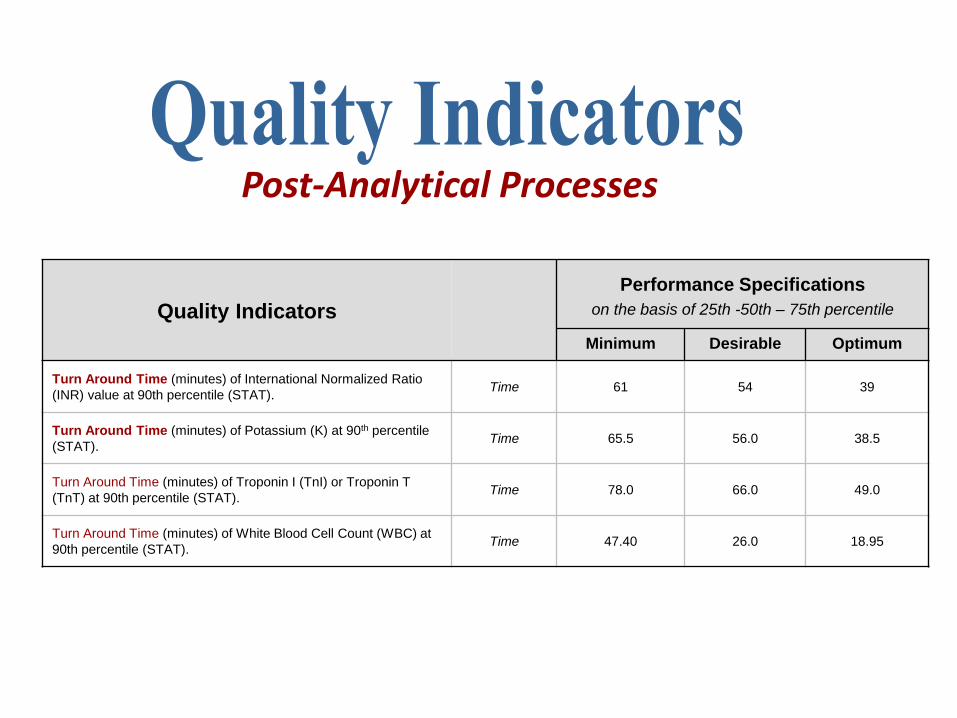
Quality Indicators
Performance Specifications
on the basis of 25th -50th – 75th percentile
Minimum Desirable Optimum
Turn Around Time (minutes) of International Normalized Ratio
(INR) value at 90th percentile (STAT). Time 61 54 39
Turn Around Time (minutes) of Potassium (K) at 90th percentile
(STAT). Time 65.5 56.0 38.5
Turn Around Time (minutes) of Troponin I (TnI) or Troponin T
(TnT) at 90th percentile (STAT). Time 78.0 66.0 49.0
Turn Around Time (minutes) of White Blood Cell Count (WBC) at
90th percentile (STAT). Time 47.40 26.0 18.95
Post-Analytical Processes
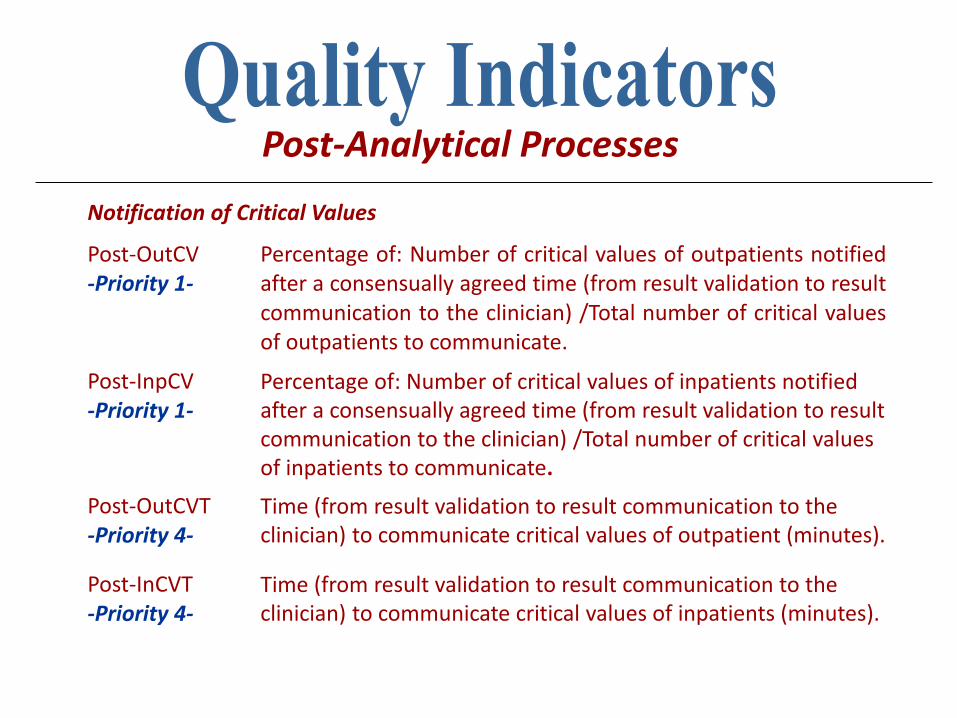
Notification of Critical Values
Post-OutCV -Priority 1-
Percentage of: Number of critical values of outpatients notified after a consensually agreed time (from result validation to result communication to the clinician) /Total number of critical values of outpatients to communicate.
Post-InpCV -Priority 1-
Percentage of: Number of critical values of inpatients notified after a consensually agreed time (from result validation to result communication to the clinician) /Total number of critical values of inpatients to communicate.
Post-OutCVT -Priority 4-
Time (from result validation to result communication to the clinician) to communicate critical values of outpatient (minutes).
Post-InCVT -Priority 4-
Time (from result validation to result communication to the clinician) to communicate critical values of inpatients (minutes).
Post-Analytical Processes
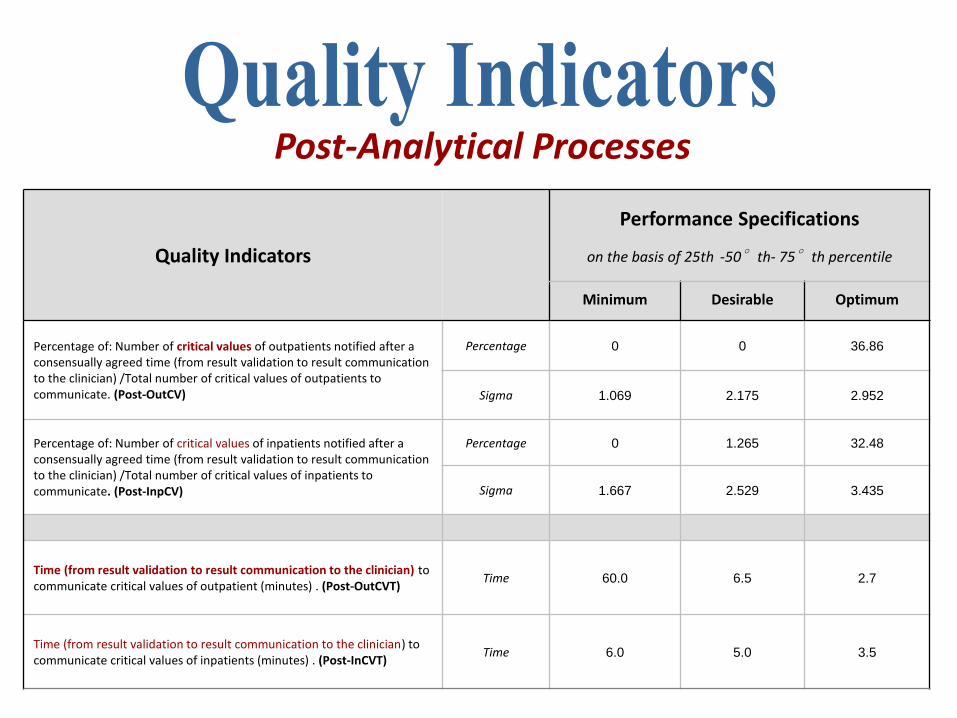
Quality Indicators
Performance Specifications
on the basis of 25th -50°th- 75°th percentile
Minimum Desirable Optimum
Percentage of: Number of critical values of outpatients notified after a consensually agreed time (from result validation to result communication to the clinician) /Total number of critical values of outpatients to communicate. (Post-OutCV)
Percentage 0 0 36.86
Sigma 1.069 2.175 2.952
Percentage of: Number of critical values of inpatients notified after a consensually agreed time (from result validation to result communication to the clinician) /Total number of critical values of inpatients to communicate. (Post-InpCV)
Percentage 0 1.265 32.48
Sigma 1.667 2.529 3.435
Time (from result validation to result communication to the clinician) to communicate critical values of outpatient (minutes) . (Post-OutCVT)
Time 60.0 6.5 2.7
Time (from result validation to result communication to the clinician) to communicate critical values of inpatients (minutes) . (Post-InCVT)
Time 6.0 5.0 3.5
Post-Analytical Processes
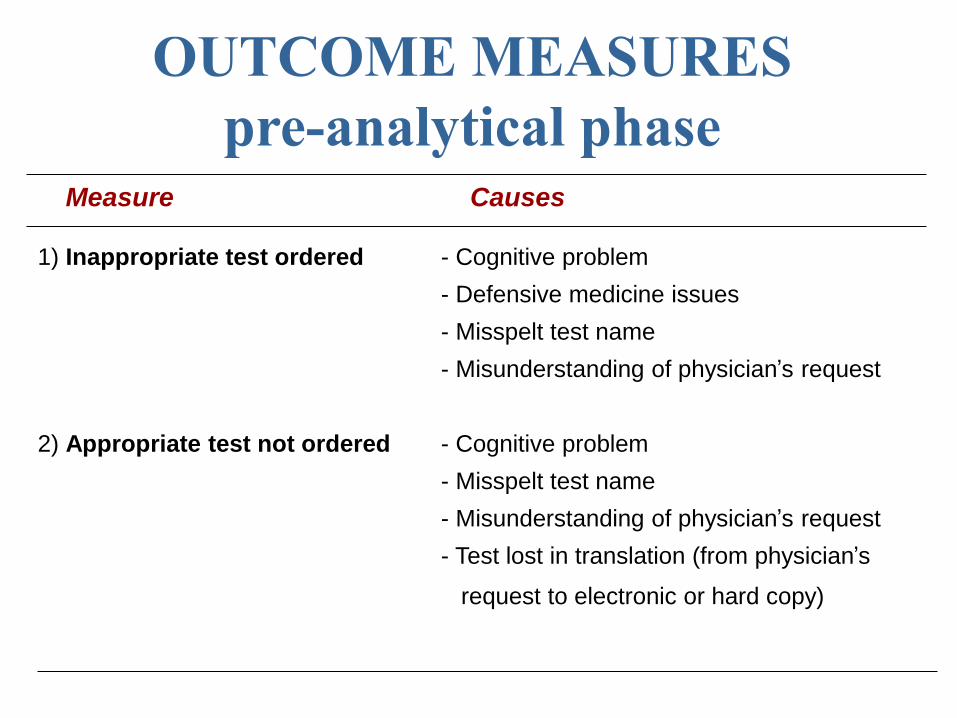
Measure Causes
1) Inappropriate test ordered - Cognitive problem
- Defensive medicine issues
- Misspelt test name
- Misunderstanding of physician’s request
2) Appropriate test not ordered - Cognitive problem
- Misspelt test name
- Misunderstanding of physician’s request
- Test lost in translation (from physician’s
request to electronic or hard copy)
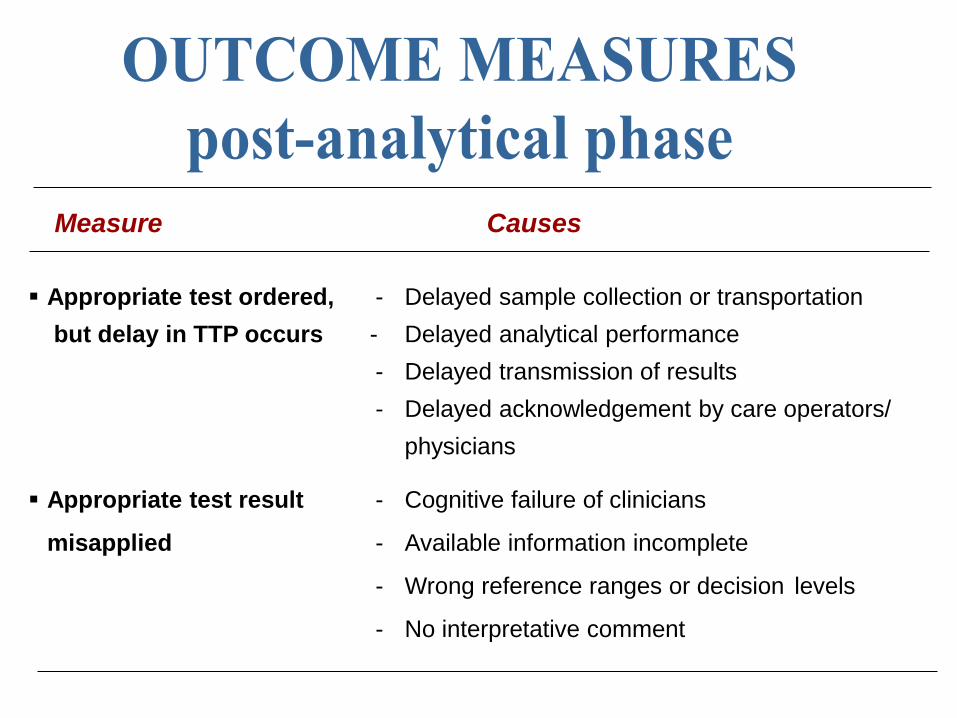
Appropriate test ordered, - Delayed sample collection or transportation
but delay in TTP occurs - Delayed analytical performance
- Delayed transmission of results
- Delayed acknowledgement by care operators/
physicians
Appropriate test result - Cognitive failure of clinicians
misapplied - Available information incomplete
- Wrong reference ranges or decision levels
- No interpretative comment
Measure Causes
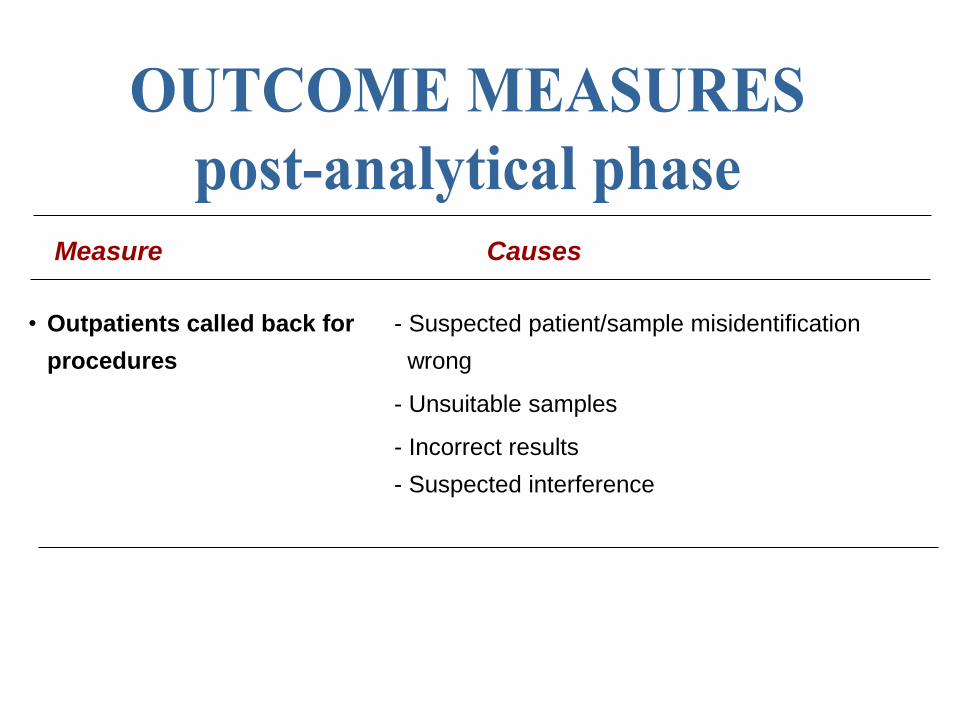
• Outpatients called back for - Suspected patient/sample misidentification
procedures wrong
- Unsuitable samples
- Incorrect results
- Suspected interference
Measure Causes

Patient Safety
Out-InacR -Priority 1-
Percentage of: Number of inaccurate results released/Total number of results released.
Out-RecInp -Priority 1-
Percentage of: Number of inpatients with recollected samples for laboratory errors/ Total number of inpatients.
Out-RecOutp -Priority 1-
Percentage of: Number of outpatients with recollected samples for laboratory errors/ Total number of outpatients.
Outcome Measures
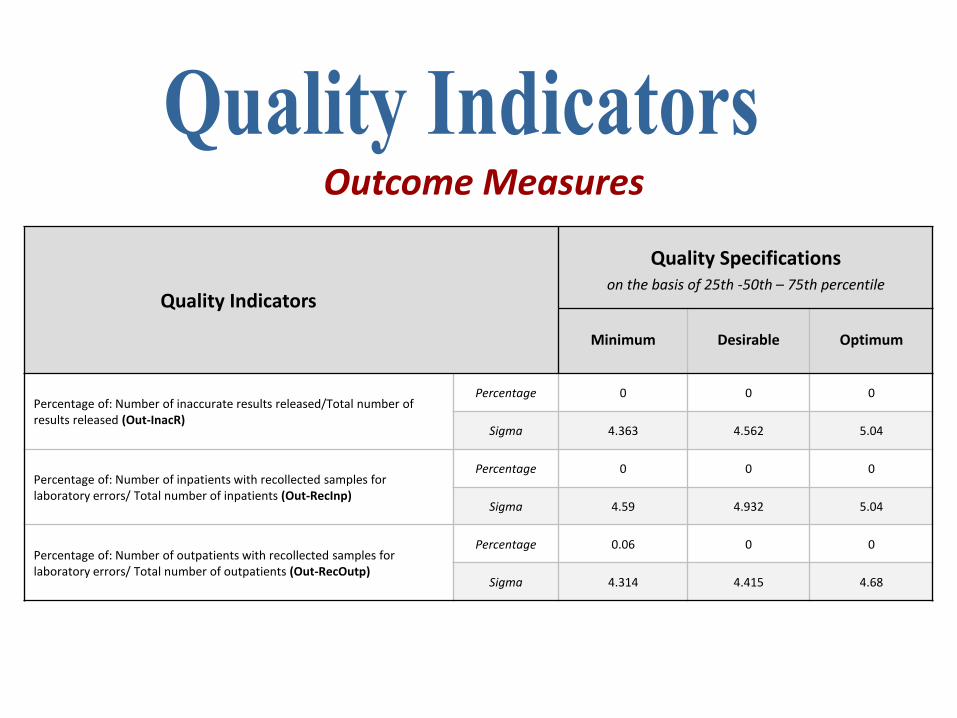
Quality Indicators
Quality Specifications on the basis of 25th -50th – 75th percentile
Minimum Desirable Optimum
Percentage of: Number of inaccurate results released/Total number of results released (Out-InacR)
Percentage 0 0 0
Sigma 4.363 4.562 5.04
Percentage of: Number of inpatients with recollected samples for laboratory errors/ Total number of inpatients (Out-RecInp)
Percentage 0 0 0
Sigma 4.59 4.932 5.04
Percentage of: Number of outpatients with recollected samples for laboratory errors/ Total number of outpatients (Out-RecOutp)
Percentage 0.06 0 0
Sigma 4.314 4.415 4.68
Outcome Measures
• Diagnostic errors and laboratory-associated errors
• Quality in laboratory medicine
• Quality indicators (QIs): definition and aims
• QIs in laboratory medicine
• QIs: harmonization and performance criteria
• QIs and state-of-the-art
• Take home messages
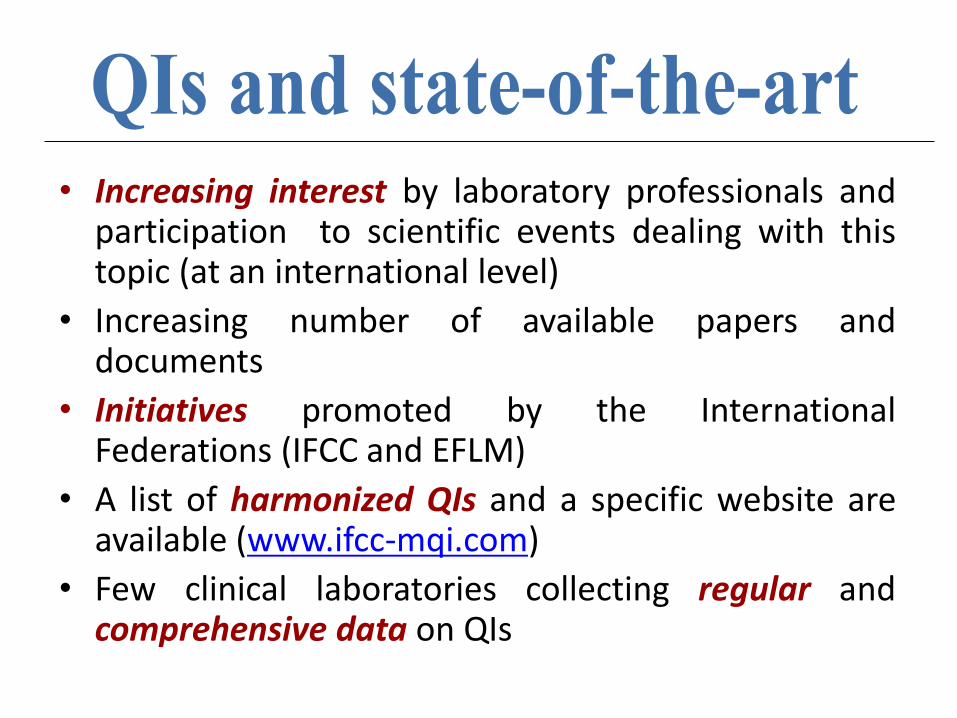
• Increasing interest by laboratory professionals and participation to scientific events dealing with this topic (at an international level)
• Increasing number of available papers and documents
• Initiatives promoted by the International Federations (IFCC and EFLM)
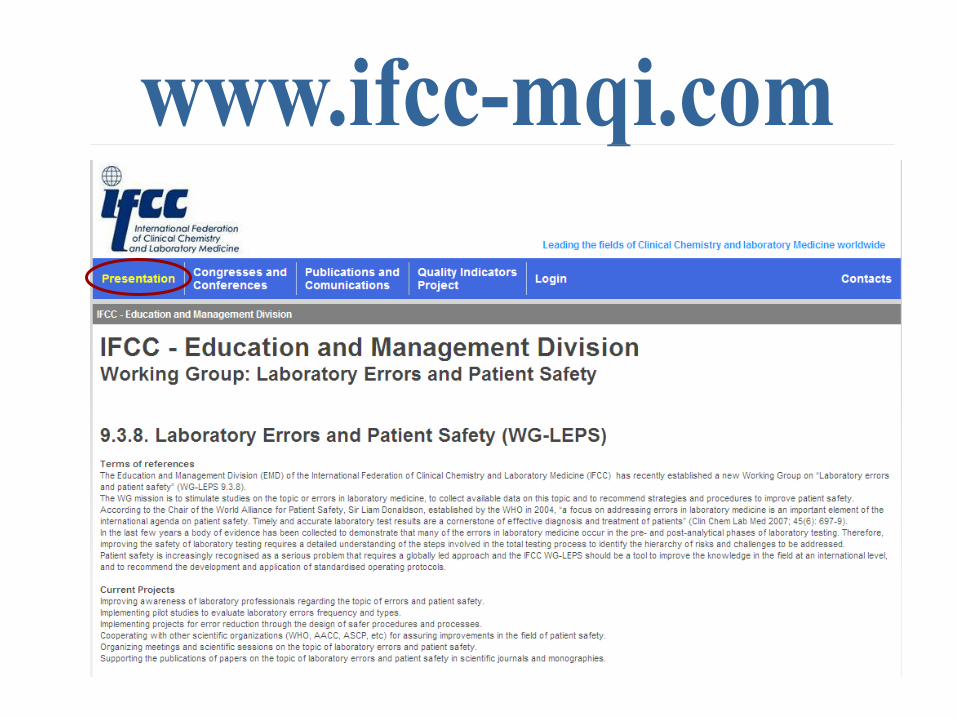
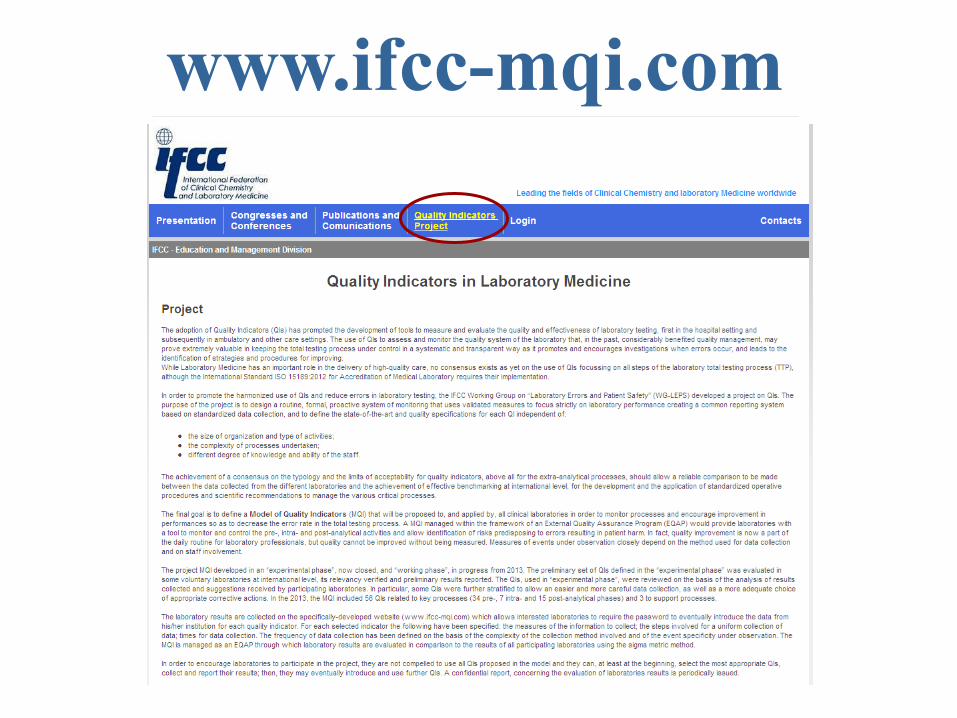
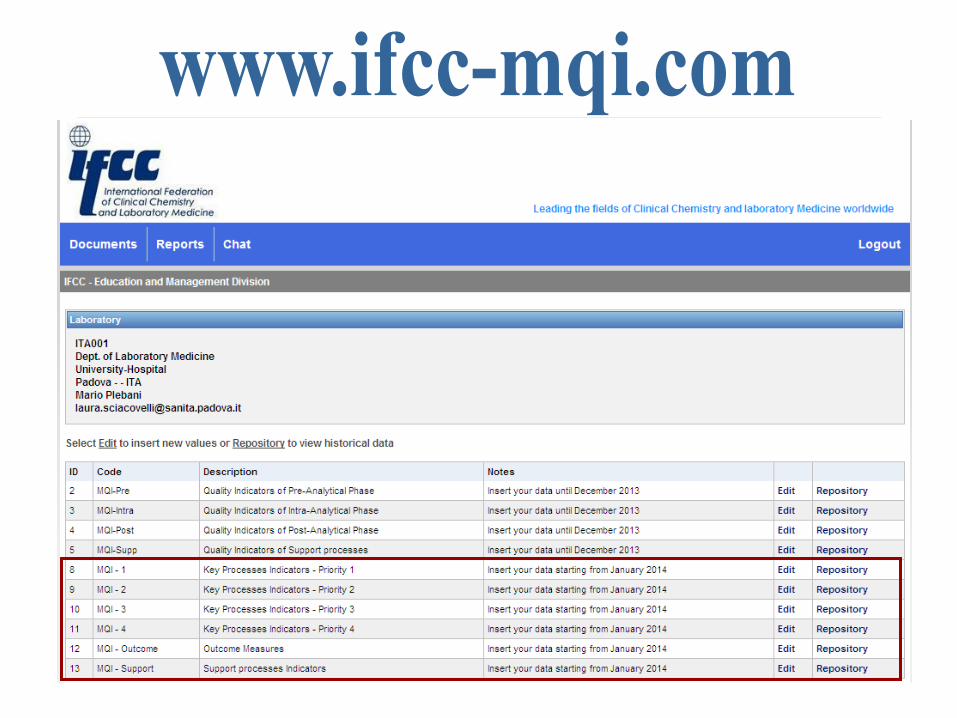
• A list of harmonized QIs and a specific website are available (www.ifcc-mqi.com)
• Few clinical laboratories collecting regular and comprehensive data on QIs
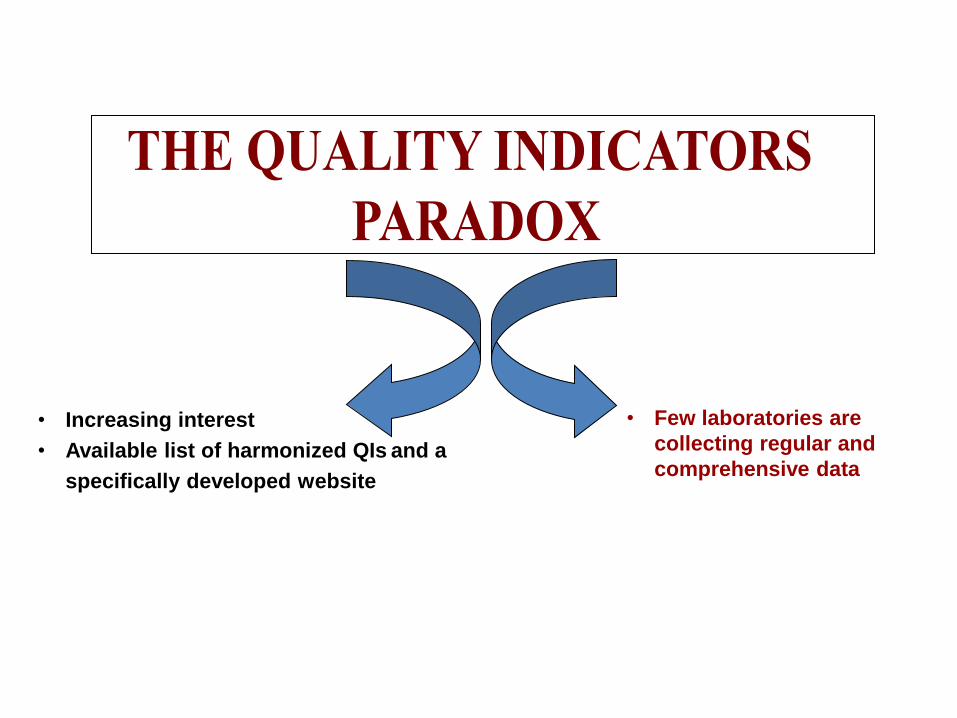
• Increasing interest
• Available list of harmonized QIs and a
specifically developed website
• Few laboratories are
collecting regular and
comprehensive data
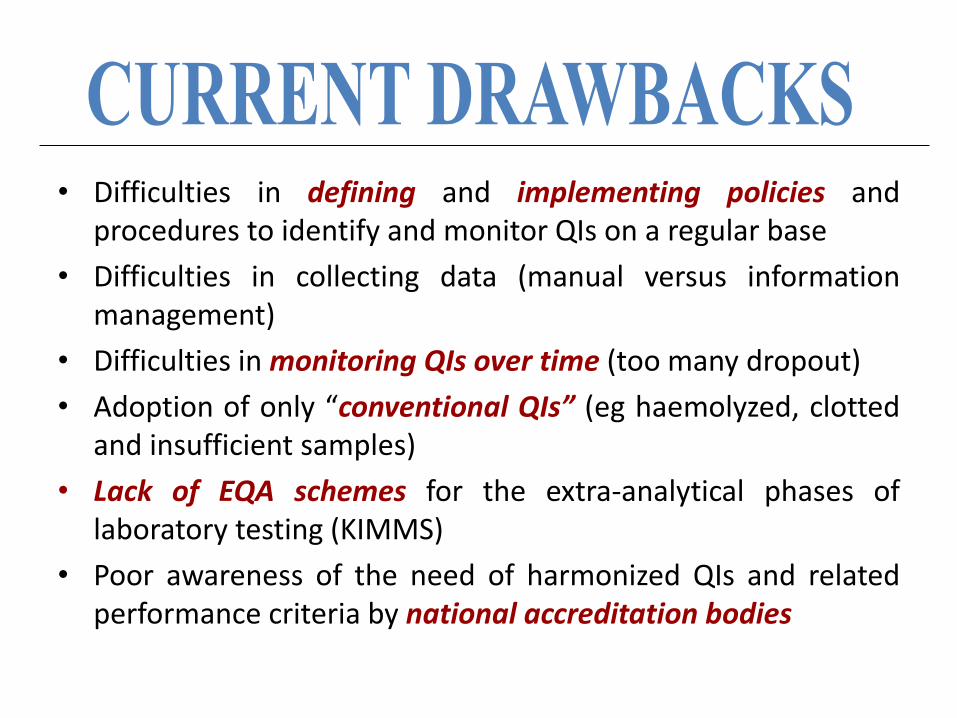
• Difficulties in defining and implementing policies and procedures to identify and monitor QIs on a regular base
• Difficulties in collecting data (manual versus information management)
• Difficulties in monitoring QIs over time (too many dropout)
• Adoption of only “conventional QIs” (eg haemolyzed, clotted and insufficient samples)
• Lack of EQA schemes for the extra-analytical phases of laboratory testing (KIMMS)
• Poor awareness of the need of harmonized QIs and related performance criteria by national accreditation bodies
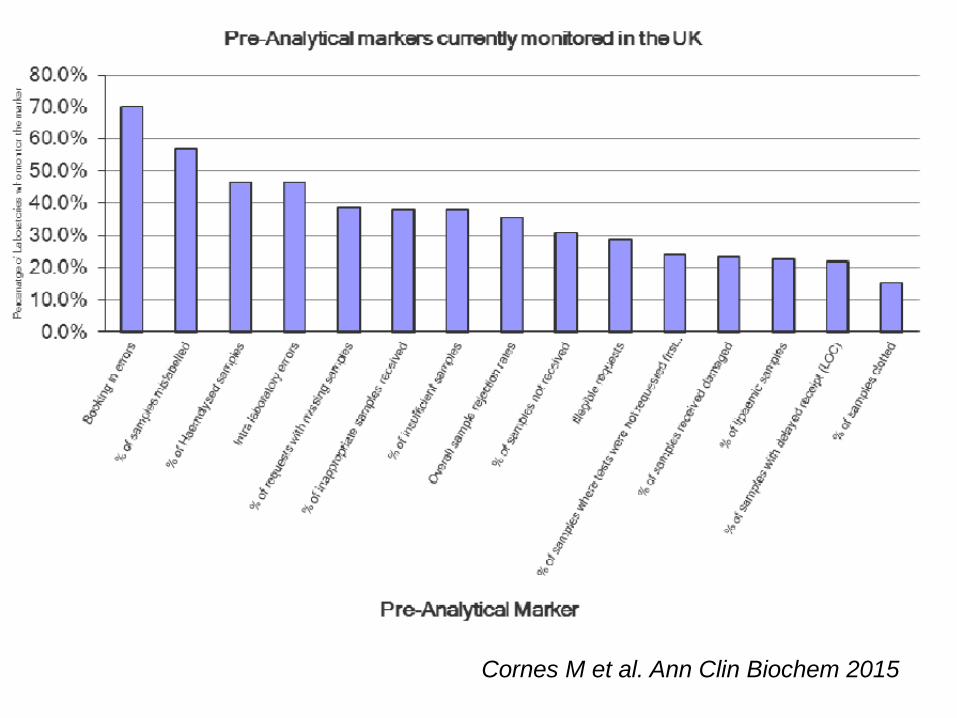
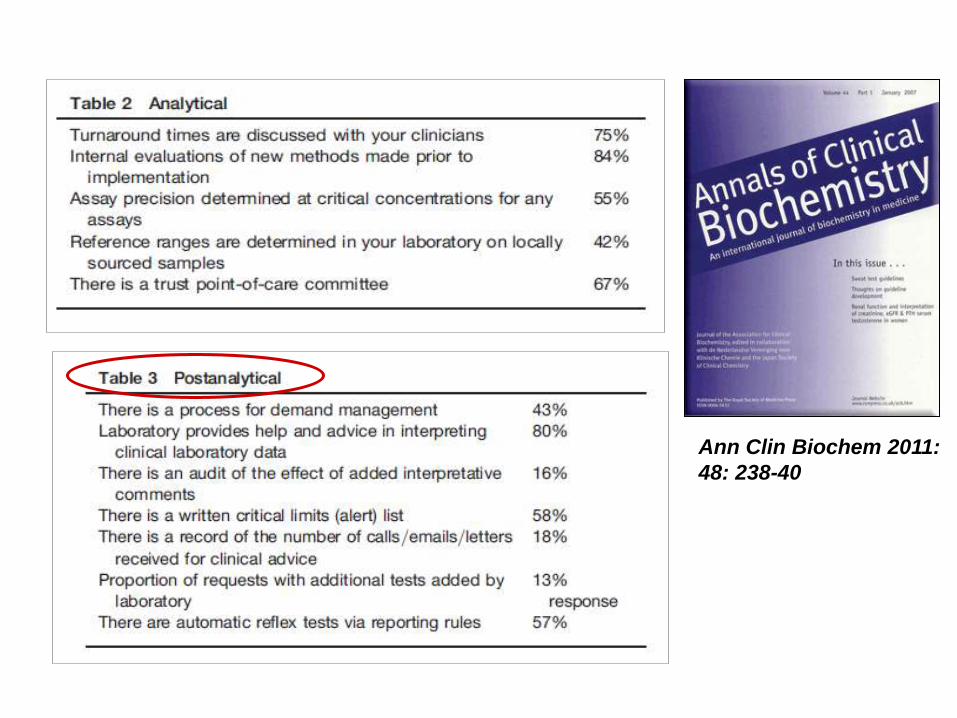
Cornes M et al. Ann Clin Biochem 2015

• New efforts for achieving better harmonization in the field of QIs (not only the identification of valuable QIs, but also data collection and reporting systems)
• More involvement of national societies and national “champions”, spreading the leadership in this field
• Free exchange of criticisms, ideas and creative suggestions

• A questionnaire to better understand the professional viewpoint and to receive some inputs (developed by the EFLM TFG-PSEP)
• Organization of a second consensus conference on QIs harmonization
• ………send me your own suggestions, please

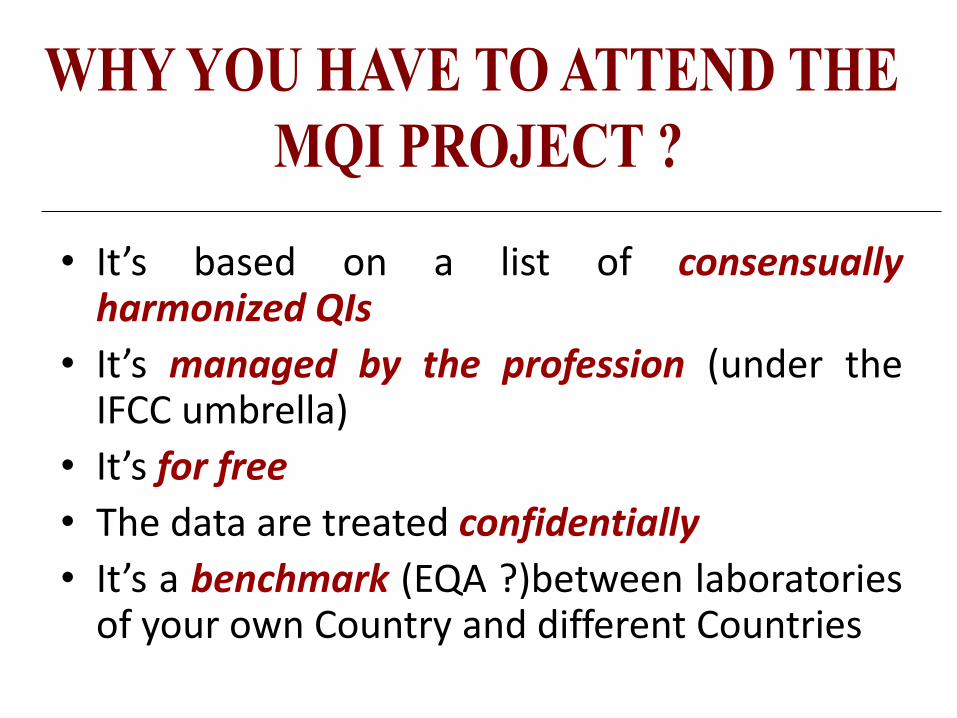
• It’s based on a list of consensually harmonized QIs
• It’s managed by the profession (under the IFCC umbrella)
• It’s for free
• The data are treated confidentially
• It’s a benchmark (EQA ?)between laboratories of your own Country and different Countries
• Quality in laboratory medicine
• Quality indicators (QIs): definition and aims
• QIs in laboratory medicine
• QIs: harmonization and performance criteria
• QIs and state-of-the-art
• Take home messages
from
• the “pre-pre-analytical” phase (“Right test choice at the
Right time on the Right patient”)
through
• analytical steps (“Right results in the Right forms”)
to the
• “post-post-analytical” phase (“Right interpretation, at the
Right time with the Right advice as to what to do next
with the result”).
Quality in laboratory testing includes all aspects of the so-
called “Brain-to-brain loop”,
• Quality indicators represent a valuable tool for identifying,
documenting and reducing errors in the total testing process
• Harmonized quality indicators may allow improvements in
“ in-house” quality, as well as a benchmark with other
laboratories at an international level
• Quality indicators allow the identification and setting of
performance criteria for the extra-analytical phases of
laboratory testing
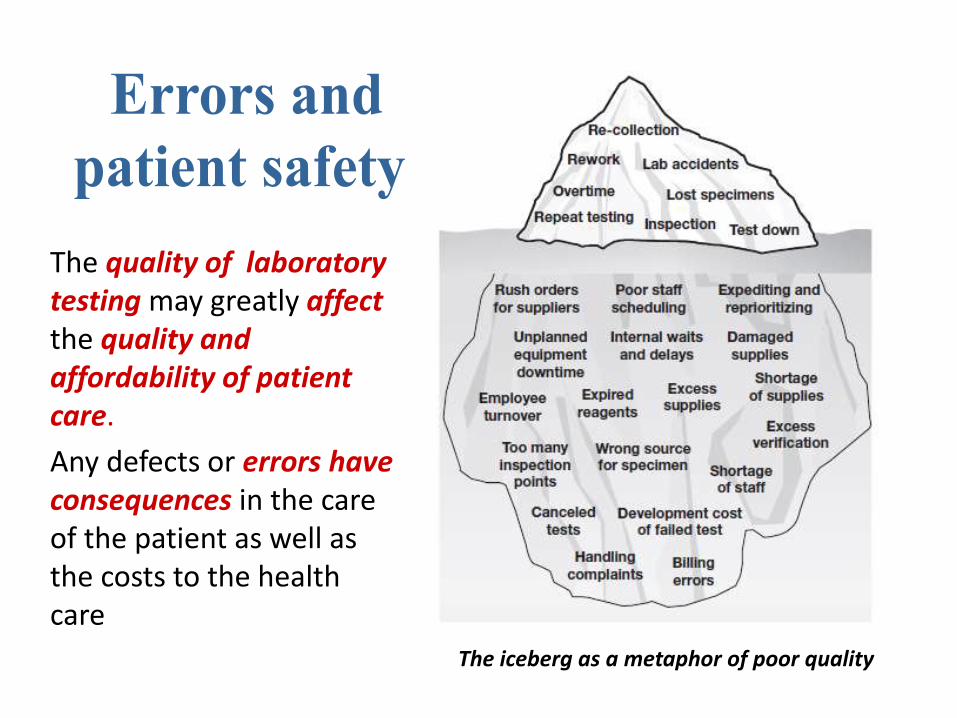
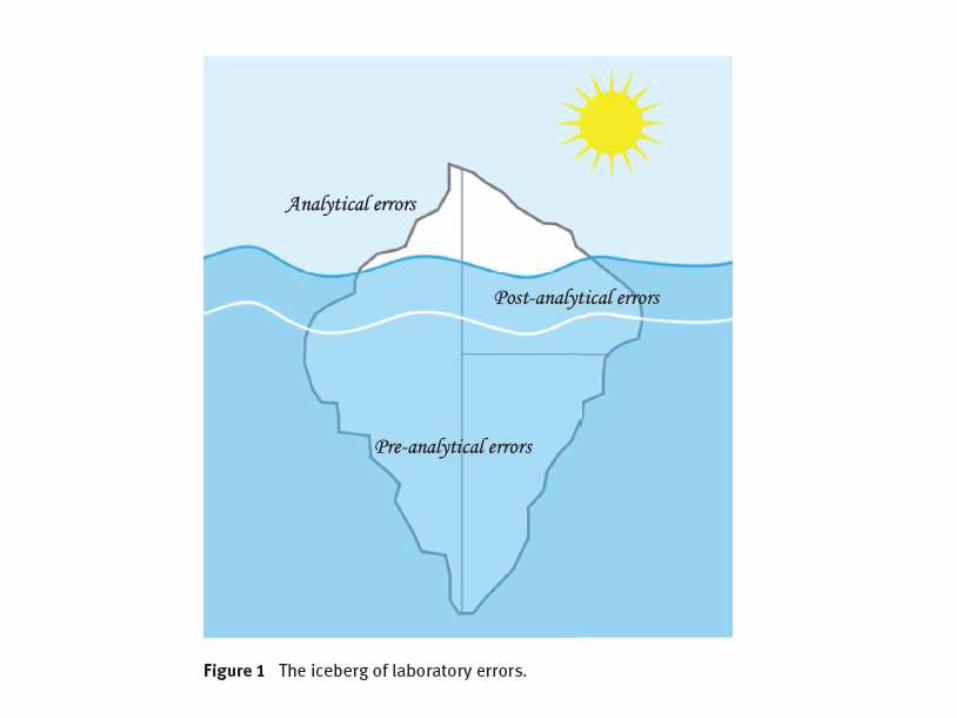
The iceberg as a metaphor of poor quality
The quality of laboratory testing may greatly affect the quality and affordability of patient care.
Any defects or errors have consequences in the care of the patient as well as the costs to the health care system.

QUALITY

The Croatian Society of Medical Biochemistry and Laboratory Medicine,
is a Champion in the field of quality and safety in Laboratory Medicine!


![PREDAVANJE (3) [Read-Only] - hdmblm.hr · HEMOTORAKS Hemotoraks‐uzroci ytrauma, tumor, ruptura krvne žile,](https://img.dokumen.tips/doc/110x75/5aeed64f7f8b9a9031919e27/predavanje-3-read-only-hemotoraksuzroci-ytrauma-tumor-ruptura-krvne-zile.jpg)