Embed Size (px)
Citation preview

Introduction to expression analysis (RNA-seq)
Quality Control Hands-on Exercise
Philippine Genome Centre University of the Philippines Originally prepared by Maria Xenophontos, EMBL-EBI Konrad Rudolph, EMBL-EBI (Revised and re-printed with permission)
Revised for PGC by Nelzo C. Ereful National Institute of Agricultural Botany Cambridge, UK
U n i v e r s i t y o f C a m b r i d g e

General information
The following standard icons are used in the hands-on exercises to help you
locate:
Important Information
General information / notes
Follow the following steps
Questions to be answered
Warning – PLEASE take care and read carefully
Resources used:
FastQC: http://www.bioinformatics.babraham.ac.uk/projects/fastqc/
Fastx-toolkit: http://hannonlab.cshl.edu/fastx_toolkit/
We will use a dataset derived from sequencing mRNA of Claviceps purpurea
a fungus that infects wheat. Sequencing was performed on the Illumina
platform and generated 100 bp single-end sequence data using polyA
selected RNA. Due to time constraints and memory requirements of the
practical we will use only one replicate.

Data quality control tutorial
Going on a blind date with your read set? For a better understanding of the consequences please check the data quality!
For the purpose of this tutorial we are focusing only on the Illumina
sequencing which uses 'sequence by synthesis' technology in a highly
parallel fashion. Although Illumina high throughput sequencing provides
highly accurate sequence data, several sequence artefacts, including base
calling errors and small insertions/deletions, poor quality reads and
primer/adapter contamination are quite common in the high throughput
sequencing data. The primary errors are substitution errors. The error rates
can vary from 0.5-2.0% with errors mainly rising in frequency at the 3' ends of
reads.
One way to investigate sequence data quality is to visualize the quality
scores and other metrics in a compact manner to get an idea about the
quality of a read data set. Read data sets can be improved by post
processing in different ways like trimming off low quality bases, cleaning up
the sequencing adapters if any, removing PCR duplicates if required. We can
also look at other statistics such as, sequence length distribution, base
composition, sequence complexity, presence of ambiguous bases etc. to
assess the overall quality of the data set. Highly redundant coverage (>15X)
of the genome can be used to correct sequencing errors in the reads before
assembly and errors. Various k-mer based error correction methods exist but
are beyond the scope of this tutorial.
To investigate sequence data quality we would demonstrate tools
called FastQC and fastx-toolkit. FastQC will process and present the reports
in visual manner. Based on the results the sequence data can be processed
using the fastx-toolkit.

Running FastQC
In this exercise we will check the quality of the reads generated from spores of
Claviceps purpurea, an ergot fungus that infects the ears of wheat and other
related forage plants. The file was generated using Illumina single end reads
sequencing at Source Bioscience. FastQC is installed on your computer. Load and
analyse the file ‘Claviceps.fastq’ by typing the following in your screen:
fastqc Claviceps.fastq
The process of analysing may take a few minutes. After the analysis, transfer the
html file to your local drive using WinSCP and view it using your favourite browser
(e.g. Mozilla Firefox).
Quality visualisation:
A QC report contains several modules. For example, the report file will have a
Basic Statistics table and various graphs and tables for different quality statistics.
For a complete tutorial on the different modules of FASTQC report, open the
following link:
http://www.bioinformatics.babraham.ac.uk/projects/fastqc/Help/3%20Analysis%20Modules/
Table 1 FastQC Basic Statistics table
Filename Claviceps.fastq
File type Conventional base calls
Encoding Sanger / Illumina 1.9
Total Sequences 4284245
Filtered Sequences 0
Sequence length 100
%GC 48
In addition, FastQC reports information about the quality scores of the reads.

per base sequence quality plot: visual output from FastQC. Base positions in the reads are shown on x‐axis and quality
score (Q Score) are shown on the Y‐axis.
Q-scores:
A quality score (or Q‐score) expresses an error probability. In particular, it serves as a
convenient and compact way to communicate very small error probabilities.
Given an assertion, A, the probability that A is not true, P(~A), is expressed by a
quality score, Q(A), according to the relationship:
Q(A) =-10 log10(P(~A))
where P(~A) is the estimated probability of an assertion A being wrong.
The relationship between the quality score and error probability is demonstrated with the
following table:
Quality score, Q(A) Error probability, P(~A)
10 0.1
20 0.01
30 0.001
40 0.0001

Questions:
1. How many sequences were there in your file? What is the read length?
___________________________________________________________________________
Does the quality score value vary throughout the read length? (hint: look at the 'per base
sequence quality plot') _________________________________________________________
What is the quality score range you see? __________________________________________
2. At around which position do the score start falling below Q20?
___________________________________________________________________________
3. How can we trim the reads to filter out the low quality data?
__________________________________________________________________________
4. Why does the quality deteriorate at the end of Illumina reads? http://arep.med.harvard.edu/pdf/Fuller_09.pdf
___________________________________________________________________________

Sequencing errors can complicate the downstream analysis, which normally
requires that reads be aligned to each other (for genome assembly) or to a
reference genome (for detection of mutations). Sequence reads containing
errors may lead to ambiguous paths in the assembly or improper gaps. In
variant analysis projects sequence reads are aligned against the reference
genome. The errors in the reads may lead to more number of mismatches
than expected due to mutations alone. But if these errors can be removed or
corrected, the reads alignment and hence the variant detection will improve.
The assemblies will also improve after pre-processing the reads with errors.
Read Trimming:
The read trimming can be done in a variety of ways. Choose a
method which best suits your data. Here we are giving examples of
fixed-base trimming and quality score-based trimming.
1. Fixed Length Trimming:
Low quality read ends can be trimmed using a fixed length trimmer. We will use the
fastx_trimmer from the fastx-toolkit. Type 'fastx_trimmer -h' at anytime to
display the various options you can use with this tool.
In order to do fixed trimming with the fastq file ‘Claviceps.fastq' use the
following command. The output will be stored as
'Claviceps_fixed_trimmed.fastq'.
#go to your home directory
cd ~
#copy the file to your home directory cp /nfs/projects/training/RNASeq/Claviceps.fastq ./
#display options
fastx_trimmer –h
fastx_trimmer -f 1 -l 80 –i Claviceps.fastq \
-o Claviceps_fixed_trimmed.fastq
Run FastQC on the resulting file.

Table 2 FastQC Basic Statistics table
Filename Claviceps.fastq
File type
Conventional base calls
Encoding Sanger / Illumina 1.9
Total Sequences 40000
Filtered Sequences 0
Sequence length 80
%GC 48
per base sequence quality plot: visual output fromFastQC. Base positions in the reads are shown on x-axis and quality
score (Q Score) are shown on the Y-axis.

2. Quality Based Trimming:
Base call quality scores can also be used for trimming sequence end. A quality
score threshold and minimum read length after trimming can be used to
remove low quality data. Using the same input file (Claviceps.fastq), trim the
sequence reads using the following commands:
cd ~
fastq_quality_trimmer -h
fastq_quality_trimmer -t 20 -l 50 \
-i Claviceps.fastq \
-o Claviceps.quality.fastq
Note: You will have to change the output folder if you run similar files, e.g.
change it to:
-o Claviceps.quality.fastq
If you don’t change the output folder, then these results will overwrite
previous output with similar output file name.
Again, run FastQC on the resulting file.
Table 3 FastQC Basic Statistics table (This is a sample table)
Filename Claviceps.fastq
File type Conventional base calls
Encoding Sanger / Illumina 1.9
Total Sequences 38976
Filtered Sequences 0
Sequence length 50-100
%GC 48

Questions:
1. How did the quality score range change with two types of trimming? ___________________
___________________________________________________________________________
2. Did the number of total reads change after two types of trimming? ____________________
___________________________________________________________________________
3. What reads lengths were obtained after quality based trimming? ______________________
___________________________________________________________________________
4. Did you observe adapter sequences in the data?
___________________________________________________________________________

Advanced Options:
1. Adapter Clipping
Sometime sequence reads may end up getting the leftover of adapters and
primers used for the sequencing process. It's a good practice to screen your
data for these possible contaminations for more sensitive alignment and
assembly based analysis. This is usually a necessary steps in sequencing
projects where read lengths are longer than the molecule sequenced, for
example when sequencing miRNAs.
Various QC tools are available to screen and/or clip these adapter/primer
sequences from your data. (e.g. FastQC, fastx, cutadapt)
Here we are demonstrating 'fastx_clipper' to trim a given adapter sequence.
Use 'fastx_clipper -h' to display help at anytime.
cd ~
fastx_clipper -h
fastx_clipper -v -l 20 -M 15 \
-a <sequence to be trimmed> \ -i Claviceps.fastq -o Claviceps.adapter.clipped.fastq
An alternative tool, not installed on this system, for adapter clipping is 'fastq-mcf'. A
list of adapters is provided as a list in a text file. For more information, see:
http://code.google.com/p/ea-utils/wiki/FastqMcf
2. Removing Duplicates
Duplicate reads are the ones having the same start and end coordinates. This
may be the result of technical duplication (too many PCR cycles), or over-
sequencing (very high fold coverage). It is very important to put the
duplication level in context of your experiment. For example, duplication level
in targeted or re-sequencing projects may mean different than in RNA-seq
experiments. In RNA‐seq experiments oversequencing is usually necessary
when detecting the low expressed transcripts.
The duplication level computed by FastQC is based on sequence identity at
the end of reads. Another tool, Picard, determines duplicates based on
identical start and end positions.
We will not perform removal of duplicates since we will be doing differential
expression analysis. However, we provide the following for your information.
Picard is a suite of tools for performing many common tasks with SAM/BAM
format files. For more information see the Picard website and information
about the various command-line tools available:
http://picard.sourceforge.net
One of the Picard tools (MarkDuplicates) can be used to analyse and remove
duplicates from the raw sequence data. The input for Picard is a sorted
alignment file in .bam format. Short read aligners such as, bowtie, BWA, tophat
etc. can be used to align fastq files against a reference genome to generate
SAM/BAM alignment format.
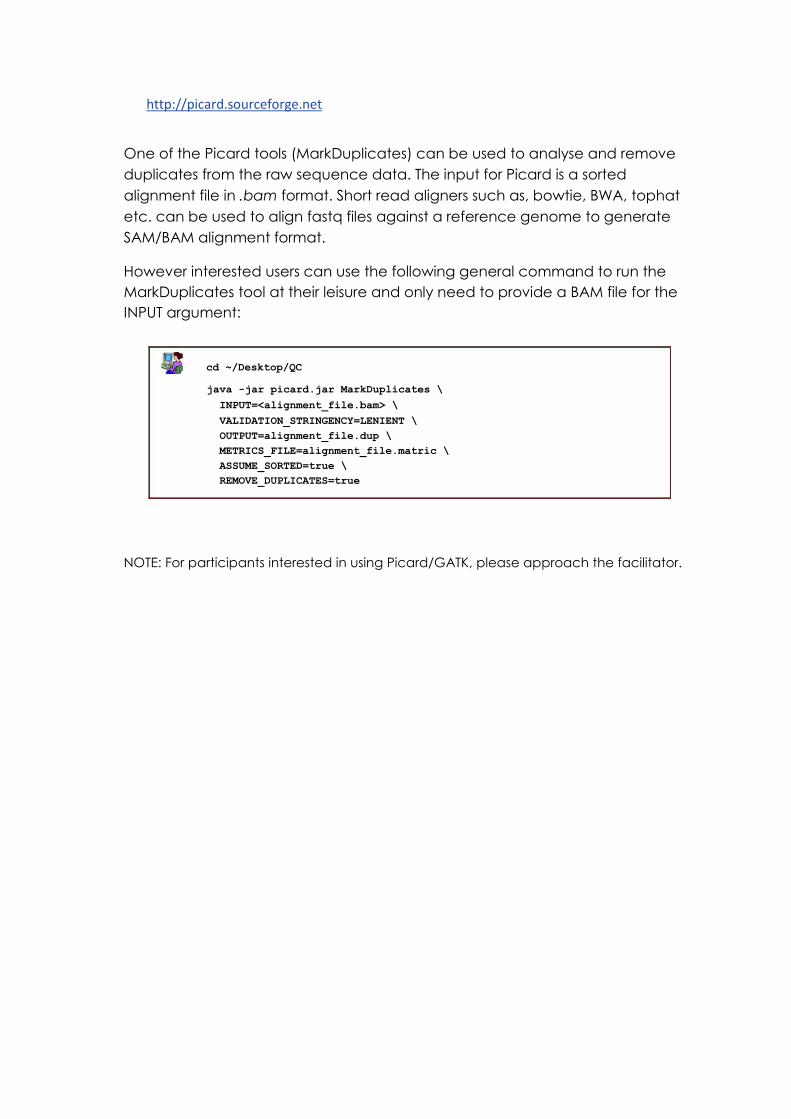
However interested users can use the following general command to run the
MarkDuplicates tool at their leisure and only need to provide a BAM file for the
INPUT argument:
cd ~/Desktop/QC
java -jar picard.jar MarkDuplicates \
INPUT=<alignment_file.bam> \
VALIDATION_STRINGENCY=LENIENT \
OUTPUT=alignment_file.dup \
METRICS_FILE=alignment_file.matric \
ASSUME_SORTED=true \
REMOVE_DUPLICATES=true
NOTE: For participants interested in using Picard/GATK, please approach the facilitator.