Embed Size (px)
Citation preview

QUALITY ASSURANCE PROGRAM PLAN Surface Water Monitoring & Assessment
Massachusetts Department of Environmental Protection
Division of Watershed Management-Watershed Planning Program 2020-2024
Massachusetts Department of Environmental Protection Bureau of Water Resources
Division of Watershed Management - Watershed Planning Program
CN # 520.1 August 2020

MassDEP-DWM Program QAPP (2020-2024) CN # 520.1 October, 2020 Page 2
QUALITY ASSURANCE PROGRAM PLAN Surface Water Monitoring & Assessment
2020-2024
DWM Control Number: 520.1
August 2020
COMMONWEALTH OF MASSACHUSETTS EXECUTIVE OFFICE OF ENERGY AND ENVIRONMENTAL AFFAIRS
Kathleen Theoharides, Secretary
DEPARTMENT OF ENVIRONMENTAL PROTECTION Martin Suuberg, COMMISSIONER
Kathleen Baskin, Assistant Commissioner for Water Resources
BUREAU OF WATER RESOURCES DIVISION OF WATERSHED MANAGEMENT
Lealdon Langley, Director
WATERSHED PLANNING PROGRAM Laura Blake, Director
QUALTTY ASSURAI{CE PROGRAM PLANSurface Water Monitoring & Assessment
202A-2024
DWM-WPP Control Number: 520.1Rev I.0
August 2020
DWM Watershed Planning Program Director:fi*-.--
Blake)'fe Iephone {508) 767 -2876" EmaiI: [email protected]
DWM-WPP Mon itoring Coordinator:
Telephon e {5 08} 7 67 -28 73, Emai I : Aithur. i ohnson @mass. eov
IIWNI-WPP Quality
'l'elephorre $Aq 7 67 -2789, Email: Suzanne,Flinr(}mass.gov
11t2t20
(Date)
October 30, 2020
,,f '. o/''t t Digitally signed by BRYAN
HOGAN,'-. 24i":-:'fi/*.u--i' Date: 2020.1 L02 1 1:13:05 -05'00'{JSEPA Region I Quality Assurance:
(Bryan i{ogan)Telephone (61 7) 9I 8-8634, EmaiI: I-iosan.Brvanf4,epa.goy
(Date)
LJSEPA Region I 'I'echnical Reviewer:Fa ber, Tom F. 3:1;i1i11:i,TiLi;fi?l;L['
(Toin Faber)Telephone (6 I 7) 9l 8- 8672, Email: Faber.Tom@,epa.gov
(l-late )
USEPA Region I Acting MA PPG P0:J E N N I F ER BRADY 3f.::lljfiilflj,;:,T5T,P#"
(Jennif'er Brady)Telephone (6 I 7) 9i 8-l 698, Email: Bradv.Jenniferl(ilepa.gov
(Date)
MassDEP-DWlvl Program QAPP (202e2024)cN # 520.1
October, 2020 Page 3 m

MassDEP-DWM Program QAPP (2020-2024) CN # 520.1 October, 2020 Page 4
FOREWORD
This Quality Assurance Program Plan (QAPP) pertains to surface water data collection by the Massachusetts Department of Environmental Protection (MassDEP), Division of Watershed Management’s (DWM), Watershed Planning Program (WPP). It addresses all chemical, physical and biological monitoring to be performed by DWM-WPP from 2020 through 2024 (with annual addendum updates). Appendices as part of this QAPP include stand-alone laboratory QA Plans, field and laboratory Standard Operating Procedures (SOPs), project-level QAPPs, Sampling and Analysis Plans (SAPs) and other supporting documentation. These are included as accompanying compressed files. For additional information that is not contained in this QAPP, see other applicable and current DEP policies, procedures and plans. DWM-WPP’s programmatic QAPP is generally consistent with the intent of USEPA’s Quality Policies (https://www.epa.gov/quality) and USEPA-Region 1 Quality Policies (https://www.epa.gov/quality/managing-quality-environmental-data-epa-region-1) EPA guidance and requirement documents used to guide development of this QAPP include: EPA Guidance on Systematic Planning using the Data Quality Objectives Process
(QA/G-4; EPA/240/B-06/001, February 2006) EPA Guidance for Quality Assurance Project Plans (QA/G-5; EPA/240/R-02/009,
December 2002) EPA Guidance on Choosing a Sampling Design for Environmental Data Collection
(QA/G-5S, EPA/240/R-02/005; December, 2002) EPA Guidance on Quality Assurance Project Plans for Modeling (QA/G-5M,
EPA/240/R-02/007; December, 2002) EPA Guidance for Standard Operating Procedures (QA/G-6, EPA/600/B-07/001; April
2007) EPA Guidance on Environmental Data Verification and Data Validation (QA/G-8,
EPA/240/R-02/004; November, 2002 and reissued January, 2008) EPA QAPP Guidance for Projects Using Only Existing (Secondary) Data, Rev. #2,
10/13/09, EPA-Region 1 Quality Assurance Project Plans (QA/R-5; EPA/240/B-01/003, March 2001 and reissued
May, 2006) Document Availability The 2020-2024 QAPP (main report and appendices) is available electronically at MassDEP’s web site: http://www.mass.gov/eea/agencies/massdep/water/watersheds/environmental-monitoring-quality-management-program.html This information can be made available in alternate formats upon request by contacting the American Disabilities Act (ADA) Coordinator at 617-292-5751.

MassDEP-DWM Program QAPP (2020-2024) CN # 520.1 October, 2020 Page 5
Acknowledgments Many thanks to the following DEP staff persons who contributed information and/or insights toward completion of this multi-year program QAPP and its implementation. DWM-WPP: Arthur Johnson, Richard Chase, Jane Ryder, Laurie Kennedy, Joan Beskenis, Pete Mitchell, Dan Davis, James Meek, Matt Reardon, Kari Winfield, Tom Dallaire, Therese Beaudoin, Jenny Sheppard, Allyson Yarra, Dahlia Tympanick, and Shervon DeLeon. WES Lab: Jean Tang, Madhuri Tummalapalli, Ron Stoner, Tess Burdin, Nina Duston, Carol Batdorf, Peter Piro, David Brierley, Michael Bebirian, and Oscar Pancorbo. USEPA-Region 1 provided financial support and technical assistance. EPA staff included Mary Jo Feuerbach, Katrina Kipp, Ernest Waterman, Dan Boudreau, Michael Dowling, and Tom Faber. Credits Cover photo: DWM-WPP Seasonal, Andrew Salant, sampling the Fall River in Greenfield, MA, August 2019 (photo credit: Daniel Davis). Individual watershed maps were created by Jane Ryder (MassDEP). Disclaimers References to trade names, commercial products and manufacturers in this QAPP does not constitute endorsement. Web links are provided for convenience and may not function if the URL address has changed.

MassDEP-DWM Program QAPP (2020-2024) CN # 520.1 October, 2020 Page 6
TABLE OF CONTENTS FOREWORD .................................................................................................................................. 4 SECTION A: PROJECT MANAGEMENT ................................................................................. 10 A3. DISTRIBUTION LIST ...................................................................................................... 10 A4. PROGRAM DESCRIPTION & ORGANIZATION ......................................................... 10 A5 PROGRAM GOALS AND OBJECTIVES ....................................................................... 16 A6 PROJECT SCHEDULING & COORDINATION ............................................................ 23 A7 DATA QUALITY OBJECTIVES AND CRITERIA ........................................................ 26 A8 TRAINING ........................................................................................................................ 51 A9 DOCUMENTATION AND RECORDS ........................................................................... 54 SECTION B: DATA GENERATION AND ACQUISITION...................................................... 60 B1 SAMPLING PROCESS DESIGN ..................................................................................... 60 B2 SAMPLING METHODS ................................................................................................... 78 B3 SAMPLE HANDLING AND TRACKING ...................................................................... 88 B4 ANALYTICAL METHODS ............................................................................................. 92 B5 QUALITY CONTROL .................................................................................................... 103 B6 FIELD EQUIPMENT TESTING, INSPECTION AND MAINTENANCE ................... 109 B7 LAB INSTRUMENT CALIBRATION, INSPECTION AND MAINTENANCE ......... 114 B8 INSPECTION OF SUPPLIES ......................................................................................... 118 B9 NON-DIRECT MEASUREMENTS & USE OF SECONDARY DATA ....................... 120 B10 DATA MANAGEMENT................................................................................................. 133 SECTION C: ASSESSMENT AND OVERSIGHT ................................................................... 137 C1 CORRECTIVE ACTIONS .............................................................................................. 137 C2 REPORTING ................................................................................................................... 140 SECTION D: DATA VALIDATION AND USEABILITY ...................................................... 143 D1 DATA REVIEW AND VALIDATION .......................................................................... 143 D2 DATA VALIDATION METHODOLOGY .................................................................... 147 D3 DATA USABILITY ........................................................................................................ 151 REFERENCES: .......................................................................................................................... 152 GLOSSARY: .............................................................................................................................. 159 APPENDICES ............................................................................................................................ 165 Appendix A: DWM-WPP Project QAPPs Appendix B: Massachusetts Probabilistic Monitoring and Assessment Program QAPP

MassDEP-DWM Program QAPP (2020-2024) CN # 520.1 October, 2020 Page 7
Appendix C: Collaborative Project QAPPs/SOPs Appendix D: DWM-WPP Annual Sampling & Analysis Plans (SAPs) for 2020 Appendix E: DWM-WPP Monitoring, Analytical and Data Management SOPs Appendix F: WES Laboratory QA Plan and SOPs Appendix G: Contract Lab QAPs and SOPs Appendix H: DWM-WPP Documentation Forms (examples) LIST OF FIGURES AND TABLES (Note: The watershed maps shown in this document comprise all the Commonwealth’s watersheds and are intended to provide general information) Figure 1: Program Organization (2020) (Updated July 2020) ...................................................... 12 Figure 2: Monitoring Networks for Multiple Water Management Objectives ............................. 17 Figure 3: DWM-WPP Historical WQ, Benthic and Fish Toxics Sampling Stations .................... 20 Figure 4: Massachusetts River Basins and Seven-Year Rotation ................................................. 21 Figure 5: Major Planning Tasks for DWM-WPP Watershed Monitoring Projects ...................... 24 Figure 6: Northeastern Highlands and Northeastern Coastal Plains Ecoregions .......................... 72 Figure 7: Macroinvertebrate Stream Classes in Southern New England ...................................... 74 Table 1: Program Roles and Responsibilities related to monitoring and data use ........................ 13 Table 2: Data Quality Objectives for DWM-WPP Monitoring .................................................... 30 Table 3: Types of DWM-WPP Training ....................................................................................... 51 Table 4: DWM-WPP Project Documentation and Data Records ............................................... 58 Table 5: Core and Supplemental Indicators .................................................................................. 63 Table 6: DWM-WPP Seven-Year Rotating Basin Cycle ............................................................. 65 Table 7: Assessment Prioritization (DRAFT) ............................................................................... 66 Table 8: DWM-WPP Field Method SOPs .................................................................................... 78 Table 9: DWM-WPP Field Equipment and Supplies ................................................................... 80 Table 10: Bottle Group Codes, Container Types and Field Preservation Methods ...................... 83 Table 11: DWM-WPP and SERO Lab Method SOPs .................................................................. 92 Table 12: WES, EPA and Contract Lab Analysis Method SOPs for DWM-WPP Samples ........ 93 Table 13: Analytical Methods and Holding Times ....................................................................... 96 Table 14: DWM-WPP Master Services Agreement List of Laboratory Vendors ...................... 100 Table 15: Operating Specifications for DWM-WPP Reagent Water System ............................. 104 Table 16: Field Sampling Quality Control Requirements for Water Quality Analytes .............. 105 Table 17: General Field & Laboratory QC Requirements for Biological Samples .................... 105 Table 18: Field and Laboratory QC Requirements for ATTENDED Multi-Probe .................... 106 Table 19: Field and Laboratory QC Requirements for UNATTENDED Loggers ..................... 107 Table 20: DWM-WPP Field Equipment Calibration, Inspection and Maintenance ................... 110 Table 21: DWM-WPP Analytical Instruments Calibration and Maintenance ............................ 115 Table 22: DWM-WPP Supplies .................................................................................................. 118 Table 23: Potential Secondary Data Providers to DWM-WPP .................................................. 125 Table 24: DWM-WPP Data Management SOPs ........................................................................ 133

MassDEP-DWM Program QAPP (2020-2024) CN # 520.1 October, 2020 Page 8
List of Acronyms: ACOE ............................. US Army Corps of Engineers AED ............................... Automated Electronic Defibrillation ANSI .............................. American National Standards Institute AVS................................ Acid Volatile Sulfide BMP ................................. Best Management Practice BOD ................................. Biochemical Oxygen Demand BPJ ................................. Best Professional Judgment BRP ................................ Bureau of Resource Protection BST ............................... Bacteria Source Tracking BWR .............................. Bureau of Water Resources BWR-WPP ..................... Bureau of Water Resources / Watershed Protection Program CAF ................................ Corrective Action Form COD ................................. Chemical Oxygen Demand CMR ............................... Code of Massachusetts Regulations CN ................................. Control Number (documents) CPR ................................ Cardiopulmonary Resuscitation CWA .............................. Clean Water Act CWF ............................... Cold Water Fishery DCR ............................... Massachusetts Department of Conservation and Recreation DMF ............................... Division of Marine Fisheries DMR ............................. Discharge Monitoring Report (NPDES) DO .................................. Dissolved Oxygen DFG................................ Department of Fish and Game DFW ............................... Department of Fisheries and Wildlife DPH................................ Department of Public Health DQO .............................. Data Quality Objective DWM ............................. Division of Watershed Management EDC................................ Endocrine Disrupting Compounds EEA ................................ Executive Office of Energy and Environmental Affairs EHSS .............................. Evidence of Human Sewage Source EPA ................................ United States Environmental Protection Agency EPT ................................ Ephemeroptera, Plecoptera, Trichoptera FPS ................................. Feet Per Second FWA .............................. Fluorescent Whitening Agents GPS ................................ Global Positioning System ILW ................................ Integrated List of Waters ISO ................................ International Organization for Standardization LFM ............................... Laboratory Fortified Matrix MAP2 ............................. Massachusetts Probabilistic Monitoring and Assessment Program MassDEP........................ Massachusetts Dept. of Environmental Protection MassGIS ......................... Massachusetts Geographic Information System MDL ............................... Method Detection Limit MPN ............................... Most Probable Number MRL ............................... Minimum Reporting Limit NERL ............................ New England Regional Laboratory (EPA)

MassDEP-DWM Program QAPP (2020-2024) CN # 520.1 October, 2020 Page 9
NPDES ........................... National Pollutant Discharge Elimination System PAH................................ Polycyclic Aromatic Hydrocarbon PALIS ............................ Pond and Lake Information System PCB ................................ Polychlorinated Biphenyl PFD ................................ Personal Flotation Device PPCP .............................. Pharmaceuticals and Personal Care Products QAP ............................... Quality Assurance Plan (laboratory) QAPP ............................. Quality Assurance Project Plan QA/QC ........................... Quality Assurance/ Quality Control QMP .............................. Quality Management Plan RBP ................................ Rapid Bioassessment Protocol SARIS ............................ Stream and River Inventory System SEM ............................... Simultaneously Extracted Metals SWQS ............................ Surface Water Quality Standards TALUs ........................... Tiered Aquatic Life Uses TMDL ............................ Total Maximum Daily Loads TNTC ............................. Too Numerous to Count TOXTD .......................... MassDEP DWM Toxicity Testing Database TSS ................................. Total Suspended Solids USGS ............................. United States Geological Survey WAAS ............................ Wide Area Augmentation System WBS ............................... Waterbody System Database WES ............................... Wall Experiment Station Laboratory WPP ............................... Watershed Planning Program WWF .............................. Warm Water Fishery WWTP ........................... Waste Water Treatment Plant List of Units: cfs ................................... cubic feet per second cfu .................................. colony forming unit mg/Kg ............................ milligram per kilogram mg/L ............................... milligram per liter mg/m3 ............................. milligram per cubic meter mi2 .................................. square mile mL .................................. milliliter µg/kg .............................. microgram per kilogram µg/L ................................ microgram per liter µS/cm ............................. microsiemens per centimeter ng.................................... nanogram ppb.................................. parts per billion ppm ................................ parts per million SU .................................. standard units

MassDEP-DWM Program QAPP (2020-2024) CN # 520.1 October, 2020 Page 10
SECTION A: PROJECT MANAGEMENT
A3. DISTRIBUTION LIST
The following groups have been made aware of this QAPP: MassDEP, DWM-WPP staff MassDEP QA Managers (DEP, BWR) Wall Experiment Station laboratory (selected staff persons) USEPA-New England (relevant staff persons)
Electronic copies of this QAPP have been placed on the DWM-WPP network drive, the MassDEP enterprise drive and the MassDEP website: https://www.mass.gov/guides/water-quality-monitoring-quality-management-program A4. PROGRAM DESCRIPTION & ORGANIZATION
This QAPP covers the ambient surface water monitoring conducted by the Massachusetts Department of Environmental Protection (MassDEP), Bureau of Water Resources (BWR), Division of Watershed Management’s Watershed Planning Program (DWM-WPP). MassDEP’s emphasis on a “quality system” approach forms the basis for DWM’s generation of usable data of documented quality. This approach is detailed in the EPA-approved MassDEP Quality Management Plan (QMP) for Federally Funded Programs (MassDEP 2015; MassDEP’s QMP will be updated in 2020). The MassDEP QMP is consistent with EPA’s Quality Policy and related guidance. The QAPP process is one part of a programmatic focus on data quality. As set forth in the departmental QMP, program-level and project-specific QAPPs, SOPs and other plans and policies, DWM-WPP strives to set and maintain a high standard for all its work. DWM-WPP is responsible for (or plays a primary role in) a variety of programs aimed at implementing the Clean Water Act (CWA). Among these are: Watershed-based Monitoring, Assessment and Implementation Development of Total Maximum Daily Load (TMDL) Implementation Plans Surface Water Quality Standards Non-Point Source (NPS) Pollution program, and Grants and Loans Program (§319, §604(b))

MassDEP-DWM Program QAPP (2020-2024) CN # 520.1 October, 2020 Page 11
A central component in implementing these programs is water quality monitoring to determine pollutant levels and loads, biotic metrics of ecological integrity, designated use impairments and attainments, and in general, the “state of the waters.” Monitoring performed as part of these programs meet the ten basic elements of a State water resource monitoring program outlined by EPA and the prerequisites of CWA §106(e)(1). These ten elements are generally as follows:
A detailed description of the key elements of Massachusetts water quality monitoring programs and strategy can be found in A Strategy for Monitoring and Assessing the Quality of Massachusetts’ Waters to Support Multiple Water Resource Management Objectives, 2016 - 2025 (https://www.mass.gov/doc/water-quality-monitoring-strategy-2016-2025/). Figure 1 provides an overview of specific personnel involved in data collection and use at DWM-WPP. Table 1 provides more detailed descriptions of the roles and responsibilities for these DWM staff and state/ contract laboratory staff (as of June 2020). Because DWM-WPP is responsible for monitoring statewide, program staff are based in Worcester, MA.
1. Monitoring Program Strategy: A comprehensive long-term monitoring program strategy that serves Massachusetts water quality management needs and addresses all State waters, including streams, rivers, lakes, reservoirs, estuaries, coastal areas, wetlands, and groundwater.
2. Monitoring Objectives: Monitoring objectives that are effective in generating data that serve management decision needs.
3. Monitoring Design: An approach and rationale for selection of sample sites that best serve the monitoring objectives. The monitoring program ultimately will integrate several monitoring designs (e.g., fixed station, intensive and screening-level monitoring, rotating basin, etc.) to meet the full range of decision needs.
4. Core and Supplemental Water Quality Indicators: Core indicators are selected to represent each applicable designated use, plus supplemental indicators selected according to site-specific or project-specific decision criteria.
5. Quality Assurance: Quality management plans and quality assurance program/project plans are developed and implemented (maintained and peer reviewed in accordance with EPA policy) to ensure the scientific validity of monitoring and laboratory activities, and to ensure that State reporting requirements are met.
6. Data Management: An electronic data system is developed and utilized for water quality, fish tissue, toxicity, sediment chemistry, habitat, biological data, with timely data entry (following appropriate metadata and State/Federal geo-locational standards) and public access.
7. Data Analysis/Assessment: The State has a methodology for assessing attainment of water quality standards based on analysis of various types of data (chemical, physical, biological, land use) from various sources, for all waterbody types and all State waters. The methodology includes criteria for compiling, analyzing, and integrating all readily available and existing information (e.g., volunteer monitoring data, discharge monitoring reports).
8. Reporting: The State produces timely, complete water quality reports and lists called for under federal regulatory requirements.
9. Programmatic Evaluation: The State, in consultation with its EPA Region, conducts periodic reviews of each aspect of its monitoring program to determine how well the program serves its water quality decision needs for all State waters, including all waterbody types.
10. General Support and Infrastructure Planning: Current and future resource requirements (funding, staff, training, laboratory resources) for fully implementing the monitoring program strategy.

MassDEP-DWM Program QAPP (2020-2024) CN # 520.1 October, 2020 Page 12
Figure 1: Bureau of Water Resources, Division of Watershed Manament, Watershed Planning Program Organization (2020) (Updated July 2020)

MassDEP-DWM Program QAPP (2020-2024) CN # 520.1 October, 2020 Page 13
Table 1: Program Roles and Responsibilities related to monitoring and data use
Personnel, Title and/or Primary role Responsibilities
Laura Blake, Program Director, Watershed Planning Program (WPP) Overall management of administrative and technical work by the Watershed Planning Program.
Arthur Johnson, Monitoring Coordinator Manages the planning and coordination of all environmental monitoring by BWR-WPP including technical oversight, staff assignments, and scheduling.
Richard Chase, Data & Assessment Coordinator Oversees CWA §305(b) assessments and management of DWM-WPP monitoring data and associated QA/QC
Barbara Kickham, TMDL Coordinator Manages development and implementation of Total Maximum Daily Loads (TMDLs) for State waters.
Richard Carey, Water Quality Standards Coordinator
Provides technical and administrative oversight in the development and evaluation of ambient water quality standards.
Matthew Reardon, Nonpoint Source Coordinator Oversees the §319 Nonpoint Source program and §604(b) programs, including grants administration and project review
Suzanne Flint, QA Officer
Overall quality assurance and quality control for environmental monitoring and data handling at DWM-WPP, including SOP development, training, data review and validation, QAPP development, QC reporting, coordination with labs and EPA, assists with calibration and maintenance of multi-probe instruments and other instrumentation as applicable.
Vacant, External Monitoring & Data Coordinator Outreach and coordination with statewide monitoring groups, data compilation and analysis, quality review of external data submittals
Allyson Yarra, Benthic Biologist Sampling, analysis and generation of valid data for benthic macroinvertebrates in rivers and streams, in order to assess aquatic life use and describe site-specific ecology.
Shervon DeLeon, Field and Lab Operations Coordinator
Oversees DWM-WPP field and laboratory operations including instrument calibration, post-field checks, maintenance, data uploads, and laboratory and field safety. Oversees analyses carried out in DWM-WPP labs and coordinates with QA Officer
James Meek, Matt Reardon, Pete Mitchell, Dan Davis, Dahlia Tympanick, Allyson Yarra; Monitoring Survey Coordinators
Designing sampling and analysis plans, coordinating surveys, performing waterbody assessment, preparing technical memoranda and related tasks
Holly Brown, Therese Beaudoin; TMDL coordinators
Developing sampling plans/designs and QAPPs for the TMDL-related sampling, as well as for any special TMDL surveys, training, modeling, project management, etc.

MassDEP-DWM Program QAPP (2020-2024) CN # 520.1 October, 2020 Page 14
Personnel, Title and/or Primary role Responsibilities
Meghan Selby, 604b Program Manages the 604b program including grants administration and project review
Dan Davis, Pete Mitchell; Fish Biologists Coordination of fish tissue and population surveys, and associated tasks including sample preparation, and validation and management of biological data. DEP representatives on interagency fish kill and fish toxics committees
Joan Beskenis, Benthic Biologist Sampling, analysis and generation of valid data for periphyton and cyanobacteria in rivers, streams and lakes
Laurie Kennedy, Jenny Peet, Jennifer Sheppard, misc. assessment staff; waterbody assessments
Coordinating waterbody assessments for designated uses (e.g., primary and secondary contact, aesthetics, aquatic life use, and fish consumption)
Tom Dallaire and Kari Winfield, Database Management
Manage DWM-WPP monitoring data, including downloading and processing of raw multi-probe data, data entry, LIMS and probe data processing, QC coordination, EQuIS and EDGE database development, data requests and public data delivery, database exports, etc.
Jane Ryder, data & assessment support Geo-referencing for DWM-WPP monitoring stations, fieldsheet quality control, database entry and proofing, ArcMap products, NPDES toxicity database coordination
Survey crews (BWR-WPP staff, seasonal employees)
Under the direction of the survey coordinators and survey crew leaders, conduct chemical, microbiological and biological survey crews following relevant DWM-WPP SOPs to collect data.
Nina Duston, Michael Bebirian, Jean Tang, Ron Stoner, Peter Piro, Carol Batdorf, Tess Burdin, David Brierley, Madhuri Tummalapalli, Beth McDonough, Lisa Jordan and others; Wall Experiment Station (WES) Lab, Lawrence, MA.
Responsible for specific lab management (microbiology, inorganic, organic, LIMS, etc.), sample analyses, quality control and data production at WES.
Oscar Pancorbo, Director Wall Experiment Station (WES) Lab, Lawrence, MA
Lab direction, management, technical oversight, quality assurance and lab data production related to the performance of water quality analyses according to established EPA/other methods and WES laboratory Standard Operating Procedures (SOPs).
Misc. labs under contract Overall lab management and technical oversight regarding the performance of water quality analyses and submittal of validated data to DWM-WPP in compliance with contractual arrangements.

MassDEP-DWM Program QAPP (2020-2024) CN # 520.1 October, 2020 Page 15
Taunton Watershed

MassDEP-DWM Program QAPP (2020-2024) CN # 520.1 October, 2020 Page 16
A5 PROGRAM GOALS AND OBJECTIVES
DWM-WPP’s surface water monitoring efforts support MassDEP’s programmatic goals and functions to preserve, protect, assess and restore water quality. In 2018, DWM-WPP coordinated with EPA to finalize a new 10-year Monitoring Strategy for 2016-2025 (MassDEP, 2017), superseding the 2005-2015 Monitoring Strategy (MassDEP, 2005). A brief history of MassDEP’s monitoring programs, from the 1970’s under the Massachusetts Division of Water Pollution Control to the present, is available in the Monitoring Strategy. The new Monitoring Strategy re-examines program priorities and data needs and sets forth a plan for achieving a comprehensive water resource monitoring program that continues to embody EPA’s fundamental ten elements and meets the prerequisites of §106(e)(1) of the CWA. The ultimate goal embodied in the Monitoring Strategy remains to implement a comprehensive monitoring program that serves all water quality management needs and addresses all water body types. As such, the monitoring program is designed to provide data and information from streams, rivers, lakes, reservoirs, estuaries, coastal areas and wetlands to support the major objectives listed below. Assess the status or condition of Massachusetts’ waters (CWA §305(b)) Develop, implement and evaluate pollution control strategies (CWA §303(d)) Develop policies and standards and identify emerging issues Measure the effectiveness of water quality management programs Maintain reserve monitoring capacity to respond to unforeseen data needs
Major themes, inherent to both the MassDEP’s water management programs and the monitoring elements that support them, are 1) the focus on the watershed as the fundamental planning unit for water quality management, 2) the assessment of biological communities, such as aquatic macroinvertebrates, fish, or algae as reliable indicators of water quality conditions and ecosystem health, 3) the application of new technology and streamlined systems for data processing and analysis to support monitoring and assessment activities, and 4) the formation and reliance on partnerships and collaboration to meet water quality goals. A total of eighteen monitoring program elements are recommended in the 2016-2025 Monitoring Strategy to meet the defined monitoring objectives. These monitoring elements include both probabilistic (random) and deterministic (targeted) sampling networks. Furthermore, these designs encompass both rotating watershed monitoring cycles as well as non-rotating, priority-driven schedules to support multiple objectives (Figure 2). (Individual elements are detailed below in Section B, Sampling Process Design).
NOTE for SECTION A5: See also annual sampling & analysis plans (SAPs) for additional, project-specific objectives. Stand-alone SAPs are developed each year, based on current monitoring needs.

MassDEP-DWM Program QAPP (2020-2024) CN # 520.1 October, 2020 Page 17
Probabilistic Monitoring: EPA encourages states to adopt networks of randomly selected sampling sites that will allow for statistically unbiased assessments that can be applied at larger scales (e.g., statewide). Because statistically-valid inferences can be drawn for an entire population of waterbodies by sampling a set of sites randomly selected from that population, a probabilistic design can, with a single sample at each site, provide a snapshot of the percentage of waters attaining water quality standards and supporting designated uses. A single sample at each site, however, does not allow for the assessment of individual waterbodies. Therefore, DWM-WPP added adequate spatial, temporal and analytical coverage to its random survey designs to assess the designated use support status, and identify causes and sources of impairment, for individual waterbodies. DWM-WPP completed probabilistic surveys of wadeable streams (2011-2015) and lakes and ponds (2016-2018), and will be conducting probabilistic surveys of coastal waters starting in 2020. Targeted Monitoring: Several targeted monitoring networks are also proposed to obtain the data and information needed to identify causes and sources of impairments, and to develop and implement control strategies, such as TMDLs, watershed-based plans, NPDES permits and BMPs. Furthermore, targeted monitoring may provide data to define new and emerging issues or to support the development of water quality standards and policies. Over the last 30 years DWM-WPP has sampled waterbodies throughout the state, primarily for water chemistry, pathogenic
Figure 2: Monitoring Networks for Multiple Water Management Objectives
MassDEP-DWM Program QAPP (2020-2024) CN # 520.1 October, 2020 Page 18
indicators, fish tissue contaminants and biological end-points, such as benthic macroinvertebrates and fish communities (Figure 3). Flexible Seven-Year Basin Rotation for Targeted Monitoring: The use of the watershed, or river basin, as a fundamental planning unit for water quality management was a guiding principle in the development of the first Monitoring Strategy, and it remains a goal of the DWM-WPP to resume targeted monitoring and assessment activities on a rotating watershed schedule. However, the need exists to maintain enough flexibility within that schedule to perform additional monitoring to meet other water management program needs. To that end, the DWM-WPP has established a sequential schedule that provides the opportunity for monitoring to be carried out in each watershed at least once every seven years, yet allows for monitoring resources to be disproportionately applied in each watershed to fulfill specific water resource management objectives (Figure 2). Massachusetts’ 27 major watersheds and coastal drainage areas have been arranged by geography (and hydrology) into four major groups, or cohorts (A-D), each consisting of from three to ten “basins”. In turn, each major cohort is subdivided into minor cohorts, each of which represents one year of the seven-year monitoring schedule (Figure 4). DWM-WPP will continue to employ technology and enhance monitoring functions through the deployment of metered probes, remote sensing, data loggers and other emerging technologies. Ongoing efforts will be maintained to automate data validation and enhance data flows, through the application of Geographical Information Systems (GIS) and specialized programming used to evaluate data and make watershed assessment and listing decisions. DWM-WPP continues work to improve its electronic data management systems and to implement measures for reporting and distributing water monitoring data and information to multiple end users in government, the private sector and the general public. To that end, in 2015, DWM-WPP procured a commercially available, off-the-shelf water data storage and retrieval system (EQuIS) that is capable of managing data from multiple water monitoring program elements and facilitates the transfer of DWM-WPP data and information to EPA’s Water Quality Exchange (WQX). The migration of historical water quality data from DWM-WPP warehouses into the new EQuIS database structure was finalized in March 2019. Field data collection using EQuIS-EDGE on tablets in the field for data collection is planned for rollout in 2021. As part of its long-term strategy, DWM-WPP aims to utilize monitoring data from or collaborate directly with other agencies and programs to supplement DWM-WPP’s. Other programs include, for example, the Massachusetts Drinking Water Program (surface water source waters), Massachusetts Division of Conservation and Recreation (Quabbin and Wachuset Reservoir data), Massachusetts Office of Coastal Zone Management, National Estuaries Partnership Programs (MassBays, Buzzards Bay, and Narragansett Bay), USGS, Massachusetts Wetlands Program, academic institutions, volunteer groups, and University of Massachusetts. Quality assurance for these programs are covered under program-specific QAPPs and are not addressed here. Numerous other external parties and organizations collect water quality data with the intent, in addition to their own program goals, that DWM-WPP will use that data for making use assessments and other watershed management decisions. To make better use of these external data sources, DWM-WPP is adding a staff position in 2020 to coordinate its outreach and communication with external groups, and to build more robust and expedient data review and analysis tools.

MassDEP-DWM Program QAPP (2020-2024) CN # 520.1 October, 2020 Page 19
In addition to monitoring and managing water resources at the watershed level and relying increasingly on partnerships to meet water quality objectives, a number of other program enhancements will be integrated into the strategic monitoring plan. For example, MassDEP will continue to emphasize the use of biological communities, such as macroinvertebrates and fish, as the most effective indicators of water quality conditions and ecosystem health and is evaluating various newer techniques for interpreting biological data (e.g., multi-metric indices; tiered aquatic life use). While the restoration of impaired waters will remain a primary goal of the MassDEP and its many partners, the preservation of healthy watersheds will also be emphasized. The surface water monitoring program is designed to not only identify impaired waters and support clean-up activities, but to highlight high-quality waters in need of further measures to ensure their protection. Consistent with EPA’s Healthy Watershed Initiative, protection measures may be implemented through the development of watershed-based plans and §319 grant projects. Of the eighteen monitoring program elements recommended in the 2016-2025 Monitoring Strategy, this QAPP is intended to cover the QA/QC requirements of the data collection by MassDEP-WPP. Collaborative projects and projects under the direction of other groups are covered in separate program-specific QAPPs.

MassDEP-DWM Program QAPP (2020-2024) CN # 520.1 October, 2020 Page 20
Figure 3: MassDEP-DWM-WPP Historical Water Quality, Benthic and Fish Toxics Sampling Stations 1994 – 2019 (Note: fish population stations not shown)

MassDEP-DWM Program QAPP (2020-2024) CN # 520.1 October, 2020 Page 21
Figure 4: Massachusetts River Basins and Seven-Year Rotation (Note: Boston Harbor sub-basins (Mystic, Neponset, Weymouth-Weir) not shown)

MassDEP-DWM Program QAPP (2020-2024) CN # 520.1 October, 2020 Page 22
Deerfield Watershed

MassDEP-DWM Program QAPP (2020-2024) CN # 520.1 October, 2020 Page 23
A6 PROJECT SCHEDULING & COORDINATION
The schedule and logistics for DWM-WPP’s annual monitoring seasons (typ. April through October) are dependent on several factors, including: available staff available resources (equipment, funds, laboratories, etc.) anticipated data needs (internal) requests for data (by external parties) availability of “external” data (gathered by external groups) related efforts by others (e.g., planned/on-going projects, monitoring, etc.)
In general, the typical schedule for planning and conducting DWM-WPP surveys and using data to generate reports and to make decisions is outlined in Figure 5. Coordination between DWM-WPP staff helps to formulate sampling plans. Information from other groups, such as USEPA, USGS, Mass. DCR, Mass. DFG, other Mass DEP programs, consultants and contractors and volunteer monitoring associations, also assists in allocating monitoring resources. DWM-WPP often requests and receives in-kind assistance from EPA-NE. This assistance can be for sampling, sample analysis, ambient toxicity testing, discharge compliance monitoring, or other EPA-NE capability. DWM-WPP Survey Coordinators play the lead role in planning and conducting field surveys for water quality, benthic macroinvertebrates, fish populations, fish tissue toxic contaminants, benthic algae, flow (as needed), and other project-specific survey needs. Survey planning usually includes the following tasks: Identification of sampling/data need Discussions with project partners and interested parties Development of project-specific Sampling & Analysis Plans Field-reconnaissance of watersheds to be sampled Designing economical and efficient field survey routes to be taken by survey crews Documenting required survey routing, station information and logistics in crew-specific
Survey Books Pre-logging samples into the WES State Laboratory Information Management System
(WinLIMS) Setting up fieldsheets and field tablets with preliminary information Scheduling field crew members and vehicles (with DWM-WPP’s Monitoring
Coordinator) Preparing crew-specific, pre-labeled sample containers, and Scheduling and assembling required field gear for field crews

MassDEP-DWM Program QAPP (2020-2024) CN # 520.1 October, 2020 Page 24
Figure 5: Major Planning Tasks for DWM-WPP Watershed Monitoring Projects
Planning
•Background research, data collection, outreach, internal discussions, etc.
•Project planning meetings
•Field reconnaissance (visits for station selection, logistics, etc.)
•Sampling & Analysis Plan (SAP) development and approval for each project
•Revisions to/approval of programmatic Quality Assurance Program Plan (QAPP)
• Survey training, scheduling, preparation and coordination
Sampling & Analysis
•Field Surveys (water quality, biological, habitat, etc.)
•Field audits & Lab Audits
Data Validation/ Reduction
•Water quality field data entry and WinLIMS EDD data transfer from lab(s) into database
•Biological sample preparation (fish toxics), processing and taxonomy (benthic macroinvertebrates)
•Biological data entry, QC and reduction/analyses (metric calculations, scoring)
•Water quality data validation and verification
•Report production for draft and final project technical memoranda and assessment reports

MassDEP-DWM Program QAPP (2020-2024) CN # 520.1 October, 2020 Page 25
Millers Watershed

MassDEP-DWM Program QAPP (2020-2024) CN # 520.1 October, 2020 Page 26
A7 DATA QUALITY OBJECTIVES AND CRITERIA
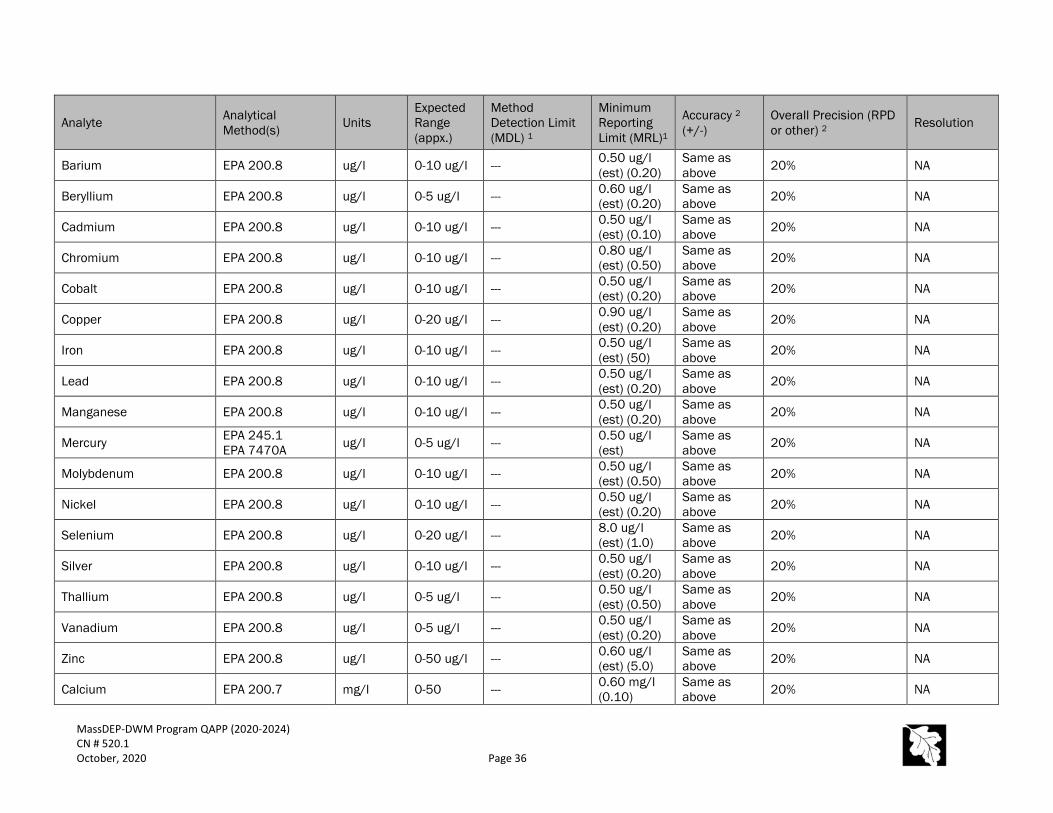
Quality assurance activities, as detailed in this and other DWM-WPP QAPPs, result in data of known and documented quality. Parameter-specific data quality objectives (DQOs) are outlined in Table 2. Failure to meet these planned DQOs may subject project data to qualification or censoring during post-monitoring quality control review, but decisions to censor or qualify data are not based solely on meeting DQOs. As outlined in Section D of this QAPP, DWM-WPP uses all available information and best professional judgement in its evaluation of data quality. Method detection and reporting limit information in Table 2 is based on the latest determinations by MassDEP’s Division of Environmental Analysis, Wall Experiment Station (WES) in Lawrence, MA, EPA’s New England Regional Laboratory (NERL) in North Chelmsford, MA., misc. private contract labs and DWM-WPP’s internal labs in Worcester, MA. In all cases, suitable method detection limits (MDLs) and minimum reporting limits (MRLs) are required for all analyses (e.g., MRLs < applicable criteria). Where applicable, “action levels” related to individual parameters in Table 2 can be found in Mass. most current surface water quality standards (314 CMR 4.00): https://www.mass.gov/lists/water-resources-regulations-and-standards#water-quality- . The data quality concepts of precision, accuracy, representativeness, completeness and comparability and sensitivity (PARCCS) are discussed below, along with other data quality issues, such as holding time, sensitivity and detection limits. While more commonly associated with quantitative chemical data, these concepts can also be applied to qualitative/quantitative physical and biological data, as applicable. For data quality issues related to DWM-WPP’s use of secondary data (generated by others), see Section B9 of this QAPP. A7.1 Accuracy
Accuracy is determined by how close a reported result is to a true or expected value and the degree to which bias is avoided or minimized. Laboratory accuracy will be determined by following the policy and procedures provided in the laboratory’s Quality Assurance Plan and analyte-specific DWM-WPP SOPs. These generally employ estimates of percent recoveries for known internal standards, matrix spikes and performance evaluation samples, and evaluation of blank contamination. Depending on the analyte, specific accuracy objectives can be concentration-based (e.g. +/- 0.010 mg/l at concentrations < 0.05 mg/l and + /- 20% at concentrations > 0.05 mg/l), or can be defined in terms of percent recovery percentages (e.g. 80-120 % recovery of matrix spike/PE sample).
MassDEP-DWM Program QAPP (2020-2024) CN # 520.1 October, 2020 Page 27
Accuracy for multi-probe measurements is tested prior-to-use using standards that bracket the measurement range and after use checked against standards to determine if probes remained in calibration at the end of the measurement period. An NIST-certified thermometer is used to periodically check thermometer accuracy. Lower limit accuracy for dissolved oxygen (DO) is checked using a zero DO standard. The post-sampling checks of each unit ensure that the readings taken during the survey(s) were within QC acceptance limits for each multi-probe analyte. Accuracy assessment for biological identifications usually entails confirmation of voucher specimens and/or random samples by expert peer(s). A7.2 Precision
Precision is a measure of the degree of agreement among repeated measurements and is estimated through sampling and analysis of replicate (e.g., duplicate, triplicate) samples. Laboratory precision of lab duplicates will be determined by following the policy and procedures provided in the laboratory’s Quality Assurance Plan and individual DWM-WPP SOPs. This varies depending on the lab and analyte, but typically involves analysis of same-sample lab duplicates and matrix spike duplicates. Overall precision objectives using relative percent difference (RPD) of field duplicate samples vary depending on the parameter and typically range from 10-25% RPD. DWM-WPP recognizes that precision estimates based on small numbers can result in relatively high RPDs (due to small number effect). Precision of the multi-probe measurements can be determined by taking duplicate (via a second placement of the unit) readings at the same station location. This is sometimes performed for lake surveys. Multi-probe precision objectives generally range from 5-10 % RPD depending on the parameter. In general, assessment of precision for biological samples typically involves comparison of identifications, counts and other measures by the same analyst and/or by separate analysts using same and duplicate samples. The type of QC sampling depends on the type of biological sample being collected. A7.3 Representativeness
Representativeness refers to the extent to which measurements characterize the true environmental condition. Sampling locations and survey times are selected to ensure that the samples taken represent typical field conditions at the time and location of sampling, and not anomalies due to uncommon effects. In some cases, stations are chosen to evaluate site-specific impacts (i.e. “hot spots”) which dictate the representativeness of distinct conditions. Other factors, such as seasonality and weather conditions, must be considered by data users when evaluating what the resulting data are representative of (e.g., wet weather water quality). A7.4 Completeness

MassDEP-DWM Program QAPP (2020-2024) CN # 520.1 October, 2020 Page 28
Completeness refers to the amount of valid data collected using a measurement system. It is expressed as a percentage of the number of valid measurements that should have been collected. For DWM-WPP monitoring, the completeness criterion is typically 80-100%. This assumes that, at most, one event out of five might be cancelled for some reason that could cause an incomplete data set with up to 20 % of the planned-on data not obtained. A7.5 Comparability
Comparability refers to the extent to which the data from a study is comparable to other studies conducted in the past or from other areas. For DWM-WPP monitoring, the use of standardized sampling and analytical methods, units of reporting, and site selection procedures help to ensure comparability of data. Review of existing data and methods used to collect historical data have been reviewed and taken into account in the sampling design. Efforts to enhance data comparability are made where possible and appropriate. A7.6 Sensitivity
Sensitivity characterizes the ability of the method or instrument to discriminate between measurement responses. The specifications for sensitivity are unique to each analytical instrument and are typically defined in laboratory Quality Assurance Plans (QAP) and SOPs. A7.7 Detection Limits
In general, detection limits define the smallest amount of analyte that can be detected above signal noise and within certain confidence levels. Typically, Method Detection Limits (MDL) are calculated in the laboratory by analyzing a minimum of seven low-level standard solutions using a specific method. (Detection limits in the traditional sense do not apply to some measurements such as pH and temperature that have essentially continuous scales.) Multiplication factors are typically applied to MDL values by labs to express Minimum Reporting Limits (MRL) which define a level above which there is greater confidence in reported values. Where low-level results are needed, DWM-WPP sometimes requests that labs, if possible, report results down to the MDL value with qualification as appropriate (rather than “<RDL”). A7.8 Holding Times
Most analytes have standard holding times (maximum allowed time from collection to analysis) that have been established to ensure analytical accuracy. Where established holding times are exceeded, violations are taken into account during the data validation process. A7.9 Standard Protocols
The use of approved field and laboratory SOPs by DWM-WPP and its agents provides a high level of assurance that programmatic data quality objectives shall be met consistently. As noted above, use of standard methodologies also helps data comparability and accuracy. A7.10 Performance Auditing
Subject to adequate time and resources, scheduled and unscheduled field audits are conducted by DWM-WPP’s QA Analyst to evaluate implementation of field methods, consistency with this QAPP and compliance with sampling SOPs. Ideally, field audits are planned for each DWM-WPP survey type (e.g., water quality, benthic macroinvertebrate, fish, etc.) and each survey crew

MassDEP-DWM Program QAPP (2020-2024) CN # 520.1 October, 2020 Page 29
member every monitoring season, but this does not happen in practice. Due to limited resources and multiple staff involved, DWM-WPP’s QA Analyst annually prioritizes which field audits to do. Proficiency testing of laboratory analytical accuracy and precision is usually performed for several analyte groups (e.g., nutrients, metals, chlorophyll a, bacteria). These are single- and/or double-blind lab QC audits using DMW-WPP-prepared solutions and purchased QC check samples. All audit results are compared to “true” values/results, evaluated against acceptance limit criteria and used to help validate the data. Results are also provided to lab analysts, survey coordinators and data users. A7.11 Modeling Projects
The data quality objectives for any modeling data generated by DWM-WPP or its agents are addressed in DWM-WPP’s most current version of its TMDL modeling QAPP (Appendix A).

MassDEP-DWM Program QAPP (2020-2024) CN # 520.1 October, 2020 Page 30
Table 2: Data Quality Objectives for DWM-WPP Monitoring
Analyte Analytical Method(s) Units
Expected Range (appx.)
Method Detection Limit (MDL) 1
Minimum Reporting Limit (MRL)1
Accuracy 2 (+/-)
Overall Precision (RPD or other) 2 Resolution
DWM-WPP Instruments (Hydrolab® Series 5; YSI EX01; Onset DO/T, Onset conductivity loggers, and Tidbit loggers; depth finder
Temperature SM 2550 °C 0-30° C NA NA +/- 0.15 °C +/- 0.2°C 0.01 °C
Temperature (deployed) SM 2550 °C 0-30° C NA NA +/- 0.3 °C +/- 0.3 °C between deployed and side-by-side QC reading
0.01 °C
pH SM 4500-H+ standard units 4-9 s.u. NA NA +/- 0.2 s.u. +/- 0.1 s.u. 0.01 s.u.
pH (deployed) SM 4500-H standard units 4-9 s.u. NA NA +/- 0.2 s.u.
+/- 0.4 s.u. between deployed and side-by-side QC reading
0.01 s.u.
Dissolved Oxygen (optic) HACH 10360 ASTM D888-05 mg/L 0-14 mg/L NA 0.2 mg/L +/- 0.2 mg/L +/- 0.2 mg/L 0.01 mg/L
Dissolved Oxygen (deployed) ASTM D888-05 mg/L 0-14 mg/L NA 0.2 mg/L +/- 0.2 mg/L
+/- 0.5 mg/L between deployed and side-by-side QC reading
0.01 mg/L
% Oxygen Saturation --- % 0.2-110 % NA NA +/- 2 % 5% 0.1 %
Specific Conductance SM 2510 µS/cm 75-700 µS/cm (fresh)
NA NA +/- 1% of reading 5% 4 digits
Specific Conductance (deployed) SM 2510 µS/cm
75-700 µS/cm (fresh)
NA NA +/- 2% of reading
5% between deployed and side-by side QC reading
4 digits
Total Dissolved Solids (TDS) - calculated value --- mg/l
50-5000 (fresh-brackish)
--- --- --- 10% 0.1 mg/L
Salinity SM 2520B PSU 0-35 NA NA 0.2 +/- 0.1 PSU 0.01 PSU
Turbidity ISO 7027 USGS TWRI Book 9 Section 6.7
NTU 0.1-100 NA NA 2 NTU 10% 0.1 NTU

MassDEP-DWM Program QAPP (2020-2024) CN # 520.1 October, 2020 Page 31
Analyte Analytical Method(s) Units
Expected Range (appx.)
Method Detection Limit (MDL) 1
Minimum Reporting Limit (MRL)1
Accuracy 2 (+/-)
Overall Precision (RPD or other) 2 Resolution
Chlorophyll fluorescence (in-vivo screening)
Turner SCUFA fluorometry YSI fluorometry probes (IVF)
ug/l (RFU) 0-100 0.2 1.0 --- 30% 0.1 ug/l
(0.1% RFU)
Phycocyanin (in-vivo screening)
YSI fluorometry (IVF, BGA-PC) Turner Cyclops 7
cells/ml (RFU) ug/l
0-200,000 0-500
220 (est.) 1 (est.)
500 2
--- 30%
1 cell/ml (0.1% RFU) 0.1 ug/L
Depth --- meters 0-10 NA 0.1 0.1 m 10% 0.01 m
Secchi disc (lakes) MassDEP protocol meters 0-5 m NA NA NA 10 % 0.1 m
Lake Bathymetry MassDEP protocol meters 0-100 m NA NA +/- 0.5 meter for indiv. datum
+/- 0.5 meter for indiv. datum 0.1 m
GPS MassDEP protocol meters --- NA NA +/- 2 meters (WAAS-corrected)
+/- 2 meters ---
Physico-chemical
Flow (Q) USGS TWRI Bk 3 cfs variable NA NA 15% (estimated) 15% (same crew) NA
Water velocity (V) USGS TWRI Bk 3, Book 8 Ch. B2 Indiv. protocols
fps 0-5 NA NA 2% (estimated) +/- 0.2 fps 0.001 fps
Staff gage readings USGS TWRI Bk 3 feet --- NA NA 0.01 +/- 0.02 feet 0.02 ft
Time-of-Travel USGS TWRI Bk 3 Reserved (ug/l (dye); hrs since injection; miles travelled; flow)

MassDEP-DWM Program QAPP (2020-2024) CN # 520.1 October, 2020 Page 32
Analyte Analytical Method(s) Units
Expected Range (appx.)
Method Detection Limit (MDL) 1
Minimum Reporting Limit (MRL)1
Accuracy 2 (+/-)
Overall Precision (RPD or other) 2 Resolution
Total Phosphorus (TP) Total Dissolved P (TDP) Dissolved Reactive P (DRP) Total Reactive P (TRP)
SM 4500-P F mg/L 0-0.15 0.001 0.002
80-120% recovery of QC standard and LFM <50 ppb, 5 ppb >50 ppb, 10%
<50 ppb, 5 ppb >50 ppb, 10% NA
Total Nitrogen (TN) Total Dissolved N (TDN)
SM 4500-N C mg/L 0-2 0.025 (est) 0.075
80-120 % recovery for QC std. and LFM
0.02 mg/L or 25% NA
Ammonia Nitrogen (NH3-N) SM 4500- G mg/L 0-0.5
mg/L 0.02 mg/L 0.04 mg/L
80-120% recovery for QC standard and LFM
0.01 mg/L or 20% NA
Nitrate-Nitrite-N (NO3-NO2-N) SM 4500-NO3 F mg/L 0-1 mg/L 0.02 mg/L 0.04 mg/L
80-120 % recovery for QC std. and LFM
0.02 mg/L or 25% NA
Total Kjeldahl Nitrogen (TKN) EPA 351.2 mg/L 0-1 mg/L --- 0.10 mg/L
80-120 % recovery for QC std. and LFM
0.02 mg/L or 25% NA
Total Suspended Solids (TSS) SM 2540D mg/L 0-100
mg/L --- 1.0 mg/L
80-120 % recovery for QC std. and/or LFM
1.5 mg/L or 40% NA
Turbidity SM 2130B NTU 1-100 NTU 0.2 NTU (est.) 0.5 NTU (est.)
1% of full scale (0-10) 5% full scale (0-100)
20% 0.01 NTU
Transparency tube --- cm Reserved
Salinity Refractometer PSU Reserved

MassDEP-DWM Program QAPP (2020-2024) CN # 520.1 October, 2020 Page 33
Analyte Analytical Method(s) Units
Expected Range (appx.)
Method Detection Limit (MDL) 1
Minimum Reporting Limit (MRL)1
Accuracy 2 (+/-)
Overall Precision (RPD or other) 2 Resolution
Alkalinity SM 2320B mg/l as CaCO3
Neg.-200 mg/L --- 2.0 mg/L
80-120 % recovery for QC std. and LFM <20 mg/L: 2 mg/l >20 mg/L: 10 %
2.0 mg/L or 20% NA
Hardness SM 2340B (and EPA 200.7)
mg/l as CaCO3
0-100 mg/L --- 2.0 mg/L
80-120 % recovery for QC std. and LFM for Ca and Mg (200.7 / 200.8 methods)
20% NA
Chloride SM-4500-Cl-E mg/l 0-100 mg/L --- 1.0 mg/L
90-110 % recovery for QC std. and LFM
20% NA
Biochemical Oxygen Demand (BOD-5 and 21-day “ultimate” BOD)
SM 5210B mg/l Reserved
Chemical Oxygen Demand (COD) EPA 5220B mg/l Reserved
Total Oxygen Demand (TOD) ASTM D6238-98 mg/l Reserved
Total Organic Carbon (TOC) and Dissolved Organic Carbon (DOC)
SM 5310B mg/l 0-10 mg/L 1.0 mg/L 1.0 mg/L
80-120 % recovery for QC std., lab fortified blank and matrix
20% NA

MassDEP-DWM Program QAPP (2020-2024) CN # 520.1 October, 2020 Page 34
Analyte Analytical Method(s) Units
Expected Range (appx.)
Method Detection Limit (MDL) 1
Minimum Reporting Limit (MRL)1
Accuracy 2 (+/-)
Overall Precision (RPD or other) 2 Resolution
Sulfate EPA 300.0 mg/l 0-10 mg/L 0.07 mg/L 0.15 mg/L est.
80-120 % recovery for QC std., lab fortified blank and matrix
20% NA
UVA254 SM 5910B cm -1 0-0.5 cm -1 0.1 cm -1 (est.) 0.1 cm -1 (est.)
Compare to expected absorbances of KHP QC stds. To verify RSD<20%
20% NA
Sodium EPA 200.7 mg/l 0-10 mg/l 0.20 mg/l
.50 (Na) est.
80-120 % recovery for QC std., LFB, LFM
20% NA
Potassium EPA 200.7 mg/l 0-10 mg/l 0.73 mg/l 2.0 mg/L est.
80-120 % recovery for QC std., LFB, LFM
20% NA
Silica EPA 200.7 mg/l 0-10 mg/l 0.03 mg/l 0.1 mg/l est.
80-120 % recovery for QC std., LFB, LFM
20% NA
Perchlorate EPA 314.0, 314.1, 314.2, 331.0 ug/l 0-5 0.2 (est.) 1.0 (est.)
80-120 % recovery for QC std. and lab fortified matrix
5 ug/L or 20% NA
Color (true) SM 2120C
CU 0-500 2 5
80-120% of standard <5 CU for blanks
<50 CU, 10 CU >50 CU, 20% 1 CU
Chlorophyll a (WPP lab) EPA 445.0 modified ug/l 0-100 0.1 1.0 75-125 %
for QC std. 2.0 ug/L or 20% 0.1 ug/L

MassDEP-DWM Program QAPP (2020-2024) CN # 520.1 October, 2020 Page 35
Analyte Analytical Method(s) Units
Expected Range (appx.)
Method Detection Limit (MDL) 1
Minimum Reporting Limit (MRL)1
Accuracy 2 (+/-)
Overall Precision (RPD or other) 2 Resolution
Microcystin-LR Abraxis ELISA ug/l 0-20 ug/l 0.15 ug/l 0.15 ug/l 0.20 ug/l (est.) 20% 0.10 ug/l
Microcystins (total) and Nodularins EPA 546 (ELISA) ug/l 0-100 ug/l --- 0.30 ug/l TBD 20% 0.01 ug/l
Anatoxin-a (total)
Eurofins Abraxis Anatoxin-a (Total) ELISA Product #520060
ug/l 0-100 ug/l 0.1 ug/l 0.15 ug/L TBD 20% 0.01 ug/l
Fluorescent Whitening Agents (FWA) 3 OB1 OB2 FWA1 FWA2 FWA4
SPE-HPLC-FL (WES) ug/l ---
0.20 ug/l 0.20 ug/l 0.01 ug/l 0.10 ug/l 0.20 ug/l
40-140% recovery for LFM and LFB
30% RSD
baseline separation of indiv. analytes
Optical Brighteners (WPP) DWM CN 58.0 P/A --- --- --- N.A. N.A. P/A test
Detergents (WPP) (CHEMets kit K-9400) EPA 425.1
mg/l linear ABS (eq. wgt. 325)
--- 0.125 mg/l 0.25 mg/l 0.5 mg/l (est.) 30%
0.25 mg/l (0-3 mg/l range)
Ammonia-N test strips (screening)
HACH Aquacheck (DL65059) mg/l 0-5 mg/l 0.125 mg/l
(est.) 0.25 mg/l 0.5 mg/l (est.) 30%
0.25 mg/l (0-6 mg/l range)
Metals (dissolved in water) 4
Aluminum EPA 200.8 ug/l 0-100 ug/l --- 40 ug/l (est) (5.0)
85-115 % recovery for QC std. and LFB 70-130% for LFM
20% NA
Antimony EPA 200.8 ug/l 0-20 ug/l --- 0.50 ug/l (est) (0.50)
Same as above 20% NA
Arsenic EPA 200.8 ug/l 0-20 ug/l --- 1.5 ug/l (est) (0.50)
Same as above 20% NA
MassDEP-DWM Program QAPP (2020-2024) CN # 520.1 October, 2020 Page 36
Analyte Analytical Method(s) Units
Expected Range (appx.)
Method Detection Limit (MDL) 1
Minimum Reporting Limit (MRL)1
Accuracy 2 (+/-)
Overall Precision (RPD or other) 2 Resolution
Barium EPA 200.8 ug/l 0-10 ug/l --- 0.50 ug/l (est) (0.20)
Same as above 20% NA
Beryllium EPA 200.8 ug/l 0-5 ug/l --- 0.60 ug/l (est) (0.20)
Same as above 20% NA
Cadmium EPA 200.8 ug/l 0-10 ug/l --- 0.50 ug/l (est) (0.10)
Same as above 20% NA
Chromium EPA 200.8 ug/l 0-10 ug/l --- 0.80 ug/l (est) (0.50)
Same as above 20% NA
Cobalt EPA 200.8 ug/l 0-10 ug/l --- 0.50 ug/l (est) (0.20)
Same as above 20% NA
Copper EPA 200.8 ug/l 0-20 ug/l --- 0.90 ug/l (est) (0.20)
Same as above 20% NA
Iron EPA 200.8 ug/l 0-10 ug/l --- 0.50 ug/l (est) (50)
Same as above 20% NA
Lead EPA 200.8 ug/l 0-10 ug/l --- 0.50 ug/l (est) (0.20)
Same as above 20% NA
Manganese EPA 200.8 ug/l 0-10 ug/l --- 0.50 ug/l (est) (0.20)
Same as above 20% NA
Mercury EPA 245.1 EPA 7470A ug/l 0-5 ug/l --- 0.50 ug/l
(est) Same as above 20% NA
Molybdenum EPA 200.8 ug/l 0-10 ug/l --- 0.50 ug/l (est) (0.50)
Same as above 20% NA
Nickel EPA 200.8 ug/l 0-10 ug/l --- 0.50 ug/l (est) (0.20)
Same as above 20% NA
Selenium EPA 200.8 ug/l 0-20 ug/l --- 8.0 ug/l (est) (1.0)
Same as above 20% NA
Silver EPA 200.8 ug/l 0-10 ug/l --- 0.50 ug/l (est) (0.20)
Same as above 20% NA
Thallium EPA 200.8 ug/l 0-5 ug/l --- 0.50 ug/l (est) (0.50)
Same as above 20% NA
Vanadium EPA 200.8 ug/l 0-5 ug/l --- 0.50 ug/l (est) (0.20)
Same as above 20% NA
Zinc EPA 200.8 ug/l 0-50 ug/l --- 0.60 ug/l (est) (5.0)
Same as above 20% NA
Calcium EPA 200.7 mg/l 0-50 --- 0.60 mg/l (0.10)
Same as above 20% NA

MassDEP-DWM Program QAPP (2020-2024) CN # 520.1 October, 2020 Page 37
Analyte Analytical Method(s) Units
Expected Range (appx.)
Method Detection Limit (MDL) 1
Minimum Reporting Limit (MRL)1
Accuracy 2 (+/-)
Overall Precision (RPD or other) 2 Resolution
Magnesium EPA 200.7 mg/l 0-10 --- 0.030 mg/l (0.10)
Same as above 20% NA
Organics
Extractable petroleum Hydrocarbons (EPH) MA EPH ug/l Reserved
(aliphatic:C9 - C18; C19 -C36) (aromatic: C11 - C22)
Pesticides (various)
EPA 507 EPA 508 EPA 608 EPA 8081A & 3510
ug/l Reserved
Polychlorinated Biphenyls (PCBs)
EPA 608 EPA 8082 & 3510 ug/l Reserved
Semi-volatile organics EPA 8270D/625 ug/l Reserved
Volatile organics EPA 8260B/624 ug/l Reserved
Emerging Contaminants (PPCPs, EDCs)
EPA 525.2 (modified) EPA 1694 EPA 1698 USGS O-2080-08
ng/l Reserved
Microplastics Pending Reserved
Per- and Polyfluoroalkyl Substances (PFAS) in surface waters
EPA 537.1, ver. 1 (EPA/600/R-18/352); isotope dilution
ng/l --- --- 2 ng/l (typ. 18-24 compounds)
70-130 % recovery for QC std. and LFB; 50-150% for LFM <MRL for blanks
30% RSD ---
Caffeine 3 Modified EPA 525.2 ug/l --- 0.016 ug/l 0.10 ug/l
70-130% recovery for LFM and LFB
30% ---

MassDEP-DWM Program QAPP (2020-2024) CN # 520.1 October, 2020 Page 38
Analyte Analytical Method(s) Units
Expected Range (appx.)
Method Detection Limit (MDL) 1
Minimum Reporting Limit (MRL)1
Accuracy 2 (+/-)
Overall Precision (RPD or other) 2 Resolution
Microbiological
E. coli, Enterococci bacteria (Colilert®, Enterolert®) @WES/DWM
SM 9223B MPN/100 ml
0-2420 (max. with quanti-tray for un-diluted samples
1 MPN/100 ml MPN of 1 /100 ml
Presence or >2420 MPN on positive control and absence or 0 (<RDL) for negative control
Within 50 CFUs, OR For Log10 duplicate data: <30% (<50 CFU) <20% (50-500 CFU) <10% (500-5000 CFU) < 5% (>5000 CFU)
NA
E. coli bacteria (modified MTEC MF) EPA 1603 cfu/100
ml 0-5000 5 cfu/100 ml 5 cfu/100 ml (WES lab)
“TNTC” on positive control and 0 or < RL for negative control
Within 50 CFUs, OR For Log10 duplicate data: <30% (<50 CFU) <20% (50-500 CFU) <10% (500-5000 CFU) < 5% (>5000 CFU)
NA
Fecal coliform bacteria (MF) SM 9222D cfu/100
ml 0-5000 5 cfu/100 ml 5 cfu/100 ml (WES lab)
“TNTC” on positive control and 0 or < RL for negative control
Same as above NA
Enterococci bacteria (MF) EPA 1600 cfu/100 ml 0-5000 5 cfu/100 ml 5 cfu/100
ml (WES) Same as above Same as above NA
Bacteroidetes human marker3
(HF134 @ 68C) WES nested PCR P/A --- --- ---
Confirmation using PCR, positive & negative controls and blanks
Confirmation of results using lab method duplicate
P/A test
Bacteroidetes human marker3
(HF183 @ 68C) WES nested PCR P/A --- --- --- Same as
above Same as above P/A test
Bacteroidetes Group Marker 3 (GB32 @55 C)
PCR (2000 AEM 66:1587-1594) P/A --- --- --- Same as
above Same as above P/A test

MassDEP-DWM Program QAPP (2020-2024) CN # 520.1 October, 2020 Page 39
Analyte Analytical Method(s) Units
Expected Range (appx.)
Method Detection Limit (MDL) 1
Minimum Reporting Limit (MRL)1
Accuracy 2 (+/-)
Overall Precision (RPD or other) 2 Resolution
Enterococcus faecium human marker 3 (esp gene)
PCR (2005 ES&T 39:283-287) P/A --- --- --- Same as
above Same as above P/A test
Biological
Macrophyte Percent Cover (lakes) MassDEP protocol 0-100% NA NA NA
NA (if true % cover were known, results would be expected to be +/- 20%)
NA
NA
Macrophyte Identification MassDEP protocol NA NA NA NA
Qualitative assessment by aquatic plant experts in DWM via spot checking/testing the accuracy of identification using the same plants.
Qualitative assessment based on same-plant identifications by other survey crewmembers
NA
Habitat Assessment
USEPA RBP III NA NA NA NA NA
Qualitative evaluation based on duplicate assessment by other survey crewmembers
NA

MassDEP-DWM Program QAPP (2020-2024) CN # 520.1 October, 2020 Page 40
Analyte Analytical Method(s) Units
Expected Range (appx.)
Method Detection Limit (MDL) 1
Minimum Reporting Limit (MRL)1
Accuracy 2 (+/-)
Overall Precision (RPD or other) 2 Resolution
Benthic Macroinvertebrates (taxonomy)
USEPA RBP III NA NA NA NA
Qualitative assessment: spot checks of taxonomic accuracy using the same samples by separate experts.
Qualitative assessment based on same-sample identification by other taxonomists in the group
NA
Benthic Macroinvertebrates (sample sorting efficiency)
USEPA RBP III NA NA NA NA >90% efficiency NA NA
Fish Population USEPA RBP III NA NA NA NA
Qualitative assessment, based on in-field or lab specimen verification by other trained DWM fish taxonomists (for fish type/sp.)
Qualitative and/or quantitative assessment based on replicate analysis of an adjacent reach by the same DWM taxonomists
NA
Ambient freshwater toxicity (acute, chronic)
EPA 2021.0 EPA 2002.0 Reserved
Sediment Quality
Total Organic Carbon EPA 9060 (Lloyd Kahn) g/kg dry --- --- 0.1 --- < 20% RPD for field
duplicates ---
Acute freshwater sediment toxicity (% survival and growth)
EPA/600/R-99/064 % --- NA NA
Statistical significance of survival and growth vs. test control
--- ---

MassDEP-DWM Program QAPP (2020-2024) CN # 520.1 October, 2020 Page 41
Analyte Analytical Method(s) Units
Expected Range (appx.)
Method Detection Limit (MDL) 1
Minimum Reporting Limit (MRL)1
Accuracy 2 (+/-)
Overall Precision (RPD or other) 2 Resolution
% Solids/ % water ASTM E203; SM 2540G % --- NA NA --- +/- 10 % for field
duplicates ---
Grain size ASTM D422 % of various sizes
--- NA NA --- +/- 15 % for field duplicates NA
Total Phosphorus (TP) EPA 3050B USGS I-6600-88 SM 4500-P-E
mg/kg dry Reserved
Total Nitrogen (TN) TBD mg/kg dry Reserved
Acid Volatile Sulfide (AVS)-Simultaneously Extracted Metals (SEM)
EPA, 1991
umol/g dry wt. (AVS) mg/kg dry wt. (SEM)
--- ---
AVS= 0.05 umol/g (2 ug/g) (see also metals RLs)
75-125 % recovery for aqueous lab QC stds. and lab fortified matrix
< 30% for field duplicates NA
Metals and Organics (in sediment)
Silver (Ag) EPA 200.7/EPA 6010B mg/kg dry --- --- (3) mg/kg
dry
70-130 % recovery for aqueous lab standards and LFM
< 30% for field duplicates NA
Aluminum (Al) EPA 200.7/EPA 6010B mg/kg dry --- --- (20) mg/kg
dry 70-130 % recovery < 30% NA
Arsenic (As) EPA 200.7/EPA 6010B mg/kg dry --- --- (10) mg/kg
dry 70-130 % recovery < 30% NA
Barium (Ba) EPA 200.7/EPA 6010B mg/kg dry --- --- (3) mg/kg
dry 70-130 % recovery < 30% NA
Beryllium (Be) EPA 200.7/EPA 6010B mg/kg dry --- --- (1) mg/kg
dry 70-130 % recovery < 30% NA
Calcium (Ca) EPA 200.7/EPA 6010B mg/kg dry --- --- (20) mg/kg
dry 70-130 % recovery < 30% NA
Cadmium (Cd) EPA 200.7/EPA 6010B mg/kg dry --- --- (3) mg/kg
dry 70-130 % recovery < 30% NA
Cobalt (Co) EPA 200.7/EPA 6010B mg/kg dry --- --- (3) mg/kg
dry 70-130 % recovery < 30% NA

MassDEP-DWM Program QAPP (2020-2024) CN # 520.1 October, 2020 Page 42
Analyte Analytical Method(s) Units
Expected Range (appx.)
Method Detection Limit (MDL) 1
Minimum Reporting Limit (MRL)1
Accuracy 2 (+/-)
Overall Precision (RPD or other) 2 Resolution
Chromium (Cr) EPA 200.7/EPA 6010B mg/kg dry --- --- (3) mg/kg
dry 70-130 % recovery < 30% NA
Copper (Cu) EPA 200.7/EPA 6010B mg/kg dry --- --- (3) mg/kg
dry 70-130 % recovery < 30% NA
Iron (Fe) EPA 200.7/EPA 6010B mg/kg dry --- --- (10) mg/kg
dry 70-130 % recovery < 30% NA
Potassium (K) EPA 200.7/EPA 6010B mg/kg dry --- --- (500)
mg/kg dry 70-130 % recovery < 30% NA
Magnesium (Mg) EPA 200.7/EPA 6010B mg/kg dry --- --- (20) mg/kg
dry 70-130 % recovery < 30% NA
Manganese (Mn) EPA 200.7/EPA 6010B mg/kg dry --- --- (2) mg/kg
dry 70-130 % recovery < 30% NA
Sodium (Na) EPA 200.7/EPA 6010B mg/kg dry --- --- (500)
mg/kg dry 70-130 % recovery < 30% NA
Nickel (Ni) EPA 200.7/EPA 6010B mg/kg dry --- --- (6) mg/kg
dry 70-130 % recovery < 30% NA
Lead (Pb) EPA 200.7/EPA 6010B mg/kg dry --- --- (10) mg/kg
dry 70-130 % recovery < 30% NA
Antimony (Sb) EPA 200.7/EPA 6010B mg/kg dry --- --- (10) mg/kg
dry 70-130 % recovery < 30% NA
Selenium (Se) EPA 200.7/EPA 6010B mg/kg dry --- --- (10) mg/kg
dry 70-130 % recovery < 30% NA
Thallium (Tl) EPA 200.7/EPA 6010B mg/kg dry --- --- (20) mg/kg
dry 70-130 % recovery < 30% NA
Vanadium (V) EPA 200.7/EPA 6010B mg/kg dry --- --- (3) mg/kg
dry 70-130 % recovery < 30% NA
Zinc (Zn) EPA 200.7/EPA 6010B mg/kg dry --- --- (3) mg/kg
dry 70-130 % recovery < 30% NA
Mercury (Hg), total EPA 200.7/EPA 6010B mg/kg dry --- --- --- 70-130 %
recovery < 30% NA
PCB Arochlor 1232 EPA 8082/3541 µg/g dry --- 0.026 µg/g dry 0.078 µg/g dry
65-135 % recovery for lab QC stds. and LFM
< 30% for field duplicates NA
PCB Arochlor 1242 EPA 8082/3541 µg/g dry --- 0.0052 µg/g dry 0.0156 µg/g dry
65-135 % recovery < 30% NA

MassDEP-DWM Program QAPP (2020-2024) CN # 520.1 October, 2020 Page 43
Analyte Analytical Method(s) Units
Expected Range (appx.)
Method Detection Limit (MDL) 1
Minimum Reporting Limit (MRL)1
Accuracy 2 (+/-)
Overall Precision (RPD or other) 2 Resolution
PCB Arochlor 1248 EPA 8082/3541 µg/g dry --- 0.012 µg/g dry 0.036 µg/g dry
65-135 % recovery < 30% NA
PCB Arochlor 1254 EPA 8082/3541 µg/g dry --- 0.011 µg/g dry 0.033 µg/g dry
65-135 % recovery < 30% NA
PCB Arochlor 1260 EPA 8082/3541 µg/g dry --- 0.040 µg/g dry 0.120 µg/g dry
65-135 % recovery < 30% NA
HCCP EPA 8081A/ 3541 µg/g dry --- 0.075 µg/g dry 0.225 µg/g dry
60-140 % recovery for lab QC stds. and LFM
< 30% NA
Trifluralin EPA 8081A/ 3541 µg/g dry --- 0.079 µg/g dry 0.237 µg/g dry
60-140 % recovery < 30% NA
HCB EPA 8081A/ 3541 µg/g dry --- 0.035 µg/g dry 0.105 µg/g dry
60-140 % recovery < 30% NA
a-BHC EPA 8081A/ 3541 µg/g dry --- 0.0024 µg/g dry 0.0072 µg/g dry
60-140 % recovery < 30% NA
b-BHC EPA 8081A/ 3541 µg/g dry --- 0.0083 µg/g dry 0.0249 µg/g dry
60-140 % recovery < 30% NA
Lindane EPA 8081A/ 3541 µg/g dry --- 0.0037 µg/g dry 0.0111 µg/g dry
60-140 % recovery < 30% NA
d-BHC EPA 8081A/ 3541 µg/g dry --- 0.0054 µg/g dry 0.0162 µg/g dry
60-140 % recovery < 30% NA
Heptachlor EPA 8081A/ 3541 µg/g dry --- 0.0030 µg/g dry 0.0090 µg/g dry
60-140 % recovery < 30% NA
Aldrin EPA 8081A/ 3541 µg/g dry --- 0.0026 µg/g dry 0.0078 µg/g dry
60-140 % recovery < 30% NA
Heptachlor Epoxide EPA 8081A/ 3541 µg/g dry --- 0.0023 µg/g dry 0.0069 µg/g dry
60-140 % recovery < 30% NA
DDE EPA 8081A/ 3541 µg/g dry --- 0.0024 µg/g dry 0.0072 µg/g dry
60-140 % recovery < 30% NA
DDD EPA 8081A/ 3541 µg/g dry --- 0.0024 µg/g dry 0.0072 µg/g dry
60-140 % recovery < 30% NA
DDT EPA 8081A/ 3541 µg/g dry --- 0.0044 µg/g dry 0.0132 µg/g dry
60-140 % recovery < 30% NA
Methoxychlor EPA 8081A/ 3541 µg/g dry --- 0.0051 µg/g dry 0.0153 µg/g dry
60-140 % recovery < 30% NA

MassDEP-DWM Program QAPP (2020-2024) CN # 520.1 October, 2020 Page 44
Analyte Analytical Method(s) Units
Expected Range (appx.)
Method Detection Limit (MDL) 1
Minimum Reporting Limit (MRL)1
Accuracy 2 (+/-)
Overall Precision (RPD or other) 2 Resolution
Chlordane EPA 8081A/ 3541 µg/g dry --- 0.063 µg/g dry 0.189 µg/g dry
60-140 % recovery < 30% NA
Toxaphene EPA 8081A/ 3541 µg/g dry --- 0.074 µg/g dry 0.222 µg/g dry
60-140 % recovery < 30% NA
Phenol EPA 8270C µg/g dry --- 0.26 µg/g dry 0.78 µg/g dry
60-140 % recovery for lab QC stds. and LFM
< 30% NA
2-Chlorophenol EPA 8270C µg/g dry --- 0.32 µg/g dry 0.96 µg/g dry
60-140 % recovery < 30% NA
2-Nitrophenol EPA 8270C µg/g dry --- 0.17 µg/g dry 0.51 µg/g dry
60-140 % recovery < 30% NA
Dichlorophenol EPA 8270C µg/g dry --- 0.33 µg/g dry 0.99 µg/g dry
60-140 % recovery < 30% NA
Naphthalene EPA 8270C µg/g dry --- 0.17 µg/g dry 0.51 µg/g dry
60-140 % recovery < 30% NA
4-Chloro-3-methylphenol EPA 8270C µg/g dry --- 0.32 µg/g dry 0.96 µg/g dry
60-140 % recovery < 30% NA
Trichlorophenol EPA 8270C µg/g dry --- 0.37 µg/g dry 1.11 µg/g dry
60-140 % recovery < 30% NA
Dimethyl phthalate EPA 8270C µg/g dry --- 0.32 µg/g dry 0.96 µg/g dry
60-140 % recovery < 30% NA
Acenaphthylene EPA 8270C µg/g dry --- 0.36 µg/g dry 1.08 µg/g dry
60-140 % recovery < 30% NA
Acenaphthene EPA 8270C µg/g dry --- 0.35 µg/g dry 1.05 µg/g dry
60-140 % recovery < 30% NA
Fluorene EPA 8270C µg/g dry --- 0.32 µg/g dry 0.96 µg/g dry
60-140 % recovery < 30% NA
Diethyl phthalate EPA 8270C µg/g dry --- 0.13 µg/g dry 0.39 µg/g dry
60-140 % recovery < 30% NA
Pentachlorophenol EPA 8270C µg/g dry --- 0.17 µg/g dry 0.51 µg/g dry
60-140 % recovery < 30% NA
Phenanthrene EPA 8270C µg/g dry --- 0.13 µg/g dry 0.39 µg/g dry
60-140 % recovery < 30% NA
Anthracene EPA 8270C µg/g dry --- 0.27 µg/g dry 0.81 µg/g dry
60-140 % recovery < 30% NA

MassDEP-DWM Program QAPP (2020-2024) CN # 520.1 October, 2020 Page 45
Analyte Analytical Method(s) Units
Expected Range (appx.)
Method Detection Limit (MDL) 1
Minimum Reporting Limit (MRL)1
Accuracy 2 (+/-)
Overall Precision (RPD or other) 2 Resolution
Fluoranthene EPA 8270C µg/g dry --- 0.13 µg/g dry 0.39 µg/g dry
60-140 % recovery < 30% NA
Pyrene EPA 8270C µg/g dry --- 0.08 µg/g dry 0.24 µg/g dry
60-140 % recovery < 30% NA
Butyl-benzo-phthalate EPA 8270C µg/g dry --- 0.11 µg/g dry 0.33 µg/g dry
60-140 % recovery < 30% NA
Bis(2-ethylhexyl)adipate EPA 8270C µg/g dry --- 0.10 µg/g dry 0.3 µg/g dry 60-140 % recovery < 30% NA
Benzo(a)anthracene EPA 8270C µg/g dry --- 0.08 µg/g dry 0.24 µg/g dry
60-140 % recovery < 30% NA
Chrysene EPA 8270C µg/g dry --- 0.23 µg/g dry 0.69 µg/g dry
60-140 % recovery < 30% NA
Benzo(b)fluoranthene EPA 8270C µg/g dry --- 0.10 µg/g dry 0.3 µg/g dry 60-140 % recovery < 30% NA
Benzo(k)fluoranthene EPA 8270C µg/g dry --- 0.08 µg/g dry 0.24 µg/g dry
60-140 % recovery < 30% NA
Benzo(a)pyrene EPA 8270C µg/g dry --- 0.26 µg/g dry 0.78 µg/g dry
60-140 % recovery < 30% NA
Indeno(,2,3-cd)pyrene EPA 8270C µg/g dry --- 0.27 µg/g dry 0.81 µg/g dry
60-140 % recovery < 30% NA
Dibenzo-a,h-Anthracene EPA 8270C µg/g dry --- 0.19 µg/g dry 0.57 µg/g dry
60-140 % recovery < 30% NA
Benzo-ghi-perylene EPA 8270C µg/g dry --- 0.17 µg/g dry 0.51 µg/g dry
60-140 % recovery < 30% NA
Total PAHs --- µg/g dry --- --- --- --- --- NA Pesticides (various) Reserved
Polychlorinated Biphenyls (PCBs) Reserved
Extractable Petroleum Hydrocarbons (EPH) Reserved
VOCs EPA 5035A EPA 8260B (SW-846)
Reserved

MassDEP-DWM Program QAPP (2020-2024) CN # 520.1 October, 2020 Page 46
Analyte Analytical Method(s) Units
Expected Range (appx.)
Method Detection Limit (MDL) 1
Minimum Reporting Limit (MRL)1
Accuracy 2 (+/-)
Overall Precision (RPD or other) 2 Resolution
Per- and Polyfluoroalkyl Substances (PFAS) in sediments
Reserved
Fish Tissue Toxics 5
-Length Fish Processing SOP mm 150-
800mm N/A N/A 0.1 mm 0.1 mm NA
-Weight (wet) Fish Processing SOP
Grams wet 80-4000 g N/A N/A 20 g 20 g NA
-Age Fish Processing SOP years 1-10 years N/A N/A +/- 1 yrs +/-1 yrs NA
-Sex Fish Processing SOP --- --- --- --- --- --- ---
-Condition Fish Processing SOP --- --- --- --- --- --- ---
-Gonad Weight Fish Processing SOP
Grams wet 0.1-60 N/A N/A 20 g 20 g NA
Lipids Thermo AN #337 % 2-40% N/A N/A 25% 30% NA
Arsenic EPA 6010D ug/g wet 0-1 ug/g 0.60 ug/g 25% 30% NA Cadmium EPA 6010D ug/g wet 0-1 ug/g 0.20 ug/g 0.60 ug/g 25% 30% NA Lead EPA 6010D ug/g wet 0-1 ug/g 0.20 ug/g 0.60 ug/g 25% 30% NA Mercury EPA 7473 ug/g wet 0-5 ug/g 0.002 ug/g 0.006 ug/g 25% 30% NA Selenium EPA 6010D ug/g wet 0-1 ug/g 0.60 ug/g 25% 30% NA PCB Arochlor 1232 EPA 8082A ug/g wet 0-5 ug/g 0.010 ug/g 25% 30% NA PCB Arochlor 1242 EPA 8082A ug/g wet 0-5 ug/g 0.010 ug/g 25% 30% NA PCB Arochlor 1248 EPA 8082A ug/g wet 0-5 ug/g 0.010 ug/g 25% 30% NA PCB Arochlor 1254 EPA 8082A ug/g wet 0-5 ug/g 0.010 ug/g 25% 30% NA PCB Arochlor 1260 EPA 8082A ug/g wet 0-5 ug/g 0.010 ug/g 25% 30% NA Chlordane EPA 8081B ug/g wet 0-5 ug/g 0.20 ug/g 25% 30% NA Toxaphene EPA 8081B ug/g wet 0-5 ug/g 0.20 ug/g 25% 30% NA a-BHC EPA 8081B ug/g wet 0-5 ug/g 0.010 ug/g 25% 30% NA b-BHC EPA 8081B ug/g wet 0-5 ug/g 0.010 ug/g 25% 30% NA

MassDEP-DWM Program QAPP (2020-2024) CN # 520.1 October, 2020 Page 47
Analyte Analytical Method(s) Units
Expected Range (appx.)
Method Detection Limit (MDL) 1
Minimum Reporting Limit (MRL)1
Accuracy 2 (+/-)
Overall Precision (RPD or other) 2 Resolution
Lindane EPA 8081B ug/g wet 0-5 ug/g 0.0060 ug/g 0.010 ug/g 25% 30% NA d-BHC EPA 8081B ug/g wet 0-5 ug/g 0.028 ug/g 0.010 ug/g 25% 30% NA Hexachloro-cyclopentadiene EPA 8081B ug/g wet 0-5 ug/g 0.010 ug/g 0.10 ug/g 25% 30% NA
Hexachlorobenzene EPA 8081B ug/g wet 0-5 ug/g 0.084 ug/g 0.10 ug/g 25% 30% NA Endosulfan I EPA 8081B ug/g wet 0-5 ug/g 0.0031 ug/g 0.010 ug/g 25% 30% NA Trifluralin EPA 8081B ug/g wet 0-5 ug/g 0.047 ug/g 0.010 ug/g 25% 30% NA Heptachlor EPA 8081B ug/g wet 0-5 ug/g 0.0060 ug/g 0.010 ug/g 25% 30% NA Heptachlor Epoxide EPA 8081B ug/g wet 0-5 ug/g 0.014 ug/g 0.010 ug/g 25% 30% NA Methoxychlor EPA 8081B ug/g wet 0-5 ug/g 0.026 ug/g 0.010 ug/g 25% 30% NA DDD EPA 8081B ug/g wet 0-5 ug/g 0.007 ug/g 0.010 ug/g 25% 30% NA DDE EPA 8081B ug/g wet 0-5 ug/g 0.010 ug/g 0.010 ug/g 25% 30% NA DDT EPA 8081B ug/g wet 0-5 ug/g 0.011 ug/g 0.010 ug/g 25% 30% NA Endosulfan I EPA 8081B ug/g wet 0-5 ug/g 0.021 ug/g 0.010 ug/g 25% 30% NA Aldrin EPA 8081B ug/g wet 0-5 ug/g 0.0080 ug/g 0.010 ug/g 25% 30% NA Endrin EPA 8081B ug/g wet 0-5 ug/g 0.0036 ug/g 0.010 ug/g 25% 30% NA
PCNB EPA 8082A % 50-150 ug/g NA NA 40% NA NA
PCB Congener BZ # 8 EPA 8082A ug/g wet 0-0.02 ug/g 0.0024 ug/g 0.0072
ug/g 25% 30% NA
PCB Congener BZ #11 EPA 8082A ug/g wet 0-0.02 ug/g --- 0.020 ug/g 25% 30% NA
PCB Congener BZ # 18 EPA 8082A ug/g wet 0-0.02 ug/g 0.020 ug/g 25% 30% NA
PCB Congener BZ # 28 EPA 8082A ug/g wet 0-0.02 ug/g 0.020 ug/g 25% 30% NA
PCB Congener BZ # 44 EPA 8082A ug/g wet 0-0.02 ug/g 0.020 ug/g 25% 30% NA
PCB Congener BZ # 52 EPA 8082A ug/g wet 0-0.02 ug/g 0.020 ug/g 25% 30% NA
PCB Congener BZ# 66 EPA 8082A ug/g wet 0-0.02 ug/g 0.020 ug/g 25% 30% NA
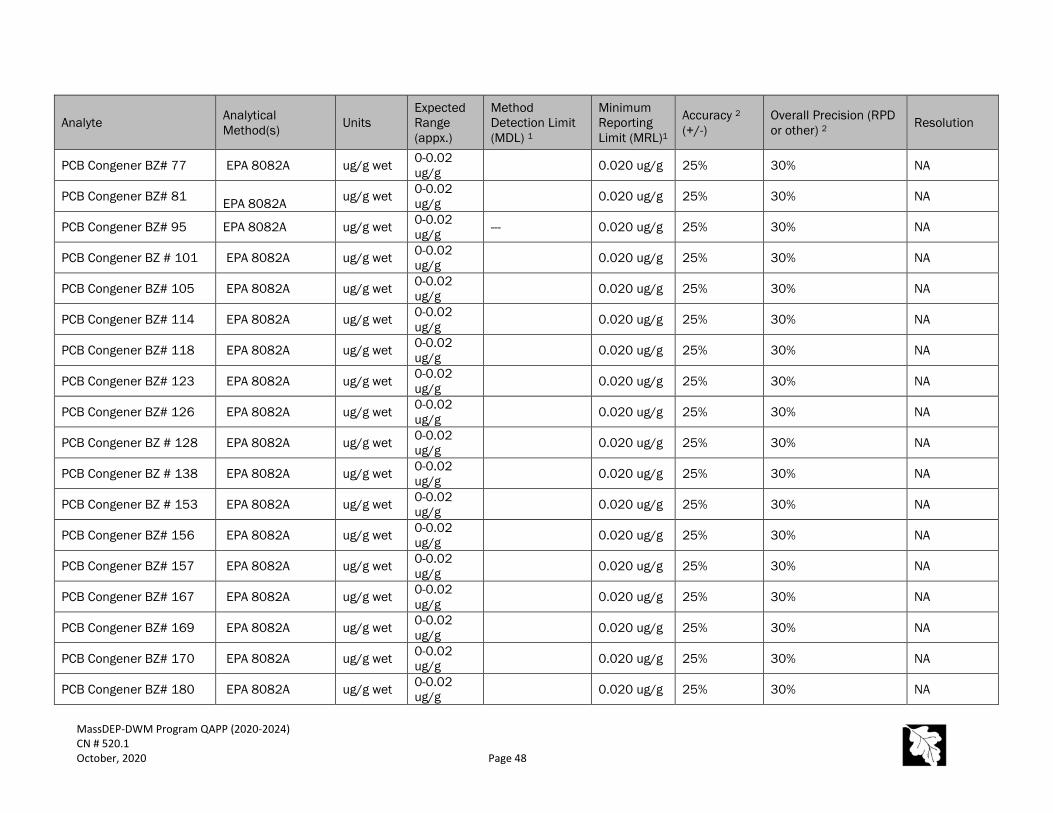
MassDEP-DWM Program QAPP (2020-2024) CN # 520.1 October, 2020 Page 48
Analyte Analytical Method(s) Units
Expected Range (appx.)
Method Detection Limit (MDL) 1
Minimum Reporting Limit (MRL)1
Accuracy 2 (+/-)
Overall Precision (RPD or other) 2 Resolution
PCB Congener BZ# 77 EPA 8082A ug/g wet 0-0.02 ug/g 0.020 ug/g 25% 30% NA
PCB Congener BZ# 81 EPA 8082A ug/g wet 0-0.02
ug/g 0.020 ug/g 25% 30% NA
PCB Congener BZ# 95 EPA 8082A ug/g wet 0-0.02 ug/g --- 0.020 ug/g 25% 30% NA
PCB Congener BZ # 101 EPA 8082A ug/g wet 0-0.02 ug/g 0.020 ug/g 25% 30% NA
PCB Congener BZ# 105 EPA 8082A ug/g wet 0-0.02 ug/g 0.020 ug/g 25% 30% NA
PCB Congener BZ# 114 EPA 8082A ug/g wet 0-0.02 ug/g 0.020 ug/g 25% 30% NA
PCB Congener BZ# 118 EPA 8082A ug/g wet 0-0.02 ug/g 0.020 ug/g 25% 30% NA
PCB Congener BZ# 123 EPA 8082A ug/g wet 0-0.02 ug/g 0.020 ug/g 25% 30% NA
PCB Congener BZ# 126 EPA 8082A ug/g wet 0-0.02 ug/g 0.020 ug/g 25% 30% NA
PCB Congener BZ # 128 EPA 8082A ug/g wet 0-0.02 ug/g 0.020 ug/g 25% 30% NA
PCB Congener BZ # 138 EPA 8082A ug/g wet 0-0.02 ug/g 0.020 ug/g 25% 30% NA
PCB Congener BZ # 153 EPA 8082A ug/g wet 0-0.02 ug/g 0.020 ug/g 25% 30% NA
PCB Congener BZ# 156 EPA 8082A ug/g wet 0-0.02 ug/g 0.020 ug/g 25% 30% NA
PCB Congener BZ# 157 EPA 8082A ug/g wet 0-0.02 ug/g 0.020 ug/g 25% 30% NA
PCB Congener BZ# 167 EPA 8082A ug/g wet 0-0.02 ug/g 0.020 ug/g 25% 30% NA
PCB Congener BZ# 169 EPA 8082A ug/g wet 0-0.02 ug/g 0.020 ug/g 25% 30% NA
PCB Congener BZ# 170 EPA 8082A ug/g wet 0-0.02 ug/g 0.020 ug/g 25% 30% NA
PCB Congener BZ# 180 EPA 8082A ug/g wet 0-0.02 ug/g 0.020 ug/g 25% 30% NA

MassDEP-DWM Program QAPP (2020-2024) CN # 520.1 October, 2020 Page 49
Analyte Analytical Method(s) Units
Expected Range (appx.)
Method Detection Limit (MDL) 1
Minimum Reporting Limit (MRL)1
Accuracy 2 (+/-)
Overall Precision (RPD or other) 2 Resolution
PCB Congener BZ # 187 EPA 8082A ug/g wet 0-0.02 ug/g 0.020 ug/g 25% 30% NA
PCB Congener BZ# 189 EPA 8082A ug/g wet 0-0.02 ug/g 0.020 ug/g 25% 30% NA
PCB Congener BZ # 195 EPA 8082A ug/g wet 0-0.02 ug/g 0.020 ug/g 25% 30% NA
PCB Congener BZ # 206 EPA 8082A ug/g wet 0-0.02 ug/g 0.020 ug/g 25% 30% NA
PCB Congener BZ # 209 EPA 8082A ug/g wet 0-0.02 ug/g 0.020 ug/g 25% 30% NA
Per- and Polyfluoroalkyl Substances (PFAS)4 EPA 537 ng/g wet 0-100
ng/g Est. 0.5-1 ng/g --- 25% 30% NA
1) Detection and reporting limit information in Table 2 is based primarily on the WES lab, unless otherwise noted for DWM-WPP and other labs. 2) Accuracy and precision goals are based on potential error introduced via both field and lab activity. The analytical method limits are published in the analytical method and/or provided by the lab, as are the achievable laboratory limits. Multi-Probe information for accuracy, precision and resolution is based on manufacturer’s specifications. RPD precision objectives relate to field duplicates. 3) These analytes comprise the Evidence of Human-Sewage Source (EHSS) suite of tests performed at WES as part of bacteria source tracking studies to assist in locating and fixing microbial pollution sources. 4) Metals RL information in parentheses ( ) indicates RLs attainable by the EPA backup lab in North Chelmsford, MA. 5) Fish tissue PCB/pesticide MDL/MRL values are based on most recent analyses by WES, and as all DL values, subject to change. PAH analysis for fish tissue samples is not normally performed for DWM samples, and so DQO’s for these are not presented here. PFAS EPA Method 537 for fish tissue has not yet been implemented at WES; estimated DQOs.

MassDEP-DWM Program QAPP (2020-2024) CN # 520.1 October, 2020 Page 50
Islands Watershed

MassDEP-DWM Program QAPP (2020-2024) CN # 520.1 October, 2020 Page 51
A8 TRAINING
Annual and/or as needed training in field and laboratory methods and procedures is provided to staff (full time and seasonals) to ensure consistent adherence to SOPs and data quality. The main focus of this training is to review both the fundamentals and finer details of sample collection, associated documentation, lab requirements and protocols and safety issues. Types of available training is summarized in Table 3. Training is dependent on the specific type of monitoring planned and the level of staff experience (e.g., if flow surveys are not currently planned, then flow training is not provided). If, however, the need arises during the season, addition training is scheduled prior to actual survey. Most of the training done annually focuses on seasonal staff. Table 3: Types of DWM-WPP Training
Training Description Trainer(s)
CPR-AED and First Aid * Practice of Cardiopulmonary Resuscitation (CPR), Automated Electronic Defibrillation (AED) and first aid techniques to rescue and aid victims
American Red Cross and/or ARC-certified MassDEP instructors
Health & Safety Discussion of safety precautions both in the field and in the lab Shervon DeLeon, Dan Davis
Multi-probe Use Discussion and practicum on how to use Hydrolab and YSI multi-probe units in the field to collect water quality data (single-use and deployment)
Shervon DeLeon, Dahlia Tympanick, Suzanne Flint
Water quality surveys (general)
Discussion of survey preparation, field procedures and special considerations (e.g., clean metals sampling) for stream and pond surveys
James Meek, Dan Davis, Pete Mitchell, subject matter-expert staff
Lake Monitoring Review of SOPs for lake/pond surveys, including safety, boat use, sampling gear, aquatic plant identification, etc.
James Meek, Dahlia Tympanick
Benthic Macroinvertebrate and Periphyton surveys
Field and lab instruction on survey preparation, sample collection, field data collection, sample sorting, etc.
Allyson Yarra, Joan Beskenis (respectively)
Electrofishing surveys How to assist in performing electrofishing surveys safely and with minimal field error (fish toxics and populations)
Dan Davis, Pete Mitchell
E. coli by Colilert® (also Enterolert®)
Review of SOP for sample analysis at DWM-WPP lab, including safety and waste management issues
Shervon DeLeon, Suzanne Flint, Richard Chase
Flow Discussion and practicum on proper preparation and performance of flow surveys, including use of velocity meters and data processing
Richard Chase
Chlorophyll a How to perform sampling & analysis for chlorophyll a content in water and biological samples Joan Beskenis
Color, turbidity and hardness analyses
How to perform lab analyses for true color, total hardness and turbidity (WPP lab)
Shervon DeLeon, Suzanne Flint, Richard Chase
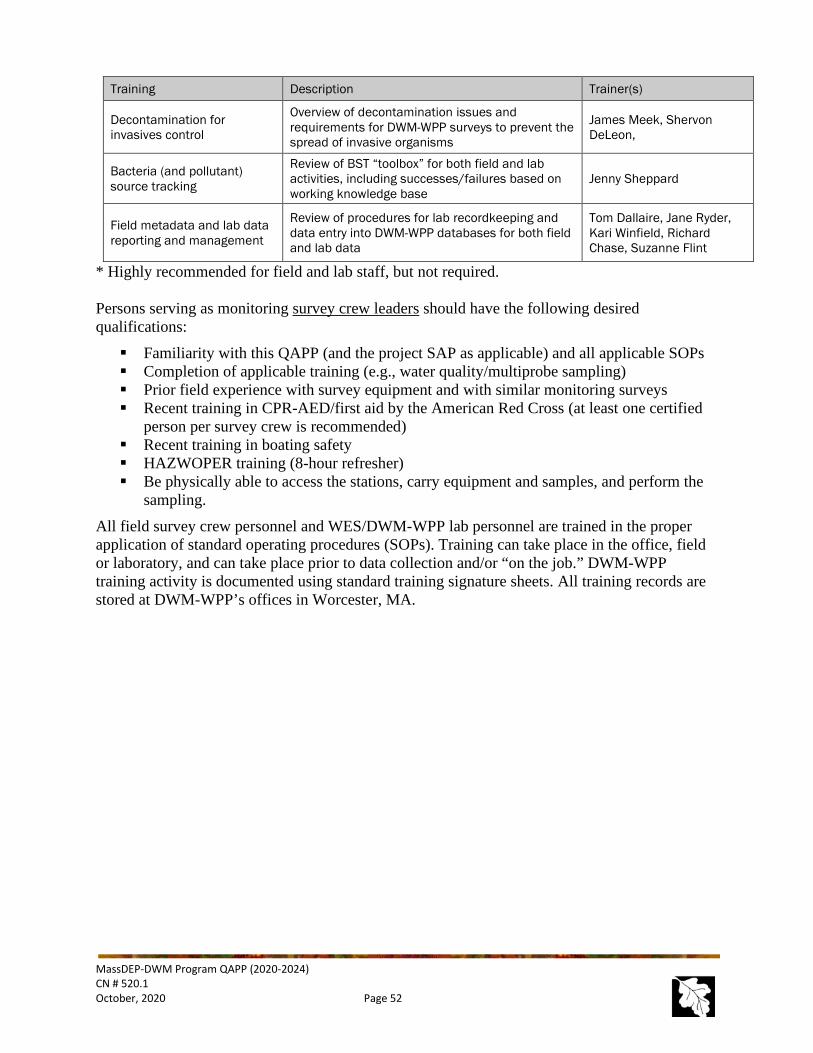
MassDEP-DWM Program QAPP (2020-2024) CN # 520.1 October, 2020 Page 52
Training Description Trainer(s)
Decontamination for invasives control
Overview of decontamination issues and requirements for DWM-WPP surveys to prevent the spread of invasive organisms
James Meek, Shervon DeLeon,
Bacteria (and pollutant) source tracking
Review of BST “toolbox” for both field and lab activities, including successes/failures based on working knowledge base
Jenny Sheppard
Field metadata and lab data reporting and management
Review of procedures for lab recordkeeping and data entry into DWM-WPP databases for both field and lab data
Tom Dallaire, Jane Ryder, Kari Winfield, Richard Chase, Suzanne Flint
* Highly recommended for field and lab staff, but not required. Persons serving as monitoring survey crew leaders should have the following desired qualifications: Familiarity with this QAPP (and the project SAP as applicable) and all applicable SOPs Completion of applicable training (e.g., water quality/multiprobe sampling) Prior field experience with survey equipment and with similar monitoring surveys Recent training in CPR-AED/first aid by the American Red Cross (at least one certified
person per survey crew is recommended) Recent training in boating safety HAZWOPER training (8-hour refresher) Be physically able to access the stations, carry equipment and samples, and perform the
sampling. All field survey crew personnel and WES/DWM-WPP lab personnel are trained in the proper application of standard operating procedures (SOPs). Training can take place in the office, field or laboratory, and can take place prior to data collection and/or “on the job.” DWM-WPP training activity is documented using standard training signature sheets. All training records are stored at DWM-WPP’s offices in Worcester, MA.

MassDEP-DWM Program QAPP (2020-2024) CN # 520.1 October, 2020 Page 53
Ipswich Watershed

MassDEP-DWM Program QAPP (2020-2024) CN # 520.1 October, 2020 Page 54
A9 DOCUMENTATION AND RECORDS
A9.1 Field Records
Observations made and measurements taken in the field are recorded on standardized DWM-WPP Field Sheets (paper) through 2021. In 2021 DWM-WPP will be implementing the use of EQuIS Data Gathering Engine (EDGE) software running on ruggedized field tablets to collect field data previously collected on paper field sheets. Field data collected will be uploaded directly to DWM-WPP’s EQuIS water quality database. EDGE software/data forms will be reviewed annually and updated as needed. For the first field season or until data collection using the tablets is fully field tested, field data will continue to be collected on paper field sheets as backup (waterproof “Rite-in-the-Rain” paper is used exclusively). Paper field sheets are scanned to create an electronic backup record. EDGE software has been customized to collect the same information previously collected on Fieldsheet including the following. To be implemented on EDGE in 2021: “Rivers & Streams” “Lakes & Ponds” “Lake Shoreline” “Pipes and Conduits” “Bacteria Source Tracking”
Later implementation on EDGE: “Multi-Probe Deployment” “Habitat Assessment Field Scoring” “Biomonitoring Field Data” (benthic surveys) “Fish Collection Data & Inventory” (fish tissue toxics) “Macrophyte Distribution Map” (lake-specific outline maps) “Fish Field Data” (fish population) “Stream Walk” (pollution source tracking) “Probabilistic Site Evaluation”
Samples of selected completed DWM-WPP Field Sheets can be found in Appendix H. While each fieldsheet type is unique, common information recorded on field sheet forms/EDGE includes, but is not limited to: Site name and watershed location Station Description (including GPS coordinates) Station Access Information Sample Name and ID # Personnel on-site performing the sampling Dates and times of sample collection Pertinent observations regarding uses (aquatic life, recreation, etc.) Summary of weather conditions Site observations and any aberrant sample handling comments

MassDEP-DWM Program QAPP (2020-2024) CN # 520.1 October, 2020 Page 55
Sample collection information (sample collection methods and devices, sample collection depth /heights, sample preservation information, matrix sampled, etc.).
Certain information that will not change can be pre-filled out prior to the survey to save time in the field. Other information that is time-, location- and/or condition-specific is entered at the station ONLY. Completed EDGE forms are uploaded at the end of each survey. Any paper sheets (for surveys for which EDGE has not yet been implemented) should be filled out completely using (blue) ink pens. Upon completion of the survey, each completed paper field sheet is submitted to the QA Analyst for hard copy filing. Survey guidebooks are provided to each crew lead by the Survey Coordinator. These books contain detailed driving directions and maps to each sequential sampling station, along with photos, helpful hints, contact information and survey-specific emergency hospital locations. Multiprobe and Deployed Logger Files Electronic records include field data and calibration files from attended and unattended multiprobe and single probe (temperature) deployments and associated side-by-side QC measurements. Procedures for uploading data files from water quality probes are described in the instrument SOPs. Data management and data validation procedures for these files are documented in DWM-WPP data processing and validation SOPs (Appendix E). Other Digital Field Records Use of digital cameras (and video as appropriate) and project-specific “trail” cameras for photo documentation and GPS for geo-referencing augment metadata information. Although a digital camera is standard equipment for every DWM-WPP sampling team, the need to collect digital photos is project-specific, and at the discretion of the field crew. When collected, digital pictures and videos are uploaded to DWM-WPP’s secure network drive using a dedicated photo documentation folder, in project-specific sub-folders, and renamed as applicable. A9.3 Laboratory Records
WES laboratory (Lawrence, MA) A standard chain-of-custody (COC) form generated by prelogging samples in WES’ WinLIMS is used to transfer sample custody for all samples from DWM-WPP staff to the WES laboratory. Electronic copies of completed COC forms are scanned and stored on a shared network drive by WES. See Appendix H for sample WES COC form. The WES laboratory tracks samples via a web-based Laboratory Information Management System (WinLIMS) system, which was implemented fully in 2019, replacing WES’ older Sample Master Pro LIMS. The WinLIMS system provides for efficient and accurate data transfers to DWM-WPP’s database system (i.e., LIMS EDD extracts), and allows pre-logging of samples by DWM-WPP staff to generate Chains of Custody forms and bottle labels for samples going to WES. WinLIMS is a cloud based Commercial off the Shelf system (COTS) that is implemented under contract with a software vendor. The terms of the contract include off site redundancy, uptime/downtime and backup/disaster recovery requirements that are consistent with the Massachusetts Executive Office of Technology Services and Security (EOTSS) standards.
MassDEP-DWM Program QAPP (2020-2024) CN # 520.1 October, 2020 Page 56
In general, most hard copy records including logbooks, data analysis books, control charts, chain of custody forms, log-in sheets and data reports are archived for storage within a secure building according to MassDEP recordkeeping requirements. See the WES QA Plan for more information on laboratory recordkeeping. DWM-WPP Laboratory (Worcester, MA) For samples to be analyzed at DWM-WPP’s laboratory, a DWM-WPP chain-of-custody (COC) form is used to transfer sample custody for all samples from DWM-WPP staff to the DWM-WPP laboratory. Paper copies of completed COC forms are filed in DWM-WPP project folders. DWM-WPP laboratories track sample information in various ways, depending on the type of analysis performed. Lab records are kept in both paper and digital formats. Hard copy lab records include: logbooks, data analysis books, control charts and data reports, and are stored according to DEP recordkeeping requirements. Electronic lab notebooks are also used for several analyses. These result in batch-specific electronic lab data files, which are used to produce analyte-specific electronic data deliverables (EDDs) for upload to DWM-WPP’s database system. Contract laboratories Contract documents for laboratory services are kept in the DWM-WPP’s QA office (paper and electronic). Contract lab COC forms are used when available and when deemed sufficient to meet DWM-WPP’s information needs. In some cases, DWM-WPP may use the WES lab style COC form for non-WES lab samples if a contract lab COC form is found to be insufficient. When contract labs are used, copies of completed COC forms are included in the data report packages, which are filed in DWM-WPP project folders. Contract labs are required to submit formal EDDs using DWM-WPP’s standard format and specification so that contract lab data can be uploaded to DWM-WPP’s database system with minimal transcription error. A9.4 Data Records (paper)
Formal DWM-WPP project folders containing field metadata, any hard-copy data reports and relevant additional information (e.g., survey weather and streamflow conditions) are kept at DWM-WPP’s offices in Worcester, MA. These records are considered “backup” to digital data records. A9.5 Data-Related Records (electronic)
The majority of program data records are in electronic format. Electronic office records pertinent to DWM-WPP’s data operations and available to staff include, but are not limited to, the following types of information on the shared network drives: Automated probe QC and calibration records Draft and Final data (QC levels 1 through 5; see Section D1) Digital photo-documentation (site reconnaissance, surveys, etc.) Survey guidebooks Fieldsheet data and metadata (following data entry) EDGE field data Working files and data analyses Standard Operating Procedures (field, office, lab) and policies

MassDEP-DWM Program QAPP (2020-2024) CN # 520.1 October, 2020 Page 57
Standard forms QC records Secondary data (from sources external to DWM-WPP) Internal databases Draft and final reports and plans (e.g., TMDL, water quality assessments, Sampling &
Analysis Plans, etc.) A9.6 Document Tracking: “Control Numbers”
The DWM-WPP QC Analyst assigns document control numbers (CN) to all Quality Assurance Project Plans, SOPs, Assessment Reports and other important documents. Assigning a control number provides a formal reference number for citation purposes and helps to ensure differentiation of multiple versions of a document when they exist. All CN documents can be electronically accessed internally by DWM-WPP staff using DWM-WPP’s Document Control Number Database (MS Access), or directly via the formal network repository for DWM-WPP documents: W/DWM/SOP. A9.7 Sampling Station Registration
Prior to visiting sampling stations for data collection, DWM-WPP’s electronic station definition files are updated to create new (proposed) stations where needed. Each unique location (or station) sampled is given a “Unique ID” number and description including latitude/longitude. Unique IDs are recorded on all fieldsheets, along with a field sheet number, prior to entry of fieldsheets in another database. At the completion of the survey season, pre-registered station locations are verified as those sampled. All station information is maintained in a database. A9.8 Documentation Protocols
All DWM-WPP paper and digital records related to data collection are considered formal records subject to DWM-WPP and DEP-wide (i.e., State Record Retention requirements) documentation protocols. Example documentation procedures include, but are not limited to: Use of indelible ink (not pencil) for paper records No omissions in the data (completeness) 100% QC checks on any manually-entered data No use of erasing, "white-outs", removal of pages, and multiple crossovers to correct
errors. When errors occur, they should be corrected according to the following procedures:
o Draw a single line through the incorrect entry, insert the correct entry into the closest space available and initial and date the correction;
o Groups of related errors on a single page should have one line through the entries and should be initialed and dated with a short comment supplied for the reason of data deletion.
Use of Control Numbers for key documents Retention of original data downloads from field instruments

MassDEP-DWM Program QAPP (2020-2024) CN # 520.1 October, 2020 Page 58
Table 4: DWM-WPP Project Documentation and Data Records
Sample Collection Records Health & Safety Records Fixed Laboratory Records Data and QA/QC
Assessment Records
Field Sheets and electronic (EDGE) field data
MSDS/SDS Chain of Custody (COC) Forms Data Validation Report for specific data sets
Chain of Custody Forms
Hazardous Waste Generation Forms and Waste Receipt Forms
Laboratory Raw Data Reports and Notebooks
QA/QC section in published reports (e.g. Tech Memos)
Digital photos Training forms Electronic Laboratory Data (WinLIMS, EDD)
MS Excel data validation sheets
Survey-related Correspondence (e.g., e-mail)
Annual Operational Safety Reports Analytical Instrument Logbooks
Technical Correspondence (e.g., e-mail)
GPS waypoints Field/lab audit reports Laboratory QC Results Raw, preliminary and final data files (QC1-QC4)
Probe/logger raw data downloads Corrective Action Forms Level 1 and Level 2 Data QC
reviews (WES) Station definition files
Training forms Incident Report Forms Reagent Water Logbook and control charts
Field Notebook (optional) Performance Evaluation Test
Results
Corrective Action Forms MDL Studies
Probe Instrument Calibration Logbook, User Reports, and Maintenance Logbook, electronic data downloads
Automated logger QC data
Incubator Temperature Log and other calibration logs
Training forms

MassDEP-DWM Program QAPP (2020-2024) CN # 520.1 October, 2020 Page 59
South Coastal Watershed

MassDEP-DWM Program QAPP (2020-2024) CN # 520.1 October, 2020 Page 60
SECTION B: DATA GENERATION AND ACQUISITION
B1 SAMPLING PROCESS DESIGN
B1.1 Long-Term Design Strategy
DWM-WPP’s ambient surface water monitoring program is a vital component of a comprehensive statewide monitoring approach to protect and restore the waters of the Commonwealth. The long-term approach for watershed-scale monitoring is to effectively utilize a combination of targeted, probabilistic, fixed-site and objective-driven monitoring, to address multiple objectives. (DWM-WPP’s 10-year monitoring strategy is discussed in detail in Section A5, above.) Requirements to support two of the objectives (waterbody assessments and TMDL development) are that the monitoring strategy be: statewide in scale comprehensive (all water bodies in the Commonwealth are assessed) repeated at regular intervals planned to increase the number of stream miles and lake acres assessed, and structured to reduce the historical bias toward problem areas
Collaboration on specific projects augments DWM-WPP’s ability to assess other waterbody types, geographic areas, and objectives. Collaborative projects, which reflect DWM-WPP monitoring priorities but are managed by other groups, are to be covered in separate, project-specific QAPPs. In 2020 collaborative projects include: Massachusetts Coastal Condition Assessment: Probabilistic monitoring and assessment
program (MAP2) of coastal waters, a collaboration between the MassBays National Estuary Partnership and MassDEP, to provide a comprehensive assessment of the condition of coastal waters. (MassBays and MassDEP, 2020) (Appendix B).
Massachusetts Estuaries Project (MEP) Marine Benthic Monitoring is a collaborative project between MassDEP, Cape Cod Commission, Buzzards Bay Coalition and other nonprofit organizations, Massachusetts Maritime Academy and other educational institutions, coastal communities, consulting firms, and volunteer programs. The benthic surveys aim to determine the chemical and biological health of an embayment and any sub-embayments by assessing the sediment and benthic macroinvertebrate communities. The program objectives are to reassess ecological health for embayments that have been previously assessed under MEP, evaluate the ecological health of southeastern Massachusetts embayments that have not been assessed, assess the effects management actions including TMDL implementation, and (4) to determine whether long term changes are occurring that may indicate stress from eutrophication or other factors including invasive species and climate change. (Appendix C)
Mount Hope Bay and Taunton River Estuary/Narragansett Bay Fixed-Site Monitoring Network: U.S. Geological Survey and MassDEP are collaborating to develop a water quality monitoring strategy for Mount Hope Bay and the Taunton River Estuary to characterize current water quality conditions, assess nutrient-related impacts, and capture conditions before and after planned upgrades to wastewater treatment facilities. In addition, to provide data to review existing coastal and marine dissolved oxygen criteria

MassDEP-DWM Program QAPP (2020-2024) CN # 520.1 October, 2020 Page 61
in the MA Surface Water Quality Standards (SWQS: 314 CMR 4.00). In 2016, MassDEP acquired two YSI marine water quality monitoring buoys; deployment of these buoys expands the existing Narragansett Bay Fixed-Site Monitoring Network (NBFSMN) currently administered by the Rhode Island Department of Environmental Management (RIDEM) and the University of Rhode Island Graduate School of Oceanography (URI). (Appendix C)
Nutrient Loading in the Merrimack River: USGS will be collecting nutrient and probe data along the Merrimack River including the marine segments (2020-21).
Emerging Contaminants: USGS will be sampling selected PFAS contaminants at 40 surface water sites throughout the state, 24 of which are upstream and downstream of wastewater treatment plants that are located upstream of drinking water supplies (2020). (Appendix C)
Another important ingredient in an effective, long-term monitoring strategy is partnering with monitoring groups outside DWM-WPP for projects driven by the partner’s priorities. Over the years the number of external data providers has increased substantially, providing new and varying sources of information to support water management decision-making. For example, §604(b) water quality planning and assessment grants to outside parties have substantially supported NPS and other assessments. Other parties include: volunteer monitoring organizations, academic institutions, government agencies, stream teams, watershed associations, NPDES permit holders and environmental consultants. MassDEP continues to work collaboratively with these groups to optimize the utilization of their data. In doing so, DWM-WPP can focus its monitoring efforts in areas that are not covered by outside parties. The acquisition of valid scientific data is achieved, in part, by ensuring that interested monitoring parties develop standard operating procedures (SOPs) and quality assurance project plans (QAPPs) that will increase the likelihood that these external data sources can be used to fulfill selected CWA requirements (e.g., §305b/303d assessment and listing functions). Guidelines for submitting external data are available on the DWM-WPP website (https://www.mass.gov/guides/external-data-submittals-to-the-watershed-planning-program) and internal data handling processes are documented in internal SOPs. As of July 2020, DWM-WPP is in the process filling a new staff position dedicated to fostering partnerships, managing external data, and analyzing external data for greater use in §305b/303d decisions. B1.2 Short-Term Sampling Plans
The decision-making process regarding where, when, how, why and what to sample is complex and challenging. The overall scope of the monitoring effort is limited by available human resources, equipment, funds, competing needs and priorities. Each year, DWM-WPP staff develop Sampling and Analysis Plans (SAPs) which guide data gathering activities. For details regarding project-specific sampling locations, frequencies, analytes, methods, etc., see the separate and individual Sampling & Analysis Plans (SAPs). These annual SAPs are supplements to this programmatic QAPP, and their contents mirror selected QA-R5 Guidance elements (i.e., A4-A6, B1, and B9) as they pertain to those projects.

MassDEP-DWM Program QAPP (2020-2024) CN # 520.1 October, 2020 Page 62
Special Note: COVID-19 Pandemic Impacts on 2020 DWM-WPP’s Monitoring Projects Each year, MassDEP’s Division of Watershed Management, Watershed Planning Program (DWM-WPP) implements a surface water monitoring program to support waterbody assessments, as well as other stand-alone monitoring projects as resources allow. DWM-WPP had intended to begin its new seven-year rotating watershed targeted assessment monitoring program in 2020, focusing on 90-100 sites in the Concord, Merrimack, Nashua and Shawsheen Watersheds in Year 1. There are specific requirements for the minimum amount and type of data needed to support waterbody assessments. Meeting these data needs generally requires field work to begin in May or June, and the ability for supporting laboratories to receive and process samples immediately. The ability to carry out a monitoring program to support waterbody assessments in 2020 has been impacted by the COVID-19 pandemic. As a result, DWM-WPP cut back the planned 2020 surface water monitoring program. All lab and field work planned for the 2020 is being carried out in accordance with Safety Guidance for DWM-WPP Field & Laboratory Operations During the COVID-19 Pandemic (CN 535.0 in Appendix E). Staff received training in these safety protocols. The 2020 surface water monitoring program to focus on the following activities between July 1 and September 30, 2020: Massachusetts Coastal Condition Assessment: The pilot sampling will go ahead as originally planned. (Appendix B). Biocriteria Develop: Collection of macroinvertebrate samples to support ongoing biocriteria development activities. Samples will focus on addressing data gaps in: high gradient streams in the Western Highlands with high levels of human disturbance; low gradient streams in the Central Hills and southeastern Massachusetts with low levels of human disturbance; and legacy high gradient reference streams that have demonstrated significant inter-year variability in biocriteria indices. Cold Water Fishery Resources: Collection of data on water temperature, dissolved oxygen, and fish population to support assessments of candidate streams for potential designation as cold water fishery resources as part of future revisions to the Massachusetts surface water quality standards. Data will be collected from up to 75 sites in northeastern Massachusetts. Mystic Lakes TMDLs: Water quality sample collection for this project will be delayed until 2021, however the bathymetry work planned is still planned for October 2020. Fish Toxics Monitoring: Collection of fish as part of the DEP/DPH/DFG cooperative Fish Toxics Monitoring Program, which provides data (mercury, arsenic, cadmium, selenium, and PCB aroclors and chlorinated pesticides for some samples) for the assessment of risk to humans associated with the consumption of freshwater fish. Chloride Monitoring: Continuation of water conductivity monitoring and sample collection for chloride analysis to support understanding of seasonal chloride levels and dynamics in selected waters that may be impaired due to road-salt application. The data may be used to support development of a potential future state-wide or regional TMDL for waters impaired by chlorides.

MassDEP-DWM Program QAPP (2020-2024) CN # 520.1 October, 2020 Page 63
Reconnaissance: Conduct field reconnaissance to support site planning for assessment monitoring in summer 2021 and summer 2022. B1.3 Core Indicators
Although highly project-dependent on specific SAPs, DWM-WPP typically monitors specific core and supplemental indicators to assess the aquatic life uses, water contact recreational uses, and other human health-related water uses as defined in the Massachusetts Water Quality Standards (WQS), as indicated below. Core and Supplemental indicators used by DWM-WPP are shown below (Table 5). Table 5: Core and Supplemental Indicators
INDICATOR TYPE AQUATIC LIFE RECREATION FINFISH/SHELLFISH CONSUMPTION
Core
Macroinvertebrate community Fish community Periphyton/Phytoplankton Macrophyton Habitat quality * Flow Dissolved oxygen pH Temperature Lake trophic status
Pathogens (e.g., E. coli and Enterococci) Transparency Algal blooms, (chlorophyll) Macrophyte density Land-use/% impervious cover
Mercury PCBs Pesticides Shellfish bed closures (non-management)
Supplemental
Toxic pollutants (e.g., metals, chloride) Toxicity tests (water, sediment) Tissue chemical assays Nutrients Chlorophyll Sediment chemistry Organism condition factor Non-native species Land-use/% impervious cover Fish kills Pollutant loadings Suspended solids Turbidity Specific Conductance
Aesthetics Objectionable deposits (scums, sheens, etc.) Flow/water level, Sediment quality Color/Turbidity pH
Contaminants of concern (e.g., PFAS, PPCPs) Pathogens
* Water quantity (discharge), geomorphology (slope, bank stability, channel morphology), substrate (sediment type, embeddedness) and riparian zone (shoreline vegetation, canopy) B1.4 Probabilistic Sampling
The goal of the Massachusetts Probabilistic Monitoring and Assessment Program (MAP2) is to provide a comprehensive assessment of the condition of surface waters in Massachusetts through the implementation of probabilistic sampling designs. With completion of the wadeable rivers and streams (2010-2015) and lakes (2016-2018) probabilistic surveys, MAP2 will focus on coastal waters from 2020 to 2023.

MassDEP-DWM Program QAPP (2020-2024) CN # 520.1 July 2020 Page 64
Massachusetts Coastal Condition Assessment (MCCA) The Massachusetts Bays National Estuary Partnership (MassBays) is dedicated to protecting, restoring, and enhancing the estuarine ecosystems of Ipswich Bay, Massachusetts Bay and Cape Cod Bay. As part of its mission, and as mandated by Section 320 of the CWA, MassBays monitors the status and trends of water quality conditions in estuarine waters of those Bays. Considering the shared needs and responsibilities between the two programs, MassDEP and MassBays formed a partnership to conduct a probabilistic Massachusetts Coastal Condition Assessment (MCCA) that meets the needs and responsibilities of both programs. Overall, the project is coordinated by MassDEP with MassBays. MassBays is responsible for coordinating sample collection and analyses. This work is covered under a separate QAPP (MassBays and MassDEP, 2020; Appendix B) and will be implemented with contractor assistance. The primary objectives of the MCCA are to determine the percent of coastal waters that are supporting aquatic life use, and determine if key stressors are impairing aquatic life use in coastal waters. The assessment is designed to be completed during the period of June through the end of August each year between 2020 and 2023. The Field Crew collects a variety of measurements and samples from 90 probabilistically selected sampling sites that are located at specific coordinates. Fifteen sites will be visited monthly during 2020 (pilot year) while 25 sites will be sampled monthly during each of the succeeding years – 2021, 2022, and 2023. From each site, in situ water quality conditions will be measured. Water samples will be collected for analyses of chlorophyll-a, nutrients, and phytoplankton. Sediment samples will be collected to describe sediment characteristics and measure sediment chemistry and toxicity. Benthic macroinvertebrates will be collected to assess the composition and health of benthic communities in estuaries and in coastal areas. B1.5 Targeted Sampling Designs (2020-2024)
Rotating Basin Monitoring Targeted monitoring of lakes, rivers and estuaries is needed to provide data and information to support the development and implementation of various measures to restore impaired waters. These measures include the identification or verification of causes and sources of impairment, calculation and implementation of TMDLs and watershed-based plans to manage point and nonpoint sources of pollution, issuance of NPDES wastewater discharge permits, and installation of stormwater controls and BMPs. As detailed in Section A5, above, DWM-WPP has established a sequential schedule (Table 6) that provides the opportunity for monitoring to be carried out in each watershed at least once every seven years, yet allows for monitoring resources to be disproportionately applied in each watershed to fulfill specific water resource

MassDEP-DWM Program QAPP (2020-2024) CN # 520.1 October, 2020 Page 65
Table 6: DWM-WPP Seven-Year Rotating Basin Cycle
NHD Water Resource Estimations Assessment Units
NAME Major Cohort
Total Yrs. in Cohort
Minor Cohort
Perennial River Miles
River Mi / Year
Lakes > 5 Acres
Lake Acreage
Lakes / Year
River Segments (Total Length Miles)
Lake Segments (Total Area Acres)
Concord (SuAsCo)
A 2
(2020-2021)
A1 529
1324
134 7186
367
53 (187) 61 (6572) Merrimack A1 344 93 5071 39 (140) 29 (3515) Nashua A1 664 126 10344 79 (273) 69 (9524) Shawsheen A1 98 12 408 21 (65) 14 (406) Ipswich A2 157 68 2992 22 (97) 39 (1922) North Coastal A2 116 64 2698 22 (41) 42 (2006) Parker A2 81 24 588 7 (28) 12 (290) Charles A2 384 113 3726 45 (178) 50 (2824) Boston Harbor A2 274 100 4352 60 (166) 50 (2982) Connecticut
B 2
(2022-2023)
B1 999
1722
96 3358
233
63 (345) 46 (2460) Chicopee B1 907 168 31113 51 (259) 74 (29797) Millers B2 435 97 4762 30 (134) 64 (3846) Westfield B2 630 85 4295 63 (320) 33 (3648) Deerfield B2 474 21 788 130 (366) 22 (561) Ten Mile
C 2
(2024-2025)
C1 92
1322
21 937
611
10 (35) 12 (595) Taunton C1 746 223 13697 49 (222) 87 (10901) Narragansett Bay C1 178 29 4552 20 (65) 6 (3769) Blackstone C1 334 148 6509 48 (168) 100 (5177) Quinebaug C1 210 56 2451 28 (86) 25 (1980) French C1 97 56 3603 18 (39) 43 (3420) Buzzards Bay C2 479 210 6546 25 (79) 72 (4983) South Coastal C2 244 131 4925 22 (58) 75 (4214) Cape Cod C2 177 280 11567 16 (33) 68 (5706) Islands C2 86 69 5738 6 (12) 5 (106) Housatonic
1 (2026)
D1 547 952
117 5982 194
35 (219) 33 (4284) Hudson D D1 229 13 759 26 (109) 8 (716) Farmington D1 175 64 3907 40 (108) 18 (2135)

MassDEP-DWM Program QAPP (2020-2024) CN # 520.1 October, 2020 Page 66
management objectives. Massachusetts’ 27 major watersheds and coastal drainage areas have been arranged by geography (and hydrology) into four major groups, or cohorts (A-D), each consisting of from three to ten basins. Each major cohort is subdivided into one or two minor cohorts, each of which represents one year of the seven-year monitoring schedule (Figure 4). Basic assessment monitoring will be performed in each minor cohort for one year and will be consecutive within major cohorts (e.g. A2 will always follow A1). However, the extended time allotted to the major cohorts (two years for all but three basins) allows for the basic schedule to be adapted to fulfill specific data needs. As such, the level of effort applied to monitoring within each major cohort, will not necessarily be evenly distributed through the minor cohorts, individual basins, or particular sites, but will vary depending on priorities and objectives (see Table 7 draft list of priorities). Targeted monitoring may be focused anywhere within the major cohort and, if necessary, extend through all or a portion of the time allotted to that cohort. Table 7: Assessment Prioritization (DRAFT)
Priority Priority Order
General Category Category Descriptions1
High 1 Delisting
Assessment units currently listed in Categories 4c or 5 where there are indications it should not be listed for at least one impairment cause (indications can be environmental improvement or listing/assessment methodology changes or errors).
High 2 Listing
Assessment units NOT listed in Categories 4c or 5 where there are indications it should be listed for at least one impairment cause (indications can be environmental degradation or listing/assessment methodology changes or errors).
Medium 3 Unassessed (suspect impairment)
Assessment units listed in Category 3 or waters without an assessment unit where there are indications it could listed in Categories 4c or 5 for at least one impairment cause (i.e. unassessed waters suspected to be impaired).
Medium 4 Stressor Identification
Assessment units listed in Category 5 for a non-pollutant (i.e. Fishes Bioassessment, Aquatic Macroinvertebrate Bioassessment) with no stressor impairment causes.
Medium 5 CWF Determination
Assessment units or waters without an assessment unit thought to be an undesignated or under documented coldwater fishery (CWF).
Low 6 Unassessed (suspect support)
Assessment units listed in Category 3 or waters without an assessment where there are indications it could listed in Category 1 or 2 (i.e. unassessed waters likely to support uses).
Low 7 Priority NPDES Assessment units or most sensitive receiving waters with a prioritized NPDES permit development (i.e. situations where a reassessment of the targeted assessment unit would be of value).
Low 8 TMDL Effectiveness
Assessment units currently listed in Category 4a where the TMDL was potentially successful in removing the use impairment or the original listing of the impairment cause was potentially in error.
Low 9 Priority TMDL Assessment units in Category 5 prioritized for TMDL development (i.e. situations where a reassessment of the listed assessment unit would be of value).
1) Assessment units placed in prioritization categories based on available information from multiple sources (monitoring data, landscape data, pollution control measures, assessment methodologies, etc.).

MassDEP-DWM Program QAPP (2020-2024) CN # 520.1 October, 2020 Page 67
B1.6 Targeted Monitoring for Rivers and Streams
Targeted monitoring of rivers and streams is planned according to the seven-year flexible rotating basin schedule described above and may consist of chemical, physical, and biological sampling components depending on the survey goals. River and stream surveys are typically performed during low-flow, dry-weather conditions, which more closely approximate the worst-case scenario with respect to the potential for impairments. Planned surveys are conducted in both dry and wet weather, and surveys are cancelled only when wet weather conditions result in unsafe sampling conditions (e.g., extremely high streamflows). Due in part to the difficulties planning and implementing wet weather surveys, any wet weather data collected is usually unplanned. Sampling locations for rivers and streams are intended to represent lotic conditions, although some locations in and near wetlands may also represent wetland water quality conditions. River surveys are sometimes supplemented by wastewater discharge sampling, which serves to document pollutant loading from point sources to the river at the time of the survey and to assess compliance with NPDES discharge permit limits. River & stream water quality surveys generally consist of five or six monthly sampling events from April 1 to October 15 (primary contact recreation period) on rivers and streams. Typical analytes include pH, dissolved oxygen, temperature, conductivity, turbidity, total suspended solids, true color, chloride, nutrients (TP, TN, NH3-N), dissolved metals and indicator bacteria (E. coli for freshwater and Enterococci for coastal areas). New analytes: DWM-WPP is proposing to amend the Surface Water Quality Standards (314 CMR 4.00) to include the copper Biotic Ligand Model (BLM) as an option to derive freshwater copper criteria. The BLM generates criteria that incorporate the effects of water chemistry on the bioavailability and toxicity of copper, requiring ten water chemistry parameters as inputs. As resources allow, DWM-WPP may include the following additional analytes to aid implementation of the BLM for CWA purposes: dissolved organic carbon (DOC), major cations (Ca, Mg, Na, & K), major anions (SO4 & Cl), alkalinity, and sulfide. Hardness will also be included to calculate copper criteria using the original equations. Stream discharge measurements may be made at selected stations to supplement data from the United States Geological Survey (USGS) stream gage network. Discharge measurements provide data for the calculation of pollutant mass loadings, as well as for assessing the impacts on stream biota of low-flow conditions resulting from drought and/or water withdrawals. Additional site-specific data may also be collected for the development of water quality models. These data may include sediment oxygen demand, nutrient flux and nutrient partitioning, and metal toxicity determinations. The biological monitoring component in rivers typically consists of habitat assessments and surveys to collect macroinvertebrates, fish, aquatic plants and periphyton. These assessments help determine aquatic life use-support status. DWM-WPP is actively developing biocriteria using benthic macroinvertebrate assemblages. The implementation of biocriteria increases the accuracy and precision of aquatic life use assessments and improves water quality goal-setting processes. Additional macroinvertebrate sample collection to support the new biocriteria is described under Macroinvertebrate Project below.

MassDEP-DWM Program QAPP (2020-2024) CN # 520.1 October, 2020 Page 68
Macroinvertebrates The Rapid Bioassessment Protocols (RBPs), based on those developed by the EPA, are used to monitor the health of benthic macroinvertebrate communities in wadeable streams. These methods were developed to minimize laboratory time requirements for taxonomic identification and enumeration of benthos. Kick-net samples are collected at sites for upstream/downstream comparisons, for comparisons against a regional or surrogate reference, or for long-term trend monitoring. Two different levels of analysis are employed, RBP II or RBP III, depending on the objectives to be served. Based on scoring of several metrics, three categories of impairment are discerned by the RBP II (nonimpaired, moderately impaired, and severely impaired), while the RBP III distinguishes between four (nonimpaired, slightly impaired, moderately impaired, severely impaired). Fish Community The analysis of the structure and function of the finfish community as a measure of biological integrity is also a component of the water quality monitoring program. Fish community data quality and comparability are assured through the use of qualified fisheries professionals and the application of consistent methods. DWM-WPP utilizes a standardized method based on the EPA Rapid Bioassessment Protocol V (RBP V) to improve data comparability among wadeable sampling sites throughout the state. The fish collection procedures employ a multi-habitat approach that allows for sampling of habitats in relative proportion to their local availability. Electrofishing has generally proven to be the most comprehensive and effective single method for collecting stream fishes, and is, therefore, the preferred method for obtaining a representative sample of the fish community at each sampling site. Fish (except young-of-the-year) collected within the study reach are identified to species (or subspecies), counted, and examined for external anomalies (i.e., deformities, eroded fins, lesions, and tumors). Aquatic life use-support status is derived from knowledge of the environmental requirements (i.e., water temperature and clarity, dissolved oxygen content, etc.) and relative tolerance to water pollution of the fish species collected. In accordance with Chapter 131 §4 of the Massachusetts General Laws, Scientific Collection Permits are renewed annual for any project collecting fish. Algae Algae represent a third biological community that is typically assessed as part of the biomonitoring efforts. The analysis of the attached algae or periphyton community in shallow streams or the phytoplankton in deeper rivers and lakes employs an indicator species approach whereby inferences on water quality conditions are drawn from an understanding of the environmental preferences and tolerances of the species present. Algal indicators of the presence of elevated metals concentrations, nutrient enrichment, or other pollutants are noted. Because the algal community typically exhibits dramatic temporal shifts in species composition throughout a single growing season, results from a single sampling event are generally not indicative of historical conditions. For this reason, algal community assessments are more useful as a supplement information to the assessments of other communities that serve to integrate conditions over a longer time period. In some instances, where information pertaining to primary production is required, algal biomass analysis or chlorophyll determinations may be performed. Results of these analyses are used to evaluate the trophic status of lakes, ponds, and impoundments. Similar information from riverine and coastal waters is used to identify those waterbodies subjected to excessive nutrient enrichment. Results at public drinking water
MassDEP-DWM Program QAPP (2020-2024) CN # 520.1 October, 2020 Page 69
reservoirs can indicate whether land uses need to be addressed as sources of nutrients and can help water suppliers adjust treatment processes if necessary. Cyanobacteria are a normal part of the algal assemblage of a lake/pond or even streams/rivers. But when their growth is excessive, indicated by blooms, and when they are present for extended periods of time, they are viewed as an indicator of nutrient enriched waters. DWM-WPP assessment protocols require that both a temporal pattern as well as elevated cell counts or biomass measurements be documented to establish that an impairment may exist and not just an ephemeral growth following nutrient inputs from a storm or other environmental change. To establish this pattern samples are collected monthly over the summer growing season by the monitoring staff. Routine sampling for cyanobacteria includes identification of taxa present, cell counts or biovolumes. Lake monitoring includes phycocyanin and chlorophyll are analyzed as well as the cyanotoxins: microcystin, cylindrospermopsin and anatoxin-a. Consistent with MassDEP’s Harmful Algal Bloom (HAB) protocols (Appendix C), cyanobacteria samples can also be collected by field personnel when a possible bloom or excessive algal growth is observed and reported. Samples are collected for verification and if harmful algal bloom is present, are field staff are alerted so safety measures can be taken in future work at this waterbody. The local Board of Health is also notified if a bloom is confirmed at a recreational area. Harmful cyanobacteria blooms (HCB's) pose the risk of potential toxicity to recreational users of the lakes and ponds as well as field personnel who may be exposed dermally or through aerosols in their normal work. Improvements in methods and equipment for cyanobacteria sampling will continue to be introduced to the DWM-WPP program through participation in the EPA's Cyanobacteria Monitoring Collaborative. Participation includes meetings, field equipment testing, contributions to the phycocyanin database and testing of a BloomWatch app. This app will be a very useful tool to aid in future outreach programs as well as for state personnel to help identify blooms or inform others of blooms. Toxic contaminants in biota Assays for the presence of toxic contaminants in fish tissue is another important DWM-WPP monitoring element. These data help assess the risk to human consumers associated with the consumption of freshwater finfish. In the past fish collection efforts were generally restricted to waterbodies where wastewater discharge data or previous water quality studies indicated potential toxic contamination problems. More recently concerns about mercury contamination from both local and far-field sources have led to a broader survey of waterbodies throughout Massachusetts. “Toxics-in-Fish” is a cooperative monitoring effort of the Department of Environmental Protection, the Department of Fish and Game (DFG), and the Department of Public Health (DPH). Fish sampling is performed at sites at the recommendation of the Inter-Agency Fish Toxics Committee each year. Edible fillets from fish are analyzed for the presence of mercury, arsenic, cadmium and selenium. Fillets from selected waterbodies are also analyzed for PCB and organochlorine pesticides. Uniform protocols, designed to assure accuracy and prevent cross-contamination of samples, are followed for fish collection, processing and shipping. Fish are typically obtained with electrofishing gear or gill nets. Lengths and weights are measured and

MassDEP-DWM Program QAPP (2020-2024) CN # 520.1 October, 2020 Page 70
fish are visually examined for tumors, lesions, or other indications of disease. Data are provided to the DPH, which is the agency responsible for performing the risk assessments and issuing public health advisories. Other tissue assays to trace the fate and transport of toxic contaminants in the aquatic environment are performed on a limited basis, primarily to support waste site clean-up activities. B1.7 Targeted Lake Sampling
Lake sampling consists of biological surveys of the macrophyton (i.e., aquatic vascular plants) community, "in-situ" measurements using metered probes, and limited water quality sampling to provide data for the calculation of TMDLs or the derivation of nutrient criteria. Lake surveys typically include sampling and measurements for chlorophyll a, Secchi depth, nutrients and dissolved oxygen/temperature profiles. Lake surveys are generally conducted on multiple days for TMDL development and consist of bathymetric mapping; physical, chemical and biological sampling of the open water areas, tributary stream(s), and outlet; and a quantitative and qualitative mapping of the aquatic macrophyton community. The lake is sampled during the summer months when productivity is high. Some limited use assessments may be accomplished through the lake monitoring described above depending upon the scope of the individual lake surveys. Cover estimates and species distribution of macrophytes, and measurements of water column transparency support a limited assessment of the recreational uses. Finally, macrophyte surveys are used to document the spread of several non-native and potentially nuisance aquatic plant species that are known to be present in Massachusetts. B1.8 Specific Objective Monitoring Projects
In addition to the targeted monitoring on the rotating basins schedule, other monitoring projects supporting specific goals are conducted each year. In 2020, those projects (detailed below) include: Mystic Lakes TMDL Study, Bacterial Source Tracking in Southeast MA, Reference Site Network, Chloride Monitoring, and Biocriteria Development/ Macroinvertebrate monitoring. (See annual SAPs in Appendix D). Targeted projects conducted in collaboration with other groups/agencies are listed above (Section B1.1) and covered under separate QAPPs. Mystic Lakes TMDL Study The Mystic Lakes Study is 3-year project (2019 - 2021/2022) in collaboration with EPA Region 1's New England Regional Laboratory. (See Appendix D for SAP). The project aims to determine the current trophic status of the lakes, and to support calibration of a Lake Loading Response Model (LLRM) and development of a TMDL for the lakes. Additionally, the data collected will be used to assess the status of designated uses (Aquatic Life Use, Recreational Use, Aesthetic Use) at sampled lakes. The data that will be collected at each of the sites are: Vertical profile (dissolved oxygen, temperature, pH, conductivity) Secchi disk transparency Nutrients (Total Nitrogen, Total Phosphorus, True Color, Turbidity) Chlorophyll a (Depth Integrated) Aesthetics observations Human disturbance observations Bathymetry

MassDEP-DWM Program QAPP (2020-2024) CN # 520.1 October, 2020 Page 71
Bacterial Source Tracking Because bacterial contamination is one of the leading causes of impairment in Massachusetts waters, special consideration has been given to locating sources of bacterial contamination, and working with regional and local parties on potential corrective actions. Due to resource limitations, bacterial source tracking continues as an active project primarily in the MassDEP Southeast Region (Appendix D for SAP). The monitoring design uses GIS desktop analysis to identify potential sources, followed by wet- and dry-weather sampling using an iterative sampling process to narrow down the location of the bacteria sources. The sampling includes the bracketing of suspected point sources (e.g., pipes, ditches, culverts) and non-point sources (e.g., specific land-use types, small tributaries, neighborhoods). To facilitate processing rapid processing of a large number of samples, DWM-WPP utilizes the IDEXX, Inc. Colilert® and Enterolert® testing system at each regional office (located in laboratory facilities at the western, central, southeast and northeast DEP regional offices), subject to available resources. When potential sources of contamination are identified, appropriate authorities are notified of the suspected source(s) and recommendations for further source tracking work (e.g., for likely illicit discharges to storm sewer), clean-up, or enforcement action may be made. Effectiveness Monitoring Targeted monitoring can also be employed to demonstrate non-point source (NPS) program effectiveness by identifying, through monitoring, waterbodies where improvement can be measured as a result of NPS Program activities. Due to resource limitations, such targeted sampling is not designed to demonstrate BMP or project effectiveness, but program effectiveness. Because the NPS program is a partnership program, data from other sources outside DEP can also be used to meet program goals. In 2020, DWM-WPP, through the collaborative Massachusetts Estuaries Program, is conducting benthic marine sampling to assess the effectiveness of TMDL implementation in southeast estuaries (described in Section B1.1). Reference Site Network (2011-onwards) The Reference Site Network (RSN) is a multi-year project focusing on the biological communities (macroinvertebrates, fish, and periphyton) and associated water quality at “reference” or “least disturbed” sites in the northeastern highlands (58) and northeastern coastal plains (59) ecoregions (Figure 6). The finalized data will be used to study both reference conditions and intra and inter-year variations of physicochemical parameters and biological communities. This monitoring will provide a continually increasing dataset to assist with the development of water quality criteria, biocriteria and tiered aquatic life use (TALU), and to define the reference condition for the assessment of aquatic life use at other sites.

MassDEP-DWM Program QAPP (2020-2024) CN # 520.1 October, 2020 Page 72
Figure 6: Northeastern Highlands and Northeastern Coastal Plains Ecoregions DWM-WPP is currently developing biocriteria and exploring the development of tiered aquatic life uses. The implementation of biocriteria and tiered aquatic life uses increases the accuracy and precision of aquatic life use assessments and improves water quality goal-setting processes. Understanding the “reference” condition and inter-year variation within indices of biotic integrity used for assessment is critical for the development and implementation of biocriteria and tiered aquatic life use. Without an understanding of the “reference” condition and variation, policy decisions could be made (e.g. §303(d) listing, antidegradation) based on a low index score due to natural or sampling variation rather than an actual impairment of the resource. The goal of the RSN monitoring surveys is to collect sufficient data at “reference/least disturbed” sites to assess the quality of aquatic life in multiple assemblages. The types of data that are typically collected include: Benthic macroinvertebrate community Habitat assessments Fish community Periphyton community Nutrients (total phosphorus, total nitrogen, nitrate-nitrite, and ammonia) Other Water Quality (chloride, true color, and turbidity) Temperature (instantaneous) Continuous temperature (year around) Dissolved oxygen (instantaneous) Continuous dissolved oxygen (4-5 month duration) Aesthetics observations
The Reference Site Network utilizes a human disturbance index (HDI) to identify watersheds with the least human disturbance, or potential “reference” watersheds. In the selection process, an attempt is made to select watersheds of varying sizes and geographic locations. Candidate

MassDEP-DWM Program QAPP (2020-2024) CN # 520.1 October, 2020 Page 73
“reference” watersheds are evaluated with field and desktop reconnaissance in late March or early April. Preference is given to watersheds with legacy macroinvertebrate sites that are representative of the watershed. Once the “reference” watersheds are selected, monitoring sites are established in each watershed if a legacy site is not available. Chloride Monitoring Road salt is Sodium chloride (NaCl) is applied to roadways in winter as a deicer and has been found to be the major source of salt in Massachusetts streams. Chloride is a recognized toxin with potential to impair waterbodies and impact biological communities and has been shown to contribute to year-round elevated chloride levels in streams and groundwater. This multi-year project involves collection of continuous conductivity data to estimate chloride levels using DWM-WPP’s conductivity-chloride regression developed. Estimated chloride data will help assess the effects of seasonal road salt (NaCl) applications on surface water quality and may be compared with EPA ambient criteria for acute and chronic toxicity. The results of this study have the potential to influence DEP water quality alert levels for chloride and provide baseline data for potential future development of Total Maximum Daily Loads (TMDLs). The EPA recommended acute criterion for chloride is 860 mg/L (one-hour average) and the chronic criterion is 230 mg/L (four-day average). Neither value is to be exceeded more than once every three years. For the 2018 reporting cycle DWM-WPP analysts developed and validated a linear regression model to estimate chloride concentrations from specific conductance (SC) measurements (MassDEP, 2018). Model validation testing also proved it to be sufficiently accurate and robust to reliably predict chloride concentrations using SC as a surrogate in Massachusetts freshwaters according to the following equation:
Y=0.2753X – 18.987 (R2 = 0.9445, P<0.001), where Y is chloride concentration and X is specific conductance at 25°C
Sampling locations focus on streams near major highways or in heavily urbanized areas. Monitoring is designed to run from October to June, covering the winter season. In 2015/2016, six stations in the Concord River watershed in close proximity to Rtes. 495 and the Lowell Connector were selected: four on a tributary to the Concord River (River Meadow Brook) and two on the mainstem Concord River. In 2016/2017, five stations on Potash Brook in the Westfield River Watershed near Route 90 were monitored. In 2017/2018, eight stations in the Neponset River Watershed near Routes 95 and 128 were monitored: six on the Neponset mainstem and two tributary stations. In 2019/2020 approximately 12 tributary stream locations in the Blackstone River Watershed were selected in the heavily urbanized Worcester area. Continuous conductivity data will be collected using HOBO U24 freshwater data loggers. Attended, discrete quality control (QC) readings will be taken at each visit using separate YSI/Hydrolab multiprobe instruments. On two of the survey rounds, water samples will be collected for chloride (only) and analyzed by the WES lab. Conductivity data will be analyzed using DWM-WPP’s chloride regression tool, which was previously verified, to estimate ambient chloride levels. Macroinvertebrate/Biocriteria Development

MassDEP-DWM Program QAPP (2020-2024) CN # 520.1 October, 2020 Page 74
Biocriteria development monitoring focuses on the biological communities (macroinvertebrates, fish, and periphyton) and associated water quality conditions at sites across a human disturbance gradient (e.g. pristine to severely disturbed). Biocriteria are commonly expressed as multimetric indices of biotic integrity (IBI) and the metrics comprising an IBI are selected based on the strength of their ecological response to human disturbance. DWM-WPP is actively developing biocriteria using benthic macroinvertebrate assemblages through a contract with Tetra Tech, Inc (Jessup and Stamp 2019). The implementation of biocriteria increases the accuracy and precision of aquatic life use assessments and improves water quality goal-setting processes. The focus of this project is macroinvertebrate monitoring, implemented on a statewide or regional scale, to support the development of DWM-WPP’s biocriteria. Sites selected for monitoring may be monitored for just one or multiple years by DWM-WPP personnel, depending on the project objectives. The finalized monitoring data will be used by DWM-WPP to study the response of biological communities to human disturbance for biocriteria development. After the initial phases of biocriteria development were completed, it was apparent that gaps existed in the Massachusetts macroinvertebrate dataset. The two most significant data gaps are from: High gradient streams in the Western Highlands with high levels of human disturbance
(Figure 7) Low gradient streams in the Central Hills and southeastern Massachusetts with low levels
of human disturbance (i.e. reference) (Figure 7) Filling these data gaps would aid in future development efforts to refine, expand, and improve the accuracy of the macroinvertebrate biocriteria indices.
Figure 7: Macroinvertebrate Stream Classes in Southern New England (Jessup and Stemp 2019)
MassDEP-DWM Program QAPP (2020-2024) CN # 520.1 October, 2020 Page 75
Coldwater Fisheries (CWF) Monitoring of the stream fish assemblage to determine Cold Water Fishery status is an integral component of the MassDEP water quality management program, and its importance is reflected in state stream class and use-support designations. Assessments of the cold water fish assemblage help to ensure the overall structure and function of the cold water ichthyofaunal community and ultimately protect surface water resource quality. The data collected will support identification of Coldwater Fisheries, §305(b) assessments, and development of a revised procedure for designating a fresh water river or stream as Cold Water in the Massachusetts Surface Water Quality Standards (SWQS; §314 CMR 4.00). For general fish population investigations, DWM-WPP uses a consistent, standardized method based on the fish protocols in USEPA’s Rapid Bioassessment Protocols for Use in Streams and Wadeable Rivers: Periphyton, Benthic Macroinvertebrates and Fish (Barbour et al. 1999) to improve data comparability among wadeable sampling sites throughout the state. The CWF monitoring efforts will use a revised version of these methods to focus on cold water species. Fish collection procedures will prioritize sampling habitats within a stream that will maximize the potential for collecting cold water species; e.g., portions of the stream with overhanging banks, suitable cover, and potential for cold water seeps or cooler water habitats. Whenever possible, the sample reach should be sampled sufficiently upstream of any bridge or road crossing to minimize the hydrological effect on overall habitat quality. Wadeability and accessibility may ultimately govern the exact placement of the sample reach. A habitat assessment is performed (and in some cases physical/chemical parameters are measured) concurrently with fish sampling to document and characterize available habitat specifics within the sample reach. All fish sampling gear types are generally considered selective to some degree; however, electrofishing has proven to be the most comprehensive and effective single method for collecting stream fishes. Pulsed DC electrofishing is the method of choice to obtain a representative sample of the fish community at each Massachusetts sampling station. The accurate identification of each fish collected is essential, and species-level identification is required. Field identifications are acceptable; however, voucher specimens must be retained for laboratory identification if there is any doubt about the correct identity of the specimen. To identify reproducing populations of cold water species (as opposed to stocked individuals), the collection of young-of-the-year brook trout and any slimy sculpin will be emphasized. Full methods are detailed in CN 533.0 Fish Collection Procedures for the Evaluation of Potential Cold Water Fisheries in Wadeable Streams. B1.9 How Data Are Used
In addition to direct uses, such as comparison to State ambient water quality standards or EPA criteria, specific ways in which DWM-WPP’s final data are used include but are not limited to: Assessment decision-making as directed in the latest Consolidated Assessment and
Listing Methodology (CALM). DWM-WPP’s current CALM guidance is made available on MassDEP’s website (https://www.mass.gov/guides/watershed-planning-program). Versions of the CALM are specific to bi-annual Integrated List Reports, and document the procedures used to make assessment and listing decisions.

MassDEP-DWM Program QAPP (2020-2024) CN # 520.1 October, 2020 Page 76
Model input (e.g., hydrologic, water quality models) Mass balance calculations (e.g., pollutant loading) Criteria development (e.g., nutrients, marine DO, biocriteria) Inferential statistics (e.g., probability-based sampling data) NPDES permit-writing TMDL-related data analyses and determinations Coldwater fishery designations Freshwater fish consumption advisories (in coordination with MDPH) Trend analysis (e.g., fish tissue Hg concentrations, in coordination with MassDEP-ORS) Descriptive statistics (e.g., geomeans for bacteria data, minima/maxima for dissolved
oxygen and temperature, ANOVA) with or without uncertainty statements Future sampling plan development Non-DEP studies and data requests (DWM-WPP data provided to other groups) Evaluation of the effectiveness of water quality programs (such as the NPS Program),
based on improvements in water quality or waterbody health.

MassDEP-DWM Program QAPP (2020-2024) CN # 520.1 October, 2020 Page 77
Farmington Watershed

MassDEP-DWM Program QAPP (2020-2024) CN # 520.1 October, 2020 Page 78
B2 SAMPLING METHODS
B2.1 Sampling-Related SOPs
All DWM-WPP field sampling follows the most current and approved DWM Standard Operating Procedures (SOPs), as listed in Table, along with applicable standard reference documents used to help formulate them. Table 8: DWM-WPP Field Method SOPs
Control Number(s) SOP subject matter Applicable “Standard” Method Reference(s)
CN 0.2 Field safety --- CN 0.21 Incident Report Form ---
CN 1.21 Sample collection (general)
- USGS TWRI Book 9 USGS. National Field Manual for the Collection of Water-Quality Data (1998) - Standard Methods for the Examination of Water and Wastewater (21st edition, 2005)
CN 1.25 GPS data collection --- CN 1.27/28 Property Access --- CN 1.3 Use of sample collection pole --- CN 1.35 Hinged Pole Sampler (draft) --- CN 1.4 Use of bottle basket sampler --- CN 1.5 / 1.55 Stormwater Sampling --- CN 1.68 Peristaltic Pump Sampler --- CN 1.96 WinLIMS pre-login (WES lab only) --- CN 3.5 Chlorophyll a sampling --- CN 4.25 Multiprobe use - Hydrolab, YSI, Onset manuals CN 4.28 Hydrolab Quickguide CN 4.34 YSI EX01 Quickguide CN 4.41 Multiprobe deployment - Hydrolab, YSI, Onset manuals
CN 4.70 Mini-DOT Quickguide - Mini-DOT meter manual
CN 4.81 Onset DO/T logger Quickguide - Onset DO/T meter manual
CN 4.85 HOBO TidBits
CN 35.0 Periphyton Sampling
CN 39.2 Benthic macroinvertebrate/Habitat - Modified RBP (EPA) - USGS TWRI Book 5 (1987)
CN 40.2/ 40.3 Fish collection/preparation for fish tissue analysis
- EPA guidance for fish sampling and analysis for fish advisories (1995) - USGS TWRI Book 5 (1987)
CN 55.1 Secchi transparency - EPA Volunteer Lake Monitoring methods manual (1991)
CN 58.0 Optical brighteners ---
CN 58.5 Fluorometer use to detect optical brighteners ---
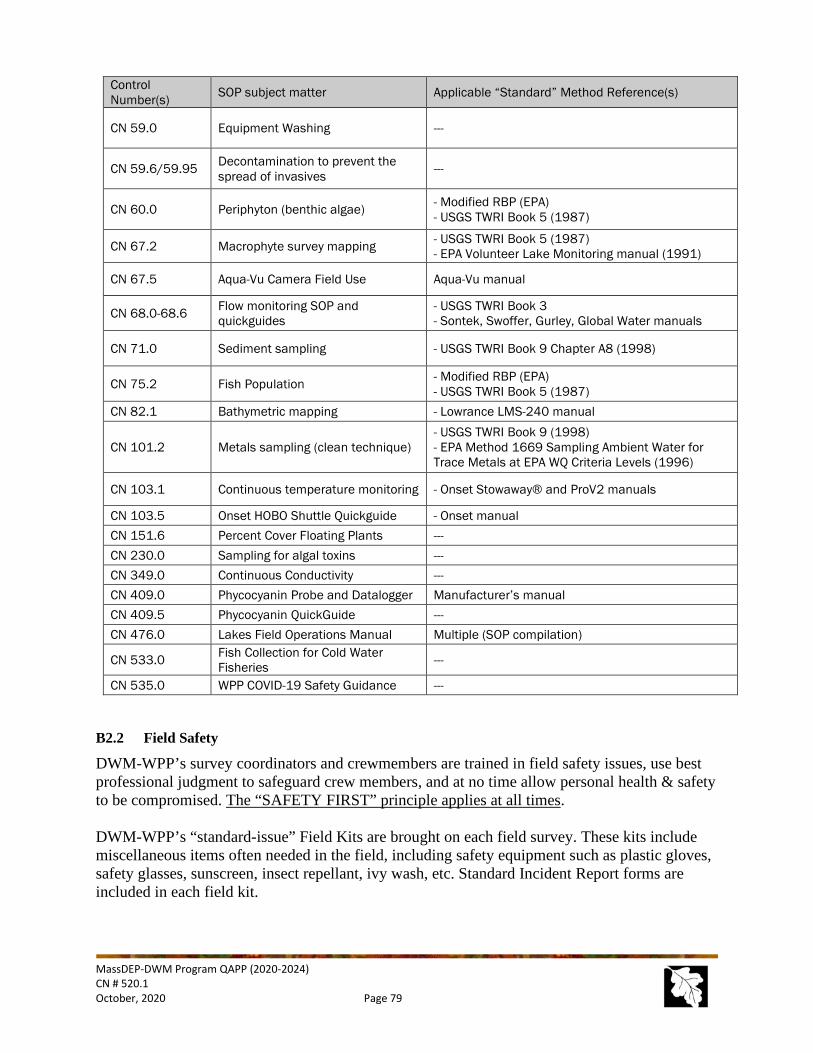
MassDEP-DWM Program QAPP (2020-2024) CN # 520.1 October, 2020 Page 79
Control Number(s) SOP subject matter Applicable “Standard” Method Reference(s)
CN 59.0 Equipment Washing ---
CN 59.6/59.95 Decontamination to prevent the spread of invasives ---
CN 60.0 Periphyton (benthic algae) - Modified RBP (EPA) - USGS TWRI Book 5 (1987)
CN 67.2 Macrophyte survey mapping - USGS TWRI Book 5 (1987) - EPA Volunteer Lake Monitoring manual (1991)
CN 67.5 Aqua-Vu Camera Field Use Aqua-Vu manual
CN 68.0-68.6 Flow monitoring SOP and quickguides
- USGS TWRI Book 3 - Sontek, Swoffer, Gurley, Global Water manuals
CN 71.0 Sediment sampling - USGS TWRI Book 9 Chapter A8 (1998)
CN 75.2 Fish Population - Modified RBP (EPA) - USGS TWRI Book 5 (1987)
CN 82.1 Bathymetric mapping - Lowrance LMS-240 manual
CN 101.2 Metals sampling (clean technique) - USGS TWRI Book 9 (1998) - EPA Method 1669 Sampling Ambient Water for Trace Metals at EPA WQ Criteria Levels (1996)
CN 103.1 Continuous temperature monitoring - Onset Stowaway® and ProV2 manuals
CN 103.5 Onset HOBO Shuttle Quickguide - Onset manual CN 151.6 Percent Cover Floating Plants --- CN 230.0 Sampling for algal toxins --- CN 349.0 Continuous Conductivity --- CN 409.0 Phycocyanin Probe and Datalogger Manufacturer’s manual CN 409.5 Phycocyanin QuickGuide --- CN 476.0 Lakes Field Operations Manual Multiple (SOP compilation)
CN 533.0 Fish Collection for Cold Water Fisheries ---
CN 535.0 WPP COVID-19 Safety Guidance --- B2.2 Field Safety
DWM-WPP’s survey coordinators and crewmembers are trained in field safety issues, use best professional judgment to safeguard crew members, and at no time allow personal health & safety to be compromised. The “SAFETY FIRST” principle applies at all times. DWM-WPP’s “standard-issue” Field Kits are brought on each field survey. These kits include miscellaneous items often needed in the field, including safety equipment such as plastic gloves, safety glasses, sunscreen, insect repellant, ivy wash, etc. Standard Incident Report forms are included in each field kit.
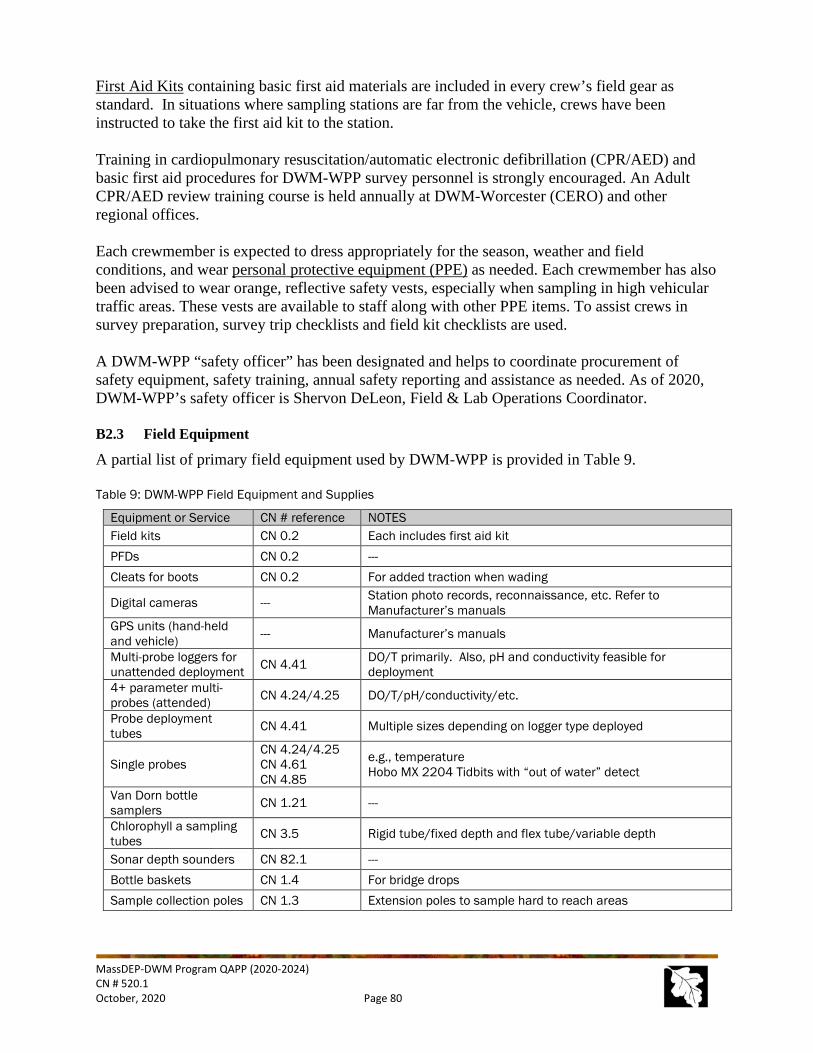
MassDEP-DWM Program QAPP (2020-2024) CN # 520.1 October, 2020 Page 80
First Aid Kits containing basic first aid materials are included in every crew’s field gear as standard. In situations where sampling stations are far from the vehicle, crews have been instructed to take the first aid kit to the station. Training in cardiopulmonary resuscitation/automatic electronic defibrillation (CPR/AED) and basic first aid procedures for DWM-WPP survey personnel is strongly encouraged. An Adult CPR/AED review training course is held annually at DWM-Worcester (CERO) and other regional offices. Each crewmember is expected to dress appropriately for the season, weather and field conditions, and wear personal protective equipment (PPE) as needed. Each crewmember has also been advised to wear orange, reflective safety vests, especially when sampling in high vehicular traffic areas. These vests are available to staff along with other PPE items. To assist crews in survey preparation, survey trip checklists and field kit checklists are used. A DWM-WPP “safety officer” has been designated and helps to coordinate procurement of safety equipment, safety training, annual safety reporting and assistance as needed. As of 2020, DWM-WPP’s safety officer is Shervon DeLeon, Field & Lab Operations Coordinator. B2.3 Field Equipment
A partial list of primary field equipment used by DWM-WPP is provided in Table 9. Table 9: DWM-WPP Field Equipment and Supplies
Equipment or Service CN # reference NOTES Field kits CN 0.2 Each includes first aid kit PFDs CN 0.2 --- Cleats for boots CN 0.2 For added traction when wading
Digital cameras --- Station photo records, reconnaissance, etc. Refer to Manufacturer’s manuals
GPS units (hand-held and vehicle) --- Manufacturer’s manuals
Multi-probe loggers for unattended deployment CN 4.41 DO/T primarily. Also, pH and conductivity feasible for
deployment 4+ parameter multi-probes (attended) CN 4.24/4.25 DO/T/pH/conductivity/etc.
Probe deployment tubes CN 4.41 Multiple sizes depending on logger type deployed
Single probes CN 4.24/4.25 CN 4.61 CN 4.85
e.g., temperature Hobo MX 2204 Tidbits with “out of water” detect
Van Dorn bottle samplers CN 1.21 ---
Chlorophyll a sampling tubes CN 3.5 Rigid tube/fixed depth and flex tube/variable depth
Sonar depth sounders CN 82.1 --- Bottle baskets CN 1.4 For bridge drops Sample collection poles CN 1.3 Extension poles to sample hard to reach areas

MassDEP-DWM Program QAPP (2020-2024) CN # 520.1 October, 2020 Page 81
Equipment or Service CN # reference NOTES Continuous temperature probes CN 103.1 24-hour continuous recording at 30 min intervals for 3-6 month
durations per site (typ.) Flow meters CN 68.0 Propeller and acoustic Doppler technology Staff gages CN 68.0 Each 3 feet long Dye testing CN 68.0 For time-of-travel, mixing zone studies, etc. Portable peristaltic pump CN 1.21 For use in hard-to-sample areas, for field-filtration, etc.
NIST-traceable thermometers CN 103.1 Field/lab QC for temperature
Sediment samplers CN 71.0 --- Backpack electroshockers CN 75.1 ---
Electroshocking boat CN 75.1 CN 40.1 ---
Large sampling boats --- e.g., Boston Whaler Small sampling boats --- Canoes and rowboats Outboard boat motors --- Including one electric motor Portable spectrophotometer (field/lab)
CN 2.3 Mainly for in-lab use (HACH spectrophotometer)
Portable turbidimeter (field/lab) CN 95.1 Mainly for in-lab use
Colilert® / Enterolert® analysis (field/lab) CN 198.0 Mainly for in-lab use (2 incubators)
Fluorometer (bacteria source tracking) CN 58.5 Primarily for in-lab use only (Turner)
Phycocyanin probe CN 409.0 Pigment concentrations correlated to cyanobacteria levels (and associated potential for cyanotoxins)
misc. test kits (e.g., detergents, microcystins)
Varies Mainly for in-lab use. Follow manufacturer’s instructions.
QC/PT audit samples --- Quantitative QC known samples for nutrients (TP, TN, NH3, etc.), chlorophyll a, bacteria (e.g., E. coli), metals, etc.
B2.4 Bottle Groups, Types and Preservatives for Typical Analytes
Bottle group designations, associated parameters, and bottle type and preservative requirements for water, sediment and tissue sample analytes are shown in Table 10. B2.5 Field Sample “OWMID #” Allocations
Sample identification numbers are systematically allocated by DWM-WPP’s Database Manager when needed. Printed OWMID # labels are provided to each project Principle Investigator for use on the fieldsheet forms. This process helps to avoid using ID#s more than once, misinterpretation of written ID#s, and other sample ID-related problems. For Rivers and other non-lake surveys, six-digit ID# (e.g., 36-2105) labels are affixed on the fieldsheets for each separate sample, using designated, 2-digit project prefixes.

MassDEP-DWM Program QAPP (2020-2024) CN # 520.1 October, 2020 Page 82
For Lake surveys, one five-digit ID# (e.g., LB-268_) label is physically affixed on the fieldsheet in the top corner of pg.2. This ID# controls up to 10 samples IDs, where the last digit is filled in by the survey lead (e.g., LB -2681) for each separate sample (with "0" always being the multi-probe ID). To facilitate logging sample with the WinLIM system at the Wall Experimental Laboratory, bottle-group codes (Table 10) will be appended to the OWMID#s; for example, sample # 36-2105 for nutrients will be designated 36-2105_N. B2.6 Field Quality Control (see B5)
B2.7 Field Documentation (see A9)

MassDEP-DWM Program QAPP (2020-2024) CN # 520.1 October, 2020 Page 83
Table 10: Bottle Group Codes, Container Types and Field Preservation Methods for DWM-WPP Samples 1
ANALYTE GROUP & Bottle code PARAMETERS Bottle type(s) (2) SPECIAL preservative (3)
WATER & BIOLOGICAL
Chemistry C Alkalinity, hardness, turbidity, color HDPE (500 mls) None, except for hardness by SM 2340B where HNO3 is used to pH < 2
Chemistry (WPP) R Turbidity and color HDPE (120-250 mls) None
Nutrients + N Total phosphorus, total nitrogen, ammonia nitrogen, nitrate-nitrite nitrogen (and chloride)
HDPE (250-500 mls) H2SO4 (9N, 1 ml.) to pH < 2
Phosphate fractions P1 P2
Total Reactive P Dissolved Reactive P HDPE (250-500 mls) None
Solids (in water) S Total suspended solids, total solids, total dissolved solids HDPE (1000 mls) None
Bacteria B E. coli and Enterococci (typically) Sterile, sealed plastic (120-250 mls) Sodium thiosulfate (Na2S2O3) for dechlorination as needed
Human Markers of Sewage Source HM
E. coli, fecal coliform, Enterococci, Bacteroidetes and Enterococci human markers, caffeine, FWAs, and OBs
Amber glass 1000 mls; 2 liters per site (1L for micro/FWAs and 1L for caffeine); extra 2 liters at one site for caffeine lab QC
None (sterile bottle for micro); WES lab prepared
Chlorophyll (in water) I Chlorophyll a HDPE (500-1000 mls) None
Algae (in water) A Phytoplankton ID and enumeration HDPE (120-250 mls) Lugol’s solution
Algal Toxins AT Anatoxin-a, cylindrospermopsin Amber glass vial (120 ml) Ascorbic acid, 0.10 g/L
Cyanotoxins MC Microcystins (total), and nodularins Amber glass (120 mls) None
Phycocyanin PC Phycocyanin TBD TBD
Misc. Ions C2 Sulfate and chloride by 300.0) HDPE, 500-1000 mls (C) None
FWA FWA Fluorescent Whitening Agents Amber glass (500 mls) None
Toxicity TOX various toxicity end points, including whole effluent toxicity and ambient toxicity
PE (sufficient volume to meet lab analytical reqts.) None

MassDEP-DWM Program QAPP (2020-2024) CN # 520.1 October, 2020 Page 84
ANALYTE GROUP & Bottle code PARAMETERS Bottle type(s) (2) SPECIAL preservative (3)
UV-Absorbing UVA UVA254 HDPE, 500-1000 mls (C) None
Metals (dissolved) M
Al, Sb, As, Be, Cd, Cr, Cu, Pb, Ni, Se, Ag, Mn, Co, Mo, Ba, Fe, V, Tl, Zn, Ca, Mg and hardness calculation (typical ambient water quality suite); also Na, K, Si by 200.7
Certified, trace-clean HDPE (500 mls) 1:1 HNO3 to pH < 2 (4)
Metals (total recoverable) M2 Same as above (unfiltered) Certified, trace-clean HDPE (500 mls) 1:1 HNO3 to pH < 2 (4)
Organic Carbon OC Total/Dissolved Organic Carbon Amber glass, 250 mls. (D) Field-filtered; HCl to pH<2 (in bottle);
Oxygen Demand OD BOD, COD, TOD Glass “BOD” bottles (300 ml with glass stopper)
None for BOD 1:1 H2SO4 to pH < 2 for COD
Volatile Organics VOC Various Glass with Teflon-lined septum caps (40 mls) 1:1 HCL (no headspace)
Hydrocarbons HC Oil and grease, total petroleum hydrocarbons, various poly-aromatic hydrocarbons
Amber glass (1000 mls) 1:1 H2SO4 to pH < 2
PCBs and Pesticides (in water) PCB Various NA None
Extractable Organics EOC Various Amber glass (1000 mls) None
Perchlorate PER Perchlorate HDPE (120 mls) None
PFAS PFAS Per- and polyfluoroalkyl substances HDPE (250 mls) (2/sample), certified PFAS-free None
Chlorophyll (in benthic algae) I Chlorophyll a jars (containing acetone; at lab after
scraping substrate) 90% acetone in a buffered aqueous solution (at lab)
Benthic algae A ID and enumeration
Glass vials (2-4 dram with screw type caps) in a 1-liter jar half filled with in-stream water to keep the vials from heating.
M3 or Lugol’s (as needed) Refrigerated/iced at lab until analysis

MassDEP-DWM Program QAPP (2020-2024) CN # 520.1 October, 2020 Page 85
ANALYTE GROUP & Bottle code PARAMETERS Bottle type(s) (2) SPECIAL preservative (3)
Benthic Macroinvertebrates --- ID and enumeration
2 liter wide-mouth leak-proof Nalgene bottle. Specimen vials (in 1l Nalgene PMP jars)
Denatured 100% reagent alcohol (5% methanol, 5% isopropanol, 90% ethanol). Refrigerated/iced (if not preserved)
FISH TISSUE
Metals M Mercury, Lead, Selenium, Arsenic, Cadmium HPDE cup (at lab after processing) Ice/refrigeration @ < 6C in dark,
followed by freezing PCBs and Organochlorine Pesticides (fish)
PCB Various (including PCB congeners and arochlors) Aluminum foil (at lab after processing) Ice/refrigeration @ < 6C in dark,
followed by freezing
PFAS (in tissue) PFAS Per- and polyfluoroalkyl substances TBD by project-specific QAPP TBD by project-specific QAPP
SEDIMENTS Sediment toxicity (e.g., Hyalella azteca, Chironomus tentans)
TOX --- HDPE plastic or glass; 3 liters if two-species test; or 2 liters of one-species test
Ice/refrigeration @ < 6C in dark
AVS/SEM (acid-volatile sulfide/ simultaneously-extracted metals)
--- --- 4 oz. WM amber glass w/ Teflon-lined cap (120 ml)
Ice/refrigeration @ < 6C in dark
Polycyclic aromatic hydrocarbons (PAHs) PAH Various 4 oz. WM amber glass w/ Teflon-lined
cap (120 ml; > 200 grams) Ice/refrigeration @ < 6C in dark
PCB arochlors PCB Various 4 oz. WM amber glass (120 ml; > 200 grams) Ice/refrigeration @ < 6C in dark
Chlorinated Pesticides PEST Various 4 oz. WM amber glass (120 ml; > 200 grams) Ice/refrigeration @ < 6C in dark
TOC/DOC SOC --- 4 oz. WM amber glass Ice/refrigeration @ < 6C in dark
Metals (total concentrations for each element)
M Various plastic or glass 4 oz./120 ml. Ice/refrigeration @ < 6C in dark
% solids/ % water --- --- 4 oz. WM amber glass Ice/refrigeration @ < 6C in dark

MassDEP-DWM Program QAPP (2020-2024) CN # 520.1 October, 2020 Page 86
ANALYTE GROUP & Bottle code PARAMETERS Bottle type(s) (2) SPECIAL preservative (3)
Grain size distribution --- --- 1 liter N.A.
Nutrients (TP, TN) N TP, TN HDPE plastic or glass Ice/refrigeration @ < 6C in dark
PFAS (in sediment) PFAS Per- and polyfluoroalkyl substances TBD by project-specific QAPP TBD by project-specific QAPP
(1) For any given analyte, bottle type and preservative recipe are generally independent of analytical method. Differences in required preservative within a bottle group are addressed on a case-by-case basis.
(2) In all cases, new, pre-cleaned bottles are used. (3) Wet ice to < 6 deg. C in dark cooler is standard short-term storage for all water samples (4) Acid addition for preservation is typically done at the lab within 24 hours

MassDEP-DWM Program QAPP (2020-2024) CN # 520.1 October, 2020 Page 87
Concord Watershed

MassDEP-DWM Program QAPP (2020-2024) CN # 520.1 October, 2020 Page 88
B3 SAMPLE HANDLING AND TRACKING
B3.1 Assignment of LOCATION ID#s (Station ID and Unique ID)
Prior to each survey, the Survey Coordinator must verify that each station has been given two location-specific IDs: a project-specific Station ID# (e.g., BB01) and more importantly, a permanent Unique ID# (e.g., W0657). Both ID#s are used on DWM-WPP fieldsheets. If unplanned station visits occur for which the Station ID and/or the Unique ID were not provided, the Survey Coordinator shall get both immediately following the survey, and insert the IDs onto the appropriate fieldsheet. Station locations are verified at the end of the season as part of field sheet data entry and validation. All station information is maintained in database. B3.2 Assignment of SAMPLE ID#s (“OWMID”)
See B2.5. The Database Manager provides each Survey Coordinator with a season’s worth of sample ID# or “OWMID”s (on pre-printed labels—one ID per label) for their specific project. The Survey Coordinators are responsible for avoiding the use of duplicate OWMIDs by using these labels on the fieldsheets (one label per sample). Multi-probe and deployed probe data at each station also get separate Sample IDs. If the ID label sheets are lost, new sheets containing new numbers are generated by the Database Manager. Typically, each survey crew lead is provided with an extra ID label sheet for use as needed (e.g., in the survey guidebooks, so that they are returned). If a labeling mistake is made, the old label is crossed out with a single line and a new label is affixed next to the old one. To facilitate logging sample with the WinLIM system at the Wall Experimental Laboratory, bottle-group codes (Table 10) will be appended to the OWMID#s; for example, sample # 36-2105 for nutrients will be designated 36-2105_N. B3.3 WinLIMS Pre-login
For samples planned to be delivered to the WES lab, samples are pre-logged into the WES WinLIMS database using a WinLIMS web interface customized for DWM-WPP use. The specific procedures for pre-logging samples in this way are provided in CN 001.96. Based on their unique SAPs, survey coordinators plan their use of OWMID #s using a MS Excel spreadsheet. This is required for all DWM-WPP surveys (except DWM-regional monitoring). Changes/corrections to COC forms can be made prior to initiation of sampling run; however, these changes must be made to the finalized COC form, entered into WinLIMS and reflected on the labels affixed to bottles prior to survey. Once samples have been submitted to WES, no changes may be made to data in WinLIMS. If changes are needed after delivery of samples to WES, these changes need to be coordinated directly with WES staff. B3.4 Sample Bottle Labeling
Bottle labels are printed on waterproof label-paper by the survey coordinators as part of the survey preparation. Pre-printed bottle labels are affixed to bottles prior to the bottles getting wet. An example of the required container label displaying the OWMIDs is shown in Appendix H. To minimize sample bottle mix-ups, labeled bottles are placed in individual bottle bags - each bag containing all the bottles for each specific station.

MassDEP-DWM Program QAPP (2020-2024) CN # 520.1 October, 2020 Page 89
B3.5 Sample Preparation (following Collection)
Depending on the analyte, samples may need to be prepared for later analysis (e.g., filleting fish for tissue samples, filtering for true color, chlorophyll a, dissolved nutrients). For water samples, this usually involves filtration to remove suspended solids or generate a non-filterable residue (e.g., via 0.45u filter). In certain instances, involving dissolved analyte fractions (e.g., total dissolved phosphorus), every attempt is made to filter samples immediately after collection in the field (and noted on the fieldsheet and COC). Where this cannot be accomplished, samples are filtered as soon as possible. B3.6 Sample Preservation and Transport
Most samples are typically delivered to the state laboratory, Wall Experiment Station (WES) in Lawrence, Massachusetts. Samples can also be delivered to one or more contract labs for analysis. Samples to be analyzed at the DWM-WPP lab (typically samples for color, turbidity, chlorophyll a, aquatic plants, and E. coli and/or Enterococci by Colilert® / Enterolert®) are delivered to the DWM-WPP lab in Worcester, MA. If samples are delivered by a person(s) that was not involved in taking the sample, the COC form will be filled out and signed off during the transfer. All samples taken are preserved in coolers containing wet ice to <6 deg. C. during transport. Samples may be delivered directly from the field to the lab, or held temporarily in a storage fridge at DWM-WPP before delivery to WES, if hold-times allow The storage fridge at DWM-WPP is monitored daily for storage temperature (<6 deg.C). The Chain of Custody is used to sign samples in and out of the DWM-WPP storage fridge. Bacteria samples transported in coolers are kept in plastic bags immersed in ice to keep them dry. All bacteria samples are delivered to the appropriate lab(s) for analysis ASAP and within 6 hours of collection. Typically, bacteria sample bottles contain sodium thiosulfate for dechlorination, in case of residual chlorine. (The presence of residual chlorine is site-specific; lack of sodium thiosulfate in sample bottles is only allowed when there is no possibility of residual chlorine being present at each location.) Nutrient (e.g., TP, TN, NH3-N, NO3/NO2-N) samples are preserved with sulfuric acid (9N) immediately after collection. Acid preservative for nutrient samples is added from purchased vials in the field by DWM-WPP field staff. Metals samples are preserved with HNO3 to pH<2 at the WES lab within 24 hours. For all preservation requirements for samples, see Table 10. B3.7 Sample Delivery (and Use of Chain-of-Custody (COC) Forms)
When field samples arrive at the lab, the DWM-WPP staff relinquishes custody of samples to the laboratory staff. The sample containers are removed from the shipping or transportation cooler and visually inspected for damage such as leakage, breakage, or contamination. The samples received are then compared with accompanying custody and analysis specification forms to make sure that the paperwork agrees with the labels on each sample container. Standard chain-of-custody (COC) forms are used to transfer sample custody from DWM-WPP staff to the WES, DWM-WPP, or other labs as appropriate. All individuals who handle samples are required to sign and date the COC forms. After samples have been officially transferred and assigned

MassDEP-DWM Program QAPP (2020-2024) CN # 520.1 October, 2020 Page 90
laboratory identification numbers, they are stored, distributed and analyzed according to the lab’s QA Plan and SOPs. The proper procedure for filling out a COC form and transferring sample custody is documented in the respective laboratory Quality Assurance Plans, and in this QAPP. A copy of the WES SOP for filling out the COC form is posted in the DWM-WPP lab. In practice, the survey coordinators prepare the COC forms automatically using the WES WinLIMS pre-login procedures (for WES samples) and/or via PC/manual (for all other labs). Once prepared, survey paperwork is checked for errors prior to use. COC users are advised to: Sign into and out of the storage fridge when samples are kept temporarily in cold storage
(<6 deg. C) at DWM-WPP prior to delivery to the lab Check that the Sample Field ID (OWMID#), Site Name (e.g., PB01) and sample-specific
dates/times for all samples are filled out correctly List the MassDEP Division always, specifically and consistently as “DWM-WPP” List the Project Name consistently Be specific in the Analysis Requested column; including analyte (and specific method if
appropriate) Always use sample preservation codes Have copies of the completed COC forms sent to DWM-WPP electronically Hide the identity of field QC samples from the lab
B3.8 Lab Sample Tracking
The Wall Experiment Station (WES) tracks samples via a Laboratory Information Management System (WinLIMS). The DWM-WPP labs use lab notebooks (paper and electronic) and standardized lab data reports to keep track of samples. DWM-WPP ensures that similar internal mechanisms are in place for any contract labs it employs.

MassDEP-DWM Program QAPP (2020-2024) CN # 520.1 October, 2020 Page 91
Westfield Watershed

MassDEP-DWM Program QAPP (2020-2024) CN # 520.1 October, 2020 Page 92
B4 ANALYTICAL METHODS
All DWM-WPP samples are analyzed using standard protocols contained in accepted WES Lab, DWM-WPP Lab or other laboratory-specific SOPs. Analyses are consistent with each lab’s laboratory Quality Assurance Plan and Lab Safety Plan. B4.1 DWM-WPP Lab SOPs
All DWM-WPP lab work follows the most current and approved Standard Operating Procedures (SOPs), as listed in Table 11 and provided in Appendix E. Table 11: DWM-WPP and SERO Lab Method SOPs
Control Number SOP
CN 0.35 DWM-WPP lab safety
CN 0.34 SERO Lab Safety (Bacterial Source Tracking)
CN 0.4, DWM-WPP lab data reporting guidelines
CN 0.42/0.44 EDD template and guidelines
CN 2.3 Color analysis
CN 3.42 Chlorophyll a analysis
CN 4.25, 4.28, 4.29, 4.29b, 4.32, 4.61, 4.70, 4.81, 4.85 Probe calibrations, various units (lab)
CN 04.99 Deionized water system maintenance and operation
CN 39.2 Benthic macroinvertebrate analysis
CN 40.3 Fish Toxics Collection and Preparation
CN 58.0, 58.5 Optical brighteners
CN 60.0 Benthic algae analysis
CN , 95.7 Turbidity analysis
CN 143.0 Detergents analysis (kit)
CN 150.0, 150.5 Cyanobacteria counts
CN 198.0, 198.5 Colilert® (and Enterolert®) bacteria analysis
CN 230.0 Algal toxins
CN 399.0 Hanna portable photometer
CN 409.0/409.5 Phycocyanin analysis
CN 536.0 Hanna potassium meter

MassDEP-DWM Program QAPP (2020-2024) CN # 520.1 October, 2020 Page 93
B4.2 WES and Contract Lab SOPs
Upon request and as applicable, the WES lab, EPA-NERL lab and contract laboratories employ the following laboratory procedures for DWM-WPP samples (Table 12). When contracting with external contract labs, state-certification for method-specific project analytes (via the MassDEP Laboratory Certification Office) is preferred, but not essential. Certification status is reviewed along with lab QAPs, SOPs and other QA documentation when selecting labs and evaluating data. Table 12: WES, EPA and Contract Lab Analysis Method SOPs for DWM-WPP Samples
Lab Document Title
WES Laboratory Quality Assurance Plan
WES Anatoxin-a ELISA (Abraxis)
WES AOAC Method 983.21 Modified - Determination of Organochlorine Pesticides, PCB Aroclors, and PCB Congeners in Fish and Biological Tissue
WES BacteriodetesG - Bacteroidetes Group Marker by PCR Assay Based on AEM 66:1587
WES BacteroidetesHF -Bacteroidetes Human-Specific Marker - Modified Method of AEM 66:1587
WES EPA 525.5 mod. - Caffeine in Water by Solid-Phase Extraction and Capillary Column Gas Chromatography/Mass Spectrometry
WES ENT-esp Marker - Determination of Enterococcal esp Gene (Sewage Marker) Based on ES&T 39:283
WES EPA Method 1603 – E. coli Membrane Filtration Procedure
WES EPA Method 200.7 – Determination of Metals & Trace Elements & Hardness in Water & Wastes by ICP-AES
WES EPA Method 200.8 – Determination of Metals and Trace Elements by ICP-MS
WES USEPA Method 245.1 – Determination of Mercury in Water by Cold Vapor AA Spectrometry
WES EPA 300.0 – Inorganic Ions
WES Modified USEPA Method 3052 – Multiwave Microwave Digestion of Fish/Biota Tissue
WES USEPA Method 350.1 – Determination of Ammonia, Colorimetric Automated Phenate
WES USEPA Method 351.2 – Determination of Kjeldahl Nitrogen, Colorimetric Semi-Automated Block Digester, Auto Analyzer
WES USEPA Method 353.1 – Determination of Nitrate Nitrite Nitrogen, Colorimetric-Automated, Hydrazine Reduction
WES EPA Method 507 – Determination of Nitrogen & Phosphorus Containing Pesticides in Water by GC & ECD
WES EPA Method 508 – Determination of Chlorinated Pesticides in Water by GC with an ECD
WES USEPA Method 524.2 – Measurement of Purgeable Organic Compounds in Water by Capillary Column GC/MS
WES EPA 525.2 – Organic Compounds by Liquid-Solid Extraction and Capillary Column GC/MS
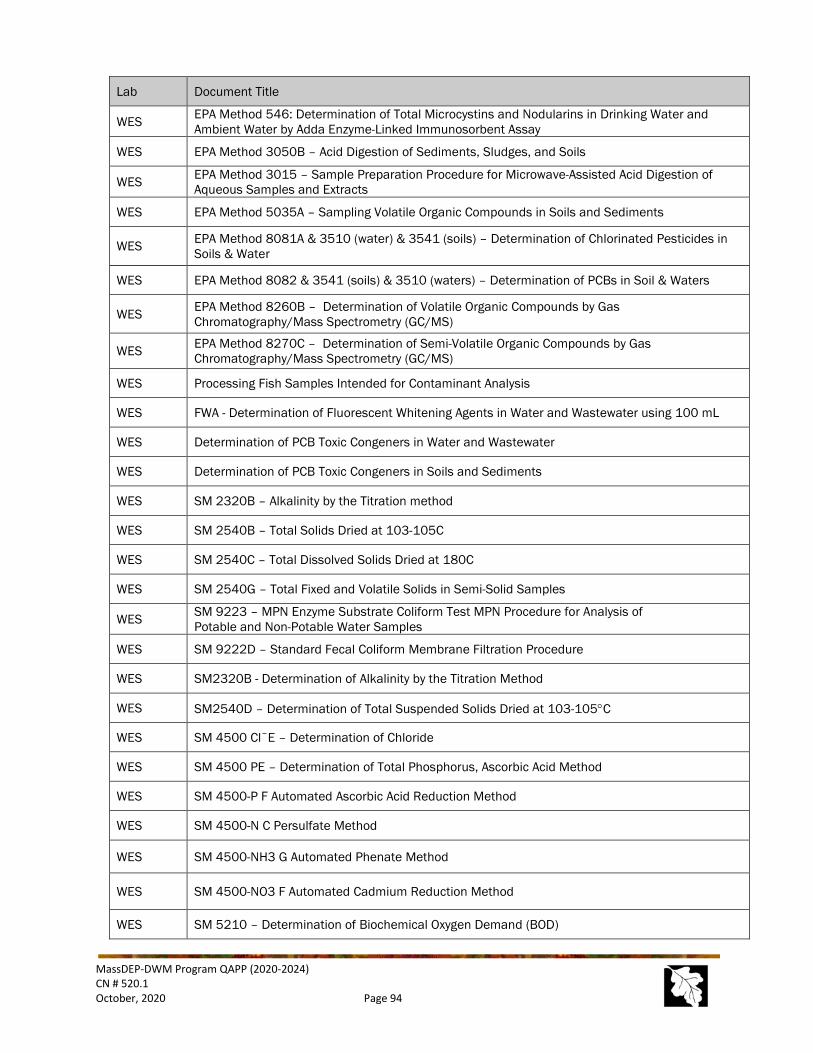
MassDEP-DWM Program QAPP (2020-2024) CN # 520.1 October, 2020 Page 94
Lab Document Title
WES EPA Method 546: Determination of Total Microcystins and Nodularins in Drinking Water and Ambient Water by Adda Enzyme-Linked Immunosorbent Assay
WES EPA Method 3050B – Acid Digestion of Sediments, Sludges, and Soils
WES EPA Method 3015 – Sample Preparation Procedure for Microwave-Assisted Acid Digestion of Aqueous Samples and Extracts
WES EPA Method 5035A – Sampling Volatile Organic Compounds in Soils and Sediments
WES EPA Method 8081A & 3510 (water) & 3541 (soils) – Determination of Chlorinated Pesticides in Soils & Water
WES EPA Method 8082 & 3541 (soils) & 3510 (waters) – Determination of PCBs in Soil & Waters
WES EPA Method 8260B – Determination of Volatile Organic Compounds by Gas Chromatography/Mass Spectrometry (GC/MS)
WES EPA Method 8270C – Determination of Semi-Volatile Organic Compounds by Gas Chromatography/Mass Spectrometry (GC/MS)
WES Processing Fish Samples Intended for Contaminant Analysis
WES FWA - Determination of Fluorescent Whitening Agents in Water and Wastewater using 100 mL
WES Determination of PCB Toxic Congeners in Water and Wastewater
WES Determination of PCB Toxic Congeners in Soils and Sediments
WES SM 2320B – Alkalinity by the Titration method
WES SM 2540B – Total Solids Dried at 103-105C
WES SM 2540C – Total Dissolved Solids Dried at 180C
WES SM 2540G – Total Fixed and Volatile Solids in Semi-Solid Samples
WES SM 9223 – MPN Enzyme Substrate Coliform Test MPN Procedure for Analysis of Potable and Non-Potable Water Samples
WES SM 9222D – Standard Fecal Coliform Membrane Filtration Procedure
WES SM2320B - Determination of Alkalinity by the Titration Method
WES SM2540D – Determination of Total Suspended Solids Dried at 103-105°C
WES SM 4500 ClˉE – Determination of Chloride
WES SM 4500 PE – Determination of Total Phosphorus, Ascorbic Acid Method
WES SM 4500-P F Automated Ascorbic Acid Reduction Method
WES SM 4500-N C Persulfate Method
WES SM 4500-NH3 G Automated Phenate Method
WES SM 4500-NO3 F Automated Cadmium Reduction Method
WES SM 5210 – Determination of Biochemical Oxygen Demand (BOD)

MassDEP-DWM Program QAPP (2020-2024) CN # 520.1 October, 2020 Page 95
Lab Document Title
WES SM 5220B – Determination of Chemical Oxygen Demand, Open Reflux Method
WES SM 5540C – Determination of Anionic Surfactants as MBAS
WES SM 9213D – E. coli Membrane Filtration
WES SM 9215B – Heterotrophic Plate Count – Pour Plate Procedure
WES SM 9222B - Total Coliform Membrane Filtration Procedure
WES SM 9222D - Fecal Coliform Membrane Filtration Procedure
WES SM 9223 - Enzyme Substrate Coliform Test Presence-Absence Procedure for Potable Water
WES SM 9223-MPN - MPN Enzyme Substrate Coliform Test
WES Multiwave Microwave Digestion for Fish Tissue
WES MA EPH Method – Determination of Extractable Petroleum Hydrocarbons
WES Evaluation of Alkaline Persulfate Digestion as an Alternative to Kjeldahl Digestion for Determination of Total and Dissolved Nitrogen and Phosphorus in Water, WRIR 03-4174
EPA EIASOP-INGNO2/NO30 SOP for Nitrate/Nitrite and TN by Lachat Analyzer
EPA EIASOP-INGTP11 – SOP for Total Phosphate and Orthoposphate Analysis by Lachat Analyzer
Phycotech General Technical Approach -- Algal analysis for identifications, counts, and biovolumes
Alpha Analytical
Mass DEP-Approved Method - Determination of Selected Perfluorinated Alkyl Substances by Solid Phase Extraction and Liquid Chromatography/Tandem Mass Spectrometry Isotope Dilution (LC/MS/MS)
Contract Labs (various)
Contract lab SOPs vary from year to year, depending on DWM-WPP’s needs. See Appendices B and G and subsequent QAPP addendums for specific SOP references. A QAPP addendum will be submitted any time a new lab and/or method is added.
B4.3 Analytical Methods, Reporting Units and Holding Times
The methods and associated holding times for common DWM-WPP parameters are provided in Table 12 primarily for methods used by the WES and DWM-WPP labs, but also for those that may be employed by contract labs to be used from 2020-2024 (based on past experience). In many cases, DWM-WPP’s contract labs use the same or similar standard methods (and associated holding times). DWM-WPP ensures that identical (or similar) established methods are employed by all contract labs in order to be able to compare data from different labs. Detection limits (MDLs, MRLs, RLs) using these methods can vary within labs (temporally) and among different labs. For detection limit information, see Table 2 (Element A7). Typically, none of DWM-WPP’s aqueous samples are frozen prior to analysis, except in cases of anticipated and unavoidable holding time exceedances. Decisions to freeze samples, such as nutrients, are avoided as much as possible, and when necessary, the resulting data are automatically qualified (when freezing is not a standard preservation step) or censored as appropriate during DWM-WPP’s data validation.
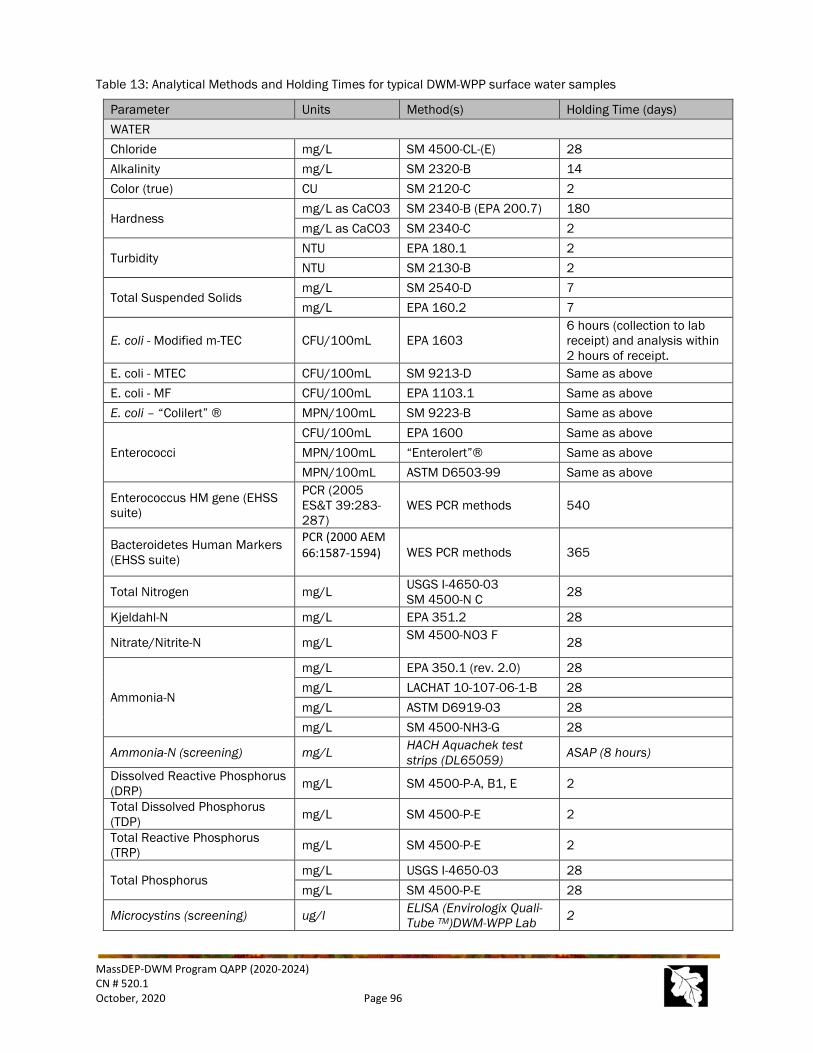
MassDEP-DWM Program QAPP (2020-2024) CN # 520.1 October, 2020 Page 96
Table 13: Analytical Methods and Holding Times for typical DWM-WPP surface water samples
Parameter Units Method(s) Holding Time (days) WATER Chloride mg/L SM 4500-CL-(E) 28 Alkalinity mg/L SM 2320-B 14 Color (true) CU SM 2120-C 2
Hardness mg/L as CaCO3 SM 2340-B (EPA 200.7) 180 mg/L as CaCO3 SM 2340-C 2
Turbidity NTU EPA 180.1 2 NTU SM 2130-B 2
Total Suspended Solids mg/L SM 2540-D 7 mg/L EPA 160.2 7
E. coli - Modified m-TEC CFU/100mL EPA 1603 6 hours (collection to lab receipt) and analysis within 2 hours of receipt.
E. coli - MTEC CFU/100mL SM 9213-D Same as above E. coli - MF CFU/100mL EPA 1103.1 Same as above E. coli – “Colilert” ® MPN/100mL SM 9223-B Same as above
Enterococci CFU/100mL EPA 1600 Same as above MPN/100mL “Enterolert”® Same as above MPN/100mL ASTM D6503-99 Same as above
Enterococcus HM gene (EHSS suite)
PCR (2005 ES&T 39:283-287)
WES PCR methods 540
Bacteroidetes Human Markers (EHSS suite)
PCR (2000 AEM 66:1587-1594)
WES PCR methods 365
Total Nitrogen mg/L USGS I-4650-03 SM 4500-N C 28
Kjeldahl-N mg/L EPA 351.2 28
Nitrate/Nitrite-N mg/L SM 4500-NO3 F 28
Ammonia-N
mg/L EPA 350.1 (rev. 2.0) 28 mg/L LACHAT 10-107-06-1-B 28 mg/L ASTM D6919-03 28 mg/L SM 4500-NH3-G 28
Ammonia-N (screening) mg/L HACH Aquachek test strips (DL65059) ASAP (8 hours)
Dissolved Reactive Phosphorus (DRP) mg/L SM 4500-P-A, B1, E 2
Total Dissolved Phosphorus (TDP) mg/L SM 4500-P-E 2
Total Reactive Phosphorus (TRP) mg/L SM 4500-P-E 2
Total Phosphorus mg/L USGS I-4650-03 28 mg/L SM 4500-P-E 28
Microcystins (screening) ug/l ELISA (Envirologix Quali-Tube TM)DWM-WPP Lab 2
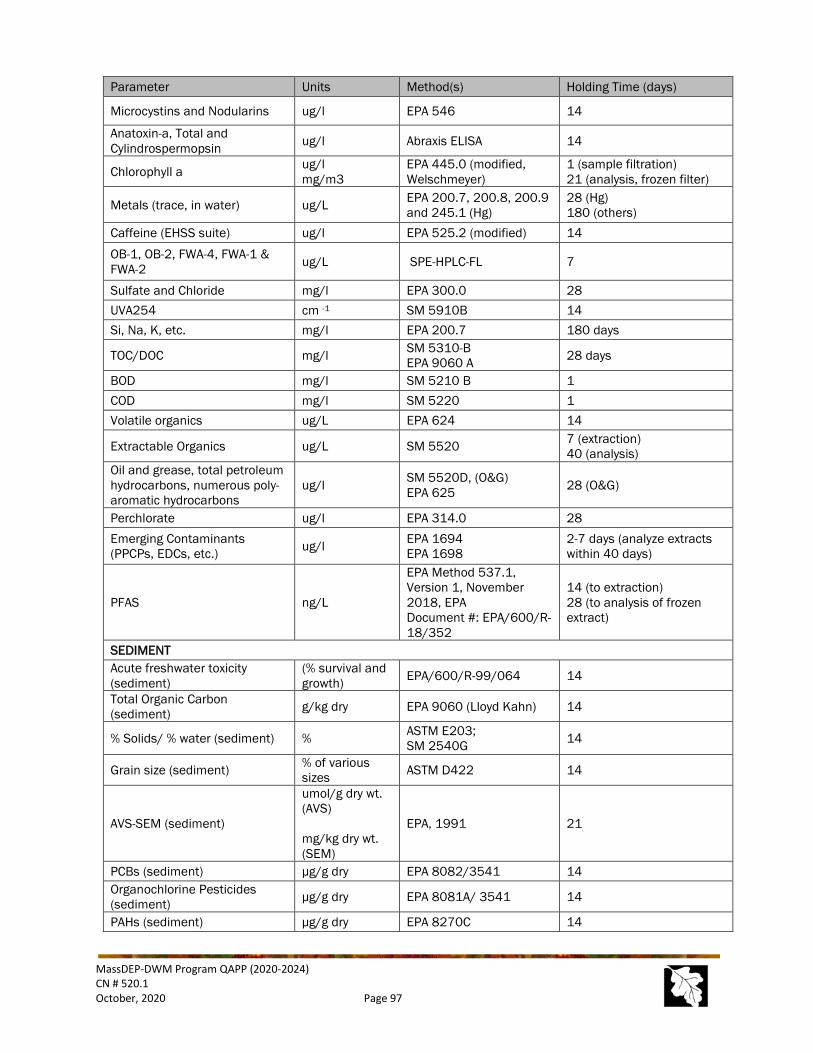
MassDEP-DWM Program QAPP (2020-2024) CN # 520.1 October, 2020 Page 97
Parameter Units Method(s) Holding Time (days)
Microcystins and Nodularins ug/l EPA 546 14
Anatoxin-a, Total and Cylindrospermopsin ug/l Abraxis ELISA 14
Chlorophyll a ug/l mg/m3
EPA 445.0 (modified, Welschmeyer)
1 (sample filtration) 21 (analysis, frozen filter)
Metals (trace, in water) ug/L EPA 200.7, 200.8, 200.9 and 245.1 (Hg)
28 (Hg) 180 (others)
Caffeine (EHSS suite) ug/l EPA 525.2 (modified) 14 OB-1, OB-2, FWA-4, FWA-1 & FWA-2 ug/L SPE-HPLC-FL 7
Sulfate and Chloride mg/l EPA 300.0 28 UVA254 cm -1 SM 5910B 14 Si, Na, K, etc. mg/l EPA 200.7 180 days
TOC/DOC mg/l SM 5310-B EPA 9060 A 28 days
BOD mg/l SM 5210 B 1 COD mg/l SM 5220 1 Volatile organics ug/L EPA 624 14
Extractable Organics ug/L SM 5520 7 (extraction) 40 (analysis)
Oil and grease, total petroleum hydrocarbons, numerous poly-aromatic hydrocarbons
ug/l SM 5520D, (O&G) EPA 625 28 (O&G)
Perchlorate ug/l EPA 314.0 28 Emerging Contaminants (PPCPs, EDCs, etc.) ug/l EPA 1694
EPA 1698 2-7 days (analyze extracts within 40 days)
PFAS ng/L
EPA Method 537.1, Version 1, November 2018, EPA Document #: EPA/600/R-18/352
14 (to extraction) 28 (to analysis of frozen extract)
SEDIMENT Acute freshwater toxicity (sediment)
(% survival and growth) EPA/600/R-99/064 14
Total Organic Carbon (sediment) g/kg dry EPA 9060 (Lloyd Kahn) 14
% Solids/ % water (sediment) % ASTM E203; SM 2540G 14
Grain size (sediment) % of various sizes ASTM D422 14
AVS-SEM (sediment)
umol/g dry wt. (AVS) mg/kg dry wt. (SEM)
EPA, 1991 21
PCBs (sediment) µg/g dry EPA 8082/3541 14 Organochlorine Pesticides (sediment) µg/g dry EPA 8081A/ 3541 14
PAHs (sediment) µg/g dry EPA 8270C 14

MassDEP-DWM Program QAPP (2020-2024) CN # 520.1 October, 2020 Page 98
Parameter Units Method(s) Holding Time (days)
Metals (sediment) mg/kg dry EPA 200.7 EPA 6010B 180
Hg (sediment) mg/kg dry EPA 245.1 EPA 7473 EPA 1631
28
PFAS TBD by project-specific QAPP
FISH TISSUE Hg ug/g (wet) EPA 7473 28 PCBs and Organochlorine Pesticides ug/g (wet) Modified AOAC 983.21 180 (frozen)
Metals (Cd, As, Pb, Se) ug/g (wet) EPA 200.9 180 (frozen)
PFAS TBD by project-specific QAPP * Changes to analytes and/or methods shall be noted in annual addendums B4.5 EPA-NERL Assistance
Upon request, the EPA-New England Regional Laboratory in North Chelmsford, MA can provide assistance in a number of monitoring areas, including lab analyses. Where appropriate, DWM-WPP requests that its standard template for Electronic Data Deliverables (EDD) be used for EPA data reporting. B4.6 Laboratory Data Reporting Formats
WES Lab, DWM-WPP Lab, EPA-NERL and contract lab final data and associated internal lab QC results are provided to DWM-WPP’s Data Management Team in digital format (e.g., WinLIMS downloads, pdf e-files, or Electronic Data Deliverables in Excel format). Hard copy data reports, when provided, are placed in project folders. The WES Lab data can be accessed by DWM-WPP through the WinLIMS system as soon as data are finalized. These represent final laboratory data for DWM-WPP review and subsequent data validation. Following preliminary DWM-WPP QC review for completeness and typographic errors, lab data can be released to the monitoring survey coordinators and other data users as “raw” data (QC status 1). B4.7 WES Lab Data Qualifiers
The WES Lab makes every effort to avoid the use of data qualifiers through sound lab practices, including efficient sample tracking, diligent reagent preparation and quality control, multi-level data reviews, and re-testing as needed. In some instances, however, qualification of data is necessary and, in all cases, helpful when needed. WES laboratory staff may use the following standard data qualifiers/text results, as reported via the WinLIMS: WES WinLIMS Qualifiers: B = Analyte detected in a blank (LRB-MB, FB-FRB, or TB) above the QC Limit. Results
are qualified when the field sample concentration is less than 10 times the concentration in the blank

MassDEP-DWM Program QAPP (2020-2024) CN # 520.1 October, 2020 Page 99
B1 = Analyte detected in a blank (LRB-MB, FB-FRB, or TB) above QC Limit. Results are qualified
BNC = Required FB-FRB or TB not collected/received E = Estimated Result: Exceeds the upper cal. range or the upper bacterial count limit HA = Samples analyzed past holding time HA-Hg = Holding time not met but previous studies by WES show that frozen fish
samples are stable for mercury for at least one year HR = Samples received past holding time J1 = Estimated Result: LFM-MS outside acceptance limits; if biased high, field sample
results < 1/3 MRL or < MRL are NOT qualified J2 = Estimated Result: LFB-LCS outside acceptance limits; if biased high, field sample
results < 1/3 MRL or < MRL are NOT qualified J3 = Estimated Result: SAMPLE DUPL, FIELD DUPL, LFB-LCS Duplicate, or LFM-
MS Duplicate outside acceptance limits; if the duplicate recovery is biased high, field sample results < 1/3 MRL or < MRL are NOT qualified
J4 = Estimated Result: Dilution water supersaturated with oxygen J5 = Estimated Result: QCS, QCS-LC, QCS-HC, or QCS-SRM outside acceptance
limits; if biased high, field sample results < 1/3 MRL or < MRL are NOT qualified J10 = Insufficient sample volume received to run method-required LFM-MS J11 = Insufficient sample volume received to run method-required sample duplicate or
LFM-MS duplicate JO = Other QC criteria not met (see comments) L = Estimated Result: Below the lower calibration range M = Estimated Result: Analyte concentration ≥ MDL but ˂ MRL N = GC/MS non-target tentatively identified compound (TIC)-no standard available for
quantitation R = Data rejected due to severe QC, quantitation, and/or qualitative ID deficiencies SC = Incorrect sample container used SP = Sample preserved improperly in the field ST = Sample temperature outside of acceptance limits at receipt
B4.8 EPA-NERL Qualifiers
When EPA provides water quality lab services to DEP (e.g., for ambient metals analysis), the following standard data symbols are used. During data validation, these are applied to DWM-WPP final results “as-is” or using the equivalent standard DWM-WPP qualifier. RL = Reporting limit ND = Not Detected above Reporting limit NA = Not Applicable due to high sample dilutions or sample interferences NC = Not calculated since analyte concentration is ND. J = Estimated value J1 = Estimated value due to MS recovery outside acceptance criteria J2 = Estimated value due to LFB result outside acceptance criteria J3 = Estimated value due to RPD result outside acceptance criteria J4 = Estimated value due to LCS result outside acceptance criteria E = Estimated value exceeds the calibration range L = Estimated value is below the calibration range

MassDEP-DWM Program QAPP (2020-2024) CN # 520.1 October, 2020 Page 100
B = Analyte is associated with the lab blank or trip blank contamination. Values are qualified when the observed concentration of the contamination in the sample extract is less than 10 times the concentration in the blank
R = No recovery was calculated since the analyte concentration is greater than four times the spike level.
B4.9 Use of Contract Labs
Based on the specific analytical needs of DWM-WPP projects, laboratory services are sometimes contracted via Request for Responses (RFR) or a Master Services Agreement (MSA). As of July 2020, the following labs (Table 14) are pre-approved by DWM-WPP under an existing laboratory services MSA. Table 14: DWM-WPP Master Services Agreement List of Laboratory Vendors
Vendor Vendor ID # Contact Alpha Analytical, Inc. 00008669 Jim Occhialini
145 Flanders Road Westborough, MA 01581 [email protected] (508) 439-5111
Cole Ecological, Inc. 00004631 15 Bank Row, Suite B Greenfield, MA 01301 [email protected] (413) 774-5515
Con-Test Analytical Laboratory
300071 Pam Byers 39 Spruce St. East Longmeadow, MA 01028 [email protected] (413) 525-2332
Northeast Environmental Laboratory Inc
00011801 Susan Tropeano 41 Dayton St Danvers, MA 01923 [email protected] (978) 777-4442
PhycoTech, Inc. 00004143 Ann St. Amand 620 Broad Street, Suite 100 Saint Joseph, MI 49085 [email protected] (269) 983-3654
Eurofins TestAmerica, Westfield
00004171 126 Myron Street West Springfield, MA 01089-1420 [email protected] (413) 572-4000
For all contract laboratories, DWM-WPP requires that its standard template for Electronic Data Deliverables (EDD) be used for data reporting.

MassDEP-DWM Program QAPP (2020-2024) CN # 520.1 October, 2020 Page 101
B4.10 Contract Lab Qualifiers
When DWM-WPP employs a private laboratory for analytical services, the qualifiers used varies from lab to lab, and are specified in each lab’s QAP. Any lab-specific data qualifiers applied to DWM-WPP data are taken into account during the data validation process by applying the qualifiers directly final results “as-is” or by using the equivalent standard DWM-WPP qualifier. B4.11 DWM-WPP Lab Qualifiers
WPP lab staff use the following standard preliminary lab qualifiers for in-house analyses (e.g., true color, chlorophyll a, turbidity, E. coli, etc.) when needed, however, the final data qualifiers are applied during formal data validation. DWM-WPP Lab Qualifiers and Reporting Conventions: “B” = Analyte found in reagent blank “H” = Analytical holding time exceeded. “D” = duplicate RPDs exceed DQOs “J” = misc. QC criteria not met “<X” = sample concentration < MDL and “X” is numeric method detection limit value “<Y” = sample concentration < RDL and “Y” is numeric reporting limit value “>Z” = sample concentration > UQL and “Z” is the upper quantitation limit value ** = missing result ## = censored data
All preliminary lab qualifiers are reviewed during the data validation process. See Element D1.2 for a complete description of final DWM-WPP data qualifiers that are used when reporting data, which may differ from the lab qualifiers used for preliminary data.

MassDEP-DWM Program QAPP (2020-2024) CN # 520.1 October, 2020 Page 102
Charles Watershed

MassDEP-DWM Program QAPP (2020-2024) CN # 520.1 October, 2020 Page 103
B5 QUALITY CONTROL
By providing important information necessary to assess data quality, DWM-WPP’s quality control program serves to minimize cumulative uncertainty for measured variables. Lab audits will continue as usual for the WES lab and contract labs as resources allow. B5.1 Field Quality Control
DWM-WPP surveys are planned well in advance to ensure proper coordination takes place among all parties, to allow adequate preparation time for crews and to ensure proper procedures are followed. Well-planned and executed surveys help to minimize field error. Water Quality Surveys: To estimate the overall precision or repeatability of results, a subset of DWM-WPP field samples are replicated by taking co-located, simultaneous, duplicate grab samples. Approx. 10% of the total number of samples and a minimum of one per survey per analyte group is typically collected. Where co-located, simultaneous, duplicate grab samples cannot be taken for any reason, it is noted on the fieldsheet what alternate type of field duplicate (e.g., sequential duplicate) was actually taken. On a project-specific basis, QC samples may be taken at a higher percentage. In addition, ambient field blanks or equipment blanks if appropriate are taken at 10% of total samples to evaluate if any sample contamination may have occurred due to improper sample collection, atmospheric fallout or other causes. Blank samples may be taken at a higher percentage, depending on the project. Performance Evaluation (PE) or diluted Certified Reference Material samples may also be delivered to a lab to evaluate lab analytical accuracy and precision. Typically, DWM-WPP evaluates a sub-set of analyses each year by providing labs with QC samples for which DWM-WPP knows the “true” concentrations (e.g., E. coli count, nutrient/metal concentrations, etc.). These QC samples may be single-blind (sample type known by the lab, but not concentration) or double-blind (concentration unknown AND sample disguised as a real sample). These are prepared by DWM-WPP, by its agents, or are purchased through a Proficiency Test (PT) provider. Training sessions for DWM-WPP field monitoring staff are held each spring, prior to any field surveys, to ensure that field measurements and samples will be taken consistent with accepted, approved SOPs. For experienced staff, these can be a basic review session, but for seasonal staff, a more thorough approach is taken to cover all aspects of field work. In addition, field audits can be performed by DWM-WPP’s QA Analyst to ensure consistent application of field protocols among different field crews. See Table 16 through Table 19 for quality control requirements for water quality analytes, multiprobe parameters (including continuous deployment) and for continuous temperature sensors, respectively.

MassDEP-DWM Program QAPP (2020-2024) CN # 520.1 October, 2020 Page 104
Biological Surveys: See biological programs QAPPs and SOPs (Appendices A, B, D, and E). B5.2 Lab Quality Control
DWM-WPP requires sufficient laboratory quality control for all its data generation activities. Laboratory quality control processes are described in the WES Lab and DWM-WPP Lab QAPs and SOPs, as well as in the QA documentation for contract labs. Required lab quality control procedures include but are not limited to detailed recordkeeping, SOPs that are current/updated, participation in proficiency testing studies, use of appropriate QC samples (e.g., lab blank, reagent blanks, sample duplicate and matrix spike analyses), and keeping internal control and calibration charts. For detailed descriptions of calibration and maintenance procedures for WES and other labs, see the applicable lab QAPs and SOPs, adopted herein by reference. Operating specifications for DWM-WPP’s reagent water system are detailed in Table 15. For all labs used, DWM-WPP requests that laboratory quality control data be included with submitted data packages. Analysis of these lab QC data helps inform DWM-WPP’s data validation process. Table 15: Operating Specifications for DWM-WPP Reagent Water System
Manufacturer/Brand Thermo Scientific E-pure®
Series 1090
Water quality output Type 1 RGW per ASTM D1193; 18.2 M-ohm-cm
Max. flow rate 2.5 LPM (pressure-feed @ 60 HZ)
Feedwater reqts. HQ tap water or better
Resistivity measurement 0.01-18.2M-ohm-cm (temperature-compensated at 25 deg. C); +/-3%
Treatment methods (cartridges)
Cellulose/resin filtration (pretreatment), ion-exchange (deionization), activated carbon organics filtration, 0.2u final filtration
# cartridges 4

MassDEP-DWM Program QAPP (2020-2024) CN # 520.1 October, 2020 Page 105
Table 16: Field Sampling Quality Control Requirements for Water Quality Analytes
QC SAMPLE TYPE Frequency Corrective Action Persons Responsible for Corrective Action
Data Quality Indicator
Measurement Performance Criteria
Ambient Field Blanks and/or Equipment Blanks, or Trip Blanks (as approp.)
Minimum 10% of samples collected, and a minimum of 1 per survey
Qualify or censor data as necessary
Survey Coordinator and QA Analyst
Accuracy (contamination)
No target analytes exceeding MDL (preferred) or RL
Field Duplicates Minimum 10% of samples collected, and a minimum of 1 per survey
Evaluate and compare lab dups and field dups (overall precision). Censor or qualify data as necessary
Survey Coordinator and QA Analyst Overall Precision See Table 2 for precision
DQOs
Performance Evaluation (PE) Samples
1-2 occasions per season, per lab and per analyte group
Discuss with lab; rerun test samples. Censor or qualify data as necessary
QA Analyst and lab QC officer Accuracy
Same as QC/PT sample acceptance criteria (provided by PT lab)
Cooler Temperature Blank
Each cooler Add more ice; drain cooler water Survey crew leader Accuracy
(preservation) 0-6 deg. C
Table 17: General Field & Laboratory Quality Control Requirements for Biological Samples
QC SAMPLE TYPE Frequency Corrective Action Persons Responsible for Corrective Action
Data Quality Indicator
Measurement Performance Criteria
Field Duplicates Minimum 10% of samples collected, and a minimum of 1 per survey
Evaluate and compare duplicate data; censor or qualify data as necessary
Biological Survey Coordinator Overall Precision See Table 2 for precision
DQOs
Duplicate habitat assessment Every station; every survey
Disagreement in habitat parameter scoring will be discussed and resolved before the Habitat Assessment can be considered complete.
Survey Coordinator and field crew Precision See Table 2 for DQO

MassDEP-DWM Program QAPP (2020-2024) CN # 520.1 October, 2020 Page 106
QC SAMPLE TYPE Frequency Corrective Action Persons Responsible for Corrective Action
Data Quality Indicator
Measurement Performance Criteria
“Expert” verification of taxonomic IDs & enumerations
As needed and spot checks
Work with taxonomist to determine correct identity when there is disagreement. Seek assistance from authority on the taxonomic group if identity cannot be resolved.
Bio-Survey Coordinator Accuracy See Table 2 for DQO
QC checks on sorting efficiency (inverts)
10% of samples Repicking of the subsample with the addition of the “discovered” specimens.
Bio-Survey Coordinator Completeness >90% sorting efficiency
Table 18: Field and Laboratory Quality Control Requirements for ATTENDED Multi-Probe Instruments
QC SAMPLE TYPE Frequency/ Number
Method/SOP QC Acceptance Limits
Corrective Action (CA)
Persons Responsible for Corrective Action
Data Quality Indicator
Measurement Performance Criteria
Pre-Calibration (or pre-deployment) Each day used
See SOP (CN 4.25, 4.28, 4.29, 4.31, 4.61, 4.70, 4.81, 4.85) and multi-probe instrument manuals
Re-calibrate to within allowable specs.
Field & Lab Operations Coordinator & QA Analyst
Accuracy/bias Contamination
Must meet or exceed instrument accuracy specs
Field Duplicate reading (Lakes only)
Approximately 10% of sites, minimum of one per trip
RPD < 10% Re-deploy and start reading sequence again
Field survey crew leader General precision RPD < 10%
Instrument Blank After pre & post calibrations
No target compounds > lowest calibration standard
Retest and/or qualify data
Field & Lab Operations Coordinator & QA Analyst
Accuracy/bias Contamination
No target compounds> lowest calibration level
Post-Survey (or post-deployment) Check and User Report
End of each day or after deployment
See SOPs (CN 4.25, 4.28, 4.29, 4.31, 4.61, 4.70, 4.81, 4.85) and multi-probe instrument manuals
If outside acceptance limits, discard or qualify data
Field & Lab Operations Coordinator & QA Analyst
Accuracy/bias Contamination
Must meet or exceed instrument accuracy specs

MassDEP-DWM Program QAPP (2020-2024) CN # 520.1 October, 2020 Page 107
Table 19: Field and Laboratory Quality Control Requirements for UNATTENDED Continuous Loggers
QC SAMPLE TYPE
Frequency/ Number QC Acceptance Limits Corrective
Action (CA) Persons Responsible for Corrective Action Data Quality Indicator Measurement
Performance Criteria
Pre-Deployment QC Check
Before every use for each sensor
D.O.: +/- 0.3 mg/l Temperature: +/- 0.3 deg. C (vs. NIST-certified lab thermometer) Sp.Cond: 3% or 15 uS/cm (low) 3% or 30uS/cm (high) (vs. lab standard) Time: +/- 1 minute
Replace with more accurate sensor
Field & Lab Operations Coordinator & QA Analyst
Accuracies for D.O., temperature, Sp.cond., and time compared against 100% saturation concentration, lab standard, NIST-traceable thermometer and PC network clock, respectively
See SOP (CN 103.1 & CN 349.0) and sensor specifications
During-Deployment QC checks (Field Duplicate readings)
Each sensor; min. 1X/month (or more freq. for shorter duration deployments)
D.O.: +/- 0.5 mg/l Temperature: +/- 0.5 deg. C (vs. NIST-certified lab thermometer) Sp.Cond: +/- 10 uS/cm (low) +/- 40 uS/cm (high) Time: +/- 1 minute
Replace with more accurate sensor; re-deploy
Project Coordinator & QA Analyst Accuracy as above
See SOP (CN 103.1 & CN 349.0) and sensor specifications
Post-Deployment Checks
After every use for each sensor
D.O.: +/- 0.5 mg/l Temperature: +/- 0.5 deg. C (vs. NIST-certified lab thermometer) Sp.Cond: 3% or 15 uS/cm (low) 3% or 30uS/cm (high) (vs. lab standard) Time: +/- 1 minute
If data outside acceptance limits, discard or qualify data
Field & Lab Operations Coordinator & QA Analyst
Accuracy as above
See SOP (CN 103.1 & CN 349.0) and sensor specifications

MassDEP-DWM Program QAPP (2020-2024) CN # 520.1 October, 2020 Page 108
North Coastal Watershed

MassDEP-DWM Program QAPP (2020-2024) CN # 520.1 October, 2020 Page 109
B6 FIELD EQUIPMENT TESTING, INSPECTION AND MAINTENANCE
All field equipment used by DWM-WPP to collect environmental data is inspected, maintained, calibrated (as applicable) and tested prior to use. In addition to rigorous pre-survey calibrations, water quality instruments are also checked following use to ensure they were operating properly during field data collection. A summary of inspection and maintenance procedures for each instrument type is contained in Table 20.

MassDEP-DWM Program QAPP (2020-2024) CN # 520.1 October, 2020 Page 110
Table 20: DWM-WPP Field Equipment Calibration, Inspection and Maintenance
Instrument Person(s) Responsible
Frequency of Calibration
Inspection Activity and Frequency
Maintenance Activity and Frequency
Testing Activity and Frequency Corrective Action (CA) SOP Reference
Multiprobes: * Hydrolab® Series 5 YSI EXO1
Shervon DeLeon Dahlia Tympanick Monitoring Coords.
Pre-cal/re-cal prior to and within 24 hours of use Post-use QC checks
Visual & Electronic; Monthly and/or before each use
Hardware & Software Repair and maintenance as needed.
Pre-survey calibration & post-survey QC checks
Re-calibrate as necessary during pre-calibration; censoring or qualifying data if post-survey check indicates excessive drift or inaccuracies in comparison to pre-calibrated readings and standard solutions
CN 4.25, CN 4.33, CN 4.34
Backpack electrofishers (battery and gas-powered; e.g. Smith Root Model 12/15, Coffelt Mark 10.BP4, Halltech HT-2000 or equivalent)
Daniel Davis, Peter Mitchell ---
Visual inspection before use; check battery charge before use
Clean the electrode ring and rat tail cathode with steel wool twice per year Winterize the gas-powered electro-fisher by adding gas stabilizer to the main and spare fuel tanks at the end of the sampling season. Recharge batteries immediately after use.
Set for effective use for conditions at site
Clean and adjust as needed CN 533.0

MassDEP-DWM Program QAPP (2020-2024) CN # 520.1 October, 2020 Page 111
Instrument Person(s) Responsible
Frequency of Calibration
Inspection Activity and Frequency
Maintenance Activity and Frequency
Testing Activity and Frequency Corrective Action (CA) SOP Reference
Barge electrofisher (gas powered; e.g. Smith Root Model SR6, SR7 or equivalent)
Daniel Davis, Peter Mitchell ---
Visual inspection before use; all items should be checked for tightness (tightened if necessary) prior to each survey.
Change the Honda™ generator oil once per year. Clean the hull of the electro-fishing barge, cathode plate, and the anode rings with steel wool once per year or as needed.
Set for effective use for conditions at site
Clean and adjust as needed
CN 533.0
Velocity Meters (for flow measurement) 1) Price AA 2) Teledyne-Gurley 3) Swoffer 4) Sontek ADV FlowTracker
Shervon DeLeon Richard Chase Monitoring Coords.
Before each use Visual & Electronic; Before and after each use
Inspect post-use for damage; lubricate parts as needed per SOP. Also, repair and maintenance as needed.
Prior to each use in the lab; field testing in Spring prior to seasonal use.
Re-calibrate as necessary. If repair and/or re-calibration ineffective, replace with alternate device.
CN 68.0, CN 68.7
Lowrance depth finders (lakes)
Shervon DeLeon Monitoring Coords.
See SOP 82.1 See SOP 82.1 See SOP 82.1 See SOP 82.1 See SOP 82.1 CN 82.1
Phycocyanin Probe (Turner Cyclops/ Databank)
Joan Beskenis Shervon DeLeon
Annually (Spring) using standard. Before and after each use using solid secondary standard
Visual, before and after each use
Cleaning as needed; before and after each use
See SOP 409.0
Re-calibrate as needed during pre-calibration; censoring or qualifying data if post-survey check indicates excessive drift or inaccuracies
CN 409.0, CN 409.5
NIST-traceable thermometer (field)
Shervon DeLeon Monitoring Coords.
Annually, and as needed based on QC checks.
Visual & Electronic; Before and after each use
As needed
Annual (Spring) comparison to NIST-traceable thermometer
Replace unit as needed
CN 4.25 CN 103.1

MassDEP-DWM Program QAPP (2020-2024) CN # 520.1 October, 2020 Page 112
Instrument Person(s) Responsible
Frequency of Calibration
Inspection Activity and Frequency
Maintenance Activity and Frequency
Testing Activity and Frequency Corrective Action (CA) SOP Reference
Temperature-only Loggers * (Onset PROV2, TidBits)
Shervon DeLeon Dahlia Tympanick Monitoring Coords.
Annually, and as needed based on QC checks.
Visual & Electronic; Before, during and after each use; if possible, review data while deployed to ensure working order and accuracy
NA
Annual (Spring) QC check against DWM-WPP NIST-traceable thermometer and PC network clock, per SOP.
Replace with working sensor.
CN 103.1, CN 4.85
Cond/Temp loggers
Shervon DeLeon Dahlia Tympanick
Before and after field deployment
Visual & Electronic; Before and after each use
NA
Annual (Spring) QC check against DWM-WPP NIST-traceable thermometer and PC network clock, per SOP.
Replace with working sensor. CN 349.0
Onset DO/T Shervon DeLeon Dahlia Tympanick
Before and after field deployment
Visual & Electronic; Before and after each use
NA
Annual (Spring) QC check against DWM-WPP NIST-traceable thermometer and network clock, per SOP.
Replace with working sensor. CN 4.81
GPS (vehicle; hand-held)
Shervon DeLeon Monitoring Coords.
--- Settings (annually) As needed per manual Annually --- ---
Master-Flex peristaltic pump (field filtration)
Shervon DeLeon Monitoring Coords.
NA Before each use (in the lab) As needed. Before each use (in
the lab). Repair as needed. CN 1.21
* DWM-WPP checks temperature loggers and probes annually against a NIST-traceable thermometer at near 0.0 o C and room temperature (approx. 20-22 o C).

MassDEP-DWM Program QAPP (2020-2024) CN # 520.1 October, 2020 Page 113
Hudson/Hoosic Watershed

MassDEP-DWM Program QAPP (2020-2024) CN # 520.1 October, 2020 Page 114
B7 LAB INSTRUMENT CALIBRATION, INSPECTION AND MAINTENANCE
All laboratory instruments involved in analyses of DWM-WPP samples are inspected, maintained, calibrated (as applicable) and tested prior to use. Details on the calibration of each DWM-WPP lab analytical instrument are contained in Table. For detailed descriptions of calibration procedures for WES and other lab instrumentation, see the applicable lab QAPs and SOPs, adopted herein by reference.

MassDEP-DWM Program QAPP (2020-2024) CN # 520.1 October, 2020 Page 115
Table 21: DWM-WPP Analytical Instruments Calibration and Maintenance
Instrument Person(s) Responsible
Frequency of Calibration
Inspection Activity and Frequency
Maintenance Activity and Frequency
Testing Activity and Frequency
Corrective Action (CA)
SOP Reference
NIST-traceable thermometer (lab) *
Shervon DeLeon Annually, and as needed based on QC checks.
Visual & Electronic; Before and after each use
As needed Annual re-calibration by manufacturer vs. NIST-certified
Send to manufacturer for re-calibration per SOP
CN 4.25 CN 103.1
IDEXX Colilert System (sealer, incubators, incubator thermometers, etc.)
Shervon DeLeon
Sealer and incubators: Prior to each use. Incubator thermometers: annually to NIST-traceable
Visual checks prior to each use, including incubator temperature checks
Per equipment manual (IDEXX, Inc.) NA
Apply temperature correction factors to incubator temps as needed
CN 198.0
Turner TD-700 Fluorometer (Chl a analysis)
Joan Beskenis Prior to and following the sampling season
Calibration uses pure or re-hydrated Chlorophyll-a preparations, or a solid standard
As needed per SOP Periodic QC checks using dehydrated Chl-a during seasonal use
Re-calibrate as necessary per SOP CN 3.42
Turbidimeter (AQUAfast AQ4500)
Shervon DeLeon Users (checks)
Calibration using a range of standards: every 3 months. Low standard check: prior to each use
Visual; daily when in active use. As needed per SOP Periodic QC checks
during use per SOP
Censor or qualify data if QC check data indicate excessive drift or inaccuracies in comparison to standard calibration solutions
CN 95.7
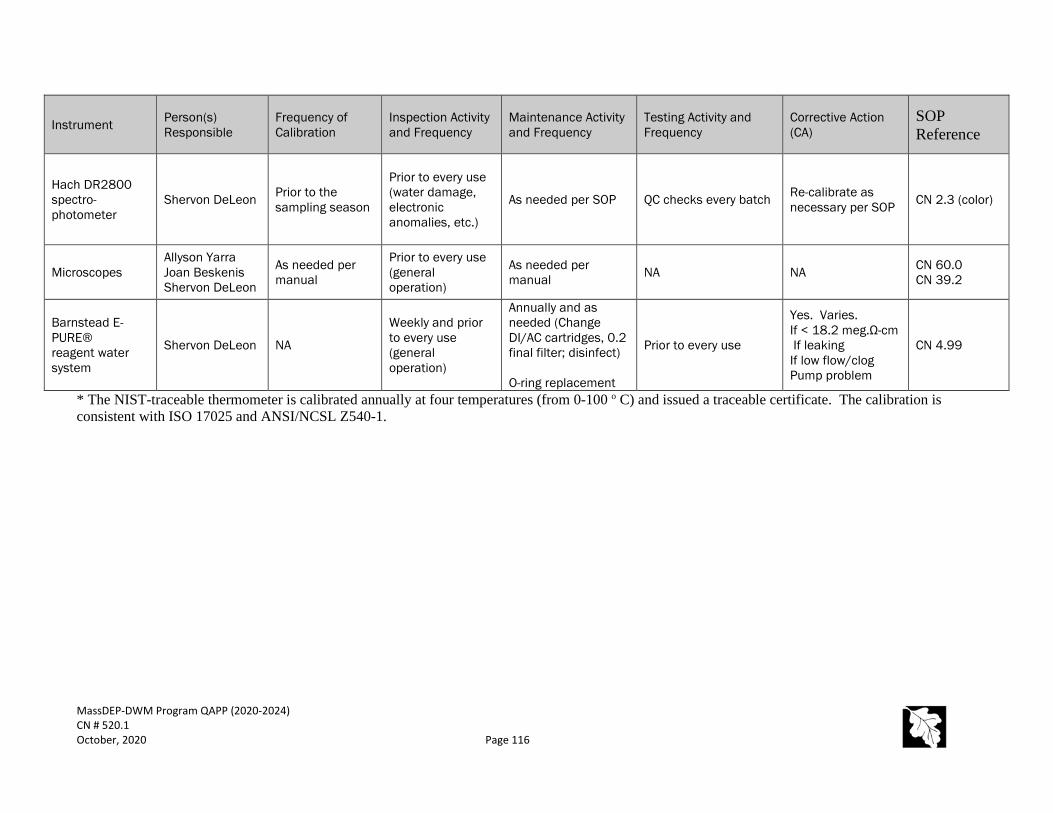
MassDEP-DWM Program QAPP (2020-2024) CN # 520.1 October, 2020 Page 116
Instrument Person(s) Responsible
Frequency of Calibration
Inspection Activity and Frequency
Maintenance Activity and Frequency
Testing Activity and Frequency
Corrective Action (CA)
SOP Reference
Hach DR2800 spectro-photometer
Shervon DeLeon Prior to the sampling season
Prior to every use (water damage, electronic anomalies, etc.)
As needed per SOP QC checks every batch Re-calibrate as necessary per SOP CN 2.3 (color)
Microscopes Allyson Yarra Joan Beskenis Shervon DeLeon
As needed per manual
Prior to every use (general operation)
As needed per manual NA NA CN 60.0
CN 39.2
Barnstead E-PURE® reagent water system
Shervon DeLeon NA
Weekly and prior to every use (general operation)
Annually and as needed (Change DI/AC cartridges, 0.2 final filter; disinfect) O-ring replacement
Prior to every use
Yes. Varies. If < 18.2 meg.Ω-cm If leaking If low flow/clog Pump problem
CN 4.99
* The NIST-traceable thermometer is calibrated annually at four temperatures (from 0-100 o C) and issued a traceable certificate. The calibration is consistent with ISO 17025 and ANSI/NCSL Z540-1.

MassDEP-DWM Program QAPP (2020-2024) CN # 520.1 October, 2020 Page 117
Ten Mile Watershed

MassDEP-DWM Program QAPP (2020-2024) CN # 520.1 October, 2020 Page 118
B8 INSPECTION OF SUPPLIES
Based on their individual responsibilities, designated DWM-WPP staff are responsible for ensuring the adequacy of supplies and equipment necessary to perform monitoring surveys. Equipment and supplies are ordered annually and as needed to meet specific monitoring and analytical needs. Wherever feasible, DWM-WPP strives to avoid or minimize the use of hazardous materials, to minimize the environmental impacts of its purchasing decisions, and to make cost-effective purchasing decisions. Table 22 provides some examples of types of supplies used by DWM-WPP (not exhaustive). Following use, efforts are made to recycle used supplies wherever possible at the 8 New Bond St. location. Disposal of liquid and solid wastes is done in the most environmentally-sensitive ways possible, and in compliance with applicable Massachusetts regulations. Table 22: DWM-WPP Supplies
WPP STAFF PROGRAM AREA(S) TYPES OF SUPPLIES
Shervon DeLeon Laboratory and Field Operations
Sampling devices, multi-probe units and supplies, analytical kits, Colilert® / Enterolert® reagents and supplies, sample bottles, QC samples, cameras, GPS units, etc. DIW system maintenance supplies, probes and sonde parts, calibration reagents, water system cartridges, etc.
Shervon DeLeon Lab and Field Safety Safety equipment and first aid supplies
Dan Davis Pete Mitchell
Fish toxics and community monitoring
Electroshocking equipment, nets, knives, boating supplies, etc. related to fish toxics and fish population sampling
Allyson Yarra Benthic Macroinvertebrates Microscopy
Nets, reagents, bottles, etc. related to benthic macroinvertebrate sampling & analysis, microscopy parts and equipment
Dahlia Tympanick Lake and TMDL Monitoring Depth finders, boating supplies, misc. test equipment
Joan Beskenis Benthic algae Microscopy
Supplies and reagents for chlorophyll a analysis, benthic algae sampling and analysis
Robin Murphy Vehicles Maintenance items for vehicles
James Meek Dan Davis Pete Mitchell Dahlia Tympanick Allyson Yarra
Monitoring Project-specific supplies and equipment as needed
Shervon DeLeon Dan Davis Purchasing Procurement of all field, lab and safety equipment and supplies

MassDEP-DWM Program QAPP (2020-2024) CN # 520.1 October, 2020 Page 119
Connecticut Watershed

MassDEP-DWM Program QAPP (2020-2024) CN # 520.1 October, 2020 Page 120
B9 NON-DIRECT MEASUREMENTS & USE OF SECONDARY DATA
Given the inherent limitations of any monitoring program, use of reliable, quality-controlled data from external sources has become an integral part of DWM-WPP’s decision-making. Both in planning its own data collection work and evaluating other’s available data, DWM-WPP assembles data and information from a wide variety of sources. In cases where there are no recent DWM-WPP data available, decisions regarding waterbody health can be based solely on external (non-WPP), non-direct or secondary data submitted to MassDEP (by regulation, request or voluntarily), as well as gathered by MassDEP (e.g., data mining) with permission to use as appropriate. Because DWM-WPP has limited control over the QA planning and implementation for outside monitoring activities, the degree to which QAPPs, SOPs and other QA/QC measures are in place varies from project to project. This makes it especially critical that data quality is assessed prior to use of external data. Based on current procedures in place to request, receive and review submitted data, DWM-WPP strives to verify the accuracy and evaluate the quality of all external data submitted and found. Although DWM-WPP’s use of secondary data is combined with its own primary data, the uses are generally consistent with EPA-New England guidance for projects using only secondary data (USEPA; http://www.epa.gov/region1/lab/qa/pdfs/EPANESecondaryDataGuidance.pdf). B9.1 Sources of Information
Potential sources of secondary data that meet DMW-WPP’s needs include, but are not limited to, monitoring data reports from federal, state and municipal programs, various non-governmental organizations (NGO), grant-funded (CWA §314, 319, 104, or 604(b)) projects and volunteer monitoring organizations. The following partial list provides some of the possible sources of information for DWM’s watershed assessment, TMDL and other work. See also Table. Federal Agencies U.S. Environmental Protection Agency (EPA) National Estuaries Program (NEP) U.S. Fish and Wildlife Service (USFWS) U.S. Army Corps of Engineers (ACOE) National Oceanographic and Atmospheric Administration (NOAA) U.S. Geological Survey (USGS) Natural Resources Conservation Service (NRCS) National Ecological Observatory Network (NEON)
State Agencies
NOTE FOR SECTION B9: See also annual project-specific Sampling & Analysis Plans (SAPS) in Appendix G and in the annual QAPP addenda.

MassDEP-DWM Program QAPP (2020-2024) CN # 520.1 October, 2020 Page 121
Department of Environmental Protection - Drinking Water Program Department of Environmental Protection - Wetlands and Waterways Program Department of Environmental Protection - Watershed Permitting Program Massachusetts Office of Coastal Zone Management (CZM) Massachusetts Department of Conservation and Recreation (DCR) Massachusetts Department of Fish and Game (DFG) Massachusetts Division of Marine Fisheries (DMF) Massachusetts Division of Ecological Restoration (DER) Massachusetts Department of Public Health (DPH) Massachusetts Water Resources Authority (MWRA) Massachusetts Office of Geographic and Environmental Information (MassGIS)
Municipalities Municipal Conservation Commissions (non-point source assessment) Municipal and Industrial NPDES Permit Monitoring Requirements (including service
contracts for toxicity testing) Public drinking water system testing
Private Consulting Firms Misc. project data
Academic and Research Colleges, universities and other academic/research institutions Scientific/engineering literature, including conference and symposium papers
Volunteer Monitoring Organizations Watershed associations Lake & Pond associations Citizen monitoring groups
B9.2 Types of Non-Direct Data
The types of secondary data gathered by DWM-WPP for potential use vary widely depending on the source (chemical, biological, ecological, regulatory, etc.). These may include: measured surface water quality/quantity data hydrologic and water quality model output measured pollutant loads literature values and data historical environmental data permit records (e.g., DMRs) geographic information system data beach and shellfish bed closure records measured fish tissue contaminants sediment quality data, and weather records.
The form these data take can be electronic (e.g., internet, database reports, spreadsheets, etc.) or paper (e.g., in published reports, scientific literature, etc.).

MassDEP-DWM Program QAPP (2020-2024) CN # 520.1 October, 2020 Page 122
B9.3 Data Quality Evaluation for Secondary Data
DWM-WPP’s current process for requesting, receiving and reviewing external data is outlined here: https://www.mass.gov/guides/external-data-submittals-to-the-watershed-planning-program. As of July 2020, DWM-WPP is in the process of filling a dedicated staff position to coordinate DWM-WPP’s handling of external data, including coordination and support for external groups, data assessment and management, and integration of external data into DWM-WPP’s assessment process. The following describes DWM-WPP’s current external data handling process. DWM-WPP categorizes external data into 3 general levels, which are related to the monitoring objectives (i.e., why the data was collected):
1. Educational/Stewardship-level 2. Screening level, and 3. Regulatory/Assessment level.
While extremely important, data collected primarily for educational and/or stewardship purposes (level 1) generally does not meet the rigor (i.e., accuracy, precision, frequency, comparability, overall confidence, etc.) required for use in making water quality assessment decisions or in developing TMDLs. Although this type of data can be submitted, it is unlikely the data will be used for §305(b) or §303(d)-related decision making. Screening-level data (level 2) are also very important and welcome, but generally fail to meet one or more DWM-WPP criteria required for direct use in water quality assessments or TMDLs. Level 2 data may meet the data quality objectives in the submitter's Quality Assurance Project Plan (QAPP), but not those in the DWM-WPP's monitoring program QAPP approved by USEPA. Level 2 data may be used to direct future DWM-WPP sampling efforts and as supporting evidence. Level 3 assessment-level data have been deemed by MassDEP, based on the DWM-WPP's external data review procedures, to be directly usable for §305(b) and §303(d) decision-making. These data are considered scientifically sound and legally defensible, and are typically the result of extensive planning, attention to detail, relatively stringent data quality objectives, training, standard field and lab procedures, metadata collection, project organization, and data verification. Contingent upon DWM-WPP staff review and approval, these data can help determine if a waterbody is meeting water quality standards or is impaired. All external data submitted electronically are reviewed using a consistent procedure. Use of DWM-WPP's data submittal template is the preferred format for external data submittals. Once data are received by DWM-WPP, a standard data review spreadsheet is used to facilitate and document the review. NOTE: QAPP approval, submittal of the data integrity statement and/or data submittal does not guarantee that the associated data will be used by the DWM-WPP. In order for data to be used by DWM-WPP, certain quality criteria must be met. A preliminary review of the data involves an evaluation based on the following three main criteria.

MassDEP-DWM Program QAPP (2020-2024) CN # 520.1 October, 2020 Page 123
1) Monitoring is performed consistent with an acceptable Quality Assurance Project Plan including acceptable standard operating procedures;
2) Data resulted from use of an acceptable, preferably state-certified lab (certified for the applicable analyses) that has a documented, acceptable laboratory Quality Assurance Plan (QAP) and Standard Operating Procedures (SOPs); and
3) Results include documented QA/QC data Failure to meet any of these basic criteria (i.e., no QAPP, questionable analytics or poor QC documentation) seriously undermines confidence in the secondary data. Lack of attention to QA/QC may result in non-use of the data by DWM-WPP, without any further review. If one or more of the basic criteria are not met, the decision to do additional review is made on a case-by-case basis. Preferred characteristics of external data submittals, based on additional review, include: Clarity, organization, detail, completeness and accuracy of the raw and/or analyzed data
(including fieldsheets, notebook pages, QC analyses, spreadsheet data, etc.) Estimates of overall precision of field duplicates/replicates compared to project DQOs
contained in the QAPP for the secondary data, Estimates of accuracy of lab analyses, using field blank data, raw bench sheets, Quality
Control/Performance Evaluation (QC/PE) samples, spiked sample matrices, and positive/negative controls (for bacteria samples), as compared to project DQOs,
Clear signs of QAPP implementation (i.e., documentation of actual QC measures to ensure data quality, such as the frequency of instrument calibration and maintenance, problem identification and response, and personnel training),
Evaluation of field audit information (if available), Assessment of holding time violations, Assessment of the frequency of field QC sampling (vs. QAPP), Availability of side-by-side and/or inter-laboratory QC audit information, if available, to
assess inter-group and/or inter-lab precision (if available), Opportunities for personal communication with project lead(s) and/or QC officer(s), if
needed, to address questions (such as, were sample data representative of a waterbody at a specific location?),
Appropriate and accurate data analyses, Method consistency among project participants and over time throughout the duration of
the project, Availability of completed Chain-of-Custody (COC) forms.
Data usability determinations can be analyte-specific (e.g., phosphorus data is OK, but do not use chlorophyll a data), time-specific (e.g., do not use data prior to their SOP being in place or training taking place) or location-specific (e.g., do not use data from Station X due to non-representativeness). A standard external data review form is used for all DWM-WPP reviews. One or more DWM-WPP staff conducts these reviews. The data usability assessment begins with assembling all available information from the submittal, which may include data reports, data files, QC information, email, etc. For information deemed missing, the contact for the external data group is contacted to see if the information is available and can be sent. The initial preliminary review

MassDEP-DWM Program QAPP (2020-2024) CN # 520.1 October, 2020 Page 124
determines if the recommended pre-requisites, as identified above, were met. Submitted data are stored in the appropriate DEP-network location. The subsequent detailed review involves reviewing the data in more detail, specifically looking at the following, when and if available, and as appropriate: Analytical holding time violations Frequency of QC samples (blank and duplicates) taken for each survey, and compare to
QAPP Field blank sample results to verify lack of contamination Field duplicate sample results to verify acceptable precision Laboratory records (lab notebooks, lab bench sheets, if available) for potential effects on
data quality, including multi-probe calibration books for potential effects on data quality Quality control results contained in laboratory data reports for potential implications to
data quality (based on lab accuracy and precision data), and lab analytical performance during survey period based on results of any QC/PE testing
Miscellaneous documentation (training records, e-mails, phone records, pers. comms., etc.) to highlight any potential problems affecting data quality
Overall quality of other data, as available (e.g., benthic macroinvertebrates, fish toxics, other “biological” data)
Raw data fieldsheets (and field notebook(s) data, if available) for accuracy and consistency with other survey data, especially with regard to station location
Raw data Chain-of-Custodies (COCs) for accuracy and potential problems Communication with data providers regarding data completeness, missing information and other questions takes place as necessary. In many cases, additional information is requested by DWM-WPP from the data provider to help finalize the review. It may also be necessary to postpone decisions regarding the usability of certain external data, pending submittal of additional information, for lack of staff resources to adequately review the data, or for other reason(s). Based on the review (and any follow-up), conclusions regarding the usability of the data, as a whole and/or by components, are documented on the data review form, and become the basis for DWM-WPP’s use or non-use of the submitted data. Data are categorized as Level 1, 2 or 3. Some or all of the data deemed to be Level 3 (potentially suitable for use in waterbody assessments) can be accepted, accepted with caveat/qualification and/or not used, depending on the circumstances. Submitted data may be accepted, accepted with caveat/qualification or rejected. While DWM-WPP may use acceptable secondary data in decision-making, DWM-WPP does not formally manage any secondary data in its primary data repository or databases and does not transmit any secondary data to EPA’s WQX. When appropriate, however, DWM-WPP recommends the use of the WQX to external monitoring groups, as a mechanism to upload their quality-controlled, final data to EPA.

MassDEP-DWM Program QAPP (2020-2024) CN # 520.1 October, 2020 Page 125
Table 23: Potential Secondary Data Providers to DWM-WPP
(subject to availability, as agency monitoring programs and group projects can vary from year to year)
Data Source
Surface WATERBODY TYPES
Sample Data Parameters*
Sampling DESIGN
Geographic Area of Activity
WEB data LINKS**, 2020 (subject to availability and change)
Massachusetts Department of Public Health (MA DPH)
Marine beaches Indicator bacteria Fixed Coastal areas
http://mass.digitalhealthdepartment.com/public_21/index.cfm “Beaches Bill” database
MA DPH (in coordination with MassDEP)
Freshwater beaches
Cyanobacterial toxins and algal counts
Targeted Statewide ---
MA DPH (in coordination with MassDEP-DWM, DFG, DMF and ORS) - Freshwater and marine fish advisories - Selected project data
Lakes & ponds Rivers
Metals, toxins (in fish tissue) Sediment quality Water quality
Targeted Statewide https://eohhs.ehs.state.ma.us/DPH_FishAdvisory/Default.aspx program-specific databases (ORS)
Massachusetts Department of Conservation and Recreation (DCR) - cooperatively with USGS
Weather Streamflow (general)
Precipitation Drought status (varies by program)
Fixed and variable
Varies by program
https://www.mass.gov/service-details/current-drought-status https://www.mass.gov/dcr-monthly-water-conditions
MA DCR Lakes and ponds
Secchi depth Nutrients Chlorophyll a Bacteria Non-native plants
Targeted Statewide https://www.mass.gov/lakes-and-ponds-program
MA DCR - cooperatively with Massachusetts Water Resources Authority
Drinking-water protection
Nutrients alkalinity, hardness bacteria/ pathogens macroinvertebrates
Fixed site
Quabbin Reservoir, Ware River, and Wachusett Reservoir watersheds
https://www.mass.gov/service-details/dcr-watershed-water-quality-reports
MA DCR Public beaches Bacteria Fixed site Statewide
https://www.mass.gov/service-details/dcr-watershed-water-quality-reports
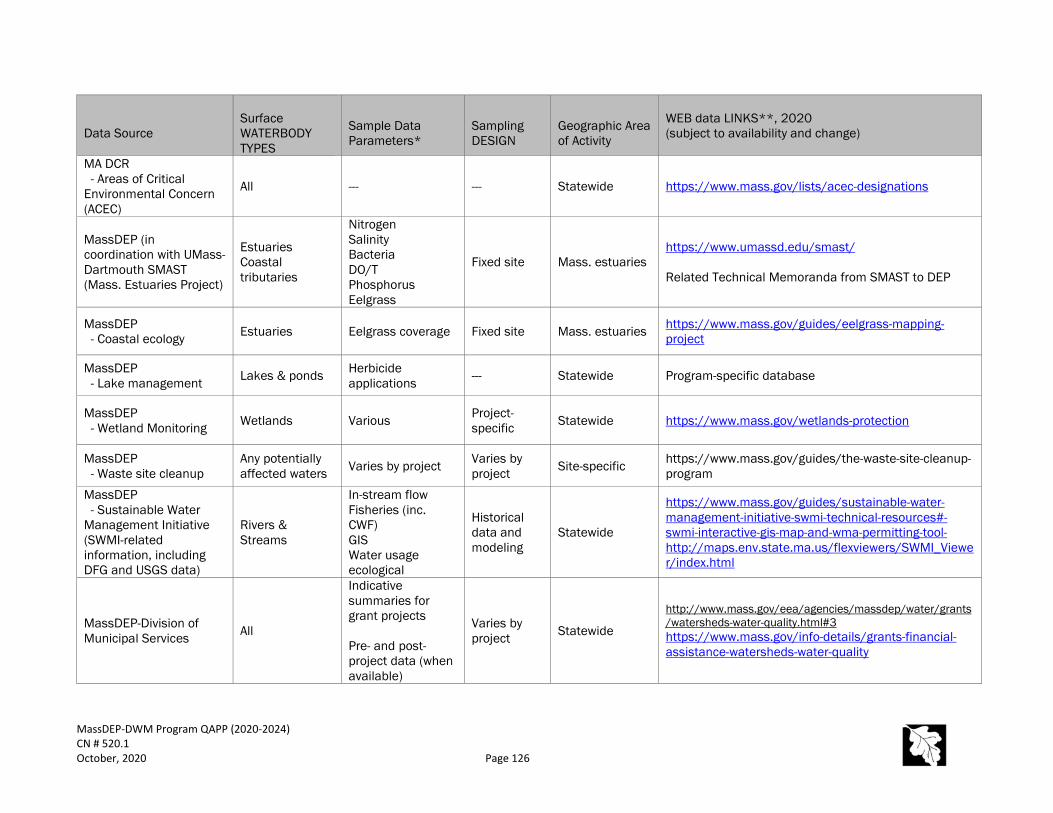
MassDEP-DWM Program QAPP (2020-2024) CN # 520.1 October, 2020 Page 126
Data Source
Surface WATERBODY TYPES
Sample Data Parameters*
Sampling DESIGN
Geographic Area of Activity
WEB data LINKS**, 2020 (subject to availability and change)
MA DCR - Areas of Critical Environmental Concern (ACEC)
All --- --- Statewide https://www.mass.gov/lists/acec-designations
MassDEP (in coordination with UMass-Dartmouth SMAST (Mass. Estuaries Project)
Estuaries Coastal tributaries
Nitrogen Salinity Bacteria DO/T Phosphorus Eelgrass
Fixed site Mass. estuaries https://www.umassd.edu/smast/ Related Technical Memoranda from SMAST to DEP
MassDEP - Coastal ecology Estuaries Eelgrass coverage Fixed site Mass. estuaries https://www.mass.gov/guides/eelgrass-mapping-
project
MassDEP - Lake management Lakes & ponds Herbicide
applications --- Statewide Program-specific database
MassDEP - Wetland Monitoring Wetlands Various Project-
specific Statewide https://www.mass.gov/wetlands-protection
MassDEP - Waste site cleanup
Any potentially affected waters Varies by project Varies by
project Site-specific https://www.mass.gov/guides/the-waste-site-cleanup-program
MassDEP - Sustainable Water Management Initiative (SWMI-related information, including DFG and USGS data)
Rivers & Streams
In-stream flow Fisheries (inc. CWF) GIS Water usage ecological
Historical data and modeling
Statewide
https://www.mass.gov/guides/sustainable-water-management-initiative-swmi-technical-resources#-swmi-interactive-gis-map-and-wma-permitting-tool- http://maps.env.state.ma.us/flexviewers/SWMI_Viewer/index.html
MassDEP-Division of Municipal Services All
Indicative summaries for grant projects Pre- and post-project data (when available)
Varies by project Statewide
http://www.mass.gov/eea/agencies/massdep/water/grants/watersheds-water-quality.html#3 https://www.mass.gov/info-details/grants-financial-assistance-watersheds-water-quality

MassDEP-DWM Program QAPP (2020-2024) CN # 520.1 October, 2020 Page 127
Data Source
Surface WATERBODY TYPES
Sample Data Parameters*
Sampling DESIGN
Geographic Area of Activity
WEB data LINKS**, 2020 (subject to availability and change)
Department of Fish and Game (DFG) - Fisheries and Wildlife
Lakes & ponds Rivers & streams
Fish populations Target fish community Bathymetry Trout-stocked waters Coldwater fisheries
Targeted Statewide
https://www.mass.gov/orgs/division-of-fisheries-and-wildlife Freshwater sampling database (data sharing)
MA. DFG - Marine Fisheries
Marine shellfishing areas, rivers & streams
Saxitoxin (in tissue) Fish passage Dissolved oxygen temperature bacteria Fish counts and restoration data
Fixed site Coastal areas
https://www.mass.gov/orgs/division-of-marine-fisheries https://www.mass.gov/service-details/marine-fisheries-technical-reports https://www.mass.gov/service-details/diadromous-fisheries-project Shellfish classification areas and fish passage barriers (data sharing)
MA. DFG - Division of Ecological Restoration
Rivers & streams Wetlands Salt marshes Lakes & ponds
Streamflow Temperature Habitat Macroinvertebrates Aesthetics Dam removal
Targeted Varies by project
https://www.mass.gov/orgs/division-of-ecological-restoration https://eeaonline.eea.state.ma.us/DFG/RIFLS/#/home
Massachusetts Office of Coastal Zone Management (MA. CZM) - Coastal Water Quality - grant projects
Coastal streams and wetlands
Dissolved oxygen pH nutrients salinity macroinvertebrates invasive species
Fixed site Coastal areas
https://www.mass.gov/coastal-water-quality-program https://www.mass.gov/marine-invasive-species-program https://www.mass.gov/service-details/czm-coastal-habitat-publications
Massachusetts Office of Geographic and Environmental Information (MassGIS)
All Multiple layers --- Statewide https://docs.digital.mass.gov/dataset/massgis-data-layers
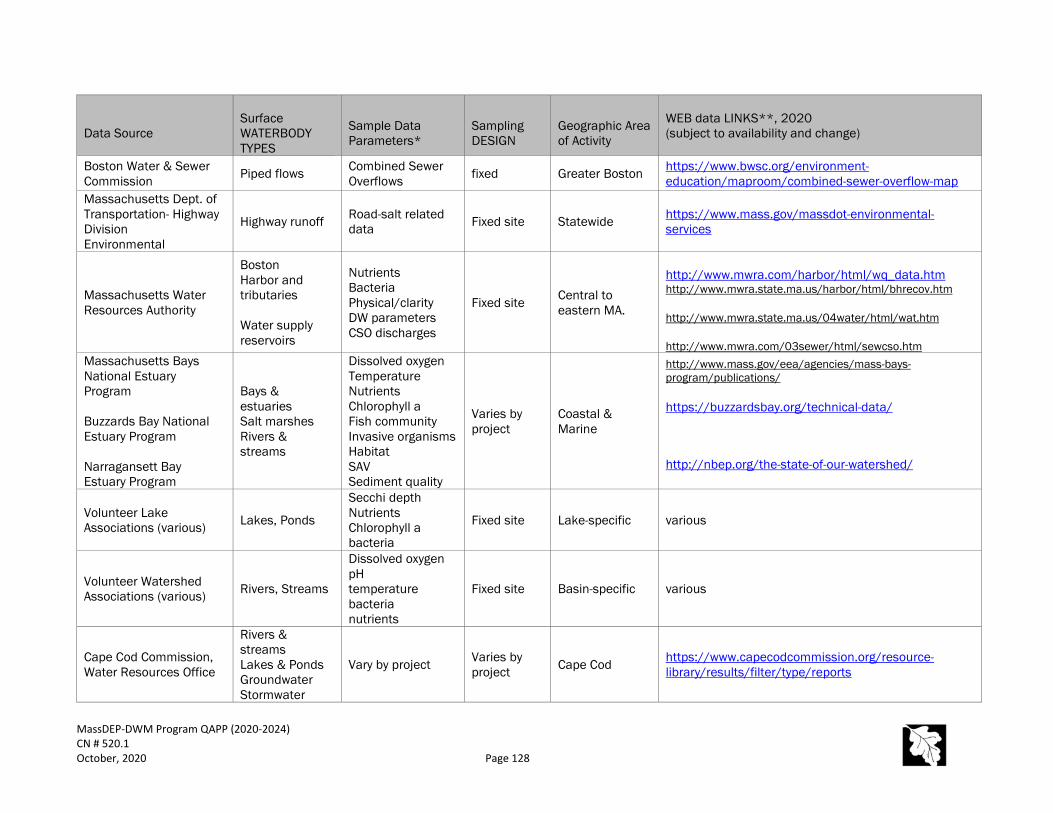
MassDEP-DWM Program QAPP (2020-2024) CN # 520.1 October, 2020 Page 128
Data Source
Surface WATERBODY TYPES
Sample Data Parameters*
Sampling DESIGN
Geographic Area of Activity
WEB data LINKS**, 2020 (subject to availability and change)
Boston Water & Sewer Commission Piped flows Combined Sewer
Overflows fixed Greater Boston https://www.bwsc.org/environment-education/maproom/combined-sewer-overflow-map
Massachusetts Dept. of Transportation- Highway Division Environmental
Highway runoff Road-salt related data Fixed site Statewide https://www.mass.gov/massdot-environmental-
services
Massachusetts Water Resources Authority
Boston Harbor and tributaries Water supply reservoirs
Nutrients Bacteria Physical/clarity DW parameters CSO discharges
Fixed site Central to eastern MA.
http://www.mwra.com/harbor/html/wq_data.htm http://www.mwra.state.ma.us/harbor/html/bhrecov.htm http://www.mwra.state.ma.us/04water/html/wat.htm http://www.mwra.com/03sewer/html/sewcso.htm
Massachusetts Bays National Estuary Program Buzzards Bay National Estuary Program Narragansett Bay Estuary Program
Bays & estuaries Salt marshes Rivers & streams
Dissolved oxygen Temperature Nutrients Chlorophyll a Fish community Invasive organisms Habitat SAV Sediment quality
Varies by project
Coastal & Marine
http://www.mass.gov/eea/agencies/mass-bays-program/publications/ https://buzzardsbay.org/technical-data/ http://nbep.org/the-state-of-our-watershed/
Volunteer Lake Associations (various) Lakes, Ponds
Secchi depth Nutrients Chlorophyll a bacteria
Fixed site Lake-specific various
Volunteer Watershed Associations (various) Rivers, Streams
Dissolved oxygen pH temperature bacteria nutrients
Fixed site Basin-specific various
Cape Cod Commission, Water Resources Office
Rivers & streams Lakes & Ponds Groundwater Stormwater
Vary by project Varies by project Cape Cod https://www.capecodcommission.org/resource-
library/results/filter/type/reports

MassDEP-DWM Program QAPP (2020-2024) CN # 520.1 October, 2020 Page 129
Data Source
Surface WATERBODY TYPES
Sample Data Parameters*
Sampling DESIGN
Geographic Area of Activity
WEB data LINKS**, 2020 (subject to availability and change)
US Army Corps of Engineers, NE District Reservoirs Varies by project Varies by
project Project-based
http://www.nae.usace.army.mil/ http://www.nae.usace.army.mil/Missions/ProjectsTopics.aspx
National Oceanographic and Atmospheric Administration (NOAA) - National Climatic Data Center (NCDC) - National Weather Service
--- Weather parameters Precipitation
Fixed Statewide
https://w2.weather.gov/climate/ https://www.weather.gov/box/
United States Geological Survey (USGS)
Rivers & streams Reservoirs Impoundments Lakes & Ponds
Streamflow Precipitation Water quality Historical data
Fixed site and variable Varies by project
https://www.usgs.gov/centers/new-england-water lhttps://maps.waterdata.usgs.gov/mapper/nwisquery.html?URL=https://waterdata.usgs.gov/ma/nwis/current?type=flow&group_key=basin_cd&format=sitefile_output&sitefile_output_format=xml&column_name=agency_cd&column_name=site_no&column_name=station_nm&column_name=site_tp_cd&column_name=dec_lat_va&column_name=dec_long_va&column_name=agency_use_cd https://waterdata.usgs.gov/ma/nwis/rt https://www.usgs.gov/mission-areas/water-resources/science/streamstats-streamflow-statistics-and-spatial-analysis-tools?qt-science_center_objects=0# https://www.usgs.gov/mission-areas/water-resources/science/national-water-quality-assessment-nawqa?qt-science_center_objects=0#
USEPA National Pollutant Discharge Elimination System (NPDES) (Mass is non-delegated as of 2015)
Lakes & ponds Rivers & streams Bays and estuaries (associated with discharges)
Required parameters for permitted discharges Also, Discharge Monitoring Report
Fixed Permittee-based locations and regional (MS4)
https://icis.epa.gov/icis/jsp/common/LoginBody.jsp;jsessionid=2DbTKyvQ2ZPl3X1m3KlpJShDh2zKhkQJvy1JrQQ11BNQGqsRwQlg!-1628596325 (password required) https://echo.epa.gov/tools/data-downloads/icis-npdes-dmr-and-limit-data-set
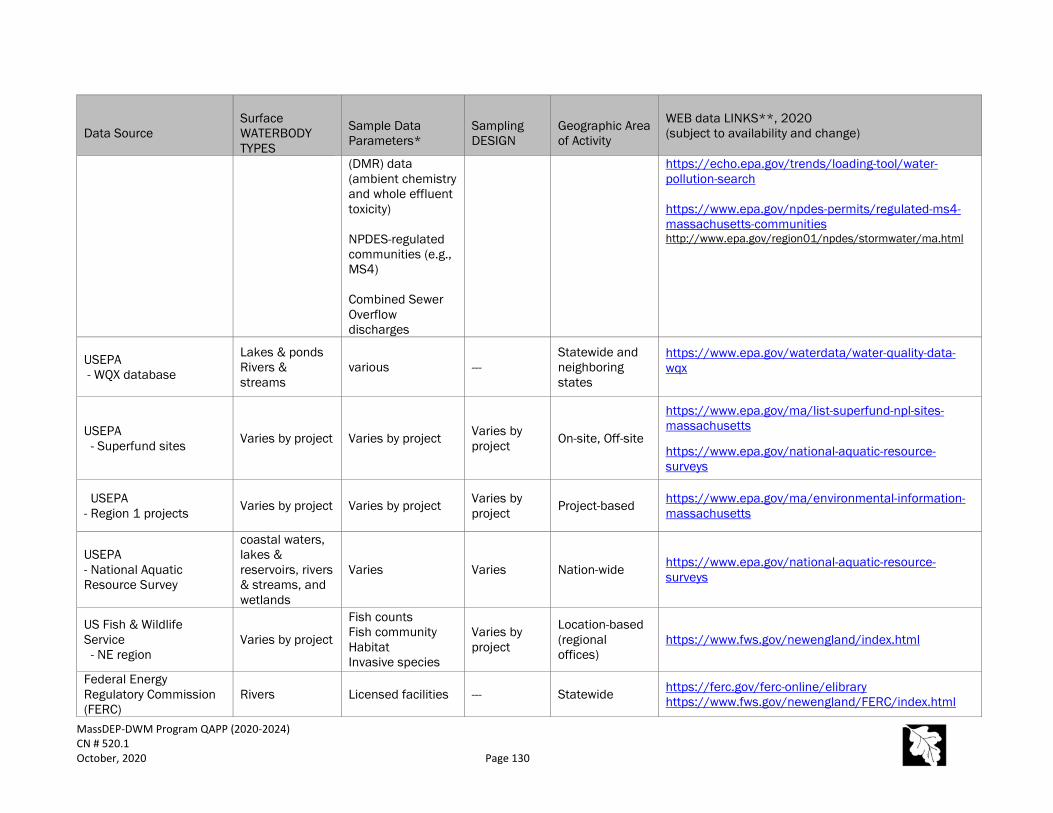
MassDEP-DWM Program QAPP (2020-2024) CN # 520.1 October, 2020 Page 130
Data Source
Surface WATERBODY TYPES
Sample Data Parameters*
Sampling DESIGN
Geographic Area of Activity
WEB data LINKS**, 2020 (subject to availability and change)
(DMR) data (ambient chemistry and whole effluent toxicity) NPDES-regulated communities (e.g., MS4) Combined Sewer Overflow discharges
https://echo.epa.gov/trends/loading-tool/water-pollution-search https://www.epa.gov/npdes-permits/regulated-ms4-massachusetts-communities http://www.epa.gov/region01/npdes/stormwater/ma.html
USEPA - WQX database
Lakes & ponds Rivers & streams
various --- Statewide and neighboring states
https://www.epa.gov/waterdata/water-quality-data-wqx
USEPA - Superfund sites Varies by project Varies by project Varies by
project On-site, Off-site
https://www.epa.gov/ma/list-superfund-npl-sites-massachusetts https://www.epa.gov/national-aquatic-resource-surveys
USEPA - Region 1 projects Varies by project Varies by project Varies by
project Project-based https://www.epa.gov/ma/environmental-information-massachusetts
USEPA - National Aquatic Resource Survey
coastal waters, lakes & reservoirs, rivers & streams, and wetlands
Varies Varies Nation-wide https://www.epa.gov/national-aquatic-resource-surveys
US Fish & Wildlife Service - NE region
Varies by project
Fish counts Fish community Habitat Invasive species
Varies by project
Location-based (regional offices)
https://www.fws.gov/newengland/index.html
Federal Energy Regulatory Commission (FERC)
Rivers Licensed facilities --- Statewide https://ferc.gov/ferc-online/elibrary https://www.fws.gov/newengland/FERC/index.html

MassDEP-DWM Program QAPP (2020-2024) CN # 520.1 October, 2020 Page 131
Data Source
Surface WATERBODY TYPES
Sample Data Parameters*
Sampling DESIGN
Geographic Area of Activity
WEB data LINKS**, 2020 (subject to availability and change)
Bordering states with cross-border segment data (NY, VT, NH, CT and RI)
Rivers Lakes Varies by State Varies by
project State-shared watersheds
http://www.dem.ri.gov/pubs/data.htm http://www.vtwaterquality.org/wqd_mgtplan/waterq_data.htm http://des.nh.gov/organization/divisions/water/wmb/swqa/ http://www.ct.gov/deep/cwp/view.asp?a=2719&q=325616&deepNav_GID=1654 http://www.dec.ny.gov/chemical/8459.html
New England Interstate Water Pollution Control Commission (NEIWPCC)
Varies by project Varies by project Varies by project Project-based https://neiwpcc.org/
Misc. Projects (academic, contractor services, other)
Varies by project Varies by project: Varies by project Project-based ---
* Actual parameters sampled for can vary from year-to-year and from project-to-project for many groups. “Nutrients” can include total phosphorus, dissolved reactive P, total reactive P,
total dissolved P, total nitrogen, ammonia-nitrogen, nitrate+nitrite-nitrogen, dissolved organic N, etc. ** These are general links, some of which contain data. DWM-WPP typically contacts individual staff to receive data files electronically.

MassDEP-DWM Program QAPP (2020-2024) CN # 520.1 October, 2020 Page 132
Blackstone Watershed

MassDEP-DWM Program QAPP (2020-2024) CN # 520.1 October, 2020 Page 133
B10 DATA MANAGEMENT
In coordination with project-level staff, DWM-WPP’s data management team facilitates the storage of raw field data, lab data, and associated metadata in both hard copy and electronic formats, performs validation and verification procedures to finalize all data, and provides mechanisms for staff and outside groups to access these data. Only DWM-WPP-collected sample data are formally managed in DWM-WPP databases. This includes sample data collected by DWM-WPP and analyzed by external lab contractors. Regional bacteria source tracking (BST) data, however, are managed differently due to the unique nature of this type of monitoring activity. Unless otherwise specified, only BST data based on multiple station visits (“base stations”) are entered into the DWM-WPP database (single site visit data are not entered). Data not collected by DWM-WPP staff (including DEP project data) are considered “secondary data” and are reviewed for usability as described in Section B9. B10.1 Data Management Protocols Table 24: DWM-WPP Data Management SOPs
Control Number SOP
CN 0.40 WPP lab data reporting
CN 0.42 EDD template and definitions
CN 0.44 Lab data elements
CN 0.6 Station definition
CN 0.83b Data Use Guidelines
CN 56.15, 56.4, 56.5, 56.61, 56.9 Data Validation
CN xxx.x Data Management using DWM-WPP’s EQuIS Database - in development
B10.2 DWM-WPP Databases
Environmental databases currently in use by DWM-WPP include: Earthsoft EQuIS, a commercial off-the-shelf data management system, configured for DWM-WPP
historical and current data Data warehouse (1994-2004 data) Data warehouse (2005-2018 data) Benthic macroinvertebrate database (MABenthos) (1983 – 2020 data) Assessment unit database (SegDef) Station Georeferences ATTAINS assessment/listing reporting (via EPA application) Toxicity Testing Data (ToxTD) for NPDES permittees’ WET data External Database warehouse (EDB) for external data

MassDEP-DWM Program QAPP (2020-2024) CN # 520.1 October, 2020 Page 134
Earthsoft EQuIS: DWM-WPP continues work to improve its electronic data management systems and to implement measures for reporting and distributing water monitoring data and information to multiple end users in government, the private sector and the general public. To that end, in 2015, DWM-WPP procured a commercially available, off-the-shelf water data storage and retrieval system (EQuIS) that is capable of managing data from multiple water monitoring program elements and facilitates the transfer of DWM-WPP data and information to EPA’s Water Quality Exchange (WQX). The migration of historical water quality data (1994 – 2014) from DWM-WPP warehouses into the new EQuIS database structure was finalized in March 2019. Data collected between 2015 and 2019 will be migrated to EQuIS in the fall/winter of 2020. Field data collection using EQuIS-EDGE (electronic tablets in the field) for data collection is planned for rollout in 2021. Data Warehouses: For internal staff use, two separate data warehouses exist for DWM-WPP water quality data and will continue to be used until staff access to EQuIS is fully implemented. These warehouses have been used to import or migrate water quality data into the new DWM-WPP data management system. Biological data from separate databases for benthic macroinvertebrate data and fish community data will be migrated into the new EQuIS database starting in 2021. MABenthos: The benthic macroinvertebrate database (MAbenthos) contains tables, queries, forms, and reports used to store and analyze years of stream, river, pond, and lake biomonitoring data across the state of Massachusetts. The database was created in Microsoft Access and contains data collected from 1983 until present. Assessment Unit Database: SegDef is an Access database storing information on Assessment Units (segments) for multiple §305(b) Assessment cycles. Exports from SegDef can be joined with georeferenced segment shapefiles in ArcGIS. Station Georeferencing: DWM-WPP’s georeferencing system for all historical and current sampling stations (water quality and biological) includes station descriptions, unique IDs, GPS coordinates, and GIS reference tables and shape files. Station water body names are based on MassDEP’s inventory coding systems (SARIS - Stream and River Inventory System; PALIS - Pond and Lake Inventory System; and CAMIS - Coastal and Marine Inventory System). The ArcGIS Shapefile of stations and station descriptions is available through MassGIS at https://docs.digital.mass.gov/dataset/massgis-data-massdep-water-quality-monitoring-stations. ATTAINS: DWM-WPP uses EPA’s Assessment, Total Maximum Daily Load (TMDL) Tracking and Implementation System (ATTAINS) to track statewide water quality assessment data, including use attainment, and causes and sources of impairment. The ATTAINS database (replacing ADB) (https://attains.epa.gov/attains/login) is designed to: Improve the quality and consistency of water quality reporting Reduce the burden of preparing reports under Sections 305(b), 303(d), 314, and 319 of the Clean
Water Act (CWA) Improve water quality data analysis
ToxTD: DWM-WPP’s toxicity database (ToxTD) is a MS Access database containing acute and chronic whole effluent toxicity (WET) testing and associated chemistry data submitted by permittees as required by their National Pollutant Discharge Elimination System (NPDES) permits. The facilities are required to submit reports to DEP monthly, quarterly, biannually, or annually based on the permit requirements.

MassDEP-DWM Program QAPP (2020-2024) CN # 520.1 October, 2020 Page 135
DWM-WPP staff review the reports, fill the relevant data into coding sheets, and enter these data into the ToxTD database. These external, secondary data assist in making waterbody assessment decisions. There are no plans to migrate these secondary ToxTD data to DWM-WPP’s main database system or WQX, because these data sets are not collected or “owned” by DWM-WPP. B10.3 Data Entry Processes
All completed DWM-WPP field sheets, and COC forms are scanned by field staff, filed with the data management staff for preliminary review and hard copy filing. Any field notebook page(s) are scanned and added to the final hard copy file. All hardcopy files are stored at the Worcester office; electronic files and scans are stored in DWM-WPP’s computer system and backed up as part of the system-wide backups In 2021 DWM-WPP will be implementing the use of EQuIS Data Gathering Engine (EDGE) software running on ruggedized field tablets to collect field data previously collected on field sheets. Field data collected will be uploaded directly to DWM-WPP’s EQuIS water quality database. For the first field season or until data collection using the tablets is full field tested, field data will continue to be collected on field sheets as backup. Paper field sheets are scanned to create an electronic backup record. EDGE software has been customized to collect the same information previously collected on Fieldsheet. The data management group has primary responsibility for fieldsheet data entry and electronic data file transmission. While the Principle Investigators (PIs) are responsible for ensuring the completeness and quality of field data prior to data entry, the data entry staff work closely with the PIs on any discrepancies found on the fieldsheets. Incomplete and/or erroneous field-recorded data and information will be brought to the attention of the appropriate field crew, coordinator and/or person(s). Most of the data contained on the fieldsheets is entered into the DWM-WPP database. Data entry is followed by data entry QC, where all entered data are checked against the original data and metadata by a 2nd DWM-WPP staff person. Laboratory quality-controlled data from WES are available for download via the WES Laboratory Information Management System (WinLIMS) as soon as data are finalized. Lab data from contract labs and DWM-WPP’s labs are also provided to the QC Analyst and Database Manager using standard Electronic Data Deliverable (EDD) templates. Entered field and lab data/metadata are processed using DWM-WPP’s data validation procedures, and are eventually finalized following completion of the validation steps. See Section D1 for more specific information on DWM-WPP’s data validation methodology.

MassDEP-DWM Program QAPP (2020-2024) CN # 520.1 October, 2020 Page 136
Housatonic Watershed
MassDEP-DWM Program QAPP (2020-2024) CN # 520.1 October, 2020 Page 137
SECTION C: ASSESSMENT AND OVERSIGHT
C1 CORRECTIVE ACTIONS
Recognizing MassDEP’s commitment to continual improvement and the common QA theme of “Plan-Do-Check-Act”, DWM-WPP takes corrective actions when necessary based on a graded approach. Problems encountered that have a direct and meaningful effect on data quality are dealt with using formal corrective action forms and communications. Less important issues are resolved on a case-by-case basis using more informal methods (e.g., email clarification). C1.1 Field-Related Evaluation and Correction
Review of field activities related to data integrity and safety is the joint responsibility of the Survey Coordinator for each project, DWM-WPP’s Monitoring Coordinator, the Field & Lab Operations Coordinator and the QA Analyst. Although infrequently done due to staffing limitations, DWM-WPP’s field audit process calls for the QA Analyst to accompany survey crews to evaluate adherence to the applicable SOPs and the program QAPP by crews and individual crew members. These field audits attempt to evaluate at least one survey per watershed and, ideally, each survey crew member a minimum of one time. DWM-WPP sampling staff in need of performance improvements may be directed to re-read the relevant standard operating procedure and/or may be re-trained. If errors in sampling techniques are consistently identified, mandatory re-training will be scheduled. When necessary, Root Cause Analyses (RCA) are conducted to determine the primary causal factors that led to an incident and to develop corrective actions. RCAs are performed by the Field & Lab Operation Coordinator. C1.2 Lab-Related Evaluation and Correction
DWM-WPP’s QA Analyst has the primary responsibility to ensure that data from laboratories are consistently of known, documented and usable quality. This is done mainly by reviewing lab reports for errors, inconsistencies and poor QC results, but also via frequent communication with lab staff. Ideally, the need for corrective action can be communicated in a timely fashion to avoid future problems and/or data censoring. For all labs used, the QA Analyst works with each lab to avoid misunderstandings early on. This includes visits to contract labs to discuss method and logistical specifics. In addition, external, single- and double-blind laboratory audits using quantitative QC check samples are typically initiated by DWM-WPP for nutrients (TP, NH3-N, TN, NO3-NO2), bacteria and metals. DWM-WPP also performs self-audits for Colilert® bacteria analysis using semi-quantitative PE samples (E. coli within a defined range). Assessment of laboratory performance is mainly the responsibility of individual labs used (e.g., WES) prior to data transmittal. Lab audits are conducted by the Field & Lab Operation Coordinator and/or QA Analyst.

MassDEP-DWM Program QAPP (2020-2024) CN # 520.1 October, 2020 Page 138
C1.3 Database-Related Evaluation and Correction
DWM-WPP’s Database Manager is responsible for ensuring that housed data are secure, organized, accessible and free from systematic error. The need for corrective actions concerning the database system is attenuated somewhat by the “built-in” QA inherent in database development and maintenance (e.g., locked computer code, redundancy checks, etc.). Nevertheless, issues can arise that require resolution. Database-related issues and problems can be brought to the attention of the Database Manager by any staff, but the corrective actions needed to resolve problems are handled by the DWM-WPP data management group. Corrective actions take place as soon as possible and can include: Changes to database to correct for transcription errors, based on data entry QC Changes to VB code Changes to import files based on new or updated information, such as WinLIMS data corrections
and updates C1.4 Incident and Corrective Action Forms
Incident Forms are available for use for reporting issues related to safety or data quality. RCAs or Corrective Action Forms can be used for further documentation and for recommended improvements. These forms can also be used for all field and laboratory deviations and deficiencies that cannot be handled immediately. Refer to DWM’s Corrective Action Procedures SOP (CN 5.0) for more information.

MassDEP-DWM Program QAPP (2020-2024) CN # 520.1 October, 2020 Page 139
Shawsheen Watershed

MassDEP-DWM Program QAPP (2020-2024) CN # 520.1 October, 2020 Page 140
C2 REPORTING
C2.1 Program-Level Quality Assurance
Annual quality assurance self-assessments are generated by BRP and DWM-WPP (and other MassDEP Bureaus) to evaluate compliance with MassDEP’s current Quality Management Plan (QMP). The self-assessments are provided to EPA Region 1. C2.2 Internal and On-Line Data Reporting
As data are finalized, final data are made available to staff using MS Excel spreadsheets and MS Access by project. The internal data warehouse includes standard statistical calculations. As DWM-WPP’s EQuIS database is fully implemented, data will be made available to staff through EQuIS. DWM-WPP water quality data are made available to the public via the MassDEP website (https://www.mass.gov/guides/water-quality-monitoring-program-data#-data-files). The following dataset types are available to the public: Water quality laboratory data: water quality data generated via laboratory analysis; collected at
monitoring stations throughout the Commonwealth. Water quality attended probe data: discrete probe data for parameters such as dissolved oxygen,
temperature, pH, and specific conductance. Water quality continuous probe statistical summaries by deployment: statistical summaries of the
unattended, continuously-logged data (e.g., averages, maximums, minimums, etc.). Water quality continuous probe statistical summaries by station: summary water quality
information based on multiple deployments at each individual station in a given data year. Water quality continuous probe data (available upon request): water quality readings from
continuous probes deployed for durations from a few days to several months at individual stations. Most deployments include data collected every 30 minutes.
Biological data (available upon request): These data are collected to assess aquatic life communities, including benthic macroinvertebrates, fish and periphyton.
Mount Hope Bay marine buoy continuous probe data: water quality readings from continuous probes deployed at two location in Mount Hope Bay.
C2.3 DWM-WPP Technical Memoranda
Using final data, DWM-WPP staff develop project-specific Technical Memoranda summarizing findings. These reports are made available internally, as well posted to DEP’s web site (https://www.mass.gov/guides/water-quality-technical-memoranda). C2.4 EPA Database Reporting
Once data are finalized, data are exported to EPA’s STORET Water Quality Exchange (WQX) network (https://www.epa.gov/waterdata/water-quality-data-wqx). DWM-WPP’s goal for assembling, validating and finalizing laboratory, instrument and biological data is within 6-9 months of data collection. The frequency of water quality data transmittals to WQX may vary from once per year to several times per year, depending on the availability of final data.

MassDEP-DWM Program QAPP (2020-2024) CN # 520.1 October, 2020 Page 141
DWM-WPP also employs the ATTAINS to track water quality assessment decisions, including causes and sources of impairment (https://www.exchangenetwork.net/data-exchange/assessment-tmdl-tracking-and-implementation-system/). C2.5 Integrated List
On a biennial basis, DWM-WPP generates an Integrated List of Waters (ILW) that combines reporting elements required by CWA §305(b) and §303(d). The ILW report presents the individual categories of Massachusetts’ waters for the current CWA listing cycle. Each waterbody or segment is listed in one of the following five categories: Category 1: Unimpaired and not threatened for all designated uses Category 2: Attaining some uses and not assessed for others Category 3: No uses assessed (insufficient information to make assessments for any uses) Category 4a: TMDL is completed Category 4b: Impairment controlled by alternative pollution control requirements Category 4c: Impairment not caused by a Pollutant - TMDL not required Category 5: Impaired or threatened for one or more uses and requiring a TMDL The latest version of the Integrated List can be found on the MassDEP web page: https://www.mass.gov/lists/integrated-lists-of-waters-related-reports. C2.6 Water Quality Assessments
Results of monitoring efforts, combined with all other reliable information, constitute the basis for making water quality assessments. The Consolidated Assessment and Listing Methodology (CALM) guidance document contains MassDEP’s reasoning and justification for site-specific designated use decisions. The 2018 CALM is here: https://www.mass.gov/files/documents/2018/05/07/2018calm.pdf. Use-attainment determinations are made for each waterbody segment for which adequate data and information are available. (Many waters remain not assessed for one or more uses in any given assessment cycle and many small and/or unnamed streams and ponds have never been monitored and assessed). Results of DEP water quality assessments are available at: https://www.mass.gov/lists/water-quality-assessment-reports-blackstone-through-islands-watersheds and https://www.mass.gov/lists/water-quality-assessment-reports-merrimack-through-weymouth-weir-watersheds. C2.7 TMDLs
Section 303(d) of the Clean Water Act and the EPA's Water Quality Planning and Management Regulations (40 CFR Part 130) require states to develop Total Maximum Daily Loads (TMDLs) for waterbodies that are not meeting designated uses under technology-based controls. The TMDL process establishes the maximum allowable loading of pollutants that a waterbody can receive and still meet the SWQS established for protecting public health and maintaining the designated beneficial uses of those waters. TMDL analyses are based on available data and information and documented in TMDL reports. Final reports are posted at: https://www.mass.gov/lists/total-maximum-daily-loads-by-watershed. C2.8 TMDL Modeling Reports
As described in DWM-WPP’s TMDL Modeling QAPP (Appendix A), selection and use of models will be thoroughly documented in Modeling Reports.

MassDEP-DWM Program QAPP (2020-2024) CN # 520.1 October, 2020 Page 142
Chicopee Watershed

MassDEP-DWM Program QAPP (2020-2024) CN # 520.1 October, 2020 Page 143
SECTION D: DATA VALIDATION AND USEABILITY
D1 DATA REVIEW AND VALIDATION
DWM-WPP uses standardized procedures for managing, reviewing and validating primary water quality data. These procedures are contained in the following SOPs (Appendix E): CN 56.15 Data Validation Summary for Attended, Unattended, and Laboratory Data CN 56.4 Data Validation_Attended data CN 56.5 Data Validation_Unattended data CN 56.61 Data Validation_Laboratory data CN 56.9 Data Validation Overview (including biological data)
NOTE: The review and validation of DWM-WPP biological data (e.g., aquatic macroinvertebrates, fish toxics, fish populations) are done in accordance with the stand-alone QAPPs and SOPs for those programs (available in compressed files accompanying this QAPP). Review of secondary data sources (gathered by others) for usability is described in Section B9.3. D1.1 “QC Status” Levels for DWM-WPP Data
The following categories of “data readiness” are used at DWM-WPP, as it relates to the use and transmission of draft and final data. All DWM-WPP data are categorized into five levels, depending on and reflecting the status of review and validation (finalization). The preferred QC Status levels for use and/or release of DWM-WPP data are QC Status 4 (final) and QC Status 5 (final, published). Although not recommended, all levels (QC1-5) can be shared with others if requested (e.g. for Freedom of Information Act purposes) with the appropriate disclaimers based on the QC status of the data. QC Status 1: Raw data. Generally not suitable for use or transmission, but can be transmitted to other parties upon request provided data are sent as “DRAFT” with standard disclaimers. QC Status 2: Draft data that has been entered into the appropriate DWM-WPP electronic system or database and for which data entry QC has taken place. This stage is for technical QC review. QC Status 3: Draft data for which technical QA/QC review (e.g. QC sample results, outlier identification, comparison to project QAPP DQOs, etc.) has taken place. This stage is for project-level review. QC Status 4: Final Data. This level of data reflects project-level review by appropriate staff for reasonableness, completeness and acceptability. These data can be freely used and cited in documents without caution or caveat (reviewed and approved by all appropriate DWM-WPP staff). The following guidelines pertain to receipt and use of QC Status 4 data: When using, analyzing, presenting or transmitting QC4 data, do not make any changes affecting
CONTENT, including symbols and qualifiers used, censoring decisions, etc. When presenting data, provide KEY to symbols and qualifiers used. See final data file “READ ME” sheets for additional information.

MassDEP-DWM Program QAPP (2020-2024) CN # 520.1 October, 2020 Page 144
QC Status 5: Final data in a published, citable report. The QC Status 4 guidelines stated above apply to the data contained in a report. QC4-level data have been reviewed and approved by all appropriate DWM-WPP staff. D1.2 DWM-WPP Final Data Qualifiers
Standard data symbols are used to denote specific problems or issues for final datum. These are applied to both qualified and censored data to provide data users with additional information. General Symbols (applicable to all data types): “ ## ” = Censored data (i.e., data that has been discarded for some reason; check qualifier symbol for cause(s)). “ ** ” = Missing data (i.e., data that should have been reported, but were not for any reason other than no water). “ -- ” = No data (i.e., data not collected nor intended) “ ^^ ” = No water (i.e., a special case of missing data due to dry/no water conditions) “ <MRL” = Less than method reporting limit (MRL). Denotes a sample result that went undetected using a specific analytical method, or was detected but the result is less than the allowable reporting limit. The actual, numeric MRL is specified (e.g. <0.2). Probe-specific Qualifiers: “ i ” = inaccurate readings from probe likely; may be due to:
• significant pre-survey calibration problems or lacking pre-calibration/check • post-survey checks outside typical acceptance ranges at post-field calibration checks • lack of calibration of the depth sensor prior to use or negative depth readings • checks against laboratory analyses • water temperatures < 0.1˚C (likely iced conditions) • to qualify anomalous points in continuous data likely to be caused by instrument problems
“ m ” = method not followed; one or more protocols contained in the probe SOP not followed, i.e. operator error (eg. less than 3 readings per station (rivers) or per depth (lakes), or instrument failure not allowing method to be implemented. “ s ” = field sheet recorded data were used to accept data (i.e., not data electronically recorded in a data logger or in cases where data logging is not possible (e.g., single-probes)). “ u ” = unstable readings, due to lack of sufficient equilibration time prior to final readings, non-representative location, highly-variable water quality conditions, etc. See Section 4.1 for acceptance criteria. Also used to indicate instability in deployed/continuous readings. “ c ” = unit not calibrated for a particular parameter and/or greater than calibration standard used for pre-calibration, or outside the acceptable range about the calibration standard. Typically used for
MassDEP-DWM Program QAPP (2020-2024) CN # 520.1 October, 2020 Page 145
conductivity (>718, 1,413, 2,760, 6,668 or 12,900 uS/cm) or turbidity (>10, 20 or 40 NTU). It can also be used for TDS and Salinity calculations based on qualified (“c”) conductivity data, or that the calculation was not possible due to censored conductivity data ( TDS and Salinity are calculated values and entirely based on conductivity reading). “ r ” = data may not be representative due to circumstances and/or conditions at the time of sampling; used to indicate unrepresentative conditions (e.g. probe out of water, backwatered by beaver dam, probe buried, probe iced in) in continuous readings. “ t ” = tidal influence likely (not indicative of freshwater flow) Lab Sample-Specific Qualifiers: “ a ” = accuracy as estimated at WES Lab via matrix spikes, PT sample recoveries, internal check standards and lab-fortified blanks did not meet project data quality objectives for program or QAPP. “ b ” = blank contamination in lab reagent blanks and/or field blank samples (indicating possible bias high and false positives). “ d ” = precision of field duplicates (as RPD) did not meet project data quality objectives identified for program or in QAPP. Batched samples may also be affected. “ e ” = not theoretically possible. Specifically, used for bacteria data where colonies per unit volume for e-coli bacteria > fecal coliform bacteria, for lake Secchi and station depth data where a specific Secchi depth is greater than the reported station depth, and for other incongruous or conflicting results. “ f ” = frequency of QC duplicates did not meet data quality objectives for program or QAPP. “ h ” = holding time violation (usually indicating possible bias low) “ j ” = ‘estimated’ value; can be used for lab-related issues where certain lab QC criteria are not met and re-testing is not possible (as identified by the WES lab only). Also used to report sample data where the sample concentration is less than the ‘reporting’ limit or RDL and greater than the method detection limit or MDL (MDL < x < RDL). Also used to note where values have been reported at levels less than the MDL. Also used for estimated ranges based on known metadata. “ m ” = method SOP not followed, only partially implemented or not implemented at all, due to complications with sample matrix (e.g. sediment in sample, floc formation), lab error (eg. cross-contamination between samples), additional steps taken by the lab to deal with matrix complications, lost/unanalyzed samples, use of expired reagents and missing data. “ p ” = samples not preserved per SOP or analytical method requirements. “ r ” = data may not be representative due to circumstances and/or conditions at the time of sampling, including the possibility of “outlier” data. “ t ” = tidal influence likely (not indicative of freshwater flow)

MassDEP-DWM Program QAPP (2020-2024) CN # 520.1 October, 2020 Page 146
Nashua Watershed

MassDEP-DWM Program QAPP (2020-2024) CN # 520.1 October, 2020 Page 147
D2 DATA VALIDATION METHODOLOGY
D2.1 Validation Process Overview
Water quality data generated by DWM-WPP can be deemed suspect or erroneous based on a variety of issues that affect data quality, such as analytical holding time exceedances, poor accuracy and precision, non-representativeness, missing and/or incorrect information, tidal influence, inadherence to field/lab methods, sample mix-ups, stability of probe readings, outliers or unreasonable data, field blank contamination, lack of QC information to evaluate data quality, and other sources of human and mechanical error. DWM-WPP’s validation approach attempts to systematically accept, qualify or censor data using semi-automated procedures with built-in error-checking, as follows. D2.2 Fieldsheet Metadata
Definitive electronic files containing all entered metadata from DWM-WPP’s paper fieldsheets undergo 100% data entry proofing. These electronic fieldsheet files are used, in combination with data files, to generating final data files. As changes to the e-fieldsheet file are required during the validation process, the files are revised following consensus of at least two QA/database staff persons. All changes to the definitive year-based e-fieldsheet record are documented by email to QC/database staff. D2.3 Laboratory Data
Laboratory data is validated in a series of automated and manual steps. For each data year, an MS Excel file is compiled from the complete laboratory results including: WinLIMS extract from the WES lab, and from Electronic Data Deliverable (EDD) files from DWM-WPP, SERO, and contract labs. Initial processing and preliminary “QC2” validation are done using Visual Basic (VB) scripts and EXCEL macros to efficiently manage the large datasets: Lab sample IDs are linked to OWMIDs (DWM-WPP’s sample identifiers). Station location information is added to the file using the common data element of "Unique ID"
(DWM-WPP’s station identifiers). Field duplicate accuracy, field blank contamination, hold times, and QC sample frequency are
checked against DQOs. Standard DWM-WPP reporting rules (e.g., rounding and significant figures) are applied.
The automated QC2-level validation is then checked manually and additional checks are conducted using additional information and best professional judgment. Output files are read-only and the data sheet protected. Following the "technical QC" review (QC2), designated staff are asked to review the draft final data files as part of QC3 review. This project-level review involves additional checks for completeness, obvious outliers, incongruities, other errors. Once any required edits from the QC3 review were made, the data status became QC4 (FINAL) followed by QC5 (Published). D2.4 Attended Data
Attended probe data is also validated in a series of automated and manual steps. YSI and Hydrolab multiprobe data files are downloaded from the instrument loggers on a regular basis during the field season and stored in limited-access folders. Data files are processed in YEAR sets. Each file is manually pre-processed to select the "best line" from blocks of data (3 to 5-minute duration, 30 sec. apart to ensure a stable record at each site). During pre-processing, each parameter is assessed for stability and "u" (unstable) qualifiers applied as appropriate. All the "best lines" are assembled and linked to electronic

MassDEP-DWM Program QAPP (2020-2024) CN # 520.1 October, 2020 Page 148
field sheet metadata records. Processing is done via Visual Basic (VB) script to efficiently manage the large datasets: Identify and correct errors (such as missing or inaccurate IDs, date/time errors, duplicate IDs,
etc.). Apply additional qualifiers (such as lab QC issues). Incorporated in-situ temperature QC measurements (needed to assess temperature-only unattended
data records) from a separate file. Standard DWM-WPP reporting rules are applied. Location information is joined based on current station registration records.
The automated QC2-level validation is then checked manually and additional checks are conducted using additional information and best professional judgment. File output is an EXCEL, "flat file" type. Output files are read-only and the data sheet protected. Following the "technical QC" review (QC2), "QC3 review" project-level review is performed by selected staff to look for potential problems missed in QC2 review. Once any required edits from the QC3 review are made, the data status became QC4 (FINAL) followed by QC5 (Published). D2.5 Unattended Data
Unattended probe data are validated in a series of automated and manual steps. Multiprobe and temperature logger data files data files are downloaded on a regular basis during the field season and stored in limited-access folders. Data files are processed in YEAR sets. Each file is pre-processed to link to electronic field sheet metadata records. Using Visual Basic (VB) code: Files are trimmed for start/end times and Run automated QC checks to identify and correct errors Apply data qualifiers based on standard QC criteria. Standard reporting rules are applied. Location information included based on most current station registration records. Produce automated statistics and charts summarizing each data file.
The automated QC2-level validation is then checked manually and additional checks are conducted using additional information and best professional judgment. Overall, the validation process for unattended data is applied to both censor suspect data with justifiable cause (i.e., data are probably erroneous), and to censor or qualify unpredictable data without reasonable cause (i.e., data may be real). File output is an EXCEL, "flat file" type. Each file contains a "read me" tab, data, a daily statistics sheet, a summary statistics sheet, and data graphs. The automated statistics and charts are provided to staff for convenience, and to provide accurate, quality-controlled and consistent output for the more common statistical measures for DO, conductivity, and temperature. Output files are read-only and the data sheet protected. Following the "technical QC" review (QC2), "QC3 review" is performed by selected staff to look for potential problems missed in QC2 review. Once any required edits from the QC3 review were made, the data status become QC4 (FINAL) followed by QC5 (Published). D2.6 Benthic Macroinvertebrate Data
Benthic macroinvertebrate samples are collected by DWM-WPP to assess aquatic habitat. Samples are sorted, enumerated and identified to appropriate taxonomic level(s). Data are finalized as described in the benthic program QAPP (Appendix A, CN 226) by biologist’s evaluation of the results of quality control sampling and expert confirmation of split samples and voucher specimens, and best professional

MassDEP-DWM Program QAPP (2020-2024) CN # 520.1 October, 2020 Page 149
judgement. Final data (meeting defined data quality objectives) are used in a metrics-based scoring system. Results are typically presented in Tech Memos. D2.7 Fish Population Data
Using electroshocking techniques, fish samples are also collected by DWM-WPP to assess aquatic habitat. Live samples are enumerated and identified to species level. Data are finalized as described in the fish population program QAPP (Appendix A, CN 096.0) by biologist’s best professional judgement with regard to factors affecting survey data quality, such as survey efficacy (e.g., catch per unit effort) and accuracy of identifications. Final data meeting defined data quality objectives are used to evaluate the health of the fish community in relation to reference and/or expected conditions. Results are typically presented in Tech Memos. D2.8 Benthic Algae
Periphyton (AKA benthic attached algae) samples are collected by DWM-WPP to assess aquatic habitat and impacts due to excess nutrients. In-situ measurements are taken and samples are collected for identification, density and chlorophyll a content. Biological data are finalized by biologist’s best professional judgement with respect to accuracy of identifications, adherence to SOPs and other factors potentially affecting data quality. Laboratory-based chlorophyll-a data are validated as described above in Section D2.3. Final data meeting defined data quality objectives are used to evaluate the waterbody health in relation to reference conditions, and are typically presented using Tech Memos.

MassDEP-DWM Program QAPP (2020-2024) CN # 520.1 October, 2020 Page 150
Buzzards Bay Watershed

MassDEP-DWM Program QAPP (2020-2024) CN # 520.1 October, 2020 Page 151
D3 DATA USABILITY
Data of known and documented quality (i.e. “QC Status 4” and “5”) can be used without caveat for analysis, decision making and reporting (as described in Section C2). The extent to which data are determined to be useful is an on-going in-house evaluation based on cumulative confidence (and uncertainty) in the data, data conclusiveness and results of QC and data analyses. If certain data do not meet the program Data Quality Objectives (DQO’s), data may be censored, qualified or left as draft subject to further review. Any limitations on data use will be detailed in both interim and final reports. Final monitoring data are used in project-specific technical memoranda, which include summary quality control evaluations. These memoranda support determinations made as part of the watershed assessment and TMDL development processes. The successfulness of DWM-WPP monitoring is evaluated on a continuous basis. Data for each project are evaluated with regard to both programmatic and project-specific objectives. Final data are used to answer important questions related to the current health of surface waters in the Commonwealth and to the potential for improvements in environmental quality.

MassDEP-DWM Program QAPP (2020-2024) CN # 520.1 October, 2020 Page 152
SELECTED BIBLIOGRAPHY:
NOTE: Only selected references to specific SOPs from EPA, USGS, Standard Methods and MassDEP (WES laboratory and DWM field/laboratory) are included here. Alliance for Coastal Technologies 2004. Technology Evaluations Reports for DO Sensors (including YSI Inc. rapid pulse DO sensor, ACT VS04-04, December 2004) http://www.act-us.info/evaluation_reports.php Alliance for Coastal Technologies 2005. Protocols for Verifying the Performance of In-situ Chlorophyll Fluorometers, ACT PV05-01, April 2005) APHA/AWWA/WEF 2005. Standard Methods for the Examination of Water and Wastewater, 21st Edition, American Public Health Association, American Water Works Association and Water Environment Federation, Washington. http://www.standardmethods.org/ ASTM 2005. Standard Test Methods for Dissolved Oxygen in Water, ASTM D888-05, American Society for Testing and Materials International, August 2005 Barbour, M., Gerritsen, J, Synder, B. D. and J. B. Stribling 1999. Rapid Bioassessment Protocols for Use in Streams and Wadeable Rivers: Periphyton, Benthic Macroinvertebrates and Fish, 2nd edition. EPA 841-B-99-002. U.S. Environmental Protection Agency, Office of Water, Washington, D.C. Bernhard, A.E. and Field, K.G. 2000. A PCR assay to discriminate human and ruminant feces on the basis of host differences in Bacteroides-Prevotella genes encoding 16S rRNA. Appl. Environ. Microbiol. 66(10): 4571-4574. Biggs, B. and Kilroy, C. 2000. Stream Periphyton Monitoring Manual, prepared for the New Zealand Ministry of the Environment. Canadian Council of Ministers of the Environment 1999. Canadian Sediment Quality Guidelines for the Protection of Aquatic Life, Winnipeg, Canada. CRC 2001. Evaluation of Analytical Methods for Detection and Quantification of Cyanotoxins in Relation to Australian Drinking Water Guidelines. Cooperative Research Centre for Water Quality and Treatment, Australia. Duerring, Connors and Tamul. 2004. Bacteria Source Tracking Pilot Study Summary Report. Massachusetts DEP, Division of Watershed Management. Worcester, MA. Durant, et al. 2007. Long-Term Fate of a Pulse Arsenic Input to a Eutrophic Lake. Environmental Science & Technology/ Vol 41, NO. 9, 2007. Gurley Precision Instruments Inc., on-line http://www.gpi-hydro.com/meters.htm HACH 2005. DR 2800 Spectrophotometer User Manual, ed. 1, Sept. 2005. Hach Company. HACH 2003. Water Analysis Handbook, 4th Edition, Rev. 2. Hach Company. Helrich, K., ed. 1990. Organochlorine Pesticide and Polychlorinated Biphenyl Residues in Fish, Gas Chromatographic Method, Method 983.21. In Association with Official Analytical Chemists (AOAC) Official Methods of Analysis, 15th ed., AOAC, Arlington, VA. Hydrolab 2006. User Manual for Hydrolab DS5X, DS5, and MS5 Water Quality Multiprobes, February 2006, Edition 3.
MassDEP-DWM Program QAPP (2020-2024) CN # 520.1 October, 2020 Page 153
Ingersoll, C.G. and MacDonald, D. D. 2001. A Guidance Manual to Support the Assessment of Contaminated Sediments in Freshwater, Estuarine, and Marine Ecosystems: Volume 3 – Interpretation of the Results of Sediment Quality Investigations. ISO 2004. Environmental Management Systems – Specification with Guidance for Use. ISO 14001. International Organization for Standardization, 2004 ISO 2001. Information and Documentation---Records Management, ISO15489-1. International Organization for Standardization, September, 2001. ISO 2001. Quality Management Principles (on-line) http://www.iso.org/iso/qmp.htm ISO 1999. Water quality - Determination of Turbidity. International Organization for Standardization, ISO 7027 Jessup, B. and Stamp, J. 2019. Development of Indices of Biotic Integrity for Assessing Macroinvertebrate Assemblages in Massachusetts Freshwater Wadeable Streams. June 2019. Tetra Tech, Inc. Montpelier, VT. Kummerer K. (Ed.) 2004. Pharmaceuticals in the Environment-Sources, Fate, Effects and Risks MacDonald, D.D., C.G. Ingersoll and T.A. Berger 2000. Development and Evaluation of Consensus-Based Quality Guidelines for Freshwater Ecosystems. Environmental Contamination and Toxicology, 36, 20-31. MassBays and MassDEP 2020. Massachusetts Coastal Condition Assessment Quality Assurance Project Plan for the Massachusetts Probabilistic Monitoring and Assessment Program (MAP2), Coastal Waters. Massachusetts Bays National Estuary Partnership and Massachusetts Department of Environmental Protection, (CN pending), May, 2020 MassDEP 1982 (original, with subsequent updates). Massachusetts Stream Classification Program: Part I, Inventory of Rivers and Streams (SARIS), July, 1982 MassDEP 1984 (original, with subsequent updates). Compilation of Lakes, Ponds, Reservoirs and Impoundments Relative to the Massachusetts Lake Classification Program (PALIS), August, 1984 MassDEP 2004. A Water Quality Monitoring Strategy for the Commonwealth of Massachusetts. CN 203.0 Massachusetts Department of Environmental Protection, Division of Watershed Management. Worcester, MA. MassDEP 2013. Massachusetts Surface Water Quality Standards. Massachusetts Department of Environmental Protection. https://www.mass.gov/doc/314-cmr-400-surface-water-quality-standards/download MassDEP 2008a. Water Resource Attribute Tracking System (WRATS) Technical Specification Document Version 1.0, July 11, 2008; prepared by Stellar Corporation, Lexington, MA. MassDEP 2016. Massachusetts Year 2016 Integrated List of Waters. Final Listing of the Condition of Massachusetts’ Waters Pursuant to Sections 303(d) and 305(b) of the Clean Water Act, December, 2019. CN 470.1 https://www.mass.gov/lists/integrated-lists-of-waters-related-reports MassDEP 2019. Laboratory Quality Assurance Plan, MassDEP, Division of Environmental Laboratory Sciences, William X. Wall Experiment Station (WES); Rev. 7.0, February 2019. MassDEP 2009. Quality Management Plan for Federally Funded Programs, April 2009.

MassDEP-DWM Program QAPP (2020-2024) CN # 520.1 October, 2020 Page 154
MassDEP 2017. A Strategy for Monitoring and Assessing the Quality of Massachusetts’ Waters to Support Multiple Water Resource Management Objectives. 2016-2025. CN 203.5. Massachusetts Department of Environmental Protection, Division of Watershed Management, Watershed Planning Program, Worcester, MA. https://www.mass.gov/doc/water-quality-monitoring-strategy-2016-2025/ MDPH 2007. MDPH Guidelines for Cyanobacteria in Freshwater Recreational Waterbodies in Massachusetts. Massachusetts Dept. of Public Health, Boston. http://www.mass.gov/Eeohhs2/docs/dph/environmental/exposure/protocol_cyanobacteria.pdf MassGIS. Multiple digital data layers and map production via comprehensive, statewide database of spatial information for environmental planning and management; National Rivers Authority 1990. Toxic Blue Green Algae. Water Quality Series No. 2, September 1990 NEMI online. National Environmental Methods Index. https://www.nemi.gov/apex/f?p=237:1:3881193867520989 NOAA 1999. NOAA Screening Quick Reference Tables. Coastal Protection and Restoration Division. (National Oceanic and Atmospheric Administration) NOAA HAZMAT Report No. 99-1. Seattle, WA. Northeast Regional Mercury TMDL 2007. Multi-state (New England, New York) TMDL, in coordination with NEIWPCC, October, 2007. http://www.mass.gov/dep/water/resources/mertmdl.pdf Patton and Kryskalla 2003. Methods of Analysis by the U.S. Geological Survey National Water Quality Laboratory—Evaluation of Alkaline Persulfate Digestion as an Alternative to Kjeldahl Digestion for Determination of Total and Dissolved Nitrogen and Phosphorus in Water, WRIR 03-4174 (nitrogen and phosphorus, total whole water, I-4650-03) Persaud, D., R. Jaagumagi and A. Hayton 1993. Guidelines for the protection and management of aquatic sediment quality in Ontario. Water Resources Branch, Ontario Ministry of the Environment. Queens’ Printer for Ontario, Canada Pitt, R. et. Al. 2004. Source Verification of Inappropriate Discharges to Storm Drainage Systems, WEFTEC Sept., 2004 Poiger, T., Field, J.A., Field, T.M., and Giger, W. 1996. Occurrence of fluorescent whitening agents in sewage and river water determined by solid-phase extraction and high-performance liquid chromatography. Environ. Sci. Technol. 30:2220-2226. RIDEM 2020. Quality Assurance Project Plan, Narragansett Bay Fixed-Site Monitoring Network. Rhode Island Department of Environmental Management. January 17, 2020. Scott, T. M., Jenkins, T.M., Lukasik, J., and Rose, J.B. 2005. Potential use of a host associated molecular marker in Enterococcus faecium as an index of human fecal pollution. Env. Sci. Technol. 39(1): 283-287. Selker, et. al. 2006. Distributed Fiber Optic Temperature Sensing for Hydrologic Systems. Water Resources Research 42, W12202. Sontek 2002. FlowTracker Handheld ADV Technical Documentation. Sontek/YSI Stockholm County Council 2009. Environmentally Classified Pharmaceuticals. Swoffer 2002. Model 3000 Flow Meter Operating Instructions, Swoffer Instruments, Seattle, WA.

MassDEP-DWM Program QAPP (2020-2024) CN # 520.1 October, 2020 Page 155
Tang, et. al. 2005. Validation of a Potential Human Fecal Pollution Marker Based on a Putative Virulence factor (ESP Gene) in Enterococcus faecium and its Application to the Assessment of the Charles River and Boston Harbor Beaches, Massachusetts. USEPA 2015. Framework for Defining and Documenting Natural Conditions for Development of Site-Specific Natural Background Water Quality Criteria for Temperature, Dissolved Oxygen, and pH to protect Aquatic Life Uses: Interim Document. (Natural Conditions Framework), EPA 820-R-15-001. February, 2015. http://water.epa.gov/scitech/swguidance/standards/library/upload/natural_conditions_framework.pdf USEPA 2009a. QAPP Guidance for Environmental Projects Using Only Existing (Secondary) Data, Rev. #2, 10/13/09, EPA-Region 1, QA Unit http://www.epa.gov/region1/lab/qa/pdfs/EPANESecondaryDataGuidance.pdf USEPA 2009b. Guidance on the Development, Evaluation and Application of Environmental Models, Council for Regulatory Environmental Modeling (EPA/100/k-09/003), March, 2009; www.epa.gov/crem USEPA 2008a. EPA Quality Program Policy, CIO 2106.0, 10/20/08. http://www.epa.gov/irmpoli8/policies/21060.pdf USEPA 2008b. EPA Guidance on Environmental Data Verification and Data Validation (QA/G-8, EPA/240/R-02/004; November, 2002 and reissued January, 2008) http://www.epa.gov/quality1/qs-docs/g8-final.pdf USEPA 2008c. Critical Technical Elements of a Bioassessment Program. Barbour, M.T., and C. O. Yoder. USEPA, Office of Water, Washington, DC. (August 2008). USEPA 2007a. Guidance for Standard Operating Procedures (QA/G-6, EPA/600/B-07/001; April 2007) http://www.epa.gov/quality1/qs-docs/g6-final.pdf USEPA 2007b. Generic Modeling Quality Assurance Project Plan Template, June, 2007. http://www.epa.gov/region1/lab/qa/qamodeling.html USEPA 2007c. Method 1694: Pharmaceuticals and Personal Care Products in Water, Soil, Sediment and Biosolids by HPLC/MS/MS, EPA-821-R-08-008, Washington, D.C. USEPA 2007d. Method 1698: Steroids and Hormones in Water, Soil, Sediment, and Biosolids by HRGC/HRMS: USEPA, Washington, DC, EPA-821-R-08-003 USEPA 2007e. Method 1699: Pesticides in water, soil, sediment, biosolids, and tissue by HRGC/HRMS: USEPA, Washington, DC, EPA-821-R-08-001 USEPA 2006a. Data Quality Assessment: A Reviewer’s Guide (QA/G-9R, EPA/240/B-06/002; February, 2006) http://www.epa.gov/quality1/qs-docs/g9r-final.pdf USEPA 2006b. EPA Requirements for QA Project Plans, QA/R-5. (QA/R-5; EPA/240/B-01/003, March 2001 and reissued May, 2006) http://www.epa.gov/quality1/qs-docs/r5-final.pdf USEPA 2006c. Guidance on Technical Audits and Related Assessments for Environmental Data Operations (QA/G-7, EPA/600/R-99/080; January, 2000 and reissued May 2006) http://www.epa.gov/quality1/qs-docs/g7-final.pdf USEPA 2006d. Guidance on Systematic Planning using the Data Quality Objectives Process (QA/G-4; EPA/240/B-06/001, February 2006) http://www.epa.gov/quality1/qs-docs/g4-final.pdf
MassDEP-DWM Program QAPP (2020-2024) CN # 520.1 October, 2020 Page 156
USEPA 2006e. Memorandum regarding recommendation for interim approval of ASTM International standard test method D888-05, from William Telliard, Office of Water, Washington D.C., January 3, 2006 USEPA 2006f. Memorandum regarding recommendation on use of HACH Method 10360, Rev. 1.1, January, 2006 for Luminescence Measurement of Dissolved Oxygen in Water and Wastewater, from Robin Oshiro, Ph.D., Office of Water Engineering and Analytical Support Branch, Washington D.C., July 26, 2006 USEPA 2003. Elements of a State Water Monitoring and Assessment Program. EPA 841-B-03-003. Assessment and Watershed Protection Division, Office of Wetlands, Oceans and Watersheds, US Environmental Protection Agency, Washington, D.C. USEPA 2002a. Guidance for Quality Assurance Project Plans (QA/G-5; EPA/240/R-02/009, December 2002) http://www.epa.gov/quality1/qs-docs/g5-final.pdf USEPA 2002b. Guidance on Choosing a Sampling Design for Environmental Data Collection (QA/G-5S, EPA/240/R-02/005; December, 2002) http://www.epa.gov/quality1/qs-docs/g5s-final.pdf USEPA 2002c. Guidance on Quality Assurance Project Plans for Modeling (QA/G-5M, EPA/240/R-02/007; December, 2002) http://www.epa.gov/quality/qs-docs/g5m-final.pdf USEPA 2002d. Consolidated Assessment and Listing Methodology. Toward a Compendium of Best Practices. Office of Wetlands, Oceans and Watersheds, US Environmental Protection Agency, Washington, D.C. USEPA 2002e. Field Sampling Plan for the National Study of Chemical Residues in Lake Fish Tissue. EPA 823-R-02-004, September 2002. USEPA 2001a. EPA Requirements for Quality Management Plans, QA/R-2 (QA/R-2; EPA/240/B-01/002, March 2001and reissued May, 2006) http://www.epa.gov/quality1/qs-docs/r2-final.pdf USEPA 2001b. Ambient Water Quality Recommendations. Lakes and Reservoirs in Nutrient Region XIV. United States Environmental Protection Agency, Washington, DC. EPA 822-B-00-022. http://www.epa.gov/waterscience/criteria/nutrient/ecoregions/lakes/lakes_14.pdf USEPA 2001c. Methods for Collection, Storage and Manipulation of Sediments for Chemical and Toxicological Analyses: Office of Water. Publica. No. EPA-823-B-01-002. Washington, DC. USEPA 2000a. Guidance for Assessing Chemical Contaminant Data for Use in Fish Advisories Volume 1 Fish Sampling and Analysis Third Edition, EPA-823-B-00-007, November 2000. Office of Science and Technology, Office of Water. Washington, DC. USEPA 2000b. Ambient Water Quality Recommendations. Rivers and Streams in Nutrient Region XIV. United States Environmental Protection Agency, Washington, DC. EPA 822-B-00-022. http://www.epa.gov/waterscience/criteria/nutrient/ecoregions/rivers/rivers_14.pdf USEPA 2000c. Methods for Measuring the Toxicity and Bioaccumulation of Sediment-associated Contaminants with Freshwater Invertebrates, 2nd Edition. EPA/600/R-94/024 EPA Office of Research and Development, March 2000 USEPA 1998. Lake and Reservoir Bioassessment and Biocriteria -Technical Guidance Document, Tetra Tech, 1998 http://www.epa.gov/owow/monitoring/tech/lakes.html USEPA 1996. Method 1669 Sampling Ambient Water for Trace Metals at EPA Water Quality Criteria Levels, July 1996

MassDEP-DWM Program QAPP (2020-2024) CN # 520.1 October, 2020 Page 157
USEPA 1994. Short-Term Methods for Estimating the Chronic Toxicity of Effluents and Receiving Water to Freshwater Organisms, 3rd Edition. EPA/600/4-91/002. Office of Research and Development, Washington, DC, July, 1994 USEPA 1993a. Methods for Measuring the Acute Toxicity of Effluents and Receiving Water to Freshwater and Marine Organisms. EPA/600/4-90/027F. Office of Research and Development, Washington, DC, 1993 USEPA 1993b. Methods for the determination of inorganic substances in environmental samples. EPA/600/R-93/100. U.S. Environmental Protection Agency, Cincinnati, OH, USEPA 1992a. Determination of acid-volatile sulfide and simultaneously extracted metals in sediments using sulfide-specific electrode detection (AVSSEM SOP v2.0). EPA Environmental Research Laboratory, Narragansett, R.I. and Science International Corp., Narragansett, R.I. 1992 USEPA 1992b. Sediment Classification Methods Compendium. EPA 823/R-92-006, September 1992. USEPA 1983. Methods for Chemical Analysis of Water and Wastes, EPA 600/4-79-020, Revised 1983. Clesceri, L.S., A.E. Greenberg, and A.D. Eaton, (editors). USEPA 1982. Handbook for Sampling and Sample Preservation of Water and Wastewater, EPA 600/4-82-029, Environmental Monitoring and Support Laboratory, Cincinnati, OH. USGS in preparation. Merrimack River Basin Source Water Quality Assessment (2008-2010)--USGS MA-RI WSC USGS 2008. Comparison of Two Cell Lysis Procedures for Recovery of Microcystins in Water Samples from Silver Lake in Dover, Delaware with Microcystin producing cyanobacteria accumulations. Open File Report 2008-1341. USGS 2006. Field Comparison of Optical and Clark Cell Dissolved Oxygen Sensors in the Tualatin River, Oregon, 2005: U.S. Geological Survey Open-File Report 2006-1047 USGS. National Field Manual for the Collection of Water-Quality Data, TWRI Book 9, Chapters A1-A9, 1997-2005 USGS 2005. Sediment Studies in the Assabet River, Central Massachusetts, 2003. SIR Report# 2005-5131 USGS 2003. Evaluation of Alkaline Persulfate Digestion as an Alternative to Kjeldahl Digestion for Determination of Total and Dissolved Nitrogen and Phosphorus in Water, WRIR 03-4174, USGS National Water Quality Laboratory, 2003. USGS 2003. Electrofishing and its Harmful Effects on Fish, USGS/BRD/ITR-2003-0002, September, 2003 USGS 2002a. A Guide for the Use of Semipermeable Membrane Devices (SPMDs) as Samplers of Waterborne Hydrophobic Organic Contaminants; American Petroleum Institute publication # 4690, Washington, D.C., 2002 USGS 2002b. Water Quality Data for Pharmaceuticals, Hormones and Other Organic Wastewater Contaminants in U.S. Streams, 1999-2000. Open File Report 02-94 USGS 2001. Statewide Water Quality Network for Massachusetts. United States Geological Survey WRIR #01-4081. http://pubs.usgs.gov/wri/wri014081/

MassDEP-DWM Program QAPP (2020-2024) CN # 520.1 October, 2020 Page 158
USGS 2000. Guidelines and Standard Procedures for Continuous Water-Quality Monitors: Site Selection, Field Operation, Calibration, Record Computation and Reporting, WRIR 00-4252 USGS 1998. National Field Manual for the Collection of Water Quality Data, TWRI Book 9; September, 1998 USGS 1985. Study and Interpretation of Chemical Characteristics of Natural Water, 3rd edition, Water Supply Paper 2254, by John Hem. USGS 1982. Measurement and Computation of Streamflow, Volumes 1 and 2. Measurement of Stage and Discharge, and Computation of Discharge; by Rantz et. al. Water Supply Paper 2175. USGS on-line. StreamStats. http://water.usgs.gov/osw/streamstats/massachusetts.html USGS. Techniques for Water Resource Investigations, Book 3, Section A. Surface Water Hydraulics, various dates. https://pubs.usgs.gov/twri/index090905.html US Office of Management and Budget 2004. Final Information Quality Bulletin for Peer Review. WERF 1999. Evaluating Whole Effluent Toxicity Testing as an Indicator of Instream Biological Conditions, by TetraTech & Risk Sciences (Project 95-HHE-1) for Water Environment Research Foundation WHO 1999. Toxic Cyanobacteria in Water: A Guide to Their Public Health Consequences, Monitoring and Management. I. Chorus and J. Bartram editors. World Health Organization. Spon Press. London. Wilson, A. et. al. 2008. Evaluation of the human health threat associated with the hepatotoxin microcystin in the muscle and liver tissues of yellow perch (Perca flavescens). Can. J. Fish. Aquat. Sci. Vol. 65, 2008. YSI 2010. User Manual for YSI 6-Series Multiparameter Water Quality Sondes (2010) and 650 MDS Multiparameter Display System (2007), YSI Incorporated YSI 2020. EXO User Manual. YSI Incorporated. https://www.ysi.com/File%20Library/Documents/Manuals/EXO-User-Manual-Web.pdf

MassDEP-DWM Program QAPP (2020-2024) CN # 520.1 October, 2020 Page 159
GLOSSARY:
A common understanding of terminology is critical to an effective QA program. All project personnel should have the same working knowledge of these terms. The following terms are commonly-used in describing project QA/QC, from QAPP development to lab analysis and reporting. In most cases, these suggested definitions are entirely consistent with EPA guidance. PARCCS Concepts: Precision: A data quality indicator, precision measures the level of agreement or variability among a set of repeated measurements, obtained under similar conditions. Precision is usually expressed as a standard deviation in absolute or relative terms. Accuracy: A data quality indicator, accuracy is the extent of agreement between an observed value (sampling result) and the accepted, or true, value of the parameter being measured. High accuracy can be defined as a combination of high precision and low bias. Representativeness: A data quality indicator, representativeness is the degree to which data accurately and precisely portray the actual or true environmental condition measured. Comparability: A data quality indicator, comparability is the degree to which different methods, data sets, and/or decisions agree or are similar. Completeness: A data quality indicator that is generally expressed as a percentage, completeness is the amount of valid data obtained compared to the amount of data planned. Sensitivity: Similar to resolution, sensitivity refers to the capability of a method or instrument to discriminate between measurement responses. The more sensitive a method is, the better able it is to detect lower concentrations of a variable. Sensitivity may be quantified through detection limits. General QA/QC: Analyte: Within a medium, such as water, an analyte is a property or substance to be measured. Examples of analytes would include pH, dissolved oxygen, bacteria, and heavy metals. Bias: Often used as a data quality indicator, bias is the degree of systematic error or inaccuracy present in the assessment or analysis process. When bias is present, the sampling result value will differ from the accepted, or true, value of the parameter being assessed in one direction. Bias should not be used interchangeably with accuracy. Censored data: Data that has been found to be unacceptable as a result of the data validation process, including review for conformance to the approved QAPP and data quality objectives for the project (ex. required holding times for analysis, required frequency of field blanks and duplicates/splits, acceptability of precision estimates (standard deviation, SD or relative percent difference, RPD). Chain-of-Custody: Used for routine sample control for regulatory and non-regulatory monitoring. The chain-of-custody form contains the following information: sample IDs, collection date/time/samplers, sample matrix, preservation reqts., delivery persons/ date/time, etc.… Used also as a general term to

MassDEP-DWM Program QAPP (2020-2024) CN # 520.1 October, 2020 Page 160
include sample labels, field logging, field sheets, lab receipt and assignment, disposal and all other aspects of sample handling from collection to ultimate analysis. Data users: The group(s) that will be applying the data results for some purpose. Data users can include the principle investigators, as well as government agencies, schools, universities, watershed organizations, and business and community groups. Data quality objectives (DQOs): Data quality objectives are quantitative and qualitative statements describing the degree of the data's acceptability or utility to the data user(s). They include indicators such as accuracy, precision, representativeness, comparability, and completeness (PARCC). DQOs specify the quality of the data needed in order to meet monitoring project goals. Matrix: A matrix is a specific type of medium, such as surface water or sediment, in which the analyte of interest may be contained. Measurement Range: The measurement range is the extent of reliable readings of an instrument or measuring device, as specified by the manufacturer. Method Validation: Testing procedure for existing, new and modified methods, in which several evaluation steps are typically employed: determinations of MDL, method precision, method accuracy, and sensitivity to variation in method steps (“method ruggedness”, SM, 1998). Minimum Reporting Limit (MRL): Also known as the Reporting Limit (RL), the lower limit that the lab feels comfortable reporting with a high level of certainty. This limit is typically a multiplier of the MDL (2-5X). Performance Audit: Unscheduled evaluation of field sampling QC or laboratory QC procedures by a third party not directly involved in the taking, transport and analysis of the samples; used to detect deviations from accepted SOPs. Audits can take many forms. Submittal of identical check samples to two different labs is an example of an external, blind performance audit. Inter-lab comparison samples can also be used to test the lab’s proficiency in relation to other labs. Results of audits are documented and any necessary corrections recommended. Practical Quantitation Limit (PQL): The lowest concentration of an analyte that can be reliably measured within specified limits of precision and accuracy during routine laboratory operating conditions. (50 FR 46906, November 13, 1985) PQLs can range from 3-10 times the MDL. Protocols: Protocols are detailed, written, standardized procedures for field and/or laboratory operations. Quality assurance (QA): QA is an integrated management system designed to ensure that a product or service meets defined standards of quality with a stated level of confidence. QA activities involve planning quality control, quality assessment, reporting, and quality improvement. These activities can be internal (within the main group) or external (involving outside parties). Quality assurance project plan (QAPP): A QAPP is a formal written document describing the detailed quality control procedures that will be used to achieve a specific project's data quality requirements. A QAPP is a planning tool to ensure that project goals are achieved. Typically, QAPPs are finalized prior to
MassDEP-DWM Program QAPP (2020-2024) CN # 520.1 October, 2020 Page 161
monitoring activities and any deviations from the final QAPP made during the actual monitoring are noted in a subsequent task, such as the data reporting phase of the project. QAPPs can be of two main types: A “project-specific QAPP” provides a QA blueprint specific to one project or task and is
considered the sampling and analysis plan/workplan for the project. A “generic program QAPP” is an overview-type plan that describes program data quality
objectives, and documents the comprehensive set of sampling, analysis, QA/QC, data validation and assessment SOPs specific to the program. An example is a macroinvertebrate monitoring program performed throughout many watersheds within a State.
Quality control (QC): QC is the overall system of technical activities designed to measure quality and limit error in a product or service. A QC program manages quality so that data meets the needs of the user as expressed in a quality assurance project plan. Specific quality control samples include blanks, check samples, matrix spikes and replicates. Random Sample: A sample chosen such that the choice of each event in the sample is left entirely to chance; an unbiased sample generally representative of the population. Randomness is a property of a sample that must exist for almost any statistical test, but may not be appropriate for all sampling designs (ex. Non-random site selection based on targeting specific conditions or based on practical considerations). Relative standard deviation (RSD): A measure of precision calculated by dividing the std. deviation by the mean, expressed as a percentage. Used when sample number exceeds two. Relative percent difference (RPD): A measure of precision used for duplicate sample results. It is calculated by dividing the difference between the two results by the mean of the two results, expressed as a percentage. Used when sample number equals two. Standard deviation(s): Used in the determination of precision, standard deviation is the most common calculation used to measure the range of variation among repeated measurements. The standard deviation of a set of measurements is expressed by the positive square root of the variance of the measurements. Standard operating procedures (SOPs): An SOP is a written, official document detailing the prescribed and established methods used for performing project operations, analyses, or actions. Each DWM SOP is reviewed and approved for accuracy and applicability by DWM managers. Trend: Systematic tendency over time in a specific direction in time series data, ideally collected at uniform intervals, collected and analyzed using the same (or comparable) methods and containing no gaps in periodic data. True value: In the determination of accuracy, observed measurement values are often compared to true, or standard, values. A true value is one that has been sufficiently well established to be used for the calibration of instruments, evaluation of assessment methods or the assignment of values to materials. Variance: A statistical term used in the calculation of standard deviation, variance is the sum of the squares of the difference between the individual values of a set and the arithmetic mean of the set, divided by one less than the numbers in the set.

MassDEP-DWM Program QAPP (2020-2024) CN # 520.1 October, 2020 Page 162
Field Quality Control: Duplicate sample: Used for quality control purposes, field/lab duplicate samples are two samples taken generally at the same time from, and representative of, the same site/sample that are carried through all assessment and analytical procedures in an identical manner. Field duplicate samples are used to measure natural variability as well as the precision of field sampling and lab analytical methods. Lab duplicates are used as a measure of method precision. More than two duplicate samples are referred to as replicate samples. DWM field blank water: Deionized water made available by properly-maintained and -functioning water filtration system located in DWM laboratory. Environmental sample: An environmental sample is a specimen of any material collected from an environmental source, such as water or macroinvertebrates collected from a stream, lake, or estuary. Field blank: A field blank is created by filling a clean sample bottle with deionized or distilled water in the field during sampling activities. The sample is treated the same as other samples taken from the field. Field blanks are submitted to the lab along with all other samples and are used to detect any contaminants that may be introduced during sample collection, fixing, storage, analysis, and transport. Field composite sample: A sample taken by mixing equal volumes of a pre-determined number of grab samples from the same location at different times, i.e. a time-composite. Used to assess average conditions present between the first and last grab samples that are composited. Use time-composite sampling only for those parameters that can be shown to remain unchanged under the specific conditions of composite sample collection. Flow-weighted composite sampling is a variation to time-composite sampling, in which sample volume adjustments are made to each grab based on variations in flow, such as occurs during stormwater monitoring loading studies. Field integrated sample: A sample taken by simultaneously combining a matrix across vertical or horizontal strata as an evaluation of average composition within the boundaries of the integration (ex. Photic zone sampling for chlorophyll a). Sampling tubes can sample continuous, integrated media. Field Split: A second sample generated from the same sampling location and at the same time by splitting a large volume sample from one sampler deployment into two equal volume samples. Used to measure precision, except that associated with actual sample collection, and excludes natural variability. Also referred to as duplicate subsample. Field Duplicate (sequential): A second sample generated from the same sampling location as the initial sample, but from a second sampler deployment immediately after the first. Used to measure overall field sampling precision and includes an unknown amount of natural variability (spatial and temporal), if present. Field Duplicate (simultaneous): A second sample generated from the same sampling location and at the same exact time as the other sample by simultaneous deployment of two identical sampling devices or by the simultaneous filling of two separate sample bottles. Used to measure overall field sampling precision and includes an unknown amount of natural variability (spatial), if present. Also referred to as a co-located duplicate.

MassDEP-DWM Program QAPP (2020-2024) CN # 520.1 October, 2020 Page 163
Grab Sample: A manually collected sample at a specific location and time. Given practical constraints and budget limitations, assumptions are usually made that the natural variation is small enough over space/time to consider the grab to be representative of conditions over a greater expanse and/or longer period. In some cases, these assumptions may not always be valid. Laboratory Quality Control: Blind sample: A blind sample is a sample submitted to an analyst without their knowledge of its identity or composition. Blind samples are used to test the analyst's or laboratory's expertise in performing the sample analysis. Calibration Blank: Reagent-grade, purified water (deionized/distilled) used as a zero standard; used to “zero” lab instruments, evaluate instrument drift and check for sample contamination of field blanks. Calibration Check Standard: A standard used to check the calibration of an instrument between periodic recalibrations. Detection limits: Applied to both methods and equipment, detection limits are descriptions of the lowest concentration of a target analyte that a given method or piece of equipment can reliably ascertain as greater than zero. Specific detection limits include: Instrument detection limit, level of quantitation, lower level of detection, method detection limit, practical quantitation limit and reporting (detection) limit. Instrument detection limit (IDL): The concentration that produces a signal greater than five times the signal/noise ratio of the instrument. Level of Quantitation (LOQ): The concentration that produces a signal sufficiently greater than the blank that it can be detected; typ. The concentration that produces a signal 10*s above the blank signal. Typically, ten times the IDL (SM, 1998). Lower level of detection (LLD): Measurement level reproducible with 99% certainty; typically, twice the IDL. Method detection limit (MDL): The MDL is the concentration that produces a signal with a 99% probability that it is different from the blank, after going through the entire method. The smallest amount that can be detected above the noise in a procedure and within a stated confidence level. Typically, four times the IDL. Practical Quantitation Limit (PQL): The lowest concentration level that several labs can report using the same method and samples; typically, ten times the IDL, and 3-5 times the MDL. Reporting Limit (RL): Also known as the Reporting Detection Limit (RDL), the lower limit that the lab feels comfortable reporting with a high level of certainty. For practical purposes, the RDL is often equivalent to the MDL when data with values down to the lowest possible limits are needed. Equipment or rinsate blank: Used for quality control purposes, equipment or rinsate blanks are types of field blanks used to check specifically for carryover contamination from reuse of the same sampling equipment (see field blank).

MassDEP-DWM Program QAPP (2020-2024) CN # 520.1 October, 2020 Page 164
Lab Split: A sample that has been divided into two or more subsamples. Splits are submitted to different analysts or laboratories and are used to measure the precision of the analytical methods. Lab splits are an external QC protocol. Lab duplicate: A sample that has been divided into two or more subsamples. It is processed concurrently and identically with the initial sample by the same laboratory. It is used to measure the precision of the analytical methods. Lab duplicates are also referred to as lab splits. Method Blank: An aliquot of clean reference matrix carried through the analytical process to assess the degree of laboratory contamination and indicate accuracy. Matrix Spike: A sample to which a known concentration of target analyte has been added. When analyzed, the difference in analyte concentration between a spiked sample and the non-spiked sample should be equivalent to the amount added to the spiked sample. Lab QC sample used to assess sample matrix effects on recovery of target analyte and evaluate accuracy. Also known as Lab-fortified matrix. Duplication of this sample is referred to as matrix spike duplicate or lab-fortified matrix duplicate. Performance evaluation (PE) samples: A sample of known concentration submitted “blind” (without lab’s knowledge) to the analyst. PE samples are provided to evaluate the ability of the analyst or laboratory to produce analytical results within specified limits, and as an indicator of method accuracy. Also called a laboratory control sample. Spike Blank: Known concentration of target analyte(s) introduced to clean reference matrix and processed through the entire analytical procedure; used as an indicator of method performance and accuracy. Also known as Lab-fortified blank. Standard reference materials (SRM): An SRM is a certified material or substance with an established, known and accepted value for the analyte or property of interest. Employed in the determination of bias, SRMs are used as a gauge to correctly calibrate instruments or assess measurement methods. SRMs are produced by the U. S. National Institute of Standards and Technology (NIST) and characterized for absolute content independent of any analytical method. Qualifier: Used to indicate additional information about the data, and generally denoted as capital letters in data reports. Qualifier acronyms or terms are unique to each laboratory. Quality Assurance Plan (QAP): A comprehensive laboratory document detailing lab quality control procedures (e.g. WES QAP).

APPENDICES
Appendix A: DWM-WPP Project QAPPs CN 096.0 Fish Toxics Program QAPP CN 226.0 Benthic Macroinvertebrate Biomonitoring & Habitat Assessment QAPP CN 388.0 Generic QAPP for Model Simulations in the TMDL Program CN 350.0 DWM-WPP Bacteria Laboratory QAPP CN 350.3 Laboratory Quality Assurance Plan Microbiology (Southeast Regional Office) CN 408.0 Continuous Stream Temperature Monitoring Program (Rev. 1.0)
Appendix B: Massachusetts Probabilistic Monitoring and Assessment Program QAPP Massachusetts Probabilistic Monitoring & Assessment Program (MAP2), Coastal Waters QAPP Alpha Analytical Quality Systems Manual 1558 Enthalpy Analytical QA Manual Normandeau Benthic Infauna QAPP Appendix C: Collaborative Project QAPPs/SOPs
Narragansett Bay Fixed-Site Monitoring Network (NBFSMN) Seasonal Monitoring QAPP CN 510.0 Massachusetts Estuaries Project Marine Benthic Monitoring QAPP CN 510.2 Massachusetts Estuaries Project Benthic Monitoring Laboratory SOPs CN 510.3 Marine Benthic Macrofaunal Monitoring Guidance to Support TMDLs and Habitat Condition Assessments PFAS Sampling in Rivers and Streams in Massachusetts, USGS/MassDEP QAPP Division of Marine Fisheries QAPP – Excerpt: Section 5 Fish Kill Protocol MassDPH / MassDEP HAB Protocol (Draft)
Appendix D: DWM-WPP Annual Sampling & Analysis Plans (SAPs) for 2020 CN 509.0 Chloride Project SAP 2019-2020 CN 523.0 Bacteria Source Tracking in the Southeast Region SAP 2020 CN 524.0 Mystic Lakes Monitoring SAP 2020 CN 526.0 Regional Monitoring Network SAP 2020 CN 531.0 Biocriteria Development
Monitoring SAP 2020 CN 532.0 Wadeable Stream Cold Water Fishery Determination in Northeastern and Central Massachusetts SAP 2020
Appendix E: DWM-WPP Monitoring, Analytical and Data Management SOPs CN 000.2 - Field Safety.doc CN 000.21 - Incident Report Form_2020 CN 000.34 - Laboratory Safety Plan2_SERO CN 000.35 - Laboratory Safety Plan for 8 New Bond location

CN 000.42 - EDD template.xls CN 000.44 - Lab Data Elements CN 000.5 - DWM Document Control CN 000.6 - Station Definition CN 000.70b - Secondary QAPP Submittal and Approval CN 000.72c - Secondary Data Submittal & Review CN 000.74a - External Data Reports CN 000.78 - External Data Review Form CN 000.83b - DWM Data Use Guidelines CN 001.21 - Field Sampling CN 001.27 - Property Access WORKING DRAFT CN 001.28 - Property Access (forms) CN 001.3 - Sample Collection Pole CN 001.35 - Hinged Pole Sampler (DRAFT) CN 001.4 - Bottle Basket Sampler CN 001.68 - Peristaltic Pump Sampler CN 001.7 - Sample Handling for Total Analytes CN 001.82 - Mailed Samples_with passwords CN 001.96 - WinLIMS_SamplePreLog 2019 CN 002.3 - Analysis for True Color CN 003.42 - Analysis for Chlorophyll a CN 003.5 - Sampling Guidance for Chlorophyll a CN 004.25 - Water Quality Multiprobes DRAFT CN 004.28 - Hydrolab Multiprobe Quickguide for Field Use CN 004.29 - Hydrolab Multiprobe Quickguide for Calibration and File Management CN 004.29b - Hydrolab MS5 Calibration QuickGuide 2019 CN 004.32 - YSI EXO1 Calibration and Download QuickGuide 2019 CN 004.33 - YSI EXO1 Multiprobe Field Operation QuickGuide 2019 CN 004.34 - YSI EXO1 Calibration and Download QuickGuide 2002 CN 004.41 - Multiprobe Deployment CN 004.70 - MiniDOT Multiprobe Setup QuickGuide CN 004.81 - HOBO DO-T Logger Setup QuickGuide CN 004.85 - HOBO TidBits CN 004.99 - Barnstead E-PURE 2019 CN 005.0 - Corrective Action

CN 035.0 - Periphyton Sampling CN 039.2 - Benthic Macroinvertebrates CN 040.3 - Fish Toxics Monitoring CN 055.1 - SOP_Secchi disk transparency CN 056.15 - Data Validation Processes (summary) CN 056.3 - Data Validation Decision Table CN 056.4 - Data Validation_Attended Probe Data_4-12 CN 056.5 - Data Validation_Unttended Probe Data_11-2012 CN 056.61 - Data Validation_Laboratory Data CN 056.9 - Data Validation_Overview CN 058.0 - Optical Brighteners.doc CN 058.5 - Fluorometer Use to Detect Optical Brighteners CN 059.0 - Equipment Washing CN 059.6 - Field Equipment Decontamination (invasives) CN 059.95 - Quickguide for Field Equipment Decontamination (2020) CN 060.0 - Periphyton CN 067.2 - Macrophyte Survey Mapping CN 067.5 - Aqua-Vu Camera Use CN 068.0 - Flow Measurement CN 068.1 - Flow Calculation CN 068.2 - Swoffer depth setting CN 068.5 - Sontek ADV QuickGuide CN 068.6 - Swoffer 3000 QuickGuide CN 068.7 - Global Velocity Meter QuickGuide CN 071.0 - Sediment Sampling & Analysis CN 075.2 - Fish Population CN 082.1 - Bathymetric Mapping CN 095.7 - Analysis for Turbidity (QuickGuide) CN 101.2 - Clean Metals Sampling CN 103.1 - Continuous Temperature Monitoring CN 103.5 - Hobo Shuttle Quickguide CN 143.0 - Analysis for Detergents as MBAS (SOP QuickGuide) CN 150.0 - Cyanobacteria Counts CN 150.5 - Cyano Cell Count Calculation Sheet CN 151.5 - Percent Cover Floating Plants
CN 198.0 - Analysis for Bacteria Using Colilert-Enterolert CN 198.5 - Quickguide for Bacteria Analysis Using Colilert-Enterolert CN 230.0 - Algal Toxins CN 349.0 - Continuous Conductivity Monitoring CN 399.0 - Hanna high range portable photometer HI 96733_2015 CN 409.0 - Phycocyanin Probe and Datalogger CN 409.5 - Phycocyanin Probe and Datalogger Quickguide CN 533.0 - Fish Collection for Cold Water Fisheries 2020 CN 535.0 - WPP COVID-19 Safety Guidance 2020 CN 536.0 - Hanna Potassium Meter SERO
Appendix F: WES Laboratory QA Plan and SOPs Lab QA Plan Laboratory Quality Assurance Plan Anatoxin-a – Abraxis ELISA in Waters AOAC 983-21n (modif) - Pesticides, PCB Aroclors and PCB Congeners in Fish Tissue BacteroidetesG - Bacteroidetes Group Marker by PCR Assay Based on AEM 66:1587 BacteroidetesHF - Bacteroidetes Human-Specific Marker - Modified Method of AEM 66:1587 EPA 525.2 mod. - Caffeine in Water by Solid-Phase Extraction and Capillary Column GC/MS ENT-esp Marker - Enterococcal esp Gene (Sewage Marker) Based on ES&T 39:283 EPA 1603 - E. coli Membrane Filtration Procedure EPA 200.7 - Metals & Trace Elements & Hardness in Water & Wastes by ICP-AES EPA 200.8- Metals and Trace Elements in Water and Wastes by ICP-AMS EPA 245.1 - Mercury in Water by Cold Vapor Atomic Absorption Spectrometry EPA 300.0 - Inorganic Ions EPA 3052 Modified - Multiwave Microwave Digestion of Fish/Biota Tissue EPA 350.1 - Ammonia, Colorimetric Automated Phenate EPA 351.2 - Kjeldahl Nitrogen, Colorimetric Semi-automated Block Digester, Auto Analyzer EPA 353.1 - Nitrate Nitrite Nitrogen, Colorimetric-Automated, Hydrazine Reduction EPA 525.2 - Organic Compounds by Liquid-Solid Extraction and Capillary Column GC/MS EPA 546 – Total Microcystins and Nodularins by Adda ELISA (WES pending) EPA 7473 - Hg in Solids and Solutions by thermal decomp., amalgamation, and AA Spec EPA 8082 - PCBs in Soil & Waters EPA 8270C - Semi-Volatile Organic Compounds by GC/MS Fish Processing SOP- Processing Fish Samples Intended for Contaminant Analysis FWA in 100 mL - Fluorescent Whitening Agents in Water and Wastewater using 100 mL PCB Congeners-Water - PCB Toxic Congeners in Water and Wastewater

SM 2320B - Alkalinity by the Titration Method SM 2540B - Total Solids Dried at 103-105°C SM 2540-C - Total Dissolved Solids Dried at 180°C SM 2540G - Total Fixed & Volatile Solids in Semi-Solid Samples SM 4500-Cl-B - Chloride SM 4500-P-E - Total Phosphorus, Ascorbic Acid Method SM 5220-B - Chemical Oxygen Demand, Open Reflux Method SM 5540-C - Anionic Surfactants as MBAS SM 9213D - E. coli Membrane Filtration Procedure SM 9215B - Heterotrophic Plate Count -Pour Plate Procedure SM 9222B - Total Coliform Membrane Filtration Procedure SM 9222D - Fecal Coliform Membrane Filtration Procedure SM 9223 - Enzyme Substrate Coliform Test Presence-Absence Procedure for Potable Water SM 9223-MPN - MPN Enzyme Substrate Coliform Test
Appendix G: Contract Lab QAPs and SOPs EPA Region 1 – Laboratory QMP EPA Region 1 – TN/TP method [Alpha Analytical – included in MCCA QAPP Appendix B] [Enthalpy – included in MCCA QAPP Appendix B] [Normandeau – included in MCCA QAPP Appendix B] PhycoTech – Sorting/ID SOPs Appendix H: DWM-WPP Documentation Forms (examples) Field Sheets Chain of Custody (WES) Chain of Custody (nonWES) Bottle Labels Survey Guidebook Training Record DWM-WPP lab audit form Multi-probe user report Hazardous Waste Generation form EDD Template External Data Review Scientific Collection Permit