Embed Size (px)
Citation preview

Governors State UniversityOPUS Open Portal to University Scholarship
All Capstone Projects Student Capstone Projects
Fall 2012
Quality Assurance Plan Project for CopperDetermination Using Flame Atomic AbsorptionSpectroscopyBharath RaparthiGovernors State University
Follow this and additional works at: http://opus.govst.edu/capstones
Part of the Analytical Chemistry Commons
For more information about the academic degree, extended learning, and certificate programs of Governors State University, go tohttp://www.govst.edu/Academics/Degree_Programs_and_Certifications/
Visit the Governors State Analytical Chemistry DepartmentThis Project Summary is brought to you for free and open access by the Student Capstone Projects at OPUS Open Portal to University Scholarship. Ithas been accepted for inclusion in All Capstone Projects by an authorized administrator of OPUS Open Portal to University Scholarship. For moreinformation, please contact [email protected].
Recommended CitationRaparthi, Bharath, "Quality Assurance Plan Project for Copper Determination Using Flame Atomic Absorption Spectroscopy"(2012). All Capstone Projects. 63.http://opus.govst.edu/capstones/63
1
Quality Assurance Plan Project for
Copper Determination using Flame
Atomic Absorption Spectroscopy
Research project
By
Bharath Raparthi
Submitted in partial fulfillment of requirements for
Masters of Science in Analytical chemistry
Governors State University
December 2012

2
ACKNOWLEDGEMENTS
I would like to express my gratitude towards my parents for their kind co-operation
and encouragement which help me in completion of this project.
I am highly indebted to Governors State University for their guidance and constant
supervision, as well as for providing necessary information regarding the project &
also for their support in completing the project.
I thank my advisor, Dr. Karen D’Arcy, for her prompt and detailed advice, for her
valuable guidance and her hard work, showing me what an academic professional
ought to be. I thank her enthusiasm about my work and her exceptional patience.
I would like to express my gratitude and thanks to Dr. Timothy Gsell and Dr. John
Yunger for giving me such attention and time.
My thanks and appreciations also go to Vinaybabu Yalamanchili, Sandra Johnston
and Felicia Krelwitz in developing the project
3
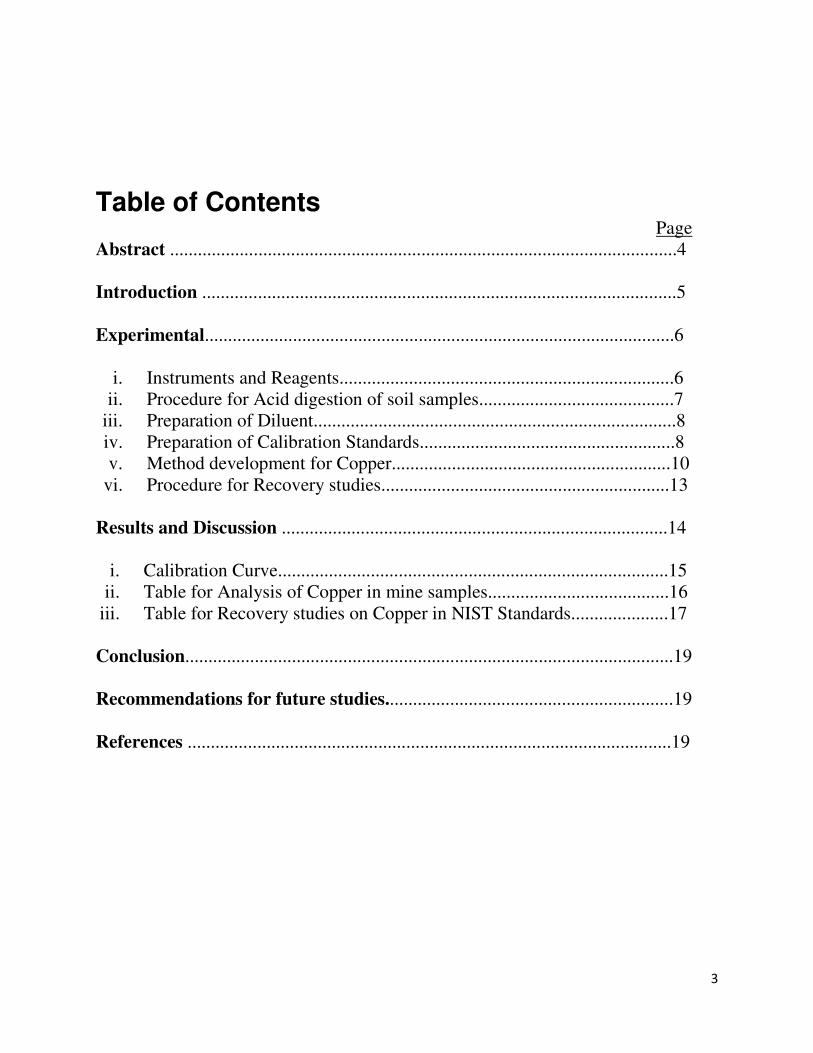
Table of Contents Page
Abstract .............................................................................................................4
Introduction ......................................................................................................5
Experimental.....................................................................................................6
i. Instruments and Reagents........................................................................6
ii. Procedure for Acid digestion of soil samples..........................................7
iii. Preparation of Diluent..............................................................................8
iv. Preparation of Calibration Standards.......................................................8
v. Method development for Copper............................................................10
vi. Procedure for Recovery studies..............................................................13
Results and Discussion ...................................................................................14
i. Calibration Curve....................................................................................15
ii. Table for Analysis of Copper in mine samples.......................................16
iii. Table for Recovery studies on Copper in NIST Standards.....................17
Conclusion.........................................................................................................19
Recommendations for future studies..............................................................19
References ........................................................................................................19
4
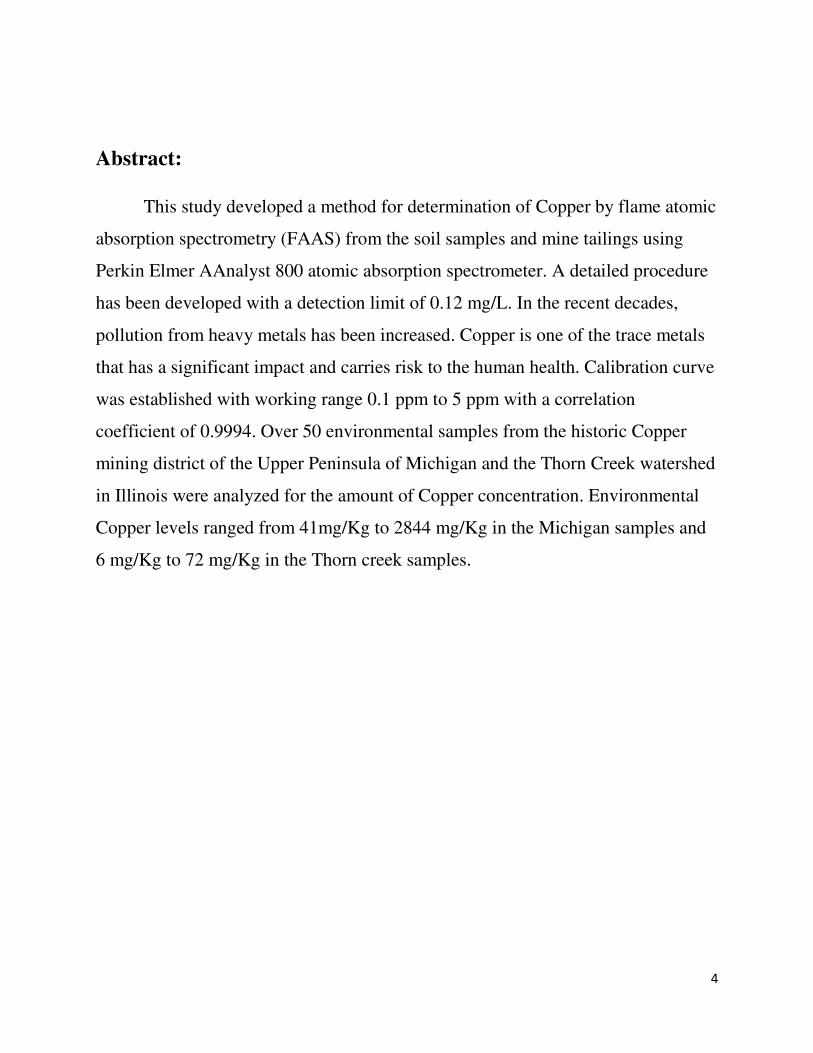
Abstract:
This study developed a method for determination of Copper by flame atomic
absorption spectrometry (FAAS) from the soil samples and mine tailings using
Perkin Elmer AAnalyst 800 atomic absorption spectrometer. A detailed procedure
has been developed with a detection limit of 0.12 mg/L. In the recent decades,
pollution from heavy metals has been increased. Copper is one of the trace metals
that has a significant impact and carries risk to the human health. Calibration curve
was established with working range 0.1 ppm to 5 ppm with a correlation
coefficient of 0.9994. Over 50 environmental samples from the historic Copper
mining district of the Upper Peninsula of Michigan and the Thorn Creek watershed
in Illinois were analyzed for the amount of Copper concentration. Environmental
Copper levels ranged from 41mg/Kg to 2844 mg/Kg in the Michigan samples and
6 mg/Kg to 72 mg/Kg in the Thorn creek samples.
5
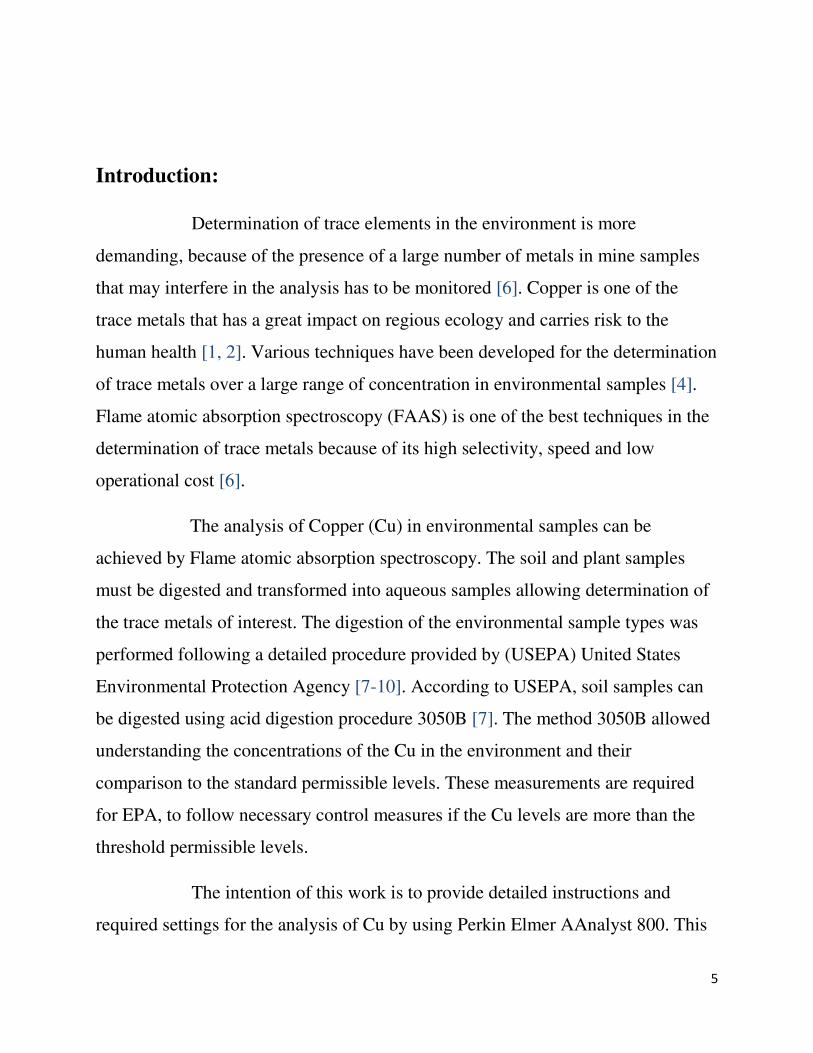
Introduction:
Determination of trace elements in the environment is more
demanding, because of the presence of a large number of metals in mine samples
that may interfere in the analysis has to be monitored [6]. Copper is one of the
trace metals that has a great impact on regious ecology and carries risk to the
human health [1, 2]. Various techniques have been developed for the determination
of trace metals over a large range of concentration in environmental samples [4].
Flame atomic absorption spectroscopy (FAAS) is one of the best techniques in the
determination of trace metals because of its high selectivity, speed and low
operational cost [6].
The analysis of Copper (Cu) in environmental samples can be
achieved by Flame atomic absorption spectroscopy. The soil and plant samples
must be digested and transformed into aqueous samples allowing determination of
the trace metals of interest. The digestion of the environmental sample types was
performed following a detailed procedure provided by (USEPA) United States
Environmental Protection Agency [7-10]. According to USEPA, soil samples can
be digested using acid digestion procedure 3050B [7]. The method 3050B allowed
understanding the concentrations of the Cu in the environment and their
comparison to the standard permissible levels. These measurements are required
for EPA, to follow necessary control measures if the Cu levels are more than the
threshold permissible levels.
The intention of this work is to provide detailed instructions and
required settings for the analysis of Cu by using Perkin Elmer AAnalyst 800. This

6
will help the researchers who were interested in detection of trace elements
especially in case of the Cu in the soils, plants and animal samples. This method
will help in analyzing the element Cu with required conditions and specifications.
Experimental:
Instruments and Reagents:
• AAnalyst 800 Atomic absorption spectrometer (Perkin Elmer).
• Multi-element Ag-Cr-Cu-Fe-Ni Lumina Hollow Cathode Lamp
(Perkin Elmer)
• Centrifuge (CRU 5000- Centrifuge).
• Hot air oven (Thelco).
• Disposable graduated pipettes (non-sterile) (VWR International).
• Disposable graduated Centrifuge tubes (sterile) (VWR International).
• Glass beakers and Pipettes.
• 1:1 Nitric acid (Made with equal amounts of Nitric acid and water).
• 70% Concentrated HNO3 (Nitric acid-Fisher Certified ACS plus).
• 30% H2O2 (Hydrogen peroxide-Fisher Scientific).
• 5% HNO3 (Spex Certi Prep).
• Copper in 2% HNO3 (1000 mg/L, Lot#:17-124CU, Perkin Elmer).
• Acetylene AA grade (Fuel).
• Compressed gas zero grade (Oxidant gas).
• Water ACS Reagent grade (RICCA Chemical Company).
7
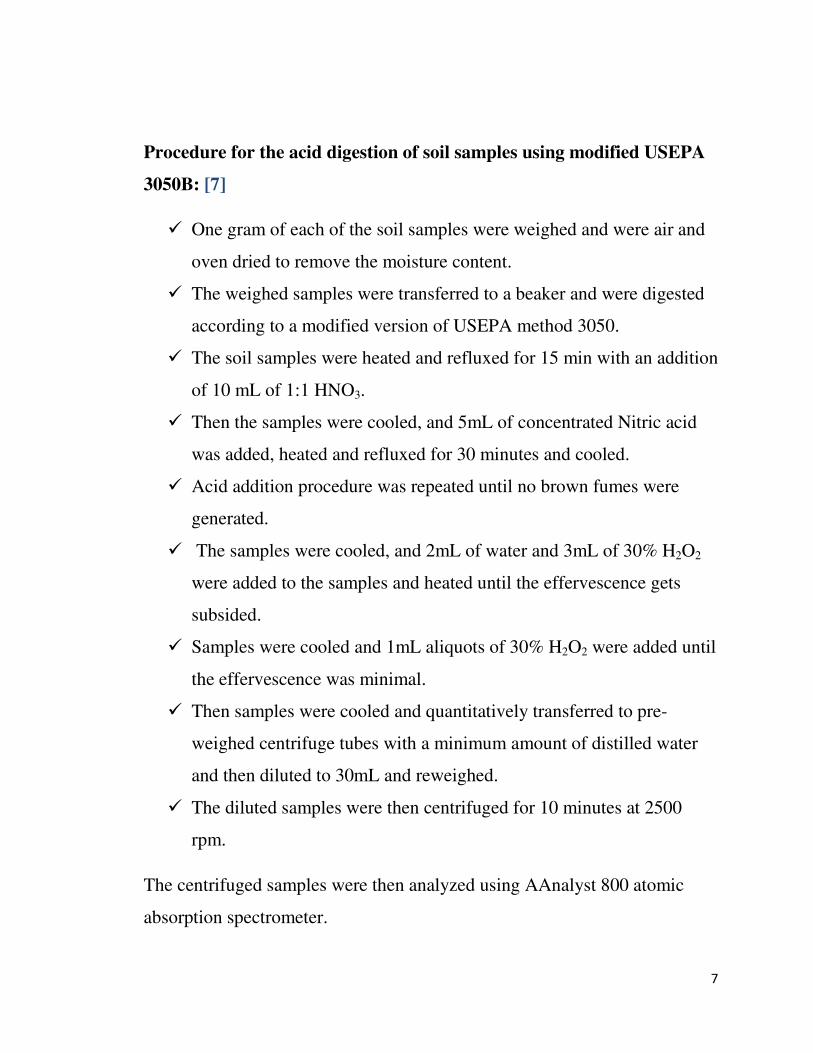
Procedure for the acid digestion of soil samples using modified USEPA
3050B: [7]
� One gram of each of the soil samples were weighed and were air and
oven dried to remove the moisture content.
� The weighed samples were transferred to a beaker and were digested
according to a modified version of USEPA method 3050.
� The soil samples were heated and refluxed for 15 min with an addition
of 10 mL of 1:1 HNO3.
� Then the samples were cooled, and 5mL of concentrated Nitric acid
was added, heated and refluxed for 30 minutes and cooled.
� Acid addition procedure was repeated until no brown fumes were
generated.
� The samples were cooled, and 2mL of water and 3mL of 30% H2O2
were added to the samples and heated until the effervescence gets
subsided.
� Samples were cooled and 1mL aliquots of 30% H2O2 were added until
the effervescence was minimal.
� Then samples were cooled and quantitatively transferred to pre-
weighed centrifuge tubes with a minimum amount of distilled water
and then diluted to 30mL and reweighed.
� The diluted samples were then centrifuged for 10 minutes at 2500
rpm.
The centrifuged samples were then analyzed using AAnalyst 800 atomic
absorption spectrometer.

8
Calibration:
The calibration standards were first prepared by making serial dilutions of
the Perkin Elmer Cu standard 1000mg/L using 1% HNO3. Initial working
range tested, followed the Perkin Elmer recommended conditions.
Preparation of Diluent (1% HNO3):
100 mL of 5% HNO3 was diluted to 500mL with Water ACS regent grade in
a measuring cylinder.
Preparation of Calibration Standards:
A 10 mg/L was prepared as an intermediate stock solution diluting 1mL of
1000 mg/L of Cu Standard to 100mL in a volumetric flask using 1% HNO3
as diluent.
Serial dilutions of 5 mg/L, 2 mg/L, 1 mg/L, 0.5 mg/L and 0.1 mg/L were
prepared from the intermediate stock solution(10 mg/L). (See Table-1
below)
Table-1: Preparation of Calibration standards from commercial stock
solution 1000mg/L Cu
(Intermediate Stock
Solution) 10 mg/L
1 mL of 1000 mg/L diluted to 100mL
5 mg/L 25 mL of 10 mg/L diluted to 50 mL
2 mg/L 10 mL of 10 mg/L diluted to 50 mL
1 mg/L 5 mL of 10 mg/L diluted to 50 mL

9
0.5 mg/L 2.5 mL of 10 mg/L diluted to 50 mL
0.1 mg/L 0.5 mL of 10 mg/L diluted to 50 mL
The Calibration standards and the digested samples were stored at room
temperature until for further analysis using FAAS.
NIST Standards:
Domestic Sludge (2781) and Estuarine Sediment (1646a) with standard
concentrations of Cu as 627.4 mg/Kg and 10.01 mg/Kg respectively were
used as control for the soil samples[11,12].
Figure-1: Perkin Elmer AAnalyst 800 in Flame Mode
10
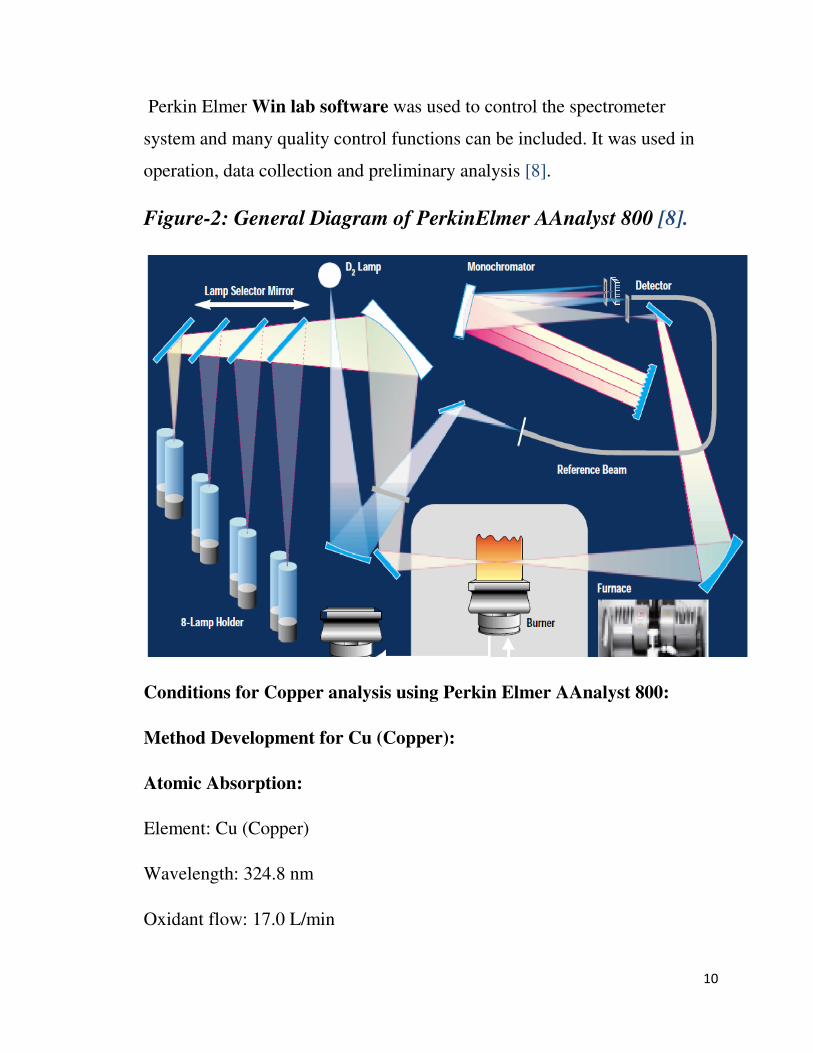
Perkin Elmer Win lab software was used to control the spectrometer
system and many quality control functions can be included. It was used in
operation, data collection and preliminary analysis [8].
Figure-2: General Diagram of PerkinElmer AAnalyst 800 [8].
Conditions for Copper analysis using Perkin Elmer AAnalyst 800:
Method Development for Cu (Copper):
Atomic Absorption:
Element: Cu (Copper)
Wavelength: 324.8 nm
Oxidant flow: 17.0 L/min

11
Acetylene flow: 2.0 L/min
Slit width: 0.7H
Measurement: Time Average.
Flame Emission:
Wavelength: 327.4 nm
Oxidant flow: 16.0 L/min
Acetylene flow: 7.8 L/min
Settings:
Reading Parameters:
The sample was analyzed for 3 sec without any delay for 3 replicates at 72
amps.
Auto sampler was not used for FAAS.
Calibration Equation:
Equation: Linear, calculated intercept
Max. Decimal places: 3
Max. Significant figures: 4
Calibration and sample units: mg/L
12
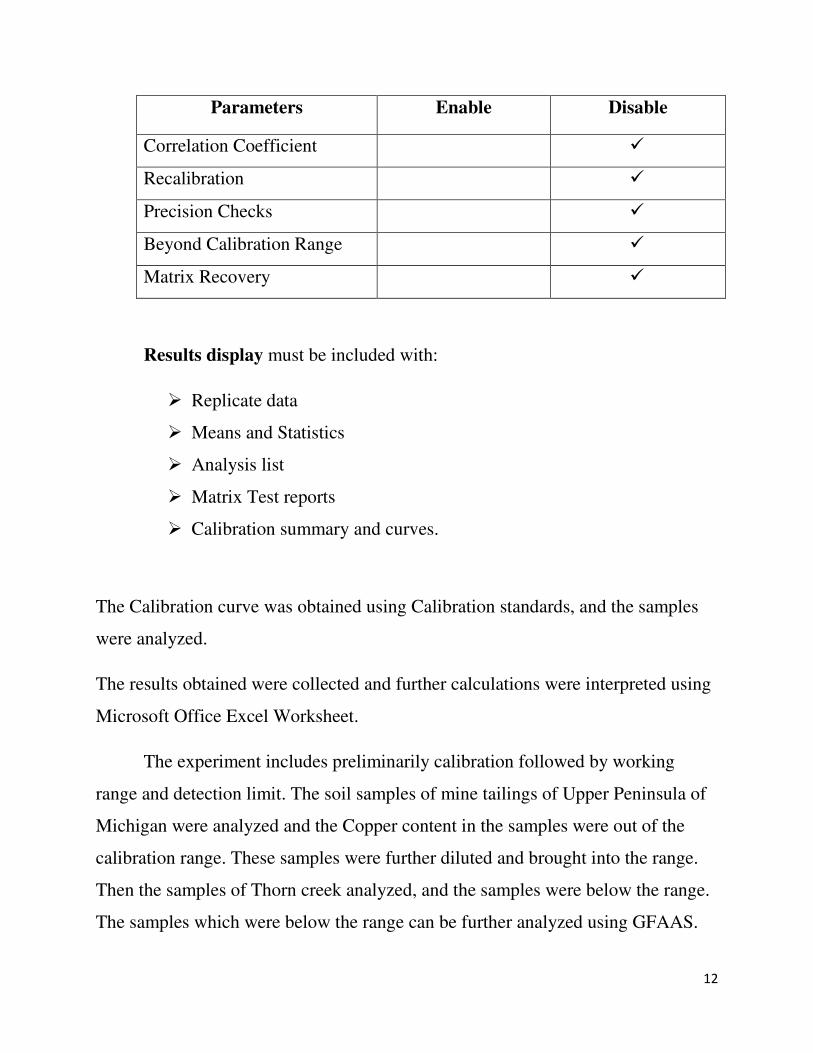
Parameters Enable Disable
Correlation Coefficient �
Recalibration �
Precision Checks �
Beyond Calibration Range �
Matrix Recovery �
Results display must be included with:
� Replicate data
� Means and Statistics
� Analysis list
� Matrix Test reports
� Calibration summary and curves.
The Calibration curve was obtained using Calibration standards, and the samples
were analyzed.
The results obtained were collected and further calculations were interpreted using
Microsoft Office Excel Worksheet.
The experiment includes preliminarily calibration followed by working
range and detection limit. The soil samples of mine tailings of Upper Peninsula of
Michigan were analyzed and the Copper content in the samples were out of the
calibration range. These samples were further diluted and brought into the range.
Then the samples of Thorn creek analyzed, and the samples were below the range.
The samples which were below the range can be further analyzed using GFAAS.
13
The recovery studies on the Copper in NIST standards were made due to changes
in the original concentrations of the standards.
Procedure for Recovery Studies:
� Nine samples of one gram weight of NIST standards Domestic sludge and
Estuarine Sediment were weighed and transferred into beakers.
� 3 replicate samples of each of the NIST standards were spiked with 5 mg
and 10 mg of 1000 mg/L of Cu standard (Perkin Elmer) respectively and 3
samples were left unspiked.
� The spiking was done before the digestion procedure gets started.
� Followed by Spiking, these samples were digested in the same way as the
soil samples were digested, using modified USEPA 3050B method [7].
� The digested samples were then analyzed by using FAAS.
Since the calibration range was up to 5 mg/L, the samples with high
concentration were diluted and reanalyzed.
14
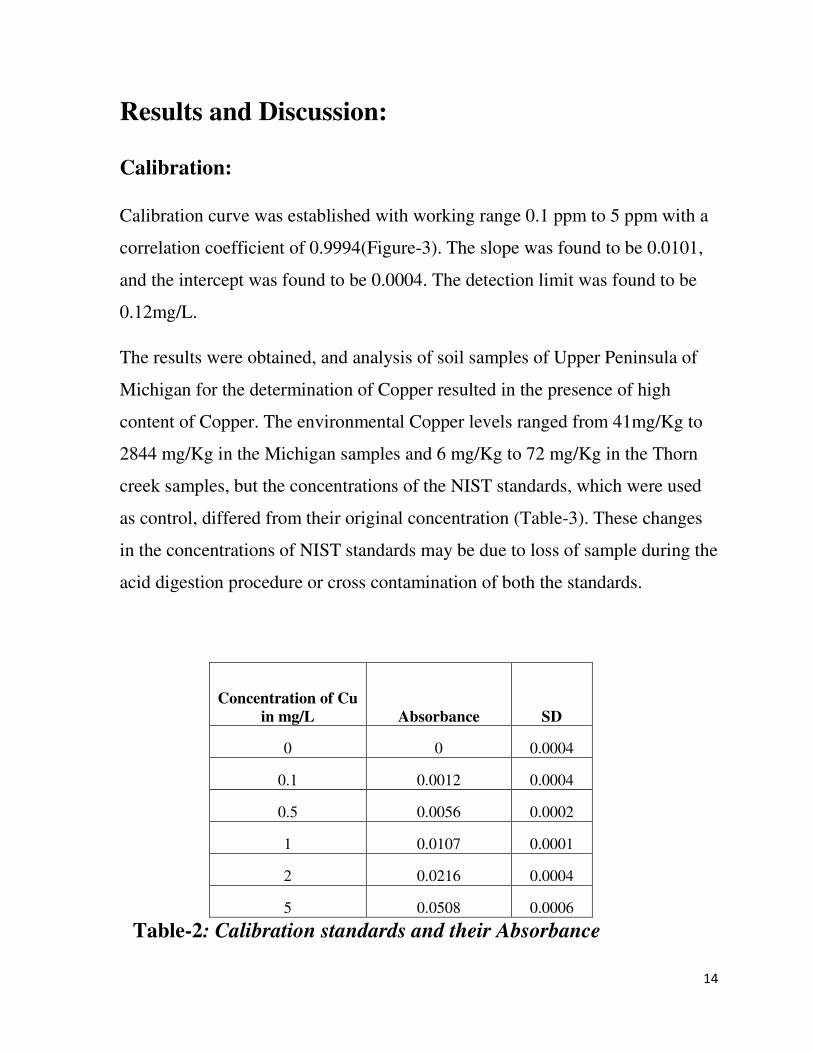
Results and Discussion:
Calibration:
Calibration curve was established with working range 0.1 ppm to 5 ppm with a
correlation coefficient of 0.9994(Figure-3). The slope was found to be 0.0101,
and the intercept was found to be 0.0004. The detection limit was found to be
0.12mg/L.
The results were obtained, and analysis of soil samples of Upper Peninsula of
Michigan for the determination of Copper resulted in the presence of high
content of Copper. The environmental Copper levels ranged from 41mg/Kg to
2844 mg/Kg in the Michigan samples and 6 mg/Kg to 72 mg/Kg in the Thorn
creek samples, but the concentrations of the NIST standards, which were used
as control, differed from their original concentration (Table-3). These changes
in the concentrations of NIST standards may be due to loss of sample during the
acid digestion procedure or cross contamination of both the standards.
Concentration of Cu
in mg/L Absorbance SD
0 0 0.0004
0.1 0.0012 0.0004
0.5 0.0056 0.0002
1 0.0107 0.0001
2 0.0216 0.0004
5 0.0508 0.0006
Table-2: Calibration standards and their Absorbance
15
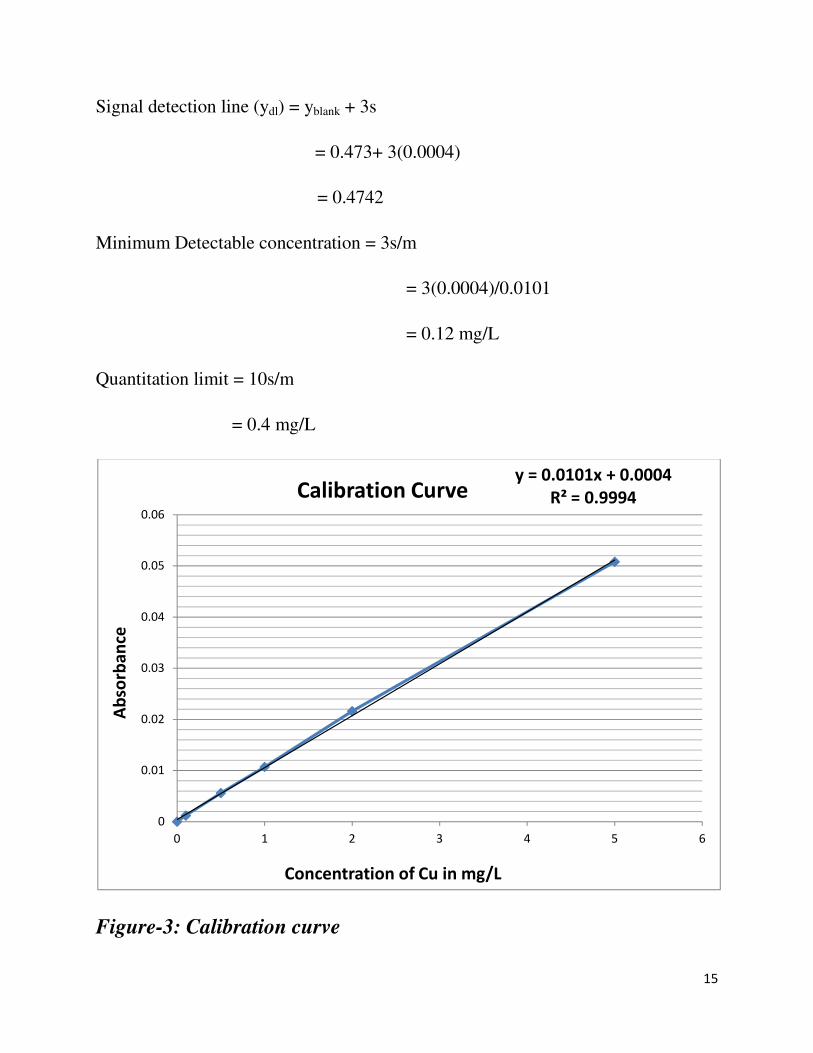
Signal detection line (ydl) = yblank + 3s
= 0.473+ 3(0.0004)
= 0.4742
Minimum Detectable concentration = 3s/m
= 3(0.0004)/0.0101
= 0.12 mg/L
Quantitation limit = 10s/m
= 0.4 mg/L
Figure-3: Calibration curve
y = 0.0101x + 0.0004
R² = 0.9994
0
0.01
0.02
0.03
0.04
0.05
0.06
0 1 2 3 4 5 6
Ab
sorb
an
ce
Concentration of Cu in mg/L
Calibration Curve

16
Table-3: Determination of Copper in the Mine Samples:
UP Soil Samples
Initial sample
size in g RSD
Mean of Cu
Conc. in
ppm mgCu/g sample
mgCu/Kg
sample
Estuary sediment 1.023 1.427 23.9 0.683105455 683.1054545
Domestic sludge 1.0013 0.63 22.69 0.698404681 698.4046809
Phoenix below 1 1.0542 0.589 35.08 0.983158429 983.1584291
C Falls above 1 1.021 1.405 2.221 0.087762565 87.76256484
C Falls top 1 1.0756 0.778 36.28 1.467892983 1467.892983
C Falls middle1 1.053 6.601 0.992 0.041732677 41.73267692
C Falls below 1 1.0422 0.073 43.58 1.597042666 1597.042666
Delaware above 1.07 1.128 5.774 0.195658196 195.6581957
Delaware side 1.019 0.793 9.284 0.369532355 369.5323549
Delaware below 1.0262 0.606 1.82 0.069874379 69.87437926
Delaware 1 1.0778 0.548 44.56 1.667667716 1667.667716
Phoenix E shaft 1 1.0402 0.139 95.19 2.84317211 2843.17211
Cliff below 1.0152 0.023 96.51 2.774548422 2774.548422
EP WPS 1.014 8.774 0.694 0.027978142 27.97814167
EP SS 1.093 7.765 0.327 0.013652654 13.65265389
EP RDS 0.847 4.212 0.539 0.013738981 13.73898103
EP CS 1.026 2.067 0.332 0.013035554 13.03555404
EP WDS 1.041 3.975 0.386 0.015593607 15.59360657
EP CED PARK 1.012 6.844 0.484 0.01351929 13.51929019
EP OPEN OFF
TR 1.013 11.02 0.317 0.013038518 13.03851786
EP YBS 1.005 7.902 0.347 0.012372201 12.37220074
EP FS 1.086 2.644 0.745 0.022499755 22.49975495
EP SMS 1.010 7.886 0.474 0.018610013 18.61001326
A1 1.066 1.636 0.241 0.006360053 6.360052641
A2 1.061 2.905 0.247 0.006957822 6.957822199
B1 1.052 8.469 0.335 0.008083439 8.08343949
F1 1.015 6.804 0.276 0.010190213 10.19021267
F2 1.098 5.36 0.667 0.026314839 26.31483938
C1 1.028 1.926 0.299 0.012182767 12.18276663
C2 Out 1.057 8.767 0.451 0.018269041 18.26904144
C2 WF 1.032 1.271 0.309 0.013138548 13.13854826
D2 1.012 7.775 0.384 0.010754391 10.75439099
D1 0.100 5.602 0.379 0.072122717 72.12271657
E1 0.238 7.188 0.43 0.061003221 61.00322119
17
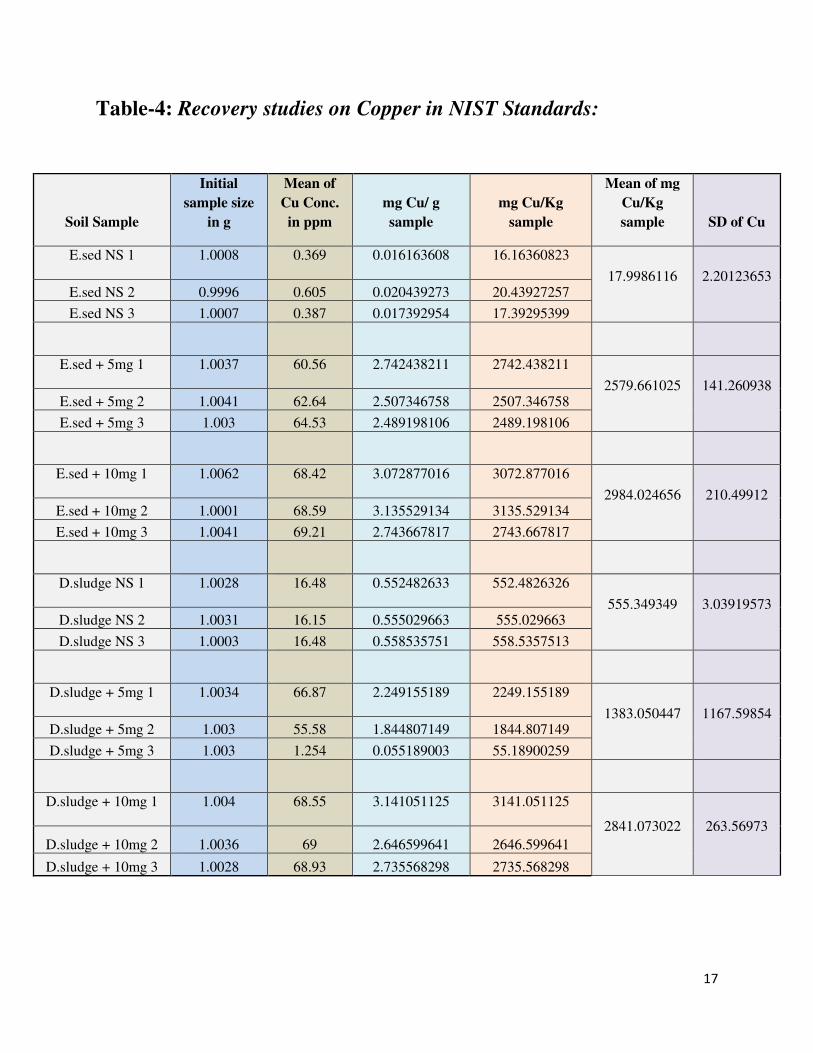
Table-4: Recovery studies on Copper in NIST Standards:
Soil Sample
Initial
sample size
in g
Mean of
Cu Conc.
in ppm
mg Cu/ g
sample
mg Cu/Kg
sample
Mean of mg
Cu/Kg
sample SD of Cu
E.sed NS 1 1.0008 0.369 0.016163608 16.16360823
17.9986116 2.20123653 E.sed NS 2 0.9996 0.605 0.020439273 20.43927257
E.sed NS 3 1.0007 0.387 0.017392954 17.39295399
E.sed + 5mg 1 1.0037 60.56 2.742438211 2742.438211
2579.661025 141.260938 E.sed + 5mg 2 1.0041 62.64 2.507346758 2507.346758
E.sed + 5mg 3 1.003 64.53 2.489198106 2489.198106
E.sed + 10mg 1 1.0062 68.42 3.072877016 3072.877016
2984.024656 210.49912 E.sed + 10mg 2 1.0001 68.59 3.135529134 3135.529134
E.sed + 10mg 3 1.0041 69.21 2.743667817 2743.667817
D.sludge NS 1 1.0028 16.48 0.552482633 552.4826326
555.349349 3.03919573 D.sludge NS 2 1.0031 16.15 0.555029663 555.029663
D.sludge NS 3 1.0003 16.48 0.558535751 558.5357513
D.sludge + 5mg 1 1.0034 66.87 2.249155189 2249.155189
1383.050447 1167.59854 D.sludge + 5mg 2 1.003 55.58 1.844807149 1844.807149
D.sludge + 5mg 3 1.003 1.254 0.055189003 55.18900259
D.sludge + 10mg 1 1.004 68.55 3.141051125 3141.051125
2841.073022 263.56973
D.sludge + 10mg 2 1.0036 69 2.646599641 2646.599641
D.sludge + 10mg 3 1.0028 68.93 2.735568298 2735.568298
18
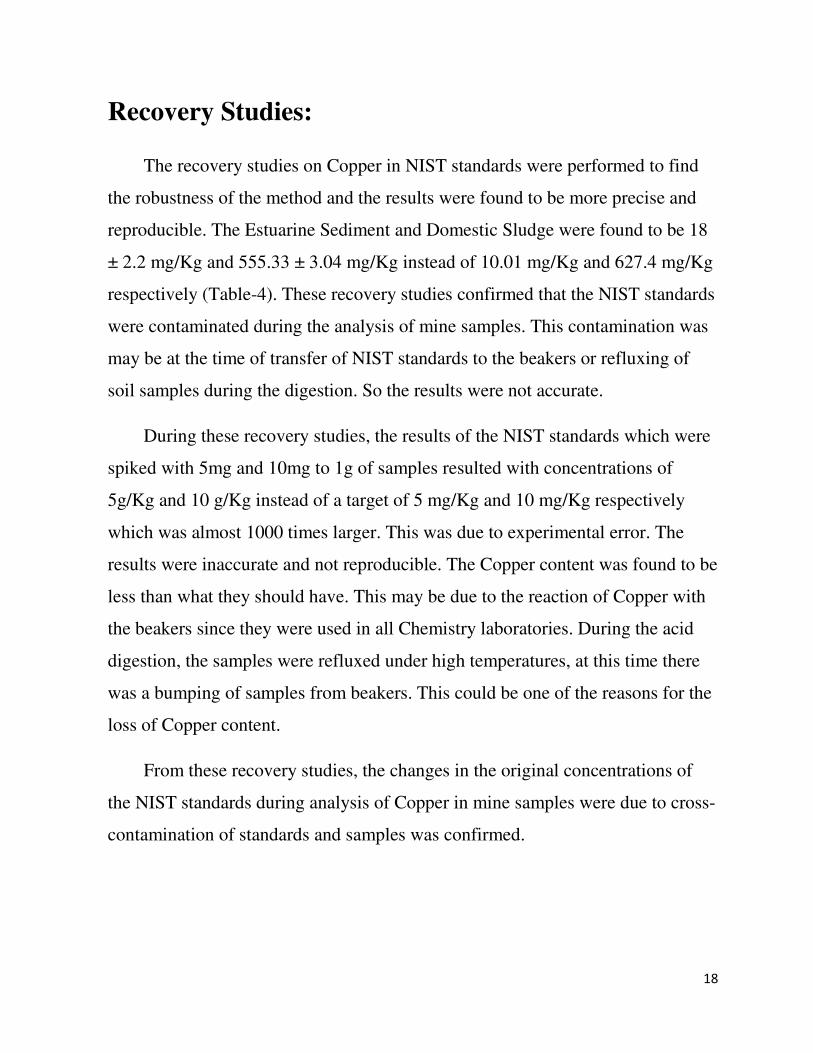
Recovery Studies:
The recovery studies on Copper in NIST standards were performed to find
the robustness of the method and the results were found to be more precise and
reproducible. The Estuarine Sediment and Domestic Sludge were found to be 18
± 2.2 mg/Kg and 555.33 ± 3.04 mg/Kg instead of 10.01 mg/Kg and 627.4 mg/Kg
respectively (Table-4). These recovery studies confirmed that the NIST standards
were contaminated during the analysis of mine samples. This contamination was
may be at the time of transfer of NIST standards to the beakers or refluxing of
soil samples during the digestion. So the results were not accurate.
During these recovery studies, the results of the NIST standards which were
spiked with 5mg and 10mg to 1g of samples resulted with concentrations of
5g/Kg and 10 g/Kg instead of a target of 5 mg/Kg and 10 mg/Kg respectively
which was almost 1000 times larger. This was due to experimental error. The
results were inaccurate and not reproducible. The Copper content was found to be
less than what they should have. This may be due to the reaction of Copper with
the beakers since they were used in all Chemistry laboratories. During the acid
digestion, the samples were refluxed under high temperatures, at this time there
was a bumping of samples from beakers. This could be one of the reasons for the
loss of Copper content.
From these recovery studies, the changes in the original concentrations of
the NIST standards during analysis of Copper in mine samples were due to cross-
contamination of standards and samples was confirmed.

19
Conclusion:
The FAAS (Perkin Elmer AAnalyst 800) used was effective in the determination
of Copper in mine samples [5]. The results were more precise and reproducible.
In case of sample pretreatment, acid digestion was most useful approach in the
destruction of the matrix [1]. The Nitric acid was used for the acidification of soil
samples, and the Hydrogen peroxide was used for oxidation of organic matter
[13].
The working range for the Cu was 0.1 ppm to 5 ppm and the mine samples with
high copper concentration can be diluted and reanalyzed. The method developed
for Copper was optimized in such a way that the working conditions can be
applied to other trace metals determined under FAAS [2].
Recommendations for future studies:
The recovery studies on Copper in the NIST standards can be done using correct
spike. Use of digester during the acid digestion would reduce the loss of sample
caused by bumping.
References:
[1] Sardans. (2009). Determination of As, Cd, Cu, Hg and Pb in biological
samples by modern electrothermal atomic absorption spectrometry. 97-112.
20
[2] Török. (2009). A study of the direct determination of Cd, Cr, Cu, Pb and Zn
in certified reference materials of soils by solid sampling electrothermal atomic
absorption spectrometry. 93-97.
[3] Haroun. (2008). Analysis of heavy metals during composting of the tannery
sludge using physicochemical and spectroscopic techniques. 111-119.
[4] Hödrejärv. (1999). Pseudo-total analysis for metallic elements in siliceous soil
by acid digestion and flame atomic absorption spectrometry. 293-301.
[5] Ghaedi. (2007). Cloud point extraction for the determination of copper, nickel
and cobalt ions in environmental samples by flame atomic absorption
spectrometry. 533-540.
[6] Duran. (2008). Simultaneous preconcentration of co(ii), ni(ii), cu(ii), and cd(ii)
from environmental samples on amberlite xad-2000 column and determination by
faas. 292-299.
[7] (n.d.). Retrieved from
http://www.epa.gov/osw/hazard/testmethods/sw846/pdfs/3050b.pdf
[8] (n.d.). Retrieved from http://www.perkinelmer.com/CMSResources/Images/44-
74392BRO_AAnalyst600800.pdf
[9] (n.d.). Retrieved from
http://webs.wofford.edu/splawnbg/Chem_411_files/Atomic Absorption
Spectroscopy- Analysis of Copper in Vitamins.pdf
[10] (n.d.). Retrieved from
http://www.uaa.alaska.edu/enri/labs/aset_lab/Methods/upload/ASET-sediment-
soil-sludges-extracts-following-EPA-3050b.pdf
[11] (n.d.). Retrieved from https://www-
s.nist.gov/srmors/view_detail.cfm?srm=1646a
[12] (n.d.). Retrieved from https://www-
s.nist.gov/srmors/view_detail.cfm?srm=2781

21
[13] (n.d.). Retrieved from
https://fortress.wa.gov/ecy/publications/publications/0803119.pdf
[14] (n.d.). Retrieved from http://www.mbanetbook.co.in/2010/05/sample-project-
report-acknowledgement.html


![Determination of Copper Content in Drinking Water by Using AAS[1] Rev 1](https://img.dokumen.tips/doc/110x75/577cdf1e1a28ab9e78b086f4/determination-of-copper-content-in-drinking-water-by-using-aas1-rev-1.jpg)
![Rapid determination of copper in copper ores - [email protected]](https://img.dokumen.tips/doc/110x75/620632ce8c2f7b1730055639/rapid-determination-of-copper-in-copper-ores-emailprotected.jpg)