Embed Size (px)
Citation preview

Quality Assurance Guidance Document 2.12
Monitoring PM2.5 in Ambient Air Using Designated Reference or Class I Equivalent Methods

Page Intentionally Left Blank
EPA-454/B-16-001
January 2016
Quality Assurance Guidance Document 2.12
Monitoring PM2.5 in Ambient Air Using Designated Reference or Class I Equivalent Methods
U.S. Environmental Protection Agency Office of Air Quality Planning and Standards
Air Quality Assessment Division RTP, NC 27711
January 2016
Disclaimer
The statements in this document, with the exception of referenced requirements, are intended solely as guidance. This document is not intended, nor can it be relied upon, to create any rights enforceable by any party in litigation with the United States. EPA may decide to follow the guidance provided in this document, or to act at variance with the guidance based on its analysis of the specific facts presented. This guidance may be revised without public notice to reflect changes in EPA’s approach to implementing 40 CFR Part 50, Appendix L and 40 CFR Part 58, Appendices A and B.
Mention of commercial products or trade names should not be interpreted as endorsement. Some types of instruments currently in use may be described in text or in example figures or tables. Sometimes these products are given as a typical and perhaps well-known example of the general class of instruments. Other instruments in the class are available and may be fully acceptable.
2.12. Table of Contents January 2016 Page ii
Method 2.12–PM2.5 Reference/Class I Equivalent Methods
Table of Contents
Section Page
Disclaimer ................................................................................................................ i List of Figures ....................................................................................................... vii List of Tables ......................................................................................................... viii List of Acronyms and Abbreviations ...................................................................... ix
1.0 Scope and Applicability .................................................................................. 1 of 61.1 Overview and Purpose ......................................................................................1 1.2 Applicability .....................................................................................................1 1.3 Conventions ......................................................................................................2 1.4 Format and Structure ........................................................................................2 1.5 Overview of Reference and Equivalent Methods for PM2.5 .............................3
1.5.1 Reference Methods ...............................................................................3 1.5.2 Equivalent Methods ..............................................................................4
1.6 Limitations of PM2.5 Reference and Class I Equivalent Methods ....................5
2.0 Prerequisites ..................................................................................................... 1 of 82.1 Overview and Definitions ................................................................................1 2.2 Personnel Qualifications ...................................................................................1
2.2.1 Laboratory Personnel Qualifications ....................................................1 2.2.2 Field Personnel Qualifications .............................................................6 2.2.3 Training for Laboratory and Field Personnel .......................................6
2.3 Health and Safety Warnings .............................................................................7 2.4 Cautions ............................................................................................................8
3.0 Summary .......................................................................................................... 1 of 53.1 Overview ..........................................................................................................1 3.2 Illustrations of Sampler Inlet Components and Sample
Flow Paths ........................................................................................................2 3.3 Summary of Field and Laboratory QC Checks ................................................3 3.4 Summary of Sampling Procedures for PM2.5 ...................................................3
4.0 Procurement of Equipment and Supplies ................................................... 1 of 104.1 Overview ..........................................................................................................1 4.2 Procurement Prerequisites—Field Operations .................................................2
4.2.1 Reference or Equivalent Method Sampler ...........................................2 4.2.2 Calibration Equipment .........................................................................4 4.2.3 Flow Verification Check Device ..........................................................4 4.2.4 Audit Equipment ..................................................................................5
4.3 Procurement Prerequisites—Laboratory Operations ........................................5 4.3.1 Filter Media ..........................................................................................5 4.3.2 Filter Support Cassettes ........................................................................7 4.3.3 Filter Cassette Protective Containers ...................................................7

2.12. Table of Contents January 2016 Page iii
Method 2.12–PM2.5 Reference/Class I Equivalent Methods
Table of Contents (continued)
4.3.4 Insulated Shipping Container ...............................................................8 4.3.5 Filter Handling Containers ...................................................................8 4.3.6 Analytical Microbalance ......................................................................8 4.3.7 Calibration Reference Standards ..........................................................9 4.3.8 Temperature and Relative Humidity Logger ......................................10 4.3.9 Audit Equipment ................................................................................10
5.0 Field Installation .............................................................................................. 1 of 4 5.1 Siting Requirements .........................................................................................1
5.1.1 Spatial and Temporal Scales of Site .....................................................1 5.1.2 Sampler Location .................................................................................1 5.1.3 Safety ....................................................................................................2 5.1.4 Electrical Considerations ......................................................................2 5.1.5 Security .................................................................................................2
5.2 Sampler Installation Procedures .......................................................................2 5.2.1 Receipt of Sampler ...............................................................................2 5.2.2 Initial Evaluation of Samplers ..............................................................3 5.2.3 Setup at Sampling Site .........................................................................3 5.2.4 Field Evaluation ...................................................................................4
6.0 Calibration Procedures ................................................................................. 1 of 186.1 Overview ..........................................................................................................1 6.2 General Aspects of Flow Rate Measurement and PM2.5
Sampler Calibration ..........................................................................................3 6.3 Calibration of the Sampler Flow Rate Measurement
System ..............................................................................................................4 6.3.1 General Requirements and Guidance ...................................................5 6.3.2 Flow Rate Calibration Standards ..........................................................7 6.3.3 NIST Traceability and Certification of Flow Rate Standards ..............8 6.3.4 Outline of Generic Flow Rate Calibration Procedure ..........................9
6.4 Calibration of Sampler Temperature Sensors ................................................10 6.4.1 General Requirements and Guidance .................................................10 6.4.2 Temperature Calibration Standards ....................................................11 6.4.3 NIST Traceability and Certification of Temperature Standards ........12 6.4.4 Outline of Generic Temperature Calibration Procedure ....................12
6.5 Calibration of Sampler Barometric Pressure Sensor ......................................14 6.5.1 General Requirements ........................................................................14 6.5.2 Outline of Generic BP Calibration Procedures ..................................14
6.5.2.1 Digital Pressure Indicator ..................................................15 6.5.2.2 Fortin-Type Barometer Readings ......................................16 6.5.2.3 Aneroid-Type Barometer ...................................................16
6.6 Leak Checks ...................................................................................................16 6.7 Verification/Calibration Frequency ................................................................16

2.12. Table of Contents January 2016 Page iv
Method 2.12–PM2.5 Reference/Class I Equivalent Methods
Table of Contents (continued)
7.0 Field Operation .............................................................................................. 1 of 177.1 Overview ..........................................................................................................1 7.2 Activities to Perform Each Site Visit ...............................................................1
7.2.1 Beginning a Run ...................................................................................2 7.2.2 Ending a Run ........................................................................................5 7.2.3 Sample Validation ................................................................................8 7.2.4. Sample Handling ..................................................................................9
7.2.4.1 Handling a Valid Sample .....................................................9 7.2.4.2 Handling a Questionable Sample .......................................10
7.3 Activities to Perform Every Five Operating Days .........................................10 7.3.1 Impactor Well Cleaning .....................................................................10
7.4 Activities to Perform Every Four Weeks .......................................................10 7.4.1 VSCC™ Cleaning ..............................................................................11 7.4.2 Field Quality Control Equipment and Standards ...............................11 7.4.3 External Check. ..................................................................................11 7.4.4 Internal Filter Bypass Leak Check. ....................................................14 7.4.5 Procedure for Temperature Verification Check. ................................14 7.4.6 Procedure for Barometric Pressure Verification Check .....................15 7.4.7 Procedure for Field Flow Rate Verification Check ............................16
8.0 Sampler Maintenance ..................................................................................... 1 of 68.1 Overview ..........................................................................................................1 8.2 Five-Day Maintenance Procedures ..................................................................2
8.2.1 Water Collector ....................................................................................2 8.2.2 WINS Impactor Well ............................................................................2
8.3 Monthly Maintenance Procedures ....................................................................3 8.3.1 Inlet .......................................................................................................3 8.3.2 WINS Impactor Housing and Well ......................................................4 8.3.3 Cleaning of VSCC™ Type PM2.5 Separators .....................................4 8.3.4 Other .....................................................................................................5
8.4 Quarterly Maintenance .....................................................................................5 8.4.1 Downtube .............................................................................................5 8.4.2 Impactor ................................................................................................5 8.4.3 Other .....................................................................................................6
8.5 Other Periodic Maintenance .............................................................................6 8.6 Refurbishing PM2.5 Samplers ...........................................................................6
9.0 Gravimetric Laboratory Design and Setup ................................................ 1 of 149.1 Overview ..........................................................................................................1 9.2 Weighing Room ...............................................................................................1 9.3 Microbalance ....................................................................................................3 9.4 Logging System ................................................................................................4
2.12. Table of Contents January 2016 Page v
Method 2.12–PM2.5 Reference/Class I Equivalent Methods
Table of Contents (continued)
9.5 Data Management System ................................................................................6 9.6 Static Neutralization .........................................................................................7 9.7 Mass Reference Standards ................................................................................9
9.7.1 Certification Procedures-Primary Standard ..........................................9 9.7.2 Certification Procedures- Working Standard .....................................11
10.0 Filter Preparation and Analysis ................................................................... 1 of 23 10.1 Overview ..........................................................................................................1 10.2 Filter Handling .................................................................................................1 10.3 Filter Integrity Check .......................................................................................2 10.4 Filter Conditioning ...........................................................................................3 10.5 Quality Control Blanks .....................................................................................9 10.6 Pre-Sampling Filter Weighing (Tare Weight) ................................................14 10.7 Post-Sampling Documentation and Inspection ..............................................18 10.8 Post-Sampling Filter Weighing (Gross Weight) ............................................20 10.9 Calculation of Net Mass Filter Loading .........................................................21 10.10 Internal Quality Control ................................................................................22 10.11 Filter Archive Requirements .........................................................................22
11.0 Performance Evaluation Procedures ........................................................... 1 of 1511.1 Overview ..........................................................................................................1 11.2 Performance Evaluations ..................................................................................2
11.2.1 Sampler Flow Rate Audit .....................................................................3 11.2.1.1 Flow Rate Audit Data Calculations .....................................5
11.2.2 Temperature Audit Procedure ..............................................................5 11.2.3 Barometric Pressure Audit Procedures .................................................7 11.2.4 Time Audit ...........................................................................................7 11.2.5 Assessment of Precision Using Collocated Measurements ...................7
11.2.5.1 Procedure for Collocated Measurements .............................7 11.2.6 Federal Reference Method Performance Evaluation ............................8 11.2.7 Balance Accuracy Assessment .............................................................9 11.2.8 Temperature and Relative Humidity Logger Audit Procedure ............9
11.3 Systems Audits ...............................................................................................10
12.0 Calculations, Validations, and Reporting of PM2.5 Monitoring Data ................................................................................................................... 1 of 712.1 Overview ..........................................................................................................1 12.2 Calculations ......................................................................................................1
12.2.1 Sample Volume Calculations ...............................................................1 12.2.2 Net PM2.5 Mass Calculation .................................................................2 12.2.3 PM2.5 Concentration Calculation ..........................................................2
12.3 Verification of Manual Calculations and Data Entry .......................................3 12.3.1 Verification of Manual Calculations ....................................................3
2.12. Table of Contents January 2016 Page vi
Method 2.12–PM2.5 Reference/Class I Equivalent Methods
Table of Contents (continued)
12.3.2 Verification of Manual Data Entry .......................................................3 12.4 Validation . . . . . . . . . . . . . . . . . . . . . . . . . . . . . . . . . . . . . . . . . . . . . . . . . . . .. 4
12.4.1 Data Validation ..................................................................................4 12.4.2 Validation of Software Used to Process PM2.5 Data .........................6
12.5 Data Reporting .................................................................................................7 12.5.1 Rounding ..............................................................................................7 12.5.2 Rounding Rules for Comparison with NAAQS ...................................7
13.0 Data and Records Management ..................................................................... 1 of 613.1 Overview ..........................................................................................................1 13.2 Methodology for Data and Records Management ...........................................1 13.3 PM2.5 Records to Create and Retain .................................................................2
13.3.1 Sampler Siting and Maintenance Records ............................................2 13.3.2 Analytical Laboratory Installation Records .........................................3 13.3.3 Field Sampling Operation Records ......................................................3 13.3.4 Weighing Laboratory Operation Records ............................................3 13.3.5 Quality Assurance Records ..................................................................4
13.4 Data Reporting Requirements ..........................................................................4
14.0 Assessment of Measurement Uncertainty for Monitoring Data ................. 1 of 614.1 Overview ..........................................................................................................1 14.2 Flow Rate Audits ..............................................................................................1 14.3 Bias Assessment ...............................................................................................2 14.4 Precision ...........................................................................................................3
14.4.1 Overview ..............................................................................................3 14.4.2 Number of Collocated Samplers Required ...........................................4 14.4.3 Location of Collocated Samplers .........................................................5 14.4.4 Schedule of Operation of Collocated Samplers ...................................6
15.0 References ........................................................................................................ 1 of 3
Appendix A—Measuring Alkalinity of Filters ................................................................ 1 of 12
2.12. List of Figures and Tables January 2016 Page vii
2.12–PM2.5 Reference/Class I Equivalent Methods
List of Figures
Number Page
3.1 PM2.5 inlet head ............................................................................................................. 2 of 53.2 Air flow through the PM2.5 impactor well and filter holder .......................................... 2 of 5 3.3 Example of a very sharp cut cyclone ............................................................................. 2 of 5
4.1 Example procurement log ............................................................................................ 2 of 104.2 Example Equipment for transporting filter cassettes ................................................... 7 of 10
6.1 Example Calibration Work Sheet .............................................................................. 18 of 18
7.1 Example of a PM2.5 field data sheet ............................................................................. 4 of 17 7.2 Example of a filter chain-of-custody ........................................................................... 7 of 17 7.3 PM2.5 field QC and maintenance form ....................................................................... 13 of 17
8.1 Cross-sectional view of a PM10 sampler inlet head ....................................................... 3 of 6 8.2 Cross-sectional view of design of a PM2.5 impactor well and filter holder ................... 4 of 6
9.1 Grounding screw on microbalance .............................................................................. 4 of 14 9.2 Example of environmental logging software displaying both summary statistics and a time series graph.................................................................................. 5 of 14 9.3 Second example of environmental logging software display ...................................... 6 of 14 9.4 210-Po anti-static strips and gooseneck holder ........................................................... 8 of 14 9.5 U-electrode (ionizer) .................................................................................................. 8 of 14 9.6 Example calibration certificate for a mass reference standard ................................. 11 of 14
10.1 Filters equilibrating on conditioning trays ................................................................... 4 of 23 10.2 Relative humidity scenarios ....................................................................................... 6 of 2310.3 Laboratory relative humidity conditions during a quarter ........................................... 8 of 23 10.4 Lab blank control chart .............................................................................................. 11 of 23 10.5 Example laboratory data form ................................................................................... 13 of 23 10.6 Filter sample holding time decision flowchart .......................................................... 19 of 23
11.1 PM2.5 Sample audit data sheet ...................................................................................... 6 of 15 11.2 Temperature and humidity verification form ............................................................ 10 of 15 11.3 PM2.5 Auditing checklist .......................................................................................... 12 of 15

2.12. List of Figures and Tables January 2016 Page viii
2.12–PM2.5 Reference/Class I Equivalent Methods
List of Tables Number Page
2-1 Definitions of Key Terms .............................................................................................. 2 of 8
4-1 Acceptance Checks and Limits for Procurement of Equipment and Supplies ............ 3 of 10 4-2 Tolerance Specifications for Mass Reference Standards ............................................. 9 of 10
6-1 Calibration and Verification Check Intervals ............................................................ 17 of 18
7-1 Sampling Procedure Checks ........................................................................................ 3 of 17
8-1 Summary of PM2.5 Sampler Maintenance Items ............................................................ 2 of 6
9-1 Filter Preparation and Analysis Checks ..................................................................... 13 of 14
11-1 Systems and Performance Evaluation Components for Manual Method PM2.5 Samplers ............................................................................................................ 1 of 15
12-1 Formulas for Calculations Associated with PM2.5 Monitoring ...................................... 1 of 7
13-1 Summary of Information to be Provided by Sampler .................................................... 5 of 6
14-1 Example of Collocated Sampler Requirements ............................................................. 5 of 6 14-2 Summary of PM2.5 Number and Type of Collocation ................................................... 5 of 6

2.12. Acronyms and Abbreviations January 2016 Page ix
2.12–PM2.5 Reference/Class I Equivalent Methods
List of Acronyms and Abbreviations
AQS Air Quality SystemANSI American National Standards Institute ASQC American Society for Quality Control ASTM American Society for Testing and Materials CFR Code of Federal Regulations CV coefficient of variation DMS data management system DOP dioctylphthalateDQO data quality objectiveEPA Environmental Protection Agency FEM Federal Equivalent Method FR flow rateFRM Federal Reference MethodHEPA high-efficiency particulate air NAAQS National Ambient Air Quality Standards NELAC National Environmental Laboratory Accreditation Conference NIST National Institute of Standards and Technology NVLAP National Voluntary Laboratory Accreditation Program OAQPS Office of Air Quality Planning and Standards Pa pressure, ambient PAMS Photochemical Assessment Monitoring Stations PM10 particulate matter 10 micrometers ( m) PM2.5 particulate matter 2.5 micrometers ( m) PMP polymethylpentene210Po polonium-210PQAO Primary Quality Assurance Organization PSD prevention of significant deterioration PTFE polytetrafluoroethyleneQA/QC quality assurance/quality control QA quality assuranceQS Quality StaffQAPP quality assurance project plan QC quality controlRH relative humiditySCC sharp cut cycloneSLAMS State and local air monitoring stations SLT State, Local, Tribal monitoring agency SOP standard operating procedure SRM Standard reference material SVOC semivolatile organic compoundTa temperature, ambientTSP total suspended particulate VSCC™ very sharp cut cyclone WINS well impactor ninety-six
2.12.1.0 Scope and Applicability January 2016 Page 1 of 6
2.12–PM2.5 Reference/Class I Equivalent Methods
1.0 Scope and Applicability 1.1 Overview and Purpose This document is intended to provide additional guidance to assist personnel using reference methods or Class I equivalent methods to monitor ambient air for particles with an aerodynamic diameter nominally equal to or less than 2.5 micrometers ( m), known as PM2.5. The formal specifications for PM2.5 reference method samplers and reference method measurements are set forth in the U.S. Environmental Protection Agency’s (EPA’s) monitoring regulations – 40 Code of Federal Regulations (CFR) Part 50, Appendix L (EPA 1997a).* The regulations governing the sampling and analytical methods must be followed. This document reviews those formal requirements and provides clarifications and supplemental information in greater detail than can be provided in the formal regulatory requirements. Because this supplemental information is intended for method users, it emphasizes the operational aspects of the method, rather than the design and performance specifications for the sampler. This document also provides recommended quality assurance (QA) procedures and guidance to help monitoring agencies reliably achieve the data quality objectives (DQOs) established for PM2.5 monitoring. The goal for acceptable measurement uncertainty has been defined as 10 percent coefficient of variation (CV) for total precision and ±10 percent for total bias (Papp et al., 1998). The information provided here, together with instruction manuals and technical bulletins provided by the manufacturer of the selected PM2.5 sampler, should be used by each monitoring organization to develop its own agency-specific quality assurance project plan (QAPP) and standard operating procedures (SOP) to govern its individual PM2.5 monitoring activity.
1.2 Applicability This document is primarily applicable to PM2.5 ambient air monitoring with reference methods carried out by State, Local or Tribal (SLT) air monitoring agencies in their State and local air monitoring stations (SLAMS) air surveillance networks under the air monitoring requirements of 40 CFR Part 58. The document is also applicable to other organizations required to carry out SLAMS or SLAMS-related PM2.5 monitoring and to any PM2.5 monitoring activity for which the PM2.5 reference method measurements will be entered into the Air Quality System (AQS) database. The recommendations and guidance in this document—to the extent that they go beyond the specific regulatory requirements set forth in the method or in the sampler-specific requirements contained in a particular sampler’s operation or instruction manual—are not mandatory or binding. In addition to this information, it is suggested that monitoring organizations that are implementing gravimetric laboratories consider the requirements and guidance in the 2003 National Environmental Laboratory Accreditation Conference (NELAC) Standard. Although gravimetric labs are not required to be NELAC certified, following standard laboratory procedures described in this document will help ensure the quality and defensibility of data. Monitoring agencies are encouraged to consider and adopt these recommendations and
* The 1998 version of this document provided a section for references. Section 15 will continue to include the references from the 1998 version. Newer references will be included as footnotes to sections and URLs where the information can be found.

2.12.1.0 Scope and Applicability January 2016 Page 2 of 6
2.12–PM2.5 Reference/Class I Equivalent Methods
guidance to help ensure that monitoring data are of acceptable quality. If the monitoring organization does not adopt this guidance, it needs to identify and adopt a method considered acceptable by the EPA Regions or the QAPP/SOP-approving authority as an acceptable alternative to the method and quality assurance requirements described in this document. This document is not a full description of a PM2.5 monitoring method and does not substitute for the formal method description as set forth in the PM2.5 reference method (EPA 1997a), or for the sampler-specific requirements contained in the associated operation or instruction manual, which is an official part of each designated reference or equivalent method for PM2.5. Agencies’ QAPPs and SOPs must meet all applicable Part 50 and 58 requirements for PM2.5. In addition to these requirements, the monitoring organization will be held accountable to the criteria documented in their approved QAPPs and SOPs.
1.3 Conventions Where this document refers to mandatory method requirements, the terms “shall” and “must” are used, and a supporting reference to the applicable section of the reference method regulation or QA requirements is provided. Use of the word “should” indicates an activity or procedure that is recommended to help achieve a high level of measurement data quality but is not formally required by the method itself. Finally, the word “may” is used to indicate activities or suggestions that are optional or discretionary. The use of these terms is generally consistent with American National Standards Institute/American Society for Quality Control (ANSI/ASQC) E4-20141 guidance.
1.4 Format and Structure
The organization of the document is intended to align more closely with the organizational structure and topics of SOPs recommended by EPA’s Quality Staff (QS) in its G-6 guidance2. This closer alignment will help monitoring agencies use this document to prepare their individual SOPs for PM2.5 monitoring. It should be clearly understood, however, that this document is not a ready-made, generic SOP and that it needs to be adapted and tailored specifically to each monitoring organization’s individual policies and circumstances.
Quality Control (QC) Acceptance Criteria
The QA acceptance criteria in this document is current as of the date of publication. However, as new methods are developed and data quality evaluations take place in the future, the QC requirements may change. This document may not be simultaneously updated to reflect the changes that have occurred. However, EPA has developed a validation template for the PM2.5 program which contains all the QA/QC criteria found in this document. The validation template will be the definitive set of QA requirements and will be regularly updated and posted on the EPA’s Ambient Monitoring Technology Information Center (AMTIC) website3. Monitoring
1 http://asq.org/index.aspx search for E-4 2 http://www.epa.gov/quality/qa_docs.html 3 http://www3.epa.gov/ttn/amtic/qapollutant.html

2.12.1.0 Scope and Applicability January 2016 Page 3 of 6
2.12–PM2.5 Reference/Class I Equivalent Methods
organizations should ensure that the acceptance criteria used is reflective of the requirements posted on AMTIC. Each table in this document will provide a footnote to this effect. References The initial 1998 document included references in the text which were then listed in Section 14. While those references remain and continue to be listed in Section 15 of this document, newer references are footnoted and URLs provided to direct the reader to a website where the referenced information can be found. 1.5 Overview of Reference and Equivalent Methods for PM2.5 A “method” for PM2.5 generally consists of the following:
A PM2.5 sampler or analyzer, designed, built and sold by a particular manufacturer
An operation or instruction manual provided by the instrument manufacturer that
describes the proper use and operation of the sampler or analyzer
A laboratory that can meet the provisions of Appendix L
The other operational and quality assurance requirements necessary to obtain reliable PM2.5 concentration measurements.
Methods used for monitoring PM2.5 in SLAMS or SLAMS-related air monitoring networks are required to be either reference or equivalent methods, as designated by EPA under the requirements and provisions of 40 CFR Part 53. For most SLAMS purposes, reference and equivalent methods may be used interchangeably, and a particular method’s identity as either a reference method or an equivalent method is irrelevant. However, for some purposes, such as collocation for QA purposes, a reference method may be specifically required. A current publication, List of Designated Reference and Equivalent Methods, identifying all methods that have been designated as reference or equivalent methods by EPA, is available online at the U.S. EPA’s AMTIC web site4. It can also be requested from any EPA Regional Office or by writing to Department E (MD-46), U.S. Environmental Protection Agency, Research Triangle Park, NC 27711. 1.5.1 Reference Methods All formal sampler design and performance requirements and the operational requirements applicable to reference methods for PM2.5 are specified in Appendix L of 40 CFR Part 50. These requirements are very specific and include explicit design specifications for the type of sampler, the type of filter, the sample flow rate, and the construction of the sampler’s collecting components. However, various designs for the flow rate control system, the filter holder, the
4 http://www.epa.gov/ttn/amtic/files/ambient/criteria/reference-equivalent-methods-list.pdf .

2.12.1.0 Scope and Applicability January 2016 Page 4 of 6
2.12–PM2.5 Reference/Class I Equivalent Methods
operator interface controls, and the exterior housing are possible. Hence, various reference method samplers from different manufacturers may vary considerably in appearance and operation. Also, a reference method may have a single filter capability (single channel sampler) or a multi-filter capability (sequential sampler). A PM2.5 method is not a reference method until it has been demonstrated to meet all the reference method regulatory requirements and has been officially designated by EPA as a reference method for PM2.5.
1.5.2 Equivalent Methods Equivalent methods for PM2.5 have much wider latitude in their design, configuration, and operating principles than reference methods. These methods are not required to be based on filter collection of PM2.5; therefore, continuous or semi-continuous analyzers and new types of PM2.5 measurement technologies are not precluded as possible equivalent methods. Equivalent methods are not necessarily required to meet all the requirements specified for reference methods, but they must demonstrate both comparability to reference method measurements and similar PM2.5 measurement precision. The requirements that some (but not all) candidate methods must meet to be designated by EPA as equivalent methods are specified in 40 CFR Part 53. To minimize the difficulty of meeting equivalent method designation requirements, three classes of equivalent methods have been established in the 40 CFR Part 53 regulations, based on the degree to which a candidate method deviates from the reference method requirements. All three classes of equivalent methods are acceptable for SLAMS or SLAMS-related PM2.5 monitoring, but not all types of equivalent methods may be equally suited to specific PM2.5 monitoring requirements or applications.
Class I Class I equivalent methods are very similar to reference methods, with only minor deviations, and must meet nearly all of the reference method specifications and requirements. The require-ments for designation as Class I equivalent methods are only slightly more extensive than the designation requirements for reference methods. Also, because of their substantial similarity to reference methods, Class I equivalent methods operate very much the same as reference methods, and most of the information and guidance in this document is applicable to Class I equivalent methods. Class II Class II equivalent methods are filter collection-based methods that differ more substantially from the reference method requirements. The requirements for designation as Class II methods may be considerably more extensive than for reference or Class I equivalent methods, depending on the specific nature of the variance from the reference method requirements. The information and guidance in this document may be only partially applicable to Class II equivalent methods. The operation or instruction manual associated with Class II equivalent methods will, therefore, have to be more detailed in some areas than for reference or Class I equivalent methods to provide information and guidance not covered by this document.

2.12.1.0 Scope and Applicability January 2016 Page 5 of 6
2.12–PM2.5 Reference/Class I Equivalent Methods
Class III Class III equivalent methods cover any PM2.5 methods that cannot qualify as reference or Class I or II equivalent methods because of more profound differences from the reference method requirements. This class encompasses PM2.5 methods such as continuous or semi-continuous PM2.5 analyzers and potential new PM2.5 measurement technologies. The requirements for designation as Class III equivalent methods are the most extensive, and, because of the wide variety of PM2.5 measurement principles that could be employed for candidate Class III equivalent methods, the designation requirements are not explicitly provided in 40 CFR Part 53. For similar reasons, much of the information and guidance in this document may not be applicable to operation of Class III equivalent methods. 1.6 Limitations of PM2.5 Reference and Class I Equivalent Methods There are several conditions or effects that limit the degree to which a PM2.5 reference or Class I equivalent method can precisely determine the mass concentration of particulate matter in the atmosphere. Procedures to control such effects are discussed throughout this document. One limitation is maintaining the specified ambient air flow rate through the sampling inlet and filter assembly. The flow rate determines the size of the particles that are collected. The effects of this limitation are minimized by following sampler construction requirements and by employing procedures and checks to ensure the proper flow rate is maintained within close tolerances. Refer to Section 6.0, “Calibration Procedures,” and to Section 7.0, “Field Operation,” for guidance. Another important limitation involves changes in the weight of a collected sample due to mishandling, chemical reactions, and volatilization. Handling procedures, choice of filter media, humidity and temperature control of the filter (sample) during collection and subsequent processing, and promptness in weighing the sample following collection, all help control filter artifacts. The chemical makeup of PM2.5 particulate matter will vary with sampling location and source. Thus, the magnitude of PM2.5 weight changes due to chemical and physical processes will also vary with site location. Weight loss due to mechanical removal of particles from the filter is minimized by carefully removing the filter cassette assembly from the sampler and storing the filter/cassette in a protective container during transit to the weighing laboratory. Once the filter arrives at the laboratory, weight loss can be minimized by carefully removing the filter from the cassette, conditioning the filter, and weighing as soon as the filter conditioning is complete. Refer to Section 10.0, “Filter Preparation and Analysis.” The choice of an essentially non-reactive Teflon® media filter as the collecting surface minimizes the weight gain that occurs when sulfate-containing particles form by chemical reactions of sulfur dioxide gas at the surface of alkaline media (such as glass fiber filters). Appendix A to this document discusses this effect and includes a procedure for measuring the alkalinity of filters. If nitric acid vapor is present at a sampling location, it can deposit on a Teflon® filter and cause small weight gains in proportion to the amount of nitric acid present in the atmosphere (Lipfert 1994). This weight gain may not be controllable. Weight losses can occur due to thermal or chemical decomposition or evaporation of compounds like ammonium

2.12.1.0 Scope and Applicability January 2016 Page 6 of 6
2.12–PM2.5 Reference/Class I Equivalent Methods
nitrate (NH4NO3), which releases ammonia and nitric acid as gases. Semi-volatile organic compounds (SVOCs) may be part of the sample makeup; if so, they may evaporate and cause sample weight losses. Such weight losses are minimized or standardized by maintaining the sampler filter compartment’s temperature near ambient conditions during the sampling process, keeping the sample cool during transport to the laboratory, and promptly conditioning and weighing the sample following its receipt in the laboratory. Weight gain or loss due to absorption or desorption of water vapor on the filter or on the particulate matter is minimized by specifying low moisture pickup for manufactured filters and by conditioning the filters within specified humidity and temperature ranges, both before use and after receipt from the field. Refer to Section 10.0, “Filter Preparation and Analysis,” for further guidance.
Errors in the gravimetric analysis of samples can also result from the buildup of electrostatic charges on filters during their manufacture or during sampling (Engelbrecht et al., 1980). This static buildup will interfere with microbalance weighing, but it can be reduced by using static charge reduction techniques. Refer to Section 9.6, “Static Neutralization,” for further guidance.

2.12.2.0 Prerequisites January 2016 Page 1 of 8
2.12–PM2.5 Reference/Class I Equivalent Methods
2.0 Prerequisites
2.1 Overview and Definitions
The air pollutant known as PM2.5 is required by Federal law to be measured and reported on a nationwide basis. Regulations governing its measurement were effective September 16, 1997, and have been periodically updated.
This document provides a review of monitoring requirements and offers guidance on the collection of samples, the determination of the volume of air sampled, and the gravimetric determination of the amount of PM2.5 collected. From the data collected, the concentration of PM2.5 particles in the ambient air can be calculated and expressed as micrograms per cubic meter ( g/m3) of air. This document addresses procedures that apply mainly to reference and Class I equivalent methods for sampling PM2.5. An annotated listing of acronyms, abbreviations, specialized terms, and other expressions is given in Table 2-1 to familiarize the new user of PM2.5 samplers with key terms.
2.2 Personnel Qualifications
General aspects of personnel qualifications, training, and guidance are discussed in Section 4 of the Quality Assurance Handbook for Air Pollution Measurement Systems Volume II5(EPA 2013). SLAMS Primary Quality Assurance Organizations (PQAOs) or SLT agencies can use information from this source and specific information about PM2.5 sampling and analysis to develop a training program for their employees.
The responsibility for ensuring adequate training of personnel rests with the organization’s management and should be explained in general in the organization’s quality management plan (QMP) and specifically in quality assurance project plans (QAPPs). The organization’s Quality Assurance Coordinator (or equivalent) should be involved as well. He or she should stress to management the need for adequate training and recommend that employees be tested or examined to evaluate the success of training and identify where further emphasis is needed.
2.2.1 Laboratory Personnel Qualifications
All laboratory personnel should be familiar with clean room environmental laboratory procedures and techniques. Those who operate the microbalance in the laboratory need to be very conscientious and attentive to details in order to report complete and high-quality PM2.5 data. Persons involved with PM2.5 laboratory operations should be trained and certified to perform the following operations:
Use common methods to determine temperature, pressure, and relative humidity (RH) in the laboratory.
Use the microbalance and anti-static devices and information management technology.
5 http://www3.epa.gov/ttn/amtic/qalist.html

2.12.2.0 Prerequisites January 2016 Page 2 of 8
2.12–PM2.5 Reference/Class I Equivalent Methods
Label, organize, and archive filters and samples in the laboratory.
Use proper filter handling and custody techniques.
Implement all quality assurance requirements, as documented in the regulations, applicable QAPPs, and SOPs.
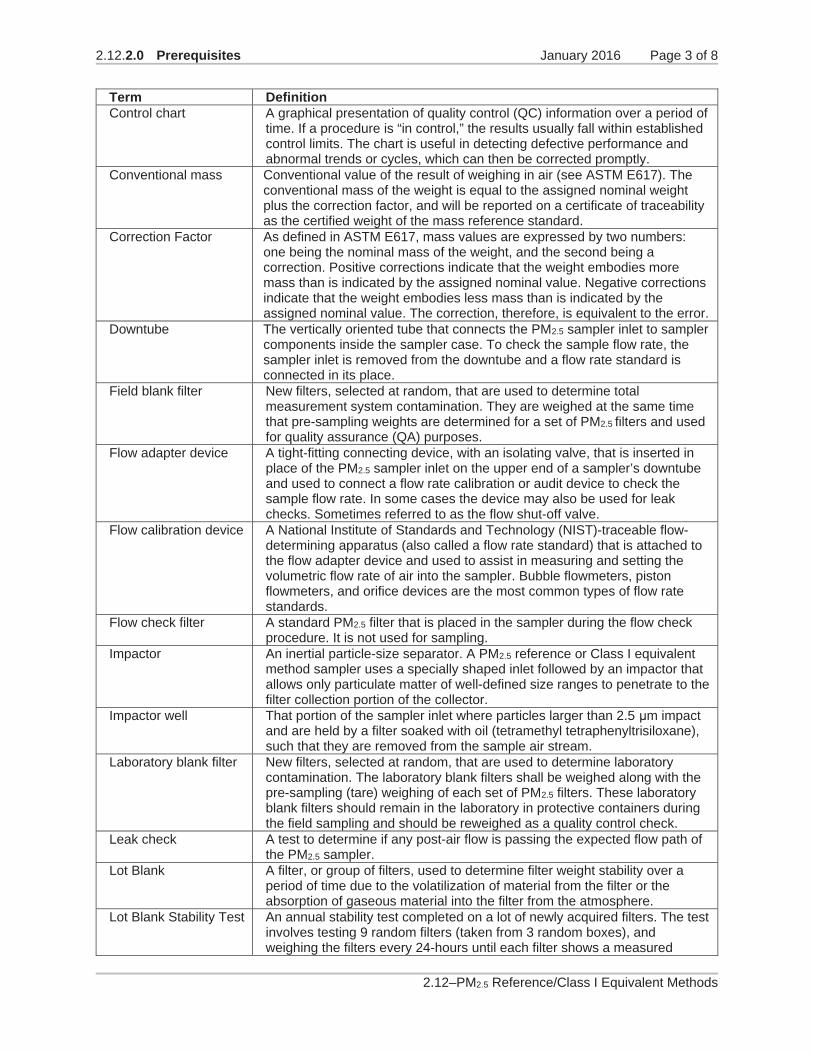
Table 2-1. Definitions of Key Terms
Term Definition Accuracy The degree of agreement between an observed value and an accepted
reference value; includes a combination of random error (precision) and systematic error (bias) components due to sampling and analytical operations.
Actual conditions The actual ambient temperature and pressure of a gas at the time its volume (or volumetric flow rate) is measured.
Analyst A staff member who weighs the new and used filters and computes the concentration of PM2.5 in g/m3.
American National Standards Institute (ANSI)
Administrator and coordinator of the U.S. private-sector voluntary standardization system.
American Society for Testing and Materials (ASTM)
A professional organization that develops and distributes protocols for testing and provides reference standards.
ASTM Class standards The device of known weight (within some tolerance) for controlling weighing operations with a microbalance. Certified to ASTM specifications.
Bias The systematic or persistent distortion of a measurement process that causes errors in one direction.
Cassette A device supplied with PM2.5 samplers to allow a weighed Teflon® filter to be held in place in the sampler and manipulated before and after sampling without touching the filter, and to minimize damage to the filter and/or sample during such activities.
Chain-of-custody Unbroken trail of accountability that verifies the physical security of environmental samples and documented information.
Class I equivalent method
An equivalent method for PM2.5 based on a sampler that closely meets the specifications for reference method samplers (40 Code of Federal Regulations [CFR] Part 58, Appendix L), with only minor deviations, as defined by the U.S. Environmental Protection Agency (EPA).
Class II equivalent method
An equivalent method for PM2.5, as defined by the U.S. EPA, that is based on a sampler having more significant deviations from reference method sampler specifications than a Class I equivalent method.
Class III equivalent method
An equivalent method for PM2.5, as defined by EPA, that is based on a device that incorporates major modifications to the reference method sampler, or on a fundamentally different design or principle.
Coefficient of variation A standardized measure of dispersion of a probability distribution or frequency distribution. It is defined as the ratio of the standard deviation to the mean.
Conditioning Environment (weighing room)
A confined/defined space containing the microbalance designed to maintain the PM2.5 filter conditioning requirements for temperature and humidity. Filters are held in this area until they have reached a steady state of moisture.
2.12.2.0 Prerequisites January 2016 Page 3 of 8
2.12–PM2.5 Reference/Class I Equivalent Methods
Term Definition Control chart A graphical presentation of quality control (QC) information over a period of
time. If a procedure is “in control,” the results usually fall within established control limits. The chart is useful in detecting defective performance and abnormal trends or cycles, which can then be corrected promptly.
Conventional mass Conventional value of the result of weighing in air (see ASTM E617). The conventional mass of the weight is equal to the assigned nominal weight plus the correction factor, and will be reported on a certificate of traceability as the certified weight of the mass reference standard.
Correction Factor As defined in ASTM E617, mass values are expressed by two numbers: one being the nominal mass of the weight, and the second being a correction. Positive corrections indicate that the weight embodies more mass than is indicated by the assigned nominal value. Negative corrections indicate that the weight embodies less mass than is indicated by the assigned nominal value. The correction, therefore, is equivalent to the error.
Downtube The vertically oriented tube that connects the PM2.5 sampler inlet to sampler components inside the sampler case. To check the sample flow rate, the sampler inlet is removed from the downtube and a flow rate standard is connected in its place.
Field blank filter New filters, selected at random, that are used to determine total measurement system contamination. They are weighed at the same time that pre-sampling weights are determined for a set of PM2.5 filters and used for quality assurance (QA) purposes.
Flow adapter device A tight-fitting connecting device, with an isolating valve, that is inserted in place of the PM2.5 sampler inlet on the upper end of a sampler’s downtube and used to connect a flow rate calibration or audit device to check the sample flow rate. In some cases the device may also be used for leak checks. Sometimes referred to as the flow shut-off valve.
Flow calibration device A National Institute of Standards and Technology (NIST)-traceable flow-determining apparatus (also called a flow rate standard) that is attached to the flow adapter device and used to assist in measuring and setting the volumetric flow rate of air into the sampler. Bubble flowmeters, piston flowmeters, and orifice devices are the most common types of flow rate standards.
Flow check filter A standard PM2.5 filter that is placed in the sampler during the flow check procedure. It is not used for sampling.
Impactor An inertial particle-size separator. A PM2.5 reference or Class I equivalent method sampler uses a specially shaped inlet followed by an impactor that allows only particulate matter of well-defined size ranges to penetrate to the filter collection portion of the collector.
Impactor well That portion of the sampler inlet where particles larger than 2.5 m impact and are held by a filter soaked with oil (tetramethyl tetraphenyltrisiloxane), such that they are removed from the sample air stream.
Laboratory blank filter New filters, selected at random, that are used to determine laboratory contamination. The laboratory blank filters shall be weighed along with the pre-sampling (tare) weighing of each set of PM2.5 filters. These laboratory blank filters should remain in the laboratory in protective containers during the field sampling and should be reweighed as a quality control check.
Leak check A test to determine if any post-air flow is passing the expected flow path of the PM2.5 sampler.
Lot Blank A filter, or group of filters, used to determine filter weight stability over a period of time due to the volatilization of material from the filter or the absorption of gaseous material into the filter from the atmosphere.
Lot Blank Stability Test An annual stability test completed on a lot of newly acquired filters. The test involves testing 9 random filters (taken from 3 random boxes), and weighing the filters every 24-hours until each filter shows a measured

2.12.2.0 Prerequisites January 2016 Page 4 of 8
2.12–PM2.5 Reference/Class I Equivalent Methods
Term Definition weight change of less than 15 g over a 24-hour period.
Mass reference standard
ASTM- or NIST-traceable weighing standards, generally in the range of masses expected for the filters.
Microbalance A type of analytical balance that can weigh to the nearest 0.001 mg (that is, 1 g or one-millionth gram).
Method Detection Limit (MDL)
Lowest concentration that can be detected by an instrument with correction for the effects of sample matrix and method specific parameters such as sample preparation.
National Ambient Air Quality Standard (NAAQS) for PM2.5
The NAAQS for PM2.5 is defined in 40 CFR Part 50 as follows: (a) primary standard: 12 g/m3, annual mean, based on the 3-year average of the annual arithmetic mean PM2.5 concentrations; (b) secondary standard: 15 g/m3, annual mean, based on the 3-year average of the annual arithmetic mean PM2.5 concentrations; (c) primary and secondary: 35 g/m3, 24-hour average, based on the 3-year average at the 98th percentile of 24-hour PM2.5 concentrations at each population-oriented monitor within an area.
NIST Acronym for the National Institute of Standards and Technology, which is the federal technology agency that works with industry to develop and apply technology, measurements, and standards.
Nominal weight Nominal value represents an accepted condition which is a goal or an approximation as opposed to the real value, which is always present. Often a "nominal" value is "de facto" rather than an exact, typical, or average measurement.
Operator A staff member who services a PM2.5 sampler in routine operation at a field site and who may also be responsible for transporting the sample filters to and from the laboratory.
Orifice flow rate check device
One type of flow rate calibration or check device (transfer standard), often used in the field, based on an established relationship between flow rate and pressure drop across the orifice plate. An orifice’s operating characteristics are determined in the laboratory using a flow rate standard such as a soap film flowmeter. Orifice devices generally require temperature and pressure corrections.
Pa Local ambient (barometric) pressure. PM2.5 Particulate matter (suspended in the atmosphere) having an aerodynamic
diameter less than or equal to a nominal 2.5 micrometers ( m), as measured by a reference method based on 40 CFR Part 50, Appendix L, and designated in accordance with 40 CFR Part 53.
PM2.5 sampler A sampler used for monitoring PM2.5 in the atmosphere that collects a sample of particulate matter from the air based on principles of inertial separation and filtration. The sampler also maintains a constant sample flow rate and may record the actual flow rate and the total volume sampled. PM2.5 mass concentration is calculated as the mass of the filter catch divided by the sampled volume. A sampler cannot calculate PM2.5 concentration directly.
PM2.5 Separator A class of approved devices for removing particles less than 10 m in aerodynamic diameter (but greater than 2.5 m in diameter), but allows particles of nominally less than 2.5 m in diameter to pass and collect on a Teflon® filter surface.
Polonium-210 (210Po) anti-static strip
A device containing a small amount of 210Po that emits particles (He2+) that neutralize the static charge on filters, making them easier to handle and their weights more accurate.
Precision A measure of mutual agreement among individual measurements of the same property, usually under prescribed similar conditions, expressed generally in terms of standard deviation.

2.12.2.0 Prerequisites January 2016 Page 5 of 8
2.12–PM2.5 Reference/Class I Equivalent Methods
Term Definition Primary Standard The standard within the lab that is traceable to NIST and has “authority”
over other standards (working standards) in the laboratory; meaning, the working standards are checked against the primary standard at some interval or when there is concern about the accuracy of the working standard.
Polytetrafluoroethylene (PTFE)
The polymer that is used to manufacture the 46.2 mm-diameter filters for PM2.5 Federal Reference Method (FRM) and Federal Equivalent Method (FEM) samplers. Also known as Teflon®.
Qa The sampler flow rate expressed at ambient (actual) conditions of temperature and pressure. Expressed in liters per minute (L/min, or LPM).
QA Collocation The placement of a second PM2.5 sampler (referred to in CFR as the “QC monitor”) near a permanent network sampler (primary sampler). Comparison of results from the two samplers is used to estimate the precision and bias of the primary sampler.
QA supervisor or coordinator
A staff member who assists in preparation of the PQAO’s quality plan, makes recommendations to management on quality issues (including training), oversees the quality system’s control and audit components, and reports the results.
Readability The smallest difference between two measured values that can be read on the microbalance display. The term "resolution" is a commonly used synonym.
Repeatability
A measure of the ability of a microbalance to display the same result in repetitive weighings of the same mass under the same measurement conditions. The term “precision” is sometimes used as a synonym.
Sample Batch A grouping of filters that are conditioned and analyzed as a single weighing event and for which laboratory 24-hour temperature and humidity conditions are documented and associated with the grouping of filters. The batch includes the required QC (filter blanks, standards, etc.). A batch may be based on the number of filters that can be processed in a normal business day since pre-sampling holding times (30 days) are determined when filters have been pre-weighed.
SLAMS Acronym for State or Local Air Monitoring Stations. The SLAMS include the ambient air quality monitoring sites and monitors that are required by 40 CFR 58, Appendix D, and are needed for the monitoring objectives of Appendix D, including NAAQS comparisons, but may serve other data purposes. The SLAMS includes NCore, PAMS, and all other state or locally operated criteria pollutant monitors, operated in accordance with Part 58, that have not been designated and approved by the Regional Administrator as Special Purpose Monitors (SPMs) in an annual monitoring network plan.
Standard conditions (EPA)
EPA-designated atmospheric conditions of 1 atm pressure (760 mmHg) and 25 C (298 K). Standard conditions are not used for reporting PM2.5 data; actual [uncorrected] conditions must be used for reporting.
Ta The ambient temperature. Expressed in degrees Celsius (C). Tolerance Also referred to as maximum permissible error (see ASTM E617). It is
defined as the maximum amount by which the sum of the conventional mass of the weight, its deviation from nominal value, and its associated uncertainty is allowed to deviate from the assigned nominal value.
Total suspended particulate (TSP)
Particulate matter collected by a high-volume sampler, which has no particular particle size selectivity.
Traceable A term signifying that a local standard has been compared and certified, either directly or by not more than one intermediate standard, to a NIST-certified primary standard, such as a thermometer or standard reference material (SRM).
Transfer standard A reference standard device (for temperature, flow rate, and so on) that has

2.12.2.0 Prerequisites January 2016 Page 6 of 8
2.12–PM2.5 Reference/Class I Equivalent Methods
Term Definition been compared to a NIST reference standard and is subsequently used to calibrate, audit, or check other measurement systems or devices.
Trip blank New filters, selected at random, that are used to determine contamination occurring during loading filters into cassettes, and/or transportation activities to/from the field and laboratory.
Uncertainty Spatial, temporal, or measurement variability or bias that leads to a deviation from the true value.
Va
An air volume measured or expressed at ambient (actual) conditions of temperature and pressure.
Very Sharp Cut Cyclone
The name given to the design of the particle impactor specified by EPA for reference method samplers for PM2.5. Fractionators defined as VSSC and approved by EPA can be used in place of WINS.
WINS The name given to the design of the particle impactor specified by EPA for reference method samplers for PM2.5; an acronym for “Well Impactor Ninety Six.”
Working Standard Standard that is used for calibrations and routine quality control checks. At some frequency, its accuracy is checked against a primary standard.
2.2.2 Field Personnel Qualifications All field operations personnel should be familiar with environmental field measurement techniques. Those who service the PM2.5 sampler in the field need to be very conscientious and attentive to detail in order to report complete and high-quality PM2.5 data. Persons qualified to perform PM2.5 field operations should be able to:
Operate the PM2.5 sampler. Perform routine maintenance and cleaning of the PM2.5 sampler. Calibrate, audit, and troubleshoot the PM2.5 sampler. Be proficient in the use of microprocessor-controlled instrumentation. Use common methods to determine temperature, pressure, and flow rate in the field, as
well as test for leaks. Enter data into databases, chain-of-custody (COC) forms/labels, and logbooks.
2.2.3 Training for Laboratory and Field Personnel Resources for training laboratory and field personnel should be available. Each individual should receive training appropriate to his or her duties on the PM2.5 monitoring program and this training should be documented in personnel files. Developing a training manual or operations checklist is recommended. Suggestions for training activities/materials include:
Reading and understanding the pertinent PM2.5 section of CFR.
Studying the relevant sections of this QA guidance document, the operating manuals for the samplers and/or the microbalance, and other guidance.
Attending relevant EPA or SLT sponsored training workshops.
Watching and studying instructional videos that may become available.

2.12.2.0 Prerequisites January 2016 Page 7 of 8
2.12–PM2.5 Reference/Class I Equivalent Methods
Having experienced operators instruct others through on-the-job training and attest to the readiness of new operators.
Having newly trained operators pass a hands-on test of procedures and attest that they
have read and understand the program procedures and requirements. 2.3 Health and Safety Warnings To prevent personal injury, all employees should heed any warnings that are associated with operation of the microbalance, the PM2.5 sampler, and any supporting equipment and supplies. Specific health and safety warnings are generally found at the point in the operating manual or troubleshooting guide where they are most applicable. In general, health and safety warnings fall into these categories:
Electrical Chemical Equipment placement and stability.
Electrical safety considerations that apply to the PM2.5 sampler include the following:
Make all electrical connections in accordance with national codes. Use of a third-wire grounding arrangement, a ground fault circuit interrupter (GFCI) outlet and cord on samplers, electrical appliances or test rigs, will minimize the possibility of electrical shock and injury.
Electrical supply lines to the PM2.5 sampler should be installed so that they are protected
from degradation and hazards. Inspect the electrical cords and connections for signs of wear and have an electrician repair or replace them as needed.
The power to the sampler should be unplugged when servicing or replacing parts in areas
requiring removal of protective panels.
Avoid contact of jewelry with electrical circuits. Remove rings, watches, bracelets, and necklaces to prevent shorting and electrical burns.
Use caution when working near moving parts (such as pumps) to avoid injury.
Be aware of weather patterns; avoid the sampling platform if lightning storms approach
because the sampler is elevated and made of conductive metal. Chemical and physical safety considerations that apply to PM2.5 operations include the following:
Use care in the application of cleaning solvents, greases for O-rings, and silicone oil for the impactor well. Use of gloves is recommended. Wash hands thoroughly after working

2.12.2.0 Prerequisites January 2016 Page 8 of 8
2.12–PM2.5 Reference/Class I Equivalent Methods
with chemicals. Provide good ventilation if organic solvents are used. Dispose of chemicals and shop towels properly.
Mercury metal, a poisonous material, is present in some types of barometers and RH
indicators. In most cases, these instruments have been replaced in the field with non-mercury containing devices. If liquid mercury is spilled, it must be cleaned up and disposed of properly. Use protective equipment to avoid inhalation of vapors and impermeable gloves to avoid skin contact. Mercury cleanup kits are available. Avoid use of mercury, if possible, to preclude mercury exposure.
Exercise caution when using anti-static devices containing radioactive polonium sources.
Keep an inventory of the location and size of anti-static devices. Dispose of the devices in accordance with State and local regulations.
Avoid touching pump or fan motors, which may be hot. Avoid injury from moving parts,
such as fans and filter-changing mechanisms.
Ensure that the PM2.5 sampler(s) and associated equipment are stably mounted to the ground or another surface so that they do not tip over.
Electrical wires should be installed so no one will trip over them and be injured.
If the sampler is placed on the roof of a building or on another elevated location, railings
should be installed and warning signs placed to prevent falls.
2.4 Cautions Damage to the PM2.5 sampler may result if caution is not taken to properly install and maintain the device. Consider the manufacturer’s instructions for maintaining the pump, for cleaning the interior and exterior surfaces, and for safe, secure installation. The weighing room should be maintained in a state of good order so that samples are not con-taminated, misplaced, or misidentified. The room air should be dust-free and controlled within specified temperature and humidity ranges. The microbalance should be placed on a vibration-free mounting. Care must be taken to avoid bumping the balance and disturbing its calibration settings. The calibration weights used to check balance precision and accuracy should be stored in a secure location away from sources of corrosion and should be used only for filter weighing by a knowledgeable analyst and handled only with Teflon® forceps to prevent scoring and weight changes. Finally, exercise care in handling new and used filters. If details concerning weighing, labeling, and transporting filters are not followed precisely, errors may result. Rough handling of used filters may dislodge PM2.5 material. Inadequate conditioning of filters at the specified temperatures and humidities or long delays between sample retrieval and sample weighing may lead to positive or negative weight changes and, thus, inaccurate PM2.5 concentrations.

2.12. 3.0 Summary January 2016 Page 1 of 5
2.12–PM2.5 Reference/Class I Equivalent Methods
3.0 Summary 3.1 Overview The procedures in this document are designed to serve as guidelines for the development of SLT agency quality assurance (QA) programs in support of measurements of PM2.5 using either Federal Reference Method (FRM) samplers or Class I equivalent method samplers. Section 3.1 gives background information on the development and intended uses of FRM and Class I equivalent method samplers; Section 3.2 illustrates the design of the PM2.5 sampler and describes how PM2.5 particles are captured; Section 3.4 contains a checklist of the typical steps involved in servicing a sampler in the field. As described in 40 CFR Part 50, Appendix L, the reference method for PM2.5 sampling employs a sampler to draw a measured quantity of ambient air at a constant volumetric flow rate (16.67 L/min) through a specially designed particle-size discrimination inlet. PM2.5 particles are those particles with an aerodynamic diameter less than or equal to a nominal 2.5 m. Particles in the 2.5 m and smaller size range are collected on a 46.2-mm- diameter Teflon® filter during the specified 23- to 25-hour sampling period. Each filter is weighed before use and after sampling. From these measurements, the mass of the collected PM2.5 sample can be calculated. Filter samples are required to be collected on daily, 1-in-3 day, and 1-in-6 day sampling schedules. The national sampling schedule is posted on AMTIC6. The samplers are operated midnight-to-midnight, local standard time. The total volume of air sampled is determined from the measured volumetric flow rate and the sampling time. The mass concentration of PM2.5 in the ambient air is computed as the total mass of collected particles in the PM2.5 size range divided by the total volume of air sampled and measured under ambient (actual) conditions of temperature and pressure. The PM2.5 concentra-tion is thus expressed as g/m3 of air. The particle-size discrimination characteristics of the sampler inlet, downtube, separator, and filter holder are all specified by design in 40 CFR Part 50, Appendix L. In addition, specific performance characteristics of the sampler are tested in accordance with the procedures in 40 CFR Part 53, Subpart E. Sampling methods for PM2.5 that meet all requirements in both Parts 50 and 53 are designated as PM2.5 FRMs for use in SLAMS and Prevention of Significant Deterioration (PSD) monitoring networks. These designated methods are identified by a specific number and can also be identified by the manufacturer and model number of the sampler.
6 http://www.epa.gov/ttn/amtic/calendar.html

2.12. 3.0 Summary January 2016 Page 2 of 5
2.12–PM2.5 Reference/Class I Equivalent Methods
3.2 Illustrations of Sampler Inlet Components and Sample Flow Paths Figure 3-1 illustrates the inlet of the PM2.5 sampler. This inlet is designed to representa-tively extract ambient aerosols from the surrounding airstream, remove particles with aerodynamic diameters greater than nominally 10 m, and send the remaining smaller particles to the next stage. Figure 3-2 illustrates the impactor and filter holder assembly that first removes those particles nominally less than 10
m but greater than nominally 2.5 m in diameter, but allows particles of nominally 2.5
m in diameter (and smaller) to pass and collect on a Teflon® filter surface. This separator has been called the “Well Impactor 96”, or WINS impactor. Downstream of the inlet, particles less than 10 m but greater than 2.5 m are removed by a PM2.5 separator. The well of the impactor assembly contains a 37-mm-diameter glass fiber filter immersed in 1 mL of low-volatility, low-viscosity diffusion oil. The oiled glass fiber filter removes particles between 10 and 2.5 m in diameter by preventing bouncing of the incoming particles. An alternative to Figure 3.2 is the very sharp cut cyclone (VSCC), illustrated in Figure 3.3, that has been approved by EPA through the FRM/FEM designation process.
NOTE: Method designations, which certify that a particular FRM/FEM sampler or analyzer has been formally approved by EPA, are partially based on the type of size-selective
2.12. 3.0 Summary January 2016 Page 3 of 5
2.12–PM2.5 Reference/Class I Equivalent Methods
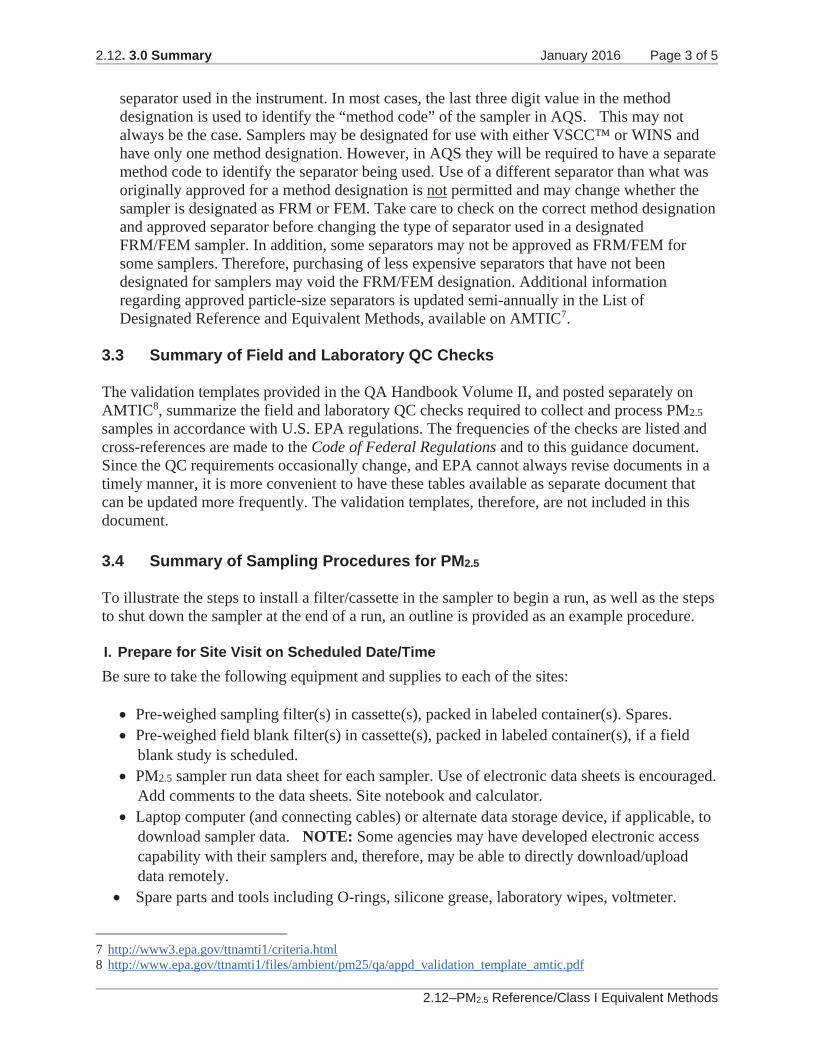
separator used in the instrument. In most cases, the last three digit value in the method designation is used to identify the “method code” of the sampler in AQS. This may not always be the case. Samplers may be designated for use with either VSCC™ or WINS and have only one method designation. However, in AQS they will be required to have a separate method code to identify the separator being used. Use of a different separator than what was originally approved for a method designation is not permitted and may change whether the sampler is designated as FRM or FEM. Take care to check on the correct method designation and approved separator before changing the type of separator used in a designated FRM/FEM sampler. In addition, some separators may not be approved as FRM/FEM for some samplers. Therefore, purchasing of less expensive separators that have not been designated for samplers may void the FRM/FEM designation. Additional information regarding approved particle-size separators is updated semi-annually in the List of Designated Reference and Equivalent Methods, available on AMTIC7.
3.3 Summary of Field and Laboratory QC Checks The validation templates provided in the QA Handbook Volume II, and posted separately on AMTIC8, summarize the field and laboratory QC checks required to collect and process PM2.5 samples in accordance with U.S. EPA regulations. The frequencies of the checks are listed and cross-references are made to the Code of Federal Regulations and to this guidance document. Since the QC requirements occasionally change, and EPA cannot always revise documents in a timely manner, it is more convenient to have these tables available as separate document that can be updated more frequently. The validation templates, therefore, are not included in this document. 3.4 Summary of Sampling Procedures for PM2.5 To illustrate the steps to install a filter/cassette in the sampler to begin a run, as well as the steps to shut down the sampler at the end of a run, an outline is provided as an example procedure.
I. Prepare for Site Visit on Scheduled Date/Time Be sure to take the following equipment and supplies to each of the sites:
Pre-weighed sampling filter(s) in cassette(s), packed in labeled container(s). Spares. Pre-weighed field blank filter(s) in cassette(s), packed in labeled container(s), if a field
blank study is scheduled. PM2.5 sampler run data sheet for each sampler. Use of electronic data sheets is encouraged.
Add comments to the data sheets. Site notebook and calculator. Laptop computer (and connecting cables) or alternate data storage device, if applicable, to
download sampler data. NOTE: Some agencies may have developed electronic access capability with their samplers and, therefore, may be able to directly download/upload data remotely.
Spare parts and tools including O-rings, silicone grease, laboratory wipes, voltmeter.
7 http://www3.epa.gov/ttnamti1/criteria.html 8 http://www.epa.gov/ttnamti1/files/ambient/pm25/qa/appd_validation_template_amtic.pdf

2.12. 3.0 Summary January 2016 Page 4 of 5
2.12–PM2.5 Reference/Class I Equivalent Methods
Operator’s manual for the sampler(s) to be serviced. If it is time for the recommended separator maintenance, also take the following:
– Ready-to-use impactor well assembly or filter/lab wipes/diffusion oil to service the sampler at the site, or
– A secondary separator or equipment for cleaning the secondary separator in the field.
II. Install Filter/Cassette and Begin Sampler Operations
Perform the following steps to install the filter/cassette and begin sampler operations: Be sure the sampler is not in sampling mode. Fill in initial information on the data sheet. Remove the new filter/cassette from its protective container and visually inspect the
filter/cassette for flaws. Verify that this is the correct filter for this sampler, site, and run date.
Remove the sampler’s filter holder assembly (if required by the manufacturer’s instructions). Inspect the O-rings inside the filter holder; service them if necessary.
Install the filter/cassette in the filter holder assembly and then install the loaded filter holder assembly in the sampler based on the manufacturer’s instructions. If you touch or scratch the filter, void the filter, record this fact, and get another one from the set of extra filters brought to the site.
Program the sampler to turn on at the beginning of a sampling period (consult the sampler’s instruction manual). The sampling day begins at midnight.
III. Remove Filter/Cassette and End Sampler Operations Perform the following steps to remove the filter/cassette and end sampler operations:
Arrive at the site as soon as possible after the end of the sampling period. The filter/cassette must be removed within 177 hours after the collection period has ended.
Review the sampler data. Record the stop time; total elapsed time; initial and final Q, Qavg, and Qcv; total volume sampled; Ta; Pa; and so forth on the data sheet.
NOTE: If a filter is still in the sampler, follow the instructions for removing the sample/cassette. Also, if the schedule calls for any of the following procedures, perform them before installing a new sampling filter/cassette: – Impactor well or VSCC replacement or cleaning (after every fifth sampling
event); – Sampler flow verification check (every 4 weeks); – Sampler ambient pressure and temperature checks (every 4 weeks); – Sampler verification/calibration (temperature, pressure, flow rate); – Cleaning of sampler inlet head and downtube (monthly); – Leak check before each flow rate verification and calibration; – Leak check before and after separator maintenance; – Field blanks.
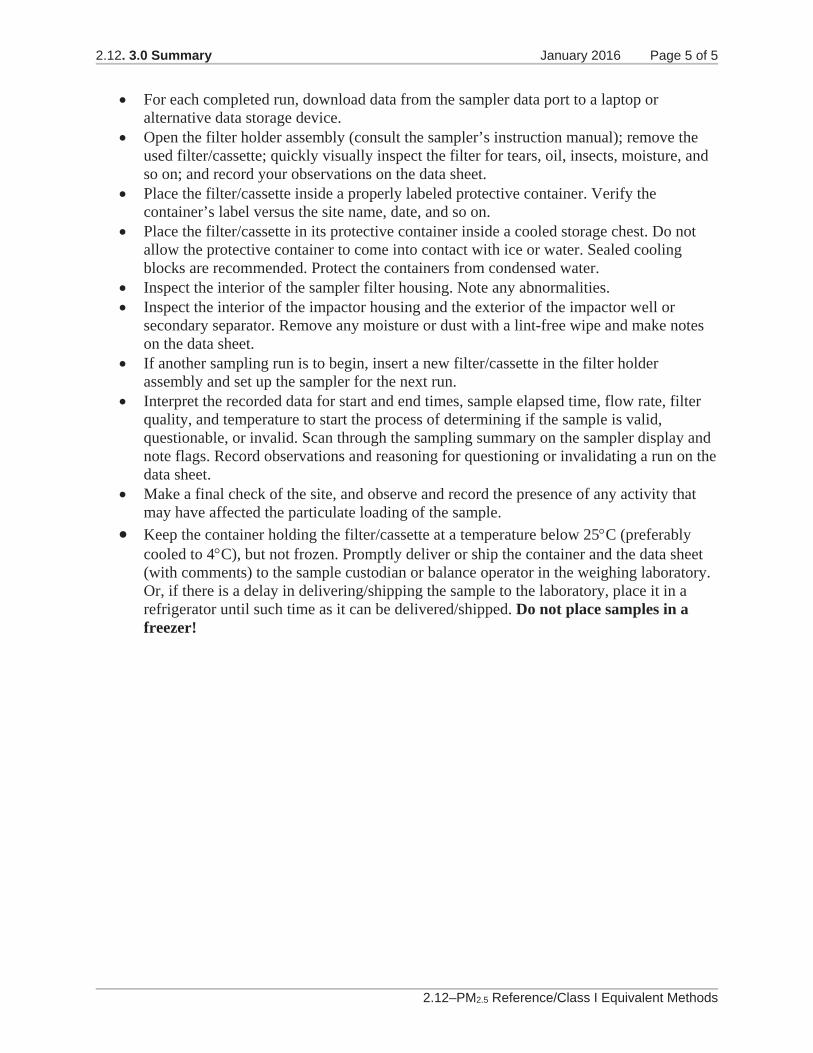
2.12. 3.0 Summary January 2016 Page 5 of 5
2.12–PM2.5 Reference/Class I Equivalent Methods
For each completed run, download data from the sampler data port to a laptop or alternative data storage device.
Open the filter holder assembly (consult the sampler’s instruction manual); remove the used filter/cassette; quickly visually inspect the filter for tears, oil, insects, moisture, and so on; and record your observations on the data sheet.
Place the filter/cassette inside a properly labeled protective container. Verify the container’s label versus the site name, date, and so on.
Place the filter/cassette in its protective container inside a cooled storage chest. Do not allow the protective container to come into contact with ice or water. Sealed cooling blocks are recommended. Protect the containers from condensed water.
Inspect the interior of the sampler filter housing. Note any abnormalities. Inspect the interior of the impactor housing and the exterior of the impactor well or
secondary separator. Remove any moisture or dust with a lint-free wipe and make notes on the data sheet.
If another sampling run is to begin, insert a new filter/cassette in the filter holder assembly and set up the sampler for the next run.
Interpret the recorded data for start and end times, sample elapsed time, flow rate, filter quality, and temperature to start the process of determining if the sample is valid, questionable, or invalid. Scan through the sampling summary on the sampler display and note flags. Record observations and reasoning for questioning or invalidating a run on the data sheet.
Make a final check of the site, and observe and record the presence of any activity that may have affected the particulate loading of the sample.
Keep the container holding the filter/cassette at a temperature below 25 C (preferably cooled to 4 C), but not frozen. Promptly deliver or ship the container and the data sheet (with comments) to the sample custodian or balance operator in the weighing laboratory. Or, if there is a delay in delivering/shipping the sample to the laboratory, place it in a refrigerator until such time as it can be delivered/shipped. Do not place samples in a freezer!

2.12. 4.0 Procurement of Equipment and Supplies January 2016 Page 1 of 10
2.12–PM2.5 Reference/Class I Equivalent Methods
4.0 Procurement of Equipment and Supplies 4.1 Overview The establishment of an ambient PM2.5 air monitoring network requires the procurement of specialized equipment and supplies for field operations and subsequent laboratory determination of particle mass. Information in this section will assist PQAOs and SLTs in selecting the proper equipment and in acceptance testing that equipment. Section 4.2 describes field operation equipment (excluding sampling filters) and Section 4.3 describes laboratory equipment (including sampling filters). Note that sampling filters are described in Section 4.3 because they are purchased for the laboratory, which must equilibrate and weigh them before field use. In addition to field operations and laboratory equipment, data handling system(s) (including forms, logs, files, and reporting procedures) should be developed and implemented. Information on data handling systems is provided in Section 13.0, “Data and Records Management.” Minimum monitoring equipment requirements and budgetary limits should be established before equipment is purchased. In addition, acceptance criteria for equipment and supplies should be established. Upon receipt of the sampling equipment and supplies, acceptance checks should be conducted. The results of these checks, including whether the equipment was accepted or rejected, should be recorded in a procurement log. Figure 4.1 is an example of such a log. This log will serve as a permanent record for procurement and provide cost projections for future programs. Table 4-1 lists the major equipment needed, how it should be tested, suggested acceptance limits, and actions to be taken if acceptance limits are not met. It is highly recommended that agencies develop an equipment replacement plan that covers parts/equipment needed for the next 5 years. It is common practice, as technology advances, for vendors to develop better samplers/calibrators and discontinue supporting the older models. Agencies should plan for replacement of samplers and transitioning to better methodologies as they are proven and become available. It is also highly recommended for agencies operating their own weighing laboratories to have a contingency plan for weighing filters. Good laboratory environmental control and stability are two of the most important components of filter weighing and should not be overlooked. If there is a problem in the laboratory and filter weighing cannot occur, delays in weighing can put samples at risk of invalidation. Many of the validation criteria for PM2.5 filter weighing are time sensitive, and a laboratory cannot afford down-time. For these reasons, a laboratory should have a contract or an agreement with another PM2.5 weighing laboratory in the event of a lab issue to continue filter weighing. It is impossible to include in this document every item or service that might be needed by any specific monitoring network. Therefore, each monitoring organization should determine the extent of its in-house inventory or capability and the items that should be procured before sampling begins. The monitoring organization should also be prepared to order any additional equipment or services required in addition to that outlined in this section.

2.12. 4.0 Procurement of Equipment and Supplies January 2016 Page 2 of 10
2.12–PM2.5 Reference/Class I Equivalent Methods
Item Description Qty PO # Vendor
Date Cost Initials
Accept/ Reject Comments
Ord. Rec’d.
1 case filters
2 mpore46.2 mm diameter
60 971-100 WIZ Supply
8/1/97 8/15/97 $100 ABC Accept Examined 8/20/97
Figure 4.1. Procurement Log 4.2 Procurement Prerequisites—Field Operations
4.2.1 Reference or Equivalent Method Sampler Each PM2.5 sampler used for reporting data to determine attainment of the National Ambient Air Quality Standard (NAAQS) for fine (2.5 m) particulate matter must meet U.S. EPA standards and must be of a model designated by EPA as a reference or equivalent method. The minimum sampler requirements are described in the reference method (EPA 1997a) and in 40 CFR Part 53 (EPA 1997b). The PM2.5 sampler cost will vary with the manufacturer and the sophistication of the sampler. Basic considerations for sampler selection include flow control and measurement systems, maintenance requirements, reliability, ease of operation, and such additional capabilities as sequential sampling and downloading data. Although a network may decide to use any number of different reference and designated equivalent PM2.5 sampler models, using a single model of sampler in a network minimizes the variety of spare parts required to keep the network in operation, simplifies training of operators, and adds consistency to the data reduction process. An in-house inventory of general maintenance supplies and replacement parts is recommended. Examples include: various hand tools, laboratory wipes, and soft brushes. Spare parts for the sampler may be obtained from the manufacturer or may be purchased from other suppliers. In accordance with 40 CFR Part 50, Appendix L, Section 7.3.4.2, the impactor in the WINS PM2.5 separator (see Figure 3.2) requires a circular, 35- to 37-mm-diameter filter made of borosilicate glass with no binder. The filter pore size must be 1 to 1.5 m and the thickness must be 300 to 500 m. The impactor oil is tetramethyltetraphenyl-trisiloxane, single-compound diffusion oil, with the following specifications at 25 C: vapor pressure, 2 10-8 mmHg; viscosity, 36 to 40 centistokes; and density, 1.06 to 1.07 g/cm3 (see Appendix L, Section 7.3.4.3). In November 2000, a second type of oil, identified as dioctyl sebacate (DOS), was approved for use and is now recommended for use in place of Tetramethyltetraphenyltrisiloxane 9.
9 http://www3.epa.gov/ttn/amtic/pmpolgud.html

2.12. 4.0 Procurement of Equipment and Supplies January 2016 Page 3 of 10
2.12–PM2.5 Reference/Class I Equivalent Methods
1 audit standards must be the same or of higher accuracy than working or field transfer standards
10 See Validation Template on AMTIC for any revisions to acceptance criteria in this table http://www3.epa.gov/ttn/amtic/qapollutant.html
Table 4-1. Acceptance Checks and Limits for Procurement of Equipment and Supplies
Equipment Acceptance check Acceptance limits10Action if require-
ments are not met
Field operations
Sampler Sampler and accessories complete; no evidence of damage. Model designated as reference or equivalent method. Sampling system verification.
Specifications outlined in 40 Code of Federal Regulation (CFR) Part 50, Appendix L
Reject sampler
Calibration quality assurance/quality control (QA/QC) equipment for flow rate, temperature, pressure, leaks, time
Accompanied by certificate. Check values against National Institute of Standards and Technology (NIST)-traceable standards.
Within accuracy limits described in this document
Adjust or reject equipment
Audit equipment Same as for calibration equipment but must not be the same equipment.
Within accuracy limits described in this document1
Adjust or reject equipment
Laboratory operations
Filters, Teflon® Of correct type and undamaged. Type as described in 40 CFR Part 50, Appendix L
Reject filters
Filter cassettes Of correct type and undamaged. As specified by sampler manufacturer
Reject filter cassettes
Filter/cassette protective containers
Of correct type and undamaged. As described in this document
Reject protective containers
Filter-handling containers
Of correct type and undamaged. As described in this document
Reject filter-handling containers
Analytical microbalance
Accompanied by certificate; check values against working standards.
Readability 1 g,repeatability 1 g
Adjust or reject equipment
Mass reference standards
All standards accompanied by NIST-traceability certificates.
±25 g tolerance or better (see Table 4-2)
Reject standards
Temperature and Relative Humidity Logger
Accompanied by certificate. Check values against National Institute of Standards and Technology (NIST)-traceable standards. Data collection software validated.
±1.0 °C accuracy for temperature
±2% RH accuracy for relative humidity
Capable of 5-minute averaging/logging
Reject device
Audit equipment Same as for calibration equipment but must not be the same equipment.
Within accuracy limits described in this document1
Adjust or reject equipment

2.12. 4.0 Procurement of Equipment and Supplies January 2016 Page 4 of 10
2.12–PM2.5 Reference/Class I Equivalent Methods
4.2.2 Calibration Equipment Specialized equipment is needed to calibrate the sampler for temperature, barometric pressure, and volumetric flow measurements. At a minimum, the following equipment should be procured:
A thermometer(s) capable of measuring ambient temperatures in a range of -30 to +45 C, readable to the nearest 0.1 C. This thermometer should be referenced (ASTM 1992; EPA 1995; NIST 1986, 1988, 1989) to within an accuracy of ±0.5 C to NIST-traceable American Society for Testing and Materials (ASTM) precision thermometers (e.g., ASTM numbers 62C, 63C, and 64C) once a year (ASTM 1995a). Multiple thermometers may be used to cover the temperature range as long as each thermometer meets the accuracy and readability specifications described above. Thermistor or thermocouple thermometers for use in the field should be calibrated against NIST-traceable thermometers. Some flexibility in these recommendations applies at sites where temperatures are extremely cold. A barometer capable of measuring barometric pressure (ASTM 1995b) over a range of 600 to 800 mm Hg (80 to 106 kiloPascals [kPa]) and readable to the nearest 1 mmHg. At least once a year, this barometer should be calibrated to within ±5 mmHg of a NIST-traceable barometer of known accuracy. A portable, aneroid barometer (e.g., a climber’s or engineer’s altimeter) is suitable for field use. A Fortin-type, mercury-column barometer may also be useful for laboratory checks of the barometer used for field measurements. Flow rate measurement equipment (transfer standards) must be capable of calibrating or verifying the sampler’s flow rate measurement device within an accuracy of ±2 percent. This flow rate standard should be a separate, stand-alone device. It must have its own certification and be traceable to a NIST primary standard for volume or flow rate. A variety of flow rate transfer standards, with their optimum flow ranges and their support equipment, are presented in Section 6.3.2.
A flow adapter of the dimensions specified in drawing No. L-30 in Appendix L of 40 CFR Part 50 (EPA 1997a) and described in Section 7.3.6, Appendix L, that will connect the transfer standard outlet to the PM2.5 sampler flow path entering the impactor assembly and form a leak-free seal. All interconnecting tubing should be flexible and crimp-resistant. This adapter is also used in conducting the required external leak test. A timepiece or device capable of accessing the NIST atomic clock to the second.
4.2.3 Flow Verification Check Device As part of the quality control (QC) procedures, a flow verification check device is required to verify that the PM2.5 sampler is operating at the correct flow rate. A variety of flow check devices are currently available on the market. The monitoring organization should select a flow device with an operational range that includes the targeted flow rate of the PM2.5 sampler (~16.67 L/min, or LPM). Current flow rate measuring devices operate using a measuring device of some kind (bubble, piston, and orifice) integrated with a microprocessor. These devices are
2.12. 4.0 Procurement of Equipment and Supplies January 2016 Page 5 of 10
2.12–PM2.5 Reference/Class I Equivalent Methods
not primary standards and require a periodic calibration or certification, typically annual, against a NIST standard from a metrology laboratory to demonstrate NIST-traceability. All of these standards require time to equilibrate to local ambient conditions before use. These devices are typically very user-friendly and designed for work in the field or laboratory. Although not required, separate flow rate calibrations devices and verification devices are encouraged. Since flow rate audits only occur every 6 months (flow rate audit devices must be separate from verification devices), it may take a considerable amount of time to identify unacceptable systemic errors which can lead to significant data invalidation if flows rate are calibrated and then verified with the same faulty flow rate standard. Detailed descriptions of different types of volumetric flow rate devices may be found in Section 6.3.2. 4.2.4 Audit Equipment Audit equipment should be similar to the calibration equipment described above. However, the audit equipment must not be the same equipment used for calibration and flow verification checks, although both sets of equipment may be of identical makes and models (see 40 CFR Part 58, Appendix A, Section 3.2.2). The calibration equipment and the audit equipment may be referenced to the same NIST primary standard. 4.3 Procurement Prerequisites—Laboratory Operations 4.3.1 Filter Media
In the laboratory, sample filters are conditioned (while in glass or plastic filter-handling containers, such as petri dishes or petri slides), pre-weighed, and placed first into sample filter cassettes and then into protective containers for transport to the field. The mean relative humidity (RH) in the filter conditioning environment must be held between 30 and 40 percent, with a variability of not more than ±5 percent RH over 24 hours. However, where it can be shown that the mean ambient RH during sampling is less than 30 percent, conditioning is permissible at a mean RH within ±5 percent RH of the mean ambient RH, but in no case at an RH less than 20 percent. Mean laboratory temperature must be held between 20 and 23 C, with a variability of not more than ±2 C over 24 hours. The time required for the weights of new filters to stabilize (see Section 10.4) may be as long as 6 weeks to eliminate initial outgassing. Adequate numbers of filters should be purchased to permit conditioning before use. In practice, this suggestion means that networks should plan on keeping a minimum filter inventory sufficient for 6 to 12 weeks of operational needs beyond the annual order. These inventory levels can be adjusted based on the network’s experience with filter weight stabilization times for a given vendor’s filters. The EPA filter procurement vendor will precondition the filters before shipping to reduce the effects of off-gassing during the production process. This action should lessen the pre-use conditioning time significantly. EPA-purchased Teflon® filters will be acceptance-tested prior to distribution to SLT agencies. However, filters should be inspected for obvious flaws (see Section 10.3). Conditioning for outgassing will still be necessary to determine the time, in excess of the 24 hours, needed to obtain a stable weight. Only sampling filter media that meet the following EPA specifications for use with PM2.5

2.12. 4.0 Procurement of Equipment and Supplies January 2016 Page 6 of 10
2.12–PM2.5 Reference/Class I Equivalent Methods
samplers should be purchased. The manufacturer must certify that these media meet the specifications given in Appendix L of 40 CFR Part 50 (EPA 1997a).
Size—circular, 46.2-mm diameter ±0.25 mm (with support ring)
Medium—polytetrafluoroethylene (PTFE) Teflon® with integral support ring
Support ring—polymethylpentene (PMP) or equivalent inert material, 0.38 ± 0.04 mm thickness, outer diameter 46.2 ± 0.25 mm, and width of 3.68 mm. The support ring diameter should also be checked for consistency. Variations in diameter will affect the filter exposure area, which, in turn, will affect any operations that involve use of a portion of the filter.
Pore size—2 m as measured by ASTM F 316-94
Thickness—30 to 50 m
Maximum pressure drop (clean filter)—30 cm H2O column at 16.67 L/min clean air flow
Maximum moisture pickup—No more than 10 g weight increase after a 24-hour exposure to air at 40 percent RH, relative to the weight after a 24-hour exposure to air at 35 percent RH
Collection efficiency—greater than 99.7 percent, as measured by the dioctyl phthalate (DOP) test (ASTM 1995c) with 0.3- m particles at the sampler’s operating face velocity
Filter weight stability (including test for loose, surface-particle contamination and test for temperature stability)—filter weight loss 20 g in either test, measured as specified in 40 CFR Part 50, Appendix L, Section 6.9
Alkalinity—less than 25 microequivalents/g of filter, as measured in a procedure based on the one given in Appendix A to this document.
Although not required for determination of PM2.5 mass concentration under this reference method, additional specifications for the filter should be developed by users who intend to subject archived PM2.5 filter samples to subsequent chemical analysis. These supplemental specifications include background chemical contamination of the filter and any other filter parameters that may be required by the chemical analysis method. All such supplemental filter specifications should be compatible with and secondary to the primary filter specifications given in Appendix L of 40 CFR Part 50 (EPA 1997a).
NOTE: EPA implements a national filter contract that support SLTs agencies for all PM2.5
SLAMS filter needs. On an annual basis, SLTs will request their filter needs to their respective EPA Regions, who will provide those orders to the EPA Office of Air Quality Planning and Standards (OAQPS).
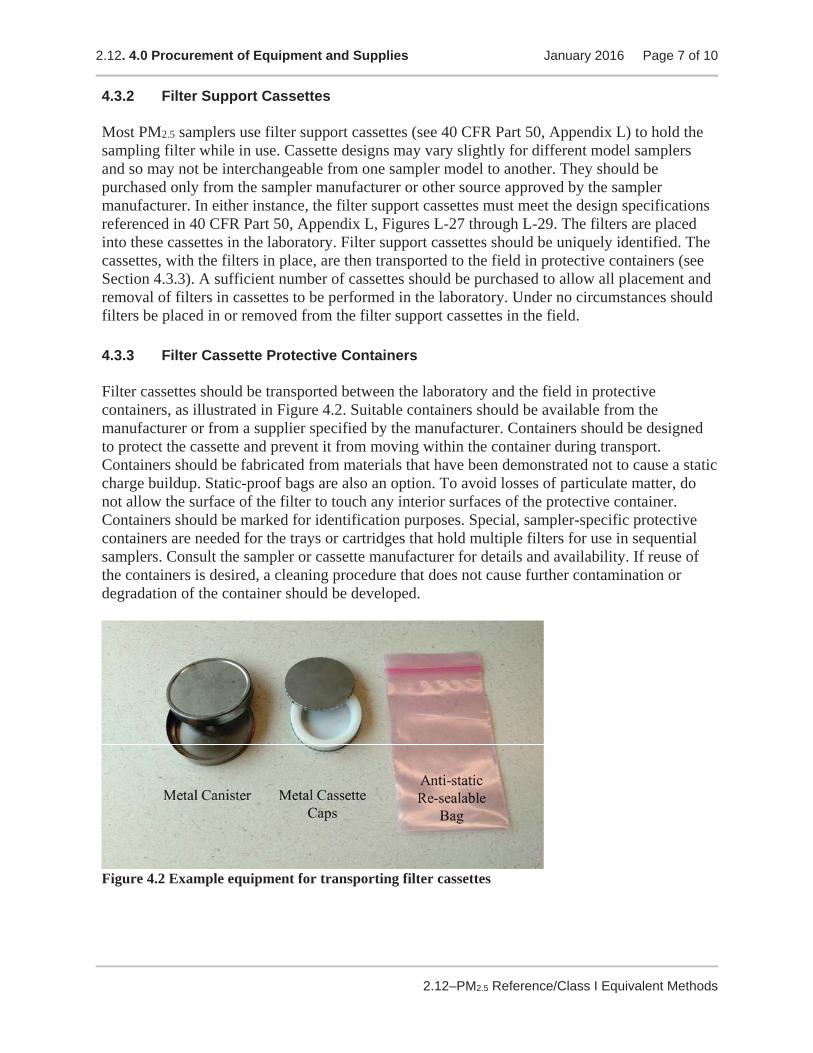
2.12. 4.0 Procurement of Equipment and Supplies January 2016 Page 7 of 10
2.12–PM2.5 Reference/Class I Equivalent Methods
4.3.2 Filter Support Cassettes Most PM2.5 samplers use filter support cassettes (see 40 CFR Part 50, Appendix L) to hold the sampling filter while in use. Cassette designs may vary slightly for different model samplers and so may not be interchangeable from one sampler model to another. They should be purchased only from the sampler manufacturer or other source approved by the sampler manufacturer. In either instance, the filter support cassettes must meet the design specifications referenced in 40 CFR Part 50, Appendix L, Figures L-27 through L-29. The filters are placed into these cassettes in the laboratory. Filter support cassettes should be uniquely identified. The cassettes, with the filters in place, are then transported to the field in protective containers (see Section 4.3.3). A sufficient number of cassettes should be purchased to allow all placement and removal of filters in cassettes to be performed in the laboratory. Under no circumstances should filters be placed in or removed from the filter support cassettes in the field. 4.3.3 Filter Cassette Protective Containers Filter cassettes should be transported between the laboratory and the field in protective containers, as illustrated in Figure 4.2. Suitable containers should be available from the manufacturer or from a supplier specified by the manufacturer. Containers should be designed to protect the cassette and prevent it from moving within the container during transport. Containers should be fabricated from materials that have been demonstrated not to cause a static charge buildup. Static-proof bags are also an option. To avoid losses of particulate matter, do not allow the surface of the filter to touch any interior surfaces of the protective container. Containers should be marked for identification purposes. Special, sampler-specific protective containers are needed for the trays or cartridges that hold multiple filters for use in sequential samplers. Consult the sampler or cassette manufacturer for details and availability. If reuse of the containers is desired, a cleaning procedure that does not cause further contamination or degradation of the container should be developed.
Figure 4.2 Example equipment for transporting filter cassettes
2.12. 4.0 Procurement of Equipment and Supplies January 2016 Page 8 of 10
2.12–PM2.5 Reference/Class I Equivalent Methods
4.3.4 Insulated Shipping Container An insulated shipping container, capable of maintaining a temperature below 25 C, is needed to transport the filter cassette containers between the field and laboratory after sampling (see 40 CFR 50, Appendix L, Section 10.13). Plastic coolers, such as those used by campers and fishers, filled with leak-proof ice substitutes have proven suitable for this use. The sample cassette temperature should be monitored from the time of collection until the sample is equilibrated (i.e., during shipping, handling, and storage). Monitoring, during filter transport, can be accomplished by placing an inexpensive electronic max-min thermometer in the shipping container for each leg of the trip to the laboratory. Other devices, such as thermologgers, are available for use as well.
4.3.5 Filter Handling Containers Filter media (particularly the 46.2-mm-diameter [1.85-in], 2- m pore-size filter specified for use with reference or Class I equivalent samplers) are especially delicate and easily damaged. Post-sampling particle loss and filter damage may occur if proper handling procedures are not followed. To ensure the integrity of the sample, some type of protective covering is required for filter handling and conditioning within the laboratory. A glass or plastic petri dish or petri slide, designed to hold these filters, is recommended. These are available from some filter manufac-turers and laboratory supply houses. The dish should be of suitable size (i.e., large enough to allow easy removal of the filter, yet small enough to prevent excessive movement within the container) and should have a tight-fitting lid to prevent intrusion of dust or loss of particles during handling at the analytical laboratory. A label should be affixed to the container to provide proper identification. A sufficient number of containers should be available to store filters during laboratory operations. 4.3.6 Analytical Microbalance An analytical microbalance is required to weigh the sample filters. Its capacity should be ade-quate to weigh the sample filters (typically 100 to 500 mg). It should have sufficient room to weigh the type and size of filters used (i.e., 46.2-mm diameter). The microbalance must have a readability of no greater than ±1 g and should have a repeatability of 1 g. Readability is the smallest difference between two measured values that can be displayed by the microbalance. Repeatability is a measure of the ability of a microbalance to display the same result in repetitive measurements of the same weight under the same measurement conditions.
The precision of mass measurements for unexposed filters based on replicate weighings will be greater than the microbalance’s repeatability. The balance must be calibrated at installation and checked immediately before each weighing session. Electrostatic charge buildup may need to be neutralized in the microbalance’s weighing chamber and on individual filters. Refer to Section 9.6 and the balance manufacturer’s instruction manual and technical notes. Using microbalances with optional data input and output capabilities and automatic tare capabilities is recommended to reduce potential data entry errors and the time required to weigh a given filter.

2.12. 4.0 Procurement of Equipment and Supplies January 2016 Page 9 of 10
2.12–PM2.5 Reference/Class I Equivalent Methods
NOTE: Automated filter weighing and processing systems (e.g., PM2.5 autohandlers) are commercially available and can be purchased by monitoring organizations for PM2.5 laboratory operations. If procured, the monitoring organization must ensure that the autohandler’s weighing operations and data recording capabilities meet all the PM2.5 requirements specified in 40 CFR Part 50, Appendix L. 4.3.7 Calibration Reference Standards Mass reference standards (or balance check weights) should be used to verify proper micro-balance operation as part of normal QC operations. These standards should be ASTM Class 0, Class 1, or Class 2, traceable to NIST. The individual weight tolerances for the ASTM mass reference standards are given in Table 4-2; balance check weights with an individual tolerance of no more than 0.025 mg should be utilized in the laboratory (ASTM 1993b)11 . See
Section 9.7 of this document for more information regarding the mass reference standards and the terminology associated with their certification. The mass reference standards should be selected so as to bracket the maximum and minimum expected filter weights by 100 mg (e.g., 300 to 500 mg, given that the mass range of a typical 46.2-mm filter is from 360 to 380 mg). Blank filter weights may occasionally change, so if purchasing filters from a new producer, check the blank filter weight to ensure the reference standards will bracket blank as well as loaded filters. Also, some microbalance designs only require calibration at their full scale weight; therefore, purchase of a mass reference standard at that weight should also be considered to verify full scale calibration. For the same reasons, consult the microbalance manufacturer, and if possible, the manufacturer’s microbalance operating instructions.
NOTE: The microbalance’s resolution and repeatability are smaller than the tolerance of the most accurate classes of mass reference standards. However, the reported uncertainty of a mass reference standard recalibrated at NIST-traceable or NVLAP-accredited laboratories will be smaller than the individual tolerance of the standard. The accuracy of the gravimetric analysis may be limited by the uncertainty of the standards rather than by the microbalance’s characteristics.
11 http://www.ricelake.com/docs/prodinfo/ReferencePDFs/ASTM_reference.pdf
Table 4-2. Tolerance specifications for Mass Reference Standards
ASTM Class Individual weight tolerance (mg) 0 0.005
1 0.010
2 0.025

2.12. 4.0 Procurement of Equipment and Supplies January 2016 Page 10 of 10
2.12–PM2.5 Reference/Class I Equivalent Methods
4.3.8 Temperature and Relative Humidity Logger Temperature and relative humidity control in the weighing room are some of the most crucial criteria that must be met and recorded when weighing PM2.5 filters. A temperature and relative humidity logger is required in the laboratory to measure and record environmental conditions in the weighing room to provide evidence that weighing conditions have been met. The logger may be stand-alone or, preferably, networked into a data logging system. The logger should also be capable of continually logging data, at a minimum, of every five minutes over at least a seven-day period. A log that records data every minute is encouraged. The logger should be recertified annually by the vendor. Minimum performance specifications are as follows:
NOTE: Some loggers display rolling 5- or 15-minute averages for temperature and humidity. Actual raw data, and not rolling average data, needs to be used to determine room conditioning compliance.
4.3.9 Audit Equipment
Standards to audit laboratory equipment (the microbalance, and temperatures/humidity devices) should be procured. The audit standards must be NIST-traceable. The standards must not be the same equipment used for routine verification checks, although both sets of equipment may be of identical makes and models, and referenced to the same NIST primary standards.
Relative humidity:
measurement range of 20 - 50% RH readable to the nearest 0.5% RH accurate to within 2% RH five-minute logging NIST-traceable
Temperature:
measurement range of 18 to 25 C readable to the nearest 0.1 C accurate to within 2 C five-minute logging NIST-traceable

2.12.5.0 Installation January 2016 Page 1 of 4
2.12–PM2.5 Reference/Class I Equivalent Methods
5.0 Installation 5.1 Siting Requirements As with any type of air monitoring study in which the sample data are used to draw conclusions about a geographic area, the validity of those conclusions depends on the representativeness of the sampling data. Therefore, an initial goal of a PM2.5 monitoring project is to select a safe and secure site where the PM2.5 measurements will be representative of the monitoring objectives for that site. 5.1.1 Spatial and Temporal Considerations for Sites Spatial scale considerations are important in PM2.5 sampler siting. Spatial scales may range from small to large areas (i.e., micro, middle, neighborhood, urban, to regional scales). Whether the potential impact of particulate pollution is generated by a local or general source category affects the size of the spatial monitoring scale. In addition, the siting of the samplers within a monitoring network should reflect whether the expected impact will be limited to a small area (a few city blocks) or will extend to larger areas (metropolitan or rural). For temporal considerations, most interest focuses on either an annual geometric mean concen-tration or a 24-hour average concentration. Because siting of a PM2.5 sampler requires con-sidering the prevailing wind direction, a sampler sited for monitoring trends in air quality over a period of a year is not necessarily ideal for measuring 24-hour concentrations. Thus, the choice temporal considerations may influence sampler location. These spatial and temporal aspects of network design and optimum site exposure are more completely explained in 40 CFR Part 58, Appendix D (EPA 1997a), and in the guidance document for network design and optimum site exposure for PM2.5 and PM10 published by the U.S. EPA OAQPS (EPA 1997b). 5.1.2 Sampler Location Although spatial and temporal scales should be considered in site selection, the following sampler location requirements (40 CFR Part 58, Appendix E) must be observed regardless of the scale:
The PM2.5 sampler must have unobstructed air flow for a minimum of 2 meters in all horizontal directions and 1 meter vertical spacing from supporting structures (i.e. a roof). Be sure to provide sufficient area for a collocated Federal Reference Method (FRM) sampler and for installation of a portable FRM Performance Evaluation Program (PEP) sampler.
The sampler inlet must be placed at a height of 2 to 15 meters above ground level for
neighborhood and larger spatial scales, and at a height of 2 to 7 meters above ground level for middle scale and microscale sites.
If a PM2.5 sampler is collocated with any other particulate matter sampler, the spacing
between sampler inlets must be at least 2 meters apart for flow rates greater than 200 liters/min or at least 1 meter apart for samplers having flow rates less than 200 liters/min

2.12.5.0 Installation January 2016 Page 2 of 4
2.12–PM2.5 Reference/Class I Equivalent Methods
to preclude airflow interference. In either case, the spacing between inlets must be no more than 4 meters. The heights of the inlets should be within 1 meter as measured in the vertical direction. A waiver allowing up to 10 meters horizontal distance and up to 3 meters vertical distance (inlet to inlet) between a primary and collocated sampler may be approved by the Regional Administrator for sites at a neighborhood or larger scale of representation. This waiver may be approved during the annual network plan approval process as described in 40 CFR Part 58, Appendix A, Section 3.2.3.4.
5.1.3 Safety Place the PM2.5 sampler used for routine sampling where the operator can reach it safely regardless of weather conditions. If the sampler is located on a rooftop, care should be taken that the operator’s personal safety is not jeopardized by a slippery roof surface during inclement weather. Consideration also should be given to the fact that routine operation (i.e., calibrations, sample filter installation and recovery, flow checks, and audits) involves transporting supplies and equipment to and from the monitoring site. 5.1.4 Electrical Considerations In 40 CFR Part 50 Appendix L (EPA 1997c), a PM2.5 sampler is required to operate at 105 to 125 volts alternating current (AC) and a frequency of 59-61 hertz (Hz). The sampler may draw a higher current when the pump starts, possibly necessitating a slow-blow fuse. Although PM2.5 samplers are required to indicate power interruptions, every effort should be made to provide a stable power source for the monitoring site. The site should be able to provide sufficient power for the primary sampler, a collocated sampler, and a PEP sampler. 5.1.5 Security The security of the sampler itself depends largely on its location. Rooftop sites with locked access and ground-level sites with fences are common. Fences should be of chain-link or similar construction so as not to impede air flow across the site. The inlet of the sampler should extend above the top of the fence. In all cases, the security of the operating personnel, as well as the sampler, should be considered. 5.2 Sampler Installation Procedures 5.2.1 Receipt of Sampler
Some sampler manufacturers may have time limits for when they will accept damaged or inferior samplers back for repair. Therefore, it may be important to inspect samplers within this warranty period to avoid additional repair costs.
Establish an individual logbook for each sampler received.
Upon receipt of a PM2.5 sampler from the manufacturer, visually inspect the sampler to ensure that all components are accounted for.

2.12.5.0 Installation January 2016 Page 3 of 4
2.12–PM2.5 Reference/Class I Equivalent Methods
Compare the equipment delivered with the items listed on the enclosed packing slip. Notify the manufacturer immediately of any missing or damaged equipment.
Read the manufacturer’s instruction manual and become familiar with the sampler’s
operating and calibration procedures.
Assemble the sampler in the monitoring organization’s certification laboratory or maintenance facility (“shop”) according to the manufacturer’s instructions, except do not put oil in the impactor well (if using a WINS).
5.2.2 Initial Evaluation of Samplers The following activities can most conveniently take place in an indoor, equipment certification laboratory environment. Field measurements personnel should conduct these tests.
Power on the sampler. Check to be sure that the pump, mechanical components, clock, and electronic displays are functioning properly.
Perform a leak check according to the manufacturer’s instructions. Each sampler’s
procedure will be somewhat different from the others. If using a WINS, the impactor should not have oil in it. A flow check filter should be placed in the filter cassette holder for this test.
Perform checks of the temperature and pressure sensors according to the manufacturer’s instructions and Sections 7.4.5 and 7.4.6 of this document.
Perform a flow verification check according to the manufacturer’s instructions and
Section 7.4.7 of this document.
For sequential samplers, check that the timing and sequencing functions work properly.
If this is the first sampler model of its type received, conduct data downloading exercises to become familiar with the process. If it is a sequential sampler, operate it for at least 3 consecutive days to test the filter exchange system. Test the sampler in this manner for more than 3 consecutive days, if resources allow.
If the separator is a WINS, and if oil has been added to the impactor well during any of
the acceptance testing checks, remove it before transit to the field site. 5.2.3 Setup at Sampling Site
Carefully transport the sampler to the sampling site.
Secure the sampler in its predetermined location. The legs of the sampler can be bolted to angle aluminum bars. The bars can be held in the soil with metal stakes or they can be nailed to wooden beams if the sampler is on the surface of a roof. Keep the sampler level. Allow space for the installation of a FRM PEP sampler and possibly for a collocated

2.12.5.0 Installation January 2016 Page 4 of 4
2.12–PM2.5 Reference/Class I Equivalent Methods
sampler12. As described in 40 CFR Part 58, Appendix A, collocated or PEP monitors must be within 4 meters of each other and at least 2 meters apart for flow rates greater than 200 liters/min or at least 1 meter apart for samplers having flow rates less than 200 liters/min to preclude airflow interference. A waiver allowing up to 10 meters horizontal distance and up to 3 meters vertical distance (inlet to inlet) between a primary and collocated sampler may be approved by the Regional Administrator for sites at a neighborhood or larger scale of representation.
5.2.4 Field Evaluation It is expected that prior to field implementation the sampler(s) has been evaluated and “checked” to ensure it is operating properly. However, it may be appropriate to implement a few non-regulatory checks to ensure any technical issues not discovered in initial evaluations are identified and corrected prior to regulatory sampling.
Check all tubing for cleanliness, crimps, cracks, or breaks.
Plug the power cord into a line voltage outlet. The use of waterproof interlocking electrical connectors is recommended to ensure operator safety and to avoid shorts and/or power interruptions. Do not allow any electrical connections to become submerged during periods of inclement weather.
Ensure timer is programmed with the correct date, time, and sampling frequency. For
SLAMS, clocks must be set to local standard time13.
Perform a leak test with a filter in the filter cassette holder. Do not use the filter for subsequent sampling.
Allow the system to run and equilibrate to ambient conditions. This may take about 15
minutes.
Perform checks of the temperature and pressure sensors.
Perform a flow rate calibration/verification according to the manufacturer’s instructions.
Correct any problems before proceeding. Document all procedures and checks. The sampler is now ready for routine use.
12 Collocated QA samplers are required at 15% of sites for each primary method designation so not every site will need to have additional space for this monitor. However, every site will need to space for the PEP monitor. 13 40 CFR Part 58 App N

2.12.6.0 Calibration Procedures January 2016 Page 1 of 18
2.12–PM2.5 Reference/Class I Equivalent Methods
6.0 Calibration Procedures 6.1 Overview Calibration is defined as:
comparison of a measurement standard or instrument with another standard or instrument to detect, correlate, report, or eliminate by adjustment any inaccuracy of the compared14.
Verification Versus Calibration Since the term calibration is associated with an adjustment in either the instrument or software, these adjustments should be minimized as much as possible. Sometimes performing frequent adjustments to provide the “most accurate data possible” can be self-defeating and be the cause of additional measurement uncertainty. For example, adjusting an instrument based upon a standard that might be degrading or contaminated may actually cause data to be farther from the true concentration. Therefore, quality control procedures that include multi-point verifications are considered “checks without correction” and are used to ensure the instruments are within the calibration tolerances. Usually these tolerances have been developed so that as long as the instrument is within these tolerances, adjustments do not need to be made. However, verifications should be implemented at reasonable frequencies to avoid invalidating significant amounts of data. In this section it is assumed that multi-point verifications will take place and are used to determine if a calibration (with adjustment) is necessary.
NOTE: When the term “calibration” is used in the remainder of this section, it is assumed that a multi-point verification is initially performed and the operator has concluded that calibration (adjustment) is necessary. NOTE: EPA does not recommend post-processing of data to “correct” for data failing one-point or multi-point verifications. For example, if after failure of a flow rate verification and a subsequent verification and calibration found that data was biased by 15%, the previous routine data up until the last acceptable flow rate check is not adjusted by 15% and reported. Based upon validation criteria, the data is either reported as initially measured or invalidated.
Before a PM2.5 monitoring program is undertaken, all sampling and analysis equipment must be properly calibrated. Careful, accurate calibrations of sampling instrumentation and associated equipment are fundamental for any monitoring network. The suggestions and requirements specified in this section may serve as initial acceptance checks; further checks may be necessary if acceptance specifications are not met. All data and calculations should be recorded in a calibration logbook or on calibration data sheets. A separate logbook or a separate section of a logbook should be used for each apparatus and sampler in the program. Once the initial calibration of a PM2.5 sampler’s sensors is established, a schedule of field performance checks should be maintained to verify that the sensor calibration has not changed. Note that the calibration activity includes first determining if the sensor reading is still within the acceptance
14 http://www.nist.gov/pml/wmd/labmetrology/upload/section-10-glossary.pdf

2.12.6.0 Calibration Procedures January 2016 Page 2 of 18
2.12–PM2.5 Reference/Class I Equivalent Methods
limits of the calibration (multi-point verification). Whenever field performance checks of the sampler’s flow rate, external or internal leakage rate, temperature, or pressure systems show out-of-tolerance conditions, the operator is cautioned to double-check the equipment, the connections, and the sampler before proceeding with recalibration. It is possible that the sampler is not out of calibration and considerable time and effort could be spent unnecessarily. According to 40 CFR Part 50, Appendix L, Section 10 (EPA 1997), the PM2.5 sampler flow rate measurement system must be calibrated in terms of the actual volumetric flow rate (Qa) at prevailing ambient conditions of temperature and pressure, as opposed to the standard volu-metric flow rate (Qstd), which is measured or corrected to U.S. EPA-standard conditions of temperature and pressure. The flow rate measurement system consists of a dry gas meter or other flow sensor, a temperature sensor, a pressure sensor, and associated devices which, as needed, make control adjustments to maintain the set point of the volumetric flow rate in response to variations in temperature and pressure. Refer to the operating manual for the PM2.5 sampler for specific instructions on how to enter calibration data using the keypad and how to make other adjustments. Measured PM2.5 concentrations are also reported in terms of the actual volume at ambient conditions of temperature and pressure. Therefore, no conversions between Qa and Qstd are generally necessary. However, if the calibration for your flow rate standard or transfer standard is expressed in terms of Qstd, conversion to Qa is required. The calculations necessary to convert these flow rates are presented in Section 6.2, Equations (6-1) and (6-2). This section presents the following aspects of calibration procedures:
A discussion of Qa and Qstd flow rate designations and their applicability in a PM2.5 monitoring program (Section 6.2).
Basic calibration procedures and associated calculations for calibration of the sampler’s
flow rate measurement system (Section 6.3).
Discussion of flow rate transfer standards and calibration equipment (Sections 6.3.2 and 6.3.3).
Basic calibration procedures for the sampler’s temperature and pressure measurement
systems (Sections 6.4 and 6.5).
Procedures for conducting external and internal leak checks (Section 6.6 and 7.4).
Sampler calibration frequency requirements (Section 6.7). More detailed information on calibration and operation procedures can be found in each sampler manufacturer’s operating instruction manual. These instruction manuals are a required part of the manufacturer’s application for designation as an EPA Reference or Equivalent Method and as such have been reviewed and accepted for their designated sampler.

2.12.6.0 Calibration Procedures January 2016 Page 3 of 18
2.12–PM2.5 Reference/Class I Equivalent Methods
6.2 General Aspects of Flow Rate Measurement and PM2.5 Sampler Calibration As discussed in Section 3.0, “Summary,” a reference or Class I equivalent PM2.5 sampler includes a specially designed sample air inlet, a PM2.5 separator (e.g., WINS or VSCC™), and a sample flow rate control system. The particle-size discrimination characteristics of both the inlet and the separator are critically dependent on specific internal air velocities; a change in velocity will result in a change in the nominal particle size collected. These velocities are determined by the actual volumetric flow rate (not the mass flow rate) through each device. Therefore, the actual volumetric flow rate through the sampler’s inlet and separator must be maintained at a constant value that is as close as possible to the design flow rate specified for the sampler. The design flow rate for a given sampler is specified in the sampler’s operation or instruction manual. Upper and lower tolerance limits for the sampler’s flow rate are specified in 40 CFR Part 50, Appendix L, and are + 5% of the design flow rate. As mentioned previously, the calibration of the sampler’s flow rate measurement system must be performed in terms of actual volumetric units (Qa or Va). Results must be recorded in the same units. However, previous measurements for PM10 were based on standard units (Qstd or Vstd); thus, the certification for some calibration standards may be in terms of standard volumetric flow rate units (Qstd). Therefore, it is important to understand the definition for each of these two types of volumetric units and the distinction between them. Before calibration procedures are initiated, the monitoring organization personnel should review the following flow rate definitions:
Qa—Actual volumetric air flow rates that are measured and expressed at existing conditions of temperature and pressure are denoted by Qa (Qactual). Typical units are L/min and m3/min. Inlet design flow rates for PM2.5 samplers are always given in actual volumetric flow units.
Qstd—Air flow rates that have been adjusted to EPA-standard conditions of temperature
and pressure (25 C or 298 K and 760 mmHg or 101 kPa) are denoted by Qstd (Qstandard). Typical units are L/min and m3/min. Standard volume flow rates are often used by engineers and scientists because they are equivalent to mass flow rate units. Prior to 1997, standard volumes (derived from standard volume flow rates and the total time of sampling) were also required in the calculation of mass concentration ( g/m3) in reporting PM10 measurements.
These Qa and Qstd flow rate units must not be confused or interchanged. If necessary, the flow rate units can be converted, provided the temperature and pressure are known. The following conversion formulas can also be used for average flow rates ( Qa and Qstd ) over a sampling period by substituting average temperature( Ta ) and pressure ( Pa ) over the sampling period. Qstd = Qa(Pa/Pstd)(Tstd/Ta) (6-1) Qa = Qstd(Pstd/Pa)(Ta/Tstd) (6-2) where

2.12.6.0 Calibration Procedures January 2016 Page 4 of 18
2.12–PM2.5 Reference/Class I Equivalent Methods
Qstd = standard volume flow rate, standard m3/min Qa = actual volume flow rate, actual m3/min Pa = ambient barometric pressure, mmHg (or kPa) Pstd = EPA standard barometric pressure, 760 mmHg (or 101 kPa) Tstd = EPA standard temperature, 298 K (25 C + 273) Ta = ambient temperature, K (ambient C + 273). Any gas flow rate measured or expressed in actual volumetric units (Qa) is always associated with a particular temperature and pressure of the gas. If either the temperature or the pressure changes, the volumetric flow rate will also change, even though the mass flow rate of the gas remains constant. Therefore, when the flow rate is measured at different locations in the sampler, the volumetric flow rate observed will be different if either the temperature or the pressure is different at the various locations. For example, when a flow calibration device is connected to the sampler inlet, the pressure of the air flow measured by the flow calibration standard will be the ambient barometric pressure. However, the pressure of the flowing air measured by the sampler’s flow measurement system will be somewhat lower than the ambient barometric pressure because all flow calibration devices cause some pressure drop. If this pressure drop is negligible (<1 percent or <4 in of H2O), then there is no problem; the pressure can be considered the same for both measurement systems. But if the pressure drop is significant (>1 percent or >4 in of H2O), then the volumetric flow rate measured by the two systems will be different, and this difference should be taken into account when comparing them. Sampler flow rate measurement systems may or may not automatically correct for this pressure change. If not, one of the flow rate measurements must be corrected to the same pressure as the other flow rate before they can be compared. This correction is accomplished using the following formula: Q1 = Q2 (P2 /P1)(T1 /T2) (6-3) where Q1 = actual volume flow rate at the pressure and temperature at the first measurement
point, m3/min Q2 = actual volume flow rate at the second measurement point, m3/min P1 = pressure at the first measurement point, mmHg (or kPa) P2 = pressure at the second measurement point, mmHg (or kPa) T1 = temperature at the first measurement point, K ( C + 273) T2 = temperature at the second measurement point, K ( C + 273). Note: In many cases the temperatures will be identical, so that T1=T2 and the (T1/T2) term will equal 1. 6.3 Calibration of the Sampler Flow Rate Measurement System A full, detailed, EPA-approved calibration procedure, tailored specifically to each commercially available PM2.5 sampler, is contained in the operating or instruction manual associated with each sampler designated as a reference or equivalent method under 40 CFR Part 53. Follow that specific procedure carefully and thoroughly to calibrate the sampler.

2.12.6.0 Calibration Procedures January 2016 Page 5 of 18
2.12–PM2.5 Reference/Class I Equivalent Methods
CAUTION
Do not calibrate the flow rate measurement system without first performing a leak check and ensuring that the temperature and pressure measurement systems are in calibration. If there is doubt, calibrate the temperature and pressure sensors (refer to Sections 6.4 and 6.5) before calibrating the flow rate measurement system.
This section provides additional precautions, guidance, and information on flow rate standards and calibration that may not be contained in the specific instruction manual procedure. It also presents a generic outline of the general procedure used to calibrate the flow rate measurement systems of commercially available samplers. This information can be used to augment the sampler-specific procedures. 6.3.1 General Requirements and Guidance
Checking to verify that a sampler’s flow rate measurement system still reads within the acceptance limit of the previous calibration should be done:
according to the sampler manufacturer’s operating instructions; at the field site; every 30 days (minimum); or following major electrical or mechanical maintenance, such as replacement of a circuit
board or rebuilding of the sampling pump assembly. If the verification fails, then recalibration and/or maintenance is required. Before beginning a flow rate calibration, the operator should repeat the flow rate verification to be certain there were no leaks in the connections between the flow rate verification device and the sampler inlet and that the flow rate data were reduced and interpreted correctly. In addition, the operator should ensure that the collector’s ambient temperature and pressure measurement systems are responding accurately; if not, these systems should be recalibrated (or replaced and calibrated) before performing a flow rate calibration.
1. Multi-point calibrations and single-point verifications of each sampler’s flow rate must be
performed periodically as defined in the PM2.5 Validation Template15to establish traceability of subsequent flow rate measurements to an authoritative flow rate standard. Calibration with a flow rate standard (or a transfer standard) that is certified against a National Institute of Standards and Technology (NIST)-traceable standard (see Section 6.3.3 regarding NIST traceability) transfers the NIST traceability to the sampler’s flow rate measurement system. This NIST traceability is required by Appendix A of 40 CFR Part 58 Sec. 2.6.3.
15 http://www3.epa.gov/ttn/amtic/qapollutant.html
2.12.6.0 Calibration Procedures January 2016 Page 6 of 18
2.12–PM2.5 Reference/Class I Equivalent Methods
2. PM2.5 samplers may employ various types of flow rate measurement devices. The specific
calibration standard and procedure used for calibration or verification of the sampler’s flow rate measurement device will vary depending on the type of flow rate measurement system employed (40 CFR Part 50, Appendix L, Sec. 9.2.1). The sampler’s operation or instruction manual identifies one or more types of flow rate or volume standards recommended for calibration and provides a detailed calibration procedure.
3. Calibration of the sampler’s flow rate measurement system must be in units of the actual
ambient volumetric flow rate (Qa) (40 CFR Part 50, Appendix L, Sec. 9.2.1). 4. The sampler flow rate measurement system must be calibrated or verified by installing an
unused filter in the filter holder, removing the sampler inlet, and connecting the flow adapter and flow rate standard to the sampler, in accordance with the instruction manual, so that the flow rate standard accurately measures the sampler’s flow rate. The operator shall verify that no leaks exist between the flow rate standard and the sampler (40 CFR Part 50, Appendix L, Sec. 9.2.3).
5. The calibration relationship between the flow rate (in actual L/min) indicated by the flow
rate standard and by the sampler’s flow rate measurement device must be established or verified in accordance with the sampler’s operation or instruction manual. Temperature and pressure corrections may be required for some types of flow rate standards (40 CFR Part 50, Appendix L, Sec. 9.2.4). Consult the operations manual for the particular flow rate standard for guidance on the nature and calculation of any corrections that may be required for the standard.
6. Monthly verification of the sampler’s flow rate shall consist of one flow rate measurement
at the sampler’s operational flow rate (40 CFR Part 50, Appendix L, Section 9.2.4). A full three-point calibration must be carried out whenever a one-point verification indicates that the sampler’s flow rate measurement system differs by ±4 percent or more from the flow rate measured by the flow rate standard and greater than 5% of the design flow rate (40 CFR Part 50, Appendix L, Sec. 9.2.5). The one-point verification must be repeated after the three-point calibration to double-check that the sampler operates properly at the design flow rate of 16.67 L/min following the calibration.
7. Calibration of the sampler’s flow rate measurement device must consist of at least three
separate flow rate measurements (a multi-point calibration), evenly spaced within the range of -10 to +10 percent of the sampler’s operational flow rate (40 CFR Part 50, Appendix L, Section 9.2.4). The sampler’s flow control system shall allow for operator adjustment of the operational flow rate of the sampler over a range of at least ±15 percent of the targeted flow rate (40 CFR Part 50, Appendix L, Section 7.4.2). Calibration procedures for the various samplers call for the results of three different flow rates to be keyed in to establish the calibration. The sampler’s instruction manual will provide additional guidance on flow rate adjustment.
8. Following a calibration, the flow adapter and flow rate standard are disconnected from the
sampler, and the sampler’s inlet is carefully reinstalled. The flow check filter remains in place. The sampler’s flow rate must then be checked under normal operating conditions,
2.12.6.0 Calibration Procedures January 2016 Page 7 of 18
2.12–PM2.5 Reference/Class I Equivalent Methods
using the sampler’s flow rate measurement system. The operator should generate flow and view the displayed flow rate on the sampler’s screen. Ensure the displayed flow rate differs by no more than ±2 percent from the required operational value of 16.67 L/min (40 CFR Part 50, Appendix L, Sec. 9.2.6). If the sampler’s flow rate meets this criterion, the filter is then removed and the sampler is returned to service. However, if the sampler’s displayed flow rate is more than ±2 percent different, the sampler’s flow rate must be adjusted again to the specified flow rate.
6.3.2 Flow Rate Calibration Standards Flow rate standards used for calibrating or verifying the sampler’s flow rate measurement device must have an accuracy of ±2 percent. This flow rate standard must be a separate, stand-alone device, and may be designed to connect to the flow adapter device. The flow rate standard must have its own certification and must be traceable to a NIST primary standard for volume or flow rate (40 CFR Part 50, Appendix L, Section 9.1.2). See Section 6.3.3 of this document for more information on NIST traceability. Consult the technical literature and the vendor’s descriptions of various flow rate standards and their performance under various weather conditions before making a decision to purchase one. All flow rate calibration standards should be fully equilibrated to the temperature of the air of the instrument whose flow rate is to be measured. This temperature equilibration can take up to an hour, depending on the temperature at which the standard was stored prior to moving it to the point of use. During this thermal equilibration period, the standard should be exposed to the prevailing air temperature, but it also should be protected from precipitation, wind, dust, solar heating, and other conditions that could affect its accuracy. Various types of flow rate standards that might be considered for sampler calibration follow.
Bubble flowmeters—Although completely manually operated and timed bubble flowmeters are available, a semiautomatic instrument such as the Gilian* flowmeter is easier to use and is more likely to provide uniform flow rate measurements. Because the liquid used to form the bubbles is usually water-based, a water-vapor correction may be required to compensate for a volume increase due to evaporation of the water in the instrument. Furthermore, the instrument cannot be used below 0 C because the soap solution will freeze. Bubble meters are primary standards, but are not conducive for use in the field.
Piston flowmeters—Automatic dry-piston flowmeters such as the BIOS* flowmeter are
relatively easy to use and not subject to the water-vapor correction or the liquid freezing limitation of the bubble flowmeters. However, they may still be subject to a lower operational temperature limit.
Mass flowmeters—Although mass flowmeters may be considered as calibration
*Mention of commercial products should not be interpreted as endorsement. This product is given as a
typical and perhaps well-known example of the general class of instruments; other instruments in the class are available and may be fully acceptable.

2.12.6.0 Calibration Procedures January 2016 Page 8 of 18
2.12–PM2.5 Reference/Class I Equivalent Methods
standards, they have a number of shortcomings in this application. They have a high pressure drop, which could change the sampler flow rate or otherwise affect the operation of the sampler. Mass flowmeters also require conversion of the measured mass flow rate to the actual volumetric flow rate for comparison to the PM2.5 sampler’s displayed value. The flow rate measured by the sampler may also have to be corrected to account for the significant pressure drop introduced by the mass flowmeter itself. Finally, mass flowmeters are subject to zero or span drift, particularly over the wide range of temperatures encountered at field sites, so their accuracy should be reverified frequently over a wide temperature range.
Orifice devices—Orifice devices are simple and reliable, but they too require
corrections for temperature and pressure and may have a significant pressure drop. They also require a very accurate and sensitive differential pressure measurement device such as a manometer or an aneroid differential pressure gauge, whose accuracy must be reverified frequently. Readings from electronic micromanometers should be cross-checked against a water manometer at some frequency in order to verify the standard is operating within acceptable limits.
Laminar flow elements—Laminar flow elements generally have a lower pressure drop
than orifice devices, but otherwise have the same requirements and disadvantages.
Wet test meters—Wet test meters are generally not practical for field use, but may be used for laboratory calibrations.
Dry gas meters—Dry gas meters may be considered for field calibration. Some meters
may have a substantial pressure drop. They should be checked for leaks and mechanical problems and be recertified at least annually.
6.3.3 NIST Traceability and Certification of Flow Rate Standards The flow rate standard used for flow rate calibration should have its own certification and should be traceable to other standards for volume or flow rate, standards that are themselves NIST-traceable. It is recommended that the “other standards” be either those of a commercial calibration laboratory or those primary standards maintained by the SLT agency or EPA Region. The greater the number of calibration steps needed to link a measurement to a NIST standard, the greater the degradation of quality of this type of traceability. Thus, the “other standard” should be at least as accurate (EPA suggests more accurate) and stable as the flow rate standards to be made traceable and should be no more than two traceability steps removed from an actual NIST standard. A calibration relationship for the flow rate standard, such as an equation, curve, or family of curves, should be established that is accurate to within 2 percent over the expected range of ambient temperatures and pressures at which the flow rate standard is expected to be used. The flow rate standard must be recalibrated or reverified and recertified at least annually16. The EPA’s Quality Assurance Handbook for Air Pollution Measurement Systems, Volume II should be consulted for further information on the calibration of primary and secondary standards for flow measurements and the hierarchy of standards.
16 40 CFR Part 50 Appendix L Se. 9.2.2

2.12.6.0 Calibration Procedures January 2016 Page 9 of 18
2.12–PM2.5 Reference/Class I Equivalent Methods
The actual frequency with which this recertification process must be completed depends on the type of flow rate standard—some are likely to be much more stable than others. The best way to determine recertification requirements is to maintain a control chart (a running plot of the differ-ence or percent difference between the flow rate standard and the NIST-traceable primary flow rate or volume standard) for all comparisons. In addition to providing excellent documentation of the certification of the standard, a control chart also gives a good indication of the stability of the standard. If the two standard deviation control limits are close together, the chart indicates that the standard is very stable and could be recertified less frequently. The minimum recertification frequency is every 365 days and once a calendar year. On the other hand, if the limits are wide, the chart would indicate a less stable standard that should be recertified more often. A particu-larly unstable standard may be unusable no matter how often it is recertified. It is also recommended that all transfer standards being sent out for certifications (or being checked/certified in-house) be checked against a specific piece of stationary laboratory equipment in house to observe the “As sent” and the “As returned” conditions of the standard. Monitoring organizations have experienced what they have considered inferior certifications from vendors, so it is a good idea to verify standards that are returned prior to putting them into service. 6.3.4 Outline of Generic Flow Rate Calibration Procedure A fully detailed, EPA-approved flow rate calibration procedure, tailored specifically to each commercially available PM2.5 sampler, is contained in the operations manual associated with each sampler that is designated as a reference or equivalent method under 40 CFR Part 53. Follow that sampler-specific procedure carefully and thoroughly, in conjunction with the guidance in this section, to calibrate the sampler. The following steps outline a general calibration procedure. Figure 6.1 can be used as an example worksheet to record this information
NOTE: Upon initial installation at the field site, ensure that the sampler is operational and fully warmed up before proceeding. Depending on weather conditions, the sampler should run for a minimum of 10 to 15 minutes before starting the flow rate calibration process.
1. Before performing a flow rate calibration, make sure that an external leak check has been
performed and passed, and that the sampler’s temperature and pressure sensors have been checked and have met acceptance criteria. If any of these checks fail, perform corrective actions prior to starting the flow rate calibration procedure below.
2. Equilibrate the selected flow rate calibration device to ambient temperature conditions
according to guidance provided in Section 6.3.2. 3. Install a filter cassette with an unused 46.2-mm filter in the sampler. This filter should meet
all specifications for PM2.5 sampling, but it does not need to be pre- or post-weighed. This filter must not be used for sampling but can be used several more times for calibration purposes, provided particulate loading on the filter is minimal.

2.12.6.0 Calibration Procedures January 2016 Page 10 of 18
2.12–PM2.5 Reference/Class I Equivalent Methods
4. Remove the inlet from the sampler. Place the flow calibration device on the sampler down-tube using a flow adapter device, if necessary. Ensure that any valves in the flow adapter are open so that flow through the sampler is unrestricted.
5. Place the sampler in calibration mode according to the instructions in the manufacturer’s
operating manual. 6. Follow the instructions in the manufacturer’s operating manual for performing the multi-
point flow calibration. 7. Once calibration is complete, turn off the sampler pump, remove the filter/cassette, remove
the flow calibration device (and flow adapter device, if applicable), and replace the sampler inlet.
8. The sampler flow rate is now calibrated. Refer to Section 7.4.7 for the procedure for flow rate verification, which will be used until the next flow rate calibration. 6.4 Calibration of Sampler Temperature Sensors A fully detailed, EPA-approved calibration procedure for temperature sensors, tailored specifi-cally to each commercially available PM2.5 sampler, is contained in the operating manual associated with each sampler that is designated as a reference or Class I equivalent method under 40 CFR Part 53. Follow these specific procedure(s) carefully and thoroughly to calibrate the sampler’s temperature sensors. It is recommended that a three-point temperature calibration of each temperature sensor be performed each year and that a one-point check of the ambient air temperature sensor be made monthly. This section provides additional precautions, guidance, and information on temperature standards and calibration that may not be contained in the specific instruction manual procedure. The section also presents a generic outline of the general procedure used for calibration of the temperature measurement systems of commercially available samplers. This information should be used to augment the specific instruction manual procedure. 6.4.1 General Requirements and Guidance 1. Multi-point (at least three temperature points) calibration followed by single-point
verification of each sampler’s temperature sensors should be performed annually to establish traceability of subsequent temperature measurements to an authoritative temperature standard. Calibration with a temperature standard that is traceable to a NIST-traceable primary standard (see Section 6.3.3 regarding NIST-traceability) transfers the traceability to the sampler’s temperature sensors. Because temperature affects the flow rate, NIST traceability of the sampler’s temperature measurements is also required for flow rate measurement traceability.
2. PM2.5 sampler manufacturers use various types of temperature sensors. The specific
calibration standard and procedure used for calibration or verification of the sampler’s temperature sensor may vary depending on the type of sensors used.
2.12.6.0 Calibration Procedures January 2016 Page 11 of 18
2.12–PM2.5 Reference/Class I Equivalent Methods
3. Multi-point calibration of the sampler’s temperature measurement system must consist of at least three separate comparative temperature measurements, evenly spaced over the sampler’s expected operational ambient temperature range. Both the ambient air and filter temperatures are monitored in order to assess filter temperature deviation from ambient temperature and to set a flag should the filter temperature rise more than 5 C above ambient temperatures and stay there for 30 consecutive minutes.
4. Section 3.4 of the EPA Quality Assurance Handbook for Air Pollution Measurement
Systems, Volume IV: Meteorological Measurements (EPA 2008) contains detailed guidance on calibration of temperature sensors and measurement systems (including a reference to the manufacturer’s manual for adjustment of signal conditioning circuits), required calibration equipment, methods for calibrating the temperature, a discussion of T calibrations, and an example of a calibration report.
5. Ideally, temperature calibration should occur in the field to assess temperature sensor
responses as they occur in normal operation. However, climate conditions may make this difficult and removal of the sampler to an indoor location may be preferable. Usually, the sensor element is removed from the sampler and its connecting wires are left attached to the sampler. The space formerly occupied by the sensor should be plugged with a fitting to prevent any contamination of the sampling system and entry of ambient air.
6. Monthly verification of a sampler’s temperature sensors responses should consist of one
temperature measurement made at the sampler’s current temperature reading. This one-point verification may be substituted for a three-point calibration, provided that a full three-point calibration is performed upon initial installation of the sampler and at least once per year thereafter, and the temperature measurement system has met the ±2 C accuracy requirement in the previous three-point calibration. A full three-point calibration should be performed whenever a 1-point verification indicates that the sampler’s temperature measurement system differs by ±2 C or more from the temperature measured by the temperature standard. A 1-point verification of the ambient temperature sensor should be done following the three-point calibration to ensure the sampler has returned to its normal operating conditions.
6.4.2 Temperature Calibration Standards The operations manual associated with the sampler should identify one or more types of temperature standards recommended for calibration and provide a detailed calibration procedure for each type that is specifically designed for the particular sampler. The EPA Quality Assurance Handbook for Air Pollution Measurement Systems, Volume IV: Meteorological Measurements (EPA 2008), Section 3.4, provides information on calibration equipment and methods for assessing response characteristics of temperature sensors. The ambient air and filter temperature sensors of a reference or Class I equivalent PM2.5 sampler must have a resolution of 0.1 C and an accuracy of ±2 C over the range of -30 to 45 C. The Handbook describes how to prepare three stable thermal mass assemblies whose temperatures can be determined to about 0.1 C. The thermal mass assemblies can be as simple as insulated vacuum bottles (i.e., thermos bottles) containing pure water or ice, or they may be solid
2.12.6.0 Calibration Procedures January 2016 Page 12 of 18
2.12–PM2.5 Reference/Class I Equivalent Methods
cylinders of aluminum metal. A good American Society for Testing and Materials (ASTM)- or NIST-traceable alcohol thermometer or thermocouple is also needed. The thermometer and the PM2.5 sampler sensor are both immersed in the thermal mass and allowed to equilibrate; the temperature readings are then compared. 6.4.3 NIST-Traceability and Certification of Temperature Standards The temperature standard used for temperature calibration must have its own certification showing traceability to a NIST primary standard. A calibration relationship to the temperature standard (an equation or a curve) is established that is accurate to within 0.5 C over the expected range of ambient temperatures at which the temperature standard will be used. The temperature standard should be reverified and recertified at least annually. The actual frequency of recertification depends on the type of temperature standard; some are much more stable than others. The best way to determine recertification requirements is to maintain a control chart. Additional reference sources concerning temperature measurements and calibration are: Liquid-in-Glass Thermometry (NIST 1976); Thermometer Calibration: A Model for State Calibration Laboratories (NIST 1986); NIST Measurement Services: Liquid-in-Glass Thermometer Calibration Service (NIST 1988); and The Calibration of Thermocouples and Thermocouple Materials (NIST 1989). 6.4.4 Outline of Generic Temperature Calibration Procedure Both the ambient air and filter temperature sensors should be calibrated once per year. The ambient air sensor is located inside the shielded fixture on the outside of the PM2.5 sampler and is easy to unfasten and remove for comparison to a temperature transfer standard. It is possible to conduct the three-point calibration of the ambient sensor at the field site, although it may prove easier to remove the sampler to the field office to avoid weather problems and for convenience in preparing the temperature standards. The filter temperature sensor of reference or Class I equivalent PM2.5 samplers is located in the open space just below the filter cassette. It is threaded through the wall of the filter assembly section of the sampler, and removal of plastic or metal fittings is required to remove the sensor and its associated wiring. It is recommended that this sensor be calibrated in the field office. The temperature sensor housing, the sampler inlet, and the interior of the downtube can also be cleaned in the laboratory. Be careful when removing the filter temperature sensor—do not gall the fittings because this could start an internal leak after installation. It is suggested that a sampler leak check be performed after reinstallation of the filter temperature sensor. Several steps to follow in calibrating ambient air temperature sensors are given below. Make frequent reference to the operator’s instruction manual for sampler-specific procedures and instructions. 1. Remove the ambient temperature sensor from the aspirated radiation shield so that it can be
placed in a constant temperature bath while it is still connected to the sampler’s signal conditioner.

2.12.6.0 Calibration Procedures January 2016 Page 13 of 18
2.12–PM2.5 Reference/Class I Equivalent Methods
2. Prepare a convenient container (such as an insulated vacuum bottle) for the ambient tem-perature water bath and the ice slurry bath. See Step 3 below. If complete immersion of the sensor is necessary, wrap it in plastic film so liquid can reach the point where the con-necting wire(s) and the sensor interface without wetting them. Use partial immersion when possible, thus keeping the interface dry. If immersion should be avoided altogether, it will be necessary to use thermal masses of metal rather than those based on water. Refer to Section 3.4 of Volume IV of the EPA QA Handbook (EPA 2008). To further insulate the vacuum bottle, it can be positioned inside a larger 2-gallon insulated container that has been modified to allow wires or cables to enter the top.
Keep the temperature changes relatively small and make comparative measurements in this order: AMBIENT COLD AMBIENT HOT AMBIENT. The range of temperatures need only be as broad as that expected to contain all the ambient temperatures that will be experienced during the upcoming time period, generally a year. The range to be expected is site-specific. HOT may have to be 120 F for Phoenix, AZ, but around 80 F for a location such as Fairbanks, AK.
3. For the ambient bath, use an insulated bottle that was filled with tap or deionized water
several hours earlier and allowed to equilibrate to ambient temperature. For the ice slurry, the ice should be made with distilled water and then crushed into pea-sized pieces and mixed with distilled water until an easily penetrable slurry state is reached. As long as ice is present in the slurry and the open end of the bottle is guarded from ambient air temperature fluctuations, the ice slurry temperature will be 0.0 ± 0.1 C.
4. Wrap the sensor(s) and a thermometer together with a rubber band. The thermometer bulb
and the temperature sensor active site should be close together. Immerse the sensor and the attached thermometer in the ambient temperature bath. Use a cork or some other device to cover the open end of the insulated bottle and thus keep ambient air from circulating over the top surface of the water (or ice slurry mass). The bath liquid should be stirred to ensure the temperature is uniform; never use the thermometer or temperature sensor to stir the bath. Gentle stirring should continue, if possible, during the measurement process; however, do not stir while readings are being taken because this may introduce noise into the readings. Wait for the ambient thermal mass and the sensor/thermometer temperatures to equilibrate. Be sure successive temperature readings are stable (indicating equilibration with the ice slurry) before taking comparative readings.
5. For each thermal test condition or mass, in the order indicated in Step 2 above, make a
series of five measurements, taken about a minute apart. Accurately read the meniscus of the thermometer. Use magnification if necessary to see the meniscus; avoid parallax errors. If the measurements made support the assumption of equilibrium, then average the five readings and record the result as the sensor temperature relative to the thermometer for hot, ambient, and cold, 0.0 C relative to the ice slurry. Record all readings in the sampler notebook and/or on the monitoring organization’s calibration form/spreadsheet.
2.12.6.0 Calibration Procedures January 2016 Page 14 of 18
2.12–PM2.5 Reference/Class I Equivalent Methods
6.5 Calibration of Sampler Barometric Pressure Sensor Each reference or Class I equivalent PM2.5 sampler has a built-in atmospheric pressure sensor whose output is processed to allow control of the actual sampling flow rate to the design value of 16.67 L/min. This section provides information concerning the use of barometers and a general procedure for sampler calibration. Several types of barometers are available to measure barometric pressure, but the most common and user-friendly type of barometer is the digital pressure indicator. All barometers, digital and mechanical, must be recertified or calibrated to a NIST-traceable standard on a regular basis (e.g., yearly). The manufacturer’s operating or instruction manual must be consulted for sampler-specific information on how to make adjustments to calibrate the pressure sensor. Due to the complications in setting up a 3-point barometric pressure calibration, EPA will accept a one-point verification with an independent NIST-traceable audit device (other than the device used for monthly routine verifications) to satisfy an annual calibration. The procedure suggested in Section 6.5.2 can be used for a multi-point calibration.
6.5.1 General Requirements 1. As required in 40 CFR Part 50, Appendix L, the sampler must have the capability to
measure the barometric pressure of the air surrounding the sampler over a range of 600 to 800 mmHg. This measurement shall have a resolution of 5 mmHg and a NIST-traceable accuracy of ±10 mmHg.
2. According to ASTM standard D 3631 (ASTM 1977), a barometer can be calibrated by
comparing it with a secondary standard traceable to a NIST primary standard. 3. Protect all barometers from violent mechanical shock and explosively sudden changes in
pressure. A barometer subjected to either of these events must be recalibrated. Minimize the vertical and horizontal temperature gradients across the instruments. Locate the instrument so as to avoid direct sunlight, drafts, and vibrations.
4. Barometric pressure calibration is suggested at installation and on a one-point verification
failure.
6.5.2 Outline of Generic Barometric Pressure Calibration Procedure
The barometric pressure sensor should be calibrated once per year. The barometric pressure sensor is typically located inside the PM2.5 sampler body and can be difficult to access. It is possible to conduct the three-point calibration of the barometric pressure sensor at the field site, although it may prove easier to remove the sampler to the field office to avoid weather problems if a partial disassembly is required. As stated above, a 1-point pressure verification is acceptable. Several steps to follow in calibrating barometric pressure sensors are given below. This is a general procedure; therefore, refer to the operator’s instruction manual for sampler-specific procedures and instructions. Descriptions of different types of barometers follow this section to aid the operator in selecting and using barometric pressure standards for calibration and/or

2.12.6.0 Calibration Procedures January 2016 Page 15 of 18
2.12–PM2.5 Reference/Class I Equivalent Methods
verification procedures. 1. Place the calibration standard aside, away from direct sunlight and extremes of temperature,
and allow the unit to equilibrate to ambient conditions. Typical equilibration times for calibration standards are from 15 to 30 minutes depending on starting temperatures.
2. As the calibration standard equilibrates, find the small port on the sampler which leads to the barometric pressure sensor. The operator’s manual can help locate and access this port. This port will be located inside or under the sampler where it is protected from the weather.
3. Setup the sampler to show the calibration screen for barometric pressure calibration. The
screen should contain the current barometric pressure measurement and an input mechanism to adjust the measurement. This screen will be used to adjust the sampler measurement to the calibrator measurement during the calibration process. On some samplers, the operator may be required to manually adjust a potentiometer to adjust the measurement.
4. Attach three short lengths of tubing to a “T” adapter and connect the first length of tubing to
the pressure port. The second length should be connected to the pressure fitting of a NIST-traceable barometer or pressure indicator, and the third length of tubing should be connected to a gas-tight syringe.
5. Draw back on the plunger to apply a light suction until the NIST-traceable barometer reads
about 100 mmHg below ambient pressure (e.g., 660 Hg if ambient pressure is 760 mmHg). Clamp off the hose with a tubing clamp or hemostats to prevent leakage and thus hold the pressure steady.
6. If the two numbers do not match within 10 mmHg or better, adjust the sampler’s barometric
pressure display or potentiometer. Record the actual (calibrator measurement) and indicated (sampler measurement) values on a calibration form or field logbook.
7. Repeat this process at ambient conditions and at a point 30 to 100 mmHg higher than
ambient pressure recording all values throughout the process.
8. If the sampler cannot be brought into satisfactory agreement with the NIST-traceable barometer, troubleshooting and repairs may be required or the pressure sensor may have to be replaced.
6.5.2.1 Digital Pressure Indicator The digital pressure indicator operates using a small pressure sensor and microprocessor to produce a reading in units of pressure measurement. These are typically hand-held units with excellent precision, resolution, and stability. Digital pressure indicators are required to be calibrated to a NIST-traceable standard on a regular basis (e.g., yearly) to ensure precision and proper operation. In most cases, these units must be returned to the vendor or sent to a metrology laboratory for this calibration.

2.12.6.0 Calibration Procedures January 2016 Page 16 of 18
2.12–PM2.5 Reference/Class I Equivalent Methods
6.5.2.2 Fortin-Type Barometer Readings
The Fortin mercurial type of barometer works on fundamental principles of length and mass and is therefore more accurate but also more difficult to read and correct than other types. By comparison, the precision aneroid barometer is an evacuated capsule with a flexible bellows coupled through mechanical, electrical, or optical linkage to an indicator. It is potentially less accurate than the Fortin-type, but can be transported with less risk to the reliability of its measurements (and it presents no hazard to personnel from mercury spills). The Fortin-type barometer is best employed as a higher quality laboratory standard that is used to adjust and certify an aneroid barometer in the laboratory. The certified aneroid barometer can then be taken to the field and used to verify readouts from the transducer-type pressure sensor in the sampler. The sampler sensor can be left in the sampler during the comparison because atmospheric pressures are equivalent within a 100-meter horizontal distance and a 0.5-meter vertical distance. If there is a discrepancy, the aneroid barometer should be recompared to the Fortin-type barometer or other standard upon return to the laboratory. A discrepancy with the sampler sensor could indicate an offset in the sampler’s pressure sensor adjustment or the need for replacement of the unit. 6.5.2.3 Aneroid-Type Barometer The aneroid barometer is a mechanical instrument used for measuring barometric pressure using the principles of expansion and contraction to demonstrate changes in pressure. An aneroid barometer typically contains an evacuated cell or capsule that is prevented from collapsing by a strong spring. Small changes in pressure causes the cell to expand or contract driving mechanical levers to amplify the small movements and display them on the face of the barometer. 6.6 Leak Checks Two types of leak checks are specified for use with PM2.5 samplers—an external leak check and an internal filter bypass leak check. The results for both of these procedures should be recorded in the site’s logbook and/or on the monitoring organization’s data forms. Sections 7.4.3 and 7.4.4 describes the leak check procedures.
6.7 Verification/Calibration Frequency
Due to the dynamic nature of the PM2.5 monitoring program, EPA has chosen to place measurement quality performance criteria, including the frequency and acceptance criteria of verifications and calibrations in one document, the PM2.5 Validation Template. If guidance needs to be revised it can be revised in the validation template. This will allow one document to be revised if necessary and will avoid confusion when multiple documents have different acceptance criteria for the same check. Only guidance will be changed in the validation template; regulatory requirements will not be changed. The PM2.5 Validation Template can be found at: http://www3.epa.gov/ttn/amtic/qapollutant.html
Checking to verify that a sampler’s flow rate measurement system still reads within the

2.12.6.0 Calibration Procedures January 2016 Page 17 of 18
2.12–PM2.5 Reference/Class I Equivalent Methods
acceptance limit of the previous calibration should be done according to the sampler manufacturer’s operating instructions, should take place at the field site, and should be done at least annually or:
Following major electrical or mechanical maintenance, such as replacement of a circuit board or rebuilding of the sampling pump assembly;
When a routine flow rate verification indicates a variation from the set point (16.67 L/min)
of more than 4 percent. If the annual verification fails, then recalibration and/or maintenance is required. Before beginning a flow rate calibration, the operator should repeat the flow rate verification to be certain there were no leaks in the connections between the flow rate verification device and the sampler inlet, and that the flow rate data were reduced and interpreted correctly. In addition, the operator should ensure that the collector’s ambient temperature and pressure measurement systems are responding accurately; if not, these systems must be recalibrated (or replaced and calibrated) before performing a flow rate calibration.
The recommended intervals for calibration and verification of flow rate, temperature, and barometric pressure are summarized in Table 6-1. Table 6-1. Calibration and Verification Check Intervals17
17 See Validation Template on AMTIC for any revision to acceptance criteria in this table http://www3.epa.gov/ttn/amtic/qapollutant.html
Parameter Recommended minimum interval
Flow rate calibration (multi-point)
Upon failure of flow rate verification; also, on installation and then annually or when out of specifications
Flow rate verification (single-point)
Every 30 days +3 days and 12/year
Temperature calibration (multi-point; both ambient air inlet and filter temperature sensors) Temperature multi-point verification
Upon failure of multi-point verification On installation, then annually or when out of specifications
Temperature verification (single-point; ambient air inlet sensor, filter temperature sensor if convenient to do so)
Every 30 days +3 days and 12/year
Pressure calibration
On installation, then annually or when out of specifications
Pressure verification (single-point)
Every 30 days +3 days and 12/year

2.12.6.0 Calibration Procedures January 2016 Page 18 of 18
2.12–PM2.5 Reference/Class I Equivalent Methods
PM2.5 Calibration Work SheetSampler Type: Sampler Id:Field Scientist: Date:Site ID: Site Name:
Calibration Standard InformationDevice Make/Model Serial Number Last Verification of Standard
Temp.PressureFlow
Calibration DataTemperature Calibration
Device Value 1 Value 2 Value 3 Value 4 Value 5 AveAmbient StandardAmbient SamplerAmbient FilterCold StandardCold SamplerCold FilterAmbient StandardAmbient SamplerAmbient FilterHot StandardHot SamplerHot FilterAmbient StandardAmbient SamplerAmbient Filter
Data Evaluation Sampler Temp Difference Data Evaluation Filter Temp DifferenceAmbient Standard vs Sampler Ambient Standard vs FilterCold Standard vs Sampler Cold Standard vs SamplerHot Standard vs Sampler Hot Standard vs Sampler
Average Difference Average DifferenceOne Point Temp Verification
Standard Value Sampler Value Difference
Barometric PressureLow Point Ambient High Point
Standard Sampler Diff. Standard Sampler Diff Sampler Standard Diff
Flow Rate (acceptance Criteria + 4 % of standard)Point #1 Point #2 Point #3
Standard Sampler % Diff. Standard Sampler % Diff Sampler Standard %Diff
Sampler flow rate check after calibration or verification (acceptance Criteria + 2 % of design value)Sampler Value Design Value % Difference
CommentsFigure 6.1 Example Calibration Worksheet
2.12.7.0 Field Operation January 2016 Page 1 of 17
2.12–PM2.5 Reference/Class I Equivalent Methods
7.0 Field Operation 7.1 Overview Sampling operations provided in this section are independent of any one type of commercially available PM2.5 sampler. Because operational procedures may vary among sampler models, consult the manufacturer’s operations manual before the sampler is put into service. Sampling procedure checks are summarized in Table 7-1. 7.2 Activities to Perform Each Site Visit This section reviews the steps taken during a site visit to prepare for and complete a sample run, sample validation criteria, and proper handling of the filter/cassette assembly. Also, refer to the sampling procedures summarized in Section 3.4. Samplers used for NAAQS regulatory decision making purposes are required to operate in accordance with the EPA’s national sampling schedule. The yearly schedule is posted on the EPA’s AMTIC website18. Depending on the sampler’s designation (i.e., primary or collocated), as well as its location, the sampler will operate on either a daily, 1-in-3 day, 1-in-6 day, or 1-in-12 day sampling schedule. The operator will prepare samples and schedule field activities based upon the required sampling frequency of the sampler. For those samplers that operate on an intermittent sampling schedule, the loss of a small number of samples in any calendar quarter (such as those lost by power outages or sampler malfunctions) can potentially impact data completeness. The monitoring organization can choose to schedule and run make-up samples, when necessary, in order to help the monitoring organization achieve the requisite number of quarterly samples. Five make-up samples can be collected for any sampler each quarter. The monitoring organization’s make-up sample policy should be documented in its QAPP, and procedures for conducting make-up samples provided in the monitoring organization’s SOP. The operator should be aware of the make-up sample procedures and be prepared to schedule make-up samples, when needed. In general, the operator should attempt to schedule a make-up sample as soon as possible following the missed sample, or schedule the make-up sample exactly one week from the missed sample, on the same calendar day. More detailed EPA guidance on conducting make-up samples can be found on the AMTIC website19.
18 http://www3.epa.gov/ttn/amtic/calendar.html 19 http://www3.epa.gov/ttn/amtic/files/ambient/pm25/replacem.pdf

2.12.7.0 Field Operation January 2016 Page 2 of 17
2.12–PM2.5 Reference/Class I Equivalent Methods
7.2.1 Beginning a Run Care must be taken to ensure that the filter is clean and undamaged before it is installed in the sampler. The filter/cassette assembly should be kept in its protective container until installation; damaged filters must be placed in the protective container and returned to the weighing laboratory, where they will be examined and then discarded. 1. Annotate the following information on the sampler run data sheet, in the sampler logbook,
and/or on the sample COC, as required by the monitoring organization’s QAPP or SOP. The single-filter PM2.5 Field Data Sheet shown in Figure 7.1 is an example of such documentation.
Date and time of sampler setup visit
Site identification and location
Sampler model, unique sample ID number (this may be the cassette and/or filter ID
number, or some other tracking number) Scheduled sample start date and time
Unusual conditions that may affect samples (e.g., subjective evaluation of pollution
on that day, construction activity, weather conditions) Setup operator’s signature or initials.
NOTE: Figure 7.1 is an example data sheet for a single-filter sampler and assumes the data sheet will accompany the sample to the laboratory. Because sampler data are electronically downloaded and archived, table entry of data relative to the run start and end operating conditions may not need to be made, so long as the information is properly documented in electronic format and appropriately stored.

2.12.7.0 Field Operation January 2016 Page 3 of 17
2.12–PM2.5 Reference/Class I Equivalent Methods
20 See Validation Template on AMTIC for any revision to acceptance criteria in this table http://www3.epa.gov/ttn/amtic/qapollutant.html
Table 7-1. Sampling Procedure Checks20
Procedure Frequency and method Requirements Action if
requirements not met
Filter installation (Never remove filter from cassette for inspection!)
Visually check filter. Filters must be uniquely
identified, tare-weighed, undamaged, and in cassette.
Void the filter, and install substitute filter/cassette.
Sample validation and documentation
Visually check each sample and the keypad display or downloaded sampler data for completeness.
Record sampling date, filter and sampler ID, station location, flow rates, sample time, and unusual conditions on data sheet.
Complete or correct the documentation. Cross out invalid information with a single line. Initial and date changes.
Post-sample inspection
Visually check filters while in cassettes for tears, missing pieces, or leakage. Review sampler operation.
There should be no evidence of filter damage or sampler malfunction.
Flag the sample as questionable; correct the cause of malfunction.
External Leak check
Every flow rate verification or calibration, when suspected, and before and after separator cleaning/maintenance.
Leak-check results must be within parameters specified by manufacturer.
Determine cause of leak and correct. Validate and/or calibrate the sampler flow rate.
Flow rate checks
Check flow rate at least every 4 weeks or once per month at each sampler in the network.
Indicated sampler flow rate must be within ±4 percent of the measured flow rate.
Correct problems. Recalibrate the sampler if needed.
Field blank check
At least one field blank available per weighing session. Install, then immediately remove filter from sampler; store in protective container inside sampler case. Or preferably, install in idle single-filter sampler for 24 hours, then remove and process. For sequential samplers, install in unused holder.
Rotate blanks from sampler to sampler, so all in network are checked. Special requirements for sequential samplers: should have one or more field blanks with each batch of filters to be weighed.
Reassess filter-handling techniques, transport/storage conditions, and sampler cleanliness.

2.12.7.0 Field Operation January 2016 Page 4 of 17
2.12–PM2.5 Reference/Class I Equivalent Methods

2.12.7.0 Field Operation January 2016 Page 5 of 17
2.12–PM2.5 Reference/Class I Equivalent Methods
2. Ensure the sampler is not operating. If the sampler is set to automatically begin operation, ensure that enough time is available to complete these setup procedures before it starts.
3. Open the filter holder assembly according to the manufacturer’s instructions. Visually
inspect the O-rings inside the filter holder to ascertain that they are present, secure and not cracked. Do not sample without these O-rings installed because the system will no longer be leak-free. Install the uniquely identified filter cassette containing the pre-weighed filter. Never remove the filter from the cassette. This is done only at the filter weighing facility. Reinstall the filter cassette holder and ensure that the fittings around the impactor housing and the filter assembly are secure.
4. The sampler is now ready to sample. If the sampler is not already set to turn on
automatically for the next sampling period (i.e. midnight, for SLAMS), program the controls to do so. Check clock on sampler to ensure it’s accurate to within 1 minute of an atomic clock and set to local standard time (for SLAMS).
5. Visually inspect the monitoring site and its equipment to ensure that all sampling
components are ready for the next run day(s). Note any changes in the site surroundings, especially dust-producing activities.
6. Visually inspect the records of the sampler. If it is time for the monthly/every 4 weeks
check, measure and record independent measurements of ambient temperature and pressure, and ensure that the ambient temperature (i.e., inlet temperature) and pressure readings taken by the sampler are within 2.0 C and 10 mmHg of the independent readings, respectively. Be certain that the independent temperature sensor (thermometer or thermistor probe) is located side-by-side with the sampler’s ambient temperature sensor. This will require that the sensor be placed in the louvers of the sampler’s radiation shield and kept out of direct sunlight. Also check the sampler’s display for the filter temperature and ensure this value is reasonable compared to the ambient temperature display.
7.2.2 Ending a Run 1. Visually inspect the sampler readouts to ensure that the sampler is operating properly.
Sequential samplers require manipulation of a number of display screens to retrieve all data. Consult the operating manual. Also check the sampler for any other obvious problems, such as a full water collection jar. If problems are identified, describe them on the sample run data sheet and take corrective actions before starting another run. If the weather is bad, provide a temporary shelter to facilitate data transfer and to protect exposed parts of the sampler. A small work table may be useful.
2. Record the following information on the sampler run data sheet, in the sampler logbook,
and/or on the sample COC (see Figure 7.2), as required by the monitoring organization’s QAPP or SOPs.
Date and sample pick-up time (Appendix L, Section 10.10)
Stop time and total elapsed time of the sample run

2.12.7.0 Field Operation January 2016 Page 6 of 17
2.12–PM2.5 Reference/Class I Equivalent Methods
Average flow rate, coefficient of variation of the flow rate, and total volume sampled
Average temperature and pressure measured by the sampler during the sampling event
Conditions at the site or of the collector that may have affected the sample
Any flags triggered by the sampler (e.g., power outage, flow rate variation)
Explanations for questionable or voided samples
Collecting operator’s signature or initials 3. Download the runtime data (e.g., sampler filter, interval, and input data files) for the
completed run using a laptop computer or other data transfer device that may be specified in the particular sampler’s operating manual.
4. Carefully open the sampler’s filter holder assembly according to the manufacturer’s
instructions. If the filter cassette comes apart or sticks to the upper housing during this process, close and gently reopen the assembly. Do not allow the filter to be shaken, dropped, or touched by any foreign object (fingers, rain, and so on). Visually examine the filter and cassette for damage or unusual appearance. Make notes and then immediately place the filter cassette inside an appropriately marked protective container (see Figure 4.2) for storage and later transport to the weighing laboratory.
5. Inspect the interior of the filter housing and the sampler itself. Note any abnormalities on
the sampler run data sheet. 6. Conduct any scheduled maintenance activities. Refer to Section 8.2 for details on separator
inspection, cleaning, and/or replacement. 7. If another sampling run will be performed, install a filter cassette according to the
instructions in Section 7.2.1, above, and the manufacturer’s instructions. 8. Observe conditions around the monitoring site; note any activities that may affect filter
particle loading (e.g., paving, mowing, fire) and record this information on the run data sheet. Retrieve equipment and applicable documentation. Secure the site.

2.12.7.0 Field Operation January 2016 Page 7 of 17
2.12–PM2.5 Reference/Class I Equivalent Methods

2.12.7.0 Field Operation January 2016 Page 8 of 17
2.12–PM2.5 Reference/Class I Equivalent Methods
7.2.3 Sample Validation Observations made by the site operator concerning the sampler's operation are important in deciding if a sample is valid. Never discard a filter/cassette. If sample validity is in question, operators are encouraged to use data qualifiers or flags and to record free-form notes on the data sheet, in a site logbook, or on computer data entry screens. The final decision for invalidation will be made after the information provided by the operator and the filter/cassette itself are examined at the office and laboratory. Tight control of sampler operation is important because too many invalid samples could cause an entire quarter’s data set to be lost. The following criteria have been established to assist in the determination of data validity. CFR references for the acceptance criteria can be found in the validation template. 1. Timing
All samplers must operate for at least 23, but not more than 25, hours (1,380 to 1,500 minutes). Samples taken for less than 23 hours are invalid for the daily average, but can be used to determine exceedances of the PM2.5 standard. Samplers are programmed to stop whenever the filter becomes so heavily loaded that proper flow rate cannot be maintained. 2. Flow Rates
The average flow rate for a 24-hour period must be within 5 percent of 16.67 L/min at actual conditions. If this limit is exceeded, investigate the cause. Use the following criteria as a basis for sample invalidation:
Deviations in flow rate during sampling (due to mechanical failure) of more than 5
percent from the design value require a flow rate verification check. Refer to Section 6.3.1 for information. Remember to use a flow check filter, not one used for sampling. If the sampler’s flow rate verification check indicates that the comparison did not meet the ±4 percent acceptance criterion, the sample is questionable and should be flagged for potential invalidation.
If the sampler flow rate decreased because of heavy particulate loading on the filter, the
sample should not be invalidated because the heavy loading may indicate an episodic situation that deserves study.
Changes in flow rate calibration of more than 4 percent, as determined by a monthly field
flow rate verification check, may cause invalidation of all samples collected since the last acceptable flow rate check. Make corrections or repairs, verify the flow rate, and recalibrate the sampler if required.
3. Filter Quality
A sample collected on any filter that has obviously been damaged (i.e., torn, frayed, or has pinholes) during the collection process should be invalidated. Return such a filter/cassette assembly to the office or laboratory with notes from the operator.

2.12.7.0 Field Operation January 2016 Page 9 of 17
2.12–PM2.5 Reference/Class I Equivalent Methods
4. Filter Temperature
Based on the data downloaded from the sampler for the run, the filter temperature must be no greater than 5 C above the ambient temperature for more than 30 consecutive minutes, based on 5-minute averages. Take corrective action if it is. 7.2.4 Sample Handling 7.2.4.1 Handling a Valid Sample
The sample must be removed from the collector within 177 hours (7 days 9 hours) of the end of the run. Promptly deliver the filter cassette in its protective container, accompanied by the completed run data sheet and chain-of-custody, to the analytical laboratory. See Section 10.7 for additional details on post-sampling filter inspection. Package and handle the samples to avoid vibrations that may dislodge particles. Do not allow the filter surfaces to touch any of the interior surfaces of the protective container. Samples are to be transported in an insulated container capable of maintaining a temperature of less than 25oC (77oF). 40 CFR Part 50, Appendix L, Section 10.13 states, “During the period between filter retrieval from the sampler and the start of the conditioning period, the filter shall be maintained as cool as practical and continuously protected from exposures to temperatures over 25°C to protect the integrity of the sample and minimize loss of volatile components during transport and storage.” The sample may be cooled to 4°C by placing leak-proof ice substitutes inside the insulated container in order to keep the samples cool, especially in the summer months when an operator may be in the field for several hours. Do not allow the protective container to become wet. Place a min/max thermometer, a liquid crystal temperature sensor strip, or other temperature recording device inside the shipping container to verify that the sample(s) remained cool during transit to the laboratory. Please note that samples are never to be frozen (i.e., placed in a freezer). Handle field blank filters in the same manner. Depending on whether the sample is shipped or transported cold, or below the average ambient air temperature during sampling, the laboratory has from 10 to 30 days from the sample’s end date to determine the sample weight. Pursuant to 40 CFR Part 50, Appendix L, Section 8.3.6, the post-sampling conditioning and weighing shall be completed within 240 hours (10 days) after the end of the sample period, unless the filter sample is maintained at temperatures below the average ambient temperature during sampling (or 4 °C or below for average sampling temperatures less than 4 °C) during the time between retrieval from the sampler and the start of the conditioning, in which case the period shall not exceed 30 days.
NOTE: Unless one has some way to determine the maximum/minimum temperatures in the transport container during transport, there is no way to guarantee that the filters were not exposed to temperatures greater than the average sampling temperature. For example, samples collected in winter months or northern climates may actually warm above average ambient sampling temperatures during transport if ice substitutes are not used. In this case, the laboratory would have 10 days to weigh filters.
2.12.7.0 Field Operation January 2016 Page 10 of 17
2.12–PM2.5 Reference/Class I Equivalent Methods
7.2.4.2 Handling a Questionable Sample 1. Complete as much of the run data sheet as possible and explain any omissions.
2. Mark “questionable” on the run data sheet and record comments on the data sheet and/or in
the site logbook. 3. Do not discard the filter.
4. Deliver the filter cassette in its container (as if it were a valid sample) and the run data
sheet to the analytical laboratory. If your quality assurance (QA) program calls for it, notify the appropriate person of the potentially invalid sample.
NOTE: Monitoring organizations may be using contract laboratories for filter analysis. There should be some contractual agreement that the contract laboratory will immediately contact the monitoring organization of any sample of questionable quality. The monitoring organization, not the contract laboratory, should make the decision whether or not to invalidate the questionable sample(s).
7.3 Activities to Perform Every Five Operating Days 7.3.1 Impactor Well Cleaning Cleaning of the impactor well is very important. It is necessary to prevent the sampler from operating with an overloaded PM2.5 impactor. When operating in an area with higher PM10 concentrations, more frequent cleaning of the well may be necessary. Refer to Section 8.2.2 for impactor maintenance guidance.
In the case of sequential samplers in use every day, sampling may be interrupted for up to 1 hour without invalidating the day’s sample. Exercise care not to contaminate the filter during the well cleaning or replacement process. 7.4 Activities to Perform Every Four Weeks The following activities are performed every thirty days:
VSCC™ Cleaning (if using VSCC™ separator) External leak check Temperature QC check Barometric pressure QC Check Flow Rate verification check
There are other maintenance activities that are performed every 30 days that are discussed in Section 8.0.
2.12.7.0 Field Operation January 2016 Page 11 of 17
2.12–PM2.5 Reference/Class I Equivalent Methods
7.4.1 VSCC™ Cleaning
Refer to Section 8.3.3 for details on VSCC™ cleaning. It is highlighted in this section due to its importance in achieving data quality.
7.4.2 Field Quality Control Equipment and Standards The following equipment is required for field calibration checks of temperature, pressure, and flow rate.
A thermometer or temperature sensing device readable to the nearest 0.1 C, capable of accurately measuring temperature to the nearest ±1 C, and referenced to a NIST standard or an American Society for Testing and Materials (ASTM) thermometer within ±0.5 C at least annually.
A barometer capable of accurately measuring ambient barometric pressure to the nearest
±1 mmHg and referenced to a NIST or ASTM barometer within ±5 mmHg at least annually.
An orifice device (or other acceptable flow measurement device) and calibration
relationship.
The sampler’s calibration information (an equation).
A clean flow check filter, installed in a cassette.
A flow check data sheet (such as the example given in Figure 7.3) and/or the sampler’s logbook.
7.4.3 External Leak Check An external leak check will test the sampler’s entire sample train – from the inlet to the pump – for a leak. Before conducting filter temperature and flow rate verifications, perform an external sampler leak check first. This is important in order to determine the “as found” condition of the sampler, and to ensure no leaks are present. Similarly, it is important to conduct an external leak check prior to conducting any separator maintenance, or any procedure which would result in the separator being removed from the sampler (such as accessing the filter temperature sensor in some sampler models). The removal of the WINS impactor or VSCC™ from the PM2.5 sampler will break the seal within the sample train, which could result in a leak if not properly reassembled. Therefore, the operator should determine the “as found” leak status, and then follow any separator maintenance (or similar) with a second leak check, in order to verify the sampler leak status “as left”.
2.12.7.0 Field Operation January 2016 Page 12 of 17
2.12–PM2.5 Reference/Class I Equivalent Methods
The following describes a generalized procedure for conducting an external leak check. 1. Insert the clean filter (designated the “leak check filter”) into the sampler filter holder using
the appropriate procedure. Leak check filters should never be used for subsequent sampling. The same filter may be used for the leak check that was used for the flow rate verification check.
2. Remove the inlet and install the flow adapter (sometimes referred to as the flow shut-off
valve) on the top of the downtube. Close the flow adapter valve to prevent air flow. 3. Perform the leak check procedure according to the specific instructions in the
manufacturer’s operating manual.
CAUTION
Open the flow adapter’s valve slowly to prevent a sudden rush of air into the system, which can cause oil to splash from the impactor well onto the filter and other components. Opening the valve too quickly can also rupture the leak check filter.
4. Upon completion of a leak check, the sampler’s pump may turn off automatically. If not,
turn off the pump. If the sampler leak check result is within acceptable limits, as detailed in the operating manual, then the sampler is operating properly and you may proceed with the temperature, pressure, and flow rate checks. If the leak limit is exceeded, investigate the cause and make corrections. For example, check the O-rings on the flow adapter for nicks, wear, and excessive flattening. Also, check the outside of the intake tube (i.e., downtube), where the leak check device sits, for deep scratches or dirt that could allow leakage. Check that the filter holder is well-seated. Rectify any problems and repeat the leak check. An internal leak check may be necessary (see Section 7.4.4.). Document the sampler logbook and/or any data forms required by the monitoring organization with details of the leak test procedure and any necessary corrective actions. If necessary, recalibrate the sampler before sampling is resumed.
5. Remove the flow adapter and replace the inlet. 6. Remove the leak check filter from the filter holder. This filter is never reused for sampling
but, if carefully handled, may be used several times as a leak check filter.

2.12.7.0 Field Operation January 2016 Page 13 of 17
2.12–PM2.5 Reference/Class I Equivalent Methods
Figure 7.3 PM2.5 Field QC Checks & Maintenance Form

2.12.7.0 Field Operation January 2016 Page 14 of 17
2.12–PM2.5 Reference/Class I Equivalent Methods
7.4.4 Internal Filter Bypass Leak Check
Performing an internal leak check is only necessary when an external leak check fails. An internal leak check test will assist the operator in isolating the location of the leak within the sampler.
The suggested technique for implementing an internal leak check follows.
1. Install a flow-impervious membrane material in the filter cassette, either with or without afilter, as appropriate, which effectively prevents air flow through the filter.
2. Remove the inlet and install the flow adapter (sometimes referred to as the flow shut-offvalve) on the top of the downtube. Close the flow adapter valve to prevent air flow.
3. Perform the internal leak check procedure according to the specific instructions in themanufacturer’s operating manual. If the internal leak check passes, then the samplercomponents below the filter are leak-free, which means that the leak is located somewherebetween the PM10 inlet head and the filter. If the internal leak check fails, the leak islocated below the filter.
4. Perform requisite corrective actions. Document all troubleshooting activities andcorrections in the sampler logbook and/or on any data forms required by the monitoringorganization.
5. After corrections are completed, conduct another external leak check to ensure the sourceof the leak has been mitigated and the sampler is leak-free. If necessary, recalibrate thesampler before sampling is resumed. Document the results of the final leak test in thesampler logbook and on any necessary data forms.
6. Remove the flow adapter and replace the inlet. Remove the leak check filter from thefilter holder.
7.4.5 Procedure for Temperature Verification Check
PM2.5 samplers have at least two temperature sensors – an ambient temperature sensor and a filter temperature sensor. Some samplers will have an additional compartment temperature sensor as well. All temperature sensors should be routinely verified. The acceptance criterion should be ±2 °C for all temperature sensors as compared to the verification/certification standard.
Due to variations in sampler models, a procedure for accessing and verifying the filter and/or compartment temperature sensors is not described here. Please consult the sampler user manual for information on how to test these sensors.

2.12.7.0 Field Operation January 2016 Page 15 of 17
2.12–PM2.5 Reference/Class I Equivalent Methods
The following describes steps to perform a single-point temperature verification of the ambient temperature sensor only.
1. Allow adequate time for the field check temperature standard to reach temperature equilibrium with its surroundings. This may take 15 minutes or more. The site operator should use his or her best judgment to ensure the temperature sensor has equilibrated to ambient conditions.
2. The sampler’s Main screen should be displayed.
3. Place the field check temperature standard between the slats of the gill screen (radiation shield) housing the sampler’s ambient temperature sensor. Wait until the temperature check standard reading is stable, and then compare it to the ambient temperature reading displayed on the sampler’s Main screen. If the temperatures agree within ± 2°C, then the ambient temperature sensor response is acceptable. If not, proceed to Step 5.
4. Record the ambient temperature information on the field data sheet.
5. If the readings are outside acceptance criteria, wait longer (10 to 15 minutes) for temperature equilibration to occur and repeat the procedure. If the readings still do not agree, verify that the problem is not with the standard by using another verification device, if available.
6. If after troubleshooting the readings are still outside the acceptance range, record the temperature information on the field data sheet and take corrective action.
7.4.6 Procedure for Barometric Pressure Verification Check A single-point barometric pressure verification is described in the following steps.
1. Allow adequate time for the barometric pressure verification device (standard) to reach equilibrium with its surroundings. This may take 15 minutes or longer. The site operator should use his or her best judgment to ensure that the standard is equilibrated to ambient conditions.
2. The sampler’s Main screen should be displayed.
3. Place the pressure standard in close proximity (< 0.5 meters) to the sampler’s pressure sensor. Wait until the standard’s reading is stable, and then compare it to the ambient pressure reading displayed on the sampler’s Main screen.
4. Record the pressure readings from the sampler and the standard on the field data sheet.
5. If the two readings are 10 mmHg of each other, the verification of the pressure sensor is satisfactory.

2.12.7.0 Field Operation January 2016 Page 16 of 17
2.12–PM2.5 Reference/Class I Equivalent Methods
6. If the deviation is >10 mmHg, check the barometric pressure using a backup verification device (standard), if available. If the results are similar to those of the first check, then the sampler’s pressure measurement system may be damaged and should be serviced. A calibration procedure should be performed at a later time (see Section 6.5).
7.4.7 Procedure for Field Flow Rate Verification Check A flow rate verification check of the sampler flow rate is required every 30 days. The results of all valid flow rate verifications are to be reported to AQS. Control charts presenting flow rate verification check data (indicated vs. measured) should be maintained. These charts provide a reference of instrument flow rate drift patterns and indicate when flow limits (±4 percent) have been exceeded. The field check is made by installing a measuring device (which is traceable to NIST and calibrated within the range of the flow rate) on the inlet of the sampler. Calibration procedures for the samplers flow rate measurement device are found in Section 6.3.4.
The following flow rate verification procedure is independent of any device. A variety of transfer standards may be used with this procedure; however, the necessary apparatus and subsequent calculations to determine the sampler’s flow rate will vary. 1. Ensure that the instrument is operational and in working condition (i.e., not in Error mode).
If the sampler is programmed to collect samples on a daily basis, the operator will have to stop the sample run in progress before proceeding with the flow rate verification procedure.
2. Insert the clean filter (designated the “flow check filter”) into the sampler filter holder.
Flow check filters should never be used for subsequent sampling but, if carefully handled, may be used several times as a flow check filter.
3. Read and record the following information on a sampler flow check data sheet, such as the
example given in Figure 7.3.
Ambient temperature (Ta), C (as indicated by the sampler’s display)
Ambient temperature (Ta), C (as indicated by the field check thermometer or thermistor)
Ambient barometric pressure (Pa), mmHg (as indicated by the sampler’s display)
Ambient barometric pressure (Pa), mmHg (as indicated by the field check barometer)
Sampler ID number and model
Flow verification check device (i.e., transfer standard) serial number and calibration relationships (if appropriate)
Date, location, and operator’s signature
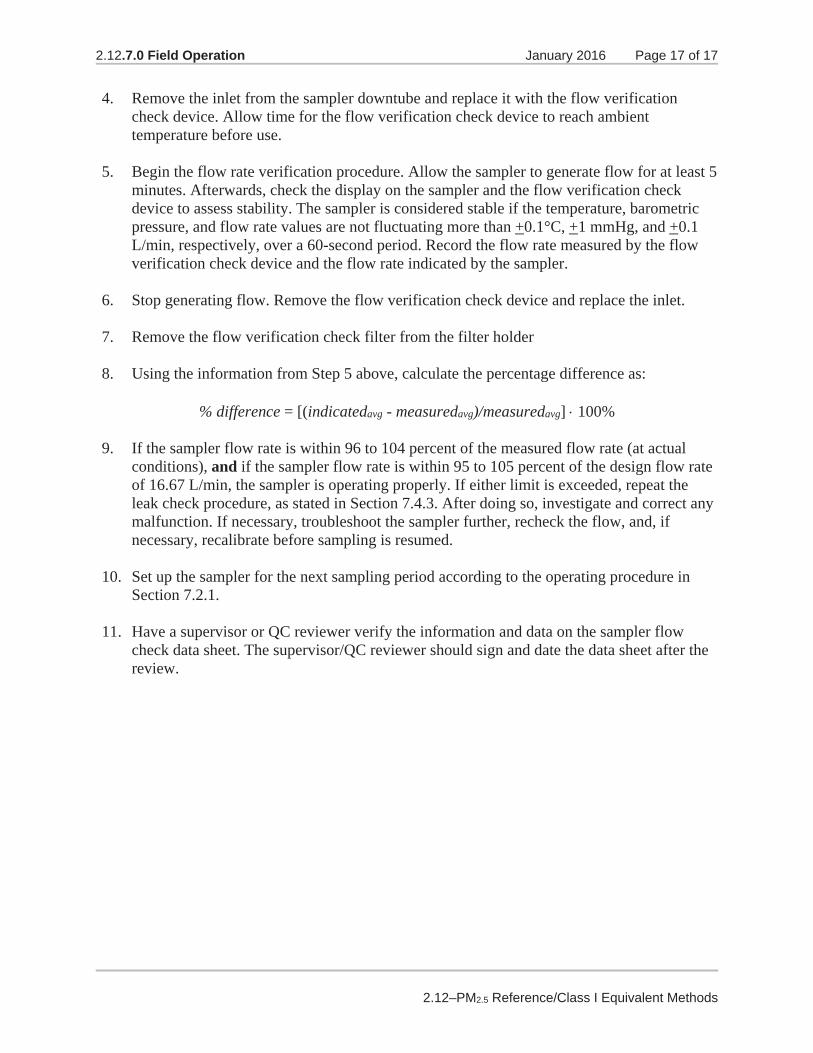
2.12.7.0 Field Operation January 2016 Page 17 of 17
2.12–PM2.5 Reference/Class I Equivalent Methods
4. Remove the inlet from the sampler downtube and replace it with the flow verification check device. Allow time for the flow verification check device to reach ambient temperature before use.
5. Begin the flow rate verification procedure. Allow the sampler to generate flow for at least 5
minutes. Afterwards, check the display on the sampler and the flow verification check device to assess stability. The sampler is considered stable if the temperature, barometric pressure, and flow rate values are not fluctuating more than +0.1°C, +1 mmHg, and +0.1 L/min, respectively, over a 60-second period. Record the flow rate measured by the flow verification check device and the flow rate indicated by the sampler.
6. Stop generating flow. Remove the flow verification check device and replace the inlet. 7. Remove the flow verification check filter from the filter holder 8. Using the information from Step 5 above, calculate the percentage difference as: % difference = [(indicatedavg - measuredavg)/measuredavg] 100% 9. If the sampler flow rate is within 96 to 104 percent of the measured flow rate (at actual
conditions), and if the sampler flow rate is within 95 to 105 percent of the design flow rate of 16.67 L/min, the sampler is operating properly. If either limit is exceeded, repeat the leak check procedure, as stated in Section 7.4.3. After doing so, investigate and correct any malfunction. If necessary, troubleshoot the sampler further, recheck the flow, and, if necessary, recalibrate before sampling is resumed.
10. Set up the sampler for the next sampling period according to the operating procedure in
Section 7.2.1. 11. Have a supervisor or QC reviewer verify the information and data on the sampler flow
check data sheet. The supervisor/QC reviewer should sign and date the data sheet after the review.

2.12.8.0 Sampler Maintenance January 2016 Page 1 of 6
2.12–PM2.5 Reference/Class I Equivalent Methods
8.0 Sampler Maintenance 8.1 Overview Preventive maintenance is defined as a program of planned actions aimed at preventing failure of monitoring and analytical systems. The overall objective of a routine preventive maintenance program is to increase measurement system reliability and to provide for more complete data acquisition. This section addresses maintenance associated with reference or Class I equivalent PM2.5 monitoring methods only. Maintenance of the laboratory microbalance and support equipment is not covered. Laboratories often employ a balance service representative who services balances on a 6-month or annual basis. Some sampler maintenance can be performed at the field site. Major maintenance of the sampler or components, such as the pump, can be performed more conveniently when the equipment is brought to a laboratory or maintenance facility, provided time and labor are available to move the equipment. A maintenance schedule should be established for each sampler and systematic records should be kept as scheduled and unscheduled maintenance occurs. Files should reflect the history of maintenance, including all replacement parts, suppliers, and cost expenditures and should include an inventory of on-hand spare equipment for each sampler. Recommended supplies for all maintenance activities include an alcohol-based general-purpose cleaner that leaves no residue, cotton-tipped applicators (such as a Q-tip), a small soft-bristle brush, paper towels, distilled water, and miscellaneous hand tools. Additional supplies may be necessary for specific procedures, as indicated below. Specifications for many of the supplies are given in Section 4.0, "Procurement of Equipment and Supplies," of this document. A compressed-air source is also recommended but not required. All activities recommended below are in addition to those specified in the operating manual specific to the sampler and are not intended to replace those activities. Maintenance activities are summarized in Table 8-1. Site operators and/or maintenance personnel should review Table 8-1 and develop appropriate schedules and documentation in their monitoring organization’s QAPP to ensure the activities are met and reported. Maintenance activities should be included in the monitoring organization’s standard operating procedures as well. NOTE: Always remove the impactor and filter cassette prior to removing the inlet downtube or cleaning any of the instrument parts upstream of these items. Such activities could dislodge dirt, oil, grease, or other materials that could deposit into the impactor well or onto the sampling filter. Temporarily store the impactor and filter cassette in a clean, dry location, away from contaminating materials (dust, dirt, rain, and so on) and direct sunlight.

2.12.8.0 Sampler Maintenance January 2016 Page 2 of 6
2.12–PM2.5 Reference/Class I Equivalent Methods
Table 8-1 Summary of PM2.5 Sampler Maintenance Items
Frequencya Maintenance itemb
Every 5 sampling days 1. Service water collector bottle (jar).2. Clean or change out impactor well.
Monthly 1. Clean sampler inlet surfaces.2. Clean impactor housing and impactor jet surfaces. Examine
O rings.3. Clean interior of sampler case.4. Check sampler clock accuracy.5. Check condition of sample transport containers.6. Clean VSCC™
Quarterly (every 3 months)
1. Inspect O rings of inlet. Remove and lightly coat them withvacuum grease.
2. Clean sampler downtube.3. Inspect and service water seal gasket where downtube
enters sampler case.4. Inspect and service O rings of impactor assembly.5. Inspect and service vacuum tubing, tube fittings, and other
connections to pump and electrical components.6. Inspect and service cooling air intake filter and fans.
Other periodic maintenance 1. As recommended by the manufacturer’s sampler manualaFrequency may vary depending on climate, amount of particulate matter in the air, weather, and so on. bRemove impactor and filter cassette before servicing any upstream sampler components.
8.2 Five-Day Maintenance Procedures 8.2.1 Water Collector At least every 5 sampling days, inspect the water collector bottle (jar). Remove accumulated water, clean the interior of the bottle, inspect the seals, and reinstall the bottle in the holder. 8.2.2 WINS Impactor Well
Impactor wells may be cleaned at the field site. Take care to thoroughly clean the well and not to introduce contaminants. Others may prefer to have spare wells that can be cleaned in a laboratory or other indoor location. The well should be transported to the sampling site in an upright position. During transport, protect the well from excessive vibration, precipitation, direct sunlight, and other harmful environments. Likewise, the used well should be protected in transit back to the laboratory. It is recommended that wells be numbered or otherwise identified and records kept of their use.
At least every 5 sampling days, disassemble and clean the WINS impactor well (refer to Figure 8.2). If spare wells are available, cleaning can be done in the laboratory. Separate the upper and
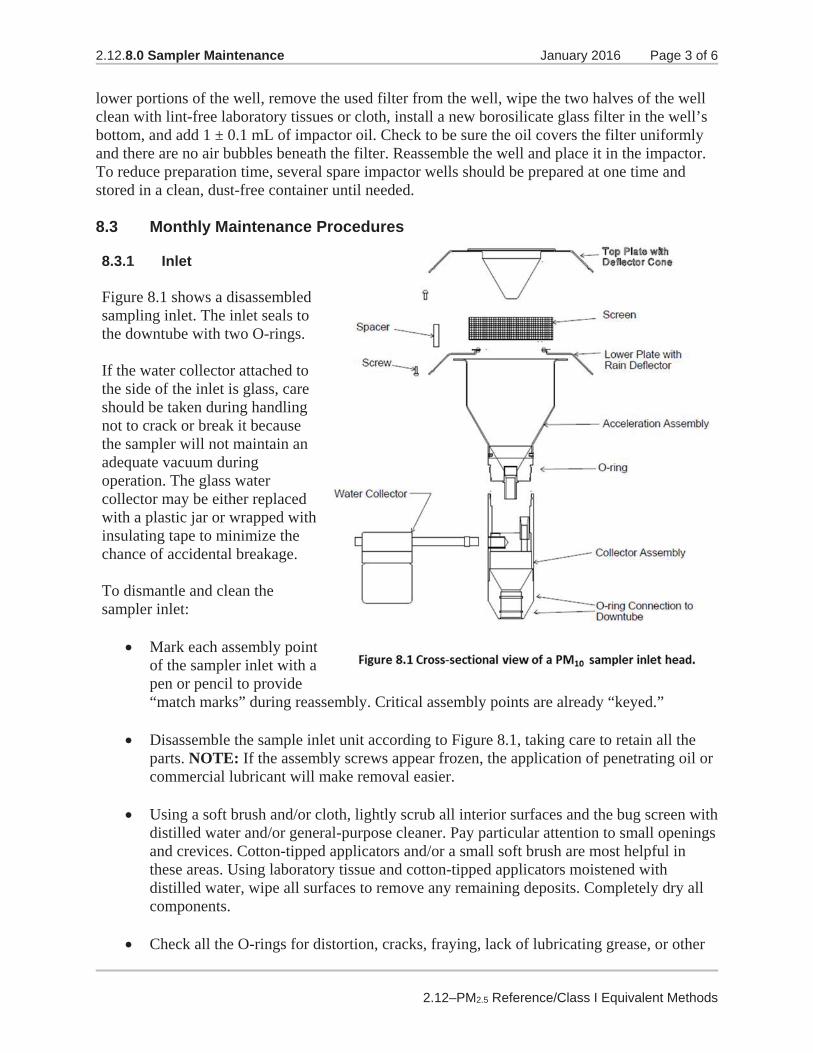
2.12.8.0 Sampler Maintenance January 2016 Page 3 of 6
2.12–PM2.5 Reference/Class I Equivalent Methods
lower portions of the well, remove the used filter from the well, wipe the two halves of the well clean with lint-free laboratory tissues or cloth, install a new borosilicate glass filter in the well’s bottom, and add 1 ± 0.1 mL of impactor oil. Check to be sure the oil covers the filter uniformly and there are no air bubbles beneath the filter. Reassemble the well and place it in the impactor. To reduce preparation time, several spare impactor wells should be prepared at one time and stored in a clean, dust-free container until needed.
8.3 Monthly Maintenance Procedures
8.3.1 Inlet Figure 8.1 shows a disassembled sampling inlet. The inlet seals to the downtube with two O-rings. If the water collector attached to the side of the inlet is glass, care should be taken during handling not to crack or break it because the sampler will not maintain an adequate vacuum during operation. The glass water collector may be either replaced with a plastic jar or wrapped with insulating tape to minimize the chance of accidental breakage. To dismantle and clean the sampler inlet:
Mark each assembly point of the sampler inlet with a pen or pencil to provide “match marks” during reassembly. Critical assembly points are already “keyed.”
Disassemble the sample inlet unit according to Figure 8.1, taking care to retain all the
parts. NOTE: If the assembly screws appear frozen, the application of penetrating oil or commercial lubricant will make removal easier.
Using a soft brush and/or cloth, lightly scrub all interior surfaces and the bug screen with
distilled water and/or general-purpose cleaner. Pay particular attention to small openings and crevices. Cotton-tipped applicators and/or a small soft brush are most helpful in these areas. Using laboratory tissue and cotton-tipped applicators moistened with distilled water, wipe all surfaces to remove any remaining deposits. Completely dry all components.
Check all the O-rings for distortion, cracks, fraying, lack of lubricating grease, or other

2.12.8.0 Sampler Maintenance January 2016 Page 4 of 6
2.12–PM2.5 Reference/Class I Equivalent Methods
problems. Apply a thin coating of vacuum grease or replace the O-rings as necessary.
Reassemble the unit in accordance with the previously scribed match marks. Take particular care to ensure that all O-ring seals are properly sealed and that all screws are uniformly tightened.
8.3.2 WINS Impactor Housing and Well Figure 8.2 shows a typical disassembled impactor unit. With the impactor assembly open, inspect the interior of the impactor housing, both above and below the impactor well. These areas should be clean and dry. If necessary, clean the areas with a lint-free wipe. On a monthly basis, clean the interior of the impactor jet using a lint-free pipe cleaner or similar tool. Check the O-rings for distortion, cracks, fraying, lack of a light coating of vacuum grease, or other problems; replace as necessary.
8.3.3 Cleaning of VSCC™ type PM2.5Separators (VSCC™ and similar devices)
Cleaning of the VSCC™ well is strongly recommended after 30 days of operation. Also, empty any water from the water trap (jar), clean the sampler interior, inspect the seals, and reinstall the trap. Cleaning the cyclone is necessary to prevent the sampler from operating with an overloaded PM2.5 separator. When operating in an area with higher PM10 concentrations, more frequent cleaning of the well may be necessary. Remove the VSCC™ from its installed position in the instrument.
1. Pull off the side transfer tube. If it is too tight to remove by hand, pry it off with a rigid plastic lever. Care should be taken to not damage the two O-ring seals.
2. Remove the top cap and grit pot by unscrewing.
3. Wet a low-lint wipe with water and remove all visible deposits. These are most likely to be found at the bottom of the cone and inside the grit pot.
4. Inspect all O-rings for shape and integrity. If at all suspect, replace. Lubricate all O- rings with light grease. It is important to well lubricate the transfer tube to avoid difficult disassembly.

2.12.8.0 Sampler Maintenance January 2016 Page 5 of 6
2.12–PM2.5 Reference/Class I Equivalent Methods
5. Assemble in reverse order and reinstall.
6. Perform a leak check according to manufacturer’s operating manual specifications.
Separators may be cleaned at the field site. Others may prefer to have spare VSCCs™ that can be cleaned in a laboratory or other indoor location.
8.3.4 Other
Wipe down the interior of the sampler’s case to remove bugs, dirt, and/or water deposits that may have collected inside the case. This procedure may be required more frequently during summer months. Inspect the cooling air intake filter and clean, if necessary.
Check the sampler’s internal clock against a timepiece known to be accurate within 1 minute/month. It is recommended that a cell phone (with an atomic clock) be used for this purpose. Record the value and note whether the sampler’s clock has gained or lost time since the previous month’s time check. The sampler clock should be set to local standard time (for SLAMS).
Check the maintenance (flow/leak check) filter cassettes and the backing screens for fractures, cracks, buckling, evidence of wear, or contamination. Clean or replace as necessary. Conduct leak test(s) after reassembly.
8.4 Quarterly Maintenance
The following activities should be performed once every 3 months at the time of the regular monthly maintenance.
8.4.1 Downtube
Inspect the outer and inner surfaces of the tip (closest to the sampler inlet) of the downtube, and remove any particulate deposits using isopropyl rubbing alcohol or water and a soft bristle brush or wads of lint-free laboratory wipes or cloth. Dry the downtube completely before reinstallation.
Inspect the rubber water seal gasket (located at the point where the downtube enters the sampling case) for cracks or other evidence of leakage. Lubricate or replace the gasket as necessary, according to the sampler’s operating manual.
8.4.2 Impactor
Remove the O-rings in the impactor assembly and condition them with a light coating of vacuum grease.

2.12.8.0 Sampler Maintenance January 2016 Page 6 of 6
2.12–PM2.5 Reference/Class I Equivalent Methods
8.4.3 Other
Examine the vacuum tubing for crimps, cracks, breaks, water, or dirt and replace as necessary.
Examine the tubing fittings to ensure proper seating and tightness.
Clean or replace the cooling air intake filter and fans as required.
8.5 Other Periodic Maintenance
As recommended by the manufacturer’s sampler operating instruction manual.
8.6 Refurbishing PM2.5 Samplers
PM2.5 samplers that have been operated in the field for extended periods may require major repairs or complete refurbishment. In these cases, the manufacturer’s manual must be referred to before work is undertaken. A sampler that has been subject to major repairs or refurbishment must be leak-checked and calibrated prior to sample collection. Such a sampler should be treated as if it were a new purchase and all verification checks should be performed prior to use.
2.12. 9.0 Gravimetric Lab Design and Set-up January 2016 Page 1 of 14
2.12–PM2.5 Reference/Class I Equivalent Methods
9.0 Gravimetric Laboratory Design and Set-Up
9.1 Overview
The quality of data from the PM2.5 sampling program depends on several factors. A primary consideration is the set-up of equipment and resources utilized within the gravimetric laboratory itself. This section offers recommendations on designing the gravimetric laboratory (filter conditioning environment) in a manner which will optimize its performance, as well as provides recommendations on associated maintenance activities.
Filter weighing activities are discussed in Section 10.
NOTE: Monitoring organizations may contract pre-and post-weighing activities. Since contract laboratories may follow internally developed QAPPs and SOPs, it is the responsibility of the monitoring organization to ensure those QAPPs/SOPs meet PM2.5 requirements and are sufficient for their monitoring program. The monitoring organization should review the laboratory’s QAPPs/SOPs on a routine basis, maintain copies of the documents, and request to be notified of any revisions. It is also the responsibility of the monitoring organization to evaluate contractor compliance with the QAPP/SOP requirements through technical systems audits or other oversight activities. If the monitoring organization desires the contract laboratory to adhere to the monitoring organization’s specific QAPP/SOPs, it is the responsibility of the monitoring organization to develop a contract with the laboratory that specifies such requirements.
9.2 Weighing Room
The gravimetric analysis of PM2.5 filters should occur in a climate-controlled, draft-free room or laboratory (i.e., filter conditioning environment). It is imperative that the weighing room be capable of meeting the filter conditioning specifications that are detailed in 40 CFR Part 50, Appendix L, Section 8.2. To that end, the room selected must not be subject to large temperature or humidity variations. Selecting an interior room (i.e., a room that is not adjacent to an exterior wall) is strongly recommended; moreover, a room without windows is preferred. Ensuring that the room is well insulated will facilitate control of temperature and relative humidity fluctuations. Ideally, a small interior room should be selected because it is easier and more economical to control the environment in a smaller space.
The filter conditioning environment should be maintained as a semi-clean room. The weighing room should be constructed such that it is constantly under positive pressure, in order to avoid entrainment of foreign materials contaminating the room. Positive pressure can be verified by holding a piece of paper against the outside door of the weighing room. The paper should blow slightly outward, away from the door, if positive pressure exists. In order to further decrease the opportunity for contaminates entering the room, ingress to and egress from the weighing room should be minimized.
Heating and air conditioning in the filter conditioning environment/weighing room should be maintained 24 hours a day, including weekends. The monitoring organization should be

2.12. 9.0 Gravimetric Lab Design and Set-up January 2016 Page 2 of 14
2.12–PM2.5 Reference/Class I Equivalent Methods
cognizant of the expected temperature and humidity ranges in their local area throughout the year and utilize an HVAC system that can accommodate those ranges. Employing a high-efficiency particulate air [HEPA]-filtered air supply system on the inlet air system will minimize human traffic effects and will help stabilize the conditions of the weighing environment. The monitoring organization should have a service contract in place to ensure proper maintenance of the HVAC, as well to provide vendor services when/if repairs are necessary. Re-heat systems also work well.
Section 9.3 provides recommendations regarding the proper placement and installation of the microbalance within the filter conditioning environment.
The weighing room should be well lit, in order to facilitate filter inspection and provide an efficient work space for the analyst. The use of a light box is encouraged. Additionally, a space within the laboratory should be designated specifically for filter conditioning. In accordance with 40 CFR Part 50, Appendix L, sample filters must condition (equilibrate) in the same environment in which the microbalance is placed. The use of a conditioning rack with equilibration trays, shelves, or similar apparatus should be utilized for filter conditioning, so long as the apparatus is clean, static-neutralized (see Section 9.6), and allows for air flow over the filters during equilibration.
Preferably, the filter conditioning environment/weighing room should be dedicated to the use of balances. The monitoring organization is encouraged to limit the activities within the weigh room to PM2.5 sample analysis only, in order to minimize the potential for cross-contamination with other particulate types.
Dust contamination should be kept to a minimum. Routine cleaning regimes should be developed and scheduled. The use of semi-wet methods to clean (such as anti-static solutions and damp lint-free cloths) is encouraged. Analysts should avoid using brooms or other devices which could create dust. Examples of cleaning regimes for the weighing room may include:
Daily: Wipe down work surfaces used to perform laboratory activities with a lint-free wipe that has been dampened with alcohol-based, anti-static solution.
Monthly: Wipe down all surfaces, including the filter conditioning shelves, with a clean lint-free wipe that has been dampened with alcohol-based, anti-static solution. Mop the floor with a damp clean room mop.
Yearly: Wipe down all surfaces, including walls, ceiling tiles, equipment, and work surfaces with a clean, lint-free wipe that has been dampened with an alcohol-based, anti-static solution. Mop the floor with a damp clean room mop. Ceiling tiles, if removable, should be removed and thoroughly cleaned.
NOTE: If filters are in petri-slides during these suggested monthly and annual cleaning regimes, place the lids on all filters that are exposed in the conditioning environment to prevent contamination. It is further recommended that these cleaning activities be completed during

2.12. 9.0 Gravimetric Lab Design and Set-up January 2016 Page 3 of 14
2.12–PM2.5 Reference/Class I Equivalent Methods
times when minimal weighing activity is expected. All cleaning activities should be documented in the laboratory logbook. Other clean room measures, such as installing sticky floor covering on the entrance(s) to the weighing area, should also be employed.
9.3 Microbalance Gravimetric analysis of the filters is performed using a microbalance with a readability of 0.001 mg (1 g) and a repeatability of 1 g as listed in the microbalance’s performance specifications (see Section 4.3.6). Because of the greater sensitivity needed for measuring microgram-range weights or weight differences, microbalances are vulnerable to relatively small changes in physical environmental conditions, such as vibration, electrostatic charge buildup, temperature, or relative humidity (RH). Features to offset the effect of these variables on the measurements may be integrated into the design of the microbalances, or they may be offered as options.
The microbalance must be located in the same controlled environment in which the filters are conditioned. The microbalance used in the weighing process should be identified by a unique balance number. Make sure that the microbalance has been externally calibrated/certified (at least annually) and maintained according to the manufacturer’s recommendations. If it is out of calibration, the microbalance should be calibrated by a microbalance service technician according to the manufacturer’s directions. The analyst should not attempt to repair the microbalance. The following general guidelines regarding set-up and placement of the microbalance should be followed to control environmental factors that may affect its performance.
The microbalance should be stationary and level. If this does not occur, the microbalance will display instability and yield biased results. Therefore, it is imperative that the microbalance be located on a sturdy, vibration-free base (such as a stone weighing table) and away from any other equipment that produces vibrations. If these arrangements are not possible, isolate the microbalance from such equipment by placing a stabilizing slab under the microbalance and/or by placing composite vibration damping pads under the microbalance’s legs or under the stabilizing slab.
Ensure that the microbalance’s base is sufficiently even to permit leveling of the
microbalance according to the manufacturer’s instructions. Most microbalances will have a bubble level that should be viewed to ensure that the microbalance is indeed level once it is set-up.
It is essential that the microbalance be located away from sources of drafts, in order to
ensure balance stability and proper readout. Therefore, the microbalance should be located away from doors, windows, aisles with frequent traffic, ventilation ducts, and/or equipment with fans or moving parts. For example, a microbalance should not be placed in the flow path of a window air conditioning unit.

2.12. 9.0 Gravimetric Lab Design and Set-up January 2016 Page 4 of 14
2.12–PM2.5 Reference/Class I Equivalent Methods
Locate the microbalance out of direct sunlight and away from local heating or cooling sources such as open flames, hot plates, water baths, ventilation ducts, windows, and heat-producing lamps.
It is important for the microbalance to be properly grounded. A lack of appropriate
grounding can cause significant stability issues with the balance. All microbalances have a grounding screw on the back that must be attached to a ground wire. See Figure 9.1 for an example. Additional information about static neutralization is found in Section 9.6.
9.4 Logging Systems The weighing room’s relative humidity (RH) and temperature conditions should be electronically measured and recorded on a continuous basis during filter conditioning, with 5-minutes values (at a minimum) logged and saved. There are a variety of RH and temperature sensors available on the market which come with electronic data-logging ability. Electronic data logging ability provides the user with simple and efficient options for manipulating data. Ensure that the sensors purchased meet the accuracy and resolution specifications detailed in Section 4.3.8. The sensors should be recertified on an annual basis by the vendor to ensure accuracy and NIST-traceability. If the data recording device that communicates with the RH and temperature sensors requires selection of an interval upon initial set-up, the monitoring organization should select a 5-minute interval/average, at a minimum. More frequent measurements of temperature and humidity are encouraged. The collection of minute data increases the size of the data set available to be statistically analyzed, and will paint a better picture regarding the stability of the weighing room’s environmental conditions. Lab analysts or managers can make more informed decisions regarding Appendix L compliance (see Section 10.4 of this document) when there is more data available to review. Some loggers record instantaneous readings of the temperature and relative humidity conditions, whereas others display an average value for the defined interval (e.g., 60 seconds averaged and reported as 1-minute data). The monitoring organization should define in its

2.12. 9.0 Gravimetric Lab Design and Set-up January 2016 Page 5 of 14
2.12–PM2.5 Reference/Class I Equivalent Methods
QAPP or SOP how its data recording device is programmed. Either scenario is acceptable, provided that the minimum amount of minute data is retained. Please note that raw data values, as opposed to rolling averages, should be used when computing the filter conditioning environment’s 24-hour statistics (see Section 4.3.8). Many sensors will have accompanying software packages that will calculate the 24-hour averages and standard deviations from the collected data, making it easier for the lab analyst to determine compliance (or not) with the filter conditioning specifications. The software packages will often display those calculated results in tables, time-series graphs, or a combination of the two. See Figures 9.2 and 9.3 for two examples. If the sensors chosen do not have associated software that will calculate these statistics, the analyst will need to determine an efficient method to manually compute these statistics.
Figure 9.2: Example of environmental logging software displaying both summary statistics and a time-series graph
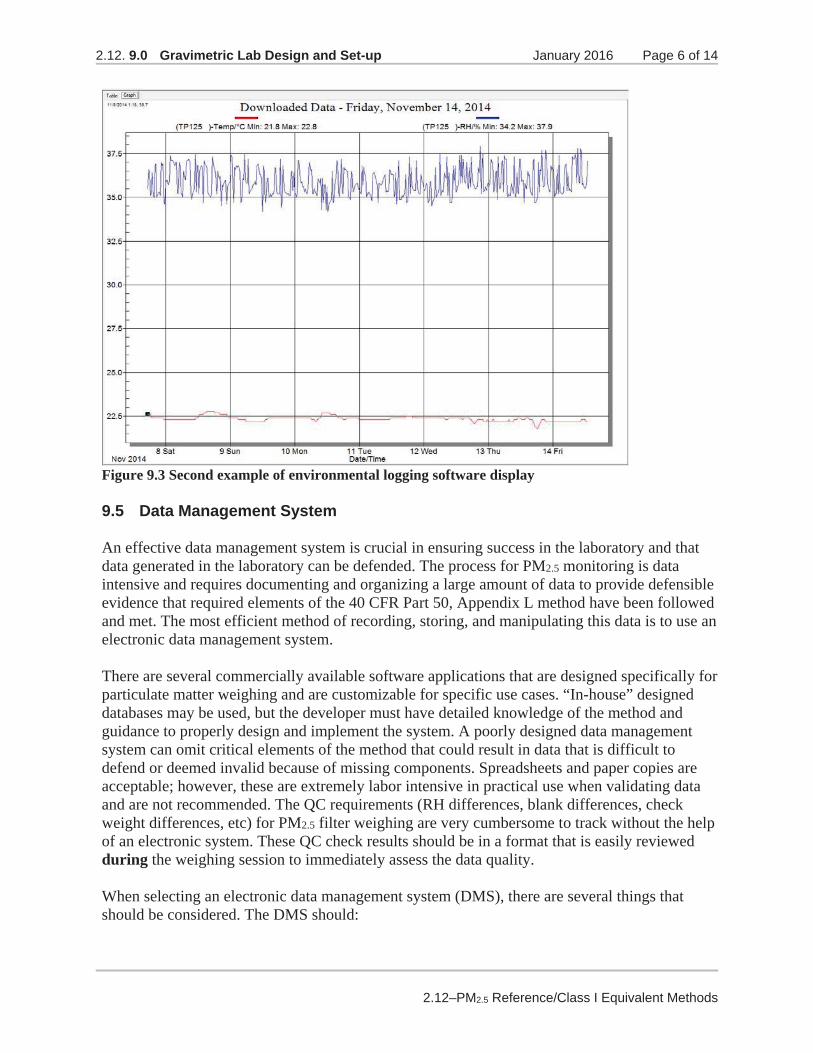
2.12. 9.0 Gravimetric Lab Design and Set-up January 2016 Page 6 of 14
2.12–PM2.5 Reference/Class I Equivalent Methods
Figure 9.3 Second example of environmental logging software display
9.5 Data Management System An effective data management system is crucial in ensuring success in the laboratory and that data generated in the laboratory can be defended. The process for PM2.5 monitoring is data intensive and requires documenting and organizing a large amount of data to provide defensible evidence that required elements of the 40 CFR Part 50, Appendix L method have been followed and met. The most efficient method of recording, storing, and manipulating this data is to use an electronic data management system. There are several commercially available software applications that are designed specifically for particulate matter weighing and are customizable for specific use cases. “In-house” designed databases may be used, but the developer must have detailed knowledge of the method and guidance to properly design and implement the system. A poorly designed data management system can omit critical elements of the method that could result in data that is difficult to defend or deemed invalid because of missing components. Spreadsheets and paper copies are acceptable; however, these are extremely labor intensive in practical use when validating data and are not recommended. The QC requirements (RH differences, blank differences, check weight differences, etc) for PM2.5 filter weighing are very cumbersome to track without the help of an electronic system. These QC check results should be in a format that is easily reviewed during the weighing session to immediately assess the data quality. When selecting an electronic data management system (DMS), there are several things that should be considered. The DMS should:

2.12. 9.0 Gravimetric Lab Design and Set-up January 2016 Page 7 of 14
2.12–PM2.5 Reference/Class I Equivalent Methods
Address all critical Appendix L requirements; Address PM2.5 guidance, as applicable; Integrate room condition data (temperature and humidity logger); Include calibrations and reminders for weighing equipment (balances, loggers, weight
standards); Provide QC check results in real-time during the weighing session; Aggregate and graphically display QC data (temperature, humidity, blanks, pre- and
post-humidity difference, balance checks, etc); and, Use conditional checks/formatting to alert the analyst of potential issues.
To support the data management system, the weigh room should be equipped with a computer that utilizes an LCD monitor. Older CRT monitors act as a reservoir for static; therefore, their use should be discouraged. See Section 9.6 regarding the importance of static neutralization.
9.6 Static Neutralization
Static charge is the accumulation of electrical charges on the surface of a nonconductive material. In a PM2.5 gravimetric laboratory, electrostatic charge buildup will prevent a microbalance from operating properly. Common symptoms of this problem include noisy readout, drift, and sudden readout shifts. To reduce the risk of such interferences, efforts should be made to minimize electrostatic charge build-up within the filter conditioning area.
Foremost, the microbalance itself should be properly grounded (see Section 9.3). The grounding screw on the back of the microbalance should be attached to a grounding wire. It is also important to ensure that the electrical outlet used with the microbalance is properly grounded, too. The use of an electrical receptacle wall plug AC outlet ground tester is recommended to check the circuit. Please be aware, if the room chosen to serve as the filter conditioning environment is itself not properly grounded, it will cause instability issues with the microbalance that may be hard to diagnose and resolve when first detected. The AC outlet ground tester is an easy, inexpensive way to double check the AC outlets in the selected weighing room.
Do not assume that grounding eliminates all electrostatic buildup because the electrical ground may not be perfect. Even though a filter weight might stabilize within 30 to 60 seconds and no weight drift be observed during that period, the microbalance may still be influenced by some electrostatic buildup.
In addition to grounding the balance, other static control devices can be utilized to further reduce static charge. For example, polonium (210Po) is a radioactive material that is very effective in eliminating static. Radioactive anti-static strips containing a very small amount (i.e., 500 picocuries) of 210Po are safe and commonly available. 210Po anti-static strips will neutralize electrostatic charges on items brought within an inch of them. To reduce electrostatic buildup within the microbalance’s weighing chamber, 210Po anti-static strip(s) can be affixed directly inside the weighing chamber. Gooseneck holders containing 210Po anti-static strips can also be placed near the microbalance and used to neutralize individual filters prior to placement on the microbalance weigh pan. See Figure 9.4 for an example of these 210Po gooseneck holders.
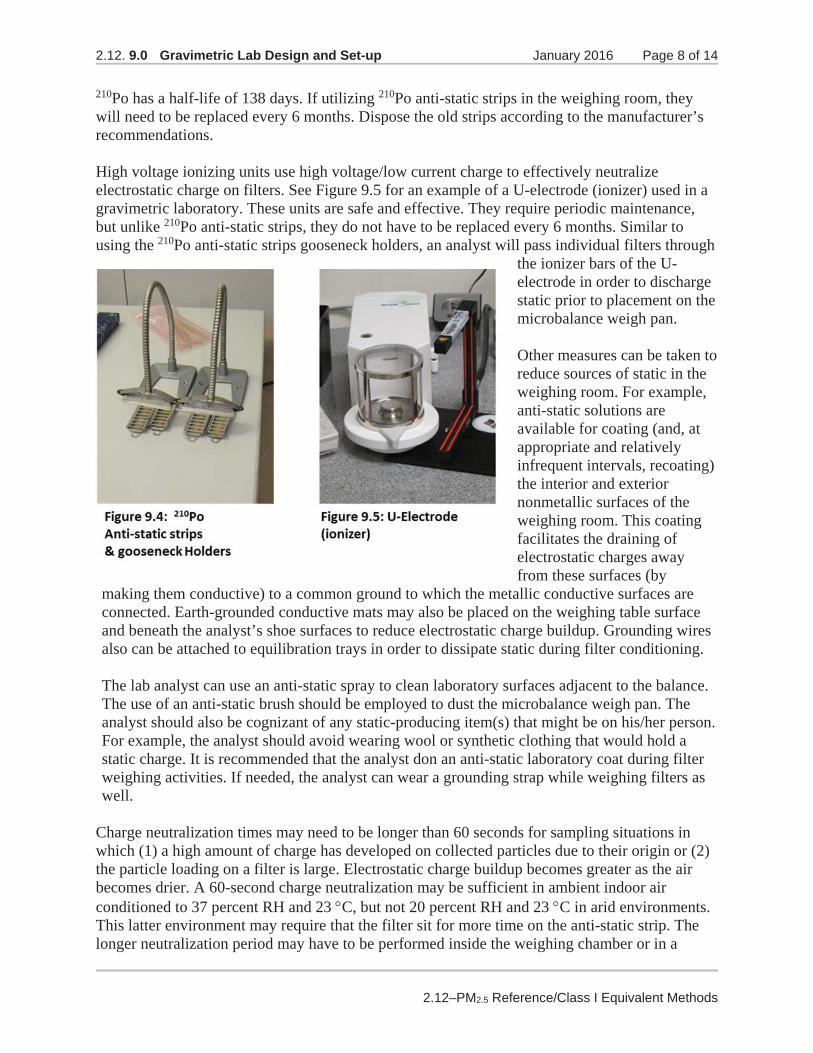
2.12. 9.0 Gravimetric Lab Design and Set-up January 2016 Page 8 of 14
2.12–PM2.5 Reference/Class I Equivalent Methods
210Po has a half-life of 138 days. If utilizing 210Po anti-static strips in the weighing room, they will need to be replaced every 6 months. Dispose the old strips according to the manufacturer’s recommendations.
High voltage ionizing units use high voltage/low current charge to effectively neutralize electrostatic charge on filters. See Figure 9.5 for an example of a U-electrode (ionizer) used in a gravimetric laboratory. These units are safe and effective. They require periodic maintenance, but unlike 210Po anti-static strips, they do not have to be replaced every 6 months. Similar to using the 210Po anti-static strips gooseneck holders, an analyst will pass individual filters through
the ionizer bars of the U-electrode in order to discharge static prior to placement on the microbalance weigh pan. Other measures can be taken to reduce sources of static in the weighing room. For example, anti-static solutions are available for coating (and, at appropriate and relatively infrequent intervals, recoating) the interior and exterior nonmetallic surfaces of the weighing room. This coating facilitates the draining of electrostatic charges away from these surfaces (by
making them conductive) to a common ground to which the metallic conductive surfaces are connected. Earth-grounded conductive mats may also be placed on the weighing table surface and beneath the analyst’s shoe surfaces to reduce electrostatic charge buildup. Grounding wires also can be attached to equilibration trays in order to dissipate static during filter conditioning. The lab analyst can use an anti-static spray to clean laboratory surfaces adjacent to the balance. The use of an anti-static brush should be employed to dust the microbalance weigh pan. The analyst should also be cognizant of any static-producing item(s) that might be on his/her person. For example, the analyst should avoid wearing wool or synthetic clothing that would hold a static charge. It is recommended that the analyst don an anti-static laboratory coat during filter weighing activities. If needed, the analyst can wear a grounding strap while weighing filters as well.
Charge neutralization times may need to be longer than 60 seconds for sampling situations in which (1) a high amount of charge has developed on collected particles due to their origin or (2) the particle loading on a filter is large. Electrostatic charge buildup becomes greater as the air becomes drier. A 60-second charge neutralization may be sufficient in ambient indoor air conditioned to 37 percent RH and 23 C, but not 20 percent RH and 23 C in arid environments. This latter environment may require that the filter sit for more time on the anti-static strip. The longer neutralization period may have to be performed inside the weighing chamber or in a

2.12. 9.0 Gravimetric Lab Design and Set-up January 2016 Page 9 of 14
2.12–PM2.5 Reference/Class I Equivalent Methods
second small chamber used only for charge neutralization. See Engelbrecht et al. (1980), Hawley and Williams (1974), and Weil (1991) for more information about electrostatic charge and how to minimize its effects. It is important to reinforce that utilizing only one static control method may not be sufficient to control static in all situations, and that a combination of these methods may be required. The analyst should have a working understanding of static sources and controls that are specific to the laboratory and document the control measures accordingly. 9.7 Mass Reference Standards Two separate sets of mass reference standards are recommended for use in the gravimetric laboratory: 1) primary standards, and 2) working standards. Procurement specifications for the mass reference standards are detailed in Section 4.3.7. Primary standards should be used for quarterly verification checks of the working standards. The working standards, on the other hand, are used for routine filter weighing and balance QC checks. Laboratory primary standards should be kept in the weighing room in a secure container which is clearly labeled as the “primary” weight set. Ideally, the primary standards should be stored in a separate location from the working standards (such as in a locked cabinet). Working standards should also be clearly labeled as the “working” weight set. The working standards should be kept next to the microbalance in a protective container. Both of these weight sets should be handled with care, in order to avoid damage that may alter their masses. To that end, the analyst should always use smooth, non-metallic forceps when handling the mass reference standards. The forceps used with the mass reference standards should not be used for any other purpose. Mark these forceps to distinguish them from the forceps used to handle filters. The forceps should be cleaned with alcohol and lint-free wipes and allowed to completely air dry before handling the mass reference standards. 9.7.1 Certification Procedures – Primary Standards The laboratory primary mass reference standards should be certified every 365 days (annually) to a NIST-traceable reference standard of higher authority. The certification should occur at a State weight and measures laboratory or at another laboratory that is accredited by the National Voluntary Laboratory Accreditation Program (NVLAP), which is administered by NIST (Harris 1994; White 1997). Certificates of traceability for the primary standards should be maintained in a central file within the monitoring organization, along with the certificates for other standards utilized within the laboratory. It is recommended that the analyst maintain copies of the certificates of traceability in the laboratory for quick access. Figure 9.6 provides a generic example of the information that may be presented on a certificate of traceability.
NOTE: Information and terminology on calibration/traceability certificates may vary. It is important that the lab analyst closely review the certificate provided by the

2.12. 9.0 Gravimetric Lab Design and Set-up January 2016 Page 10 of 14
2.12–PM2.5 Reference/Class I Equivalent Methods
vendor and understand the information represented. Most certificates will include definitions of key terms; however, if not supplied, such information may be requested from the vendor.
In Figure 9.6, the mass reference standard being recertified has a nominal value of 320 mg (meaning, simply, the mass reference standard is supposed to weigh ~320 mg). The weight certificate shows both “as found” and “as left” data (under the “Conventional Mass Correction” header). The nominal weight plus any correction factor becomes the conventional mass (i.e., certified weight) of the mass reference standard. In Figure 9.6, the “as left” correction factor for the weight is 0.0102 mg. Therefore, the newly certified weight of this example mass reference standard is, when rounded, 320.010 mg. The analyst should use the conventional mass (as opposed to the nominal weight) as the certified (reference) value when utilizing this working standard for routine QC checks.
Tolerance (also referred to as maximum permissible error) is the sum of the conventional mass correction factor plus the measurement uncertainty of the metrology calibration laboratory’s ability to quantify that conventional mass. A weight standard would be defined as an ASTM Class 0 check weight if the check weight had a tolerance of no more than 0.005 mg. In order for the mass reference standard in Figure 9.6 to be defined as an ASTM Class 0 standard, the sum of the nominal weight, conventional mass correction factor, and the measurement uncertainty must be 320 mg ± 0.005 mg (between 319.995 mg and 320.005 mg). Similarly, in order for the weight standard to be defined as an ASTM Class 1 standard, the sum must be 320 mg ± 0.010 mg (between 319.990 mg and 320.010 mg). For Class 2, the sum must be 320 mg ± 0.025 mg (between 319.975 mg and 320.025 mg). Using the information supplied on the example certificate (Figure 9.6), the summation of 320 mg (nominal value) + 0.0102mg (correction factor) + 0.0018 mg (uncertainty) equals 320.012 mg. Therefore, the weight standard in this example is classified as a Class 2 standard. The mass reference standards utilized in the gravimetric laboratory should be Class 2 or better; standards with individual tolerances greater than 0.025 mg should not be utilized in the PM2.5 laboratory. The analyst should be cognizant of the “as found” versus “as left” status of the weight standard, as documented on the traceability certificate. If the mass reference standard weighs significantly less “as found,” it could indicate damage has occurred such that a portion of the weight standard has chipped off (which could result from poor handling techniques by the analyst or from damage sustained during transit/shipping to/from the metrology lab). If the mass reference standard weighs more “as found,” it could indicate contamination of the standard, or possibly that the weight was incorrectly classified (i.e., Class 0, 1, or 2) during its previous certification. In Figure 9.6, the traceability certificate indicates that the weight standard had to be adjusted (corrected) because the “as found” conventional mass correction factor was significantly greater than the tolerance allowed for Class 2 standards (0.025 mg). To “adjust” the mass of the weight standard in this example, the metrology lab may have cleaned the weight standard, or possibly shaved off a small portion of the weight. If the latter, the metrology lab would need permission from the monitoring organization in order to make the necessary correction.
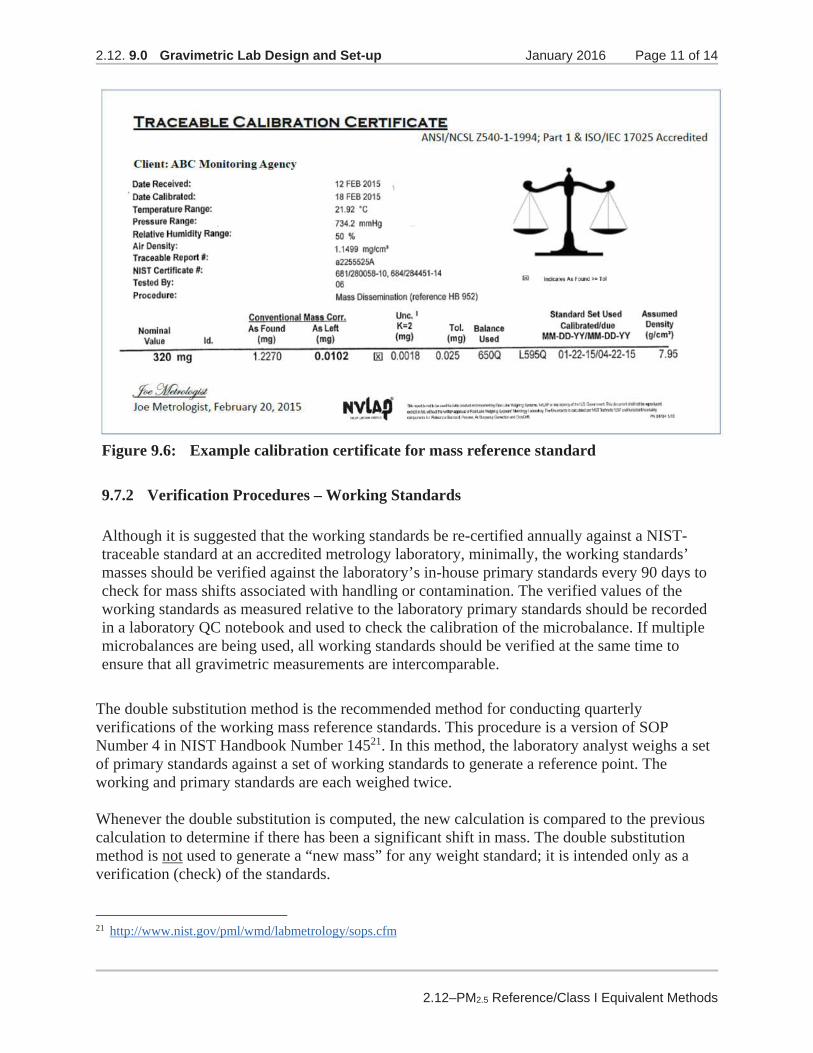
2.12. 9.0 Gravimetric Lab Design and Set-up January 2016 Page 11 of 14
2.12–PM2.5 Reference/Class I Equivalent Methods
Figure 9.6: Example calibration certificate for mass reference standard
9.7.2 Verification Procedures – Working Standards
Although it is suggested that the working standards be re-certified annually against a NIST-traceable standard at an accredited metrology laboratory, minimally, the working standards’ masses should be verified against the laboratory’s in-house primary standards every 90 days to check for mass shifts associated with handling or contamination. The verified values of the working standards as measured relative to the laboratory primary standards should be recorded in a laboratory QC notebook and used to check the calibration of the microbalance. If multiple microbalances are being used, all working standards should be verified at the same time to ensure that all gravimetric measurements are intercomparable.
The double substitution method is the recommended method for conducting quarterly verifications of the working mass reference standards. This procedure is a version of SOP Number 4 in NIST Handbook Number 14521. In this method, the laboratory analyst weighs a set of primary standards against a set of working standards to generate a reference point. The working and primary standards are each weighed twice.
Whenever the double substitution is computed, the new calculation is compared to the previous calculation to determine if there has been a significant shift in mass. The double substitution method is not used to generate a “new mass” for any weight standard; it is intended only as a verification (check) of the standards.
21 http://www.nist.gov/pml/wmd/labmetrology/sops.cfm

2.12. 9.0 Gravimetric Lab Design and Set-up January 2016 Page 12 of 14
2.12–PM2.5 Reference/Class I Equivalent Methods
The following is the recommended procedure. The analyst should weigh the standards at regularly spaced time intervals to average out any effects of instrument drift. 1. Zero and calibrate the microbalance following the microbalance’s user guide. Exercise the balance. 2. Open the draft shield. Using cleaned, non-metallic forceps, place the first working standard (for example, a 400 mg weight), w, on the weigh pan. 3. Close the draft shield. Wait until the display on the balance has stabilized. Record the weight as Measurement 1. 4. Open the draft shield and remove the weight. Shut the draft shield and allow the microbalance to zero. Tare, if needed. 5. Repeat steps 2-4 for the primary standard of the same weight (for example, 400 mg), p, and then the working standard, w, again to weigh each standard two times, recording the resulting values as Measurements 2, 3, and 4, respectively. Note that the primary standard is consecutively weighed.
Measurement Number Weight on Pan Observation Number 1 w O1
2 p O2
3 p O3
4 w O4
NOTE: The time intervals between successive trials should not differ from one another by more than 20%. If this difference is exceeded, reject the data and take a new series of measurements.
6. Repeat steps 2-4 for the second mass reference standard utilized (for example, a 300 mg weight). 7. Calculate the mass correction, Cw, for the test (working standard weight, w) as follows, according to the sequence used. In each case, the apparent mass correction for the primary weight standard, Cp, are included. The symbols Np and Nw refer to the nominal values of p and w, respectively. Cw = Cp + ([O1-O2+O4-O3]/2) + Np – Nw 8. Subsequent measurements of Cw must be within ±2 g of the initial Cw value. The analyst should document the results of this procedure in the laboratory logbook and/or on any required data forms.

2.12. 9.0 Gravimetric Lab Design and Set-up January 2016 Page 13 of 14
2.12–PM2.5 Reference/Class I Equivalent Methods
22 See Validation Template on AMTIC for any revisions to acceptance criteria in this table http://www3.epa.gov/ttn/amtic/qapollutant.html
Table 9-1. Filter Preparation and Analysis Checks22
Activity Method and frequency Requirements Action if the require-
ments are not met Microbalance Resolution of 1 g,
repeatability of 1 g. Obtain proper microbalance.
Microbalance environment
Climate-controlled, draft-free room or chamber or equivalent; clean area around microbalance.
Modify the environment.
Mass reference standards
Working standards verified every 3 months against National Institute of Standards and Technology (NIST)-traceable laboratory primary standards.
Standards bracket weight of filter; individual standard’s tolerance less than 25 g; quarterly certification check within ±2 g from Cw; handle with smooth, nonmetallic, clean forceps.
Obtain proper standards or forceps.
Filter handling Observe handling procedure. Use powder-free gloves and smooth, clean forceps. Replace 210Po anti-static strips every 6 months.
Discard mishandled filter or old anti-static strip.
Filter integrity check
Visually inspect each filter. No pinholes, separation, chaff, loose material, dis-coloration, or filter non-uniformity.
Discard defective filter.
Filter identification
Write filter number on filter handling container and on laboratory data form in permanent ink.
Make sure the numbers are written legibly.
Replace label or correct form.
Pre- sampling filter conditioning
Determine the correct conditioning period (at least 24 hours) for each new lot of filters. Observe and record the filter conditioning environment's RH and temperature on laboratory data form.
Perform lot blank stability tests. Check for stability of lot blank filter weights. Weight changes should be <15 g. Mean RH between 30 and 40 percent, with a variability of not more than ±5 percent over 24 hours. Mean temperature should be held between 20 and 23 C, with a variability of not more than ±2 C over 24 hours.
Revise conditioning period; repeat conditioning.
(continued)

2.12. 9.0 Gravimetric Lab Design and Set-up January 2016 Page 14 of 14
2.12–PM2.5 Reference/Class I Equivalent Methods
Table 9-1. (continued)
Activity Method and frequency Requirements Action if the require-ments are not met
Pre- and post-sampling filter weighing
Observe all weighing procedures. Perform all quality control (QC) checks.
Neutralize the electrostatic charge on filters. Wait until balance indicates a stable reading to record value.
Repeat weighing. Many laboratories routinely repeat the weighing.
Internal QC After every 10th filter, re-zero the microbalance and reweigh at least one working standard. Weigh 10% laboratory blanks/weighing session. Reweigh one replicate filter at the end of the weighing session. Reweigh two working standards at end of session. Weigh 10% field blanks.
The working standard measurements should agree within 3 g of the verified values. Laboratory blank and replicate measurements should agree within 15 g. Field blank measurements should agree within 30 g.
Troubleshoot and take appropriate corrective action as specified in the quality assurance project plan (QAPP) to attain acceptable levels. Do not correct PM2.5 measurements based on high blank levels.
Post-sampling filter storage
Monitor the time between sampling and weighing.
Weighing should be completed within 240 hours (10 days) after the end of sampling, unless the filter is maintained below average ambient temp during the entire time between retrieval from the sampler and start of the conditioning, in which case the period shall not exceed 30 days.
Troubleshoot and take appropriate corrective action.
Post-sampling inspection, documentation, and verification
Examine the filter and field data sheet for correct and complete entries. If sample was shipped in a cooled container, verify that low temperature was maintained.
No damage to filter. Field data sheet complete. Sampler worked OK.
Save filter for inspection. Flag sample. Troubleshoot and take appropriate corrective action.
Post-sampling filter equilibration
Equilibrate filters for at least 24 hours. Observe and record the filter conditioning environment's RH and temperature on laboratory data sheet.
Mean RH between 30 and 40 percent, with a variability of not more than ±5 percent over 24 hours, and within 5% RH of 24-hour average pre-sampling RH. Mean temperature should be held between 20 and 23 C, with a variability of not more than ±2 C over 24 hours.
Repeat equilibration.

2.12. 10.0 Filter Preparation and Analysis January 2016 Page 1 of 23
2.12–PM2.5 Reference/Class I Equivalent Methods
10.0 Filter Preparation and Analysis 10.1 Overview As discussed in Section 9.0, the quality of data from the PM2.5 sampling program depends on multiple factors. A crucial factor is the analytical laboratory staff’s attention to detail and their microbalance operation technique. This section offers guidelines to enhance the data quality of the laboratory operation and, hence, the PM2.5 mass concentration and any additional chemical qualitative and quantitative determinations.
Filter media requirements are given in Section 4.3.1. 10.2 Filter Handling
Care in all aspects of filter/cassette handling cannot be overemphasized. The filters used for the PM2.5 program typically weigh between 150 - 400 mg (depending on filter manufacturer). Due to the size and weight of the particles that will be collected on these filters, net weights will be measured in micrograms ( g). The loads on the filter may be anywhere from 10 to 2000 g (83
g/m3) with most sample loads < 300 g. In order to give one a sense of this weight, a 4 cm-long human hair weighs ~312 g. A 300 g sample load value represents ~0.1- 0.2% of the weight of the blank filter. In addition, it is expected that the laboratory analyst will be able to duplicate weighings of the same filter to within 15 g. A single thumbprint on a filter weighs 15 g or more. It should be apparent that any small loss or gain (i.e., finger oils, dust) will affect filter weights. The average volume of a 24-hour sample is 24 m3 (16.67 L/min *1440 minutes). Therefore, a 300 g net sample load would equate to a concentration of 12.5 g/m,3 which exceeds the current 12.0 g/m3 annual NAAQS. Thirty micrograms of contamination equates to approximately 1 g/m3 which, if it’s a consistent source of contamination, can make a difference in an attainment decision if sample concentrations are near the NAAQS.
Careful handling of the filter during sampling, conditioning, and weighing is necessary to avoid measurement errors due to damaged filters or a gain or loss of collected particles on the filters. The analyst should wear clean laboratory clothing (a lab coat, e.g.) when working in the filter conditioning environment. Additionally, whenever filters are handled, the analyst should wear anti-static, powder-free gloves. These gloves act as an effective contamination barrier. Gloves that are packed in a box can carry an electrostatic charge. It is a good practice to discharge them by touching a good electrical ground after putting them on. The filters should be handled carefully by the support ring, rather than by the filter material, with smooth, non-serrated forceps that are used only for that purpose. Mark these forceps to distinguish them from the forceps used to handle mass reference standards. Forceps should be cleaned with alcohol and lint-free wipes before handling filters and allowed to air-dry. These precautions reduce the potential effect from body moisture or oils contacting the filters and subsequently affecting the measured weights. In the laboratory, each filter should be transferred from its sealed manufacturer’s packaging to a clean filter-handling container, such as a glass or plastic petri dish or petri slide, to reduce the risk of contamination. The filter should remain in this container, except for weighing, until it is

2.12. 10.0 Filter Preparation and Analysis January 2016 Page 2 of 23
2.12–PM2.5 Reference/Class I Equivalent Methods
loaded into a filter cassette prior to sampling. Each filter is required to have a unique identification number. Whether this identifier is a number or barcode, it is extremely important that filter suppliers use an identification system on filters and it is maintained throughout the sampling and analysis process in the monitoring networks. EPA’s national filter procurement requires a unique filter identifier. It is recommended that each microbalance be assigned a block of filter numbers to be processed and used sequentially. Take care to avoid mistakenly assigning the same number twice or omitting a number. Color-coded labels may be helpful for separating groups of filters when more than one microbalance is being used.
If sufficient resources are available, bar coding for filters can be introduced. Bar code readers and printers for microbalances are already generally available and can significantly improve the efficiency of filter inventory tracking and processing.
10.3 Filter Integrity Check
EPA supplies filters manufactured from a single lot to the national PM2.5 network. This lot of filters is performance tested prior to distribution to the monitoring organizations. However, all filters must be visually inspected at each weighing laboratory for defects before the initial weighing. If any defects are found, discard the filter. Specific filter defects to look for include the following:
Pinhole—A small hole appearing (a) as a distinct and obvious bright point of light when examined over a light table or screen or (b) as a dark spot when viewed over a dark surface.
Separation of ring—Any separation or lack of seal between the filter and the filter border reinforcing the ring.
Chaff or flashing—Any extra material on the reinforcing, polyolefin ring or on the heat seal area that would prevent an airtight seal during sampling.
Loose material—Any extra loose material or dirt particles on the filter.
Discoloration—Any obvious discoloration that might be evidence of contamination.
Filter nonuniformity—Any obvious visible nonuniformity in the appearance of the filter when viewed over a light table or black surface that might indicate gradations in porosity or density across the face of the filter.
Other—A filter with any imperfection not described above, such as irregular surfaces or other results of poor workmanship.
Filter defects are expected periodically. Report to the EPA Regional Office if a high number of defects (e.g., >10%) are discovered in the lot of filters received by the monitoring organization throughout the year. Because filter defects are possible, a best practice is to order more filters

2.12. 10.0 Filter Preparation and Analysis January 2016 Page 3 of 23
2.12–PM2.5 Reference/Class I Equivalent Methods
than needed according to historical observations. If an unusually high number of defects are reported, OAQPS can send additional filters to make up for the shortfall. 10.4 Filter Conditioning Filter conditioning is a key activity in the gravimetric laboratory. Filters must be conditioned immediately before both pre- and post-sampling weighings. Filters must condition in the weighing room for a minimum of 24 hours to allow them sufficient time to equilibrate to the room’s specific temperature and humidity conditions, which are prescribed in 40 CFR Part 50, Appendix L. It is imperative that the weigh lab analyst condition the PM2.5 filters in strict accordance with these requirements. Not meeting these requirements will be cause for data invalidation.
10.4.1 Preparing the Filters 10.4.1.1 Conditioning Prior to Sampling Foremost, a new lot of filters should be placed in the conditioning environment immediately upon receipt. Typically, filters come packed together in large groups or in a container with separators. This package is usually contained inside another clear, reclosable plastic package, which may, in turn, be placed inside a box used in shipping. Filter lot stability testing should occur on the newly acquired filters. See Section 10.5 for more details regarding lot stability testing. The new lot of filters should be stored in the filter conditioning environment until the pre-sampling (tare) weighing activities are completed. To condition an unexposed (clean) batch of filters for their pre-sampling (tare) weighing, they should be removed individually from their sealed packages, inspected, and placed in their own filter-handling containers (e.g., petri dish or petri slide). Place the filters in their filter-handling containers on a covered rack, conditioning tray, or an open-sided cabinet which will allow air circulation over the filters, while reducing the chance that airborne material inside the weighing room will settle onto the filters. See Figure 10.1 for an example. Label, if possible, both the filter handling container’s lid and bottom half. During conditioning, the lid should be placed either beneath the open container or partially covering the container. Place the filters on the conditioning trays (or rack/shelf) in numerical order so the analyst can more easily weigh the filters (in numerical order) during the upcoming initial weigh session. The filters must be conditioned in this manner for a minimum of 24 hours (or longer, depending on the results of the lot stability testing described in Section 10.5). This process allows the filter weights to stabilize before use.
NOTE: Care should be taken to avoid contaminating PM2.5 filters inside the weighing room with particulates released by other filter media (e.g., quartz and glass) that are also being conditioned in the same area. Laboratory blanks (see Section 10.5) should be used to check for potential cross-contamination from airborne particulates inside the weighing room. If there is evidence of such cross-contamination, corrective actions should be taken. One possible solution for a cross-contamination problem is maintaining separate conditioning environments for PM2.5 filters and other filter media.

2.12. 10.0 Filter Preparation and Analysis January 2016 Page 4 of 23
2.12–PM2.5 Reference/Class I Equivalent Methods
10.4.1.2 Conditioning After Sampling
Before conditioning exposed filters (i.e., ambient samples), the analyst should first determine the requisite filter holding time for the individual samples as they are returned from the field. Filter holding times – and how to determine if the final weigh date should occur within 10 or 30 days post-sampling – are discussed in detail in Section 10.7. If shipments containing exposed filters can be weighed promptly after arrival to the laboratory, then the analyst should begin post-sample weighing activities (see Section 10.7). If, however, the analyst will not be able to immediately process and weigh the filters, then the analyst should place the samples into cold storage (i.e., 1-4o C in a refrigerator) until such time that the post-sampling conditioning and weighing activities can occur (but within the calculated filter holding time).
It is important to note that exposed filters should only be placed in the weighing room for the amount of time necessary for them to equilibrate prior to final weighing. Keeping the filters in the weighing room for longer periods of time may cause loss of volatiles from the filters, as well as subject them to additional contamination. The maximum equilibration time for exposed
filters is recommended to be 72 hours. With that in mind, the lab analyst should not place exposed filters into the weighing room for equilibration and allow them to remain on their conditioning trays for numerous days or weeks prior to the final weigh.
To condition the exposed filters (after they have been handled and inspected in accordance with the procedures described in Section 10.7), return them to their assigned filter handling containers (e.g., petri dishes or petri slides) and place on a covered rack, conditioning tray, or an open-sided cabinet that will allow proper air circulation. The filter container lid should be placed either beneath the open container or partially covering the container. Place the filters on the conditioning trays in numerical order so the analyst can more easily weigh the filters (in numerical order) during the final weigh session. Allow the filters to condition in this manner for a minimum of 24 hours (required), but not be more
than 72 hours (recommended). Under dire circumstances, exposed filters set out for conditioning can be returned to cold storage if an unexpected issue arises that hinders the analyst from final weighing within the requisite time frames. In case of this rare event, the reasons for returning the filters to cold storage should be documented in the laboratory logbook.

2.12. 10.0 Filter Preparation and Analysis January 2016 Page 5 of 23
2.12–PM2.5 Reference/Class I Equivalent Methods
For both pre- and post-sampling filter conditioning, the analyst should document the date and time that the filters are placed into conditioning in a laboratory logbook, at a minimum. Ideally, the dates/times of the conditioning period for each individual filter should be captured in the laboratory data management system, in order to provide evidence that the filters were conditioned in accordance with the reference method requirements.
10.4.1.3 Determining Compliance with Filter Conditioning Specifications
Prior to any pre- or post-sampling weigh session, the lab analyst must verify that the weighing room’s environmental conditions have met the specifications of the PM2.5 reference method. If the room has not met all of the specifications of the method, the weigh session must be postponed. The reference method for PM2.5 (40 CFR Part 50, Appendix L) requires the following filter conditioning climate control:
Section 8.2.1 Mean temperature. 20-23° C;
Section 8.2.2 Temperature control. ± 2° C over 24 hours;
Section 8.2.3 Mean humidity. Generally, 30-40% RH; however, where it can be shown that the mean ambient relative humidity during sampling is less than 30 percent, conditioning is permissible at a mean relative humidity within 5 relative humidity percent of the mean ambient relative humidity during sampling, but not less than 20 percent;
Section 8.2.4 Humidity control. ±5 percent over 24 hours.
This means that, during the 24-hour filter conditioning period23, the average temperature in the weighing room must be held within the range of 20-23 C. The temperature variability within that stated range cannot exceed ±2 C over the 24-hour period. Similarly, the average RH must be held between 30-40 RH percent in the weighing room during the conditioning period. The variability in the RH cannot be more than ±5 RH percent over the 24-hour period. When samples are taken in arid locations, where RH values are consistently low, conditioning the filters in a more humid laboratory environment could potentially add water vapor to the samples and affect their final weight measurements. Therefore, it is permissible to condition those filters at an RH within 5 RH percent of the average ambient RH during sampling, but not less than 20 percent. The temperature and relatively humidity control limits specified in 40 CFR Part 50, Appendix L, should not be confused to mean that the stated ranges can be extended by ±2°C or ±5 RH%, respectively. For example, if the 24-hour temperature average is found to be 18.5 °C, then the Appendix L requirement for temperature has not been met, because the 24-hour average must fall within the range of 20-23 °C. Similarly, if the 24-hour relative humidity average is found to be 42% RH, then the Appendix L requirement for relative humidity has not been met because the average must fall within the range of 30-40% RH.
23 A filter conditioning period may be longer than 24 hours. However, for accepting laboratory temperature and humidity control, the last 24 hours prior to initiation of weighing is considered the filter conditioning period.

2.12. 10.0 Filter Preparation and Analysis January 2016 Page 6 of 23
2.12–PM2.5 Reference/Class I Equivalent Methods
The monitoring organization is afforded some flexibility in determining how to demonstrate the room’s climate conditions have stayed in control over the 24-hour period. The monitoring organization must describe in its QAPP and SOP how it will define and demonstrate control within the gravimetric laboratory. The use of standard deviation (SD), using the 5-minute temperature and RH values as recommended in Section 9.4, is recommended as the best means to demonstrate the room has met the control requirements stipulated in the reference method. The standard deviation calculation will minimize the impact of spikes in relative humidity and temperature readings, and therefore provide an indicator as to the true variability in the weighing room during filter conditioning. If the calculated standard deviation exceeds the limits stated in the reference method, then the weighing room has not demonstrated control and any pending weigh session(s) must be postponed.
Even if the prior 24-hour temperature and humidity range and SD calculations meet acceptance criteria, spikes of temperature or RH may occur. Figure 10.2 shows two examples of relative humidity over a 24-hour filter equilibration period using hourly averages. In both scenarios, the average 24-hour RH (37%) and the standard deviation (3.4%) meet the method requirements. However, in Scenario #1, there are a few hours at the beginning of the equilibration period where the RH is outside of the humidity specification. In Scenario #2, there are a few hours towards the end of the equilibration period where the RH is out of the humidity specification. In Scenario #1, the laboratory analyst may decide to accept the spikes at the beginning of the session and allow weighing to commence (because the 24-hour average and SD are both within specification). However, in Scenario #2, even though the 24-hour average and SD are within specifications, the laboratory analyst may take a more conservative
approach and not allow weighing to commence because the RH spikes occurred at the end of the equilibration period, which would reflect the current condition of the filters. When assessing temperature or relative humidity spikes, the appropriate local decision maker should evaluate all relevant data and decide if the spikes are significant enough to adversely affect filter weights. Experience with this should eventually lead to the ability to estimate which spikes are too big or too lengthy. The evaluation should include the significance of the timing of the spike in relation to the time of weighing, with the closer to the weighing, the more significant the effect on the filter weight.
However, if the spikes in either scenario from Figure 10.2 had been more drastic – such that the calculated SD were greater than 5% RH – then the filter conditioning environment would not

2.12. 10.0 Filter Preparation and Analysis January 2016 Page 7 of 23
2.12–PM2.5 Reference/Class I Equivalent Methods
meet the Appendix L criterion for humidity control, regardless of the timing of the spikes during the 24-hour period. In this case, filters should remain in the conditioning environment until the 24-hour environmental conditions are met before weighing commences. It is important to note that the statistics calculated for the 24-hour filter conditioning period should be computed from the data collected for the 24 hours prior to the start of the actual weighing session, instead of the midnight-to-midnight time frame prior to the start of the weigh session. For example, if the weighing session is slated to start at 9am on Monday, then the lab analyst should review the weighing room’s environmental statistics from 9am Sunday until 9am Monday and verify that the temperature and relative humidity conditions meet reference method specifications before proceeding with the weighing session. The statistics computed from the environmental sensors in the laboratory to determine compliance with the filter conditioning requirements must be recorded and saved, preferably in the laboratory’s data management system. At a minimum, the lab analyst should document the summary statistics that represent the filter conditioning period’s environmental conditions in a laboratory logbook, as well as the dates/times of the conditioning period itself. If possible, it is suggested that the lab analyst directly download the minute data obtained from the environmental sensors and calculate the 24-hour averages and standard deviation manually. This process would serve as a means of verifying that the weighing room has met method specifications, as well as verifying the correctness of the calculations performed by the logging software. Microsoft Excel, or a similar spreadsheet, can be used to easily calculate means and standard deviations of the collected minute data, as well as create control charts. It is recommended that the lab analyst save this spreadsheet as further evidence that the filter conditioning environment met the specifications of Appendix L and the monitoring organization’s QAPP. Along with saving and documenting filter conditioning temperature and RH measurements, any malfunctions, discrepancies, and/or maintenance activities that occurred in the weighing room during filter conditioning should be recorded in a logbook or a laboratory notebook. Pre- and Post-Sampling Filter Conditioning Comparison
In addition to determining if the 24-hour filter conditioning period prior to a weigh session meets Appendix L specifications, the reference method also calls for filters to be conditioned at the same relative humidity conditions during their pre- and post-sampling weighings. Specifically, Appendix L states:
Section 8.3.3. Filters must be conditioned at the same conditions (humidity within ±5 relative humidity percent) before both the pre- and post-sampling weighings.
This additional relative humidity requirement is established in order to limit the effects of water vapor between pre- and post-sampling weighing sessions. To help clarify this requirement, consider the following two scenarios:
A. During the pre-weigh filter conditioning of a batch of filters, the average RH is 33%.
During the post-weigh conditioning of the same batch of filters, the average RH is 36%. The RH difference between these two weighing sessions is 3% RH. Under this scenario,

2.12. 10.0 Filter Preparation and Analysis January 2016 Page 8 of 23
2.12–PM2.5 Reference/Class I Equivalent Methods
the pre- and post-sampling weighings meet the Appendix L requirement.
B. During the pre-weigh filter conditioning of a batch of filters, the average RH is 33%. During the post-weigh conditioning of the same batch of filters, the average RH is 39%. The RH difference between these two weighing sessions is 6% RH. Under this scenario, the pre- and post-sampling weighings do not meet the Appendix L requirement.
In order to ensure that the pre- and post-weighing sessions are within ±5% RH, the environmental conditions in the filter conditioning environment must be tightly controlled and closely monitored. To this end, charting the temperature and relative humidity statistics in the weighing room is recommended. If the logging software utilized in the laboratory does not have this capability, then the lab analyst is encouraged to export the data collected from the logging system and enter it into a spreadsheet (or similar) and create control charts or time-series graphs that demonstrate trends in the laboratory environmental conditions. Figure 10.3 gives an example of daily 24-hour averages plotted on a time-series graph in order to assess trends in humidity over the course of a quarter. This graph shows swings in relatively humidity conditions, which may make it difficult for filter weighings to pass the pre- and post-RH requirement. Charts such as this will provide the lab analyst a quick tool to easily assess overall stability in the weighing room. Recurring spikes in the weigh room’s temperature or relative humidity conditions should be investigated, as they could indicate multiple issues (such as a faltering HVAC system) that would warrant corrective actions.
Figure 10.3 Laboratory relative humidity conditions during a quarter
Tracking the pre- and post-weigh RH conditions can be challenging for the lab analyst. To make this task easier, it is recommended that the databases or spreadsheets utilized in the laboratory be formatted to provide some type of warning indicator to alert the analyst that this specific RH criterion may be exceeded if a post-sampling weigh session commences.
20253035404550
1 4 7 10131619222528313437404346495255586164677073767982858891
RHRE
ADINGS
(%)
DAYS
Daily Means

2.12. 10.0 Filter Preparation and Analysis January 2016 Page 9 of 23
2.12–PM2.5 Reference/Class I Equivalent Methods
10.4.1.4 Sample Batching
In the context of this document a sample batch is defined as a grouping of filters that are conditioned and analyzed as a single event for which laboratory quality control requirements (i.e., temperature, relative humidity, etc) apply. The batch includes the required QC filters (blanks, duplicates, etc). A batch may be based on the number of filters that can be processed in a normal business day while considering post-sampling holding times, as well as ensuring that the post-sampling 24-hour average RH is within lab requirements and is within +5% of pre-sampling RH.
10.5 Quality Control Blanks There are four types of filter blanks that are commonly used in PM2.5 monitoring: field blanks, laboratory blanks, lot blanks, and trip blanks. Field and laboratory blanks are required by 40 CFR Part 50, Appendix L; lot blanks and trip blanks are QC blanks that are not required, but are considered good laboratory practice for conducting assessments. Descriptions of the four types of blanks and their uses are as follows:
Field Blank – Collecting field blanks is required under 40 CFR Part 50, Appendix L, Section 8.3.7.1. A field blank is a filter that is pre-weighed with routine samples, installed in the field sampler without any flow passing over the filter, re-weighed with routine samples, and then initial/final weights compared. The purpose of field blanks is to provide an estimate of total measurement system contamination, including laboratory and field activities. Through a comparison of laboratory blanks against field blanks, contamination from field activities can be assessed. The validation acceptance criterion for field blanks is ±30 g between weighings. The pre- and post-sampling weights and weight difference should be recorded in the QC notebook, on the laboratory data form, and/or in an equivalent database. If the field blank weight change exceeds 30 g, implement appropriate troubleshooting and corrective actions. In practice, field blanks for single channel samplers should be transported to the sampling site, momentarily installed in the sampler, removed, and then stored in their protective containers inside the sampler’s case at the sampling site until the exposed filters are retrieved for post-sampling weighing. In the case of sequential (i.e., multi-filter) samplers, field blanks should be placed in unused sampler slots, kept there during the sampling interval, and retrieved with the exposed filters. This approach presumes that unused slots are available and that the sampler can be programmed to not sample the field blank. If this cannot be done, follow the procedure used for the single channel sampler. As a recommended best-case practice, site operators are encouraged to occasionally install field blanks in a non-active sampler's filter holder over a 24-hour period during which the sampler is not scheduled to be sampling. This practice may be a useful troubleshooting technique. Field blanks should be collected at a frequency of 10% of the sampling runs scheduled per site. For example, a monitor operating on a 1-in-6 day schedule would be expected to have 6 blanks in a year, while a monitor operating every day would be expected to have 36 blanks. Field blanks should be taken throughout the duration of the sampling schedule (spaced evenly across the year) and not concentrated in a short period of time.

2.12. 10.0 Filter Preparation and Analysis January 2016 Page 10 of 23
2.12–PM2.5 Reference/Class I Equivalent Methods
To best utilize field blanks, the measurements should be control charted over time to identify and address trends before the acceptance criterion is exceeded. Field blank control charts should also be periodically compared to laboratory blank control charts to determine contamination originating from field activities. Since field blanks reflect the effect of factors occurring at all steps of the data collection process, evaluation of the effects of field factors requires removing the lab blank variability from the total measurement system variability, and then looking at the remaining values. Field variability could be due to factors having an effect on the cassette assembly, transportation to/from the field site, or issues with the sampler itself (such as sampler cleanliness). Laboratory Blank – Weighing laboratory blanks is required under 40 CFR Part 50, Appendix L, Section 8.3.7.2. A laboratory blank is a filter that is inspected, equilibrated, pre-weighed with a specific batch of filters, post-weighed with the same batch or subset of that batch of filters, and the two weights compared. The pre- and post-sampling weights and weight change should be recorded in the QC notebook, on laboratory data forms (see Figure 10.5), and/or in an equivalent database. The purpose of the laboratory blank is to mimic the laboratory conditions to which all filters in the batch are exposed during inspection, pre- and post-equilibration, and pre- and post-weighing session activities. Laboratory blanks provide an estimate of contamination that may be occurring in the laboratory during these activities. The validation acceptance criterion for laboratory blanks is ±15 g between weighings. If the laboratory blank weight change exceeds 15 g, implement appropriate troubleshooting and corrective actions. Laboratory blanks are intended to be single use. The laboratory analyst must plan to designate several filters as laboratory blanks during the pre-weigh process because all filters from the batch may not all be weighed in the same post-weigh session. Therefore, enough laboratory blanks should be weighed during a pre-sampling weighing session to provide at least one single-use laboratory blank during each subsequent post-sampling weighing session. Typically, assigning 10% of the total filters in a batch as laboratory blanks will allow for enough single-use blanks. At least one laboratory blank from a pre-weigh session must physically remain with the same batch through all laboratory activities. However, when that batch of filters is in the field, the laboratory blanks must be kept completely covered in the weighing room until the filters return to the laboratory. The rationale for this procedure is, since the batch of filters is in the field and not exposed to any potential laboratory contamination, the laboratory blanks should be covered to mimic the absence of the batch from the weighing laboratory. When the filter batch arrives back to the laboratory, the laboratory blanks are returned to the batch, uncovered, equilibrated, and weighed with the batch. To best utilize laboratory blanks, the measurements should be control charted over time to identify and address trends before the acceptance criterion is exceeded. See Figure 10.4 for an example control chart. Assessing elevated laboratory blanks requires examination of all laboratory processes, equipment, and supplies including filter handling, laboratory cleanliness, HVAC filter effectiveness, and shipping media cleanliness.

2.12. 10.0 Filter Preparation and Analysis January 2016 Page 11 of 23
2.12–PM2.5 Reference/Class I Equivalent Methods
Lot Blanks – The use of lot blanks is not required by 40 CFR Part 50, Appendix L; however, their use is considered a "best practice". A filter “lot” may be defined as a group of filters from the same manufacturer, manufactured using the same materials and process, and having the same physical and chemical characteristics. Different lots may have slightly different physical and chemical attributes that may affect equilibration times, such as differences in Teflon© or support ring thicknesses. A lot blank is a filter from the lot that is used to determine filter weight stability over a period of time due to the volatilization of material from the filter, or the absorption of gaseous material into the filter from the atmosphere. In general, lot blanks are weighed repeatedly over time to show when stability is achieved. The most common use of lot blank filters is in a filter lot stability test. Each year, EPA OAQPS provides new acceptance-tested Teflon© filters from a single lot to agencies conducting PM2.5 monitoring for NAAQS. 40 CFR Part 50, Appendix L, Section 8.2 requires all filters to be pre- and post-conditioned (equilibrated) in accordance with specified temperature and relative humidity control requirements. Section 8.2.5 of Appendix L sets the minimum conditioning time at 24 hours. However, every laboratory is different and has different environmental set-points which could have an effect on filter equilibration. Lot stability testing is used to determine the optimal time required to equilibrate the new lot of filters to the specific laboratory with its specific environmental conditions. Resultantly, EPA recommends the use of lot blanks for this particular purpose in the PM2.5 gravimetric laboratory. To complete a lot stability test, nine filters from the new lot are weighed – three filters from three boxes selected at random – every 24 hours until the weight change of each filter is less than 15 g (i.e., three times the precision for weighing unexposed filters). This experiment determines the period of time that the filter lot should be conditioned in the specific laboratory prior to weighing. The results of this one test will be used for all filters in the lot until the lot is depleted. The experiment should be repeated whenever a new lot of filters is received.

2.12. 10.0 Filter Preparation and Analysis January 2016 Page 12 of 23
2.12–PM2.5 Reference/Class I Equivalent Methods
NOTE: Researchers have found that the precision of mass measurements for unexposed filters based on replicate weighings is typically 3 to 5 g/filter (Desert Research Institute 1994). The precision on exposed filters is typically 5 to 8 g/filter. Precision for exposed filters with loadings heavier than 1 mg/cm2 of filter surface area may approach ±2 percent of the loading. The precision for net mass filter loadings (typically 6 to 9 g/filter) is defined as the square root of the sum of the squares of the pre- and post-sampling precision.
In addition to the lot stability testing, lot blanks can be utilized in the gravimetric laboratory as a tool for long-term contamination testing. A long-term exposure blank is a filter, or group of filters, from the lot that is set out in the weighing room in a constant state of conditioning and re-weighed periodically (e.g., weekly) to observe weight change over an extended period of time (e.g., 6 months to a year). If the blanks show a steady weight increase, corrective action may be necessary to control contamination in the laboratory more effectively. However, the use of long-term exposure blanks is optional. The monitoring organization should decide whether or not such testing would be beneficial to its specific QA Program. Trip Blank – Collecting trip blanks is not a requirement under 40 CFR Part 50, Appendix L; however, collecting trips blanks is a “best practice”. A trip blank is a filter that is treated exactly as a field blank, but it is never placed into the sampler or exposed to the ambient environment. The purpose of the trip blank is to assess possible contamination to filters during packing and transport to and from the laboratory to the sampling location. The pre- and post-sampling weights should be recorded in the QC notebook, on the laboratory data form (see Figure 10.5), and/or in an equivalent database. The validation acceptance criterion for trip blanks is ±15 g between weighings. If the weight change exceeds 15 g, contamination in the laboratory or during shipping may be occurring. Implement appropriate troubleshooting and corrective actions. In practice, a trip blank travels with the filters that are used in sampling, but the trip blanks remain protected at all times and are never left in the sampler. In some cases, this may mean that the trip blank is protected in an anti-static bag or with a cap. In other instances, where the filters are shipped in a magazine, the trip blank may travel on top of the filter stack, be removed and capped before installation, and then taken back to the field office. In every case, the trip blank is always protected, is never installed in the sampler, and is never left in the sampler. When utilized, trip blanks are typically collected at a frequency of 5% of the scheduled sampling runs per site, and are taken throughout the duration of the sampling schedule (evenly spaced across the year). However, trip blanks can be used at a higher frequency or on a short-term basis (i.e., concentrated period of time) as an investigative tool when field and laboratory blanks are elevated. To best utilize trip blanks, the measurements should be control charted over time to identify and address trends before the acceptance criterion is exceeded. Trip blank control charts should also be periodically compared to laboratory blank control charts to determine contamination originating from packing and shipping. Ideally, laboratory and trip blank data should be identical, meaning there is no impact from packing and shipping. Residue from cassette cleaning or particles in shipping bags can elevate field blanks and could be falsely identified as a field
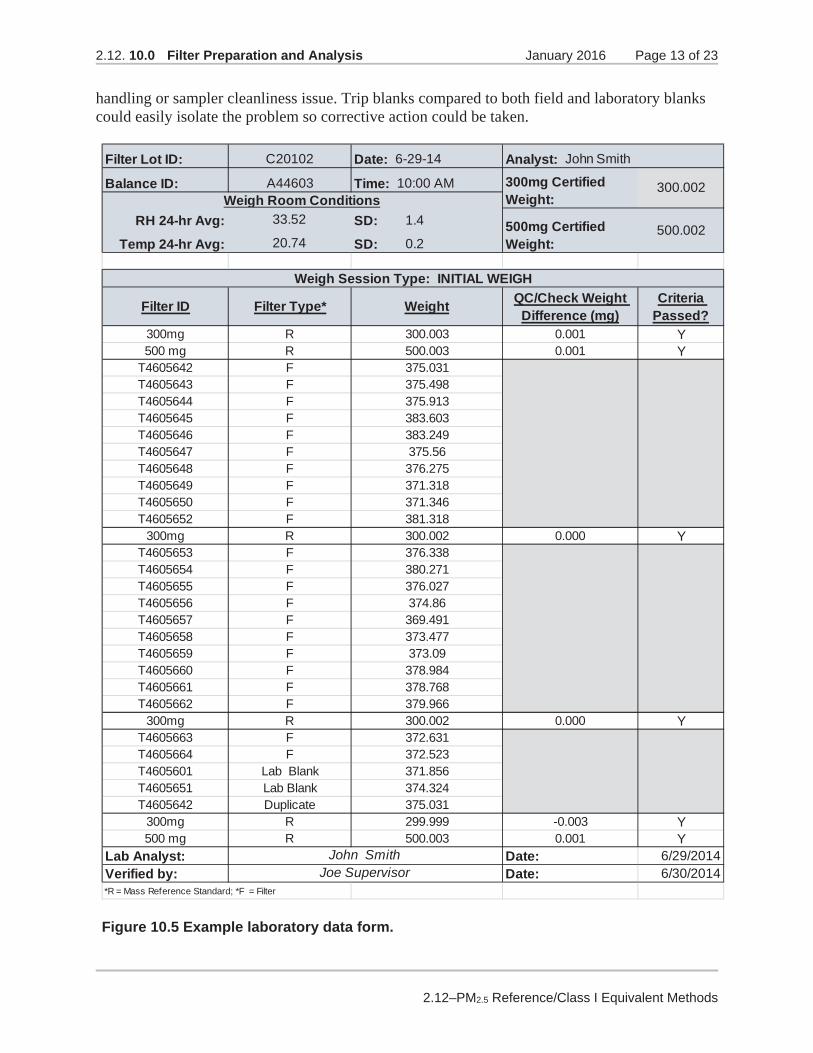
2.12. 10.0 Filter Preparation and Analysis January 2016 Page 13 of 23
2.12–PM2.5 Reference/Class I Equivalent Methods
handling or sampler cleanliness issue. Trip blanks compared to both field and laboratory blanks could easily isolate the problem so corrective action could be taken.
Figure 10.5 Example laboratory data form.
Filter Lot ID: C20102 Date: 6-29-14
Balance ID: A44603 Time: 10:00 AM
RH 24-hr Avg: 33.52 SD: 1.4
Temp 24-hr Avg: 20.74 SD: 0.2
Filter ID Filter Type* Weight QC/Check Weight Difference (mg)
Criteria Passed?
300mg R 300.003 0.001 Y500 mg R 500.003 0.001 Y
T4605642 F 375.031T4605643 F 375.498T4605644 F 375.913T4605645 F 383.603T4605646 F 383.249T4605647 F 375.56T4605648 F 376.275T4605649 F 371.318T4605650 F 371.346T4605652 F 381.318
300mg R 300.002 0.000 YT4605653 F 376.338T4605654 F 380.271T4605655 F 376.027T4605656 F 374.86T4605657 F 369.491T4605658 F 373.477T4605659 F 373.09T4605660 F 378.984T4605661 F 378.768T4605662 F 379.966
300mg R 300.002 0.000 YT4605663 F 372.631T4605664 F 372.523T4605601 Lab Blank 371.856T4605651 Lab Blank 374.324T4605642 Duplicate 375.031
300mg R 299.999 -0.003 Y500 mg R 500.003 0.001 Y
Lab Analyst: Date: 6/29/2014Verified by: Date: 6/30/2014*R = Mass Reference Standard; *F = Filter
John SmithJoe Supervisor
Weigh Room Conditions
Analyst: John Smith
Weigh Session Type: INITIAL WEIGH
300mg Certified Weight:
500mg Certified Weight:
300.002
500.002

2.12. 10.0 Filter Preparation and Analysis January 2016 Page 14 of 23
2.12–PM2.5 Reference/Class I Equivalent Methods
10.6 Pre-Sampling Filter Weighing (Tare Weight)
40 CFR Part 50, Appendix L, Section 8.3.5 requires that the pre-sample filter weighing be conducted within 30 days of the sampling period. Section 8.3.2 of Appendix L requires the analytical balance to be located in the same controlled environment in which the filters are conditioned; additionally, the filters are required to be weighed immediately following the conditioning period without intermediate or transient exposure to other conditions or environments.
Filters should be weighed and processed in batches. See Section 10.4.1.4. Simply put, a batch is a set of filters awaiting pre- or post-weighing. There is no magic number to the size of a batch, since it depends on the size of the laboratory, the type of equipment in use in the laboratory, and the size of the PM2.5 network(s) for which the laboratory processes filters. However, a batch of filters should be considered as the group of filters that can be weighed, following requisite conditioning, in a single business day, since the 30-day pre-sampling filter holding time starts once a filter has been pre-weighed.
NOTE: One might consider a weighing event to include both the filter conditioning process (lasting approximately 24-72 hours) and the filter weighing session (which should occur during the span of a typical 8-10 hour business day). In this scenario, a weighing event could total approximately 2-4 business days. However, when thinking of the weighing session, the gravimetric analysis of a batch of filters should occur no later than 10 hours from the end of the conditioning period. In other words, a batch of filters should be weighed within the same business day that the filter conditioning period is documented as ending (and for which 24-hour environmental statistics have been computed). This guidance distinguishes the conditioning period from the weighing session for convenience of discussion only. It expected that during a weighing session the laboratory temperature and humidity conditions are maintained within the required specifications of 40 CFR Part 50, Appendix L, Section 8.
When preparing a batch of filters to be weighed, the analyst should include the necessary number of QC filters – lab blanks and field blanks. The analyst should plan to weigh enough laboratory blanks during a pre-sampling weighing session to provide at least one single-use laboratory blank during each subsequent post-sampling weighing session. Typically, assigning 10% of the total filters in a batch as laboratory blanks will allow for enough single-use blanks. As an example, if a batch is prepared to include 100 routine sample filters, the analyst should designate ~10 filters as lab blanks. The number of field blanks to prepare, however, depends largely on the sampling schedules of the samplers in the PM2.5 network. In some cases, the monitoring organization will request the specific number of field blanks needed. It is also good practice to include several extra filters in a batch to account for unforeseen circumstances such as filter mishandling in the lab or make-up sample runs.
Once a batch of filters is defined and properly conditioned, the pre-sampling (tare) weighing session can begin. The steps that follow present procedures specific to a common commercially available microbalance. Calibration, QC checks, and operational procedures may have to be adapted for specific microbalance models. If the monitoring organization utilizes a balance/autohandler system, the procedures stated herein may need to be adapted for that specific system as well. If using an autohandler, the laboratory analyst is still responsible for

2.12. 10.0 Filter Preparation and Analysis January 2016 Page 15 of 23
2.12–PM2.5 Reference/Class I Equivalent Methods
ensuring that all of the filter conditioning and weighing requirements (including QC checks) are successfully met and documented, as specified in 40 CFR Part 50, Appendix L. Additionally, the laboratory analyst charged with overseeing the autohandler operation and maintenance should be fluent in manual weighing procedures, and be prepared to weigh filters manually (as described in Sections 10.6 and 10.8 of this document), in the event of autohandler downtime.
To ensure maximum stability, it is recommended that the microbalance be turned on at all times. This enables the microbalance to be operational at any time and eliminates the need for a warm-up period before analyses are performed. Newer microbalances are always turned on (except for their displays) when they are plugged in, but may revert to a “sleep mode” during inactivity.
Follow these steps during the pre-sampling weighing session:
1. Don an anti-static laboratory coat and anti-static, powder-free gloves.
2. Verify that the weighing room’s environmental conditions are in compliance withAppendix L requirements (see Section 10.4). Record the 24-hour averages for RH andtemperature on the laboratory data form and in the laboratory QC notebook or database.The SD of these parameters should also be documented.
3. Clean the microbalance’s weighing chamber with a fine brush. (Anti-static brushes forcleaning the microbalance and the surrounding area are available. Avoid using pressurizedgas, which may blow damaging debris and oils into the microbalance’s mechanism.)
4. Clean the surfaces near the microbalance with anti-static solution or alcohol-moisteneddisposable laboratory wipes.
5. Clean both the mass reference standards forceps and the filter forceps with a lint-free clothand moistened laboratory wipes. Allow the forceps to thoroughly air-dry. Even a smallamount of moisture can cause a significant measurement bias.
6. Zero (i.e., tare) and calibrate the microbalance according to the manufacturer’s directions.Many newer microbalances calibrate themselves automatically when the operator presses akey.
7. Exercise the microbalance by opening and closing the draft shield five times. Thisencourages smooth operation of the draft shield mechanics and allows air from theequilibrated environment to enter into the balance.
8. Using smooth, non-serrated, nonmetallic forceps, weigh two working mass referencestandards – one 100 mg lighter and one 100 mg heavier than an average unloaded filter – asa QC check. Handle the working standards carefully to avoid damage that may alter theirmasses. Wait until the microbalance’s display indicates that a stable reading has beenobtained. (Consult the microbalance's operating manual for more information aboutobtaining stable readings.) Record both the verified and measured values of these standardson the laboratory data form and/or in the laboratory QC notebook or database.

2.12. 10.0 Filter Preparation and Analysis January 2016 Page 16 of 23
2.12–PM2.5 Reference/Class I Equivalent Methods
If the verified and measured values of a working standard disagree by more than 3 g (i.e., three times the microbalance’s repeatability), reweigh the working standard. If the two values still disagree, troubleshoot and take appropriate corrective action, which may include (1) reverifying the working standards against the laboratory primary standards and/or (2) having a service technician repair the microbalance. The analyst should not attempt to repair the microbalance.
9. Weigh the filters. Operate the balance according to the manufacturer’s directions.
a. Zero the microbalance. The preferred way to zero the microbalance is to allow thebalance to return to zero on its own. The microbalance may be manually tared to force zero, but this practice may mask drift or stability issues with the microbalance.
b. Take the filter from its filter-handling container (petri dish or petri slide) by gentlyslipping the filter-handling forceps under the outer polyolefin support ring.
c. Hold the filter only by the ring, not by the filter material. Pass the filter near an anti-static device (see Section 9.6) for 30 to 60 seconds immediately prior to weighing. The anti-static strip should be inside the microbalance’s weighing chamber or as close to the chamber door as is practical.
d. Immediately transfer the filter to the microbalance’s weigh pan and close theweighing chamber door.
e. After the microbalance’s display indicates that a stable reading has been obtained,record the balance number, the filter number, the filter lot number, and the filter’s tare weight (pre-sampling mass) on the laboratory data form and/or in the laboratory notebook or database.
f. Return the filter to its filter-handling container and place the lid on the container.
10. After every 10th filter, the analyst should reweigh at least one of the working standards.Record the measurement on the laboratory data form and/or in the laboratory QC notebookor database. If this measurement disagrees from the verified value by more than 3 g,reweigh the standard. If the two measurements still disagree, troubleshoot and takeappropriate corrective action, which may include (1) reweighing all of the previouslyweighed filters, (2) reverifying the working standards against the laboratory primarystandards, and/or (3) having a service technician repair the microbalance. The analystshould not attempt to repair the microbalance.
11. At the end of the weighing session, reweigh both working standards. Record themeasurements on the laboratory data form and/or in the laboratory QC notebook ordatabase.
12. Weigh the batch duplicate filter as a final QC check. The batch duplicate is one routinefilter randomly selected from the batch and reweighed; the acceptance criterion is ±15 g.
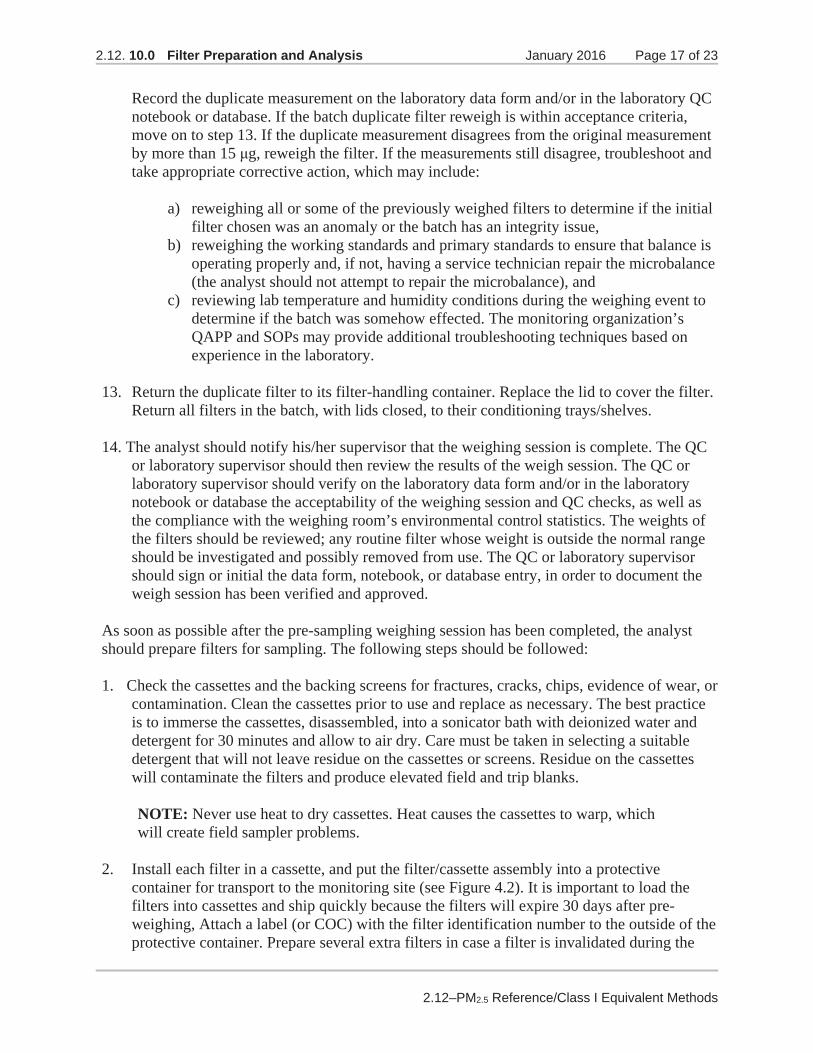
2.12. 10.0 Filter Preparation and Analysis January 2016 Page 17 of 23
2.12–PM2.5 Reference/Class I Equivalent Methods
Record the duplicate measurement on the laboratory data form and/or in the laboratory QC notebook or database. If the batch duplicate filter reweigh is within acceptance criteria, move on to step 13. If the duplicate measurement disagrees from the original measurement by more than 15 g, reweigh the filter. If the measurements still disagree, troubleshoot and take appropriate corrective action, which may include:
a) reweighing all or some of the previously weighed filters to determine if the initialfilter chosen was an anomaly or the batch has an integrity issue,
b) reweighing the working standards and primary standards to ensure that balance isoperating properly and, if not, having a service technician repair the microbalance(the analyst should not attempt to repair the microbalance), and
c) reviewing lab temperature and humidity conditions during the weighing event todetermine if the batch was somehow effected. The monitoring organization’sQAPP and SOPs may provide additional troubleshooting techniques based onexperience in the laboratory.
13. Return the duplicate filter to its filter-handling container. Replace the lid to cover the filter.Return all filters in the batch, with lids closed, to their conditioning trays/shelves.
14. The analyst should notify his/her supervisor that the weighing session is complete. The QCor laboratory supervisor should then review the results of the weigh session. The QC or laboratory supervisor should verify on the laboratory data form and/or in the laboratory notebook or database the acceptability of the weighing session and QC checks, as well as the compliance with the weighing room’s environmental control statistics. The weights of the filters should be reviewed; any routine filter whose weight is outside the normal range should be investigated and possibly removed from use. The QC or laboratory supervisor should sign or initial the data form, notebook, or database entry, in order to document the weigh session has been verified and approved.
As soon as possible after the pre-sampling weighing session has been completed, the analyst should prepare filters for sampling. The following steps should be followed:
1. Check the cassettes and the backing screens for fractures, cracks, chips, evidence of wear, orcontamination. Clean the cassettes prior to use and replace as necessary. The best practice is to immerse the cassettes, disassembled, into a sonicator bath with deionized water and detergent for 30 minutes and allow to air dry. Care must be taken in selecting a suitable detergent that will not leave residue on the cassettes or screens. Residue on the cassettes will contaminate the filters and produce elevated field and trip blanks.
NOTE: Never use heat to dry cassettes. Heat causes the cassettes to warp, which will create field sampler problems.
2. Install each filter in a cassette, and put the filter/cassette assembly into a protectivecontainer for transport to the monitoring site (see Figure 4.2). It is important to load thefilters into cassettes and ship quickly because the filters will expire 30 days after pre-weighing, Attach a label (or COC) with the filter identification number to the outside of theprotective container. Prepare several extra filters in case a filter is invalidated during the

2.12. 10.0 Filter Preparation and Analysis January 2016 Page 18 of 23
2.12–PM2.5 Reference/Class I Equivalent Methods
installation process.
3. If the filters will be mailed, the field operator should be supplied with a cooler or otherreinforced box that, in addition to the protective sample container, can protect exposed filters during their shipment back to the analytical laboratory, as well as keep filters at the temperature acceptance conditions discussed in Section 10.7 below.
10.7 Post-Sampling Documentation and Filter Inspection
All filter shipments returning to the laboratory from the field must be assessed to determine the time required for filter post-weighing. Upon receipt of the sample from the field, the analyst should follow these steps:
1. Examine the COC and/or field data sheet. Determine whether all data needed to ensuresample custody, verify sample validity, and to calculate mass concentration (e.g., averageflow rate, ambient temperature and barometric pressure, and elapsed time) are provided.If data are missing or unobtainable from a field operator, or if a sampler malfunction isevident, record this information on the laboratory data form.
2. Inspect the samples for damage (see Section 10.3; damage may also include scratches inthe filter, fingerprints, bugs, etc). The analyst should document on the COC, thelaboratory notebook, and/or the laboratory database if any samples arrived damaged. Theanalyst should document and thoroughly describe the type and extent of the damage. Thisinformation will be needed by the monitoring organization’s QA Coordinator (or decisionmaker) when making the final determination of data validity. Non uniform deposits onthe filters do not necessarily invalidate a sample, but should be documented. It isrecommended that the post-weighing procedure be completed on all samples (even thosethat are damaged). The analyst should appropriately flag any samples that have dataintegrity issues rather than not weighing them at all.
3. Determine when the filters must be weighed. This is determined by comparing theshipping receipt temperature to the average ambient temperature from the sampling runand applying the post-weighing criteria in 40 CFR Part 50, Appendix L, Section 8.3.6.Also, samples must always be protected from temperatures exceeding 25 C duringretrieval and shipping, pursuant to 40 CFR, Part 50, Appendix L, Section 10.13. Simplyput, if the filters, from collection from the sampler through shipping to the weighinglaboratory, are maintained at a temperature below the average ambient temperature fromthe run and protected from temperatures above 25 C, then the analyst must weigh thefilters within 30 days. If the samples are received above the average samplingtemperature from the run and below 25 C, then the analyst must weigh the filters within10 days.
The best practice is to use ice substitutes with a min/max thermometer when collectingfilters from the sampler, and then shipping the filters to the laboratory, to ensure thefilters remain below the average ambient temperature of the sampling run. Athermometer is necessary to give a quantitative record of the temperature to determine

2.12. 10.0 Filter Preparation and Analysis January 2016 Page 19 of 23
2.12–PM2.5 Reference/Class I Equivalent Methods
which weighing time frame to follow. If filters are shipped cold with ice substitutes, a thermometer without min/max capability may be acceptable. However, EPA discourages shipping filters without a source of cooling. In the event that ice substitutes are not utilized, the cooler would need to contain a temperature logging device in order to track the temperature from sample collection to laboratory receipt. 40 CFR Part 50, Appendix L, Section 8.3.6 includes a provision for cold weather sampling that dictates where the average sampling temperature is below 4 C, the samples must be maintained from sample retrieval to the laboratory at less than 4 C to allow for the 30-day post-weigh time. If these filters collected in cold weather exceed 4 C during collection, shipping, or storage, but stay below 25 C, the analyst has only 10 days to weigh the filters. The following flowchart (Figure 10.6) may be used to assist the laboratory analyst in determining post-weighing time frames. In most cases, all filters arriving at the laboratory should be post-weighed. While the laboratory analyst may have determined using the flow chart or visual inspection that a filter will be invalid, the monitoring organization’s QA Coordinator (or decision maker) should make the final determination of validity. However, it is the laboratory analyst’s responsibility to clearly flag the filter so that the QA Coordinator can make an accurate assessment of validity.
2.12. 10.0 Filter Preparation and Analysis January 2016 Page 20 of 23
2.12–PM2.5 Reference/Class I Equivalent Methods
3. All sample shipments that were shipped cold and were, in fact, received cold should be immediately refrigerated at 1-4 C until several hours before the start of the filter conditioning period. When the analyst is ready to begin the filter conditioning process, the shipment should be removed from the refrigerator and allowed to warm to the filter conditioning environment’s temperature before opening, in order to preclude water condensation on the sample filter(s) contained within. Remove the samples from the protective container and examine the container. If particulate matter or debris is found in the protective container after the filter has been removed, record that the sample has been flagged as questionable and state the reason as a remark at the bottom of the laboratory data form. Save the filter for inspection. Notify the appropriate personnel.
4. Match the filter identification number with the correct laboratory data form on which the
original microbalance number, filter number, pre-sampling filter weight, and other information were inscribed. Group filters according to the microbalance used to determine their initial tare weights. Initial separation of filters in this way eliminates the risk of a measurement error that could result from the use of different microbalances for pre- and post-sampling weighings.
5. Remove the filter from both the protective container and the filter cassette. Some cassettes
may require special tools to disassemble them.
NOTE: The stainless steel screen is sharp. Be very careful when removing the filter from the cassette. If the filter sticks to the stainless steel screen, carefully lift the filter without tearing the Teflon©. Sticking is generally an indicator of a poor screen cleaning process.
Remove the cassette and stainless steel backing screen to another area for cleaning. Be
careful not to touch or otherwise disturb the filter and its contents. Transfer the filter to a filter-handling container labeled with the corresponding filter number. Place the used filter in the container “dirty-side” up. The filter should be handled with clean, smooth forceps and should not be touched by hands. If any damage occurs to the filter resulting from removing it from the cassette, the damage should be documented.
6. Transfer the filter in its filter-handling container to the filter conditioning environment. 7. Allow the filter to condition for at least 24 hours. 10.8 Post-Sampling Filter Weighing (Gross Weight) Both the pre- and post-sampling filter weighings should be performed on the same analytical balance. Different analysts can perform the pre- and post-sampling filter weighings as long as the appropriate standard operating procedures (SOPs) have been followed and the working standard and duplicate measurements are within specifications. Use an effective technique to neutralize static charges on the filter. The post-sampling conditioning and weighing shall be completed within 240 hours (10 days) after the end of the sampling period, unless the filter is maintained in the manner described in Section 10.7 that would allow for weighing within 30 days from sample retrieval.

2.12. 10.0 Filter Preparation and Analysis January 2016 Page 21 of 23
2.12–PM2.5 Reference/Class I Equivalent Methods
Follow these steps during post-sampling filter weighing:
1. Group filters in numerical order according to the microbalance used for pre-weighing andby their filter numbers. Reweigh each filter on the same microbalance on which its pre-sampling weight was obtained.
2. Repeat Steps 1 through 14 in Section 10.6, noting the following differences.
a. At least one laboratory blank from the same pre-weigh batch, and any available fieldblank, should be weighed. If the pre- and post-sampling weights for the laboratoryblanks disagree by more than 15 g, repeat the measurements. If the pre- and post-sampling weights for the field blanks disagree by more than 30 g, repeat themeasurements. If the two measurements still disagree, troubleshoot and takeappropriate corrective action, as specified in the monitoring organization’s QAPP.Measurements for sampled filters should not be corrected to account for blankmeasurements.
NOTE: Occasional high blank values should not cause the automatic invalidation ofsampled filters that were measured during the same weighing session. Instead, suchvalues should trigger troubleshooting and corrective action to reduce blank values toacceptable levels. However, repeated, excessively high blank values could indicate asignificant underlying issue in the laboratory, such as improper grounding, whichcould jeopardize the quality of the data, if not resolved. Control-charting laboratoryblank values is recommended.
b. One routine filter should be reweighed as a batch duplicate. For this post-samplingweigh session, however, the filter chosen should be an exposed (sampled) filter. Theacceptance criterion remains ±15 g. If the duplicate measurement disagrees from theoriginal measurement by more than 15 g, reweigh the filter. If the measurements stilldisagree, troubleshoot and take appropriate corrective action, which may include (1)reweighing all of the previously weighed filters, (2) reweighing the working standards,or (3) having a service technician repair the microbalance. The analyst should notattempt to repair the microbalance.
3. If the filter(s) will receive further analysis, return it to the filter-handling container and noteon the container and the laboratory data form that additional analyses are required. Transferthe filter to the laboratory responsible for performing the additional analyses.
10.9 Calculation of Net Mass Filter Loading
A filter’s post-sampling mass minus its pre-sampling mass is the net mass loading for that filter. Record this value on the laboratory data form. Refer to Section 12.0, "Calculations, Validations, and Reporting of PM2.5 Monitoring Data," for the calculations required to compute and report ambient PM2.5 concentrations in g/m3. Measurements for sampled filters should not be corrected to account for blank measurements.

2.12.10.0 Filter Preparation and Analysis January 2016 Page 22 of 23
2.12–PM2.5 Reference/Class I Equivalent Methods
10.10 Internal Quality Control
See Table 9-1 for a summary of the internal QC requirements for the pre- and post-sampling weighing sessions.
The laboratory data management system (DMS) should contain weighing session QC data and may contain supplemental QC documentation such as: the microbalance calibration and maintenance information, routine internal QC checks of mass reference standards and laboratory and field filter blanks, and external quality assurance (QA) audits. The DMS should be designed to plot QC data (results of blanks, duplicate weigh sessions, and the weigh room’s environmental conditions) on control charts so that long-term trends can be identified. It is recommended that QC charts be maintained on each microbalance and routinely plotted and reviewed. These charts may indicate instrument malfunctions, procedural problems, and/or poor quality supplies or materials, before significant data impacts are realized.
If more than one microbalance is used in the laboratory, the pre- and post-sampling measurements of the filter should be made on the same microbalance.
It is also recommended that someone other than the routine analyst reweigh a portion of the filters from a manual weigh session (batch) as an additional QC check. This duplicate weighing by an independent person provides further confidence in the results of the weighing session. If this best practice recommendation is implemented, it is suggested that 7% of the filters in the batch be reweighed, the results of which documented in the laboratory QC logbooks and/or database.
It is further recommended that the temperature and relative humidity devices in the weighing room be verified on a routine basis. Verification of these devices can be performed by the analyst, although an independent (QA) staff member is suggested. The verification should be performed using independent, NIST-traceable temperature and relative humidity standards (see Section 4.3.9). The results of the verification checks should be recorded on a data form, in the laboratory logbook, and/or laboratory QC database. Temperature results should fall within ±2°C of the audit standard; relative humidity values should fall within ±2% of the audit standard. If the verification results do not fall within these guidelines, the temperature and/or relative humidity devices may need to be returned to the vendor for recalibration/recertification. See Section 11.2.8 for additional information.
10.11 Filter Archive Requirements
Air pollution control agencies must archive the exposed, final-weighed PM2.5 filters from all SLAMS sites. 40 CFR Part 58.16(f) specifically states:
The state, or where applicable, local agency shall archive all PM2.5, PM10, and PM10-2.5 filters from manual low-volume samplers (samplers having flow rates less than 200 liters/minute) from all SLAMS sites for a minimum period of 5 years after collection. These filters shall be made available for supplemental analyses, including destructive analyses if necessary, at the request of EPA or to provide information to state and local agencies on particulate matter composition. Other Federal agencies may request access

2.12.10.0 Filter Preparation and Analysis January 2016 Page 23 of 23
2.12–PM2.5 Reference/Class I Equivalent Methods
to filters for purposes of supporting air quality management or community health—such as biological assay—through the applicable EPA Regional Administrator. The filters shall be archived according to procedures approved by the Administrator, which shall include cold storage of filters after post-sampling laboratory analyses for at least 12 months following field sampling. The EPA recommends that particulate matter filters be archived for longer periods, especially for key sites in making NAAQS-related decisions or for supporting health-related air pollution studies.
Cold storage involves refrigerating exposed sample filters; archived filters should not be frozen. After removal from cold storage, the filters should be relocated to a clean, dry area, where they will be protected from light, vibrations, and dust sources.

2.12.11.0 Performance Evaluation Procedures January 2016 Page 1 of 15
2.12–PM2.5 Reference/Class I Equivalent Methods
11.0 Performance Evaluation Procedures 11.1 Overview This section summarizes the performance evaluation (PE) procedures for assessing measurement uncertainty, precision, and bias for reference or Class I equivalent methods for PM2.5 sampling at State and local air monitoring stations (SLAMS) sites. These requirements are specified in 40 CFR Part 58, Appendix A. This section also gives suggestions for components of performance and systems audits of samplers, balances, and operational procedures that Primary Quality Assurance Organizations (PQAO) may wish to conduct, in addition to those to be provided by the U.S. Environmental Protection Agency (EPA) Regional Office. Table 11-1 consolidates the required and recommended PE components and lists the personnel responsible for conducting and reporting the results, the frequency at which the audits or checks are to be performed, and the performance goal.
24 See Validation Template on AMTIC for any revisions to acceptance criteria in this table http://www3.epa.gov/ttn/amtic/qapollutant.html
Table 11-1. Systems and Performance Evaluation Components for Manual Method PM2.5 Samplers24
Component
Conducted by
Frequency
Performance
goals 1.
Sampler flow rate audit. (a) Sampler display versus audit device reading. (b) Audit device reading versus designated flow rate (required).
PQAO Every 182 days and twice a year
(a) ±4 percent (b) ±5 percent
2.
Precision via collocated sampler at 15 percent of sampling sites for each method designation of a primary sampler (required).
PQAO Every 6 days 10 percent coefficient of variation (CV) for total precision
3.
Federal Reference Method (FRM) PE via 1 to 2 days collocation of an FRM sampler at 5 or 8 sampling sites each year (required).
PQAO or EPA Regional Offices
5- 8 PEP values a year
±10 percent for total bias
4.
Balance systems and performance audits (recommended).
PQAO Every 365 days and once a year
Meet QAPP goals; agreement within 3 μg
5.
Sampler performance audits (temperature, pressure, flow rate) (recommended, based on quality assurance project plan [QAPP]).
PQAO Per QAPP Per QAPP
6.
Systems audit (required). EPA Regional
Offices Once every 3 years
Meet CFR and QAPP goals
7.
Systems audit (recommended). PQAO or State Soon after
network startup & periodically thereafter
Meet CFR and QAPP goals

2.12.11.0 Performance Evaluation Procedures January 2016 Page 2 of 15
2.12–PM2.5 Reference/Class I Equivalent Methods
For the PE components listed in Table 11-1 that are conducted by the SLT agency or PQAO, it is expected that the agency or organization will include details in its QAPP and standard operating procedures (SOPs) that describe:
Conducting and reporting of the required semi-annual (i.e., 182 days) sampler flow rate audits
Conducting and reporting of data to AQS from the required collocated samplers to estimate precision
Any additional systems or performance evaluations it wishes to conduct. In general, any PE or audit, whether conducted by personnel outside or within the monitoring organization, should be conducted under the following guidelines:
Without special preparation or adjustment of the system to be evaluated.
By an individual with a thorough knowledge of the instrument or process being evaluated, but not by the routine operator.
With accurate, calibrated/certified, National Institute of Standards and Technology
(NIST)-traceable transfer standards that are completely independent of those used for routine calibration and QC flow checks (although both calibration standards and audit standards may be referenced to the same primary standard for flow rate, volume, temperature, pressure, or mass).
With complete documentation of audit information. This documentation includes, but is
not limited to, the types of instruments evaluated, the audit transfer standards and transfer standard traceability, the instrument model and serial numbers, the calibration information, and the collected audit data.
Overviews of the procedures for conducting performance and systems evaluations of the PM2.5 collection and measurement processes are provided in these sections:
Section 11.2, "Performance Evaluations" (sample flow rate audit, precision assessment, FRM PEP, balance accuracy, and so forth); and,
Section 11.3, "Systems Audits" (EPA Regional Office audits and internal audits conducted
by the monitoring organization or PQAO). 11.2 Performance Evaluations This section presents performance audit procedures specific to reference or Class I equivalent PM2.5 samplers that operate on the inertial impaction principle at a sample flow rate of 16.67 L/min. Procedures for auditing samplers that operate according to other principles (e.g., open-path optical monitors) are not discussed here. 40 CFR Part 58, Appendix A requires that PQAOs assess, on an ~182 day basis (and twice a year), a flow rate audit of each primary (data-reporting) PM2.5 sampler used in their SLAMS monitoring network and report this data to AQS.
2.12.11.0 Performance Evaluation Procedures January 2016 Page 3 of 15
2.12–PM2.5 Reference/Class I Equivalent Methods
Appendix A of 40 CFR Part 58 also requires PQAOs to collocate 15 percent of its samplers, based on method designation (method codes25). Furthermore, the PQAOs are required to assess total measurement system bias by making side-by-side comparisons between the site’s primary sampler PM2.5 concentration results and those of an FRM Performance Evaluation Program (PEP) sampler that is temporarily installed adjacent to the site sampler. This operation may be implemented by the EPA Regional Office. This section also offers guidance to SLTs or PQAOs that may wish to incorporate internal audits into their PM2.5 monitoring program. Internal performance audits are recommended for sampler flow rate, temperature, and barometric pressure. Balance audits are also suggested. Monitoring organizations may elect to include an internal audit of the operational aspects of PM2.5 samplers as part of their overall QAPP. The person conducting these audits should be someone other than the regular site operator. It is also important that the audit devices for flow rate, temperature, and barometric pressure not be the ones used for regular site checks and calibrations. However, the audit transfer standards may be traceable to the same primary standards as the calibration standards. 11.2.1 Sampler Flow Rate Audit The calibration relationship between the flow rate (in actual L/min) indicated by the flow rate standard and the sampler’s flow rate measurement device should be established or verified in accordance with the sampler’s operations or instruction manual prior to the audit; however, no adjustments may be made to the sampler’s flow rate sensors or controls before the audit is performed. A suggested audit data recording form is shown in Figure 11.1. The example audit data sheet shown in Figure 11.1 should be styled to include additional information as necessary. In conducting the sampler flow rate audit (or any audit for that matter), the auditor should consult the manufacturer’s operations manual for sampler-specific procedures, suggestions, and precautions. The audit of the sampler’s flow rate consists of one measurement made at the sampler’s operational flow rate. The flow rate transfer standard used for the audit must not be the same flow rate standard used to verify or calibrate the sampler, but may have been made traceable to the same primary standard for flow rate or volume. The sampler’s operations or instruction manual should provide specific instructions for using the instrument’s flow rate readout or display. The audit is performed by the operator or by personnel from the quality assurance (QA) unit of the monitoring organization as follows: 1. Install a flow rate audit filter/cassette in the filter holder of the sampler. Filters used for
flow rate audits should not be used further for sampling. If the network’s sampling schedule is on a daily basis, or if the loss of a sampling day cannot be accommodated, a flow rate audit may be conducted during a sampling event provided that:
The active sampling filter is removed and protected from contamination and damage by
storing it in a clean container between uses; 25 Method codes can be found in AQS
2.12.11.0 Performance Evaluation Procedures January 2016 Page 4 of 15
2.12–PM2.5 Reference/Class I Equivalent Methods
A flow rate audit filter is used for the audit; and,
The active sampling period is not interrupted for more than 1 hour in order to achieve a
minimum overall sampling period of 23 hours. 2. Complete the required information at the top of the sampler audit data sheet (Figure 11.1). 3. Generate flow on the sampler and observe the “as found” value (in L/min). Record this
value on the audit data sheet and/or in the sampler logbook.
4. Perform an external leak check as described in Section 7.4.3. This value also verifies the “as found” condition of the sampler. Record the value on the audit data sheet and/or in the sampler logbook.
5. Perform the flow rate audit. Connect the flow rate transfer standard to the sampler
downtube. If using the flow audit adapter with flexible tubing to connect the flow rate standard, be careful not to crimp the tubing. If the transfer standard is electronic (such as an electronic manometer coupled to an orifice device), allow the audit standard sufficient warm-up time, based on one’s prior experience with the device, for readings to stabilize.
6. Observe the flow rate indicated by the PM2.5 sampler’s data display or other readout device.
Record this value and the corresponding flow rate indicated by the audit device on the audit sheet and/or in the sampler logbook. If units other than actual flow are displayed by the audit device, the ambient temperature and barometric pressure will have to be independently determined and calculations will have to be made to express results at ambient conditions. See Section 11.2.1.1 for calculation methods. Also, compare the audit flow rate with the designated flow rate, 16.67 L/min.
7. Determine the percent differences in flow rate. Record all data for eventual submission to
the EPA AQS database. 8. Following the measurement with the flow rate standard, remove the adapter/standard and
reinstall the sampler inlet. From the sampler’s display, read the sampler’s operating flow rate again (in L/min) with the flow rate filter in place. Ensure the flow rate has not significantly changed from that observed in Step 3 above, which could indicate an issue developed within the sampling train resulting from the audit process. Remove the flow rate audit filter. Do not use it for further sampling; it may be used several more times for flow rate audits of the same model sampler, provided it is carefully stored between uses to prevent contamination or damage. Stop using this filter when a buildup of particles on the filter surface is visible.
9. Replace the sample filter if it was removed in the midst of a sampling event. Otherwise,
return the sampler to its pre-audit condition.

2.12.11.0 Performance Evaluation Procedures January 2016 Page 5 of 15
2.12–PM2.5 Reference/Class I Equivalent Methods
11.2.1.1 Flow Rate Audit Data Calculations
PM2.5 flow rate audit results should be reported at ambient conditions and should not be corrected to standard conditions (e.g., 25 C, 760 mmHg). However, for some types of audit devices, it may be necessary to correct the indicated audit flow rates to ambient conditions. Equation (11-1) may be used to make this correction. The following correction should be applied only if the audit device reports flow rate already corrected to standard conditions (e.g., mass flowmeters). Be sure to verify the standard conditions of temperature and pressure (Tstd and Pstd, respectively) applicable to the audit device.
Qa = Qstd(Ta/Pa) (Pstd/Tstd) (11-1)
where
Qa = flow rate at actual conditions, L/min Qstd = flow rate reported at standard temperature and pressure (e.g., 25 C, 298 K;
760 mmHg or 101 kPa), L/min Ta = ambient temperature, K Pa = ambient barometric pressure, mmHg or kPa
Pstd, Tstd = standard barometric pressure and temperature, respectively.
Determine the percentage difference between the sampler-indicated flow rates and the audit-measured flow rates using Equation (11-2). Record the result on the audit data sheet. Any deviation greater than ±2 percent may require recalibration.
% difference = 100 (Qa(sampler) - Qa(audit))/Qa(audit) (11-2)
11.2.2 Temperature Audit Procedures
Ambient temperature, filter temperature, and ambient pressure sensors on the PM2.5 sampler may be audited in conjunction with the flow rate audit. Make no adjustments to the sampler prior to recording all audit results. Record the audit data on a form similar to the one shown in Figure 11.1.
A one-point temperature audit is sufficient. The temperature standard used for the audit must not be the same standard used to verify or calibrate the sampler, but may have been made traceable to the same primary standard for temperature. If the audit fails (assuming the audit device is accurate), it is documented and reported and calibration of the samplers’ temperature sensors may be warranted. Details of temperature calibration procedures are found in Section 6.4, "Calibration Procedures," of this document and can be adapted for audit purposes. Record the stabilized temperature reading and report the results on a data sheet such as the one shown in Figure 11.1. Any deviation greater than 2 C should be reported for corrective action.

2.12.11.0 Performance Evaluation Procedures January 2016 Page 6 of 15
2.12–PM2.5 Reference/Class I Equivalent Methods
Figure 11.1 Example PM2.5 Sampler Audit Data Sheet
PM2.5 AUDIT FORM
Manufacturer:Model No.: AQS Site No.:Inv./Ser. No.: Location:
Operator:Device:Serial Number: Auditor:Cert Date: Audit Date:
Cert Date:
Cert Date:
FlowrateSet Flowrate
Initial Leak TestFinal Leak Test
Temperature Ambient Ambient Degree Filter Filter Degree Comp Comp DegreeRange Sensor Sensor difference Sensor Sensor difference Sensor Sensor difference
Sampler Audit 2º Limit Sampler Audit 2º Limit Sampler Audit 2º LimitZero (ice bath)
AmbientHigh
Comments:
Verified By: Date:
(Flow Rate, Temperature, and Pressure)
INSTRUMENT SITE
FLOW RATE
FLOW DEVICE
TEMPERATURE PROBE
Sampler Flow Audit Flow % DifferenceReading (LPM) (LPM) 4% to Audit Device; 5% to Target
16.67 Comparison to Audit
Pressure (mm Hg) Pressure (mm Hg) (10 mm Hg Limit)
mm Hgmm Hg Operator Leak Test mm Hg
TEMPERATURE
PRESSUREBarometric Barometric mm Hg
Audit Difference
BAROMETER
TIMESampler Audit Difference
Sampler
2.12.11.0 Performance Evaluation Procedures January 2016 Page 7 of 15
2.12–PM2.5 Reference/Class I Equivalent Methods
11.2.3 Barometric Pressure Audit Procedures
Ambient pressure is audited using a suitably calibrated sensor at ambient conditions. Refer to Section 6.5 of this document for information on establishing traceability and the use of portable barometers, and Section 7 for the audit procedure, which would be very similar to the verification procedure but with the use of an independent device. Record all findings on an audit data form. Any deviation greater than 10 mmHg should be reported for corrective action.
11.2.4 Time Audit
For a time audit of the sampler, one can use a cellular phone that can access the official NIST Clock at www.time.gov (i.e., atomic clock), or has been checked against this clock and is within 30 seconds of it. Most celluar phones are synced to the NIST Time, so it will be rare that the celluar phone will be off. The sampler’s time must be within 60 seconds of the NIST time.
11.2.5 Assessment of Precision Using Collocated Samplers
Collocated sampler results, where the collocated sampler is not necessarily a reference method sampler but a sampler of the same designated method as the primary sampler, are used to assess measurement system precision according to the schedule and procedure specified in 40 CFR Part 58, Appendix A, Section 3.2.3. The regulations require that 15 percent of a PQAO’s primary samplers have another sampler (termed the “QC monitor” in CFR) collocated at the same site and collect a sample on at least an every sixth day schedule, such that the primary and collocated samplers capture samples from all days of the week throughout the year. The site locations for the collocated samplers are decided by choosing those sites that are most likely to have higher concentrations of PM2.5 or that have been found to be in violation of the National Ambient Air Quality Standards (NAAQS) during initial studies. Refer to 40 CFR Part 58, Appendix A, Section 3.2.3 for details. The collocated sampler measurements will be used by EPA to calculate quarterly and annual precision estimates for each primary sampler and for each designated method employed by each PQAO. A data quality objective (DQO) of 10 percent CV or better has been established for the operational precision of PM2.5 monitoring data.
11.2.5.1 Procedure for Collocated Measurements
The collocated QA sampler must be kept clean, serviced, and inspected frequently for proper operation, and the calibration of its flow rate, temperature, and pressure measurement systems must be checked and verified at the same intervals as the primary sampler.
The station’s primary sampler and the collocated (audit) sampler must be located at least 1 meter but no more than 4 meters apart, and their inlets should be at the same height above ground and within 1 meter of each other as measured in the vertical direction. Space either sampler at least 2 meters away from a high-volume sampler. The samplers must be calibrated and operated according to their operations manuals, and the samples must be stored, shipped, and analyzed identically, as described in the sampler’s operation or instruction manual and in general accordance with the guidance in this document and in the monitoring organization’s QAPP and SOPs.

2.12.11.0 Performance Evaluation Procedures January 2016 Page 8 of 15
2.12–PM2.5 Reference/Class I Equivalent Methods
The concentrations determined from the site’s primary sampler and from the collocated sampler are to be reported to EPA as directed in 40 CFR Part 58, Appendix A, Section 4.
NOTE: All collocated measurements must be reported, even those that are considered invalid because of identified malfunctions or other problems that occurred during or following the sample collection period. (If invalid, the data should be reported with an AQS null value code.) Although all measurements must be reported, only those sample pairs having PM2.5 concentrations above 3 g/m3 will be selected for use in precision calculations, because at low concentrations agreement between the measurements of collocated samplers may be relatively poor.
11.2.6 Federal Reference Method Performance Evaluation Program
Because the size and volatility of the particles making up ambient particulate matter vary over a wide range and the mass concentration of particles varies with particle size, it is difficult to define the accuracy of PM2.5 measurements in an absolute sense. The accuracy of PM2.5 mea-surements is therefore defined in a relative sense, referenced to measurements provided by the FRM. Accuracy is defined as the degree of agreement between a subject field PM2.5 sampler (the primary sampler) and a collocated FRM Performance Evaluation Program (PEP) sampler operating simultaneously at the monitoring site and totally independent of the site operations with respect to operator, sampler, sample handling, and weight determination. Audit results include both random (precision) and systematic (bias) errors. The PM2.5 PEP is described in 40 CFR Part 58, Appendix A, Section 3.2.4.
The EPA Regional Offices are responsible for conducting the FRM PEP to assess total measurement system bias. The PQAO is responsible for assisting FRM PEP personnel by coordinating schedules and assisting in the setup of the FRM sampler, which will be on site for approximately 2 days.
Primary quality assurance organizations with 5 or less PM2.5 monitoring sites are required to have 5 valid audits per year, distributed across the 4 quarters; PQAOs with greater than 5 sites are required to have 8 valid audits per year, distributed across the 4 quarters. The EPA requires:
One hundred (100) percent completeness (meaning whatever it takes to get 5 or 8 valid samples); and
All samplers subject to an audit within 6 years.
Details of the schedule for performing collocated measurements with the FRM sampler and guidelines for determining the initial deployment of FRM PEP samplers based on sites likely to be in violation of the NAAQS are provided in 40 CFR Part 58, Appendix A, Section 3.2.4. The results from the primary sampler and the FRM PEP sampler are used by EPA to calculate the bias of the primary sampler on an annual basis, and the bias of a PQAO on an annual and three-year basis.
2.12.11.0 Performance Evaluation Procedures January 2016 Page 9 of 15
2.12–PM2.5 Reference/Class I Equivalent Methods
11.2.7 Balance Accuracy Assessment
Each monitoring organization should conduct an internal accuracy assessment of each microbalance on an annual basis. A performance audit of the microbalances used to weigh PM2.5 filters requires the use of an independent set of American Society for Testing and Materials (ASTM) Class I standard weights (tolerance 0.010 mg), traceable to NIST. These weights must not be the same ones used as working standards for the day-to-day operation of the microbalance, but may be traceable to the same primary standard used to trace the working standards. Because microbalances are extremely delicate instruments and should not be operated by inexperienced personnel, it is recommended that the PE of the filter-weighing process be done in cooperation with the laboratory personnel. The person normally performing the weighings for PM2.5 monitoring should assist the auditor by preparing the balance as if a series of filter weighings were to be done. Record all data on an audit data sheet and/or in the laboratory’s balance notebook. The balance display should agree with the designated value of the audit weight (i.e., its certified weight/mass) to within twice its uncertainty (or at least ±0.003 mg).
Many laboratories maintain an agreement with a service representative to conduct regular servicing of the balances. It may be instructive to conduct a performance audit prior to the periodic servicing and again immediately after the servicing.
11.2.8 Temperature and Relative Humidity Logger Audit Procedure
The temperature and RH data logger of the environmental control system for the PM2.5 weighing room is an integral part of ensuring 40 CFR Part 50 Appendix L weighing criteria are met and should be audited on a routine frequency. Dataloggers may fail in different ways. A comparison of all numbers, logged and real-time, is essential to ensure that the loggers are both functioning properly. An independent audit standard or logger should be used to compare against the laboratory temperature and RH unit every 90 days; however, more frequently is recommended. The standard used for the audit must be at least as accurate as the weighing room’s logger. The acceptance criteria for the temperature and RH audit is ±2° C for temperature and ±2% for RH.
The audit standard should be placed in the weighing room and allowed to equilibrate for at least 30 minutes prior to conducting the audit. After the audit standard has equilibrated to room conditions, record the audit standard temperature and RH readings and the temperature and RH from the laboratory logging system every five minutes for 30 minutes. Calculate the differences for both temperature and RH for all points. Calculate and compare the means of the audit device and the logger. If the comparison is outside of the acceptance criteria, troubleshoot and repeat the process. If the problem persists, cease weighing, replace the laboratory logger, and investigate the impact on the filter weighing data.
Figure 11.2 is an example form for performing a temperature and relative humidity logger audit.

2.12.11.0 Performance Evaluation Procedures January 2016 Page 10 of 15
2.12–PM2.5 Reference/Class I Equivalent Methods
Figure 11.2 Temperature and humidity verification form
11.3 Systems Audits
Periodic systems audits of PM2.5 programs performed by the monitoring organization’s QA staff are strongly recommended. Such audits are particularly important at the startup of a new monitoring effort and can help recognize and pinpoint problems before significant amounts of data are affected resulting in data invalidation. Loss of data can affect the ability to make NAAQS decisions.
Pursuant to 40 CFR 58, Appendix A, Section 2.5, the EPA Regional Offices are charged with conducting a systems audit once every 3 years. These audits are designed to assess the entire measurement system and data management activities with regard to PM2.5 monitoring networks. These activities may include the following:
Initial equilibration, weighing, and transportation of the filters to the sampler Site selection criteria assessment Equipment installation Site security Equipment maintenance Calibration procedures Handling and placement of the filters Operation of the sampler and sample collection Removal, handling, and transportation of the filter from the sampler to the laboratory
2.12.11.0 Performance Evaluation Procedures January 2016 Page 11 of 15
2.12–PM2.5 Reference/Class I Equivalent Methods
Weighing, storage, and archival of the sampled filter Data analysis and reporting.
EPA specifies that QA and QC programs follow the requirements for QAPPs contained in the EPA document Requirements for Quality Assurance Project Plans for Environmental Data Operations, EPA QA/R-5 (EPA 1994). Auditors should develop a checklist based on these guidelines and on the specific information regarding PM2.5 monitoring in this guidance document. Effective system auditing requires the auditor to observe the auditee’s entire sample acquisition and analysis system and the associated data processing operations. The locations audited include the sampling site, laboratory, the shipping and receiving area where field samples are received and logged in, the sample archival area, and the data processing areas including the laboratory DMS. Data about specific samples obtained during on-site performance audits may be useful during the systems audit. Tracking specific samples and the associated data completely through the system (sample acquisition, shipping, receiving, logging in, weighing, archiving, data processing, and reporting) ensures that every significant operation is examined. This approach also allows the auditor to look at the “interfaces” between different operations—the interactions between field and laboratory tasks—and not just the individual tasks in isolation. Detailed and summary reports and data submitted to the EPA database (AQS) for the audited period should also be reviewed during the audit. Effective preparation for a systems audit requires developing a checklist similar to the example shown in Figure 11.3. Auditors are encouraged to develop their own checklists based on their experience and as dictated by the individual audit situation. Periodic internal systems audits of PM2.5 programs conducted by the monitoring organization are strongly recommended, and should be included in the organization’s QAPP. Such audits are particularly important at the startup of a new monitoring effort and can help recognize and pinpoint problems before significant parts of data are affected. After start up, an annual systems audit of the PM2.5 program, including the gravimetric laboratory, is encouraged. Loss of data could affect the monitoring organization’s designation classification; conducting internal systems audits is a proactive approach to ensure the monitoring organization (PQAO) is continuously meeting regulatory requirements and producing quality data.

2.12.11.0 Performance Evaluation Procedures January 2016 Page 12 of 15
2.12–PM2.5 Reference/Class I Equivalent Methods
Figure 11.3 Audit checklist
Checklist for PM2.5 Auditing
Site or Laboratory Location Site Designation
Auditor Name and Affiliation
Observer(s) Name and Affiliation
Audit Question Y N N/A Comment
On Site: Are logbooks and required data sheets filled in promptly, clearly, and completely? Are filters handled with the necessary care and finesse to avoid contamination and/or loss of material? Does the operator keep the filter-handling area neat and clean? Is the equipment sited properly? Are there any changes at the site that might compromise original siting criteria (e.g., fast-growing trees or shrubs, new construction)? Does the equipment appear to be well maintained and free of dirt and debris, bird/animal/insect nests, excessive rust and corrosion, etc.? Are the walkways to the station and equipment kept free of tall grass, weeds, and debris? Is the station shelter (if any) clean and in good repair?
Sampler Calibration and Maintenance: Does the flow rate standard used for routine flow rate calibration have its own certification traceable to a NIST primary standard for volume of flow rate?
(continued)

2.12.11.0 Performance Evaluation Procedures January 2016 Page 13 of 15
2.12–PM2.5 Reference/Class I Equivalent Methods
Audit Question Y N N/A
Comment
Sampler Calibration and Maintenance (continued):
Is the calibration relationship for the flow rate standard (e.g., an equation, curve, or family of curves relating actual flow rate [Qa] to the flow rate indicator reading) accurate to within 2 percent over the expected range of ambient temperatures and pressures at which the flow rate standard may be used? Verify by inspecting the original calibration data and calculating the error in the calibration relationship for each calibration point used to generate the relationship.
Is the flow rate standard used for routine sampler calibration/verification recalibrated or reverified against a NIST-traceable standard at least annually?
Balance Maintenance and Weighing Procedures:
Is the filter preparation and weighing area neat and clean?
Are logbooks kept up to date and properly filled in?
Is the balance on a service agreement for regular profes-sional maintenance? If not, is there someone in the organ-ization with the appropriate training to service the balance?
Does the analytical balance used to weight filters have a readability of ±1 g?
Is there a formal logbook or file for balance maintenance? Are entries current?
Are regular (e.g., daily, when in use) calibration checks made and recorded?
Are filters conditioned immediately before both the pre- and post-sampling weighings? The following conditions are specified in 40 CFR Part 58, Appendix L:
Mean temperature: 20–23 C.Temperature control: ±2 C over 24 hours. Average humidity: 30 to 40 percent relative humidity (RH); however, where it can be shown that the mean ambient RH during sampling is between 20 and 30 percent, conditioning is permissible at a mean RH within ±5 percent of the mean ambient RH during sampling. Humidity control: ±5 percent RH over 24 hours. Conditioning time: Not less than 24 hours.
Are new filters placed in the conditioning environment immediately upon arrival and stored there until the pre-sampling weighing?
Figure 11.3 Audit checklist (continued)

2.12.11.0 Performance Evaluation Procedures January 2016 Page 14 of 15
2.12–PM2.5 Reference/Class I Equivalent Methods
Audit Question Y N N/A
Comment
Balance Maintenance and Weighing Procedures (continued): Is the analytical balance located in the same controlled environment in which the filters are conditioned?
Are the filters weighed immediately following the conditioning period without intermediate or transient exposure to other conditions or environments?
Are filters conditioned at the same environmental conditions before both the pre- and post-sampling weighings?
Are both the pre- and post-sampling weighings performed on the same analytical balance, using an effective technique to neutralize static charges on the filter?
Are both weighings performed by the same analyst? (If not, have results of the different analysts been compared statistically?)
Are pre-sampling weighings done within 30 days of the sampling periods in which filters are to be exposed? (Review logbook to look for evidence of filters that exceed their time span.)
If filters are stored at ambient temperature, are the post-sampling conditions and weighings completed within 240 hours (10 days) after the end of the sample period?
If filters are stored at 4 C or below during the entire time between retrieval from the sampler and start of conditioning, are the post-sampling conditioning and weighings completed within 30 days after the end of the sample period?
Are new field blank filters weighed along with the pre-sampling (tare) weighing of each lot of PM2.5 filters?
Are QC field blank filters routinely used, observing the following handling steps: transport to the sampling site, installation in the sampler, retrieval from the sampler (without sampling), and reweighing?
Are QC laboratory blank filters weighed along with the pre-sampling (tare) weighing of each set of PM2.5 filters and reweighed when the exposed filters are received from the field? (These laboratory blank filters should remain in the laboratory in protective containers during the field sampling and should be reweighed as a QC check.)
Was the balance calibrated as specified by the manufacturer at installation and recalibrated immediately prior to each weighing session?
Figure 11.3 Audit checklist (continued)

2.12.11.0 Performance Evaluation Procedures January 2016 Page 15 of 15
2.12–PM2.5 Reference/Class I Equivalent Methods
Audit Question Y N N/A
Comment
Recordkeeping and Calculations: Are logs and/or charts of the balance room temperature and humidity on file?
Are records of shipments (incoming and outgoing) maintained?
Are records of sample filter condition upon arrival at laboratory kept (i.e., temperature)?
Are data management files in order?
Is there evidence that data validation, internal QA review, and complete data reporting have occurred?
Is the personnel management structure sound?
Figure 11.3 Audit checklist (continued)

2.12.12.0 Calculations, Validations, and Reporting of PM2.5 Monitoring Data January 2016 Page 1 of 7
2.12–PM2.5 Reference/Class I Equivalent Methods
12.0 Calculations, Validations, and Reporting of PM2.5 Monitoring Data
12.1 Overview This section presents the calculations required to compute and report ambient PM2.5 concentra-tions. A summary of all calculation formulas is given in Table 12-1. The end result of these calculations is the integrated (average) PM2.5 mass concentration during the sampling period, expressed in units of g/m3. To obtain this concentration, it is necessary to determine the mass of particles collected by the filter and the total volume of air that was sampled. The volumes used to calculate the PM2.5 concentration must always be expressed at the actual (local) ambient temperature and pressure used to acquire the sample (40 CFR Part 50.3). Accurate measurement and control of the sampler’s flow rate are needed to determine the total sampled volume and to ensure that the particles trapped by the filter are in the correct particle size range. Reference samplers and Class I equivalent samplers separate PM2.5 particles by inertia. Obtaining the correct particle size range by inertial separation requires maintaining the correct air velocity in the sampler’s PM2.5 separator. This velocity is correct when the specified design flow rate is maintained. 12.2 Calculations 12.2.1 Sample Volume Calculations Both reference and equivalent method samplers are required to provide measurements of the total volume of air sampled (Va), in m3 at the actual ambient temperatures and pressures during sampling (40 CFR Part 50, Appendix L, Section 7.4.5.2). If the sampler’s flow measurement system is properly calibrated, Va should be accurate, and no further sample volume calculations are required.
Table 12-1. Formulas for Calculations Associated with PM2.5 Monitoring
Calculation Formula Equation No. Section Alternative calculation of total sample volume, used only if Va is not available directly from the sampler
Va = Qavg t 10-3 12-1
12.2.1
Determination of PM2.5 mass collected on filter (net weight)
M2.5 = (Mf - Mi) 103 12-2
12.2.2
Determination of PM2.5 mass concentration
PM2.5 = M2.5/Va 12-3
12.2.3

2.12.12.0 Calculations, Validations, and Reporting of PM2.5 Monitoring Data January 2016 Page 2 of 7
2.12–PM2.5 Reference/Class I Equivalent Methods
NOTE: In the event the total sample volume measurement from the sampler is not available, the total sample volume may be calculated by multiplying the average flow rate, in actual m3/min, by the elapsed sample collection time in minutes. Both of these measurements are required to be provided by reference and equivalent method samplers. Use the following formula only if Va is not available directly from the sampler:
Va = Qavg t 10-3 (12-1)where
Va = total sample volume, actual m3 Qavg = average sample flow rate over the sample collection period, L/min
t = total elapsed sample collection time, min 10-3 = units conversion (m3/L).
For example, a sampler with an average flow rate of 16.7 L/min (Qavg) for a 1,410-min (23.5-hour) sampling period (t) would have a total sample volume (Va) of 23.5 m3.
12.2.2 Net PM2.5 Mass Calculation
The mass of particulate matter collected on the filter during the sampling period is determined by subtracting the initial (tare) mass of each filter from the final mass of the filter, as
M2.5 = (Mf – Mi) 103 (12-2)where
M2.5 = total mass of PM2.5 collected during the sampling period, g Mf = final mass of the equilibrated filter after sample collection, mg Mi = initial (tare) mass of the equilibrated filter before sample collection, mg
103 = units conversion ( g/mg).
For example, a filter that weighed 139.293 mg before sampling (Mi) and 139.727 mg after sampling (Mf) would have a PM2.5 mass (M2.5) of 434 g.
12.2.3 PM2.5 Concentration Calculation
Each PM2.5 mass concentration measurement is calculated by dividing the total mass of PM2.5 (Equation 11-2) collected during the sampling period (M2.5) by the total volume of air sampled (Va) (taken directly from the sampler readout display or calculated from Equation 12-1), as
PM2.5 = M2.5 / Va (12-3)
For example, a sample with a mass (M2.5) of 434 g collected from a total sample volume (Va) of 23.5 m3 corresponds to a PM2.5 concentration (PM2.5) of 18.5 g/m3.

2.12.12.0 Calculations, Validations, and Reporting of PM2.5 Monitoring Data January 2016 Page 3 of 7
2.12–PM2.5 Reference/Class I Equivalent Methods
12.3 Verification of Manual Calculations and Data Entry This section applies to calculations performed using manually recorded or transcribed data and when hand calculators, computerized spreadsheets, databases, or other calculation aids are used by field operators or weighing technicians. This section also describes verification procedures for data keyed from handwritten forms into a computer. 12.3.1 Verification of Manual Calculations Calculations should be verified when new sites are set up, when new personnel are trained, and when calculation aids such as spreadsheets are changed or updated. These calculations should be reverified periodically as part of the regular audit program. The basic procedure for verifying manual calculations is as follows:
Gather the raw data sources to be checked. These might include the analyst’s notebook or the field operator’s report sheets on which the data were originally recorded.
Obtain a copy of the resulting data report. The report should represent the data after they
have been entered into the monitoring organization’s electronic data system. This will ensure that all sources of human error, including keying errors, are included in the check.
Independently verify the results based on the raw data. If calculation aids were used, do
not use the same spreadsheet or calculator program that was originally used; the verification calculations should be done as independently as possible.
Verify that the correct formulas, conversion constants, and reporting units were used.
The amount of data to be recalculated and verified depends on several factors. If the original calculations are suspect (for example, where mistakes have been found in a certain individual’s work), all the questioned results should be recalculated. When there is no reason to suspect widespread errors, as with recalculations done as part of a routine audit, only a percentage of the data set need be checked initially. A commonly used audit guideline is to check 7 percent of manual calculations, provided that at least one example of each type of calculation is checked. This is a flexible guideline that depends on the amount of data to be checked and other factors. A cross-section of data should be selected for checking (e.g., the first and last values in a data set, extreme values, atypical values). The monitoring organization’s QAPP should describe the frequency of these verifications, procedures to be followed, acceptance criteria, and corrective actions. 12.3.2 Verification of Manual Data Entry Two methods are typically used for keystroke data entry quality control (QC): duplicate keying and proofing. Duplicate keying is defined as data entry by two different operators, followed by resolution of all discrepancies by referring back to the original forms. Proofing refers to manual (visual) comparison of data entered by a single operator against the original forms. The person

2.12.12.0 Calculations, Validations, and Reporting of PM2.5 Monitoring Data January 2016 Page 4 of 7
2.12–PM2.5 Reference/Class I Equivalent Methods
who proofs the data should not be the person who entered it originally. Duplicate keying is far more likely to eliminate simple keystroke mistakes than proofing. It is also more cost-effective for large data sets but requires somewhat more work to set up initially. If a data set has not been entered by the duplicate keying technique, a certain percentage of residual errors is to be expected. Keystroke data entry error rates can be estimated by comparing the original report pages or logbooks to the data reported out of the data system. The end use of the data should be considered in determining whether the error rate is unacceptably high. For example, if the data will be used for purposes of compliance or litigation, any avoidable errors may be considered unacceptable. In such a case, the data should be rekeyed as described above. If a data set has been entered by an effective duplicate keying procedure, simple keystroke errors are expected to be virtually nonexistent (less than 1 in 1,000,000, even with key operators of modest ability). If a check of duplicate-keyed data turns up a significant error rate, the integrity of the duplicate keying procedure should be investigated by examining the SOP for deficiencies. If no procedural problems are found, noncompliance with the SOP or hardware problems should be investigated. In addition to typographical errors, other potential sources of data entry errors should also be considered while performing an audit of data entry. These include poor handwriting on the original data forms and smears or water damage that renders the writing difficult to read. Hardcopy records must be maintained for a period of time so that audits and verification checks can be performed. The monitoring organization’s QAPP should describe the policies regarding verification of manual data entry, audit frequency, and retention policies for original records needed to verify the electronic data. 12.4 Validation 12.4.1 Data Validation Validation of monitoring data is an extensive topic that can only be touched on in this section. The general principles are presented in Volume I of the Quality Assurance Handbook. Validation data screening is done for two primary reasons:
To verify that the data have been recorded, entered, and calculated correctly—Validation screening can sometimes be used to identify problems such as failing equipment, siting problems, or operator errors.
To screen for potential outliers (data points that are exceptional in concentration value or
in some other way)—Data points identified as potential outliers are not necessarily invalid; validation screening simply identifies data points for further investigation.
Data validation can be done in several different ways. A combination of techniques is often the most effective. The exact criteria to be applied and corrective actions taken should be described in the monitoring organization’s QAPP.

2.12.12.0 Calculations, Validations, and Reporting of PM2.5 Monitoring Data January 2016 Page 5 of 7
2.12–PM2.5 Reference/Class I Equivalent Methods
Some techniques that may be applicable to PM2.5 data validation are the following:
Graphing and visually examining time series of operating parameter data such as flow checks (e.g., control charting)
Graphing and visually examining scatter plots of data (e.g., collocated sample results)
Range checking (does the data fall within an expected range of values?)
Statistical checking (flagging data points outside 3-sigma or other statistically derived limits)
Evaluation of goodness of fit and linearity (applicable to linear regression data such as calibrations)
Regular review of operators’ notes and communication with operators to identify problems
Review of chain-of-custody
Review of audit results to identify data potentially impacted by audit findings
Adherence to the monitoring organization’s QAPP and SOPs.
The appropriate decision maker should take into consideration all QC and QA data when making validity decisions.
With regard to data identified as outliers: Being flagged as a potential outlier by the methods listed above is not prima facie evidence that a data point is invalid. Outliers must be thoroughly investigated before they can be excluded. Outliers must be presumed to be correct unless there is documented evidence of an equipment malfunction or other exceptional condition or event that renders the result unrepresentative. This is particularly important because the 24-hour compliance criterion is based on the upper 98th percentile point of the concentration distribution. Because operational problems can sometimes cause anomalously high readings, potential outliers in the upper tail of the concentration distribution should be validated carefully. Special flags are available in AQS for indicating when data are suspect.
However, all data – not just outliers – should be rigorously reviewed during the data validation process. The monitoring organization should provide a detailed description of its data screening procedures in its QAPP and/or in an approved data validation SOP. Decision rules for data invalidation and for taking corrective actions should be clearly described. Corresponding AQS data flags should be specified in the monitoring organization’s written procedure.

2.12.12.0 Calculations, Validations, and Reporting of PM2.5 Monitoring Data January 2016 Page 6 of 7
2.12–PM2.5 Reference/Class I Equivalent Methods
12.4.2 Validation of Software Used to Process PM2.5 Data
Software used to process, manage, and report PM2.5 data used for compliance purposes should be validated to ensure that it is free of incorrectly coded calculations and errors. The process of validating software is distinct from data validation discussed in the previous section.
A structured approach to software development, testing, and validation is strongly recommended for managing PM2.5 compliance data. Information on structured software development, testing and validation can be found in EPA QA/R-5, EPA Requirements for Quality Assurance Project Plans for Environmental Data Operations, Appendix G, and in many other publications.
A few of the areas that should be tested during the development of PM2.5 compliance and reporting software include the following:
Correctness of calculations;
Correct assignment of input and output values (i.e., verify that the input and output values are correctly identified as to station, sample time period, sampler number, filter number, and so on);
Correct calculation of statistics, including determination of the correct 98th percentile point for the 24-hour compliance criterion (40 CFR Part 50, Appendix N); and,
Correct application of validation procedures, range checks, statistical control limits, and so on.
Use of spreadsheets for processing and managing large environmental data sets is strongly discouraged. Spreadsheets are difficult to test thoroughly and can develop new problems as more data are added and predefined data ranges overflow. Modern relational database products offer a much more reliable environment for large-scale data processing, although they are somewhat more difficult to learn at first.
Although software does not usually “break” or wear out after it has been written and tested, any change in its runtime environment may potentially cause problems. Therefore, periodic reverification of software is advisable, especially after significant changes to system hardware or software. Whenever individual software modules are changed, run test procedures to detect any unintended consequences of the changes. Software documentation that describes configuration changes and test results should be maintained.
All monitoring agencies are strongly encouraged to develop and comply with SOPs for software development, testing, maintenance, configuration control, documentation, and data archiving. The QAPP should identify the relevant data processing SOPs, and these should be addressed during periodic audits.

2.12.12.0 Calculations, Validations, and Reporting of PM2.5 Monitoring Data January 2016 Page 7 of 7
2.12–PM2.5 Reference/Class I Equivalent Methods
12.5 Data Reporting
The primary standards for particulate matter in ambient air are based on the measured mass concentration of PM2.5. Information on reporting and interpretation of PM2.5 data with respect to the attainment of these standards is covered in 40 CFR Part 50, Appendix N.
12.5.1 Rounding
Raw data from the samplers are preferably recorded electronically and/or communicated by electronic means to a central computer where they are recorded. Electronically stored data and computerized calculations should not be rounded until final formatting for reports or for delivery to AQS.
Filter weight data for calculating PM2.5 concentrations should be recorded to the full readable precision of the microbalance. Hand-calculated weight differences should be carried to the same number of digits and should not be rounded.
For other hand-recorded data, including calibration and audit data, it is advisable to read and record somewhat more resolution than will be needed for calculating the final result. For example, to make a measurement that will be reported to the nearest 1 percent, attempt to read the data to at least the nearest 0.5 percent or better. It is usually not necessary to record a resolution more than a factor of 10 better than that needed in the final result, however.
Special care should be taken when recording data that will be used in a difference calculation: enough significant figures must be recorded so that the result will have the necessary resolution. The most obvious example is the determination of PM2.5 mass by the difference of two filter weights. Measurement of the filter weight to six significant figures is necessary in order to get adequate precision in the net particulate mass. All data recording forms should specify the appropriate number of digits, or the necessary resolution in physical units, for each parameter that must be manually recorded.
12.5.2 Rounding Rules for Comparison with the National Ambient Air Quality Standards
For comparing calculated concentration averages to National Ambient Air Quality Standards (NAAQS) levels, it is necessary to use round-off rules defined in Sections 4.3 of 40 CFR Part 50, Appendix N. For the annual PM2.5 standard (currently 12 g/m3), the 3-year average annual means is rounded to the nearest tenth of a g /m3. Decimals x.x5 and greater are rounded up to the next 0.1, and any decimal lower than x.x5 is rounded down to the nearest tenth of a g/m3. For the 24-hour PM2.5 standard (currently 35 g/m3), the 3-year average of the annual 98th percentile values is rounded to the nearest 1 / g/m3. Decimals 0.5 and greater are rounded up to the nearest whole number, and any decimal lower than 0.5 is rounded down to the nearest whole number.
2.12.13.0 Data and Records Management January 2016 Page 1 of 6
2.12–PM2.5 Reference/Class I Equivalent Methods
13.0 Data and Records Management
13.1 Overview
It is important to keep good records in any air pollution measurement program. This is particularly true for measurements of PM2.5 by reference or Class I equivalent methods because these are manual methods that involve the transfer and handling of samples and data by several people. Automated methods, on the other hand, present the final, averaged data with much less human intervention and, thus, limit the possibilities of transcription errors and misplacement of data.
Section 14 of the U.S. EPA’s Quality Assurance Handbook for Air Pollution Measurement Systems, Volume II provides guidance on data acquisition and information management. Although it emphasizes automated data acquisition, much of the discussion is also applicable to manual methods. There are several reasons for maintaining complete, orderly records and properly managing data. Records can:
Provide information on mechanical problems that occur and document how the problems were corrected;
Provide a history of warranty repairs;
Provide a history of in-house repairs and preventive maintenance servicing;
Document date and site placement details for the primary and collocated samplers, as well as the characteristics of the surrounding land areas, sources, and other features;
Be a useful source of information at the time of the annual network review and/or a technical systems audit to show proper sampler installation and operation, performance of quality control (QC) and quality assurance (QA) checks, traceability of equipment and standards, and proof that all systems were kept in control (use of control charts); and
Provide defensible evidence to support the quality of PM2.5 data submitted to the national database (AQS).
13.2 Methodology for Data and Records Management
A systematic approach to maintaining records and managing data for all reported ambient air pollutant concentrations usually involves the following considerations:
Personnel—One or more persons should be identified within the monitoring organization to be responsible for maintaining the records and preparing and submitting the required data products. Education, training, and experience are requirements for the position. Standard Operating Procedures (SOPs) will also be required.
Quality assurance—An individual or group should be assigned to prepare SOPs, to
2.12.13.0 Data and Records Management January 2016 Page 2 of 6
2.12–PM2.5 Reference/Class I Equivalent Methods
conduct internal systems and performance audits, and to review & validate the data before submission.
Facilities and equipment—A designated storage location for paper records and
computer data files should be established (i.e., Local Area Network, etc). Using file cabinets that can be locked is suggested. A backup copy of data files should be kept in another location for safety. Computers and data entry stations, as well as connections to centralized databases (such as AQS), are also required.
13.3 PM2.5 Records to Create and Retain A quality assurance project plan (QAPP) for the various aspects of the PM2.5 sampling program must be prepared. SOPs are developed as part of the QAPP. Much of the required information can be drawn from that given in the applicable sections of the Code of Federal Regulations (CFR), the sampler’s instruction manual, and this document. Records to maintain are summarized below. 13.3.1 Sampler Siting and Maintenance Records Documentation regarding siting and maintenance of the PM2.5 samplers should be retained in the files. These documents may include the following:
Site selection criteria checklist; photographs of the site in the eight cardinal directions, with the PM2.5 sampler in the center foreground; site sketch; U.S. Geological Survey (USGS) topographical map of the area; and a copy of the site documentation records that were submitted to the AQS database when the site was first established and any updates made since that time.
Siting documentation in annual network plans (ANP), which are posted on AMTIC.
Procurement log for field equipment (see Figure 4.1). Notes on acceptance/rejection tests (see Table 4-1).
Warranty and maintenance records for each PM2.5 sampler. A dated maintenance
checklist should be established for each sampler; separate maintenance logbooks should be used for the PM2.5 samplers.
Manufacturer-supplied calibration and traceability records for the thermometers, flow
rate measuring devices, and pressure sensors used for calibrating, checking, or auditing PM2.5 samplers.
Chain-of-custody records.

2.12.13.0 Data and Records Management January 2016 Page 3 of 6
2.12–PM2.5 Reference/Class I Equivalent Methods
13.3.2 Analytical Laboratory Installation Records Records to keep about the physical setup of the gravimetric laboratory include the following:
Equipment inventory and warranty information (microbalances, anti-static devices, calibration and check weights, and so on);
Procurement log (see Figure 4.1), and notes on acceptance/rejection tests (see Table 4-1);
Records (e.g., control charts) that demonstrate that the temperature and relative humidity
(RH) within the weighing laboratory were held within specified limits;
Minute data logs or spreadsheets containing the raw temperature and relative humidity data from sensors;
Microbalance logbook; and,
Certification records (NIST-traceability) for all standards in use in the lab.
13.3.3 Field Sampling Operation Records PM2.5 sampling operations generate a number of paper and/or computerized records that need to be reviewed, reported, and filed. Starting with the calibration of the sampler’s sensors, these records will include at least the following items:
Sampler calibration logbooks or data sheets (see Figure 7.3 for an example) for entering results of temperature, pressure, and flow rate checks, audits, and calibrations. Also include documentation of the devices used to calibrate the sampler(s) and these devices’ traceability records or references to the traceability records. A separate section of the logbook should be used for each sampler in the network. Enter results of the sampling procedure checks (see Table 7-1), which include notes on filter inspection, and checks of flow rate and leaks.
PM2.5 sampler field data sheet (see Figure 7.1 for an example). The run data sheet should
be prepared at least in duplicate by using carbonless paper or making copies. The original of the data sheet should accompany the filter sample to the laboratory, and a copy should be retained in the field site records files.
Files downloaded from the data port of each PM2.5 sampler.
13.3.4 Weighing Laboratory Operation Records Data records from activities in the weighing laboratory are expected to include at least the following items:

2.12.13.0 Data and Records Management January 2016 Page 4 of 6
2.12–PM2.5 Reference/Class I Equivalent Methods
Records of temperature and humidity control in the filter conditioning environment. Use of control charts is recommended.
Laboratory data forms (see Figure 10.5 for an example).
Laboratory database files (if utilized).
Results of microbalance calibrations and servicing. This information can be recorded in the microbalance logbook.
Results of filter integrity checks and determinations of the conditioning periods (i.e., lot stability testing) required for various filter batches (refer to Sections 10.5, 10.6 and 10.7).
The completed PM2.5 sampler run data sheet and/or COC (see Figures 7.1 and 7.2 for examples).
Records of sample numbers (identifications) and locations of archived PM2.5 samples.
13.3.5 Quality Assurance Records
Quality assurance systems and performance audits require complete documentation as well. Records of audits may be similar to the following items:
Flow rate, temperature, and pressure audit data sheet (see Figure 11.1 for an example)
Systems audit questionnaire (see Figure 11.3 for an example), and subsequent written report (if applicable)
Data review/validation records.
13.4 Data Reporting Requirements
The EPA Regional Office and the AQS database require the following information be reported on a quarterly (generally, calendar-quarter) basis (EPA will calculate measurement uncertainties for the entire calendar year):
Siting documentation (upon installation and any changes thereafter)
PM2.5 concentration data ( g/m3, entered electronically into the AQS database)
Information calculated and provided by the sampler (refer to Table 13-1 [Adapted from 40 CFR Part 50, Appendix L, Table L-1]). This information is retrieved from the data port of each sampler. It is generally downloaded in the field to a laptop computer or another data storage device and later processed in the laboratory or office. Data outputs to be provided to the AQS database are indicated in Table 13-1 by the bullet symbol.

2.12.13.0 Data and Records Management January 2016 Page 5 of 6
2.12–PM2.5 Reference/Class I Equivalent Methods
Results of all valid flowrate verifications and audits, collocated precision data, and PEP audits performed during the quarter. Refer to Section 11.0 for details.
Table 13-1. Summary of Information to be Provided by Sampler

2.12.13.0 Data and Records Management January 2016 Page 6 of 6
2.12–PM2.5 Reference/Class I Equivalent Methods

2.12.14.0 Assessment of Measurement Uncertainty January 2016 Page 1 of 6 for Monitoring Data
2.12–PM2.5 Reference/Class I Equivalent Methods
14.0 Assessment of Measurement Uncertainty for Monitoring Data 14.1 Overview PQAOs operating SLAMS are required to assess the measurement uncertainty of their PM2.5 monitoring data (EPA 1997). Three different procedures are used in this assessment:
Flow rate audit—The accuracy of the PM2.5 sampler’s flow rate is assessed by performing a flow rate audit as described in Section 11.2.1. Performance of this audit is the responsibility of the SLT and/or the PQAO. The goal for accuracy of the sampler flow rate is to be within ±2 percent of the value indicated by the audit device during calibration, +4 percent during one-point verification checks and audits, and within ±5 percent of the sampler’s design flow rate (16.67 L/min).
Bias—PM2.5 measurement bias is assessed by conducting a collocated sampler audit
(PEP audit). The U.S. EPA Regional Offices will conduct this performance evaluation. The bias goal is to be between -10 percent and +10 percent (i.e., to have the site sampler’s PM2.5 concentration value agree within ±10 percent of the audit value).
Precision—PM2.5 measurement precision is assessed by collocating (i.e., locating a
second QC sampler alongside the primary sampler used for measurement) samplers and reporting the results of both the measurement sampler and the collocated sampler. Operation of the collocated samplers is the responsibility of the SLT and/or the PQAO. The precision goal is to have a coefficient of variation (CV) of less than 10 percent.
These procedures are very similar to those used in the data quality assessment (DQA) of PM10 monitoring data. The results of these procedures are used to screen individual samplers for bias or excessive imprecision. EPA also uses these results to assess measurement uncertainty for each PQAO. The results from all SLAMS PQAOs are used by EPA to assess the measurement uncertainty of data from each PM2.5 reference or equivalent method on a national basis. 14.2 Flow Rate Audits Flow rate audits consist of measuring the sampler’s normal operating flow rate with a flow rate transfer standard. This procedure is described in Section 11.2.1. Manual PM2.5 sampler methods must be audited every 6 months (i.e., every 182 days). Audits should be scheduled to avoid interference with regularly scheduled sampling periods. Whenever possible, these flow audits should be performed at randomly selected times with respect to time of day and day of week.
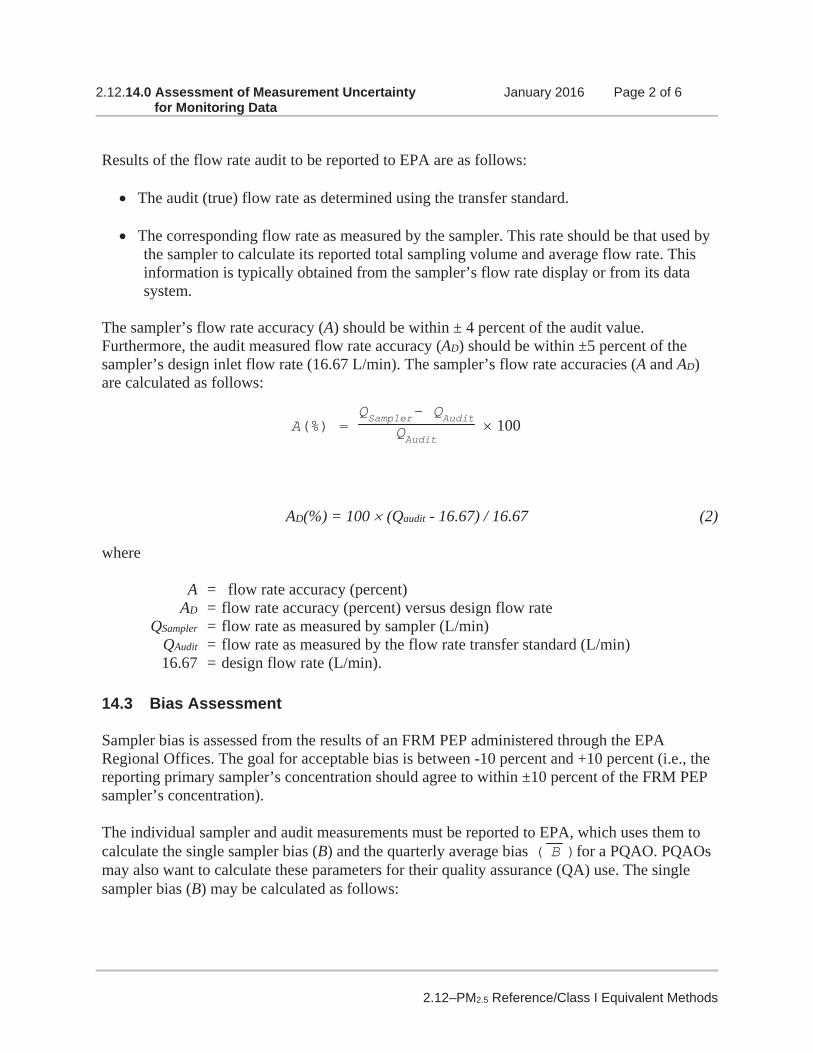
2.12.14.0 Assessment of Measurement Uncertainty January 2016 Page 2 of 6 for Monitoring Data
2.12–PM2.5 Reference/Class I Equivalent Methods
Results of the flow rate audit to be reported to EPA are as follows:
The audit (true) flow rate as determined using the transfer standard.
The corresponding flow rate as measured by the sampler. This rate should be that used by the sampler to calculate its reported total sampling volume and average flow rate. This information is typically obtained from the sampler’s flow rate display or from its data system.
The sampler’s flow rate accuracy (A) should be within ± 4 percent of the audit value. Furthermore, the audit measured flow rate accuracy (AD) should be within ±5 percent of the sampler’s design inlet flow rate (16.67 L/min). The sampler’s flow rate accuracies (A and AD) are calculated as follows:
AD(%) = 100 (Qaudit - 16.67) / 16.67 (2)
where
A = flow rate accuracy (percent) AD = flow rate accuracy (percent) versus design flow rate
QSampler = flow rate as measured by sampler (L/min) QAudit = flow rate as measured by the flow rate transfer standard (L/min) 16.67 = design flow rate (L/min).
14.3 Bias Assessment
Sampler bias is assessed from the results of an FRM PEP administered through the EPA Regional Offices. The goal for acceptable bias is between -10 percent and +10 percent (i.e., the reporting primary sampler’s concentration should agree to within ±10 percent of the FRM PEP sampler’s concentration).
The individual sampler and audit measurements must be reported to EPA, which uses them to calculate the single sampler bias (B) and the quarterly average bias ( B )for a PQAO. PQAOs may also want to calculate these parameters for their quality assurance (QA) use. The single sampler bias (B) may be calculated as follows:
A(%) = QSampler- QAudit
QAudit 100
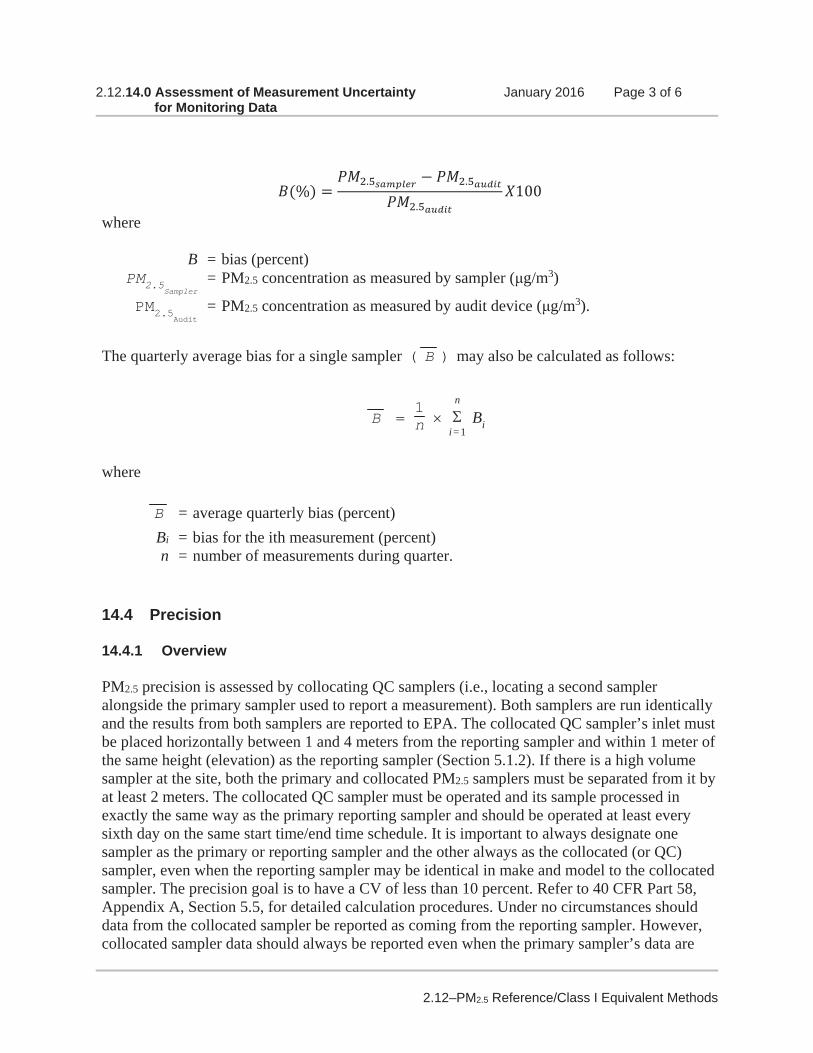
2.12.14.0 Assessment of Measurement Uncertainty January 2016 Page 3 of 6 for Monitoring Data
2.12–PM2.5 Reference/Class I Equivalent Methods
where B = bias (percent) PM2.5
Sampler = PM2.5 concentration as measured by sampler ( g/m3)
PM2.5Audit = PM2.5 concentration as measured by audit device ( g/m3).
The quarterly average bias for a single sampler ( B ) may also be calculated as follows:
where B = average quarterly bias (percent) Bi = bias for the ith measurement (percent) n = number of measurements during quarter.
14.4 Precision 14.4.1 Overview PM2.5 precision is assessed by collocating QC samplers (i.e., locating a second sampler alongside the primary sampler used to report a measurement). Both samplers are run identically and the results from both samplers are reported to EPA. The collocated QC sampler’s inlet must be placed horizontally between 1 and 4 meters from the reporting sampler and within 1 meter of the same height (elevation) as the reporting sampler (Section 5.1.2). If there is a high volume sampler at the site, both the primary and collocated PM2.5 samplers must be separated from it by at least 2 meters. The collocated QC sampler must be operated and its sample processed in exactly the same way as the primary reporting sampler and should be operated at least every sixth day on the same start time/end time schedule. It is important to always designate one sampler as the primary or reporting sampler and the other always as the collocated (or QC) sampler, even when the reporting sampler may be identical in make and model to the collocated sampler. The precision goal is to have a CV of less than 10 percent. Refer to 40 CFR Part 58, Appendix A, Section 5.5, for detailed calculation procedures. Under no circumstances should data from the collocated sampler be reported as coming from the reporting sampler. However, collocated sampler data should always be reported even when the primary sampler’s data are
B = 1n n
i = 1 Bi

2.12.14.0 Assessment of Measurement Uncertainty January 2016 Page 4 of 6 for Monitoring Data
2.12–PM2.5 Reference/Class I Equivalent Methods
nonexistent or invalid. Concentration data must be reported for both the primary and collocated sampler, no matter how low the concentration. Because agreement between the measurements of collocated samplers may be relatively poor at low concentrations, collocated measurement pairs are used by EPA to calculate precision only when both PM2.5 measurement concentrations are above 3 g/m3. 14.4.2 Number of Collocated Samplers Required To assess precision of their sampling data, SLAMS PQAOs must meet the following collocation requirements: For each distinct monitoring method designation (FRM or FEM) that a PQAO is using for a primary monitor, the PQAO must:
Have 15 percent of the primary monitors collocated (values of 0.5 and greater round up); and,
Have at least 1 collocated quality control monitor (if the total number of monitors is less than 3). The first collocated monitor must be a designated FRM monitor.
Table 14-1 demonstrates this requirement. In addition to these requirements, additional specifications must also be observed with respect to the different makes and models of samplers used as collocated samplers:
A primary monitor designated as an EPA FRM shall be collocated with a quality control monitor having the same EPA FRM method designation.
For each primary monitor designated as an EPA FEM used by the PQAO, 50 percent of the monitors designated for collocation, or the first if only one collocation is necessary, shall be collocated with a FRM quality control monitor and 50 percent of the monitors shall be collocated with a monitor having the same method designation as the FEM primary monitor. If an odd number of collocated monitors is required, the additional monitor shall be a FRM quality control monitor. An example of the distribution of collocated monitors for each unique FEM is provided in Table 14-1, which can also be found in 40 CFR Part 58, Appendix A, Section 3.2.3.4. Table 14-2 demonstrates the procedure with a PQAO having an FRM and multiple FEMs, which can also be found in 40 CFR Part 58, Appendix A, as Table A-2.

2.12.14.0 Assessment of Measurement Uncertainty January 2016 Page 5 of 6 for Monitoring Data
2.12–PM2.5 Reference/Class I Equivalent Methods
Table 14-1 Distribution of Collocated Monitors for Each Unique FEM #Primary FEMS of a unique
method designation
#Collocated #Collocated with an
FRM
#Collocated with same
method designation
"1-9" 1 1 0
"10-16" 2 1 1
"17-23" 3 2 1
"24-29" 4 2 2
"30-36" 5 3 2
"37-43" 6 3 3
As an example (Table 14-2), consider the minimum collocation requirements for an organization that has 54 primary samplers composed of 20 FRM samplers, 20 equivalent designation A samplers, 2 equivalent designation B samplers, and 12 equivalent designation C samplers. Each type of sampler should be considered separately as shown in Table 14-2 for FEM sampler types A, B, and C.
Table 14-2 Summary of PM2.5 Number and Type of Collocation (15% Collocation Requirement) Required Using an example of a PQAO that has 54 Primary Monitors (54 sites) with 1 Federal Reference Method Type and Three types of Approved Federal Equivalent Methods. Primary sampler method designation
Total no. of monitors
Total no. of collocated
No. of collocated with FRM
No. of collocated with same method designation as primary
FRM 20 3 3 3 FEM (A) 20 3 2 1 FEM (B) 2 1 1 0 FEM (C) 12 2 1 1
14.4.3 Location of Collocated Samplers
Collocated samplers should be placed at sites that have the highest PM2.5 concentrations, with special emphasis on sites likely to be in violation of the NAAQS. Data from other particulate measurement methods, such as PM10 samplers, can be helpful in selecting sites for collocation.
SLAMS PQAOs that have areas in violation of the NAAQS should place their collocated samplers as follows:
50 percent of the collocated quality control monitors should be deployed at sites with annual average or daily concentrations estimated to be within ±20 percent of either the annual or 24-hour NAAQS, and the remainder at the PQAO’s discretion.

2.12.14.0 Assessment of Measurement Uncertainty January 2016 Page 6 of 6 for Monitoring Data
2.12–PM2.5 Reference/Class I Equivalent Methods
If an organization has no sites with annual average or daily concentrations within ±20 percent of the annual NAAQS or 24-hour NAAQS, 50 percent of the collocated quality control monitors should be deployed at those sites with the annual mean concentrations or 24-hour concentrations among the highest for all sites in the network and the remainder at the PQAO’s discretion.
14.4.4 Schedule for Operation of Collocated Samplers Collocated samples should be taken to reflect the normal operation of the reporting sampler. The collocated samples should be evenly distributed across the various seasons and days of the week. A simple system to accomplish this is to run the collocated sampler every sixth day. Thus, if the first week’s collocated sample was run on Monday, the second week’s collocated sample would be run on Sunday, the third week’s on Saturday, and so on. Remember to start and stop both the collocated and reporting samplers at exactly the same time for each sample run.

2.10.15.0 References January 2016 Page 1 of 3
2.12–PM2.5 Reference/Class I Equivalent Methods
15.0 References ASTM. 1977. Standard test methods for measuring surface atmospheric pressure. American Society for Testing and Materials. Philadelphia, PA. Standard D 3631-84. ASTM. 1992. Standard test method for inspection and verification of thermometers. American Society for Testing and Materials. Philadelphia, PA. ASTM Standard E77-92. ASTM. 1993a. Standard practice for maintaining constant relative humidity by means of aqueous solutions. American Society for Testing and Materials. 1993 Annual Book of ASTM Standards, Vol 11.03, Designation E 104-85 (reapproved 1991), pp. 570–572. ASTM. 1993b. Standard specification for laboratory weights and precision mass standards. American Society for Testing and Materials. 1993 Annual Book of ASTM Standards, Vol 14.02, Designation E 617-91, pp. 280–295. ASTM. 1995a. Standard specification for ASTM thermometers. American Society for Testing and Materials. Philadelphia, PA. ASTM Standard E1-95. ASTM. 1995b. Standard test methods for measuring surface atmospheric pressure. American Society for Testing and Materials. Publication number ASTM D3631-95. ASTM. 1995c. Standard practice for evaluation of air assay media by the monodisperse DOP (Dioctylphthalate) smoke test. American Society for Testing and Materials. Philadelphia, PA. ASTM Standard D2986-95a. Desert Research Institute. 1994. DRI Standard Operating Procedure. Gravimetric Analysis, DRI SOP No. 2-102.3, Reno, NV. 24 pp. Eisner AD. 1997. Personal communication. ManTech Environmental Technology, Inc., Research Triangle Park, NC. Engelbrecht DR, Cahill TA, Feeney PJ. 1980. Electrostatic effects on gravimetric analysis of membrane filters. Journal of the Air Pollution Control Association 30(4):319–392. EPA 1997b. Guidance for network design and optimum site exposure for PM2.5 and PM10. U.S. Environmental Protection Agency, Office of Air Quality Planning and Standards. Finalized version, December 1997. EPA 2013. Quality Assurance Handbook for Air Pollution Measurement Systems. Volume II, Part I. Ambient Air Specific Methods. Appendix 12, “Calibration of Primary and Secondary Standards for Flow Measurements.” EPA. 1994. EPA requirements for quality assurance project plans for environmental data operations. U.S. Environmental Protection Agency. Document EPA QA/R-5. External Review draft final, October 1998.

2.10.15.0 References January 2016 Page 2 of 3
2.12–PM2.5 Reference/Class I Equivalent Methods
EPA. 1995. Guidance for the preparation of standard operating procedures (SOPs). U.S. Environmental Protection Agency. Publication QA/G-6, U.S. EPA Quality Assurance Division, Washington, DC. November.
EPA. 1997. Ambient air quality surveillance. U.S. Environmental Protection Agency. 40 CFR Part 58, Appendix A—Quality assurance requirements for State and local air monitoring stations (SLAMS); Appendix E—Probe and monitoring path siting criteria for ambient air quality monitoring, as revised July 18, 1997.
EPA. 1997. Reference method for the determination of fine particulate matter as PM2.5 in the atmosphere. U.S. Environmental Protection Agency. 40 CFR Part 58, Appendix L, as amended July 18, 1997.
EPA. 1997. Reference method for the determination of fine particulate matter as PM2.5 in the atmosphere. U.S. Environmental Protection Agency. 40 CFR Part 50, Appendix L.
EPA. 1997a. Network design for State and local air monitoring stations (SLAMS), national air monitoring stations (NAMS), and photochemical assessment monitoring stations (PAMS). U.S. Environmental Protection Agency. 40 CFR Part 58, Appendix D, as amended July 18, 1997.
EPA. 1997a. Reference method for the determination of fine particulate matter as PM2.5 in the atmosphere. U.S. Environmental Protection Agency. 40 CFR Part 50, Appendix L.
EPA. 1997b. Ambient air monitoring reference and equivalent methods. U.S. Environmental Protection Agency. 40 CFR Part 53, as amended July 18, 1997.
EPA. 1997c. Ambient air quality monitoring methodology. U.S. Environmental Protection Agency. 40 CFR Part 58, Appendix C, as amended July 18, 1997.
EPA. 1997c. Reference method for the determination of fine particulate matter as PM2.5 in the atmosphere. U.S. Environmental Protection Agency. 40 CFR Part 50, Appendix L.
EPA. 1997d. Ambient air monitoring reference and equivalent methods. U.S. Environmental Protection Agency. 40 CFR Part 53, as amended July 18, 1997.
EPA. 2008. Quality Assurance Handbook for Air Pollution Measurement Systems Volume IV: Meteorological Measurements Version 2. U.S. Environmental Protection Agency. Document No. EPA-454/B-08-002. Revised March.
Harris G. 1993. Ensuring accuracy and traceability of weighing instruments. ASTM Standardization News 21(4):44–51.
Harris GL. 1994. State weights and measures laboratories: state standards program description. National Institute of Standards and Technology. Special publication 791. 130 pp.
Hawley RE, Williams CJ. 1974. Electrostatic effects in microbalances. I. General considerations

2.10.15.0 References January 2016 Page 3 of 3
2.12–PM2.5 Reference/Class I Equivalent Methods
of the effectiveness of a radioactive ionizing source under ambient conditions. Journal of Vacuum Science and Technology 11(1):419–422.
Kupper WE. 1990. High accuracy mass measurements, from micrograms to tons. Instrument Society of America Transactions 29(4):11–20.
Lipfert FW. 1994. Filter artifacts associated with particulate measurements: recent evidence and effects on statistical relationships. Atmos Environ 28:391-392.
Nelson, G.O. 1992. Gas Mixtures: Preparation and Control. Lewis Publishers, Boca Raton, FL, 304 pp.
NIST. 1976. Liquid-in-glass thermometry. National Institute of Standards and Technology. NBS Monograph 150. January.
NIST. 1986. Thermometer calibration: A model for State calibration laboratories. National Institute of Standards and Technology. NBS monograph 174. January.
NIST. 1988. Liquid-in-glass thermometer calibration service. National Institute of Standards and Technology. Special publication 250-23. September.
NIST. 1989. The calibration of thermocouples and thermocouple materials. National Institute of Standards and Technology. Special publication 250-35. April.
Papp ML, Elkins JB, Musick DR, Messner MJ. 1998. Data Quality Objectives for the PM2.5 Monitoring Data. U.S. Environmental Protection Agency, Research Triangle Park, NC. In preparation.
Weil J. 1991. Static control for balances. Cahn Technical Note. Published by Cahn Instruments, Inc., Madison, WI.
White VR. 1997. National Voluntary Laboratory Accreditation Program: 1997 Directory. National Institute of Standards and Technology. Special publication 810. 225 pp.
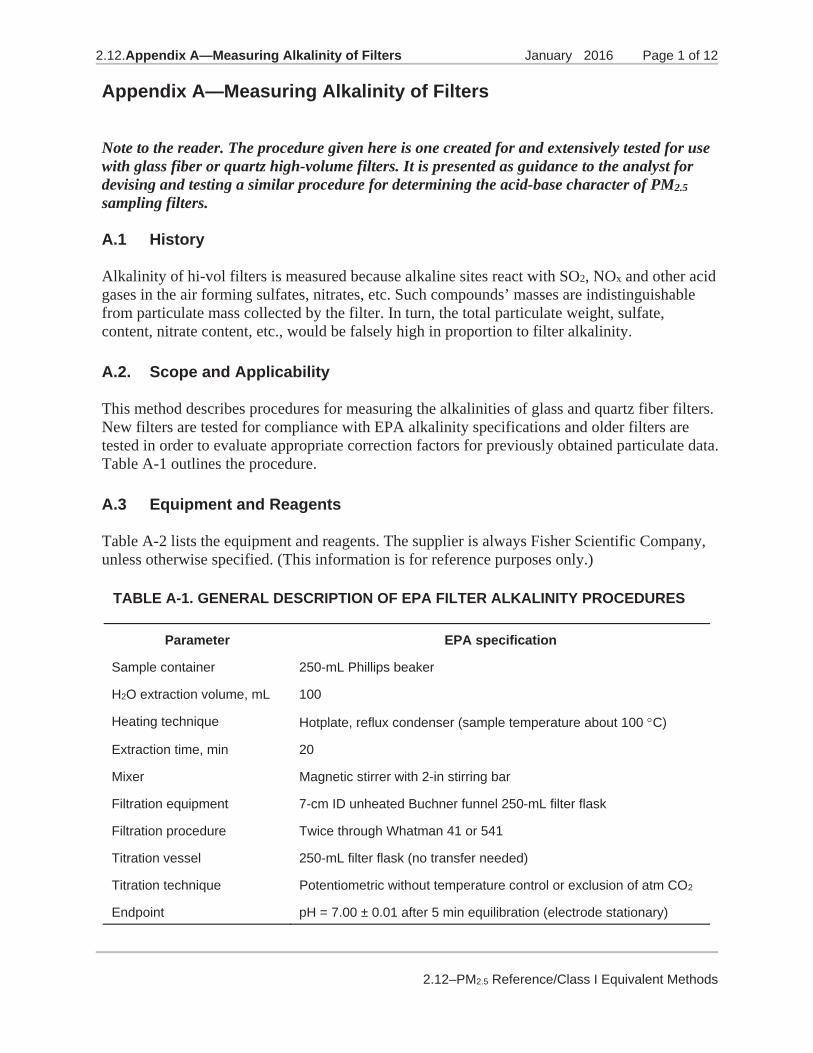
2.12.Appendix A—Measuring Alkalinity of Filters January 2016 Page 1 of 12
2.12–PM2.5 Reference/Class I Equivalent Methods
Appendix A—Measuring Alkalinity of Filters
Note to the reader. The procedure given here is one created for and extensively tested for use with glass fiber or quartz high-volume filters. It is presented as guidance to the analyst for devising and testing a similar procedure for determining the acid-base character of PM2.5sampling filters.
A.1 History
Alkalinity of hi-vol filters is measured because alkaline sites react with SO2, NOx and other acid gases in the air forming sulfates, nitrates, etc. Such compounds’ masses are indistinguishable from particulate mass collected by the filter. In turn, the total particulate weight, sulfate, content, nitrate content, etc., would be falsely high in proportion to filter alkalinity.
A.2. Scope and Applicability
This method describes procedures for measuring the alkalinities of glass and quartz fiber filters. New filters are tested for compliance with EPA alkalinity specifications and older filters are tested in order to evaluate appropriate correction factors for previously obtained particulate data. Table A-1 outlines the procedure.
A.3 Equipment and Reagents
Table A-2 lists the equipment and reagents. The supplier is always Fisher Scientific Company, unless otherwise specified. (This information is for reference purposes only.)
TABLE A-1. GENERAL DESCRIPTION OF EPA FILTER ALKALINITY PROCEDURES
Parameter EPA specification
Sample container 250-mL Phillips beaker
H2O extraction volume, mL 100
Heating technique Hotplate, reflux condenser (sample temperature about 100 C)
Extraction time, min 20
Mixer Magnetic stirrer with 2-in stirring bar
Filtration equipment 7-cm ID unheated Buchner funnel 250-mL filter flask
Filtration procedure Twice through Whatman 41 or 541
Titration vessel 250-mL filter flask (no transfer needed)
Titration technique Potentiometric without temperature control or exclusion of atm CO2
Endpoint pH = 7.00 ± 0.01 after 5 min equilibration (electrode stationary)
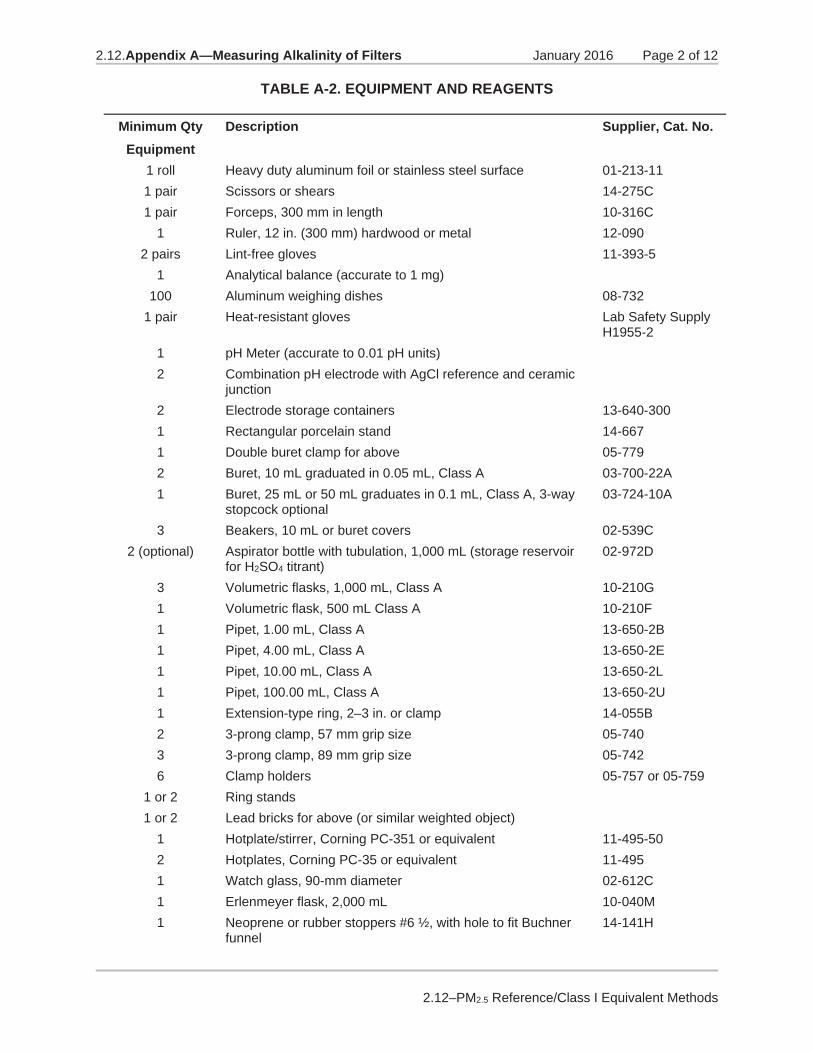
2.12.Appendix A—Measuring Alkalinity of Filters January 2016 Page 2 of 12
2.12–PM2.5 Reference/Class I Equivalent Methods
TABLE A-2. EQUIPMENT AND REAGENTS
Minimum Qty Description Supplier, Cat. No. Equipment
1 roll Heavy duty aluminum foil or stainless steel surface
01-213-11
1 pair Scissors or shears
14-275C
1 pair Forceps, 300 mm in length
10-316C
1 Ruler, 12 in. (300 mm) hardwood or metal
12-090
2 pairs Lint-free gloves
11-393-5
1 Analytical balance (accurate to 1 mg)
100 Aluminum weighing dishes
08-732
1 pair Heat-resistant gloves
Lab Safety Supply H1955-2
1 pH Meter (accurate to 0.01 pH units)
2 Combination pH electrode with AgCl reference and ceramic junction
2
Electrode storage containers
13-640-300
1 Rectangular porcelain stand
14-667
1 Double buret clamp for above
05-779
2 Buret, 10 mL graduated in 0.05 mL, Class A
03-700-22A
1 Buret, 25 mL or 50 mL graduates in 0.1 mL, Class A, 3-way stopcock optional
03-724-10A
3
Beakers, 10 mL or buret covers
02-539C
2 (optional) Aspirator bottle with tubulation, 1,000 mL (storage reservoir for H2SO4 titrant)
02-972D
3
Volumetric flasks, 1,000 mL, Class A
10-210G
1 Volumetric flask, 500 mL Class A
10-210F
1 Pipet, 1.00 mL, Class A
13-650-2B
1 Pipet, 4.00 mL, Class A
13-650-2E
1 Pipet, 10.00 mL, Class A
13-650-2L
1 Pipet, 100.00 mL, Class A
13-650-2U
1 Extension-type ring, 2–3 in. or clamp
14-055B
2 3-prong clamp, 57 mm grip size
05-740
3 3-prong clamp, 89 mm grip size
05-742
6 Clamp holders
05-757 or 05-759
1 or 2 Ring stands
1 or 2 Lead bricks for above (or similar weighted object)
1 Hotplate/stirrer, Corning PC-351 or equivalent
11-495-50
2 Hotplates, Corning PC-35 or equivalent
11-495
1 Watch glass, 90-mm diameter
02-612C
1 Erlenmeyer flask, 2,000 mL
10-040M
1 Neoprene or rubber stoppers #6 ½, with hole to fit Buchner funnel
14-141H
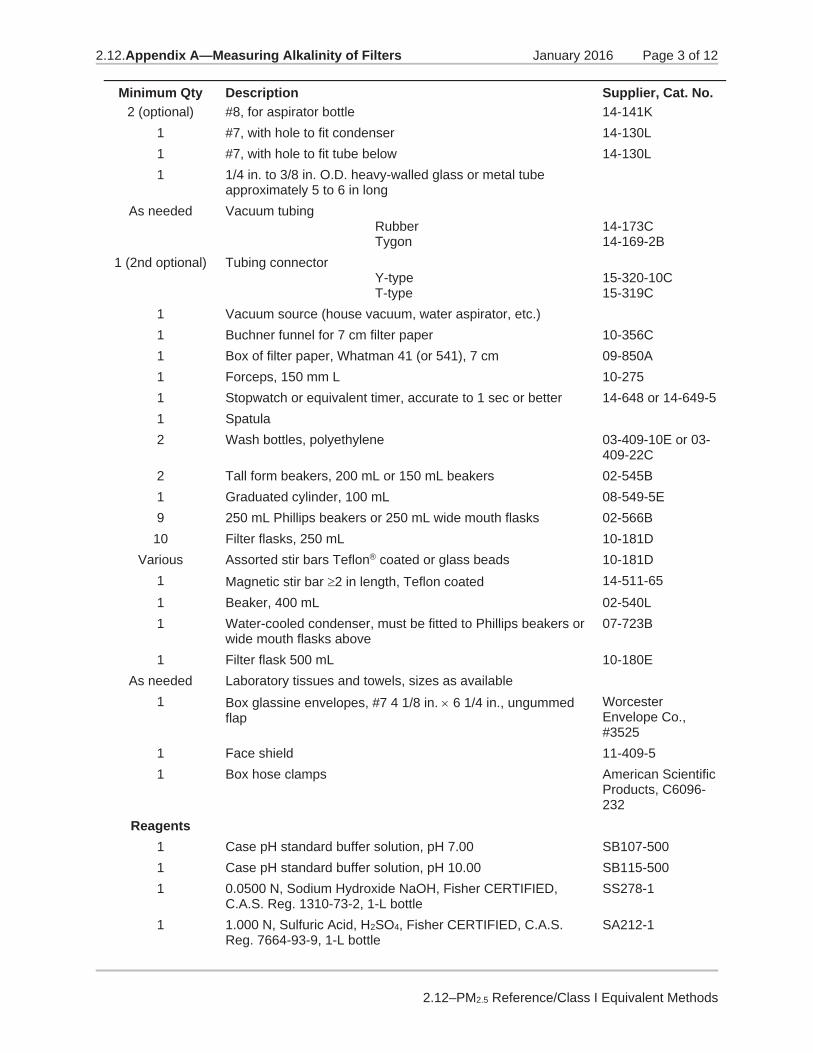
2.12.Appendix A—Measuring Alkalinity of Filters January 2016 Page 3 of 12
2.12–PM2.5 Reference/Class I Equivalent Methods
Minimum Qty Description Supplier, Cat. No.
2 (optional) #8, for aspirator bottle 14-141K 1
#7, with hole to fit condenser
14-130L
1 #7, with hole to fit tube below
14-130L
1 1/4 in. to 3/8 in. O.D. heavy-walled glass or metal tube approximately 5 to 6 in long
As needed
Vacuum tubing
Rubber Tygon
14-173C 14-169-2B
1 (2nd optional) Tubing connector
Y-type T-type
15-320-10C 15-319C
1 Vacuum source (house vacuum, water aspirator, etc.)
1 Buchner funnel for 7 cm filter paper
10-356C
1 Box of filter paper, Whatman 41 (or 541), 7 cm
09-850A
1 Forceps, 150 mm L
10-275
1 Stopwatch or equivalent timer, accurate to 1 sec or better
14-648 or 14-649-5
1 Spatula
2 Wash bottles, polyethylene
03-409-10E or 03-409-22C
2 Tall form beakers, 200 mL or 150 mL beakers
02-545B
1 Graduated cylinder, 100 mL
08-549-5E
9 250 mL Phillips beakers or 250 mL wide mouth flasks
02-566B
10 Filter flasks, 250 mL
10-181D
Various Assorted stir bars Teflon® coated or glass beads
10-181D
1 Magnetic stir bar 2 in length, Teflon coated
14-511-65
1 Beaker, 400 mL
02-540L
1 Water-cooled condenser, must be fitted to Phillips beakers or wide mouth flasks above
07-723B
1
Filter flask 500 mL
10-180E
As needed Laboratory tissues and towels, sizes as available
1 Box glassine envelopes, #7 4 1/8 in. 6 1/4 in., ungummed flap
Worcester Envelope Co., #3525
1 Face shield
11-409-5
1 Box hose clamps
American Scientific Products, C6096-232
Reagents
1 Case pH standard buffer solution, pH 7.00
SB107-500
1 Case pH standard buffer solution, pH 10.00
SB115-500
1 0.0500 N, Sodium Hydroxide NaOH, Fisher CERTIFIED, C.A.S. Reg. 1310-73-2, 1-L bottle
SS278-1
1
1.000 N, Sulfuric Acid, H2SO4, Fisher CERTIFIED, C.A.S. Reg. 7664-93-9, 1-L bottle
SA212-1

2.12.Appendix A—Measuring Alkalinity of Filters January 2016 Page 4 of 12
2.12–PM2.5 Reference/Class I Equivalent Methods
Minimum Qty Description Supplier, Cat. No.
1 Potassium Chloride, CKl, Fisher CERTIFIED, Crystals, C.A.S. Reg. No. 7447-40-7, 500-g bottle
P-217-500
1
Hydrochloric Acid, HCl, ACS reagent, C.A.S. Reg. No. 7647-01-0 ½ gal bottle
A-144-212
Deionized water
Laboratory Deionization System
A.4 Procedure A.4.1 Sample Preparation
Filters should be handled only with clean lint-free gloves or clean metal utensils such as forceps, tongs, scissors, etc. (1) After initial receipt, place the Low-vol filters in a metal rack with separate slots for each
filter. Place this rack in a controlled humidity (<50 percent relative humidity), controlled temperature (25 C), balance room and allow the filters to equilibrate for 24-48 hours. At the end of that period, carefully weigh each filter using a balance adapted for this purpose. Weigh to the nearest milligram or better. Then place the filters in a storage container.
(2) Remove one filter at a time from the storage container. (3) Place the filter on a clean metal surface (aluminum foil spread on a regular lab bench, clean
stainless steel surface, etc.). Measure its length and width on all edges. Calculate the area by multiplying the average length by the average width. Cut out the filter number printed in the upper right corner, in a single rectangular piece. Save the number and place it in a glassine envelope.
(4) Using a ruler, scissors, and lint-free gloves, cut the filter into ½ in. squares. This makes
approximately 320 squares. (5) Mix the squares and randomly select a sample of 70-80 squares (approximately 1 g). Do
not select and analyze the piece of filter containing the filter number. Weigh the filter sample in a tared disposable aluminum weighing dish. The final sample weight must be within one square of 1 g. Record the weight to the nearest milligram.
(6) Store the remaining squares in a glassine envelope with the filter number showing. NOTE:
Filters may be cut a few days before analysis and stored in glassine envelopes. (7) Transfer the weighed sample into a 250-mL Phillips beaker or a 250-mL wide-mouth flask.
Cover the beaker or flask with the aluminum weighing dish and seal. (8) Clean the gloves, utensils and work area of any filter fibers or lint before taking out the
next filter.

2.12.Appendix A—Measuring Alkalinity of Filters January 2016 Page 5 of 12
2.12–PM2.5 Reference/Class I Equivalent Methods
(9) Repeat Steps 2-8 until seven Phillips beakers containing filter squares have been prepared.
Leave two Phillips beakers empty as blanks. Label the Phillips beakers and 250-mL filter flasks consecutively from 1 to 9 and pair by number for each sample or blank.
A.4.2 Solution Preparation (1) Prepare 0.005 N NaOH titrant by diluting a certified 0.0500 N solution 1:10 with degassed
deionized water (i.e., pipet 100.0 mL of certified NaOH into a 1,000-mL volumetric flask, dilute to the mark, and mix well). Degas the deionized water by bubbling N2 through 1 L of water at a rate of approximately 1 L/min for 1 hour. Take care to protect the solution from the air during storage in order to prevent carbonate formation.
(2) Prepare 0.0100 N H2SO4 titrant by diluting certified 1.000 N HxSO4 titrant by diluting
certified 1.000 N H2SO4 solution 1:100 with deionized water (i.e., pipet 10.00 mL into a 1,000-mL volumetric flask, dilute to the mark with deionized water, and mix well).
(3) Prepare 0.1 M KCl/0.0001 M HCl electrode storage solution by the following process.
First, pipet 1 mL of reagent grade concentrated HCl into a 500-mL volumetric flask, dilute to the mark with deionized water, and mix well. Second, place 7.456 g of KCl in a 1,000-mL volumetric flask, add approximately 500 mL deionized water, swirl to dissolve the KCl crystals, pipet 4 mL of the diluted HCl solution into the flask, dilute to the mark with deionized water, and mix well. The solution may be stored in the volumetric flask or similar glass container.
A.4.3 General Notes and Pre-run Setup (1) Set up the titration stand and burets well in advance of sample analysis. Place one buret
clamp on the titration stand and adjust the clamp height. In the right-hand buret holder, place a 10-mL buret. Check to see that the stopcock is closed. Fill the buret with 0.005 N NaOH solution and place a small beaker or buret cover on top of the buret:
CAUTION The NaOH solution should not be stored in the buret for any length of time due to its tendency to form carbonates when exposed to the air.
Place the other buret in the other side of the holder, fill the buret with 0.01 N H2SO4, and cover the top of the buret with a small beaker or buret cover.
(2) (Optional: If using buret with 3-way stopcock.) Attach one end of a length of acid-resistant,
flexible tubing to the curved tube, A, at the bottom of the buret and connect the other end to a 3-way tubing connector. Securely fasten both ends using hose clamps. Attach the other
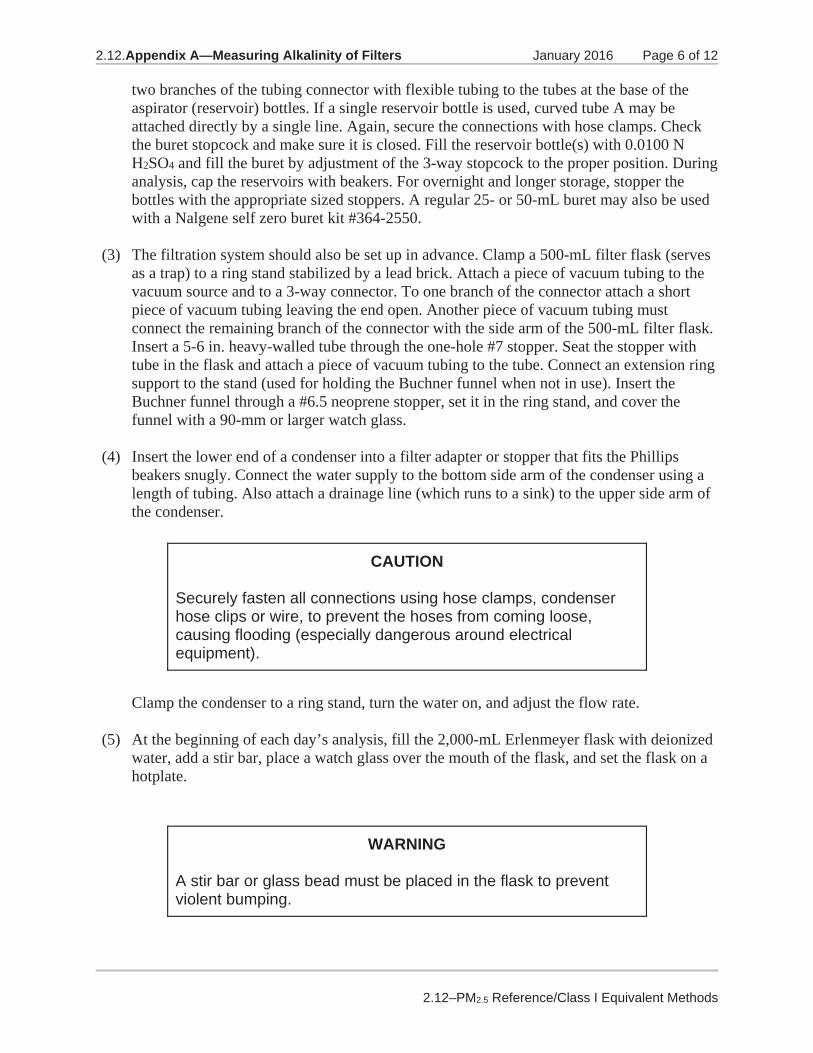
2.12.Appendix A—Measuring Alkalinity of Filters January 2016 Page 6 of 12
2.12–PM2.5 Reference/Class I Equivalent Methods
two branches of the tubing connector with flexible tubing to the tubes at the base of the aspirator (reservoir) bottles. If a single reservoir bottle is used, curved tube A may be attached directly by a single line. Again, secure the connections with hose clamps. Check the buret stopcock and make sure it is closed. Fill the reservoir bottle(s) with 0.0100 N H2SO4 and fill the buret by adjustment of the 3-way stopcock to the proper position. During analysis, cap the reservoirs with beakers. For overnight and longer storage, stopper the bottles with the appropriate sized stoppers. A regular 25- or 50-mL buret may also be used with a Nalgene self zero buret kit #364-2550.
(3) The filtration system should also be set up in advance. Clamp a 500-mL filter flask (serves
as a trap) to a ring stand stabilized by a lead brick. Attach a piece of vacuum tubing to the vacuum source and to a 3-way connector. To one branch of the connector attach a short piece of vacuum tubing leaving the end open. Another piece of vacuum tubing must connect the remaining branch of the connector with the side arm of the 500-mL filter flask. Insert a 5-6 in. heavy-walled tube through the one-hole #7 stopper. Seat the stopper with tube in the flask and attach a piece of vacuum tubing to the tube. Connect an extension ring support to the stand (used for holding the Buchner funnel when not in use). Insert the Buchner funnel through a #6.5 neoprene stopper, set it in the ring stand, and cover the funnel with a 90-mm or larger watch glass.
(4) Insert the lower end of a condenser into a filter adapter or stopper that fits the Phillips
beakers snugly. Connect the water supply to the bottom side arm of the condenser using a length of tubing. Also attach a drainage line (which runs to a sink) to the upper side arm of the condenser.
CAUTION Securely fasten all connections using hose clamps, condenser hose clips or wire, to prevent the hoses from coming loose, causing flooding (especially dangerous around electrical equipment).
Clamp the condenser to a ring stand, turn the water on, and adjust the flow rate.
(5) At the beginning of each day’s analysis, fill the 2,000-mL Erlenmeyer flask with deionized
water, add a stir bar, place a watch glass over the mouth of the flask, and set the flask on a hotplate.
WARNING A stir bar or glass bead must be placed in the flask to prevent violent bumping.

2.12.Appendix A—Measuring Alkalinity of Filters January 2016 Page 7 of 12
2.12–PM2.5 Reference/Class I Equivalent Methods
Set the heat on high until the water begins to boil. After boiling starts, turn the heat down sufficiently to just maintain boiling. Also, at this time set a hot plate/stirrer by the ring stand with the condenser and adjust the heat setting to high. Set the third hotplate (to be used during the cleanup step) in a convenient place and set on high heat. Generally, a 45- to 60-min warmup period is required for the water and hotplates.
A.4.4 pH Meter Calibration and Electrode Storage (1) Calibrate the pH meter at the beginning and end of a run as described in the instrument
manual and record the calibration data. (2) Store electrodes in the 0.1 M KCl/0.0001 M HCl solution described in Section 4.2, Step 3.
For short-term storage and between samples the electrode may be placed in a beaker containing approximately 100 mL of storage solution. For long-term storage (weekend or longer) slip the electrode into an O-ring sealed electrode storage bottle approximately three-fourths full of storage solution and tighten the cap to seal the electrode body to the bottle.
A.4.5 Analysis of Glass Fiber Filters
WARNING Protective equipment must be worn to prevent serious burns. The sample is hot and caustic and will adhere to the skin.
(1) Clamp a clean, 250-mL filter flask to the filtration stand and connect the tubing from the
vacuum trap to the flask side arm. Set the Buchner funnel on top of the filter flask, place a single 7-cm Whatman 41 or 541 filter circle in the funnel using tweezers, and cover the funnel.
(2) Set the first Phillips beaker, containing filter squares, near the hotplate/stirrer and add a 2-
in. magnetic stir bar. (3) Pour 100 mL of boiling water from the 2-L flask into a graduated cylinder. (Use heat-
resistant gloves to handle the hot glassware.) (4) Set aside the aluminum weighing dish cover, place the Phillips beaker on the hotplate, and
turn on the stirrer. (5) Add the 100 mL of water to the Phillips beaker, begin timing the extraction, quickly lower
the condenser into the beaker and clamp loosely. (6) At approximately 19 minutes and 30 seconds after the start of the extraction, don the face
mask, turn on the vacuum, and put on heat-resistant gloves. (7) At about 19 minutes and 55 seconds quickly lift the condenser out of the Phillips beaker

2.12.Appendix A—Measuring Alkalinity of Filters January 2016 Page 8 of 12
2.12–PM2.5 Reference/Class I Equivalent Methods
and clamp in a raised position.
NOTE The stirrer may be stopped at this time.
(8) At exactly 20 minutes, using heat-resistant gloves, remove the Phillips beaker from the
hotplate, swirl, and pour the contents rapidly, but carefully, through the Buchner funnel. Set the beaker on the bench and apply vacuum until the filter pad is just dry on top. The unconnected length of vacuum tubing may be used to regulate the vacuum strength by placing a finger over the hole in the tubing or by leaving it open.
(9) Remove the vacuum tubing and the funnel from the filter flask. Pour the hot extract back
into the Phillips beaker carefully washing down any residual pulp. Reclamp the filter flask, replace the funnel, and reattach the vacuum tubing. Swirl and pour the extract through the filter. Apply vacuum as needed.
NOTE Steps 8 and 9 should be completed in 2 minutes or less. Typical times have been 1 minute and 30 seconds to 1 minute and 50 seconds.
(10) Remove the fact shield, detach the vacuum tubing, set aside the Buchner funnel, place
the filter flask on the titration stand, and remove gloves.
NOTE
Before titrating the extract just finished, a more efficient use of time may be made by starting the next sample at this point as follows: Remove the stir bar and wipe it clean of filter material adhering to it. Immediately start another extraction by performing Steps 2 through 5 on the next sample.
(11) Rinse the pH electrode with deionized water, shake off excess, pat dry with a laboratory
tissue, and place in the filter flask. Push pH button (meter in Manual Temperature Compensation mode, set to 25 ) and take an initial pH reading; this reading should be between pH 9 and 11 for glass filters and between 7 and 9 for quartz. Swirl the flask and begin titration.
(12) Titrate samples with 0.0100 N H2SO4. Add the titrant in increments of several
milliliters at a time until the pH drops below 8. At that point slow the addition rate to smaller increments of 0.1–0.5 mL of titrant. Stop the titrant flow when the pH reaches

2.12.Appendix A—Measuring Alkalinity of Filters January 2016 Page 9 of 12
2.12–PM2.5 Reference/Class I Equivalent Methods
7.00 and stop swirling; the pH should rise by 0.1–0.2 units. If the final calm pH is greater than 7.00, add enough titrant to compensate. If the titration cannot be stopped at pH 7.00 ±0.02, record the calm pH and the volume of titrant for points around pH 7 and calculate the extract volume of titrant required to reach pH 7 by linear regression or extrapolation methods.
A.4.6 Analysis of Quartz Fiber Filters
In order to reduce background alkalinity retained in the funnel, rinse the Buchner funnel once with boiling water before each analysis of a quartz filter. The alkalinity of quartz filters is more than an order of magnitude lower than that of glass filters; therefore, a lower background is required. (1) Clamp in place a clean, dry, 250-mL filter flask and a 250-mL filter flask labeled “rinse.” (2) Seat the funnel on the rinse flask. (3) Fill a graduated cylinder with 100 mL boiling deionized water, pour the water through the
funnel and cover the funnel with a watch glass. (4) through (9) Same as Steps 1-5 for glass fiber filters. (10) During the extraction, remove the cover from the funnel, pat the funnel bowl and tip dry
with laboratory tissues, move the funnel to the clean dry flask, using forceps place a 7 cm Whatman 41 or 541 filter circle in the funnel and recover. Remove the rinse flask and drain.
(11) through (17) Same as Steps 6-12 for glass fiber filters. A.4.7 Analysis of Blanks Blank flasks are empty flasks that do not contain any filter squares. (1) through (11) Same as Steps 1-11 for glass fiber filters. (12a) FOR BASIC BLANKS: If the initial pH is above 7, titrate slowly with the H2SO4 used
for samples. See Step 12 for glass fiber filters. (12b) FOR ACIDIC BLANKS: If the initial pH is below 7, titrate slowly with the 0.005 N
NaOH from a 10-mL buret, instead of H2SO4. Slow the titrant flow when the pH goes above 6 and stop the flow when pH reaches 6.8–6.9; when swirling is ceased the pH should rise 0.1 to 0.2 units. See Step 12 for glass fiber filters.

2.12.Appendix A—Measuring Alkalinity of Filters January 2016 Page 10 of 12
2.12–PM2.5 Reference/Class I Equivalent Methods
A.4.8 Cleanup after Analysis (1) Wipe and rinse the stir bars, then place in a clean dry place. (2a) FOR GLASS FILTERS: Get the next clean filter flask, mount it on the ring stand, and
attach the vacuum line. Remove the used filter with forceps, clean the funnel with laboratory tissues, seat it on the filter flask, add a fresh Whatman 41 or 541 filter with forceps, and cover the funnel.
(2b) FOR QUARTZ FILTERS: Mount the next filter flask and the rinse flask on the ring stand.
Attach the vacuum line to the filter flask. Remove the used filter with forceps, clean the funnel with laboratory tissues, seat the funnel on the rise flask and cover.
(3) After each titration, rinse the pH electrode into a waste beaker, then with a laboratory
tissue wipe off any condensation on the electrode, and place it in the storage beaker. (4) As time permits, rinse the Phillips beakers and filter flask thoroughly with a stream of
deionized water. Then fill each twice with fresh deionized water discarding the water each time. Fill each a third time with fresh deionized water, add a small Teflon-coated stir bar or clean glass bead and place on a hotplate to boil (as time and space permit).
WARNING Be sure to use heat-resistant gloves or tongs when handling the hot glassware to prevent burns.
After boiling for at least 5 minutes, discard the water, taking care not to lose the stir bar, drain, and allow to dry thoroughly before reusing. Once per week, or more often as needed, scrub the sides and spout of the Phillips beaker with a clean brush, then rinse thoroughly and boil as above. Store the flask in a clean dry place.
A.5. Calculations (1) If the titration was not stopped at exactly pH 7.00, then the titrant volume corresponding to
pH 7.00 is calculated by extrapolation or linear regression. (2) Calculate the microequivalents for the samples and the blanks using the following
equation: microequivalents = (mL of titrant) (normality of titrant) 1,000.
The sign of the blank (or sample) is negative if the titrant was NaOH and positive if the titrant was H2SO4.

2.12.Appendix A—Measuring Alkalinity of Filters January 2016 Page 11 of 12
2.12–PM2.5 Reference/Class I Equivalent Methods
(3) Next average the blanks for the day:
(4) Then calculate alkalinity in microequivalents per gram of sample using the following
equation:
(5) If units of microequivalents per square centimeter are required:
(6) Sample calculation
A filter weighing 4.0432 g was found to have an area of 517.2 cm2. A 1.005-g filter sample was extracted and the extract titrated with 0.0100 N H2SO4. The volume 10.99 mL of titrant corresponded to pH 7.08 and 11.12 mL of titrant corresponded to pH 6.92. Both blanks required H2SO4 and had values of 1.0 and 0.8 microequivalents, respectively. Alkalinity is calculated as follows:
Step 1 using linear regression:
The estimated volume of titrant at pH 7.00 in this case equals 11.06 mL; or
Step 1 using extrapolation The estimated volume of titrant also equals 11.06 mL.
Step 2
eq = (11.06 mL) (0.0100 N) 1,000 = 110.6 microequivalents
Step 3
average blank = blank1 + blank2
2 (microequivalents)
eqg =
eq of sample - eq of average blankgram weight of sample
eqcm2 =
eqg
weight of entire filter (g)surface area of entire filter (cm2)
Average blank = = 0.9 eq

2.12.Appendix A—Measuring Alkalinity of Filters January 2016 Page 12 of 12
2.12–PM2.5 Reference/Class I Equivalent Methods
Step 4
alkalinity ( eq/g) = (110.6 - 0.9) eq
1.005 g .
Step 5
A.6 Quality Control Prepare a total of nine Phillips beakers for analysis each day; leave two empty as blanks. The sample analysis order is: two samples, one blank, three samples, one blank, two samples. Two samples should be from filters previously analyzed. Number the Phillips beakers and filter flasks from 1 to 9 and rotate the position each day so all glassware pairs eventually are used for a blank analysis. An example of the glassware and sample order for a week is given in Table A-3.
alkalinityeq
cm2 = 4.0432 g
517. 2 cm2109.2 eq
g = 0.854 eq
cm2 .
TABLE A-3. GLASSWARE AND SAMPLE ORDER
Day 1 Day 2 Day 3 Day 4 Day 5
Glass Sample Glass Sample Glass
Sample Glass Sample Glass Sample
1
S-1
2
S-8 3 S-13 4 S-18
5
S-23
2
S-2
3
S-9 4 S-14 5 S-19
6
S-24
3
B-1
4
B-3 5 B-5 6 B-7
7
B-9
4
S-3
5
S-10 6 S-15 7 S-20
8
S-25
5
S-4
6
S-1 7 S-9 8 S-16
9
S-18
6
S-5
7
S-11 8 S-16 9 S-21
1
S-26
7
B-2
8
B-4 9 B-6 1 B-8
2
B-10
8
S-6
9
S-12 1 S-17 2 S-22
3
S-27
9
S-7
1
S-5 2 S-1 3 S-13
4
S-4

Page Intentionally Left Blank

Uni
ted
Stat
es
Envi
ronm
enta
l Pro
tect
ion
Age
ncy
Off
ice
of A
ir Q
ualit
y Pl
anni
ng a
nd S
tand
ards
A
ir Q
ualit
y A
naly
sis D
ivis
ion
Res
earc
h Tr
iang
le P
ark,
NC
Publ
icat
ion
No.
EPA
-454
/B-1
6-00
1Ja
nuar
y, 2
016