Embed Size (px)
Citation preview
Volume: 2, Issue: 2, (December, 2020), pp 141-151
www.rjt.ac.lk/agri/sljae
SRI LANKAN JOURNAL OF AGRICULTURE AND ECOSYSTEMS eISSN: 2673-1401
ORIGINAL ARTICLE
Quality and Price Variation in the Dairy Value Chian: A Case Study in Monaragala District, Sri Lanka
P. S. S. L. Wickrama1, A.L. Sandika2*, V.S. Jayamanne3
Date of Submission: 17-04-2020 Date of Acceptance: 21-12-2020
SLJAE
1,2 Department of Agricultural
Economics, Faculty of Agriculture, University of Ruhuna, Mapalana,
Kamburupitiya, Sri Lanka.
3Department of Food Science and
Technology, Faculty of Agriculture, University of Ruhuna, Mapalana,
Kamburupitiya, Sri Lanka
Correspondence: [email protected], https://orcid.org/0000-0002-1136-5537
Abstract
Low value addition, quality and price variations have been recognized as common
problems of value chains in developing countries. Objective of the present study was
to examine the quality and price variations throughout the dairy value chain in a less
developed region in Sri Lanka. Wellawaya divisional secretariat of Monaragala
district was purposively selected as the study area. Primary data were collected by
using pre-tested, structured questionnaires. Laboratory tests of milk and curd
samples were carried out to check the quality variation using standard methods. Milk
samples were collected from three levels including farmer (10), processor (10 from
each, milk and curd) and retailer (10) to determine the quality variation. According
to the results, price of curd and yoghurt at consumer level was increased by 36% and
77% compared to the farm gate price. Farmer received the highest profit per liter of
milk (68.00 LKR) in the shortest value chain (D) out of four main chains identified.
The markets’ margin was estimated at 36%. Farmer had the largest share of 64%
followed by processor (20%), retailer (8%), collector (4%), and wholesaler (4%). It
was evident that farmers received fair profit through all four dairy value chains.
However, solid non-fat percentage, specific gravity and pH of analyzed samples
through the value chain were not comply with the standards. In conclusion, the prices
of dairy products have increased while deteriorating the quality along the chain. It
is therefore important to educate and train actors throughout the dairy value chain
on quality management.
Keywords: Dairy farmers, dairy value chain actors, price variation, quality variation
This is an open-access article distributed under the terms of the Creative Commons Attribution 4.0 International License, which permits unrestricted use, distribution and reproduction in any medium provided the original author and source are credited.
DOI: http://doi.org/10.4038/sljae.v2i2.43

142
Sri Lankan Journal of Agriculture and Ecosystems, 2(2):141-151, 2020
1. Introduction
Value chain defines as a set of activities
that a firm operating in a specific
industry performs to deliver valuable
products (Porter 1985). According to the
Kaplinsky and Morris (2001) the value
chain is the full range of activities which
are required to bring a product or service
from conception, through the different
phases of production (involving a
combination of physical transformation
and the input of various producer
services), delivery to final consumers,
and final disposal after use. In dairy
industry, different value chain actors can
be identified such as input suppliers,
milk producers, milk processors,
marketers (wholesalers and retailers),
and consumers. Further, it includes
different value-added products such as
curd, yoghurt, pasteurized milk, and ice
cream. Dairy milk is an essential source
of supplements to human and animals
and it is the first and the main
nourishment for the mammals
(Walzeem et al. 2002). Dairy milk is
therefore considered as a main food for
the human. The utilization of dairy and
dairy items is common in Sri Lanka
which is perishable. Due to their
perishable nature, there is a greater
chance for quality deterioration from
product conception to utilization
ultimately affecting the buyer wellbeing.
Enhancing product quality and safety
through arrangement of good hygienic
operations are desirable for customers.
This is one of the motivations behind
why dairy testing is important to control
quality and hygienic. (Giangiacomo et al.
2000). Customers throughout the world
are progressively worried about the
safety of their nourishment in general
and dairy and dairy items specifically.
There is limited information on hygiene
practices, quality and the price
variations of the dairy value chain in Sri
Lanka. Therefore, the development of
infrastructure such as milk collecting
networks, facilities for value addition,
processing, and quality assurance
remain as challenges for smooth growth
of the industry.
Dairy industry plays a significant role in
the Sri Lankan economy. Total annual
milk production of the country is 447.5
million liters and there are 0.176 million
dairy farmers involved in the industry
(DCS 2016). Smallholders play the main
role in the livestock industry including
dairy. Altogether, 3.5 million people
including farmers and other actors
depend on the industry (FAO, 2009). The
livestock sector contributed more than

143
Sri Lankan Journal of Agriculture and Ecosystems, 2(2):141-151, 2020
22.5 billion rupees to the GDP (FAO
2009). Currently livestock contributes to
1% to the GDP (DAPH 2019).
Approximately 17.9 percent of family
units own domesticated animals and
around 70% of them own cattle in Sri
Lanka. The dairy animal population
comprises of 1.21 million cows in Sri
Lanka (FAO 2009). In 2016, import of
dairy and dairy products has been
expanded by 15% compared to 2015. As
a result, annual per-capita accessibility
of milk and allied products expanded by
55.5 liters (DAPH 2016; DCS 2016).
Less numbers of milk collection agencies,
chilling centers and low chilling capacity
have negatively affected the dairy value
chain in Monaragala district (DAPH
2011). On the other hand, potential
economic gains of actors have drained
out due to low-quality value-added
products, poor quality control practices,
and lack of product differentiation in the
value chain. Poor infrastructure facilities
such as poor transport, training facilities,
and farm infrastructure facilities also
have contributed to the current position
of the value chain. Poor knowledge about
quality and safety of milk products also
have caused considerable economical
and health losses to consumers (Vernooij
et al. 2015). Milk is highly perishable in
nature and they should be brought to the
consumer as quickly as possible in order
to satisfy the market requirements. Even,
the retailer also should sell the products
as soon as possible to avoid qualitative
and quantitative losses. Thus, proper
management of value chain is important
for nutritional preservation, food and
financial security of the players and
produce best value-added products.
Therefore, the objectives of this study
were to identify the value chain and
assess market margin of dairy value
chain, and quality and price variations.
2. Materials and methods
This study was conducted in Monaragala
district. By considering the high number
of dairy farmers scattered in the area.
Wellawaya Divisional Secretariat (DS)
division was purposively selected for
this study among eleven DS divisions of
Monaragala district. It is the highest
populated DS division in Monaragala.
This study followed value chain
approach starting from farmer, collector,
processor and marketer (wholesaler and
retailer) to consumer in Wellawaya DS
division. Representation of all the actors
in the dairy value chain was considered.
Farmers list of the Wellawaya veterinary
office, Wellawaya DS division and Milco
collecting center was used as a sampling

144
Sri Lankan Journal of Agriculture and Ecosystems, 2(2):141-151, 2020
frame to select forty dairy farmers from
the target population. Stratified random
sampling method was used to select 20
small scales, 10 medium scale, and 10
large scale farmers to represent different
production scales. Apart from that, 10
input suppliers, 10 collectors, 10
processors, two wholesalers, 13
retailers, and 15 consumers were
selected purposively.
Six different structured questionnaires
were used for primary data collection
from each dairy value chain actor.
Questionnaires consisted three
components such as basic socio
demographic variables, prices and other
economic variables, and maintenance of
quality parameters. Secondary data were
collected through literature such as
books, journal articles, newspapers, and
websites.
Milk samples were collected randomly
from three main actor levels including
ten milk samples each from farmer and
processor level, and ten curd samples
from wholesaler level. Laboratory tests
were conducted to check the quality
variation throughout the value chain.
Milk quality parameters were measured
to identifying quality variation along the
dairy value chain from farmer to
wholesaler. Fat percentage, solid non-fat
(SNF) percentage, specific gravity and
pH were determined by using standard
methods at three main actor levels of
milk value chain. Laboratory tests were
carried out at Milco milk collection
center laboratory, Wellawaya and animal
science and technology laboratory,
Department of Animal Science, Faculty of
Agriculture, University of Ruhuna. Fat
percentage, SNF percentage and specific
gravity were tested only at farmer and
collector level. The pH was tested only at
processor level on availability of
facilities and time.
Fat percentages were determined by
using standard Gerber method. Specific
gravity was determined according to the
standard lactometer reading method.
The pH values were taken by using pH
meter. The SNF percentages were
identified by using Eq. 1 (Richmand’s
formula).
𝑆𝑁𝐹 % = (𝐶𝐿𝑅/4) + 0.22𝐹 + 0.72…………… (1)
Where;
SNF = solid non-fat percentage (%)
CLR = corrected lactometer reading
F = fat content in milk (%)
Market Margin (MM) was used to study
the price spread. It is the difference

145
Sri Lankan Journal of Agriculture and Ecosystems, 2(2):141-151, 2020
between the price paid by the ultimate
consumer and the price received by the
producer or farmer. The MM represents
all assembling, transport, other retailing
charges and profit margin added to the
farm products i.e., the cost of providing a
range of marketing services (Khan at el.
2005). Simply it can be identified as the
percentage difference in price paid by
the buyer and price received by the
seller.
Market margin for curd = (Ps/ Sp)×100%
………………… (2)
Where;
Ps = price spread (paid price - sale price in
rupees).….. (3)
Sp = sale price in rupees
Assuming,
Farm gate price = a
Collector price = b
Processor price = c
Wholesaler price = d
Retailer price = e
Market margin% = {(e-a)/e} ×100%
Farmer’s share % = {a/e} × 100%
Collector’s share = {(b-a)/e} ×100%
Processor’s share = {(c-b)/e} ×100%
Wholesaler’s share = {(d-c)/e} ×100%
Retailer’s share = {(e-d)/e} ×100%
Procedure used to calculate costs and
profits is indicated in Eq. 4
𝐴𝑣𝑒𝑟𝑎𝑔𝑒 𝑐𝑜𝑠𝑡 𝑜𝑓 𝑝𝑟𝑜𝑑𝑢𝑐𝑡𝑖𝑜𝑛 𝑝𝑒𝑟 𝑙𝑖𝑡𝑒𝑟 𝑜𝑓 𝑚𝑖𝑙𝑘 =
(𝐴𝑣𝑒𝑟𝑎𝑔𝑒 𝑡𝑜𝑡𝑎𝑙 𝑐𝑜𝑠𝑡 𝑝𝑒𝑟 𝑎𝑛𝑖𝑚𝑎𝑙)
(𝐴𝑣𝑒𝑟𝑎𝑔𝑒 𝑦𝑖𝑒𝑙𝑑 𝑝𝑒𝑟 𝑎𝑛𝑖𝑚𝑎𝑙)……….(4)
3. Results and discussion
Input suppliers, farmers, dairy
collectors, processors, marketers and
consumers were the main actors who
engaged in dairy value chain in
Wellawaya DS division. Four types of
dairy value chains were identified and
shown in Fig.1.

146
Sri Lankan Journal of Agriculture and Ecosystems, 2(2):141-151, 2020
Input supplier Input supplier Input supplier Input supplier
Farmer Farmer Farmer Farmer
Collector Processor Processor Retailer
Processor Wholesaler Retailer Consumer
Wholesaler Retailer Consumer
Eg: Curd yoghurt
Milk toffee, ice-cream
Retailer Consumer Eg: Fresh milk
Consumer
Eg: curd, yoghurt
Eg: Curd, yoghurt
Figure 1: Different dairy value chains in the study area
Curd, yoghurt, milk toffee and ice cream
were the main end products of the value
chains. In the sample, majority of
farmers (35%) were linked to Chain A,
while 28% and 25% of farmers were
linked to Chain B and C, respectively. The
rest (12%) was linked to Chain D.
Average profit calculation was made
aggregating both buffalo and cow milk.
This aggregation was made because, in
general, both cow and buffalo milk is
mixed together by collectors in all the
identified value chains. Costs and profits
for production of one liter of milk were
calculated as below.
Average cost of production per liter of
milk,
Average yield of milk per animal
= 3 liters per day
Average cost per animal
= Rs.95 per day
Average cost per liter of milk
= Rs.31.66 per day
Farmer’s average profit, farm gate price
and cost variations per liter of milk in the
four main value chains are shown in
Table 1.
Chain A Chain B Chain C Chain D
147
Sri Lankan Journal of Agriculture and Ecosystems, 2(2):141-151, 2020
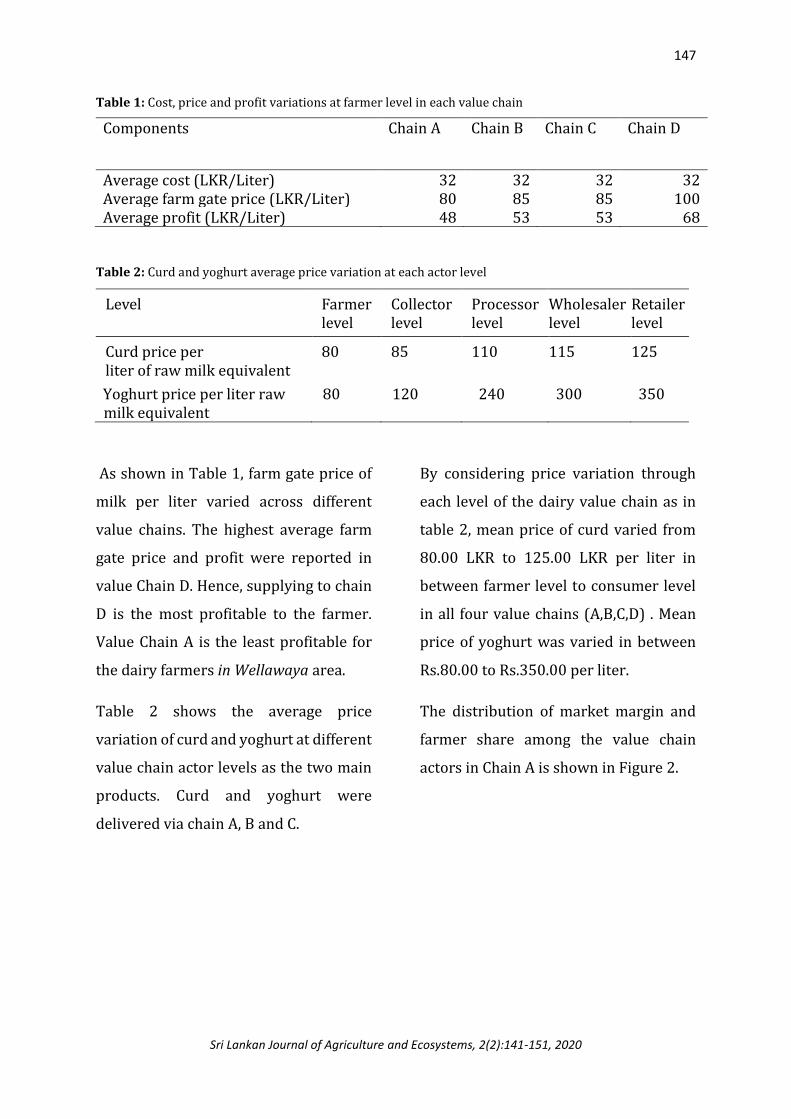
Table 1: Cost, price and profit variations at farmer level in each value chain
Components Chain A Chain B Chain C Chain D
Average cost (LKR/Liter) 32 32 32 32 Average farm gate price (LKR/Liter) 80 85 85 100 Average profit (LKR/Liter) 48 53 53 68
Table 2: Curd and yoghurt average price variation at each actor level
As shown in Table 1, farm gate price of
milk per liter varied across different
value chains. The highest average farm
gate price and profit were reported in
value Chain D. Hence, supplying to chain
D is the most profitable to the farmer.
Value Chain A is the least profitable for
the dairy farmers in Wellawaya area.
Table 2 shows the average price
variation of curd and yoghurt at different
value chain actor levels as the two main
products. Curd and yoghurt were
delivered via chain A, B and C.
By considering price variation through
each level of the dairy value chain as in
table 2, mean price of curd varied from
80.00 LKR to 125.00 LKR per liter in
between farmer level to consumer level
in all four value chains (A,B,C,D) . Mean
price of yoghurt was varied in between
Rs.80.00 to Rs.350.00 per liter.
The distribution of market margin and
farmer share among the value chain
actors in Chain A is shown in Figure 2.
Level Farmer level
Collector level
Processor level
Wholesaler level
Retailer level
Curd price per liter of raw milk equivalent
80
85
110
115 125
Yoghurt price per liter raw milk equivalent
80
120
240
300 350

148
Sri Lankan Journal of Agriculture and Ecosystems, 2(2):141-151, 2020
Figure 2: Market margin distribution in Chain A
When considering Fig. 2, if consumer
pays a 100 LKR, farmer share is 64% in
which, cost of production consists of
26% while 38% goes as the profit.
Compared to the other actors, the second
largest margin was accrued to the
processor (20%). Each wholesaler and
collector received the least share
accounted at 04%.
Table 3 shows the fat%, SNF% and
specific gravity variation of milk samples
at farmer level. Considering the quality
variation at farmer level, fat percentage
of ten milk samples varied from 3.8% to
5.0% and mean fat percentage of milk
samples was 4.34%. The SNF percentage
of ten milk samples varied between
8.34% to 9.1% while mean SNF
percentage was 8.69%. Also, specific
gravity varied between 1.028 to 1.030
g/ml and mean specific gravity of ten
milk sample was 1.028 g/ml. Specific
gravity and SNF percentage were low
and not complied with Weerasekara et
al. 2010.
Table 3: Variation of different quality parameters at farmer level
Character Fat% SNF% Specific gravity (g ml-1)
Minimum 3.8 8.34 1.026
Maximum 5.0 9.10 1.030
Mean 4.34 8.69 1.028
Market margin
(36%)
Farm share (64%)
Profit (38%) Cost (26%)
Collector (04%) Processor (20%) Wholesaler (04%)
Retailer (08%)
If consumer paid
Rs.100

149
Sri Lankan Journal of Agriculture and Ecosystems, 2(2):141-151, 2020
According to the Table 4, collector level,
fat percentage of milk samples varied
within 3.7% to 5.2% range and mean fat
percentage of milk samples was 4.34%.
This has not varied much between
producer and collector level. The SNF
percentage of ten milk samples varied
within 8.05% to 9.1% range while mean
SNF percentage was 8.45%. The SNF% at
collector level was decreased when
compared to farmer level. Also, specific
gravity varied within 1.025 to 1.029 g ml-
1 range and mean specific gravity of ten
milk samples was 1.027 g ml-1 which is
comparable to producer level. The mean
values of specific gravity, SNF, and fat
percentage were not comparable to the
standard (Weerasekara et al. 2010).
Table 4: Variation of different quality parameters at collector level
Character Fat% SNF% Specific gravity (g ml-1)
Minimum 3.7 8.05 1.025
Maximum 5.2 8.94 1.029
Mean 4.34 8.45 1.027
Table 5: pH variation of curd sample at processor level
The pH value variation of different curd
samples at processor level is shown in
Table 5. Further, processor level pH of
ten curd samples varied within 4.7 to
4.84 range and mean pH of curd samples
was 4.76. The pH values reported were
not in conformity to the standards
(Weerasekara et al. 2010).
4. Conclusions
Value chain management of dairy and
dairy products is important because it
describes how the activities are
organized from farmer to consumer. The
actors of Monaralgala district’s dairy
value chain consisted of input suppliers,
farmers, collectors, processors,
wholesalers, retailer and consumers.
There are main four types of dairy value
chains in the Wellawaya DS division.
Sample number
01 02 03 04 05 06 07 08 09 10
pH 4.84 4.79 4.72 4.71 4.73 4.72 4.82 4.75 4.7 4.8
Max. 4.84 Min.4.7 Mean 4.758

150
Sri Lankan Journal of Agriculture and Ecosystems, 2(2):141-151, 2020
Out of the four main value chains,
majority of the actors was linked to
Chain A and it was the longest compared
to other chains. Value Chain D was the
shortest and the number of actors
connected to this chain was also low.
Profit share of each value chain actor was
higher in the shortest value chain (Chain
D) compared to other three. Farmers
earned the highest profit in the shortest
chain (Chain D). Length of the value
chain or numbers of value chain actors
are mainly affected to the variation of
profit of each actor. Yoghurt and curd are
the main value added dairy products
found in the study area.
Farmers’ average cost of production per
liter of milk was 32 LKR while farm gate
price was 80 LKR. Also, price of the
yoghurt was highly varied than price of
the curd along the value chain from dairy
farmer to consumer. Curd price at
consumer level was increased by 36%
and yoghurt price was increased by 77%
compare to farm gate price. Market
margin was 36%. Farmer’s share of the
market margin was 64%. Share of
collector, processor, and retailer was
4%, 20%, and 4% respectively. Farmers
received fair profit through dairy value
chain. It can be further concluded that
prices of dairy product increased while
slightly decreasing the quality. Product
quality need to be improved throughout
the value chain ultimately enabling to
produce quality and safe products for
consumers. Rising awareness of all the
actors in the value chain about product
quality requirements and importance
and training them on quality control
should gain priority attention of policy
makers.
Conflicts of Interest: The authors declare
that there are no conflicts of interest
regarding the publication of this paper.
5. References
Department of Census and Statistics
(2016) Household income and
expenditure survey, Ministry of National
Policies and Economic Affairs, Sri Lanka.
Retrieved from
http://www.statistics.gov.lk/HIES/HIES
2016/HIES2016_FinalReport.pdf
Department of Animal Production and
Health (2019) Livestock statistical
bulletin, Peradeniya. Sri Lanka.
Retrieved from:
http://www.daph.gov.lk/web/images/c
ontent_image/news_bulletins/livestock_
statistical/livestock_statistical_bulletin_
volume_4_issue_1.pdf
Department of Animal Production and
Health (2016) Annual report,

151
Sri Lankan Journal of Agriculture and Ecosystems, 2(2):141-151, 2020
Peradeniya, Sri Lanka. Retrieved from:
http://www.daph.gov.lk/web/images/c
ontent_image/publications/annual_repo
rts/AnnualReport2015.pdf
Department of Animal Production and
Health (2011) Annual report,
Peradeniya, Sri Lanka. Retrieved from:
http://www.daph.gov.lk/web/images/c
ontent_image/publications/annual_repo
rts/AnnualReport2011.pdf
Food and Agriculture Organization
(2009) Smallholder dairy development:
Lessons learned in Asia, Food and
Agriculture Organization of the United
Nations, regional office for Asia and the
Pacific, Bangkok, January 2009.
Retrieved from:
http://www.fao.org/3/i0588e/I0588E0
0
Giangiacomo L, Scandurra R, Christova P,
Karshikoff A, Knapp S, Ladenstein R
(2000) Thermal unfolding and
conformational stability of the
recombinant domain II of glutamate
dehydrogenase from the
hyperthermophile Thermotoga
maritime, Protein engineering, 13(7),
pp.501-507.
Kaplinsky R, Morris M (2001) A
Handbook for Value Chain Research,
prepared for the IDRC. Institute of
Development Studies: University of
Sussex.
Porter M (1985) Competitive Advantage:
Creating and Sustaining Superior
Performance. New York.: Simon and
Schuster. ISBN 9781416595847.
Retrieved 9 September 2013.
Vernooij A, Houwers W, Zijlstra, J (2015)
Emerging business opportunities in the
dairy sector of Sri Lanka, Livestock
Research Report, Wageningen UR
(University & Research centre).
Walzeem R L, Dillard C J, German J B
(2002) Whey components: millennia of
evolution create functionalities for
mammalian nutrition: what we know
and what we may be overlooking, Critical
reviews in food science and nutrition,
42(4), pp.353-375.
Weerasekara W M S I M, Karunarathne G
M C R, Pathapasinghe G A (2010)
Assesment of quality parameters in curd
and yoghurt of small scale processors in
North Central Province, Wayamba
journal of animal science.