Embed Size (px)
Citation preview

QUALITATIVE PM 2.5 HOT SPOT ANALYSIS US 101 EXPRESS LANES PROJECT, SANTA CLARA COUNTY, CALIFORNIA EA 04-2G7100 04-SCL-101 PM 16.0–52.55
04-SCL-85 PM 23.0–24.1
Prepared for
State of California Department of Transportation District 4 111 Grand Avenue Oakland, CA 94612
and
Santa Clara Valley Transportation Authority 3331 North First Street San Jose, CA 95134 November 2012
URS Corporation 1333 Broadway, Suite 800 Oakland, CA 94612

TABLE OF CONTENTSTABLE OF CONTENTSTABLE OF CONTENTSTABLE OF CONTENTS
X:\x_env\_permit\SR 85 & US101 Exp Lanes\US 101\6000_Tech Studies\Air Quality\_Deliverables\11-5-12 Reports\US 101Exp Hot Spot Analysis 11-14-12.doc i
1. Section 1 ONE Introduction ........................................................................................... 1-1
2. Section 2 TWO Project Description............................................................................... 2-2
2.1 Project Description................................................................................... 2-2
2.1.1 Introduction .................................................................................. 2-2
2.1.2 Project Description....................................................................... 2-2
3. Section 3 THREE PM2.5 Hot Spot Analysis .................................................................. 3-8
3.1 Regulatory Background ........................................................................... 3-8
3.1.1 Statutory Requirements for PM Hot Spot Analyses .................... 3-9 3.1.2 Ambient Air Quality Standards ................................................. 3-11
3.2 PM2.5 Hot Spot Analysis ........................................................................ 3-12
3.2.1 Analysis Methodology and Types of Emissions Considered .... 3-12 3.2.2 Air Quality Trend Analysis ........................................................ 3-13
3.2.3 Transportation and Traffic Analysis .......................................... 3-20
3.3 Conclusion ............................................................................................. 3-23
4. Section 4 FOUR References .......................................................................................... 4-1
Tables
3-1 Ambient PM2.5 Monitoring Data (µg/m3) at the San Jose–Jackson Street Monitoring Station (2007–2011)
3-2 PM2.5 Emission Trends in the San Francisco Bay Area Air Basin, 1975–2020 (tons per day)
3-3 Daily VMT and Worst Case Peak-Hour Speeds
3-4 No Build and Build Total AADT and Truck AADT, 2015
3-5 No Build and Build Total AADT and Truck AADT, 2035
3-6 Daily Modeled PM2.5 Emissions
Figures
1 Project Location
2 Project Area
3-1 Predominant Wind Direction at San Jose International Airport
3-2 24-Hour Average PM2.5 Concentrations (µg/m3) at the Livermore San Jose–Jackson Street Monitoring Station (2007–2011)

TABLE OF CONTENTSTABLE OF CONTENTSTABLE OF CONTENTSTABLE OF CONTENTS
X:\x_env\_permit\SR 85 & US101 Exp Lanes\US 101\6000_Tech Studies\Air Quality\_Deliverables\11-5-12 Reports\US 101Exp Hot Spot Analysis 11-14-12.doc ii
3-3 Annual Average PM2.5 Concentrations (µg/m3) at the San Jose–Jackson Street. Monitoring Station (2007–2011)
3-4 PM2.5 Emission Trends in the San Francisco Bay Area Air Basin (tons per day)
Acronyms and Abbreviations
AADT Annual average daily traffic
BAAQMD Bay Area Air Quality Management District
CAA Clean Air Act
CARB California Air Resources Board
CEQA California Environmental Quality Act
CFR Code of Federal Regulations
CO Carbon monoxide
CO2 Carbon dioxide
Department California Department of Transportation
EMFAC Emission Factor Model
EPA United States Environmental Protection Agency
FHWA Federal Highway Administration
FTA Federal Transit Administration
HOV High occupancy vehicle
µg/m3 Microgram per cubic meter
mph Miles per hour
MTC Metropolitan Transportation Commission
NAAQS National Ambient Air Quality Standards
NEPA National Environmental Policy Act
NOx Nitrogen oxides
O3 Ozone
PM Particulate matter
PM10 Particulate matter with an aerodynamic diameter less than or equal to 10 microns
PM2.5 Particulate matter with an aerodynamic diameter less than or equal to 2.5 microns
POAQC Project of Air Quality Concern
RTP Regional Transportation Plan
SFBAAB San Francisco Bay Area Basin
SHOPP State Highway Operation and Protection Program
TABLE OF CONTENTSTABLE OF CONTENTSTABLE OF CONTENTSTABLE OF CONTENTS
X:\x_env\_permit\SR 85 & US101 Exp Lanes\US 101\6000_Tech Studies\Air Quality\_Deliverables\11-5-12 Reports\US 101Exp Hot Spot Analysis 11-14-12.doc iii
SIP State Implementation Plan
SOx Sulfur oxides
TIP Transportation Improvement Program
USC United States Code

SECTIONSECTIONSECTIONSECTIONONE Introduction
X:\x_env\_permit\SR 85 & US101 Exp Lanes\US 101\6000_Tech Studies\Air Quality\_Deliverables\11-5-12 Reports\US 101Exp Hot Spot Analysis 11-14-12.doc 1-1
1. Section 1 ONE Introduction
This project-level hot spot analysis for the United States Highway 101 (US 101) Express Lanes Project responds to the United States Environmental Protection Agency’s (EPA) requirement for a hot spot analysis for particulate matter with an aerodynamic diameter less than or equal to 2.5 microns (PM2.5), as required in the EPA’s March 10, 2006, Final Transportation Conformity Rule (71 Federal Register 12468). The effects of localized PM2.5 hot spots were evaluated using the EPA and Federal Highway Administration (FHWA) guidance manual, Transportation Conformity Guidance for Qualitative Hot-spot Analyses in PM2.5 and PM10 Nonattainment and Maintenance Areas (FHWA and EPA 2006). This PM2.5 analysis addresses the operation of the proposed project, which is included in the Metropolitan Transportation Commission’s (MTC) current Regional Transportation Plan (RTP), the Transportation 2035 Plan for the San Francisco Bay Area (MTC 2009, RTP ID No. 230662). The FHWA made the conformity determination for the RTP on May 29, 2009. The project is also included in the 2011 Transportation Improvement Program (TIP), which was found to conform by FHWA and Federal Transit Authority (FTA) on December 14, 2010 (TIP ID No. SCL110002). An amendment to the TIP in 2012 (Revision ID SCL110002 in TIP Amendment 11-25) updated the project description to clarify the project limits and update the funding plan. The revisions made pursuant to this amendment did not change the air quality conformity finding or conflict with the financial constraint requirements of the TIP, therefore a conformity determination was not required for this TIP amendment and the 2011 TIP was found to conform. Proposed construction is not evaluated in this PM2.5 analysis because the construction period is anticipated to last approximately 2.0 years (less than 5.0 years) and will comply with BAAQMD construction-related fugitive dust control measures, which will ensure that fugitive dust from construction activities is minimized.

SECTIONSECTIONSECTIONSECTIONTWO Project Description
X:\x_env\_permit\SR 85 & US101 Exp Lanes\US 101\6000_Tech Studies\Air Quality\_Deliverables\11-5-12 Reports\US 101Exp Hot Spot Analysis 11-14-12.doc 2-2
2. Section 2 TW O Project Description
2.1 PROJECT DESCRIPTION
2.1.1 Introduction
Santa Clara Valley Transportation Authority (VTA), in cooperation with the California Department of Transportation (Caltrans), proposes to convert the existing High-Occupancy Vehicle (HOV) lanes along the United States Highway 101 (US 101) to High-Occupancy Toll (HOT) lanes (hereafter known as express lanes) and add a second express lane in each direction on northbound and southbound US 101 within the overall project limits of the East Dunne Avenue interchange in Morgan Hill to the Santa Clara/San Mateo County line just north of the Oregon Expressway/Embarcadero Road interchange in Palo Alto. The express lanes will allow HOVs and eligible clean air vehicles to continue to use the lanes for free and eligible single-occupant vehicles (SOVs) to pay a toll. The project will also convert the US 101/State Route (SR) 85 HOV direct connectors in Mountain View to express lane connectors and restripe the northern 1.1 mile of SR 85 to introduce a buffer separating the mixed flow lanes from the express lane and connecting the SR 85 express lanes to the US 101 express lanes. The project length is 36.55 miles on US 101 and 1.1 miles on SR 85, for a total of 37.65 miles.
2.1.2 Project Description
2.1.2.1 Existing Facilities
US 101 in Santa Clara County is a 52.55-mile long freeway that connects Gilroy to Palo Alto. US 101 passes through Gilroy, Morgan Hill, San Jose, Santa Clara, Sunnyvale, Mountain View and Palo Alto. US 101 intersects SR 85 in San Jose and in Mountain View, Interstate 280 (I-280)/I-680, I-880, SR 87, and SR 237. US 101 typically has 4 lanes in each direction, including 3 mixed-flow lanes and 1 HOV lane with auxiliary lanes in some locations.
2.1.2.2 Proposed Project
The project consists of converting the existing HOV lane along both northbound and southbound US 101 into an express lane and widening the freeway to add a second express lane for the majority of the corridor. The project also proposes to build new express lanes in the northbound direction between East Dunne Avenue and the existing HOV lane at Cochrane Road, and in the southbound direction between Burnett Avenue and Cochrane Road.
With these changes, there would be two express lanes on US 101 extending from approximately the Cochrane Road interchange in Morgan Hill to just south of the Oregon Expressway/ Embarcadero Road interchange in Palo Alto in the northbound direction, and from just south of the Oregon Expressway/Embarcadero Road interchange to just south of the Burnett Avenue overcrossing in the southbound direction.
The addition of the second express lane will involve a combination of inside and outside widening. The majority of the inside widening will occur within the US 101 segments south of the SR 85/US 101 interchange in southern Santa Clara County where a wide unpaved median exists. The project proposes to widen and pave the median to accommodate the additional lanes.

SECTIONSECTIONSECTIONSECTIONTWO Project Description
X:\x_env\_permit\SR 85 & US101 Exp Lanes\US 101\6000_Tech Studies\Air Quality\_Deliverables\11-5-12 Reports\US 101Exp Hot Spot Analysis 11-14-12.doc 2-3
The outside widening will occur in the remainder of the corridor to accommodate the additional lanes where needed.
The express lanes facility would be separated from the adjacent mixed-flow lanes by a striped buffer. The buffer zone, delineated with solid stripes, will have designated openings to provide access into and out of the express lanes facility. The express lanes would allow HOVs to continue to use the lanes without cost and eligible single-occupant vehicles (SOVs) to pay a toll.
The project proposes to construct and operate the express lane system with some non-standard cross sectional elements which will minimize the need for new right-of-way, outside widening, and structure reconstruction. The proposed project maximizes the use of the existing pavement cross section with a combination of inside and outside widening to create the additional pavement needed to accommodate the second express lane.
2.1.2.3 Right of Way
It is anticipated that the project will require limited right-of-way and Temporary Construction Easements (TCE). Right of way activities are currently being coordinated based on the approval of design exceptions. Utility relocations are anticipated to accommodate the outside widening.
2.1.2.4 Construction Activities
In the section between the southern project limit and the SR 85 interchange in southern San Jose, where the median width varies between 46 and 86 feet, pavement widening would be constructed in the median to accommodate the dual express lane facility. A retaining wall in the median is required to accommodate the inside widening where a split profile exists between northbound and southbound US 101.
A dual express lane facility is proposed for the majority of the corridor, with the exception of short segments near the SR 85 express lane connectors where a single express lane is proposed. A single express lane is proposed between the SR 85 Interchange and the Blossom Hill Road Interchange in San Jose, and between the Mathilda Avenue interchange and the SR 85 interchange in Mountain View. Outside widening is proposed to accommodate dual express lanes between the Blossom Hill Road interchange and the Mathilda Avenue interchange.
Bridge widening will be required at a number of grade separations and undercrossings, as well as modifications to existing overcrossing abutments, which can be found in Table 1 and 2. Widening of creek bridges is not included as part of this project.
The piles for the overhead signs would be up to 6 feet in diameter and extend to approximately 30 feet below ground surface. The piles for the tolling devices would be up to 2.5 feet in diameter and would extend to approximately 10 feet below ground surface. Some Traffic Operations Systems (TOS) equipment such as traffic monitoring stations, Closed Circuit Televisions, cabinets, and controllers would be installed along the outside edge of pavement within the existing right-of-way.
Trenching would be conducted along the outside edge of pavement for installation of conduits. The depth of trenching would be 3 to 5 feet below the roadway surface. Conduits would be

SECTIONSECTIONSECTIONSECTIONTWO Project Description
X:\x_env\_permit\SR 85 & US101 Exp Lanes\US 101\6000_Tech Studies\Air Quality\_Deliverables\11-5-12 Reports\US 101Exp Hot Spot Analysis 11-14-12.doc 2-4
jacked across the freeway to the median where needed to provide power and communication feeds to the new overhead signage and tolling equipment.
During construction, some lane and ramp closures would be required, but full freeway closures are not expected.
Biofiltration swales are proposed to provide storm water treatment for impervious areas that would be added or reworked as part of the project. These swales would be installed within the existing right-of-way.
2.1.2.5 US 101/SR 85 Direct Connectors
At the south end of the project in southern San Jose, both the northbound and southbound HOV direct connectors from SR 85 to US 101 will be converted to express lane connectors by the SR 85 Express Lanes Project, allowing SOVs with valid FasTrak devices to use the direct connectors.
At the north end of the project in Mountain View, the US 101 Express Lanes Project will convert the existing HOV connectors to express lane connectors and will extend the buffer striping onto SR 85 to connect to the buffer constructed by the SR 85 Express Lanes Project (EA #04-4A7900). The combination of SR 85 and US 101 Express Lanes projects will provide a complete express lane system on both freeways that includes the direct connectors.

SECTIONSECTIONSECTIONSECTIONTWO Project Description
X:\x_env\_permit\SR 85 & US101 Exp Lanes\US 101\6000_Tech Studies\Air Quality\_Deliverables\11-5-12 Reports\US 101Exp Hot Spot Analysis 11-14-12.doc 2-5

SECTIONSECTIONSECTIONSECTIONTWO Project Description
X:\x_env\_permit\SR 85 & US101 Exp Lanes\US 101\6000_Tech Studies\Air Quality\_Deliverables\11-5-12 Reports\US 101Exp Hot Spot Analysis 11-14-12.doc 2-6

SECTIONSECTIONSECTIONSECTIONTWO Project Description
X:\x_env\_permit\SR 85 & US101 Exp Lanes\US 101\6000_Tech Studies\Air Quality\_Deliverables\11-5-12 Reports\US 101Exp Hot Spot Analysis 11-14-12.doc 2-7
SECTIONSECTIONSECTIONSECTIONTHREE PM2.5 Hot Spot Analysis
X:\x_env\_permit\SR 85 & US101 Exp Lanes\US 101\6000_Tech Studies\Air Quality\_Deliverables\11-5-12 Reports\US 101Exp Hot Spot Analysis 11-14-12.doc 3-8
3. Section 3 THR EE PM2.5 H ot Spot Analysis
3.1 REGULATORY BACKGROUND
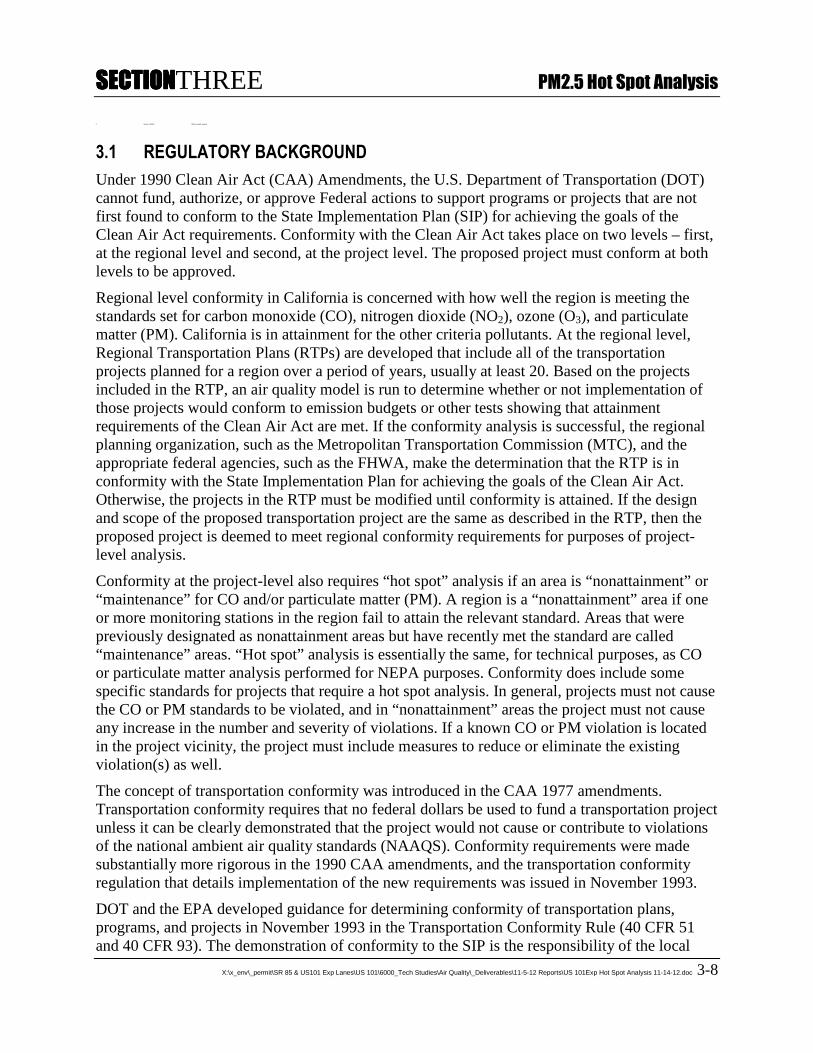
Under 1990 Clean Air Act (CAA) Amendments, the U.S. Department of Transportation (DOT) cannot fund, authorize, or approve Federal actions to support programs or projects that are not first found to conform to the State Implementation Plan (SIP) for achieving the goals of the Clean Air Act requirements. Conformity with the Clean Air Act takes place on two levels – first, at the regional level and second, at the project level. The proposed project must conform at both levels to be approved.
Regional level conformity in California is concerned with how well the region is meeting the standards set for carbon monoxide (CO), nitrogen dioxide (NO2), ozone (O3), and particulate matter (PM). California is in attainment for the other criteria pollutants. At the regional level, Regional Transportation Plans (RTPs) are developed that include all of the transportation projects planned for a region over a period of years, usually at least 20. Based on the projects included in the RTP, an air quality model is run to determine whether or not implementation of those projects would conform to emission budgets or other tests showing that attainment requirements of the Clean Air Act are met. If the conformity analysis is successful, the regional planning organization, such as the Metropolitan Transportation Commission (MTC), and the appropriate federal agencies, such as the FHWA, make the determination that the RTP is in conformity with the State Implementation Plan for achieving the goals of the Clean Air Act. Otherwise, the projects in the RTP must be modified until conformity is attained. If the design and scope of the proposed transportation project are the same as described in the RTP, then the proposed project is deemed to meet regional conformity requirements for purposes of project-level analysis.
Conformity at the project-level also requires “hot spot” analysis if an area is “nonattainment” or “maintenance” for CO and/or particulate matter (PM). A region is a “nonattainment” area if one or more monitoring stations in the region fail to attain the relevant standard. Areas that were previously designated as nonattainment areas but have recently met the standard are called “maintenance” areas. “Hot spot” analysis is essentially the same, for technical purposes, as CO or particulate matter analysis performed for NEPA purposes. Conformity does include some specific standards for projects that require a hot spot analysis. In general, projects must not cause the CO or PM standards to be violated, and in “nonattainment” areas the project must not cause any increase in the number and severity of violations. If a known CO or PM violation is located in the project vicinity, the project must include measures to reduce or eliminate the existing violation(s) as well.
The concept of transportation conformity was introduced in the CAA 1977 amendments. Transportation conformity requires that no federal dollars be used to fund a transportation project unless it can be clearly demonstrated that the project would not cause or contribute to violations of the national ambient air quality standards (NAAQS). Conformity requirements were made substantially more rigorous in the 1990 CAA amendments, and the transportation conformity regulation that details implementation of the new requirements was issued in November 1993.
DOT and the EPA developed guidance for determining conformity of transportation plans, programs, and projects in November 1993 in the Transportation Conformity Rule (40 CFR 51 and 40 CFR 93). The demonstration of conformity to the SIP is the responsibility of the local

SECTIONSECTIONSECTIONSECTIONTHREE PM2.5 Hot Spot Analysis
X:\x_env\_permit\SR 85 & US101 Exp Lanes\US 101\6000_Tech Studies\Air Quality\_Deliverables\11-5-12 Reports\US 101Exp Hot Spot Analysis 11-14-12.doc 3-9
Metropolitan Planning Organization (MPO), which is also responsible for preparing RTPs and associated demonstration of SIP conformity. Section 93.114 of the Transportation Conformity Rule states that “there must be a currently conforming regional transportation plan and transportation improvement plan at the time of project approval.”
The Metropolitan Transportation Commission (MTC) is the designated federal MPO and state regional transportation planning agency for Santa Clara County. As such, the MTC coordinates the region’s major transportation projects and programs, and promotes regionalism in transportation investment decisions.
3.1.1 Statutory Requirements for PM Hot Spot Analyses
On March 10, 2006, the EPA issued a final transportation conformity rule (40 CFR 51.390 and Part 93) that addresses local air quality impacts in PM10 and PM2.5 nonattainment and maintenance areas. The final rule requires a hot spot analysis to be performed for a Project of Air Quality Concern (POAQC) or any other project identified by the PM2.5 SIP as a localized air quality concern. Transportation conformity, under CAA Section 176(c) (42 U.S.C. 7506(c)), requires that federally supported highway and transportation project activities conform to the SIP, if one exists. The rule provides criteria and procedures to ensure that these activities will not create new violations or worsen existing violations, or prevent adherence to relevant NAAQS as described in 40 CFR 93.101.
EPA’s final rule, 40 CFR 93.123(b)(1), defines POAQCs as:
(i) New or expanded highway projects that have a significant number of or significant increase in diesel vehicles; (ii) Projects affecting intersections that are at Level-of-Service (LOS) D, E, or F with a significant number of diesel vehicles, or those that will change to Level-of-Service D, E, or F because of increased traffic volumes from a significant number of diesel vehicles related to the project; (iii) New bus and rail terminals and transfer points that have a significant number of diesel vehicles congregating at a single location; (iv) Expanded bus and rail terminals and transfer points that significantly increase the number of diesel vehicles congregating at a single location; and (v) Projects in or affecting locations, areas, or categories of sites which are identified in the PM2.5 or PM10 applicable implementation plan or implementation plan submission, as appropriate, as sites of violation or possible violation.
In March 2006, the FHWA and EPA issued a guidance document entitled Transportation Conformity Guidance for Qualitative Hot-Spot Analyses in PM2.5 and PM10 Nonattainment and

SECTIONSECTIONSECTIONSECTIONTHREE PM2.5 Hot Spot Analysis
X:\x_env\_permit\SR 85 & US101 Exp Lanes\US 101\6000_Tech Studies\Air Quality\_Deliverables\11-5-12 Reports\US 101Exp Hot Spot Analysis 11-14-12.doc 3-10
Maintenance Areas (FHWA and EPA 2006)1. This guidance details a qualitative step-by-step screening procedure to determine whether project-related particulate emissions have a potential to generate new air quality violations, worsen existing violations, or delay attainment of NAAQS for PM2.5 or PM10. The PM10 hot spot analysis is not required for project-level conformity because the area is in attainment or unclassified for the national PM10 standards. Hot spot analyses only need to be performed for POAQCs. POAQCs are certain highway and transit projects that involve significant levels of diesel traffic or any other project identified in a PM2.5 or PM10 SIP as a project of localized air quality concern. The following list provides examples of POAQCs.
• A project on a new highway or expressway that serves a significant volume of diesel truck traffic, such as facilities with greater than 125,000 annual average daily traffic (AADT) where 8 percent or more of such AADT is diesel truck traffic.
• New exit ramps and other highway facility improvements to connect a highway or expressway to a major freight, bus, or intermodal terminal.
• Expansion of an existing highway or other facility that affects a congested intersection (operating at LOS D, E, or F) that has a significant increase in the number of diesel trucks.
• Similar highway projects that involve a significant increase in the number of diesel transit buses and/or diesel trucks.
The list below provides examples of projects that are not of air quality concern.
• Any new or expanded highway project that primarily serves gasoline vehicle traffic (i.e.,
does not involve a significant number or increase in the number of diesel vehicles), including such projects involving congested intersections operating at LOS D, E, or F.
• An intersection channelization project or interchange configuration project that involves either turn lanes or slots or lanes or movements that are physically separated. These kinds of projects improve freeway operations by smoothing traffic flow and vehicle speeds by improving weave and merge operations, which would not be expected to create or worsen PM2.5 or PM10 violations.
• Intersection channelization projects, traffic circles or roundabouts, intersection signalization projects at individual intersections, and interchange reconfiguration projects
1 On December 20, 2010, EPA released PM Hot-spot Guidance Transportation Conformity Guidance for Quantitative Hot-spot Analyses in PM2.5 and PM10 Nonattainment and Maintenance Areas (EPA 2010). The EPA approved a 2-year conformity grace period that ends December 20, 2012. After the end of this grace period, quantitative PM hot spot analyses will be required for POACs. Until December 20, 2012, any PM hot spot analysis can continue to be done qualitatively or quantitative analyses can be completed, if desired.
SECTIONSECTIONSECTIONSECTIONTHREE PM2.5 Hot Spot Analysis
X:\x_env\_permit\SR 85 & US101 Exp Lanes\US 101\6000_Tech Studies\Air Quality\_Deliverables\11-5-12 Reports\US 101Exp Hot Spot Analysis 11-14-12.doc 3-11
that are designed to improve traffic flow and vehicle speeds, and do not involve any increases in idling. Thus, they would be expected to have a neutral or positive influence on PM2.5 or PM10 emissions.
Of the POAQC types identified above, the project falls into the first category: “A project on a new highway or expressway that serves a significant volume of diesel truck traffic, such as facilities with greater than 125,000 AADT where 8 percent or more of such AADT is diesel truck traffic.” The traffic study conducted for this project identifies volumes on the freeway that are above this threshold with or without the project in the 2015 and 2035 study years, and the 20092 Annual Average Daily Truck Traffic on the California State Highway System also shows traffic volumes in excess of this threshold (without the project). The project area is classified as a nonattainment area for the federal PM2.5 standard. Consequently, a qualitative project-level PM2.5 hot spot analysis was conducted to assess whether the project would cause or contribute to any new localized PM2.5 violations, or increase the frequency or severity of any existing violations, or delay timely attainment of the or PM2.5 NAAQS (see Section 3.2).
3.1.2 Ambient Air Quality Standards
• 24-hour PM2.5 Standard: 35.0 micrograms per cubic meter (µg/m3)
• Annual PM2.5 Standard: 15.0 µg/m3
The Bay Area was designated as a nonattainment area for the federal PM2.5 standard on October 8, 2009, with an effective date of December 14, 2009. The Bay Area Air Quality Management District (BAAQMD) must submit a SIP to the EPA by December 14, 2012, demonstrating how the Bay Area will achieve the PM2.5 NAAQS by December 14, 2014. However, EPA designated the Bay Area as nonattainment for the PM2.5 standard in December 2009 based on PM2.5 monitoring data for the three-year period 2006-2008. However, Bay Area PM2.5 levels have declined in the past several years. Monitoring data for the 2008-2010 period and for the 2009-2011 period show that the Bay Area met the 24-hour national PM2.5 standard during these periods. Based on the Bay Area PM2.5 monitoring data for years 2008-2010, on December 8, 2011, the California Air Resources Board (CARB) submitted a “clean data finding” request to EPA on behalf of the Bay Area, which means the BAAQMD will have to prepare a “clean data” SIP submittal (BAAQMD 2012b). The 24-hour PM2.5 standard is based on 3-year average of the 98th percentile of 24-hour recorded concentrations; the annual standard is based on 3-year average of the annual arithmetic mean PM2.5 recorded at the monitoring station. A PM2.5 hot spot analysis must consider both standards, unless it is determined for a given area that meeting the controlling standard would ensure that CAA requirements are met for both standards. The interagency consultation process should be used to discuss how the qualitative PM2.5 hot spot analysis meets statutory and
2 2009 Annual Average Daily Truck Traffic was referenced as it corresponds to the base traffic modeling year. Subsequent annual truck traffic counts also exceed the minimum threshold of 125,000 AADT.

SECTIONSECTIONSECTIONSECTIONTHREE PM2.5 Hot Spot Analysis
X:\x_env\_permit\SR 85 & US101 Exp Lanes\US 101\6000_Tech Studies\Air Quality\_Deliverables\11-5-12 Reports\US 101Exp Hot Spot Analysis 11-14-12.doc 3-12
regulatory requirements for both standards, depending on the factors that are evaluated for a given project.
3.2 PM2.5 HOT SPOT ANALYSIS
A hot spot analysis is defined in 40 CFR 93.101 as an estimation of likely future localized pollutant concentrations and a comparison of those concentrations to the relevant air quality standards. A hot spot analysis assesses the air quality impacts at the project level – a scale smaller than an entire nonattainment or maintenance area, such as for congested roadway intersections and highways or transit terminals. Such an analysis is a means of demonstrating that a transportation project meets the federal CAA conformity requirements to support state and local air quality goals with respect to achieving the attainment status in a timely manner. When a hot spot analysis is required, it is included in the project-level conformity determination that is made by FHWA or the Federal Transit Administration (FTA).
3.2.1 Analysis Methodology and Types of Emissions Considered
The EPA and FHWA established in the Transportation Conformity Guidance for Qualitative Hot-Spot Analyses in PM2.5 and PM10 Nonattainment and Maintenance Areas (FHWA and EPA 2006) the following two methods for completing a PM2.5 hot spot analysis: 1. Comparison to another location with similar characteristics (pollutant trend within the air
basin) 2. Air quality studies for the proposed project location (ambient PM trend analysis in the
project area)
This analysis uses a combined approach to demonstrate that the proposed project would not result in a new or worsened PM2.5 violation. Method 1 was used to establish that the proposed project area will meet the NAAQS. Method 2 was used to demonstrate that implementation of the proposed project would not delay attainment of the NAAQS. The analysis was based on directly emitted PM2.5 emissions, including tailpipe, brake wear, and tire wear. Re-entrained dust caused by vehicles traveling over paved and unpaved roads was not included in the qualitative analysis, as the California Air Resources Board (CARB) has not made a determination that re-entrained road dust is a significant contributor to ambient PM2.5 concentrations in the project region. Secondary particles formed through PM2.5 and PM10 precursor emissions from a transportation project take several hours to form in the atmosphere, giving emissions time to disperse beyond the immediate project area of concern for localized analyses; therefore, they were not considered in this hot spot analysis. Secondary emissions of PM2.5 and PM10 are considered as part of the regional emission analysis prepared for the conforming RTP and Federal Transportation Improvement Program (FTIP).

SECTIONSECTIONSECTIONSECTIONTHREE PM2.5 Hot Spot Analysis
X:\x_env\_permit\SR 85 & US101 Exp Lanes\US 101\6000_Tech Studies\Air Quality\_Deliverables\11-5-12 Reports\US 101Exp Hot Spot Analysis 11-14-12.doc 3-13
Project construction is anticipated to last approximately 2.0 years. In addition, the project must comply with BAAQMD construction-related fugitive dust control measures, which will ensure that fugitive dust from construction activities is minimized. Consequently, construction-related PM2.5 emissions were not included in the hot spot analysis per 40 CFR 93.123(c)(5).
3.2.2 Air Quality Trend Analysis
Local air quality data were obtained from the San Jose–Jackson Street monitoring station (to characterize existing air quality and predict future conditions in the project area. In addition to monitoring data, this analysis presents project-level PM2.5 emissions in the future (2015 and 2035) years to help characterize the project’s impact on total PM2.5 emissions generated in the project area.
3.2.2.1 Data Considered
The nearest air quality monitoring station is the San Jose–Jackson Street monitoring station (158 East Jackson Street, San Jose), which is approximately 1.5 mile south of the project corridor.
3.2.2.2 Climate and Topography
Due to its topographic diversity, the meteorology and climate of the Bay Area is often described in terms of different subregions and their microclimates. The proposed project is located in the Santa Clara Valley subregion, as defined by the BAAQMD. The Santa Clara Valley is bordered by San Francisco Bay to the north and by mountains to the east, south, and west. Temperatures are warm on summer days and cool on summer nights, and winter temperatures are fairly mild. At the northern end of the valley, mean maximum temperatures are in the low 80s during the summer and the high 50s during the winter, and mean minimum temperatures range from the high 50s in the summer to the low 40s in the winter. Further inland, where the moderating effect of the Bay is not as strong, temperature extremes are greater. For example, in San Martin, 27 miles south of the San Jose International Airport, temperatures can be more than 10 degrees warmer on summer afternoons and more than 10 degrees cooler on winter nights than mean temperatures in the valley.
Winds in the valley are greatly influenced by the terrain, resulting in a prevailing flow that roughly parallels the valley's northwest-southeast axis. A north-northwesterly sea breeze flows through the valley during the afternoon and early evening, and a light south-southeasterly drainage flow occurs during the late evening and early morning. In the summer, the southern end of the valley sometimes becomes a “convergence zone,” when air flowing from the Monterey Bay is channeled northward into the southern end of the valley and meets with the prevailing north-northwesterly winds.
Wind speeds are greatest in the spring and summer and weakest in the fall and winter. Nighttime and early morning hours frequently have calm winds in all seasons, while summer afternoons and evenings are quite breezy. Strong winds are rare and are associated mostly with winter storms. Figure 3-1 shows the predominant wind direction in the San Jose region.
The air pollution potential of the Santa Clara Valley is high. High summer temperatures, stable air, and mountains surrounding the valley combine to promote ozone (O3) formation. In addition

SECTIONSECTIONSECTIONSECTIONTHREE PM2.5 Hot Spot Analysis
X:\x_env\_permit\SR 85 & US101 Exp Lanes\US 101\6000_Tech Studies\Air Quality\_Deliverables\11-5-12 Reports\US 101Exp Hot Spot Analysis 11-14-12.doc 3-14
to local sources of pollution, O3 precursors from San Francisco, San Mateo, and Alameda counties are carried by prevailing winds to the Santa Clara Valley. The valley tends to channel pollutants to the southeast. In addition, on summer days with low-level inversions, O3 can be recirculated by southerly drainage flows in the late evening and early morning and by the prevailing northwesterly winds in the afternoon. A similar recirculation pattern occurs in the winter, affecting levels of carbon monoxide (CO) and particulate matter.
Pollution sources are plentiful and complex in this subregion. The Santa Clara Valley has a high concentration of industry at the northern end, in the Silicon Valley. Some of these industries are sources of air toxics as well as criteria air pollutants. In addition, Santa Clara Valley's large population and many work-site destinations generate the highest mobile source emissions of any subregion in the San Francisco Bay Area Air Basin (SFBAAB) (BAAQMD 2012a).

SECTIONSECTIONSECTIONSECTIONTHREE PM2.5 Hot Spot Analysis
X:\x_env\_permit\SR 85 & US101 Exp Lanes\US 101\6000_Tech Studies\Air Quality\_Deliverables\11-5-12 Reports\US 101Exp Hot Spot Analysis 11-14-12.doc 3-15
Figure 3-1. Predominant Wind Direction at San Jose International Airport
Source: California Air Resources Board 2012a San Jose International Airport (ID24945, NCDC)
3.2.2.3 Trends in PM2.5 Concentrations
Monitored PM2.5 concentrations at the San Jose–Jackson Street monitoring station for the past five years (2007–2011) are presented in Table 3-1. The data indicates that the 24-hour average PM2.5 concentrations have exceeded the NAAQS for 2007–2008 and 2010–2011 but not for 2009. However, the national annual average standard was not exceeded at the monitoring station

SECTIONSECTIONSECTIONSECTIONTHREE PM2.5 Hot Spot Analysis
X:\x_env\_permit\SR 85 & US101 Exp Lanes\US 101\6000_Tech Studies\Air Quality\_Deliverables\11-5-12 Reports\US 101Exp Hot Spot Analysis 11-14-12.doc 3-16
in any of the past five years. The national 24-hour PM2.5 standards estimated day exceedances are displayed in Table 3-1 as well. Table 3-1. Ambient PM2.5 Monitoring Data (µg/m3) at the San Jose–Jackson Street Monitoring
Station (2007–2011)
Year
Estimated Days Over Standard
Annual Average (µg/m3)
High 24-Hr Average (µg/m3)
Nat’l Nat’l State Nat’l State 2011 3 9.8 9.9 50.5 50.5 2010 3 * 9.0 41.5 41.5 2009 0.0 10.1 10.1 35.0 35.0 2008 5 11.5 11.5 41.9 41.9 2007 9 10.7 11.0 57.5 57.5
Source: CARB 2012b Notes: µg/m3 = micrograms per cubic meter Exceedances of the State or National standard shown in bold text. An exceedance is not necessarily a violation. California standards are not to be exceeded; National standards are not to be exceeded
more than once per year.
As required by the applicable transportation conformity regulations for PM2.5, a trend analysis has been conducted and compared to the current 24-hour and annual average NAAQS. The current 24-hour standard is based on the 3-year average of the 98th percentile of 24-hour average PM2.5 concentrations. The current annual standard is based on a three-year average of annual mean PM2.5 concentrations. As shown in Figure 3-2, 24-hour average PM2.5 concentrations at the San Jose–Jackson Street monitoring station show a decreasing trend from 2007 to 2009, with slight increases in 2010 and 2011. These values have remained above the current national standard of 35.0 µg/m3 except for 2010, but below the old standard of 65 µg/m3. Figure 3-3 indicates that annual average PM2.5 concentrations recorded at the San Jose–Jackson Street monitoring station peaked in 2008 and decreased through 2011. These values have remained below the current national standard of 15.0 µg/m3.

SECTIONSECTIONSECTIONSECTIONTHREE PM2.5 Hot Spot Analysis
X:\x_env\_permit\SR 85 & US101 Exp Lanes\US 101\6000_Tech Studies\Air Quality\_Deliverables\11-5-12 Reports\US 101Exp Hot Spot Analysis 11-14-12.doc 3-17
Figure 3-2. 24-Hour Average PM2.5 Concentrations (µg/m3) at the San Jose–Jackson Street Monitoring Station (2007–2011)
0
10
20
30
40
50
60
70
2007 2008 2009 2010 2011
Co
nce
ntr
ati
on
(µ
g/
m3)
Year
San Jose–Jackson
Street 24-Hour PM2.5
Concentration
24-Hour PM2.5
Standard
Source: California Air Resources Board 2012a
Figure 3-3. Annual Average PM2.5 Concentrations (µg/m3) at the San Jose- Jackson Street Monitoring Station (2007–2011)
Source: California Air Resources Board 2012a
3.2.2.4 Surrounding Land Uses
The BAAQMD generally defines a sensitive receptor as a facility or land use that houses or attracts members of the population, such as children, the elderly, and people with illnesses, who are particularly sensitive to the effects of air pollutants.
SECTIONSECTIONSECTIONSECTIONTHREE PM2.5 Hot Spot Analysis
X:\x_env\_permit\SR 85 & US101 Exp Lanes\US 101\6000_Tech Studies\Air Quality\_Deliverables\11-5-12 Reports\US 101Exp Hot Spot Analysis 11-14-12.doc 3-18
Various sensitive receptors are located in the vicinity of the project area. In general, the route is adjacent to residential, commercial, open space or undeveloped lands and several recreational trails cross underneath the freeway at river and creek crossings. Land use compatibility issues relative to the siting of pollution-emitting sources or the siting of sensitive receptors must be considered. In the case of schools, state law requires that siting decisions consider the potential for toxic or harmful air emissions in the surrounding area. Surrounding land uses include residential developments south and north of US 101 in Mountain View, Sunnyvale, Santa Clara and San Jose. As stated in Section 2.2, the proposed project would convert the existing HOV lane along both northbound and southbound US 101 into an express lane and widen the freeway to add a second express lane for the majority of the corridor. The addition of an express lane in each direction of the freeway will move traffic slightly closer to existing land uses, but the shift will not be substantial and will remain within the existing US 101 right-of-way. The widening to accommodate the additional lanes will be within the median and with outside widening. The project is therefore not expected to decrease air quality in any locations because of the relatively small change in freeway alignment. In addition, the project would help to reduce congestion and improve traffic flow, especially in the period after the opening year.
3.2.2.5 Future Trends
Emission trend data for the SFBAAB from the 2009 edition of The California Almanac of Emissions and Air Quality published by the CARB was used to provide an estimate of potential PM2.5 trends in the vicinity of the project area. While the CARB’s Almanac does not provide emission trend data on the county level, the regional trend data can be used to provide insight on the general trends of air quality in the region, as implementation of emission standards and control requirements that have an effect on regional pollutant concentrations are likely to result in similar trends at the local level. Table 3-2 presents PM2.5 emission trends in the SFBAAB for the years 1975 to 2020.

SECTIONSECTIONSECTIONSECTIONTHREE PM2.5 Hot Spot Analysis
X:\x_env\_permit\SR 85 & US101 Exp Lanes\US 101\6000_Tech Studies\Air Quality\_Deliverables\11-5-12 Reports\US 101Exp Hot Spot Analysis 11-14-12.doc 3-19
Table 3-2. PM2.5 Emission Trends in the San Francisco Bay Area Air Basin, 1975–2020 (tons per day)
Year Total Emissions Total On-Road Mobile Sources
Diesel Vehicle Mobile Sources
Gasoline Vehicles Mobile Sources
1975 80 5 2 3
1980 78 7 4 3
1985 78 8 6 2
1990 84 10 7 3
1995 82 7 4 3
2000 84 7 4 3
2005 81 7 3 4
2010 82 7 3 4
2015 83 7 2 5
2020 85 7 1 5
Source: California Air Resources Board 2010 Figure 3-4 presents emissions associated with on-road emissions and indicates that total on-road emissions are expected to remain constant through 2020, with increases in emissions from on-road gasoline vehicles offset by substantial decreases in emissions from on-road diesel vehicles. Emissions of directly emitted PM2.5 from diesel motor vehicles have been decreasing since 1990 due to adoption of more stringent emission standards, even though population and vehicle miles traveled (VMT) have been increasing. Figure 3-4 indicates that total PM2.5 emissions have remained relatively constant in the SFBAAB between 1975 and 2005 and are projected to increase slightly through 2020. However, because total on-road emissions are expected to remain constant, the slight increases expected in overall PM2.5 are not likely to result from on-road sources but from area-wide sources, such as fugitive dust associated with construction and development projects.

SECTIONSECTIONSECTIONSECTIONTHREE PM2.5 Hot Spot Analysis
X:\x_env\_permit\SR 85 & US101 Exp Lanes\US 101\6000_Tech Studies\Air Quality\_Deliverables\11-5-12 Reports\US 101Exp Hot Spot Analysis 11-14-12.doc 3-20
Figure 3-4. PM2.5 Emission Trends in the San Francisco Bay Area Air Basin (tons per day)
Source: California Air Resources Board 2010 Note: Total On-Road Mobile Sources, Diesel Vehicle Mobile Sources, and Gasoline Vehicles Mobile Sources data uses the y-axis on the left, while the Total Emissions data uses the y-axis on the right.
3.2.3 Transportation and Traffic Analysis
3.2.3.1 Transportation and Traffic
Anticipated regional growth in population and employment could result in increased traffic within the project area. Modeled traffic volumes and operating conditions were obtained from the traffic data prepared by the project traffic engineers (CDM Smith 2012), including daily VMT data for the No Build and Build scenarios in both opening year (2015) and horizon year (2035). VMT data included vehicle activity for affected roadways in the immediate project region. The traffic data used for emissions modeling is summarized in Table 3-3. Table 3-3 presents daily VMT distribution and speed for US 101.

SECTIONSECTIONSECTIONSECTIONTHREE PM2.5 Hot Spot Analysis
X:\x_env\_permit\SR 85 & US101 Exp Lanes\US 101\6000_Tech Studies\Air Quality\_Deliverables\11-5-12 Reports\US 101Exp Hot Spot Analysis 11-14-12.doc 3-21
Table 3-3. Daily VMT and Worst Case Peak Hour Speeds Scenario Peak Hour Speeds (mph) Daily VMT
No Build (2015) 42 13,386,398
Build (2015) 43 13,547,415
No Build (2035) 31 16,205,048
Build (2035) 33 16,470,484
Mainline Average Daily Traffic Volumes and Mainline Truck Volumes
Tables 3-4 and 3-5 present the total AADT volumes as well as truck AADT volumes for the US 101 corridor in the project vicinity used for the emissions analysis.
Table 3-4. No Build and Build Total AADT and Truck AADT, 2015 Segment No Build AADT Build AADT
From To Total Trucks Total Trucks
Dunne Ave. SR 85 139,000 10,400 145,000 10,600
SR 85 E. Capitol Expy 142,000 12,800 149,000 13,100
E. Capitol Expy I-880 205,000 12,300 218,000 12,700
I-880 Lawrence Expy 177,000 8,900 191,000 9,300
Lawrence Expy SR 85 167,000 6,700 179,000 7,200
SR 85 Oregon Expy/ Embarcadero Rd.
214,000 9,600 225,000 10,200
Source: Total AADT from CDM Smith Nov. 14, 2012
Table 3-5. No Build and Build Total AADT and Truck AADT, 2035 Segment No Build AADT Build AADT
From To Total Trucks Total Trucks
Dunne Ave. SR 85 185,000 13,900 197,000 14,500
SR 85 E. Capitol Expy 176,000 15,800 186,000 16,400
E. Capitol Expy I-880 234,000 14,000 250,000 14,800
I-880 Lawrence Expy 216,000 10,800 236,000 11,800
Lawrence Expy SR 85 198,000 7,900 218,000 8,800
SR 85 Oregon Expy/ Embarcadero Rd.
256,000 11,500 272,000 12,300
Source: Total AADT from CDM Smith Nov. 14, 2012

SECTIONSECTIONSECTIONSECTIONTHREE PM2.5 Hot Spot Analysis
X:\x_env\_permit\SR 85 & US101 Exp Lanes\US 101\6000_Tech Studies\Air Quality\_Deliverables\11-5-12 Reports\US 101Exp Hot Spot Analysis 11-14-12.doc 3-22
3.2.3.2 Transportation and Traffic Analysis
Vehicle emission rates were determined using EMFAC2007 and the VMT and speed data presented in Table 3-3. The EMFAC2007 program assumed the SFBAAB Santa Clara County regional traffic data. The modeling of vehicle emission rates does not account for future decreases from continuing improvements in engine technology and the retirement of older, higher-emitting vehicles. The emission factors used in the analysis also do not reflect the California Truck and Bus Regulation, which CARB initially approved in 2008 and amended in 2010. The regulation requires fleets that operate in California to reduce diesel truck and bus emissions by retrofitting or replacing existing engines. The amended regulation would require installation of diesel particulate matter retrofits beginning January 1, 2012 and replacement of older (pre-1994) trucks starting January 1, 2015. By January 1, 2023, nearly all vehicles would need to have 2010 model year engines or equivalent (CARB 2011). The new regulations will make the average truck more efficient, reducing emissions in all of the scenarios and decreasing the difference in emissions between the Build and No Build scenarios. As EMFAC2007 uses a much broader range of engine model years for each scenario, the model output tends to overstate emissions for both alternatives. In addition, the emissions modeling used worst case peak-hour speeds, as average daily speed data were not available. As a result, the calculation method provides a worst-case estimate for total emissions. Table 3-6 summarizes the modeled daily PM2.5 emissions. The differences in emissions between the Build and No Build conditions represent emissions generated directly as a result of implementation of the Build Alternative in the construction interim year (2015) and the design/future year (2035).
Table 3-6. Daily Modeled PM2.5 Emissions
Daily VMT PM2.5 Emission Factor
(grams/mile) PM2.5 Emissions (pounds per day)
PM2.5 (Small Truck)
PM2.5 (Medium Truck)
PM2.5 (Large Truck)
PM2.5 (Small Truck)
PM2.5 (Medium Truck)
PM2.5 (Large Truck)
Total
No Build (2015)
13,386,398 1.95E-02 1.16E-01 2.26E-01 575 3,423 6,670 3887
Build (2015) 13,547,415 1.95E-02 1.22E-01 2.28E-01 582 3,644 6,810 3974
No Build (2035)
16,205,048 2.35E-02 1.86E-01 2.37E-01 840 6,645 8,467 5096
Build (2035) 16,470,484 2.30E-02 1.50E-01 2.31E-01 835 5,447 8,388 4993
Note: Assumed 43% small trucks (2 axle), 5% medium trucks (3,4 axle) and 52% large trucks (5+ axle) based on the average trucks distribution shown in Table 3.2 Overall, the Build Alternative would result in a slight increase in PM2.5 emissions in opening years (2015) but a net decrease in PM2.5 emissions in the horizon year (2035), compared with the No Build Alternative. The model output indicates that the Build Alternative would increase

SECTIONSECTIONSECTIONSECTIONTHREE PM2.5 Hot Spot Analysis
X:\x_env\_permit\SR 85 & US101 Exp Lanes\US 101\6000_Tech Studies\Air Quality\_Deliverables\11-5-12 Reports\US 101Exp Hot Spot Analysis 11-14-12.doc 3-23
PM2.5 emissions by approximately 87 pounds per day in 2015 and decrease by 103 pounds per day in 2035 compared to No Build. The long-term decrease in PM2.5 will result from project-related improvements in traffic operations and overall system efficiency, as well as from the improvements in engine technology, the retirement of higher-emitting vehicles, and the regulatory changes described above.
3.3 CONCLUSION
AADT on US 101 in the project limits exceeds the FHWA and EPA’s POAQC threshold of 125,000 and 8 percent trucks (10,000 truck AADT). Implementation of the Build Alternative would not significantly affect diesel truck volumes as the trucks are not allowed in the express lanes. The slight increase in truck volumes with the Build Alternative is a result of the improved operating conditions in the mainline lanes, and represents a minor shift to the freeway from other routes. As indicated in Table 3-6, PM2. total emissions along the freeway would increase slightly in 2015 likely due to this shift, but would decrease in 2035 with the Build Alternative due to travel time savings, decreases in hours of delay, and improvements in average network speed when compared to the No Build Alternative. Transportation conformity is required under CAA Section 176(c) (42 U.S.C. 7506(c)) and requires that no federal dollars be used to fund a transportation project unless it can be clearly demonstrated that the project would not cause or contribute to violations of the NAAQS. As required by Final EPA rule published on March 10, 2006, this qualitative assessment demonstrates that the US 101 Express Lane Project meets the CAA conformity requirements and will not further contribute to NAAQS violations or conflict with state and local measures to improve regional air quality. Implementation of the propose project will not result in new violations of the federal PM2.5 air quality standards for the following reasons:
• Based on representative monitoring data, annual average PM2.5 concentrations are
declining (see Figure 3-3).
• Based on representative monitoring data, monitored annual average PM2.5 concentrations have not exceed the national standard of 15.0 µg/m3
in the past five years (2007–2011) (see Table 3-1).
• Based on representative monitoring data, monitored 24-hour average PM2.5 concentrations exceeded the federal standard of 35 µg/m3 nine times in 2007, five times in 2008, zero times in 2009, three times in 2010, and three times in 2011, indicating that 24-hour PM2.5 concentrations are likely decreasing (see Table 3-1).
• Construction of the Build Alternative would increase peak-hour speeds in the project corridor during both the opening and horizon years (see Table 3-3).
• The analysis shows that PM2.5 emissions would slightly increase with 2015 Build conditions, but ultimately decrease with 2035 Build conditions when compared to No

SECTIONSECTIONSECTIONSECTIONTHREE PM2.5 Hot Spot Analysis
X:\x_env\_permit\SR 85 & US101 Exp Lanes\US 101\6000_Tech Studies\Air Quality\_Deliverables\11-5-12 Reports\US 101Exp Hot Spot Analysis 11-14-12.doc 3-24
Build conditions, thereby reducing total PM2.5 emissions generated within the project region (see Table 3-6).
• Compared with the No Build Alternative, the Build Alternative would result in a net decrease in PM2.5 emissions over the life of the project.
• Implementation of the proposed project would not substantially affect diesel truck percentages between Build and No Build alternatives based on AADT values . The percentage of trucks using the freeway with respect to the volume of cars decreases or remains the same between 2015 and 2035, reflecting the restriction on trucks from using the express lanes.
For these reasons, future or worsened PM2.5 violations of any standards are not anticipated. Therefore, the proposed US 101 Express Lanes Project meets the conformity hot spot requirements in 40 CFR 93.116 and 93.126 for PM2.5.

SECTIONSECTIONSECTIONSECTIONFOUR References
X:\x_env\_permit\SR 85 & US101 Exp Lanes\US 101\6000_Tech Studies\Air Quality\_Deliverables\11-5-12 Reports\US 101Exp Hot Spot Analysis 11-14-12.doc 4-1
4. Section 4 F OUR Referen ces
BAAQMD 2012a. California Environmental Quality Act Air Quality Guidelines. Bay Area Air Quality Management District. May.
BAAQMD. 2012b. Particulate Matter (PM) Planning. URL: http://www.baaqmd.gov/Divisions/Planning-and-Research/Plans/PM-Planning.aspx. Accessed October 18, 2012
CARB. 2010. The California Almanac of Emissions and Air Quality - 2009 Edition. URL: http://www.arb.ca.gov/aqd/almanac/almanac09/almanac2009all.pdf.
CARB. 2011. Truck and Bus Regulation: On-Road Heavy-Duty Diesel Vehicles (In-Use) Regulation. California Air Resources Board. URL: http://www.arb.ca.gov/msprog/onrdiesel/onrdiesel.htm. Accessed August 8, 2011.
CARB. 2012a. Appendix F; Wind rose and Statistics for Surface Meteorological Stations URL: http://www.arb.ca.gov/ch/communities/ra/westoakland/documents/appendixf_final.pdf. Accessed October 2012.
CARB. 2012b. Air Monitoring Data. URL: http://www.arb.ca.gov/adam/topfour/topfour1.php, Accessed October 2012.
Department (of Transportation). 2009. Annual Average Daily Truck Traffic on the California State Highway System. http://traffic-counts.dot.ca.gov/truck2011final.pdf
Department (of Transportation). 2012. United States Highway 101 Express Lanes Project. Initial Study with Mitigated Negative Declaration/Environmental Assessment. Santa Clara County, California. California Department of Transportation. District 4 – SCL -101 (PM 16.00/52.55). EA No. 04-2G7100.
CDM Smith. 2012 Traffic Data for US 101. Received November 2012
EPA 2010. Transportation Conformity Guidance for Quantitative Hot-spot Analyses in PM2.5 and PM10 Nonattainment and Maintenance Areas. EPA-420-B-10-040. December 2010.
FHWA and EPA. 2006. Transportation Conformity Guidance for Qualitative Hot-spot Analyses in PM2.5 and PM10 Nonattainment and Maintenance Areas. Federal Highway Administration, and U.S. Environmental Protection Agency.
MTC. 2009. Transportation 2035 Plan for the San Francisco Bay Area. Regional Transportation Plan (RTP). Metropolitan Transportation Commission. Adopted April 22, 2009. URL: http://www.mtc.ca.gov/planning/2035_plan/